 Hao Chi1†
 Jinyan Yang2†
 Gaoge Peng1†
 Jinhao Zhang2
 Guobin Song2
 Xixi Xie2
 Zhijia Xia3*
 Jinhui Liu4*
 Gang Tian5*
- 1Clinical Medical College, Southwest Medical University, Luzhou, China
- 2School of Stomatology, Southwest Medical University, Luzhou, China
- 3Department of General, Visceral, and Transplant Surgery, Ludwig-Maximilians-University Munich, Munich, Germany
- 4Department of Gynecology, The First Affiliated Hospital of Nanjing Medical University, Nanjing, China
- 5Department of Laboratory Medicine, The Affiliated Hospital of Southwest Medical University, Luzhou, China
Background: Head and neck squamous cell carcinoma (HNSCC) is the most common head and neck cancer and is highly aggressive and heterogeneous, leading to variable prognosis and immunotherapy outcomes. Circadian rhythm alterations in tumourigenesis are of equal importance to genetic factors and several biologic clock genes are considered to be prognostic biomarkers for various cancers. The aim of this study was to establish reliable markers based on biologic clock genes, thus providing a new perspective for assessing immunotherapy response and prognosis in patients with HNSCC.
Methods: We used 502 HNSCC samples and 44 normal samples from the TCGA-HNSCC dataset as the training set. 97 samples from GSE41613 were used as an external validation set. Prognostic characteristics of circadian rhythm-related genes (CRRGs) were established by Lasso, random forest and stepwise multifactorial Cox. Multivariate analysis revealed that CRRGs characteristics were independent predictors of HNSCC, with patients in the high-risk group having a worse prognosis than those in the low-risk group. The relevance of CRRGs to the immune microenvironment and immunotherapy was assessed by an integrated algorithm.
Results: 6-CRRGs were considered to be strongly associated with HNSCC prognosis and a good predictor of HNSCC. The riskscore established by the 6-CRRG was found to be an independent prognostic factor for HNSCC in multifactorial analysis, with patients in the low-risk group having a higher overall survival (OS) than the high-risk group. Nomogram prediction maps constructed from clinical characteristics and riskscore had good prognostic power. Patients in the low-risk group had higher levels of immune infiltration and immune checkpoint expression and were more likely to benefit from immunotherapy.
Conclusion: 6-CRRGs play a key predictive role for the prognosis of HNSCC patients and can guide physicians in selecting potential responders to prioritise immunotherapy, which could facilitate further research in precision immuno-oncology.
1 Introduction
As the sixth most common cancer worldwide, HNSCC includes malignant lesions originating in the mouth, lips, nasopharynx, pharynx, or larynx (1). Globally, HNSCC has an incidence of more than 809,000 cases and more than 316,000 deaths, accounting for 3.6% of all cancer deaths (2). Currently, HNSCC treatment has been based on various therapeutic approaches such as surgery, chemotherapy, radiotherapy, and photodynamic therapy (3). However, the prognosis for individuals with HNSCC remains dismal, and morbidity and mortality rates are rising yearly due to the disease’s very aggressive and diverse character (4). Patients with HNSCC diagnosed at an early stage have a 60-95% chance of successful treatment by primary tumor resection combined with extensive neck debulking (5). However, most patients have advanced cancer at the time of diagnosis, with tumor metastasis and recurrence. The prognosis of the disease is strongly correlated with the TNM stage and histologic grade of HNSCC, which serve as the main foundation for several treatment choices, including prognostic classification, immunotherapy, radiation, and chemotherapy (6–10). However, the prognosis of HNSCC patients based on conventional clinicopathological staging may not be totally accurate since people with the same clinical stage may have varied clinicopathologic characteristics (9, 11). Therefore, to forecast the prognosis of HNSCC patients and direct tailored treatment, new prognostic biomarkers and molecular targets must be found in order to improve the quality of life for HNSCC patients.
The circadian clock system is used by organisms to adjust their biochemical and behavioral processes to the cyclical environmental changes caused by the rotation of the Earth (12, 13). The master clock is located in the suprachiasmatic nucleus above the optic cross and is based on neural and humoral inputs that synchronize the cellular autonomous clock in peripheral organs with the “master clock” and thus regulate most life activities (14, 15). The circadian rhythm alteration in tumorigenesis may have the same importance as genetic factors and altered biological clock gene expression has been found in cancer cells (16–18). It has been shown that biological clock genes can directly or indirectly regulate the five major pathways of DNA repair and thus the progression of the cell cycle (19–21). There are also suggestions that dysregulation of circadian genes can contribute to inflammation and tumor progression through activation of p38, c-Myc, NF-kB, Bcl-XL, and protein kinase A (PKA) pathways (17, 22–25). Considering the significant role of CRRGs in tumors, several biological clock genes have been considered as prognostic biomarkers for various cancers (26–28). Currently, the prognostic value of CRRGs in HNSCC and the role of the tumor immune microenvironment are unclear. Hence, the purpose of this study was to develop a new risk-scoring system based on CRRGs to accurately predict prognosis and characterize the immune landscape of patients with CRRGs, providing a theoretical basis for personalized and precise clinical treatment.
With the continuous development of bioinformatics, a large quantity of articles was constructing prognostic models of diseases by filtering the prognostic markers of the features through methods as machine learning (29–31). In our study, we screened 6 reliable CRRGs by two machine learning methods, constructed a prognostic model based on the TCGA-HNSCC cohort, and went on to establish a risk score and comprehensively analyzed the relationship between CRRGs and immune microenvironment, immunotherapy, and chemotherapy sensitivity. We aimed to demonstrate the value of 6-CRRGs for assessing the prognosis of HNSCC patients through a comprehensive analysis of genomic data and to develop new tools to improve treatment options.
2 Method
2.1 Data sources
We downloaded gene expression profiles and clinical data of TCGA-HNSCC cohort including 504 tumor patients and 44 normal controls from the TCGA database (https://portal.gdc.cancer.gov/). The level 3 HTSeq-Fragments per kilobase million (FPKM) data of TCGA-HNSCC was converted to TPM (transcripts per million reads) according to the following formula: TPMn = FPKMn * 106/(FPKM0 +… + FPKMm), where n represented gene n and m represented the total number of all genes, respectively. Then, we performed a log2-based transformation of TPM. After excluding samples lacking complete clinical information, 501 HNSCC samples were included in the subsequent analysis. The sample size of HNSCC patients at the M stage varied greatly. This stage was consequently excluded from the analysis. We obtained 97 HNSCC patients with complete follow-up information from GSE41613 as an external validation set. In this study, two separate datasets, TCGA-HNSCC and GSE41613, were merged and the batch effect was corrected for using the ComBat function in the R package “sva” in order to eliminate the batch effect in the microarray expression data. We obtained Circadian rhythm-associated 1424 genes by Genecards (https://www.genecards.org/) (Supplementary Table 1).
2.2 Model construction
The “limma” R package was used to analyze CRRGs that are differentially expressed in HNSCC tissues and normal tissues. Univariate Cox regression analysis was performed to identify CRRGs with prognostic value. The prognostic network of DE-CRRGs associated with prognosis was mapped by the “igraph” R package. The obtained genes were further screened by Lasso and the RF algorithm, respectively. After the intersection of genes screened by the two methods, multivariate analysis was used for modeling and R package “glmnet” (32) was used to determine key genes and their regression coefficients. For each patient, the CRRGs risk score was calculated as follows, risk score = ExpressionmRNA1 × CoefmRNA1 + ExpressionmRNA2 × CoefmRNA2 +… ExpressionmRNAn × CoefmRNAn.
2.3 Model validation
Subsequently, the HNSCC patients in the dataset were divided into low-risk and high-risk groups according to the median risk score. Overall survival (OS) was compared between the two groups using Kaplan-Meier curves created by survminer in the R package. The “pec” R package was used for PCA analysis and c-index calculation. The prediction accuracy of the signature was evaluated by constructing a time-dependent ROC using the “timeROC” R package.
2.4 Independent prognostic analysis and nomogram predictive model construction
Univariate Cox regression and multivariate Cox regression analysis were used to evaluate whether risk score was an independent prognostic factor. The rms R package combined with risk scores and clinicopathological characteristics was used to construct a nomogram for predicting the probability of survival at 1, 3, and 5 years in HNSCC patients.
2.5 Enrichment analysis
The “c2.cp.kegg.v7.4.symbols” obtained from the MSigDB database were analyzed using the “GSVA” R package. Gene Ontology (GO) analysis is done using the Cluster-Profiler R package.
2.6 Immunoassay of risk signatures
Currently recognized methods, including XCELL (33, 34), TIMER (35, 36), QUANTISEQ (37, 38), MCPCOUNT (39), EPIC (40), CIBERSORT (35, 41), and CIBERSORT-ABS (42)is used to measure immune infiltration correlation. The CIBERSORT algorithm was used to evaluate immune cell infiltration in HNSCC patients. Single sample GSEA (ssGSEA) was used to evaluate the immune function of the two groups. At the same time, we collected 19 inhibitory immune checkpoints with therapeutic potential from Auslander’s study (43). We obtained the gene set associated with cancer-immune circulation from the website developed by Xu et al. (http://biocc.hrbmu.edu.cn/TIP/) (44) and the gene set that was positively correlated with the clinical response to the anti-PD-L1 drug (atezolizumab) from the research features of Mariathasan (45). Using the GSVA algorithm (46) to calculate the enrichment scores of genetic signatures positively correlated with the cancer immune cycle and immunotherapy. Visualization was performed using the ggcor R software package. In addition, we analyzed the prediction of the 6-CRRGs signature on tumor immunotherapy response by the IMvigor210 cohort (http://research-pub.gene.com/IMvigor210CoreBiologies/).
2.7 Somatic mutation analysis
We downloaded the mutation data available to patients with TCGA-HNSCC from the TCGA Data Portal (https://portal.gdc.cancer.gov/). We analyze mutation data from HNSCC samples using maftools (47). The tumor mutation burden (TMB) score is calculated as follows: (Total Mutation/Total Coverage Base) × 10^6 (48). GSCALite (http://bioinfo.life.hust.edu.cn/web/GSCALite/) provides an online cancer genomic analysis platform by integrating 33 cancer data from TCGA and normal tissue genomics data from GTEx (49).
2.8 Database for tumor immune single-cells
A single-cell RNA sequencing database focused on the tumor microenvironment (TME) is housed at the Tumor Immunization Single Cell Center (TISCH)(http://tisch.comp-genomics.org/home/). Detailed cell type annotations are provided at the single cell level for further analysis of specific gene expression in different cell types. The specific gene expression in different cell types further reveals the variation of TME in patients with different HNSCC, thus explaining to some extent the heterogeneity of HNSCC.
2.9 Drug sensitivity
GDSC (Genomics of Drug Sensitivity in Cancer) (https://www.cancerrxgene.org/) was used to measure half-maximal inhibitory concentrations (IC50). This is achieved by using the pRRophetic R package.
2.10 Statistical analysis
Statistical analyses were performed using R software v4.1.3. Kaplan-Meier (KM) survival curves and log-rank tests were used to compare overall survival (OS) in the high-risk and low-risk groups. The LASSO regression analysis and RF were used to screen candidate CRRGs. Stepwise multifactor Cox regression analysis was used to construct CRRGs characteristics. Time-dependent ROC was used to assess the predictive performance of the model. Spearman correlation analysis was used to assess the correlation between risk score and immune cell infiltration. Wilcox test was used to compare the proportion of TIICs, immune checkpoints, and immune function between the two groups. P < 0.05 was considered statistically significant and false discovery rate (FDR) < 0.05 was considered statistically significant.
3 Results
3.1 Identification of candidate CRRGs
The primary design of this study can be known from the graphical flow chart (Figure 1). Aiming to explore CRRGs with differential expression and prognostic significance in HNSCC patients, we first performed differential expression analysis of gene expression in the normal and tumor groups by using the “limma” R package. After filtering the data according to thresholds (|log2FC|>1.0, FDR <0.05), we identified a total of 373 differential expressions (DE) CRRGs, of which 102 were down-regulated and 271 were up-regulated in HNSCC tissues (Supplementary Table 2). The DE-CRRGs were visualized by volcano plot and heat map (Figures 2A, B). The heatmap showed the top 50 CRRGs with the greatest upregulation of expression and the top 50 CRRGs with the greatest downregulation of expression relative to normal tissue. Univariate cox analysis yielded CRRGs that were associated with patients’ OS, and we ultimately identified 85 CRRGs that were prognostically significantly associated (Figure 2C). We then performed prognostic network mapping on them, and the CRRGs showed significant correlation and prognostic significance (Figure 2D). Based on these results, CRRGs may be associated with HNSCC tumorigenesis and progression.
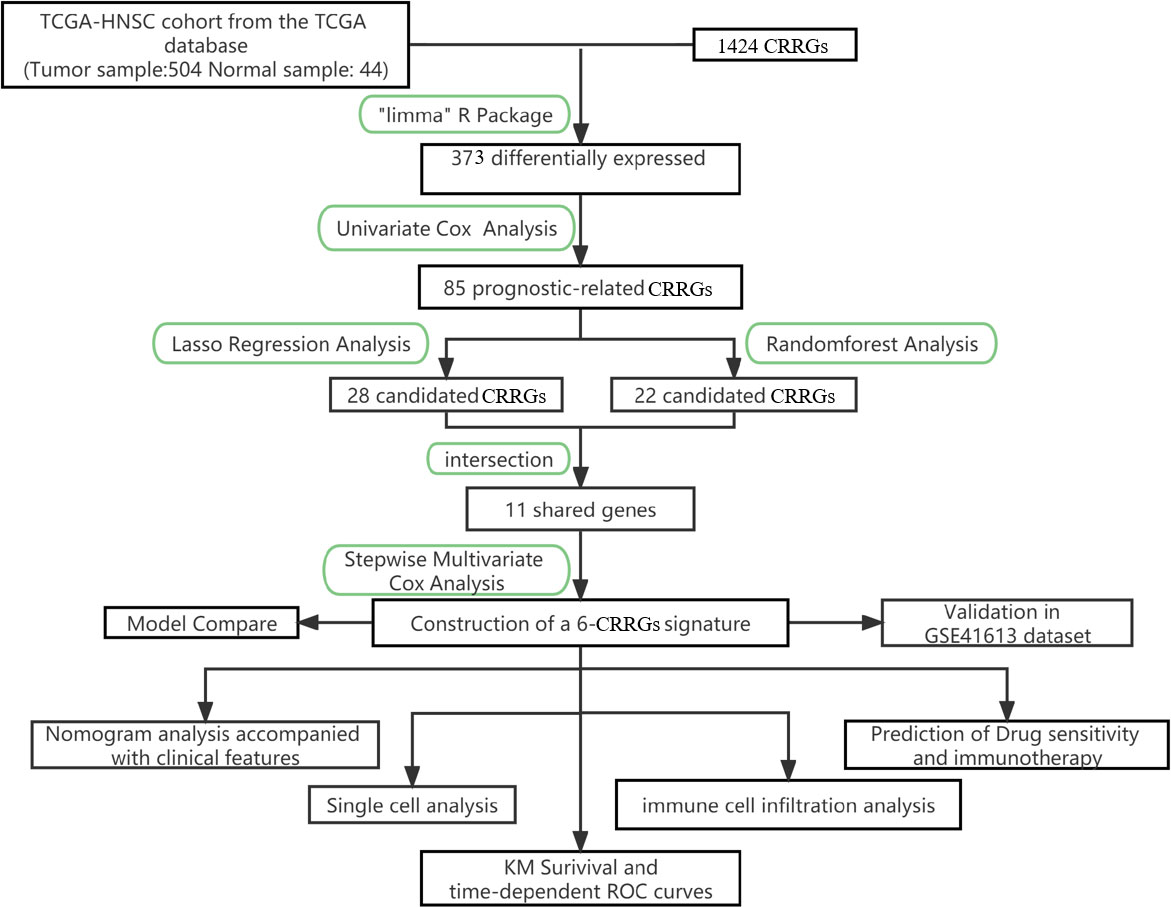
Figure 1 The flowchart summarizes the main design of the present study.
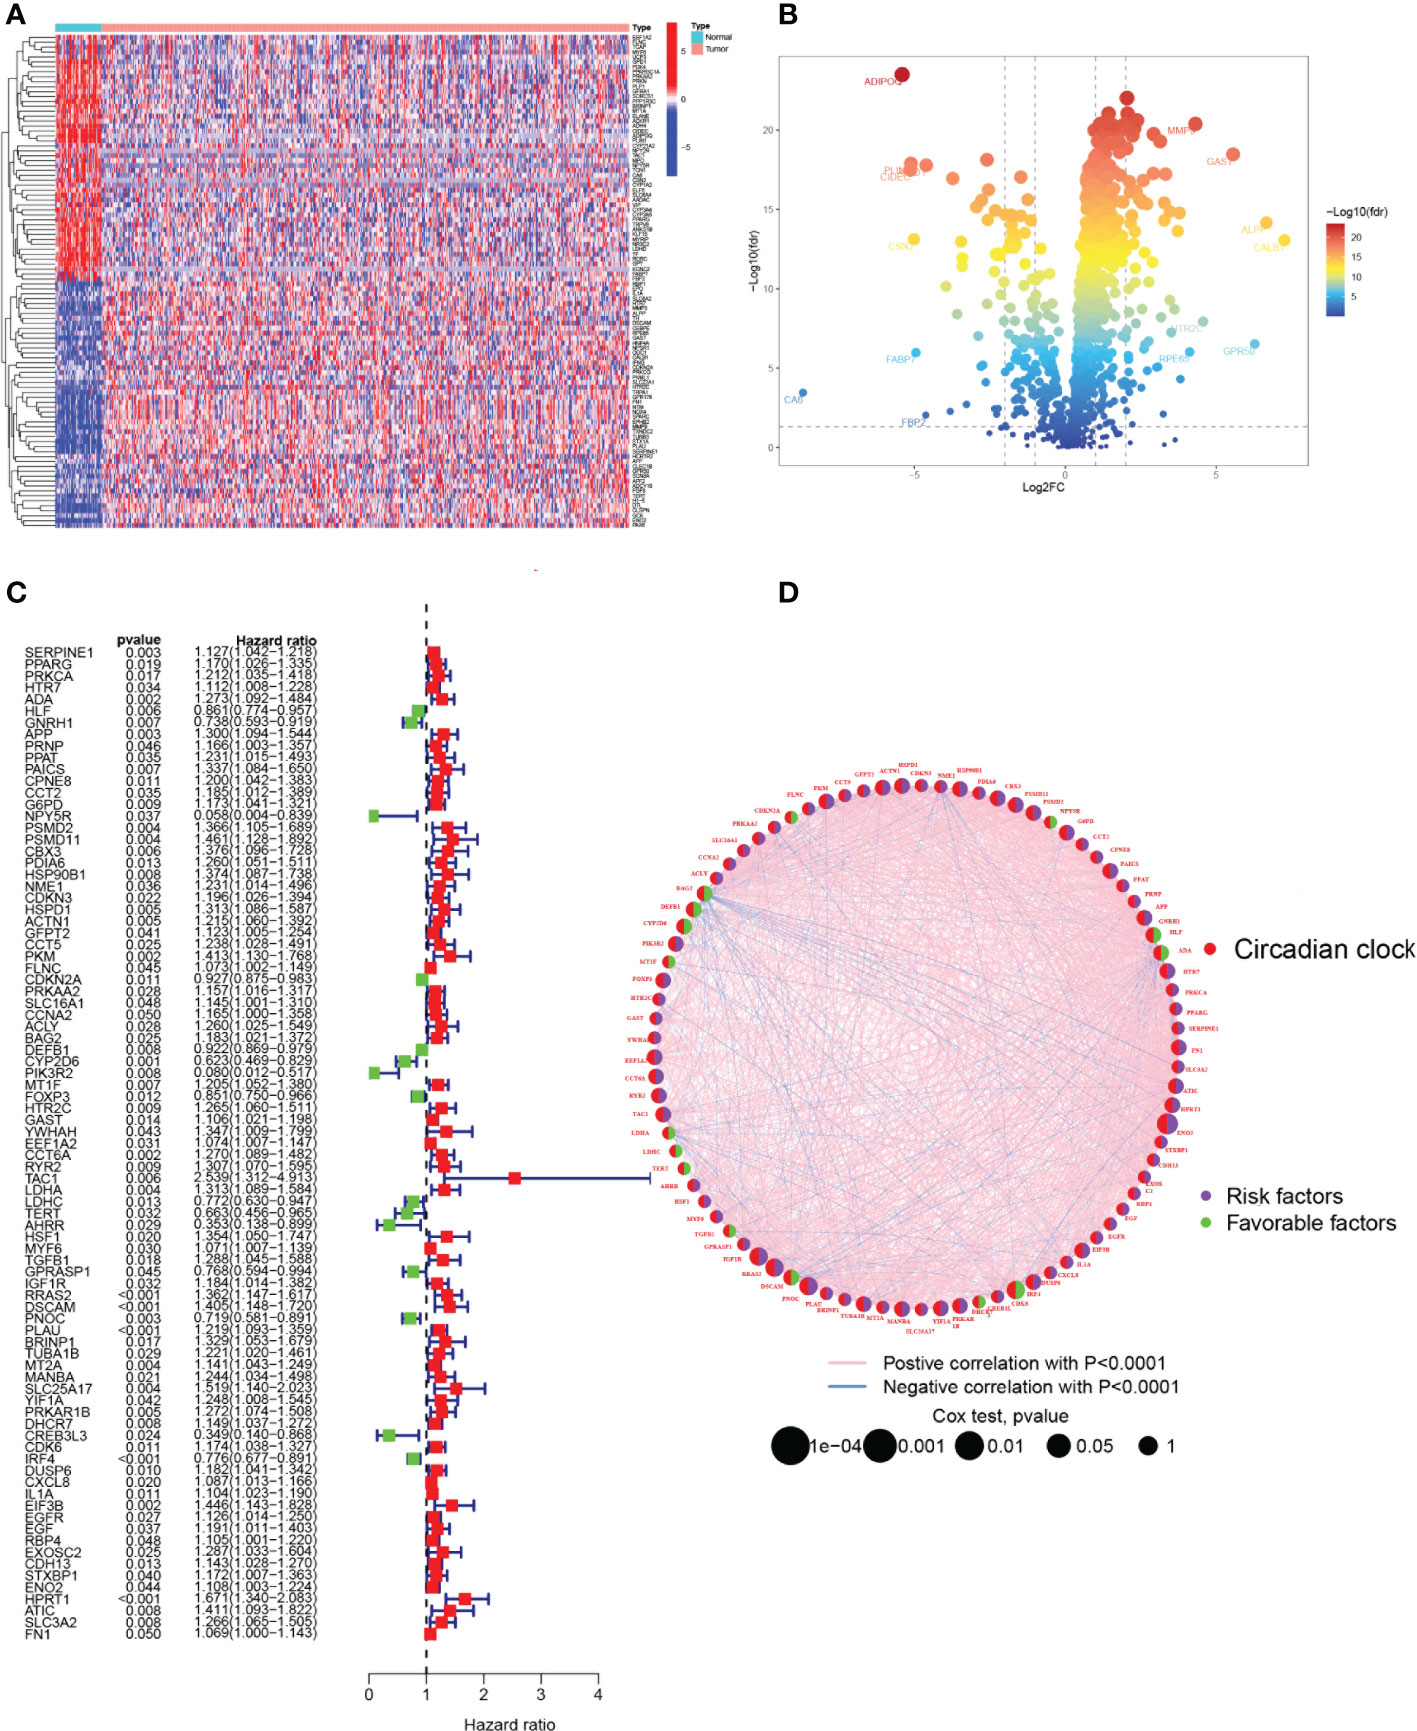
Figure 2 Identification of candidate CRRGs. (A, B) Heat map and volcano plot of differentially expressed CRRGs. (C) The prognosis of 85 CRRGs in the whole HNSCC cohort was analyzed by a univariate Cox regression model. (D) Correlation analysis of the expression of CRRGs after 87 COX regression analyses. The genes with favorable prognoses are marked in green and the harmful factors in purple. The size of the point indicates the P-value calculated by the COX regression, the larger the value, the smaller the point.
3.2 Selection of modeling genes using LASSO and RF algorithms
Two machine learning algorithms were applied to screen signature genes among biological clock genes associated with the prognosis of HNSCC patients. For the LASSO algorithm, cross-validation was performed. The minimum criteria for constructing the LASSO classifier were selected to identify 28 feature genes (Figures 3A, B). Combined with RF feature selection, the classification tree results (Figures 3C, D) were selected for genes with heavy variable importance > 0.004. Through crossover, a total of 11 feature genes including IL1B, TXN, and CASP3 were finally identified for LASSO, RF algorithm, and represented by the VENN diagram (Figure 3E). Subsequently, a stepwise multifactorial Cox risk regression algorithm was used to downscale these high-dimensional data, and the optimal Lambda value was 0.0273. Six prognosis-related CRRGs were finally identified for ADA, CYP2D6, RYR2, DSCAM, IRF4, and HPRT1. The corresponding regression coefficients were obtained as 0.2527, -0.6680, 0.3155, 0.3035, - 0.1897, and 0.5259. In multivariate Cox analysis, a linear prediction model was established based on the weighted regression coefficients of the six prognosis-related CRRGs, calculated as Risk score = (0.2527 × ADA expression level) + (-0.6680 × CYP2D6 expression level) + (0.3155 × RYR2 expression level) + (0.3035 × DSCAM expression level) + (-0.1897 × IRF4 expression level) + (0.5259 × HPRT1 expression level).
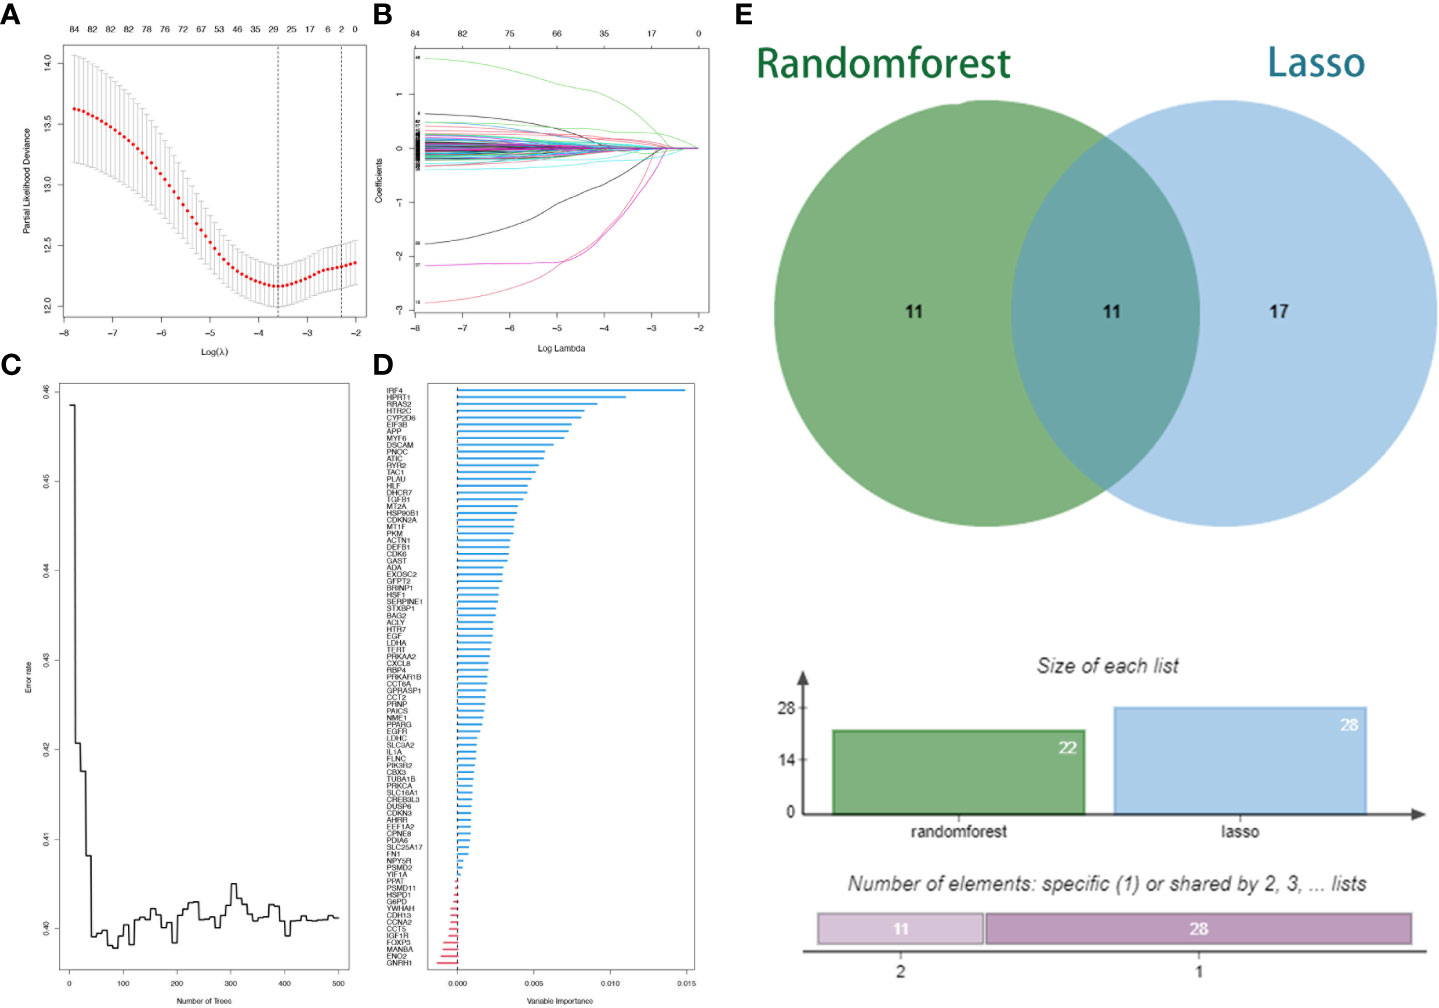
Figure 3 Lasso regression analysis and random survival forest screening for special issue genes. (A) Lasso coefficient curves. (B) Adjusted parameter selection in the Lasso model with tenfold cross validation. (C, D) RF error rate versus. (E) Wayne diagram showing intersection genes.
3.3 Validation of 6-CRRGs signature
For the purpose of evaluating the stability of the constructed risk model in predicting patient prognosis, we used the TCGA-HNSCC cohort as the internal training and the GSE41613 cohort as the external validation cohort. Risk scores were calculated separately for each sample in the TCGA training and validation cohorts based on the same risk formula, and we could find that when the risk of HNSCC patients was elevated in both cohorts, patients showed a survival disadvantage of reduced OS and increased mortality (Figures 4A, B). Based on the median risk score, we were able to divide the patients into two subgroups of high and low risk to explore prognostic differences. The Kaplan-Meier curves showed a significant difference in prognosis between the high and low-risk patients in these two cohorts respectively, with patients in the low-risk group having a more significant survival advantage (Figures 4C, D). The ROC curve (Receiver operating characteristic curve) was used as a tool to predict the survival time of patients at 1, 3, and 5 years. The AUC values for the TCGA-HNSCC cohort were 0.701, 0.705, and 0.664 respectively while the AUC values for the GSE41613 cohort were 0.723, 0.695, and 0.713 respectively (Figures 4E, F). This indicates that the model has an excellent predictive effect. Based on a principal components analysis of the risk model, both high-risk and low-risk patients in the two cohorts showed significant differences and were successfully divided into two relatively independent clusters (Figures 4G, H). These results confirm that the risk model has stable and excellent generalisability and predictive capability.
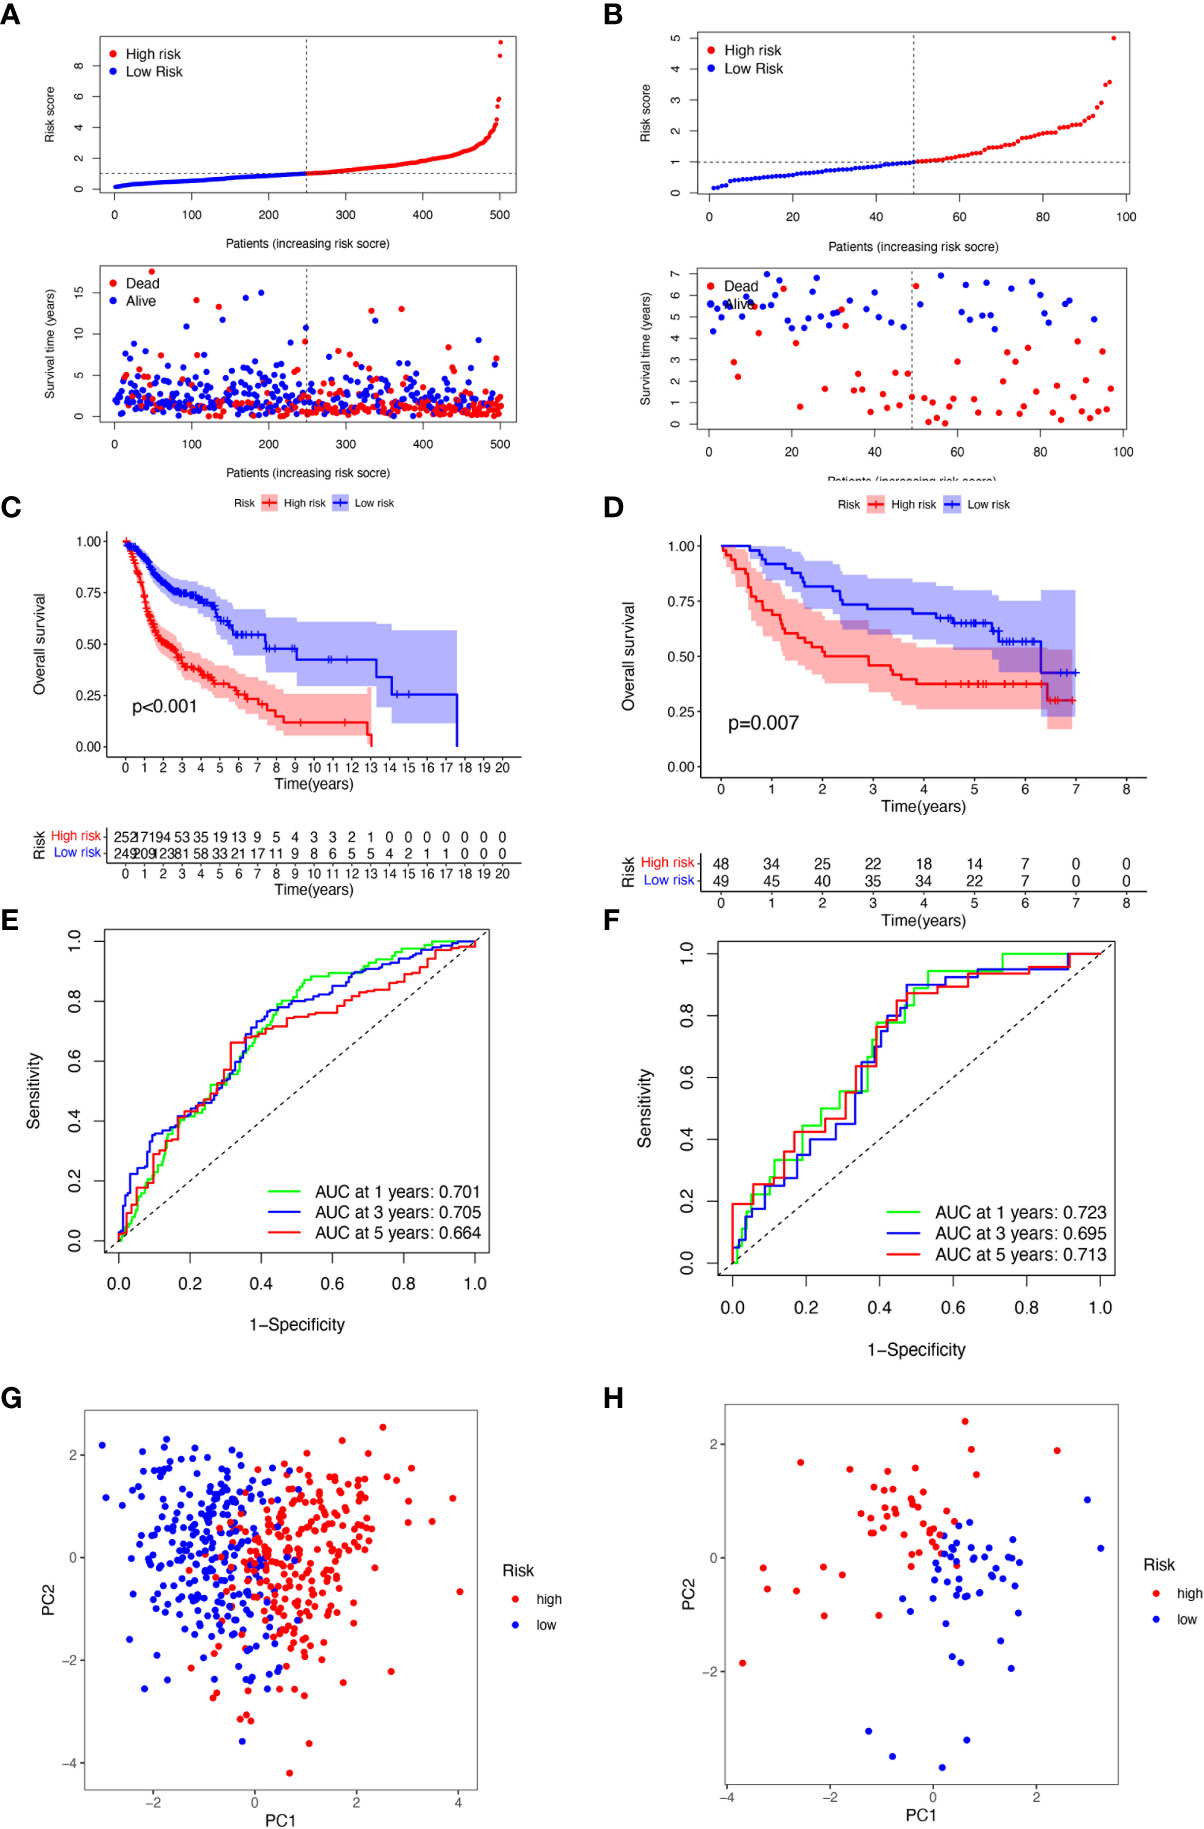
Figure 4 Validation of 6-CRRGs Signature. (A, B) Distribution of risk scores and patient survival between low and high-risk groups in the TCGA cohort and the GEO cohort. (C, D) KM curve compares the overall HNSCC patients between low- and high-risk groups in the TCGA cohort and the GEO cohort. (E, F) Time-dependent ROC curves analysis in the TCGA cohort and the GEO cohort. (G, H) PCA plot in the TCGA cohort and the GEO cohort.
3.4 Clinical correlation and survival analysis of 6-CRRGs in patients with HNSCC
Given the significant differences in OS between high and low-risk groups in individual clinical characteristics, in order to explore and compare such differences in a more focused manner, we divided HNSCC patients into six different subgroups based on clinical characteristics. Namely, pathological stage (I-II and III-IV), Age (≤65 and >65 years), gender (female and male), pathological grading (G1-2 and G3-4), N-stage (N0-1 and N2-3), T-stage (T1-2 and T3-4) and HPV status (positive and negative). Notably, in all subgroups, low-risk patients had a significant survival advantage of longer survival time compared to high-risk patients (Figure 5). Based on the analysis of the results, we are more confident that the 6-CRRGs risk model is a reliable clinical prediction tool.
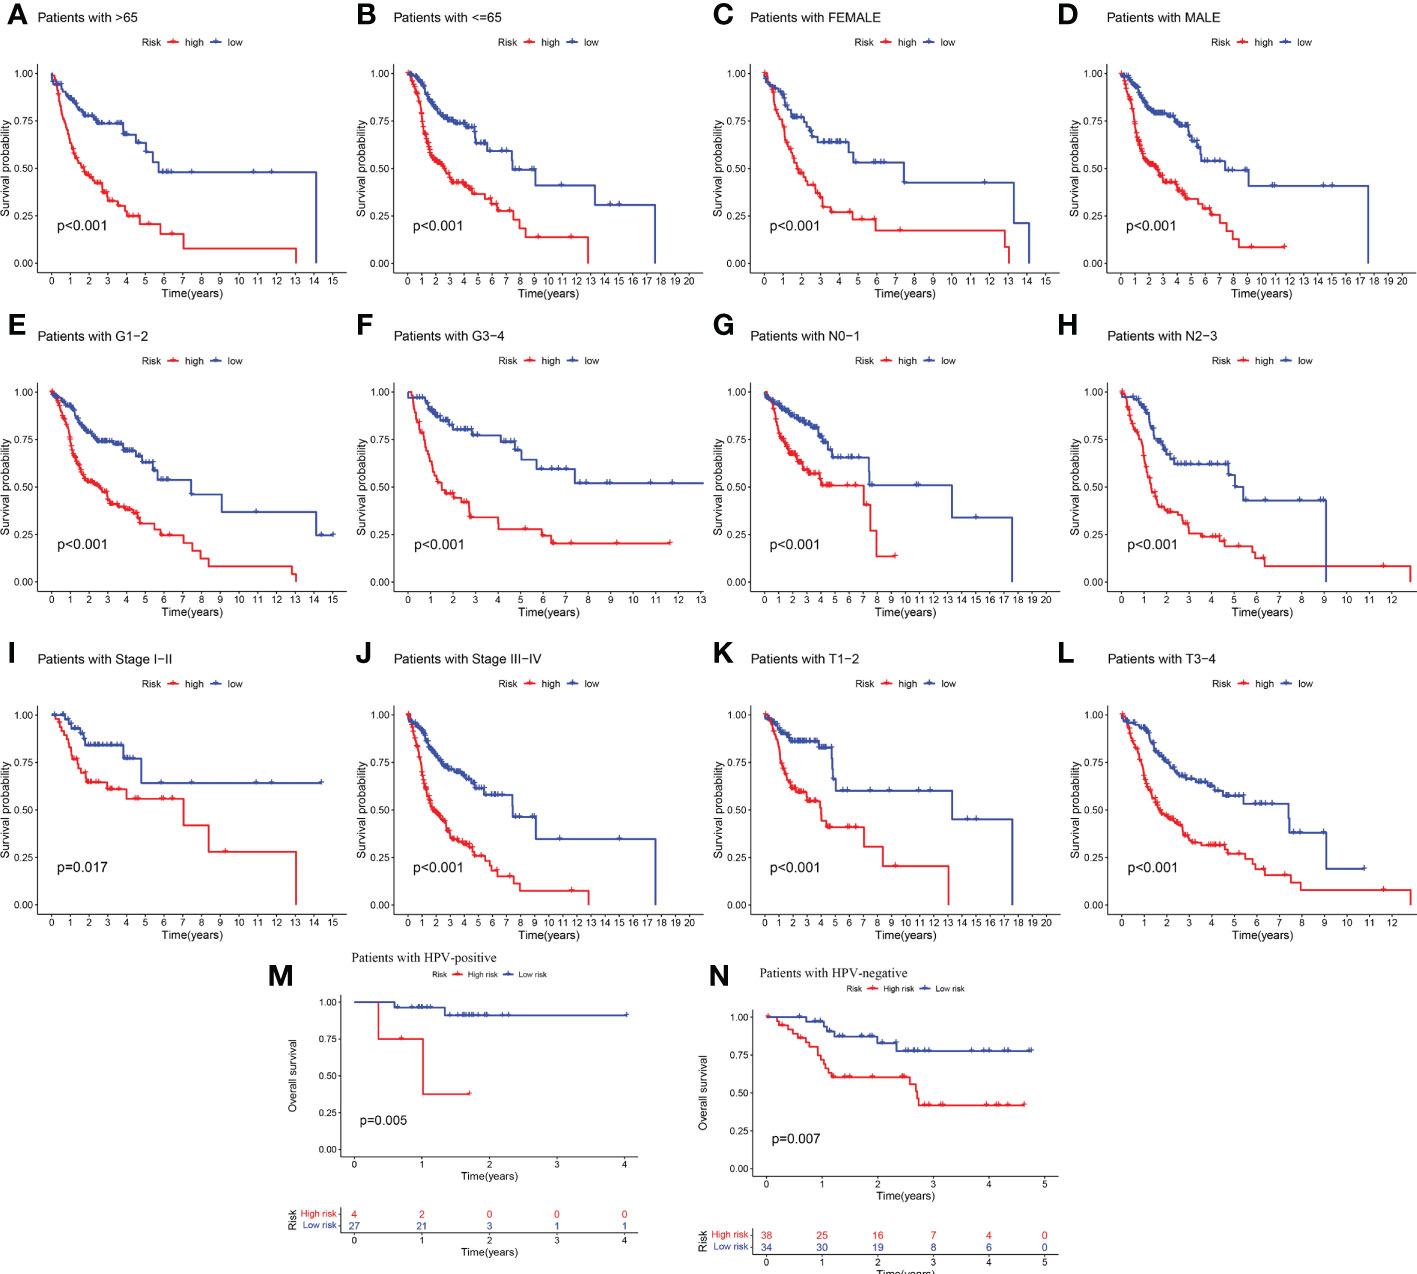
Figure 5 Clinical correlation and survival analysis of 6-CRRGs in patients with HNSCC (A, B) age, (C, D) gender, (E, F) tumor grade, (G, H) N stage, (I, J) tumor stage, (K, L) T stage, and (M, N) HPV status.
3.5 Correlation analysis of risk scores with clinical characteristics
To provide an analysis of the association between high and low-risk groups and clinical characteristics, a heatmap was made based on clinical characteristics, risk, and gene expression, which showed the correlation between CRRGs established in the prognostic risk model and the clinical characteristics and risk scores of all HNSCC patients in TCGA as a whole group (Supplementary Figure 1A). By comparing the distribution of clinical characteristics between the high and low-risk groups, we found significant differences in the distribution of clinical stage, grading, T-stage, and N-stage, while age and gender did not vary significantly between the two subgroups (Supplementary Figure 1B). The Wilcoxon test was then used to compare the differences in risk scores for clinical characteristics between the subgroups to test the correlation between both. Risk scores were found to be significantly associated with grade (P<0.01), T stage (P<0.01), stage (P<0.01), and N stage (P<0.05), but not with age, or gender (Supplementary Figures 1C–H).
3.6 Creation of nomograms based on 6-CRRGs signatures combined with clinical characteristics
To verify the credibility and clinical value of the biological signature constructed based on the 6-CRRGs as a predictor of prognosis, we included each HNSCC patient’s risk score with common clinical indicators for comparison and observed the correlation between each factor and patient prognosis after successive univariate Cox and multivariate Cox analyses. Based on the analysis of the results, it is clear that Stage, T-stage, N-stage, and risk score (P<0.001) were all prognostic factors significantly associated with patient prognosis in the univariate cox analysis (Figure 6A). However, after multifactorial cox analysis, only the risk score (P<0.001) and N stage (P=0.002) remained significant (Figure 6B). We further compared risk, N stage, and the remaining clinical indicators and it is worth noting that risk (AUC=0.701) was superior to N stage (AUC=0.609) and the other indicators (Figure 6E). It suggests that the risk score is the most reliable factor as an independent predictor of patient prognosis. Based on the above analysis, the hope of being able to predict patients’ prognoses quantitatively and inform clinical decision-making. We integrated the risk score and its clinical indicators to construct a Nomogram plot as a means of predicting the probability of prognostic survival at 1, 3, and 5 years (Figure 6C). Calibration analysis showed that the prediction curves for OS for patients at 1, 3, and 5 years were highly similar to the ideal 45-degree calibration line, indicating excellent stability of the Nomogram plot (Figure 6D). We then compared Nomogram, risk, and common clinicopathological features, with risk (AUC=0.718) and Nomogram (AUC=0.743) having more accurate predictive performance and discriminatory power than a single independent clinical indicator (Figure 6F). Subsequently, DCA (Decision curve analysis) showed that Nomogram and risk yielded greater net benefit and predictive benefit, indicating that both the model’s risk score and nomogram could be used as primary decision factors (Figure 6G). Combined with the above results, this suggests that our 6-CRRGs risk model is more practical and influential for clinical decision-making and is more suitable as a clinical decision tool for predicting the prognosis of HNSCC patients in the clinical setting.
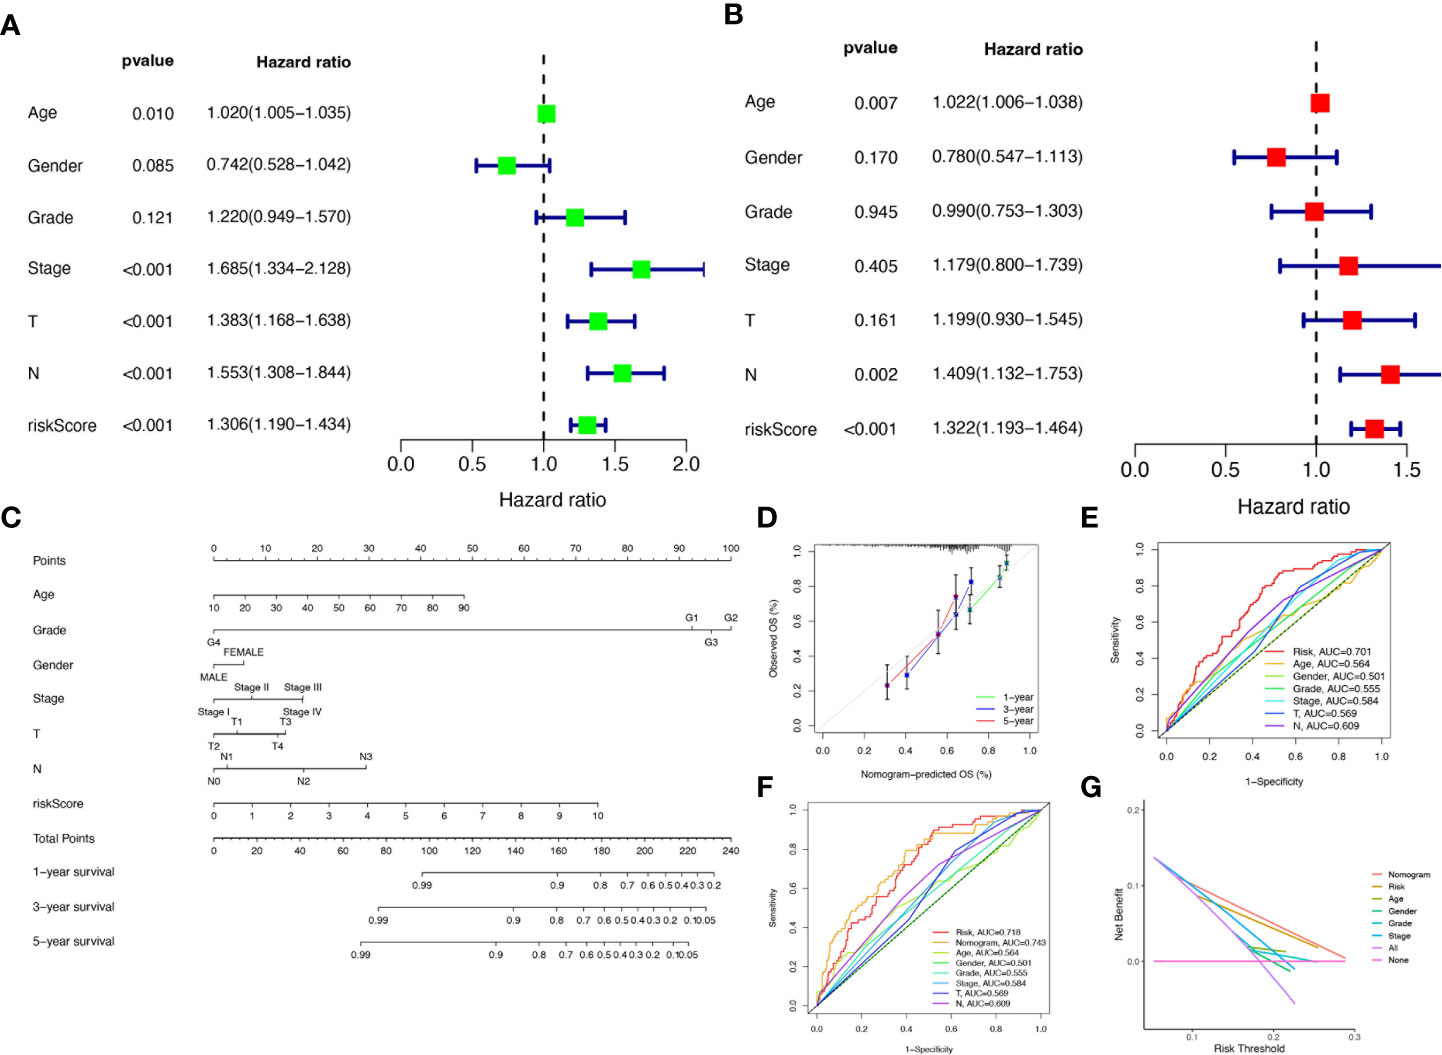
Figure 6 Creation of nomograms based on 6-CRRGs signatures combined with clinical characteristics. (A) Univariate and (B) multivariate COX regression analysis of the signature and different clinical features. (C) A nomogram combining risk score, age, grade, gender, stage, T stage, and N stage. (D) The calibration curve of the constructed nomogram of 1-year, 3-year, and 5-year survival. (E) Time-dependent ROC curves analysis. (F) The nomogram’s time-dependent ROC curves. (G) Decision curve analysis.
3.7 Functional enrichment analysis of CRRGs in HNSCC
We performed gene ontology (GO) analysis and Kyoto Encyclopedia of Genes and Genomes (KEGG) analysis on DEGs to elucidate the information pathways and underlying molecular mechanisms of the risk signature. After filtering the data according to thresholds (|log2FC|>1.0, FDR<0.05), we could obtain enrichment results that were significantly different in the HNSCC and normal groups. Cellular fractions (CC) mainly include immunoglobulin complex, external side of plasma membrane and immunoglobulin complex, circulating, etc. Molecular functions (MF) include mainly antigen binding and immunoglobulin receptor binding. Biological processes (BP) include immunoglobulin production, regulation of B cell activation, B cell receptor signaling pathway and humoral immune response, etc. (Figures 7A, B). KEGG and GSVA further explored enrichment pathways that differed significantly between high and low-risk groups, ultimately identifying 91 significantly enriched pathways (Figure 7C), including other relevant KEGG pathways such as base excision repair, and protein export in the high-risk group. The low-risk group included KEGG pathways related to α-linolenic acid metabolism, metabolism of linoleic acid, and metabolism of arachidonic acid. It is worth noting that the results of the GO enrichment analysis were mainly related to immune-related functions and biological processes, so we performed a more comprehensive and detailed analysis of the immune landscape of patients in the high and low-risk groups.
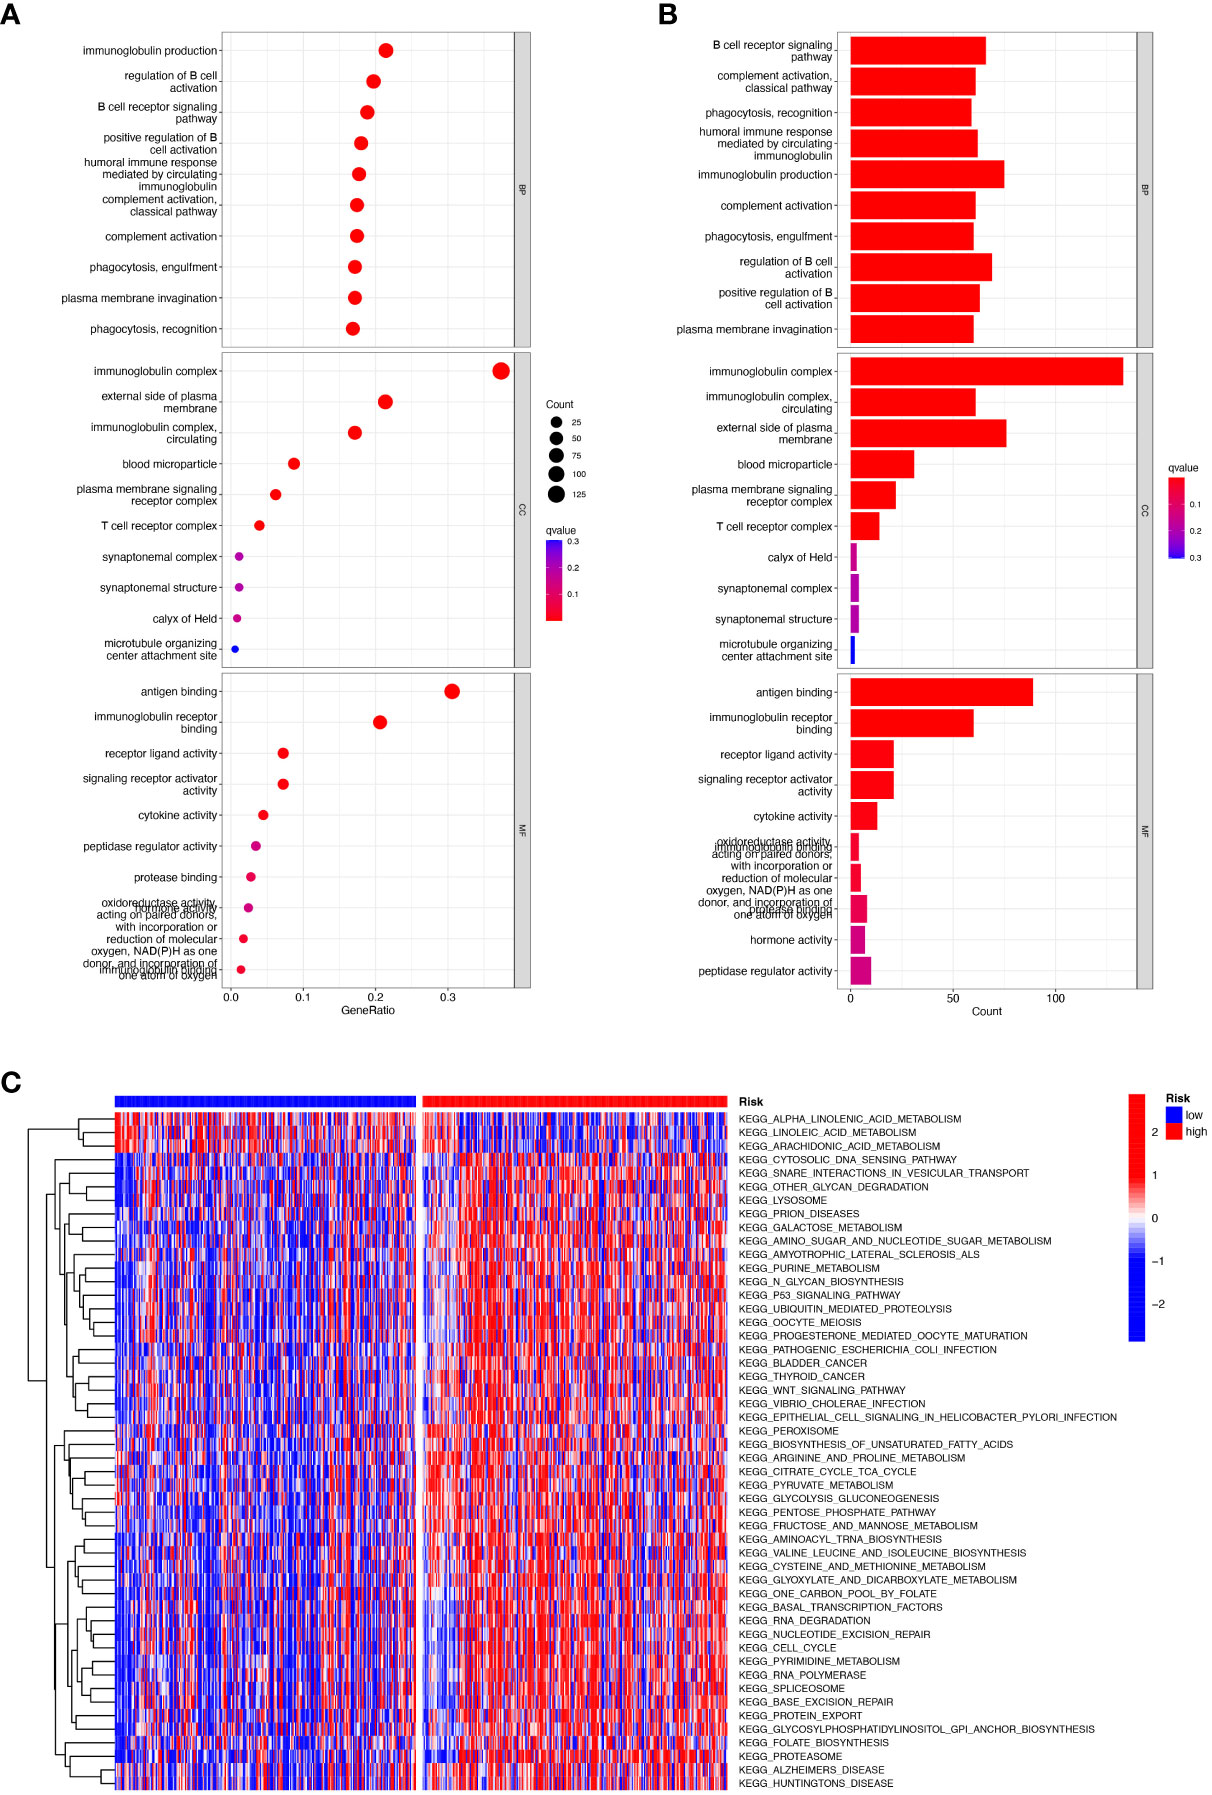
Figure 7 Functional enrichment analysis of CRRGs in TCGA-HNSCC. (A, B) Gene Ontology (GO) enrichment analysis was used to analyze the differential genes between HNSCC and normal samples. (C) GSVA analysis between the high-risk cohort and the low-risk cohort.
3.8 Multi-omics mutation analysis of 6-CRRGs
Aberrant mutations and copy number variants in somatic cells may have potential relevance in tumourigenesis and progression. We first visualized the distribution of mutated genes between high and low-risk groups with the ''maftools'' R package to see if the combined landscape of mutation profiles differed between the two subgroups. Through the results, we noted the distribution of the top 15 mutated genes with the highest frequency of change, with a higher frequency of somatic mutations in the high-risk group (95.6%) than in the low-risk group (88.98%) (Figures 8A, B). with the highest mutation frequencies being TP53, TTN, and FAT1 in that order. The analysis revealed significant differences in prognosis between the high and low TMB groups. Based on these results, we collaborated on the effects of TMB and risk scores for prognostic analysis, and we obtained four subgroups and found that patients with low TMB and low risk had a much better prognosis than the other subgroups (Figures 8C, D). However, there was no significant difference between the TMB and high and low-risk groups (Figure 8E). In addition, we explored the incidence of CNV mutations in the risk signature, where RYR2 and HPRT1 copy numbers tended to be amplified, while IRF4, DSCAM, CYP2D6, and ADA tended to be absent (Figure 8F). Figure 8G showed the percentage of CNV in HNSCC for 6-CRRGs. The mutational sites and mutational trends of 6-CRRGs on chromosomes are shown in Figure 8H. To clarify the biological mechanisms underlying the aberrant expression of 6-CRRGs in HNSCC patients, we investigated the single nucleotide locus variants (SNVs) of 6-CRRGs in patient tissues. Analysis of the results showed that missense mutations are most likely to occur in HNSCC patients and that single nucleotide polymorphisms (SNPs) are a common variant type (Figure 8I). Risk signatures in somatic mutations were present in a total of 87 HNSCC patients, with the highest frequency of mutations being in RYR2 (Figure 8J). SNV Classes were mainly C>T and C>A (Figure 8K). In addition, Spearman's correlation coefficient analysis of copy number variants and gene expression revealed that HPRT1 and ADA showed upregulated copy number variants (Figure 8L). We explored heterozygous and homozygous mutations and showed that the heterozygous copy number amplification was mainly in ADA and RYR2, while DSCAM was mainly realized as deletion. Homozygous mutations were mainly HPRT1 and RYR2 amplifications, while DSCAM again showed a reduction in copy number, so the abnormal gene expression could be the result of both copy number variation and single nucleotide variation (Figures 8M, N).
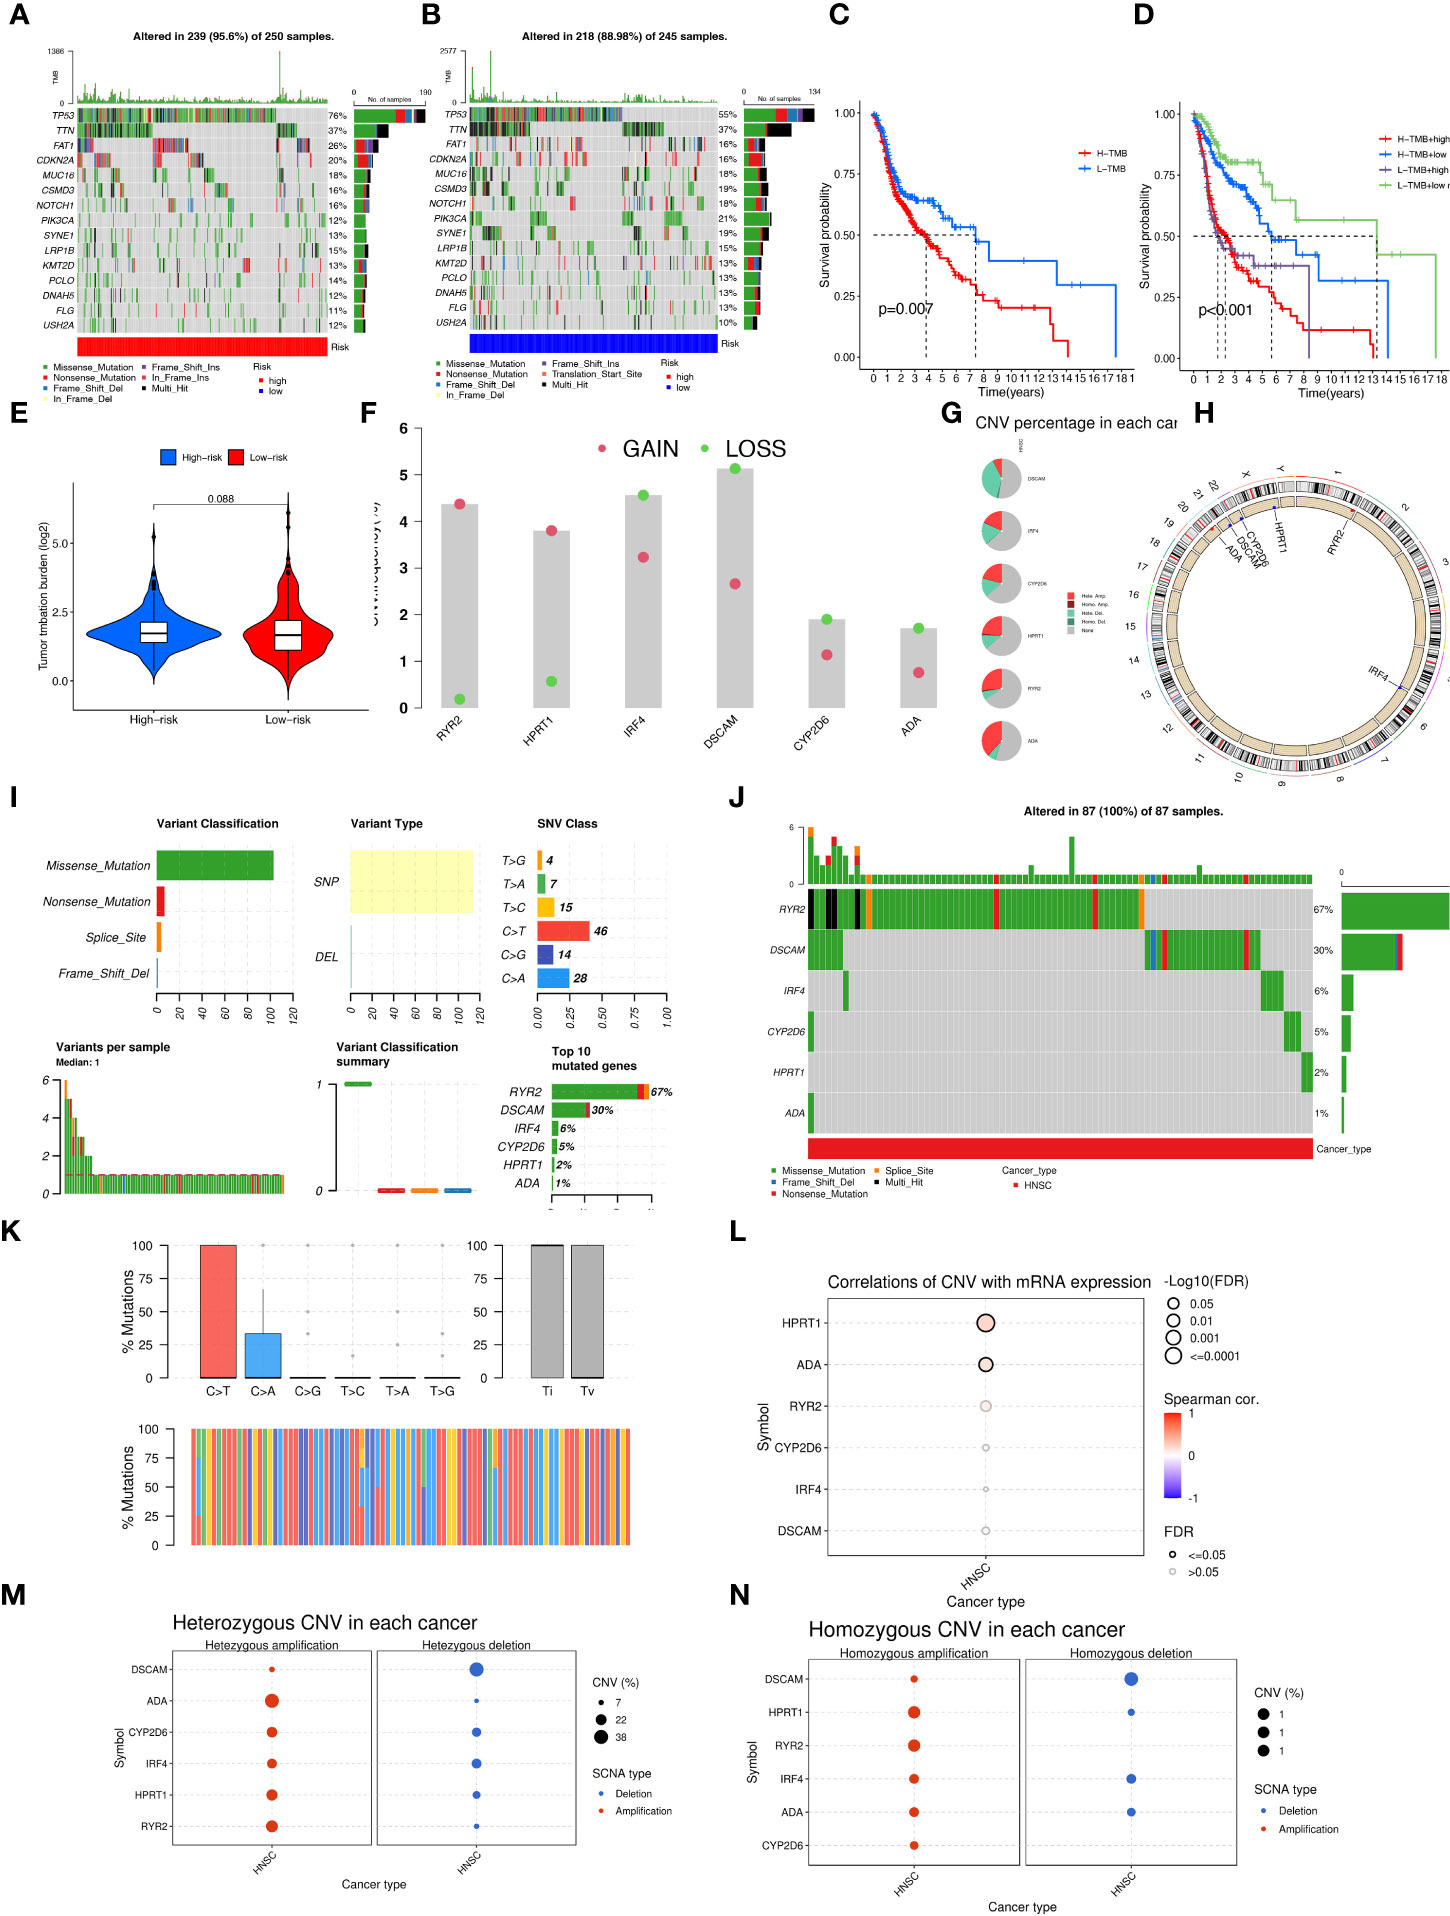
Figure 8 Multi-omics mutation analysis of 6-CRRGs. (A) Somatic mutations in the high-risk group. (B) Somatic mutations in the low risk group. (C) The KM curve compares the overall HNSCC patients between high and low mutation groups. (D) KM curve based on mutation and risk scores for the four subgroups compares the overall HNSCC patients between. (E) TMB analysis between high- and low-risk groups. (F) Copy number trends of 6-CRRGs. (G) CNV occupancy. (H) Copy number change circle plot. (I) Mutations of 6-CRRGs in TCGA-HNSCC patients. (J) Mutation analysis of 6-CRRGs in somatic cells. (K) SNV analysis. (L) Copy number variation and gene expression Spearman correlation coefficient analysis. (M) Heterozygous mutations. (N) Homozygous mutations.
3.9 6-CRRGs signature predicts TME and immune cell infiltration
Crosstalk between cancer cells and TME is closely related to tumor proliferation, invasion, and metastasis [27]. And while Tumor-infiltrating immune cells (TIICs) are one of the important components of TME, their composition, and distribution are inextricably linked to the process of tumor development. First, we explored the correlation between risk score and infiltrating immune cell abundance based on a total of seven different algorithms, EPIC, XCELL, CIBERSORT, MCPCOUNTER, QUANTISEQ, CIBERSORT-ABS and TIMER, where CD4+ T cell infiltration was positively correlated with risk score in most algorithms (Figure 9A). To bring the distribution of immune infiltration in HNSCC into full view to further explore the specific immune phenotype of HNSCC. Next, we explored the immune infiltration of 22 immune cell subpopulations inferred from mRNA expression in HNSCC patient tissues in the TCGA database by the CIBERSORT algorithm and investigated the differences between the high- and low-risk groups. The levels of the different types of immune cell populations in each HNSCC patient sample can be obtained by looking at the length of the various colors in the bar graph. From the graphs, we found a relatively high proportion of M0, M1, and M2 macrophages and T cells CD8, T cells CD4 memory resting in the tissues of HNSCC patients, accounting for approximately 57% of the 22 immune cell subpopulations. Instead, the percentage of eosinophils, Monocytes, and Neutrophils were relatively low at approximately 10% (Figure 9B). Meanwhile, since the composition of the tumor immune microenvironment significantly affects tumor growth, some studies have confirmed whether circadian rhythm disorders affect the ratio of various immune cells in the tumor microenvironment and ultimately promote tumor progression. The expression of Neutrophils, Eosinophils, Macrophages M2, Macrophages M1, and T cells CD4 memory resting was significantly higher in the high-risk group (Figure 9C). As immune cells with immune checkpoints can significantly influence immune function, we compared ssGSEA scores for immune function and several immune function scores were significantly higher in the low-risk group than in the high-risk group (Figure 9D). Owing to the importance of checkpoint-based immunotherapy, we analyzed the expression of immune checkpoint genes in the high-risk and low-risk groups. Most immune checkpoint genes were found to be significantly upregulated in the low-risk group, including IDO2, CTLA-4, TIGIT, KIR3DL1, PDCD1, and CD28 (Figure 9E), indicating that patients in the low-risk group may have better efficacy with ICB treatment. As ICB response plays an important role in immune checkpoint therapy, we further analyzed the correlation between risk score and ICB response signature and found that of these, only Systemic lupus erythematosus, Alcoholism, and Proteasome showed a significant negative correlation with a risk score. No significant correlations were found with the p53 signaling pathway, MicroRNAs in cancer, and Cytokine-cytokine receptor interaction with risk scores. In contrast, the other immune cycle steps were positively correlated with our risk score. A correlation analysis between risk score and ICB response signature was also performed, in which we found that the Re-lease of cancer cells, Monocyte recruiting, Neutrophil recruiting, Basophil recruiting, and MDSC recruiting (step 4) interactions were significantly positively correlated, only Cancer antigen presentation, Macrophage recruiting and Eosinophil recruiting (step 4) were not significantly correlated with risk scores, while the other immune cycle steps were negatively correlated with our risk scores (Figure 9F). More importantly, the expression of 6-CRRGs was significantly higher in patients with progressive and stable disease than in those in partial or complete remission (P=7.2e-06) (Figure 9G). To examine the potential of risk scores in predicting immunotherapy from a real immunotherapy cohort, we selected IMvigor210 as the cohort of patients receiving immunotherapy. The distribution of immune response outcomes in the high- and low-risk groups is shown in Supplementary Figure 2A, which shows that low-risk patients are more likely to produce an immune response, possibly predicting that low-risk patients can produce better therapy when receiving immunotherapy (Supplementary Figure 2B). Where the 1, 3, and 5-year predictive sensitivity was tested by ROC curves with satisfactory AUC values (Supplementary Figure 2C). The survival curves of patients in the high and low risk groups of the cohort clock were remarkably different, with a meaningful survival advantage for low risk patients (Supplementary Figure 2D).
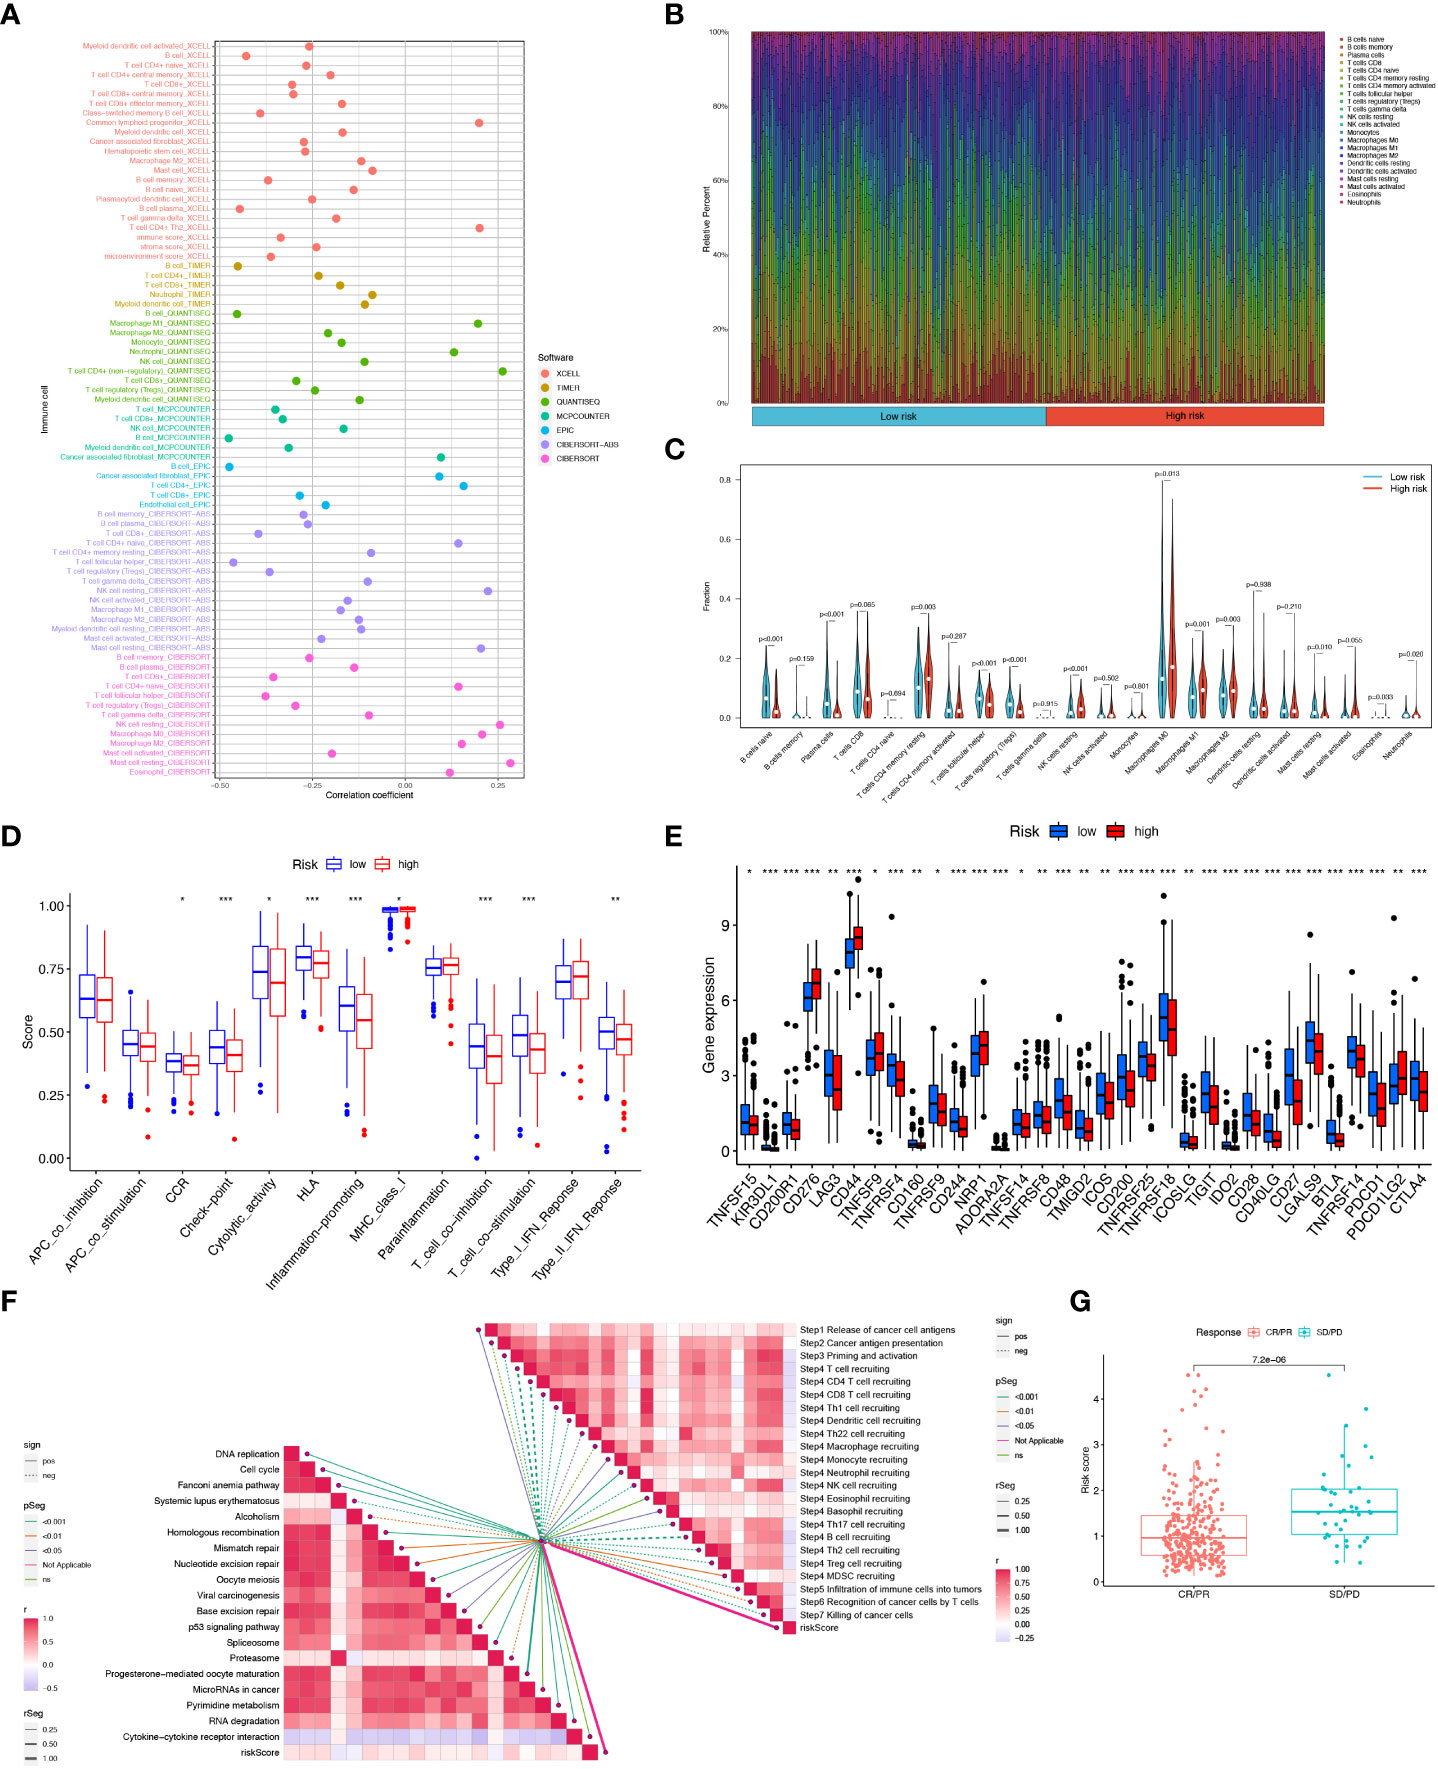
Figure 9 6-CRRGs risk score predicts TME and immune cell infiltration. (A) Immune cell bubble map. (B) Barplot showing the proportion of 22 kinds of TICs in HNSCC tumor samples. (C) Differences in immune cell infiltration between high- and low-risk groups. (D) Immune cell and immune function ssGSEA scores between high- and low-risk groups. (E) Immune checkpoint differences between high- and low-risk groups. (F) Correlation between risk score and ICB response signature. And the correlation of risk scores with each step of the tumor immune cycle. * P <0.05; ** P <0.01; *** P <0.001 (G) Correlation between risk scores and clinical response to cancer immunotherapy.
3.10 6-CRRGs signatures have better prognostic predictive performance than other signatures
For further demonstration of whether our constructed 6-CRRGs signature has an accurate predictive capability for HNSCC patients, we collected five published prognostic signatures, namely Liu signature (50), Jiang signature (51), Chen signature (52), Huang signature (53) and Wang signature (54) (Supplementary Figures 3A–F). To increase the comparability of signatures and to ensure fairness of comparison, we obtained risk coefficients for each gene using the same modeling approach, from which we were able to calculate the risk score for each HNSCC sample in the entire TCGA cohort. Furthermore, using the median value of the risk scores for all samples allowed the samples to be divided into two prognostic subgroups of high and low risk. It was found that while all five signatures, except the Chen signature, were effective in classifying HNSCC patients into two subgroups with significantly different prognoses, its ROC curves were not satisfactory in predicting AUC values for 1-, 3- and 5-year survival, all being significantly lower than the AUC values of our model. More notably on the C-index analysis, it also showed that our signature performed remarkably better than the other signatures (Supplementary Figure 3G). The above results suggest that our constructed signature of 6-CRRGs exhibits more accurate and stable predictive performance than the other signatures.
3.11 Correlation analysis of immune microenvironment and 6-CRRGs signature
Based on the single-cell dataset of HNSCC_GSE103322 in the TISCH database, we analyzed the correlation between the expression of 6-CRRGs and the immune microenvironment. There are 20 cell populations and 11 immune cell types stored in the GSE103322 dataset (Supplementary Figures 4A, B), and the distribution and numbers of various cell types are clearly visible (Supplementary Figure 4C). The expression levels of 6-CRRGs in various immune cells were observed in Supplementary Figures 4D–I, where ADA and HPRT1 were expressed on various immune cells, while IRF4 was mainly expressed in CD4Tconv, CD8T, and CD8Tex. Unfortunately, we found that CYP2D6, RYP2H, and DSCAM were barely expressed in the immune microenvironment.
3.12 6-CRRGs signature predicts chemotherapy sensitivity
On the basis of risk scores, to evaluate the potential biological value of 6-CRRGs as biomarkers for predicting response to clinical drug therapy in patients with HNSCC, we analyzed the IC50 values of 198 drugs between high and low risk groups of patients with TCGA-HNSCC by the “pRRophetic” R package. We found 142 chemotherapeutic or targeted agents with significantly different chemosensitivity. In Figure 10 we showed that in the low-risk group Rapamycin (P=0.00073), Docetaxel (P=0.00062), Gefitinib (P=3.7e-07), 5-Fluorouracil (P=5.7e-07), Lapatinib (P=1.7e-05) and Paclitaxel (P=1.1e-10) possessed higher IC50 values. In contrast, among the remaining six chemical or targeted agents IGF1R_3801 (P=2.9e-09), Erlotinib (P=0.00062), Camptothecin (P=2.1e-07), Cisplatin (P=0.00034), Palbociclib (P=8.8e-05) Gemcitabine (P=2.2e-08) had higher IC50 values at higher risk.
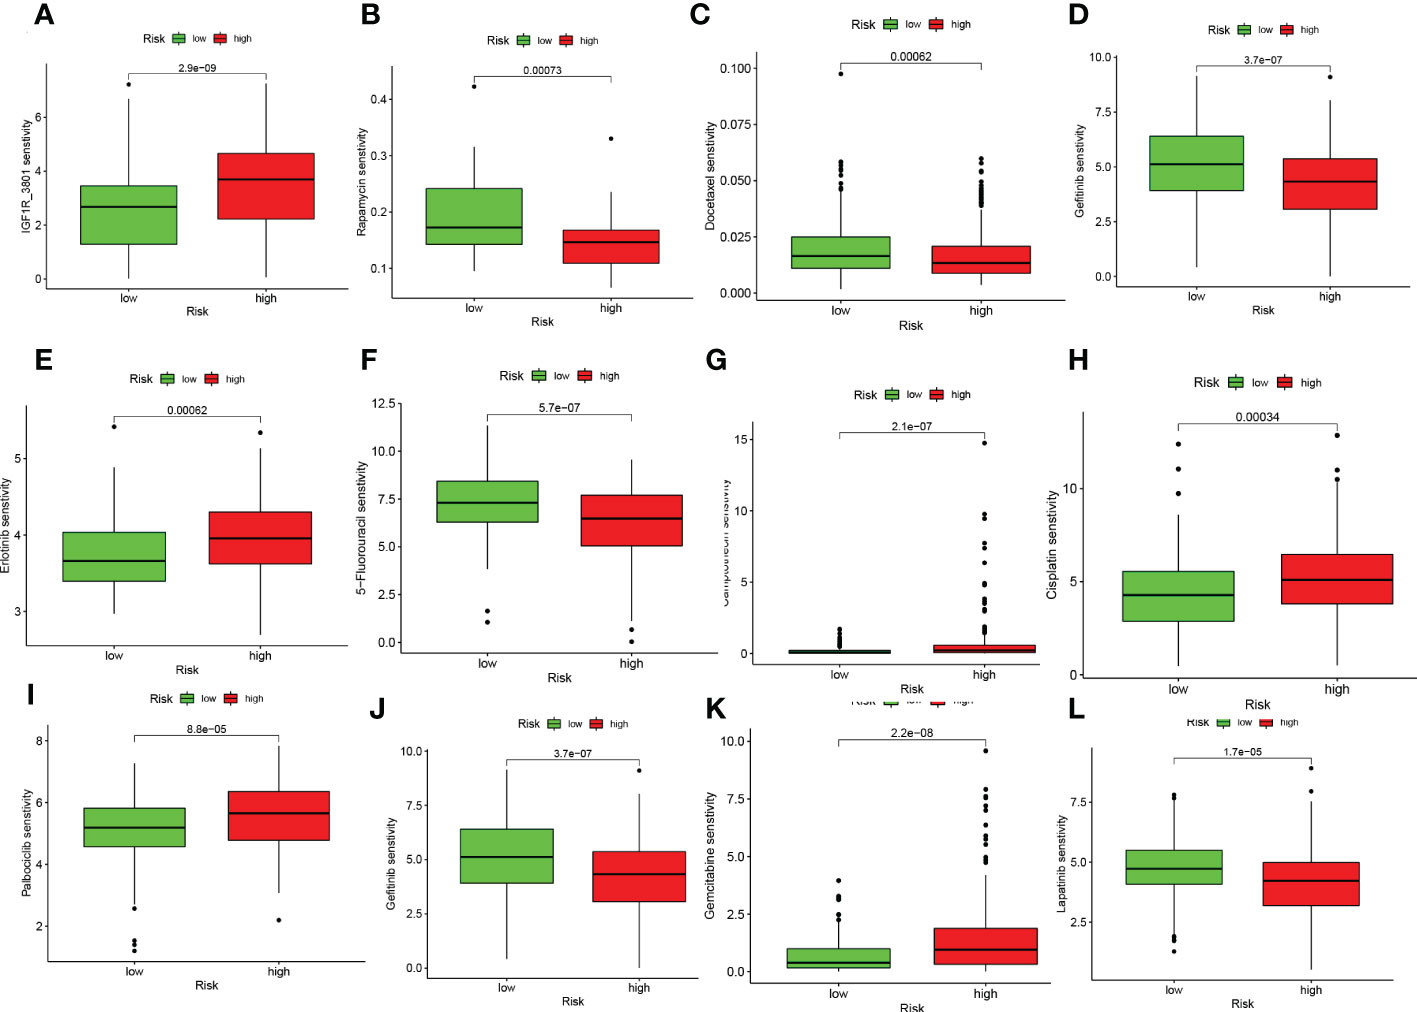
Figure 10 6-CRRGs signature predicts chemotherapy sensitivity. (A) IGF1R_3801, (B) Rapamycin, (C) Docetaxel, (D) Paclitaxel, (E) Erlotinib, (F) 5-Fluorouracil, (G) Camptonthecin, (H) Cisplatin, (I) Palbociclib, (J) Gefitinib, (K) Gemcitabine, (L) Lapatinib.
4 Discussion
Despite the heavy health burden of HNSCC on society, circadian rhythm-associated genes have lacked systematic studies in HNSCC. Therefore, we constructed a multigene prognostic model based on circadian rhythm-related genes based on the TCGA-HNSCC dataset. In this study, we selected 6-CRRGs to construct a new prognostic model using Lasso, RF, and univariate and multifactor COX risk regression analyses. The signature of the 6-CRRGs we constructed proved to be an independent prognostic factor for HNSCC. We found significant prognostic differences between the two groups. ROC curve and calibration curve analyses demonstrated the outstanding predictive performance of the 6-CRRGs signature. In addition, we constructed a nomogram and found that the 6-CRRGs signature has better predictive efficacy compared to clinicopathological features, which can help clinicians to make more accurate prognostic judgments for HNSCC patients.
It is now well established that adenosine is able to bind to A2AR and thereby limit the antitumor activity of CD4+ T cells, CD8+ T cells, and NK cells, and that it induces the expression of CTLA-4 and PD-1 to promote immune escape (55, 56). ADA is a key enzyme that protects T cells from adenosine inhibition, and its absence would promote tumor progression (57, 58). On this basis, ADA activity was considered an indicator of immune function in patients with HNSCC (59, 60). Cytochrome P450 2D6 (CYP2D6) is a catabolic enzyme of some commonly used drugs. Individuals with the CYP2D6PM genotype have been reported to be more susceptible to HNSCC and to have a greater impact on treatment response (61). mutations in ryanodine receptor 2 (RYR2) are commonly thought to be strongly associated with lethal arrhythmias and heart failure (62, 63). and subsequent studies have shown that RYR2 somatic mutations and promoter methylation were shown to contribute to the pathogenesis of HNSCC (64). Hypoxanthine phosphoribosyl transferase 1 (HPRT1) regulates the production of purines and inosine involved in the cell cycle and can enhance chemoresistance via the MMP1/PI3K/Akt axis in patients with oral squamous cell carcinoma (65).
TME has become a consensus as a key factor influencing the development of cancer, and the immune microenvironment should be noted as one of the main features of TME. Treg cells, as key cells regulating immune responses and maintaining self-tolerance, cause CD8+ T cell dysfunction in TME in HNSCC (66–68). In addition, despite the higher degree of infiltration of M1-type macrophages in the high-risk group, it has been shown that M2 is the predominant macrophage type in TME of HNSCC and is able to suppress the antitumor effects of M1 by secreting various cytokines (69–71). Further integrating the results of immune cell, and immune function analysis, we hypothesize that both low- and high-risk groups of HNSCC patients may have a suppressive immune microenvironment and limited immune cell infiltration different from other common malignancies. Given the immunosuppression and therapeutic resistance caused by complex TME, immunotherapy has great potential for oncology treatment (72). Ipilimumab is an FDA-approved CTLA-4 inhibitor and has been tested in various clinical trials in patients with HNSCC (NCT02369874, NCT02551159, NCT02319044) (73–76). One case reported a satisfactory outcome with nabumab in combination with ipilimumab in a patient with refractory HNSCC (77). Unfortunately, although immune checkpoint blockade (ICB)-based immunotherapies have some potential for HNSCC, most patients have satisfactory efficacy against them, and the intensity of the stimulatory co-signal hardly exceeds that of the heavy inhibitory factor in TME (78, 79). Therefore, it is crucial to screen patients sensitive to various immune checkpoint therapies based on their expression of immune checkpoint genes, and our model has promising results in this regard.
High tumor mutational load is usually considered to be strongly associated with a good prognosis due to increased immunogenicity of tumor-specific antigenic targets and tumor-infiltrating immune cells (80). However, the opposite result has been observed in HNSCC, possibly due to the low immunogenicity of HNSCC (81). The search for new antigens that are widely mutated in HNSCC is crucial for targeted therapy. TP53, due to its ability to halt tumor progression by regulating apoptosis, angiogenesis, and DNA repair, may promote tumor cell metastasis through the accumulation of p53 molecules compared to wild-type TP53 leading to poor prognosis in HNSCC patients (82, 83). FAT1 has two opposing mechanisms, on the one hand, binding ß-catenin to prevent tumor progression. On the other hand, interaction with Ena/VAPS and Scribble promotes cell invasiveness and metastasis, which requires additional experimental studies under different conditions (84–86). These highly mutated genes in HNSCC provide new directions and perspectives for subsequent targeted therapies, which may lead to better benefits for patients.
Although the 6-CRRGs signature we constructed has promising value in predicting the prognosis of HNSCC patients and helping clinicians with treatment selection, we still need to acknowledge that this study has some limitations. Firstly, our study was based on the analysis of data from public databases, which may lead to deviations in predictions from the actual situation, although we have taken several approaches to try to avoid this. There is still a need to collect a large amount of clinical information on HNSCC patients in the clinic as well as sequencing data after receiving immunotherapy in order to validate the accuracy of the practical application of the model and the accuracy of predicting response to immunotherapy and chemotherapy. Finally, we did not consider tumor location in this study because HNSCC contains too many sites of incidence, and the number of patients varies too much from site to site. In TCGA, some of the tumors had only single-digit sample sizes and could not be studied. This is, of course, one of the limitations of our study.
5 Conclusion
In summary, we systematically explored 6-CRRGs signature for HNSCC and successfully constructed a prognostic signature of 6-CRRGs, which can accurately assess the prognosis and immune status of HNSCC patients and help clinicians identify specific sub-groups of patients who may benefit from immunotherapy and chemotherapy for personalized treatment.
Data availability statement
The original contributions presented in the study are included in the article/Supplementary Material. Further inquiries can be directed to the corresponding authors.
Author contributions
GT and ZX conceived the study. HC, JY, and GP drafted the manuscript. HC, JZ, and XX performed the literature search and collected the data. GS, XX, and JZ analyzed and visualized the data. JL, ZX, and GT helped with the final revision of this manuscript. All authors contributed to the article and approved the submitted version.
Funding
This study was supported by grants from the Luzhou Science and Technology Department Applied Basic Research Program (No: 2022-JYJ-145), and the Sichuan Province Science and Technology Department of foreign (border) high-end talent introduction project (No: 2023JDGD0037).
Acknowledgments
We thank the Southwest Medical University Student Innovation and Entrepreneurship Program for its support.
Conflict of interest
The authors declare that the research was conducted in the absence of any commercial or financial relationships that could be construed as a potential conflict of interest.
Publisher’s note
All claims expressed in this article are solely those of the authors and do not necessarily represent those of their affiliated organizations, or those of the publisher, the editors and the reviewers. Any product that may be evaluated in this article, or claim that may be made by its manufacturer, is not guaranteed or endorsed by the publisher.
Supplementary material
The Supplementary Material for this article can be found online at: https://www.frontiersin.org/articles/10.3389/fimmu.2023.1091218/full#supplementary-material
Supplementary Table 1 | 1424 CRRGs were obtained through Genecards database.
Supplementary Table 2 | Differential expression analysis of CRRGs in HNSCC and normal tissues.
References
1. Leemans CR, Braakhuis BJ, Brakenhoff RH. The molecular biology of head and neck cancer. Nat Rev Cancer (2011) 11(1):9–22. doi: 10.1038/nrc2982
2. Fitzmaurice C, Allen C, Barber RM, Barregard L, Bhutta ZA, Brenner H, et al. Global, regional, and national cancer incidence, mortality, years of life lost, years lived with disability, and disability-adjusted life-years for 32 cancer groups, 1990 to 2015: A systematic analysis for the global burden of disease study. JAMA Oncol (2017) 3(4):524–48. doi: 10.1001/jamaoncol.2016.5688
3. Grégoire V, Langendijk JA, Nuyts S. Advances in radiotherapy for head and neck cancer. J Clin Oncol (2015) 33(29):3277–84. doi: 10.1200/jco.2015.61.2994
4. Cramer JD, Burtness B, Le QT, Ferris RL. The changing therapeutic landscape of head and neck cancer. Nat Rev Clin Oncol (2019) 16(11):669–83. doi: 10.1038/s41571-019-0227-z
5. Worsham MJ. Identifying the risk factors for late-stage head and neck cancer. Expert Rev Anticancer Ther (2011) 11(9):1321–5. doi: 10.1586/era.11.135
6. Liu SA, Wang CC, Jiang RS, Lee FY, Lin WJ, Lin JC. Pathological features and their prognostic impacts on oral cavity cancer patients among different subsites - a singe institute's experience in Taiwan. Sci Rep (2017) 7(1):7451. doi: 10.1038/s41598-017-08022-w
7. Wreesmann VB, Katabi N, Palmer FL, Montero PH, Migliacci JC, Gönen M, et al. Influence of extracapsular nodal spread extent on prognosis of oral squamous cell carcinoma. Head Neck (2016) 38 Suppl 1(Suppl 1):E1192–9. doi: 10.1002/hed.24190
8. Vasan K, Low TH, Gupta R, Ashford B, Asher R, Gao K, et al. Lymph node ratio as a prognostic factor in metastatic cutaneous head and neck squamous cell carcinoma. Head Neck (2018) 40(5):993–9. doi: 10.1002/hed.25066
9. Chi H, Xie X, Yan Y, Peng G, Strohmer DF, Lai G, et al. Natural killer cell-related prognosis signature characterizes immune landscape and predicts prognosis of hnscc. Front Immunol (2022) 13:1018685. doi: 10.3389/fimmu.2022.1018685
10. Peng G, Chi H, Gao X, Zhang J, Song G, Xie X, et al. Identification and validation of neurotrophic factor-related genes signature in hnscc to predict survival and immune landscapes. Front Genet (2022) 13:1010044. doi: 10.3389/fgene.2022.1010044
11. Chi H, Jiang P, Xu K, Zhao Y, Song B, Peng G, et al. A novel anoikis-related gene signature predicts prognosis in patients with head and neck squamous cell carcinoma and reveals immune infiltration. Front Genet (2022) 13:984273. doi: 10.3389/fgene.2022.984273
12. Garratt KN, Kaufmann UP, Edwards WD, Vlietstra RE, Holmes DR Jr. Safety of percutaneous coronary atherectomy with deep arterial resection. Am J Cardiol (1989) 64(8):538–40. doi: 10.1016/0002-9149(89)90437-2
13. Dobson CM. Dynamics and timekeeping in biological systems. Annu Rev Biochem (2014) 83:159–64. doi: 10.1146/annurev-biochem-013014-102724
14. Sancar A, Lindsey-Boltz LA, Kang TH, Reardon JT, Lee JH, Ozturk N. Circadian clock control of the cellular response to DNA damage. FEBS Lett (2010) 584(12):2618–25. doi: 10.1016/j.febslet.2010.03.017
15. Reppert SM, Weaver DR. Coordination of circadian timing in mammals. Nature (2002) 418(6901):935–41. doi: 10.1038/nature00965
16. Cadenas C, van de Sandt L, Edlund K, Lohr M, Hellwig B, Marchan R, et al. Loss of circadian clock gene expression is associated with tumor progression in breast cancer. Cell Cycle (2014) 13(20):3282–91. doi: 10.4161/15384101.2014.954454
17. Fu L, Kettner NM. The circadian clock in cancer development and therapy. Prog Mol Biol Transl Sci (2013) 119:221–82. doi: 10.1016/b978-0-12-396971-2.00009-9
18. Li HX. The role of circadian clock genes in tumors. Onco Targets Ther (2019) 12:3645–60. doi: 10.2147/ott.S203144
19. Kang TH, Lindsey-Boltz LA, Reardon JT, Sancar A. Circadian control of xpa and excision repair of cisplatin-DNA damage by cryptochrome and Herc2 ubiquitin ligase. Proc Natl Acad Sci U.S.A. (2010) 107(11):4890–5. doi: 10.1073/pnas.0915085107
20. Kang TH, Reardon JT, Kemp M, Sancar A. Circadian oscillation of nucleotide excision repair in mammalian brain. Proc Natl Acad Sci U.S.A. (2009) 106(8):2864–7. doi: 10.1073/pnas.0812638106
21. Sancar A. Regulation of the mammalian circadian clock by cryptochrome. J Biol Chem (2004) 279(33):34079–82. doi: 10.1074/jbc.R400016200
22. Sun CM, Huang SF, Zeng JM, Liu DB, Xiao Q, Tian WJ, et al. Per2 inhibits K562 leukemia cell growth in vitro and in vivo through cell cycle arrest and apoptosis induction. Pathol Oncol Res (2010) 16(3):403–11. doi: 10.1007/s12253-009-9227-0
23. Narasimamurthy R, Hatori M, Nayak SK, Liu F, Panda S, Verma IM. Circadian clock protein cryptochrome regulates the expression of proinflammatory cytokines. Proc Natl Acad Sci U.S.A. (2012) 109(31):12662–7. doi: 10.1073/pnas.1209965109
24. Blask DE, Hill SM, Dauchy RT, Xiang S, Yuan L, Duplessis T, et al. Circadian regulation of molecular, dietary, and metabolic signaling mechanisms of human breast cancer growth by the nocturnal melatonin signal and the consequences of its disruption by light at night. J Pineal Res (2011) 51(3):259–69. doi: 10.1111/j.1600-079X.2011.00888.x
25. Taniguchi H, Fernández AF, Setién F, Ropero S, Ballestar E, Villanueva A, et al. Epigenetic inactivation of the circadian clock gene Bmal1 in hematologic malignancies. Cancer Res (2009) 69(21):8447–54. doi: 10.1158/0008-5472.Can-09-0551
26. Yuan W, Liu L, Wei C, Li X, Sun D, Dai C, et al. Identification and meta-analysis of copy number variation-driven circadian clock genes for colorectal cancer. Oncol Lett (2019) 18(5):4816–24. doi: 10.3892/ol.2019.10830
27. Chai R, Liao M, Ou L, Tang Q, Liang Y, Li N, et al. Circadian clock genes act as diagnostic and prognostic biomarkers of glioma: Clinic implications for chronotherapy. BioMed Res Int (2022) 2022:9774879. doi: 10.1155/2022/9774879
28. Liang Y, Wang S, Huang X, Chai R, Tang Q, Yang R, et al. Dysregulation of circadian clock genes as significant clinic factor in the tumorigenesis of hepatocellular carcinoma. Comput Math Methods Med (2021) 2021:8238833. doi: 10.1155/2021/8238833
29. Chi H, Peng G, Wang R, Yang F, Xie X, Zhang J, et al. Cuprotosis programmed-Cell-Death-Related lncrna signature predicts prognosis and immune landscape in paad patients. Cells (2022) 11(21):3436. doi: 10.3390/cells11213436
30. Zhao S, Chi H, Ji W, He Q, Lai G, Peng G, et al. A bioinformatics-based analysis of an anoikis-related gene signature predicts the prognosis of patients with low-grade gliomas. Brain Sci (2022) 12(10):1349. doi: 10.3390/brainsci12101349
31. Chi H, Peng G, Yang J, Zhang J, Song G, Xie X, et al. Machine learning to construct sphingolipid metabolism genes signature to characterize the immune landscape and prognosis of patients with uveal melanoma. Front Endocrinol (Lausanne) (2022) 13:1056310. doi: 10.3389/fendo.2022.1056310
32. Friedman J, Hastie T, Tibshirani R. Regularization paths for generalized linear models Via coordinate descent. J Stat Softw (2010) 33(1):1–22.
33. Aran D, Hu Z, Butte AJ. Xcell: Digitally portraying the tissue cellular heterogeneity landscape. Genome Biol (2017) 18(1):220. doi: 10.1186/s13059-017-1349-1
34. Aran D. Cell-type enrichment analysis of bulk transcriptomes using xcell. Methods Mol Biol (2020) 2120:263–76. doi: 10.1007/978-1-0716-0327-7_19
35. Chen B, Khodadoust MS, Liu CL, Newman AM, Alizadeh AA. Profiling tumor infiltrating immune cells with cibersort. Methods Mol Biol (2018) 1711:243–59. doi: 10.1007/978-1-4939-7493-1_12
36. Li T, Fu J, Zeng Z, Cohen D, Li J, Chen Q, et al. Timer2.0 for analysis of tumor-infiltrating immune cells. Nucleic Acids Res (2020) 48(W1):W509–w14. doi: 10.1093/nar/gkaa407
37. Plattner C, Finotello F, Rieder D. Deconvoluting tumor-infiltrating immune cells from rna-seq data using quantiseq. Methods Enzymol (2020) 636:261–85. doi: 10.1016/bs.mie.2019.05.056
38. Finotello F, Mayer C, Plattner C, Laschober G, Rieder D, Hackl H, et al. Molecular and pharmacological modulators of the tumor immune contexture revealed by deconvolution of rna-seq data. Genome Med (2019) 11(1):34. doi: 10.1186/s13073-019-0638-6
39. Dienstmann R, Villacampa G, Sveen A, Mason MJ, Niedzwiecki D, Nesbakken A, et al. Relative contribution of clinicopathological variables, genomic markers, transcriptomic subtyping and microenvironment features for outcome prediction in stage Ii/Iii colorectal cancer. Ann Oncol (2019) 30(10):1622–9. doi: 10.1093/annonc/mdz287
40. Racle J, de Jonge K, Baumgaertner P, Speiser DE, Gfeller D. Simultaneous enumeration of cancer and immune cell types from bulk tumor gene expression data. Elife (2017) 6:e26476. doi: 10.7554/eLife.26476
41. Zhang H, Li R, Cao Y, Gu Y, Lin C, Liu X, et al. Poor clinical outcomes and immunoevasive contexture in intratumoral il-10-Producing macrophages enriched gastric cancer patients. Ann Surg (2022) 275(4):e626–e35. doi: 10.1097/sla.0000000000004037
42. Tamminga M, Hiltermann TJN, Schuuring E, Timens W, Fehrmann RS, Groen HJ. Immune microenvironment composition in non-small cell lung cancer and its association with survival. Clin Transl Immunol (2020) 9(6):e1142. doi: 10.1002/cti2.1142
43. Auslander N, Zhang G, Lee JS, Frederick DT, Miao B, Moll T, et al. Robust prediction of response to immune checkpoint blockade therapy in metastatic melanoma. Nat Med (2018) 24(10):1545–9. doi: 10.1038/s41591-018-0157-9
44. Xu L, Deng C, Pang B, Zhang X, Liu W, Liao G, et al. Tip: A web server for resolving tumor immunophenotype profiling. Cancer Res (2018) 78(23):6575–80. doi: 10.1158/0008-5472.Can-18-0689
45. Mariathasan S, Turley SJ, Nickles D, Castiglioni A, Yuen K, Wang Y, et al. Tgfβ attenuates tumour response to pd-L1 blockade by contributing to exclusion of T cells. Nature (2018) 554(7693):544–8. doi: 10.1038/nature25501
46. Hänzelmann S, Castelo R, Guinney J. Gsva: Gene set variation analysis for microarray and rna-seq data. BMC Bioinf (2013) 14:7. doi: 10.1186/1471-2105-14-7
47. Mayakonda A, Lin DC, Assenov Y, Plass C, Koeffler HP. Maftools: Efficient and comprehensive analysis of somatic variants in cancer. Genome Res (2018) 28(11):1747–56. doi: 10.1101/gr.239244.118
48. Robinson DR, Wu YM, Lonigro RJ, Vats P, Cobain E, Everett J, et al. Integrative clinical genomics of metastatic cancer. Nature (2017) 548(7667):297–303. doi: 10.1038/nature23306
49. Liu CJ, Hu FF, Xia MX, Han L, Zhang Q, Guo AY. Gscalite: A web server for gene set cancer analysis. Bioinformatics (2018) 34(21):3771–2. doi: 10.1093/bioinformatics/bty411
50. Liu B, Su Q, Ma J, Chen C, Wang L, Che F, et al. Prognostic value of eight-gene signature in head and neck squamous carcinoma. Front Oncol (2021) 11:657002. doi: 10.3389/fonc.2021.657002
51. Jiang AM, Ren MD, Liu N, Gao H, Wang JJ, Zheng XQ, et al. Tumor mutation burden, immune cell infiltration, and construction of immune-related genes prognostic model in head and neck cancer. Int J Med Sci (2021) 18(1):226–38. doi: 10.7150/ijms.51064
52. Chen Y, Li ZY, Zhou GQ, Sun Y. An immune-related gene prognostic index for head and neck squamous cell carcinoma. Clin Cancer Res (2021) 27(1):330–41. doi: 10.1158/1078-0432.Ccr-20-2166
53. Huang C, Liang Y, Dong Y, Huang L, Li A, Du R, et al. Novel prognostic matrisome-related gene signature of head and neck squamous cell carcinoma. Front Cell Dev Biol (2022) 10:884590. doi: 10.3389/fcell.2022.884590
54. Jiang Y, Li Y, Ge H, Wu Y, Zhang Y, Guo S, et al. Identification of an autophagy-related prognostic signature in head and neck squamous cell carcinoma. J Oral Pathol Med (2021) 50(10):1040–9. doi: 10.1111/jop.13231
55. Ohta A. A metabolic immune checkpoint: Adenosine in tumor microenvironment. Front Immunol (2016) 7:109. doi: 10.3389/fimmu.2016.00109
56. Antonioli L, Fornai M, Blandizzi C, Pacher P, Haskó G. Adenosine signaling and the immune system: When a lot could be too much. Immunol Lett (2019) 205:9–15. doi: 10.1016/j.imlet.2018.04.006
57. Climent N, Martinez-Navio JM, Gil C, Garcia F, Rovira C, Hurtado C, et al. Adenosine deaminase enhances T-cell response elicited by dendritic cells loaded with inactivated hiv. Immunol Cell Biol (2009) 87(8):634–9. doi: 10.1038/icb.2009.53
58. Mandapathil M, Szczepanski M, Harasymczuk M, Ren J, Cheng D, Jackson EK, et al. Cd26 expression and adenosine deaminase activity in regulatory T cells (Treg) and Cd4(+) T effector cells in patients with head and neck squamous cell carcinoma. Oncoimmunology (2012) 1(5):659–69. doi: 10.4161/onci.20387
59. Hoskin DW, Mader JS, Furlong SJ, Conrad DM, Blay J. Inhibition of T cell and natural killer cell function by adenosine and its contribution to immune evasion by tumor cells (Review). Int J Oncol (2008) 32(3):527–35.
60. Komi Y, Ohno O, Suzuki Y, Shimamura M, Shimokado K, Umezawa K, et al. Inhibition of tumor angiogenesis by targeting endothelial surface atp synthase with sangivamycin. Jpn J Clin Oncol (2007) 37(11):867–73. doi: 10.1093/jjco/hym115
61. Yadav SS, Ruwali M, Pant MC, Shukla P, Singh RL, Parmar D. Interaction of drug metabolizing cytochrome P450 2d6 poor metabolizers with cytochrome P450 2c9 and 2c19 genotypes modify the susceptibility to head and neck cancer and treatment response. Mutat Res (2010) 684(1-2):49–55. doi: 10.1016/j.mrfmmm.2009.11.010
62. Chen W, Wang R, Chen B, Zhong X, Kong H, Bai Y, et al. The ryanodine receptor store-sensing gate controls Ca2+ waves and Ca2+-triggered arrhythmias. Nat Med (2014) 20(2):184–92. doi: 10.1038/nm.3440
63. Lanner JT, Georgiou DK, Joshi AD, Hamilton SL. Ryanodine receptors: Structure, expression, molecular details, and function in calcium release. Cold Spring Harb Perspect Biol (2010) 2(11):a003996. doi: 10.1101/cshperspect.a003996
64. Schmitt K, Molfenter B, Laureano NK, Tawk B, Bieg M, Hostench XP, et al. Somatic mutations and promotor methylation of the ryanodine receptor 2 is a common event in the pathogenesis of head and neck cancer. Int J Cancer (2019) 145(12):3299–310. doi: 10.1002/ijc.32481
65. Wu T, Jiao Z, Li Y, Su X, Yao F, Peng J, et al. Hprt1 promotes chemoresistance in oral squamous cell carcinoma via activating Mmp1/Pi3k/Akt signaling pathway. Cancers (Basel) (2022) 14(4):855. doi: 10.3390/cancers14040855
66. Jie HB, Gildener-Leapman N, Li J, Srivastava RM, Gibson SP, Whiteside TL, et al. Intratumoral regulatory T cells upregulate immunosuppressive molecules in head and neck cancer patients. Br J Cancer (2013) 109(10):2629–35. doi: 10.1038/bjc.2013.645
67. Vignali DA, Collison LW, Workman CJ. How regulatory T cells work. Nat Rev Immunol (2008) 8(7):523–32. doi: 10.1038/nri2343
68. Chen SMY, Krinsky AL, Woolaver RA, Wang X, Chen Z, Wang JH. Tumor immune microenvironment in head and neck cancers. Mol Carcinog (2020) 59(7):766–74. doi: 10.1002/mc.23162
69. Jayaraman P, Parikh F, Newton JM, Hanoteau A, Rivas C, Krupar R, et al. Tgf-Β1 programmed myeloid-derived suppressor cells (Mdsc) acquire immune-stimulating and tumor killing activity capable of rejecting established tumors in combination with radiotherapy. Oncoimmunology (2018) 7(10):e1490853. doi: 10.1080/2162402x.2018.1490853
70. Costa NL, Valadares MC, Souza PP, Mendonça EF, Oliveira JC, Silva TA, et al. Tumor-associated macrophages and the profile of inflammatory cytokines in oral squamous cell carcinoma. Oral Oncol (2013) 49(3):216–23. doi: 10.1016/j.oraloncology.2012.09.012
71. Elliott LA, Doherty GA, Sheahan K, Ryan EJ. Human tumor-infiltrating myeloid cells: Phenotypic and functional diversity. Front Immunol (2017) 8:86. doi: 10.3389/fimmu.2017.00086
72. Zahran AM, Zahran ZAM, Rayan A. Microparticles and Pd1 interplay added a prognostic impact in treatment outcomes of patients with multiple myeloma. Sci Rep (2021) 11(1):17681. doi: 10.1038/s41598-021-96975-4
73. Siu LL, Even C, Mesía R, Remenar E, Daste A, Delord JP, et al. Safety and efficacy of durvalumab with or without tremelimumab in patients with pd-L1-Low/Negative recurrent or metastatic hnscc: The phase 2 condor randomized clinical trial. JAMA Oncol (2019) 5(2):195–203. doi: 10.1001/jamaoncol.2018.4628
74. Hwang M, Seiwert TY. Are taxanes the future for head and neck cancer? pragmatism in the immunotherapy era. Lancet Oncol (2021) 22(4):413–5. doi: 10.1016/s1470-2045(21)00121-2
75. Ferris RL, Haddad R, Even C, Tahara M, Dvorkin M, Ciuleanu TE, et al. Durvalumab with or without tremelimumab in patients with recurrent or metastatic head and neck squamous cell carcinoma: Eagle, a randomized, open-label phase iii study. Ann Oncol (2020) 31(7):942–50. doi: 10.1016/j.annonc.2020.04.001
76. Kordbacheh F, Farah CS. Current and emerging molecular therapies for head and neck squamous cell carcinoma. Cancers (Basel) (2021) 13(21):5471. doi: 10.3390/cancers13215471
77. Schwab KS, Kristiansen G, Schild HH, Held SEA, Heine A, Brossart P. Successful treatment of refractory squamous cell cancer of the head and neck with nivolumab and ipilimumab. Case Rep Oncol (2018) 11(1):17–20. doi: 10.1159/000485562
78. Badr M, Jöhrens K, Allgäuer M, Boxberg M, Weichert W, Tinhofer I, et al. Morphomolecular analysis of the immune tumor microenvironment in human head and neck cancer. Cancer Immunol Immunother (2019) 68(9):1443–54. doi: 10.1007/s00262-019-02378-w
79. Qi X, Jia B, Zhao X, Yu D. Advances in T-cell checkpoint immunotherapy for head and neck squamous cell carcinoma. Onco Targets Ther (2017) 10:5745–54. doi: 10.2147/ott.S148182
80. Xing X, Jin N, Wang J. Polymerase epsilon-associated ultramutagenesis in cancer. Cancers (Basel) (2022) 14(6):1467. doi: 10.3390/cancers14061467
81. Tan YS, Sansanaphongpricha K, Xie Y, Donnelly CR, Luo X, Heath BR, et al. Mitigating Sox2-potentiated immune escape of head and neck squamous cell carcinoma with a sting-inducing nanosatellite vaccine. Clin Cancer Res (2018) 24(17):4242–55. doi: 10.1158/1078-0432.Ccr-17-2807
82. Cancer Genome Atlas Network. Comprehensive genomic characterization of head and neck squamous cell carcinomas. Nature (2015) 517(7536):576–82. doi: 10.1038/nature14129
83. Feng S, Rabii R, Liang G, Song C, Chen W, Guo M, et al. The expression levels of xlf and mutant P53 are inversely correlated in head and neck cancer cells. J Cancer (2016) 7(11):1374–82. doi: 10.7150/jca.14669
84. Lin SC, Lin LH, Yu SY, Kao SY, Chang KW, Cheng HW, et al. Fat1 somatic mutations in head and neck carcinoma are associated with tumor progression and survival. Carcinogenesis (2018) 39(11):1320–30. doi: 10.1093/carcin/bgy107
85. Zwirner K, Hilke FJ, Demidov G, Socarras Fernandez J, Ossowski S, Gani C, et al. Radiogenomics in head and neck cancer: Correlation of radiomic heterogeneity and somatic mutations in Tp53, Fat1 and Kmt2d. Strahlenther Onkol (2019) 195(9):771–9. doi: 10.1007/s00066-019-01478-x
Keywords: HNSCC, circadian rhythm, biomarkers, tumor microenvironment, immunotherapy, prognostic signature
Citation: Chi H, Yang J, Peng G, Zhang J, Song G, Xie X, Xia Z, Liu J and Tian G (2023) Circadian rhythm-related genes index: A predictor for HNSCC prognosis, immunotherapy efficacy, and chemosensitivity. Front. Immunol. 14:1091218. doi: 10.3389/fimmu.2023.1091218
Received: 06 November 2022; Accepted: 27 February 2023;
Published: 10 March 2023.
Edited by:
Yutian Zou, Sun Yat-sen University Cancer Center (SYSUCC), ChinaReviewed by:
Anastasia Filia, Biomedical Research Foundation of the Academy of Athens (BRFAA), GreeceSisi He, Zunyi Medical University, China
Copyright © 2023 Chi, Yang, Peng, Zhang, Song, Xie, Xia, Liu and Tian. This is an open-access article distributed under the terms of the Creative Commons Attribution License (CC BY). The use, distribution or reproduction in other forums is permitted, provided the original author(s) and the copyright owner(s) are credited and that the original publication in this journal is cited, in accordance with accepted academic practice. No use, distribution or reproduction is permitted which does not comply with these terms.
*Correspondence: Zhijia Xia, Zhijia.Xia@med.uni-muenchen.de; Jinhui Liu, jinhuiliu@njmu.edu.cn; Gang Tian, tiangang@swmu.edu.cn
†These authors have contributed equally to this work