Significant Release of Dissolved Inorganic Nutrients From the Shallow Submarine Volcano Tagoro (Canary Islands) Based on Seven-Year Monitoring
 Alba González-Vega1,2
  Eugenio Fraile-Nuez2*
  J. Magdalena Santana-Casiano3
  Melchor González-Dávila3
  José Escánez-Pérez2 María Gómez-Ballesteros4 Olvido Tello4
  Jesús M. Arrieta2
- 1Universidad de Las Palmas de Gran Canaria, Las Palmas de Gran Canaria, Spain
- 2Centro Oceanográfico de Canarias, Instituto Español de Oceanografía, Santa Cruz de Tenerife, Spain
- 3Instituto de Oceanografía y Cambio Global, Universidad de Las Palmas de Gran Canaria, Las Palmas de Gran Canaria, Spain
- 4Centro Oceanográfico de Madrid, Instituto Español de Oceanografía, Madrid, Spain
Tagoro, the shallow submarine volcano that erupted south of El Hierro (Canary Islands, Spain) in October 2011, has been intensely monitored for over 7 years, from the early eruptive stage to the current degassing stage characterized by moderate hydrothermal activity. Here, we present a detailed study of the emissions of inorganic macronutrients (NO2– + NO3–, PO4, and Si(OH)4) comprising a dataset of over 3300 samples collected through three different sampling methodologies. Our results show a significant nutrient enrichment throughout the whole studied period, up to 8.8-fold (nitrate), 4.0-fold (phosphate), and 16.3-fold (silicate) in the water column, and larger enrichments of phosphate (10.5-fold) and silicate (325.4-fold), but not of nitrate, in the samples collected directly from the vents. We also provide some preliminary results showing ammonium (NH4+) concentrations up to 1.97 μM in the vent fluids as compared to 0.02 μM in the surrounding waters. Nutrient fluxes from the volcano during the degassing stage were estimated as 3.19 ± 1.17 mol m–2 year–1 (NO2– + NO3–), 0.02 ± 0.01 mol m–2 year–1 (PO4), and 0.60 ± 1.35 mol m–2 year–1 (Si(OH)4), comparable to other important nutrient sources in the region such as fluxes from the NW-African upwelling. Nutrient ratios were affected, with a minimum (NO3– + NO2–):PO4 ratio of 2.36:1; moreover, a linear correlation between silicate and temperature enabled the use of this nutrient as a mixing tracer. This study sheds light on how shallow hydrothermal systems impact the nutrient-poor upper waters of the ocean.
Introduction
About 85% of Earth’s volcanism occurs beneath the ocean with regard to the volume of emissions (Mitchell, 2012). Yet, submarine volcanoes are poorly characterized in comparison to their subaerial counterparts (Staudigel et al., 2006; Resing et al., 2009; Buck et al., 2018). Submarine volcanoes constitute a significant source of mantle-derived gases, solutes and heat to the ocean. Their emissions react with seawater leading to important physical-chemical anomalies with a strong potential to impact the marine ecosystems (Fraile-Nuez et al., 2012).
Volcanic inputs to the ocean have been studied mainly through hydrothermal activity. Submarine hydrothermal vents typically discharge fluids which are warm-to-hot, acidic, reducing and metal-rich, and, on a global scale, are thought to exert significant controls on the major-ion composition of seawater (Sedwick and Stüben, 1996). Studies on hydrothermal settings have been carried out mainly in the Pacific Ocean (Edmond et al., 1979; Karl et al., 1989; Tarasov et al., 1990; Sorokin et al., 1998; Staudigel et al., 2006; Buck et al., 2018; Guieu et al., 2018), with fewer examples in the Atlantic (Thorarinsson, 1967; Sarradin et al., 1999; Desbruyères et al., 2001) and the Mediterranean (Sedwick and Stüben, 1996; Kilias et al., 2013).
Submarine volcanic activity releases nutrients into seawater, including Fe, Si, P, and N (Santana-Casiano et al., 2013). The enrichment in silicate is a general characteristic of hydrothermal vents and has been used as a geochemical thermometer due to the highly significant positive correlation between Si concentration and vent water temperature (Karl et al., 1989). Nonetheless, information about volcanoes as a source of nutrients to the ocean is very limited, and most of the existing studies have been carried out in deep hydrothermal vents (Karl et al., 1989; Sarradin et al., 1999), in comparison to fewer studies on shallow volcanic settings surrounded by nutrient-poor waters (Sedwick and Stüben, 1996; Kilias et al., 2013).
The Canary Islands, located in the north-eastern margin of the Atlantic Ocean, conform an archipelago originated from hotspot-associated volcanism (Carracedo et al., 1998). El Hierro is the youngest and westernmost of these islands (Figure 1), and it is surrounded by oligotrophic waters where nutrient concentrations south of the island are usually undetectable in the upper 80–100 m of the water column (Santana-Casiano et al., 2013).
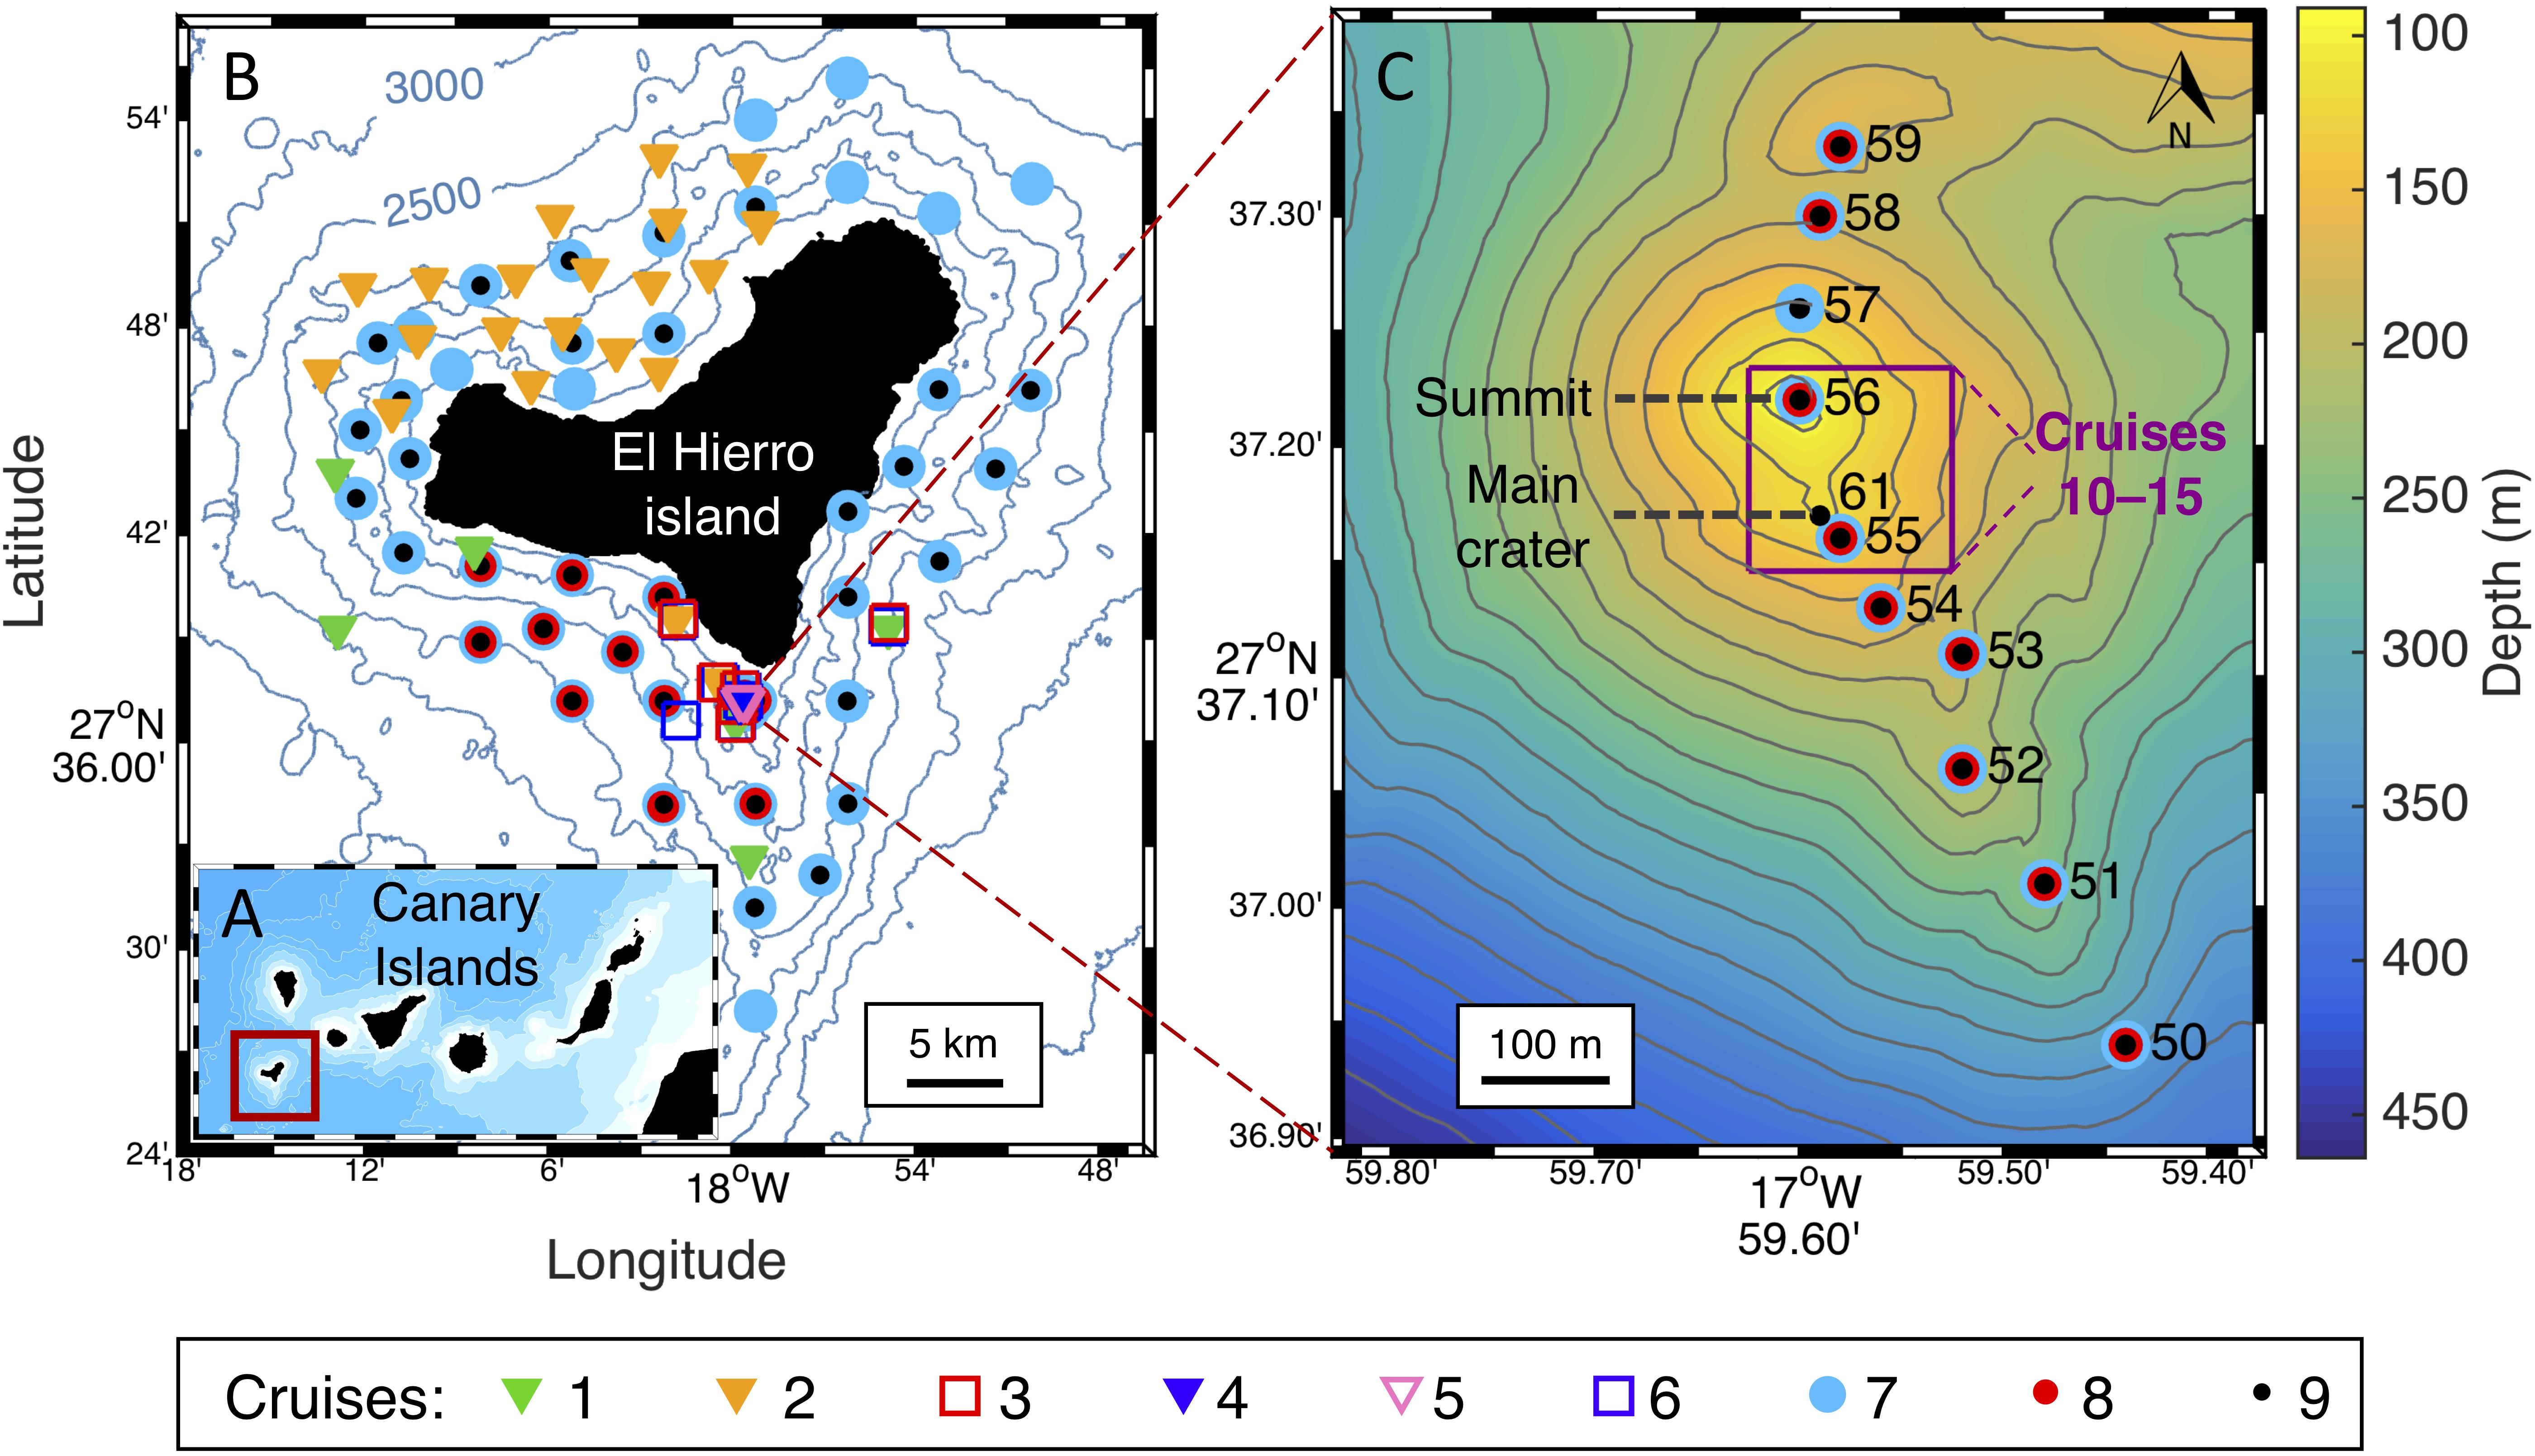
Figure 1. Study location. (A) Map of the Canary Islands. (B) Map of El Hierro island with stations of vertical profiles carried out during cruises 1–9. (C) Bathymetry of the volcanic edifice and high-resolution transect of vertical profiles carried out during cruises 7–9 across the main cones. The squared region shows the zone where the tow-yo samples (cruises 10–14) and vent samples (cruise 15) were collected. All maps were generated using Matlab 8.5 R2015a.
On October 10, 2011, after more than 15000 earthquakes were recorded in a 3-month period, a volcanic tremor was registered south of El Hierro, suggesting the beginning of a submarine eruption (Fraile-Nuez et al., 2012). The volcano, later named Tagoro, was located 1.8 km off the southern coast of the island and presented a south-westward lava flow. The main cone grew from an initial depth of 355 m to a maximum height of 88 m below the sea surface reported in February 2012 (Fraile-Nuez et al., 2012; Santana-Casiano et al., 2013; Sotomayor-García et al., 2019).
Tagoro emitted molten material during the first 6 months, affecting a wide area southwest and northwest of the island, with peaks of intensity during late October and early November 2011. This period conformed the eruptive stage, during which the physical-chemical properties of the water column were drastically influenced by the emissions. Average temperature and salinity anomalies of +3°C and -0.3 were observed respectively, with a maximum temperature anomaly of +18.8°C (Fraile-Nuez et al., 2012). The intense bubbling and degassing caused a marked increase of CO2 partial pressure (pCO2) reaching values of 12000–150000 μatm at the surface, and lowering the pH by 2.9 units (Santana-Casiano et al., 2016). The volcano also released great amounts of iron [Fe(II)] (>50 μmol kg–1) and reduced species of sulfur (>476 μmol kg–1), which caused a fall in the redox potential, eventually reaching negative values (Santana-Casiano et al., 2013). The presence of these reduced compounds caused a drastic oxygen consumption, leading to suboxic and even anoxic conditions in subsurface waters (Fraile-Nuez et al., 2012).
After March 2012, once the eruptive stage was over, Tagoro entered an active hydrothermal phase involving the release of heat, gases, and metals. The hydrothermal discharge occurs from multiple vents dispersed around the main cone by percolation of vent fluids through the highly permeable volcanic edifice (Santana-Casiano et al., 2016). In this new stage, the wide area that had been affected north and south of the volcano quickly returned to physical and chemical conditions comparable to those observed in the surrounding waters, and the perturbations are limited to the area situated roughly 0.5 km around the main cone and quite close to the seabed (Santana-Casiano et al., 2013). However, important physical-chemical anomalies are still present in the interior of the main crater as: thermal increase of +2.55°C, decreases in salinity of −1.02, density decrease of −1.43 kg m–3, and pH decrease of −1.25 units (Fraile-Nuez et al., 2018). Furthermore, the hydrothermal emissions exhibit a cyclic behavior, with peaks of activity every 130–170 min (Fraile-Nuez et al., 2018).
Two new habitats have been described around the summit and main craters: hydrothermal vents with microbial mats, and sulfurous-like fields mainly colonized by small hydrozoan colonies; whereas downslope the volcanic complex, other new habitats have been observed to hold a higher biodiversity, with annelids, arthropods, cnidarians, and mollusks as the first colonizers (Sotomayor-García et al., 2019). However, no clear impact has been detected on the local phytoplankton community (Gómez-Letona et al., 2018).
The exhaustive monitoring of Tagoro volcano performed over the last 7 years provides a remarkable dataset of the inorganic nutrient emissions from a shallow submarine volcano. Here we present a detailed study of the significant release of NO2– + NO3–, PO4, and Si(OH)4, reporting the magnitude, temporal variation, spatial distribution, fluxes and ratios of the nutrient emissions for the eruptive and degassing stages of the Tagoro submarine volcano. We discuss the implications of the different sampling methodologies used, and compare our results with different volcanic and hydrothermal settings, as well as other nutrient sources to the Canary region.
Data and Methods
The activity of Tagoro submarine volcano has been intensely monitored between 2011 and 2018 through 15 oceanographic cruises led by the Spanish Institute of Oceanography (IEO) in the affected area and around the island of El Hierro (Figure 1). A total of about 3300 discrete water samples were analyzed for this study, obtained from 221 hydrographic stations, 43 tow-yo transects, and eight remotely operated vehicle (ROV) vent samples. The surveys were carried out on board of the research vessels Ramón Margalef (cruises 1, 2, 4, 5, and 7), Cornide de Saavedra (cruise 3), and Ángeles Alvariño (cruises 6 and 8–15) from the IEO.
Sample Collection
Conductivity, temperature and pressure data were collected using a SeaBird 911-plus CTD equipped with dual temperature and conductivity sensors, with accuracies of 0.001°C and 0.0003 S/m respectively, continuously recording data with a sampling interval of 24 Hz. CTD sensors were calibrated at the SeaBird laboratory before and after the cruises. Discrete water samples for nutrient analysis were obtained using a rosette of 24–12-liter Niskin bottles.
Several sampling strategies were applied throughout the 7 years of monitoring. During cruises 1–9, the sampling consisted of vertical hydrographic stations located both in the area influenced by the emissions and outside the affected area (reference stations). These were differentiated based on various physical-chemical parameters such as temperature, conductivity, oxidation-reduction potential, pH, silicate concentration and, in the case of the eruptive stage, satellite images where the water decoloration caused by the volcanic emissions could be observed (Figure 4D). For the degassing stage, the area affected by the emissions was drastically reduced to around 0.5 km around the main cone. A high-resolution transect was established across the main and secondary craters for the study of the degassing stage during cruises 7–9 (Figure 1C). The dynamic positioning (DP) system of the research vessels allowed to locate the stations at few meters of distance. The rest of the stations, located around the island, were used as reference for this stage.
For cruises 10–14, samples were collected in the area of the main craters through tow-yo transects (Figure 1C), which involve continuously lowering and raising the rosette between 1 and 40 m above the seabed and with the ship moving at 0.2–0.4 kn in DP, obtaining a sawtooth-shaped dataset with high spatial resolution and closer to the source of the emissions.
During cruise 15, the ROV Liropus 2000 (IEO) was used for sample collection directly from the hydrothermal vents using a piston-driven suction system. A total of eight samples (each analyzed in duplicate for nutrients) were collected from different active vents in the main craters.
Nutrient Analysis
Nitrate + nitrite, phosphate, and silicate were analyzed by colorimetric determination using a four-channel automatized air-segmented continuous flow system SEAL AA3 AutoAnalyzer. Nitrite (NO2–) reacts under acidic conditions with sulfanilamide to form a diazo compound that then couples with N-Naphthylethylenediamine dihydrochloride (NEDD) to form a reddish-purple azo dye. Nitrate (NO3–) is reduced to nitrite by a copper-cadmium reductor column and detected likewise, giving the sum of nitrite and nitrate (Tréguer et al., 1976). In the present study NO2– + NO3– are analyzed jointly, which we hereafter shorten as N + N; we often refer to N + N as nitrate, since the concentrations of NO2– were found to be negligible with respect to NO3–. Phosphate (PO4) is detected by the reaction of ortho-phosphate, molybdate ion, and antimony ion followed by reduction with ascorbic acid at a pH < 1, forming a reduced blue phospho-molybdenum complex (Aminot and Kérouel, 2007). The detection of silicate (Si(OH)4) is based on the reduction of silico-molybdate in acidic solution to molybdenum blue by ascorbic acid. Oxalic acid is introduced to the sample stream before the addition of ascorbic acid to minimize interference from phosphates (Garcia, 2005). The detection limits are 0.02 μM for N + N, 0.01 μM for PO4, and 0.040 μM for Si(OH)4. The concentrations were converted to μmol kg–1 with density values derived from CTD data.
Ammonium was analyzed fluorometrically after reaction with ortho-phthalaldehyde (OPA) and reduction with sodium sulfite (Kérouel and Aminot, 1997) with a detection limit of 1.5 nmol l–1. The implementation of this method was only possible after the period of study presented in this work, therefore we only present here data from frozen samples collected from the vents with ROV in cruise 15 (November 2018) and some samples from reference stations collected during a more recent cruise (November 2019) during which the ammonium samples were analyzed on board immediately after collection.
Calculations
In order to eliminate the variability of the ambient nutrient concentrations with depth from the samples affected by the volcano, nutrient anomalies were calculated. Two parameters are presented in this study: nutrient anomalies (Δ[X]), calculated as the measured concentration ([X]) minus the average reference concentration at the same depth (; and significant nutrient anomalies (sΔ[X]), calculated as the measured concentration minus the average and the standard deviation (std[X]ref) at the same depth, in order to eliminate anomalies that are found within the standard deviation of the average ambient concentrations (non-significant anomalies).
Low-temperature discharge produces localized lower density values near the source of emission, which are expected to reach density equilibrium within a few meters from the seafloor (Baker et al., 1993). In some cases, these density values near the vents could be lower than the surface values at the reference stations. For this reason, the nutrient anomalies were calculated in isobaric component instead of isopycnal component in order to avoid the localized density perturbations close to the vents and the consequent error in the estimation of the nutrient anomalies.
Nutrient fluxes were calculated from a high-resolution vertical section of nutrient anomalies above the main craters and perpendicular to the current flow, providing an optimized flux estimation (Santana-Casiano et al., 2016; Buck et al., 2018).
Hence, the fluxes were calculated by multiplying these anomaly sections by the plume area and by a mean current velocity of 0.06 m s–1 obtained from a 9-year time series in the Canary region (Fraile-Nuez et al., 2010). The fluxes were calculated in μmol s–1 and converted to mol m–2 year–1. The plume area was delimited as the area defined by the significant anomalies (sΔ[X]). For the conversion of time units, the periodicity of the volcanic emissions was taken into account. It is estimated that the volcanic activity present pulses of emission every 140 min (this makes 3754 cycles per year), with about 40 min of activity per cycle (Fraile-Nuez et al., 2018).
The nutrient ratios were obtained from the correlations calculated by multiple linear regression by the method of least squares with a 98% confidence level. Since many of the affected datasets did not present any data near the intercept with the axis, all the regressions have been forced to intercept in 0:0 (as does the reference dataset) in order for their slopes to be comparable.
Data of mixed layer depth (MLD) and euphotic zone depth (EZD) data were provided by the Copernicus Marine Environment Monitoring Service (CMEMS). We used two products delivered by the CMEMS Iberia-Biscay-Ireland Monitoring and Forecasting Centre. The MLD data was obtained from the Physics Analysis and Forecast product, based on the NEMO ocean model (Sotillo et al., 2015); while the EZD data was obtained from the Biogeochemical Analysis and Forecast product, based on NEMO and PISCES models (Aumont et al., 2015). Both datasets have a resolution of 0.028 × 0.028°; we located the closest point to the coordinates of Tagoro volcano in the spatial grid of the datasets and used the monthly averaged data in this location for the periods available, 2013–2019 (MLD) and 2017–2019 (EZD).
Bathymetry
Three different bathymetry datasets with different spatial resolutions have been used: a global Topo15.1 bathymetry dataset with a spatial resolution of 4 km by Smith and Sandwell (1997) for the map of the Canary Islands (Figure 1A); a ZEE- Canary Island bathymetry with a resolution of 90 m from the IHM-IEO for the map of El Hierro island (Figure 1B), and a high resolution multi-beam bathymetry dataset obtained during cruise 11 (Vulcano0316) to generate a detailed map of the submarine volcano Tagoro (Figure 1C). During this cruise, bathymetric data was acquired using a Kongsberg Simrad EM-710 echosounder, which operates at sonar frequencies in the 70–100 kHz range. The data were processed with CARIS HIPS and SIPS and yields a bathymetric grid resolution of 1 m with 100% coverage.
Results
Quantification of the Nutrient Emissions
The vertical profiles of nutrient concentrations are shown in Figures 2A–C (N + N, PO4, and Si(OH)4) for the stations affected by the volcano during the eruptive and degassing stages and with the different sampling methodologies applied (vertical profiles for water-column samples, tow-yos for near-bottom samples, and ROV for vent samples). A reference profile was established using nutrient data from 122 non-affected stations surrounding El Hierro island, regardless of seasonality. Positive significant anomalies in all nutrients are observed with respect to the reference, underlining a nutrient discharge during both the eruptive and the degassing stages. Concentration peaks are generally found around 130 m (the depth of the main crater), although they often reached the surface during the eruptive stage. The maximum concentrations found during the eruptive stage in the water column (all in μmol kg–1) were of 8.06 for N + N (reference: 1.75), 0.79 for PO4 (reference: 0.11), and 21.76 for Si(OH)4 (reference: 1.23); these were found in the 75–100 m depth range, but substantial emissions often reached the surface as well (0–50 m depth). For the degassing stage, significant emissions stayed within a more constrained depth range (75–130 m). Concentrations of phosphate and silicate increased with the proximity of the sample collection to the source: the least concentrated were the water-column samples, followed by the near-bottom samples, and finally the vent samples, with maxima of 1.60 (PO4) and 189.40 (Si(OH)4) μmol kg–1. Contrastingly, the maximum concentrations of N + N were found in the water-column samples (6.21 μmol kg–1), which are assumed to be the most mixed with ambient waters, and decreased in the near-bottom and vent samples.
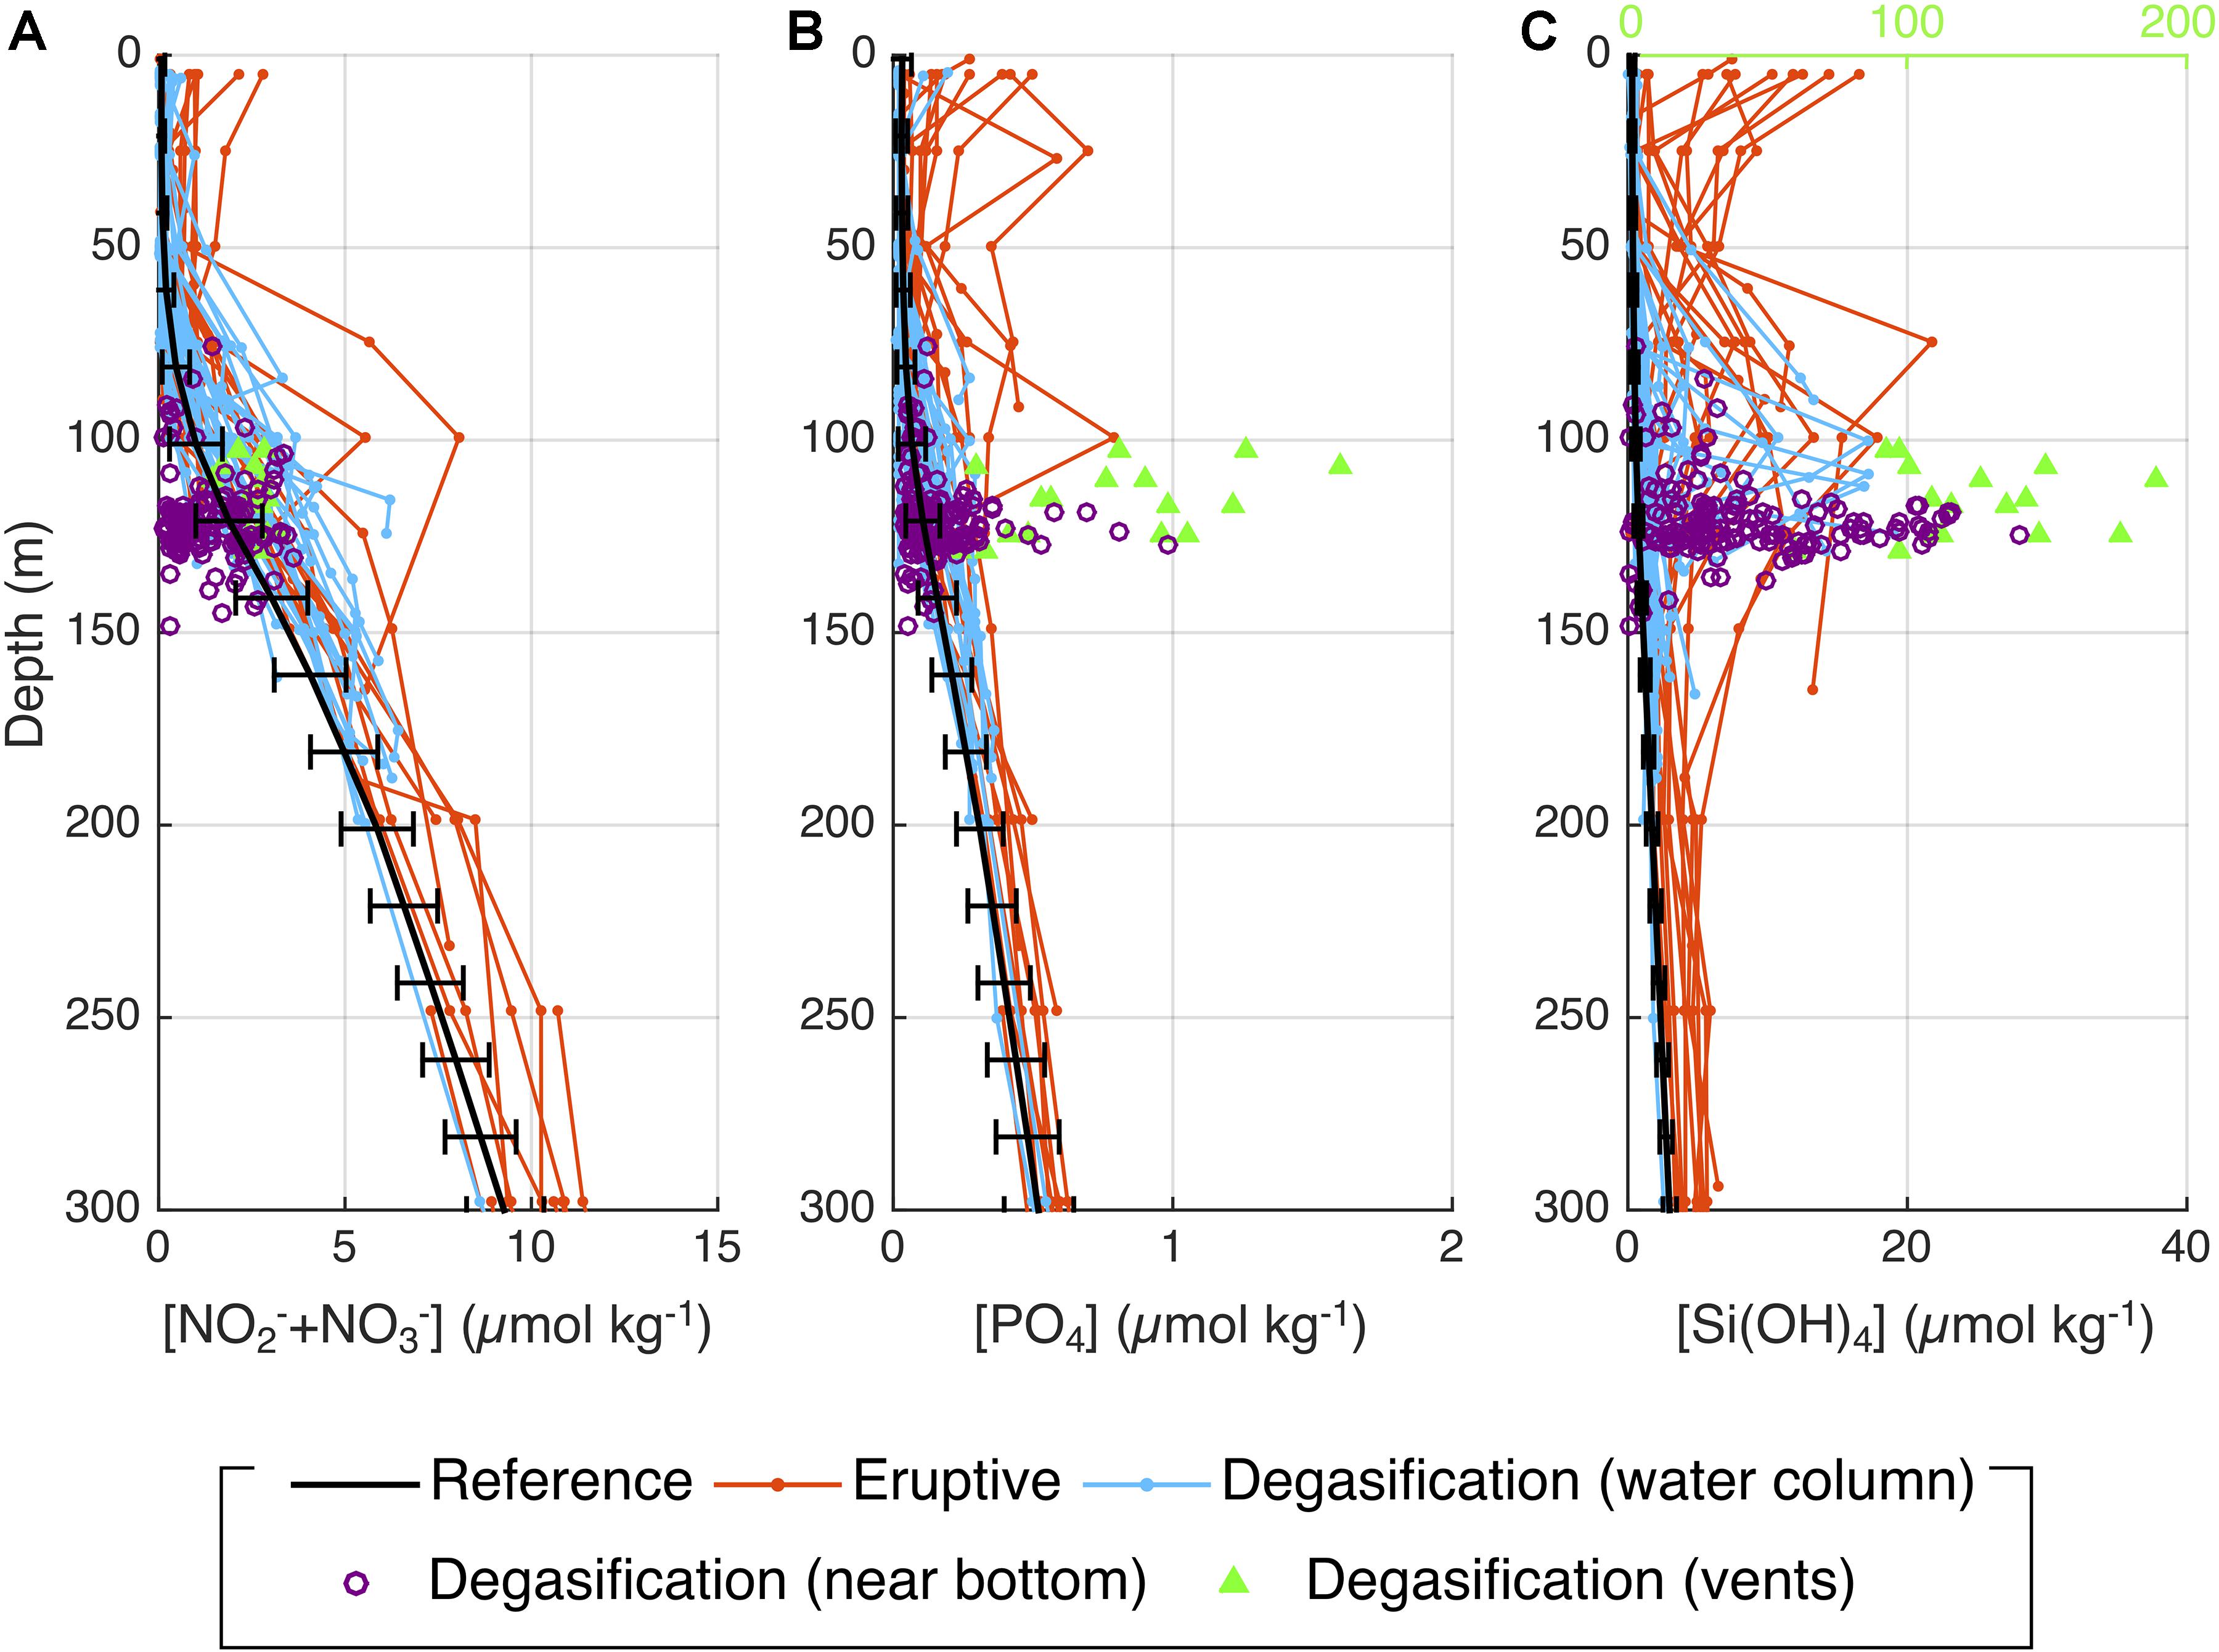
Figure 2. Vertical profiles of (A) nitrate, (B) phosphate, and (C) silicate, for all the stations affected by the volcano, discerning the different stages and sampling methodologies. Black lines show the average concentrations from all the reference stations, with standard deviation. Upper x-axis in panel (C) corresponds to silicate concentration in the vent samples (green).
This behavior is also observed when comparing the nutrient emissions during each individual cruise (Figure 3). Here, in order to avoid the variability with depth, significant anomalies were calculated (sΔ[X]; see Data and Methods) and are represented as boxplots showing the median and the distribution of the data in quartiles. This representation cannot be considered a temporal evolution of the emissions due to the different sampling methodologies applied; however, it provides a more detailed comparison and shows the high variability of the data even within each methodological dataset. For the eruptive stage, all the maxima were observed in November 2011 (cruise 2). For the degassing stage, highest concentrations of phosphate and silicate were found in the samples collected with ROV (vent samples; note the difference in the axis range for these samples), but this is not the case for nitrate, which seems to decrease during degasification regardless of the sampling methodology.
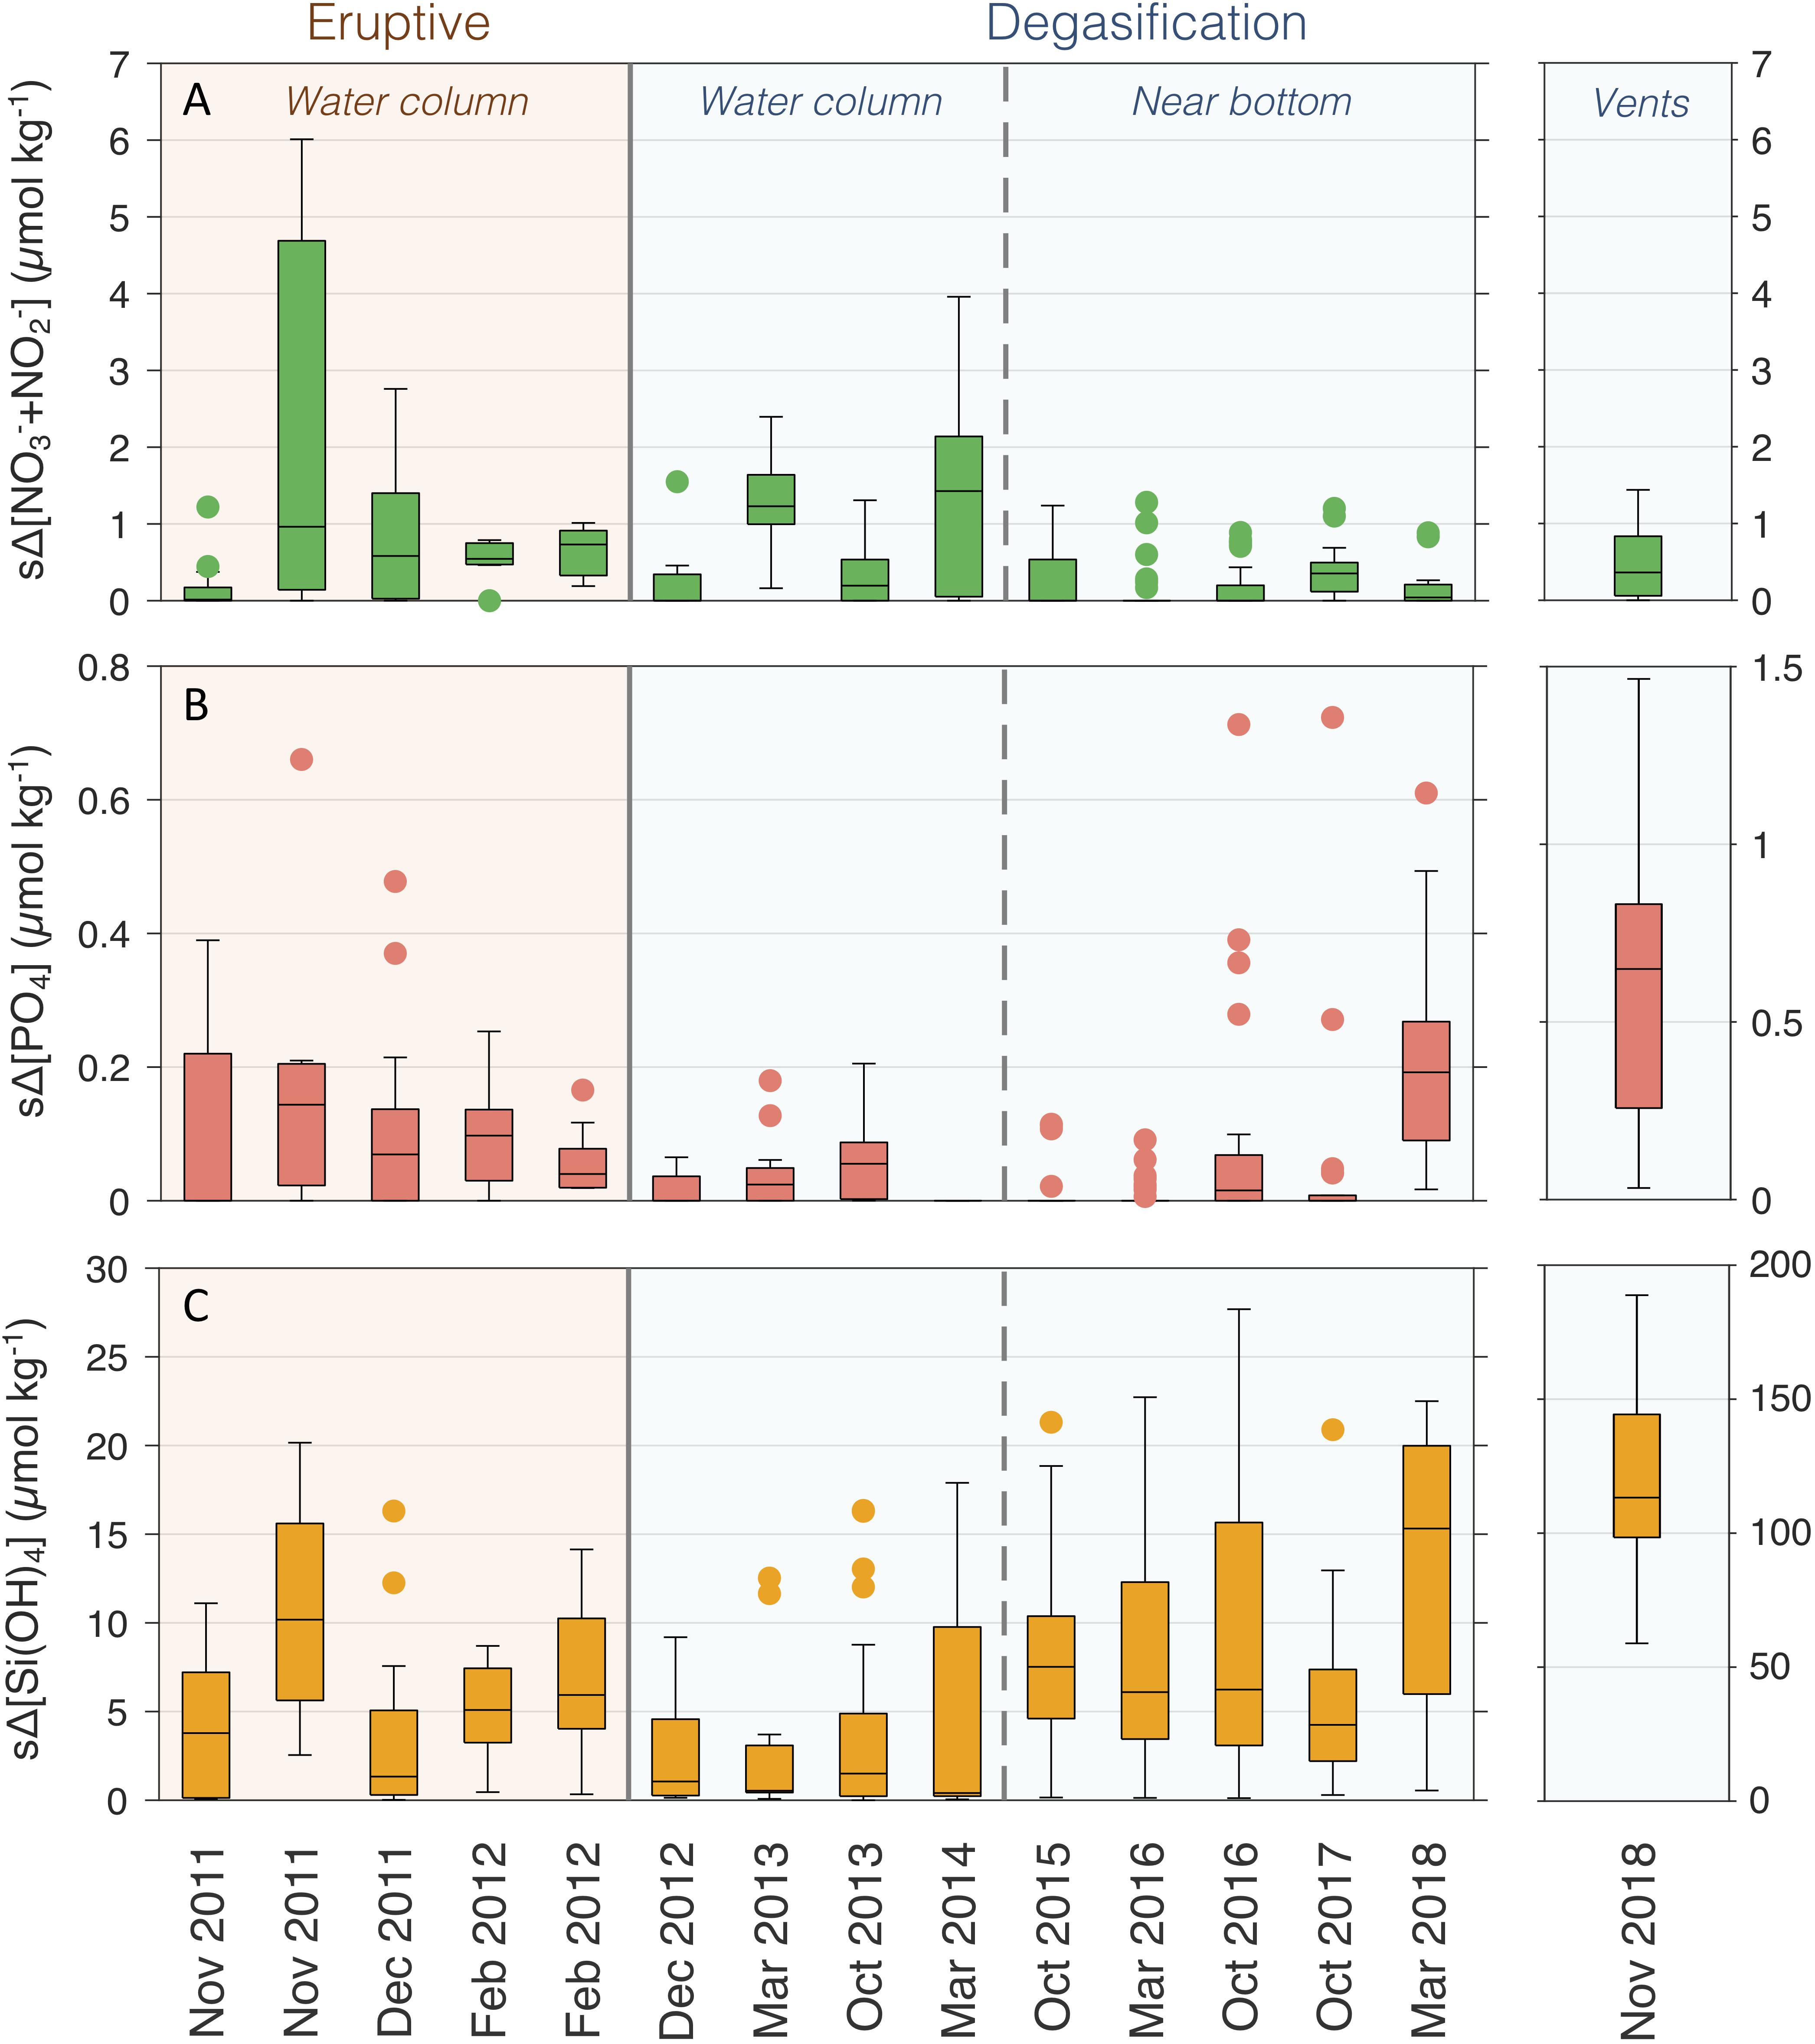
Figure 3. Significant anomalies of (A) nitrate, (B) phosphate, and (C) silicate for each cruise. Boxplots show the median, quartiles, and outliers of the datasets. Volcanic stage (eruptive/degasification) and sample type according to the sampling methodology (water column/near bottom/vents) are specified.
Nutrient concentrations in the volcanic emissions are quantified in detail in Table 1. Our results demonstrate an enrichment in all nutrients during both the eruptive and degassing stages. Silicate is the most enriched, up to 16.3-fold in the water column and reaching a three orders of magnitude enrichment in the vent samples (maximum of 325.4-fold). For phosphate, a 4.0-fold enrichment was found during the eruptive stage, but it seemed to decrease in the water column during the degassing stage; however, remarkable enrichments were found when the sampling methodology was adapted for more proximity to the source, presenting a maximum of 10.5-fold in the vent samples. Nitrate was largely enriched in the water column during the eruptive stage (maximum of 8.8-fold) but drastically decreased in degasification, and unlike phosphate and silicate, the near-bottom and vent samples did not reflect higher percentages of nitrate, reaching only a 2.5-fold. Additionally, we provide some preliminary ammonium (NH4+) data from the ROV-collected samples (cruise 15), which show concentrations of up to 1.97 μM while reference concentrations measured at the same depth were 0.02 μM.
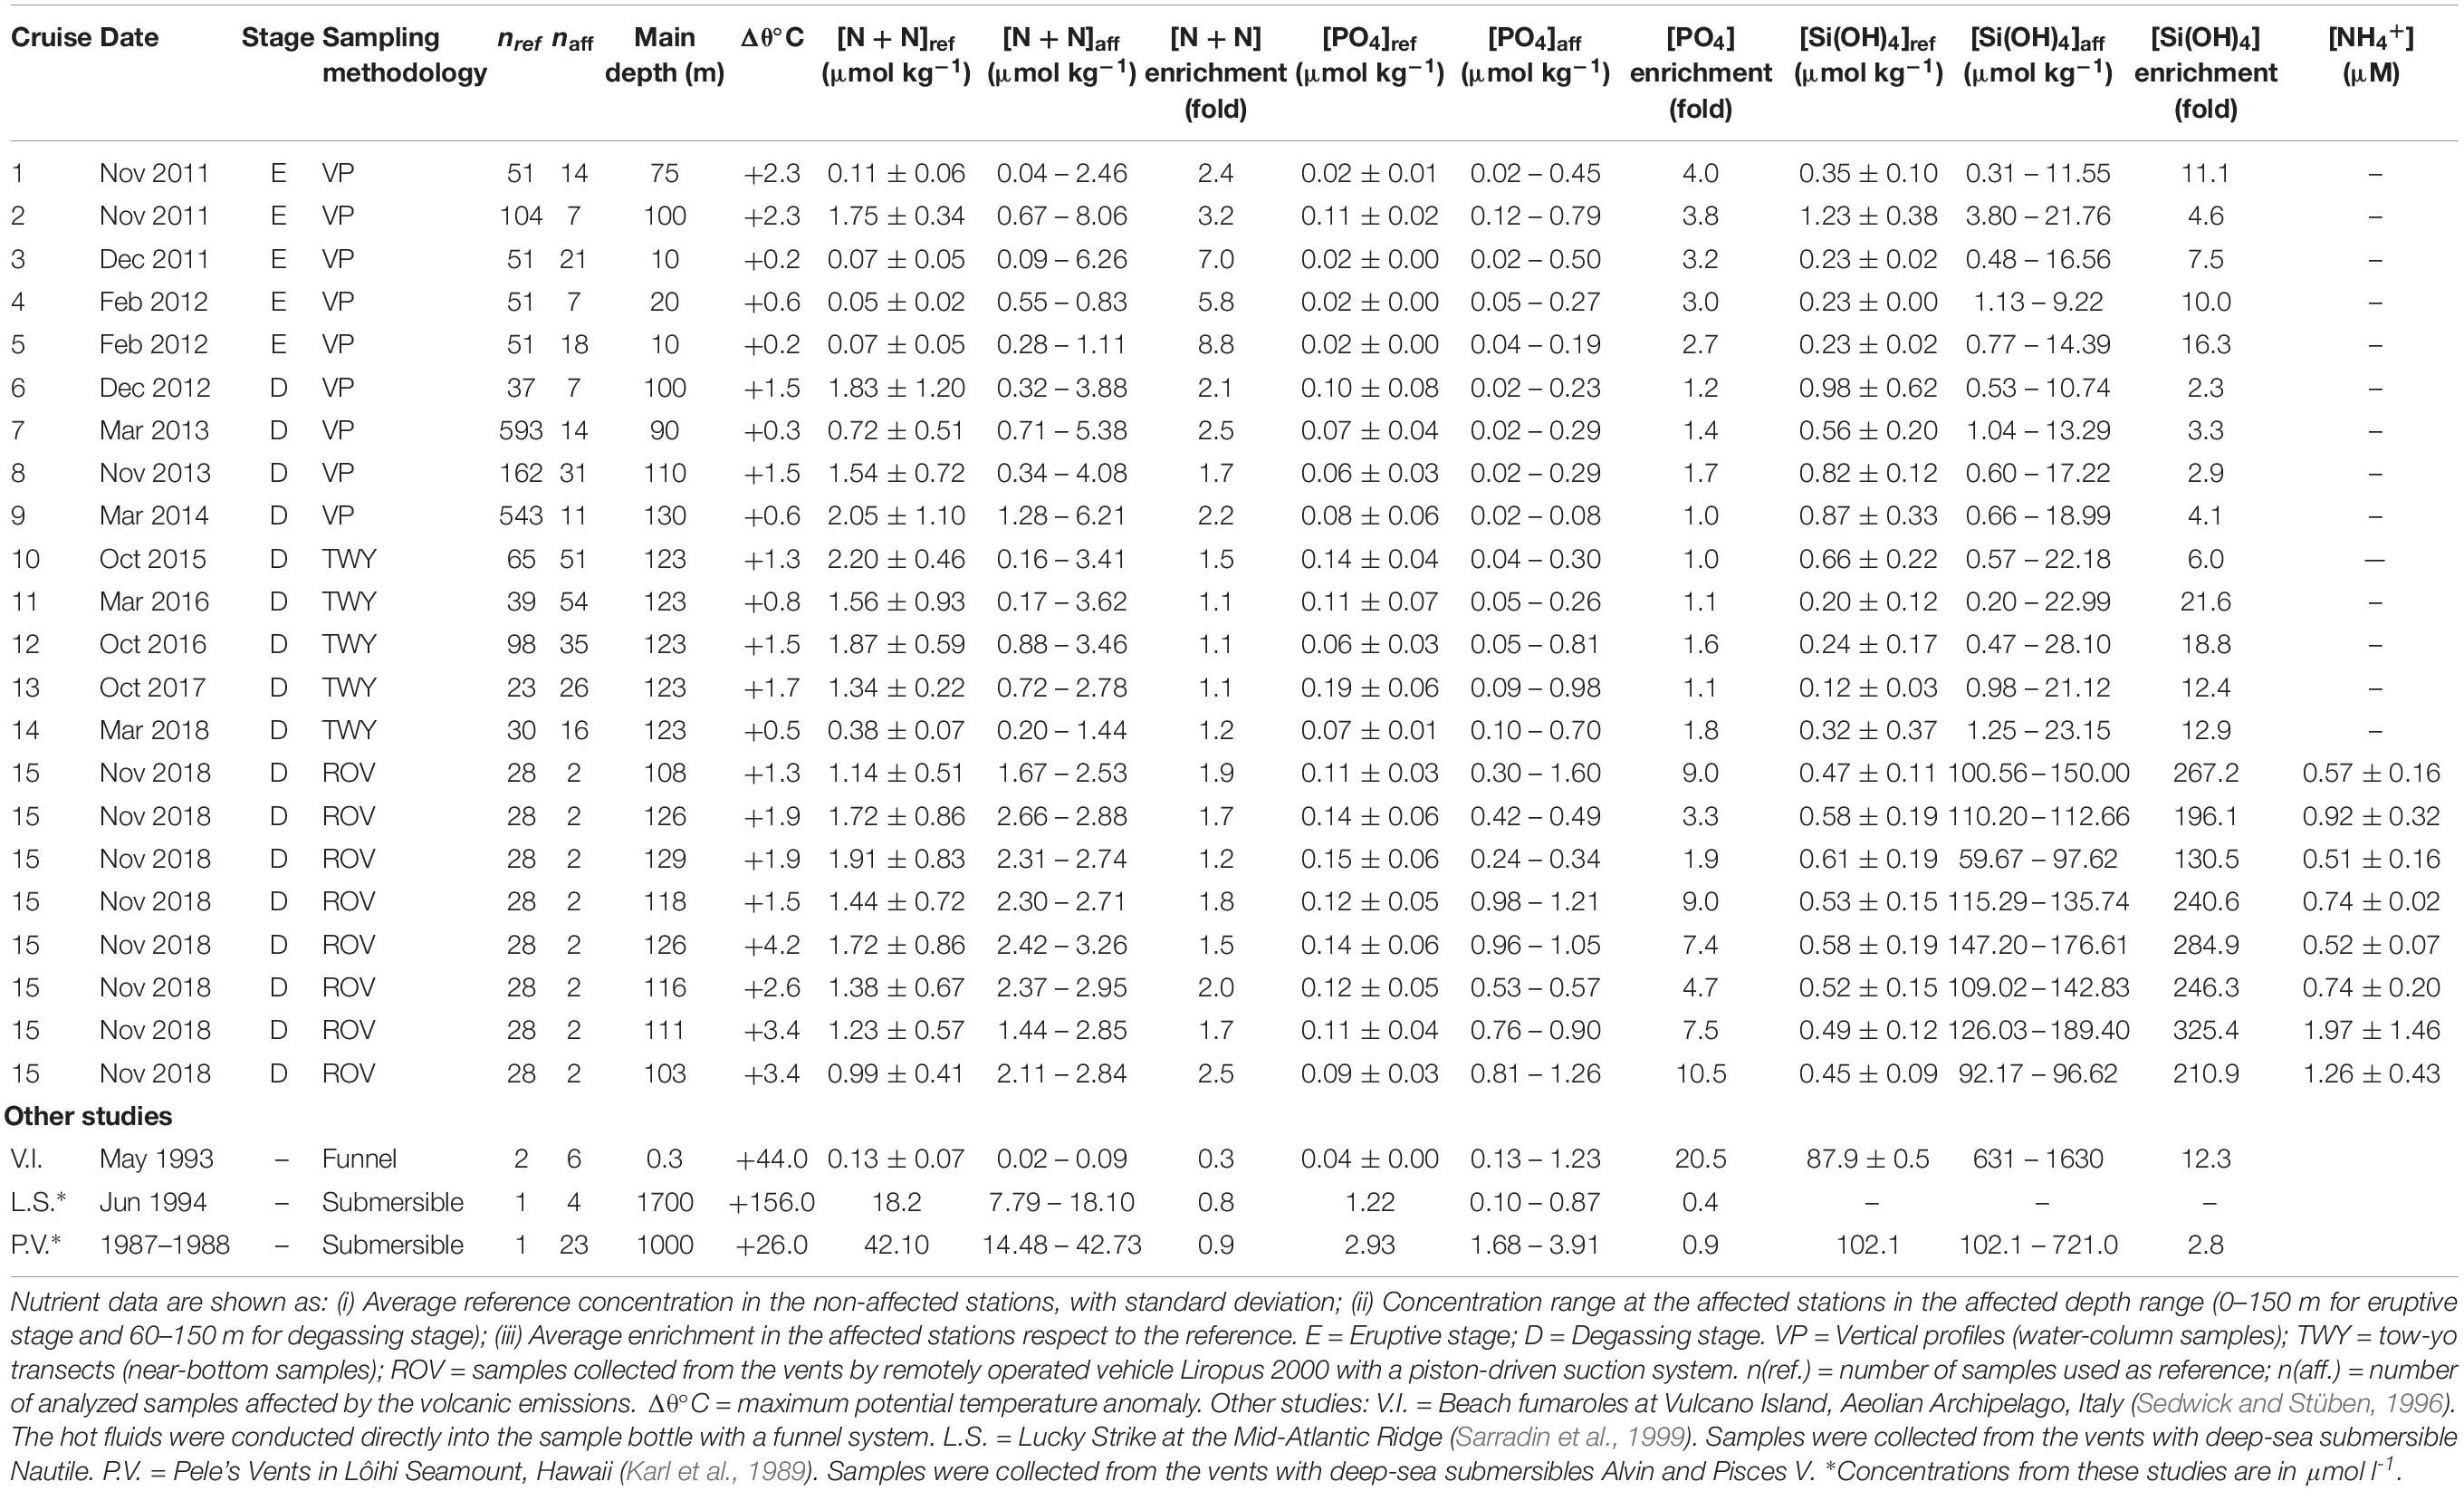
Table 1. Information from each cruise carried out in Tagoro volcano.
Extent and Transport of the Nutrient Emissions
The spatial distribution of the emission of inorganic nutrients by the Tagoro volcano during the eruptive stage was studied using the data collected during cruises 1 (November 4–9, 2011) and 2 (November 17–20, 2011). Figures 4A–C show horizontal contours of nutrient anomalies during these periods. The blue tones in the contours correspond to anomalies beneath the standard deviation of the mean reference concentrations (non-significant anomalies). Satellite images from NASA MODIS are also shown for the corresponding periods, taken on November 9 and November 20, 2011 (Figure 4D) (Eugenio et al., 2014). Note that the observed light-green discoloration of the waters surrounding El Hierro island in these images was due to the chemicals injected by the volcano and was not related to chlorophyll concentrations (Eugenio et al., 2014) and therefore this coloring was used as a natural tracer for the extent of the volcanic plume.
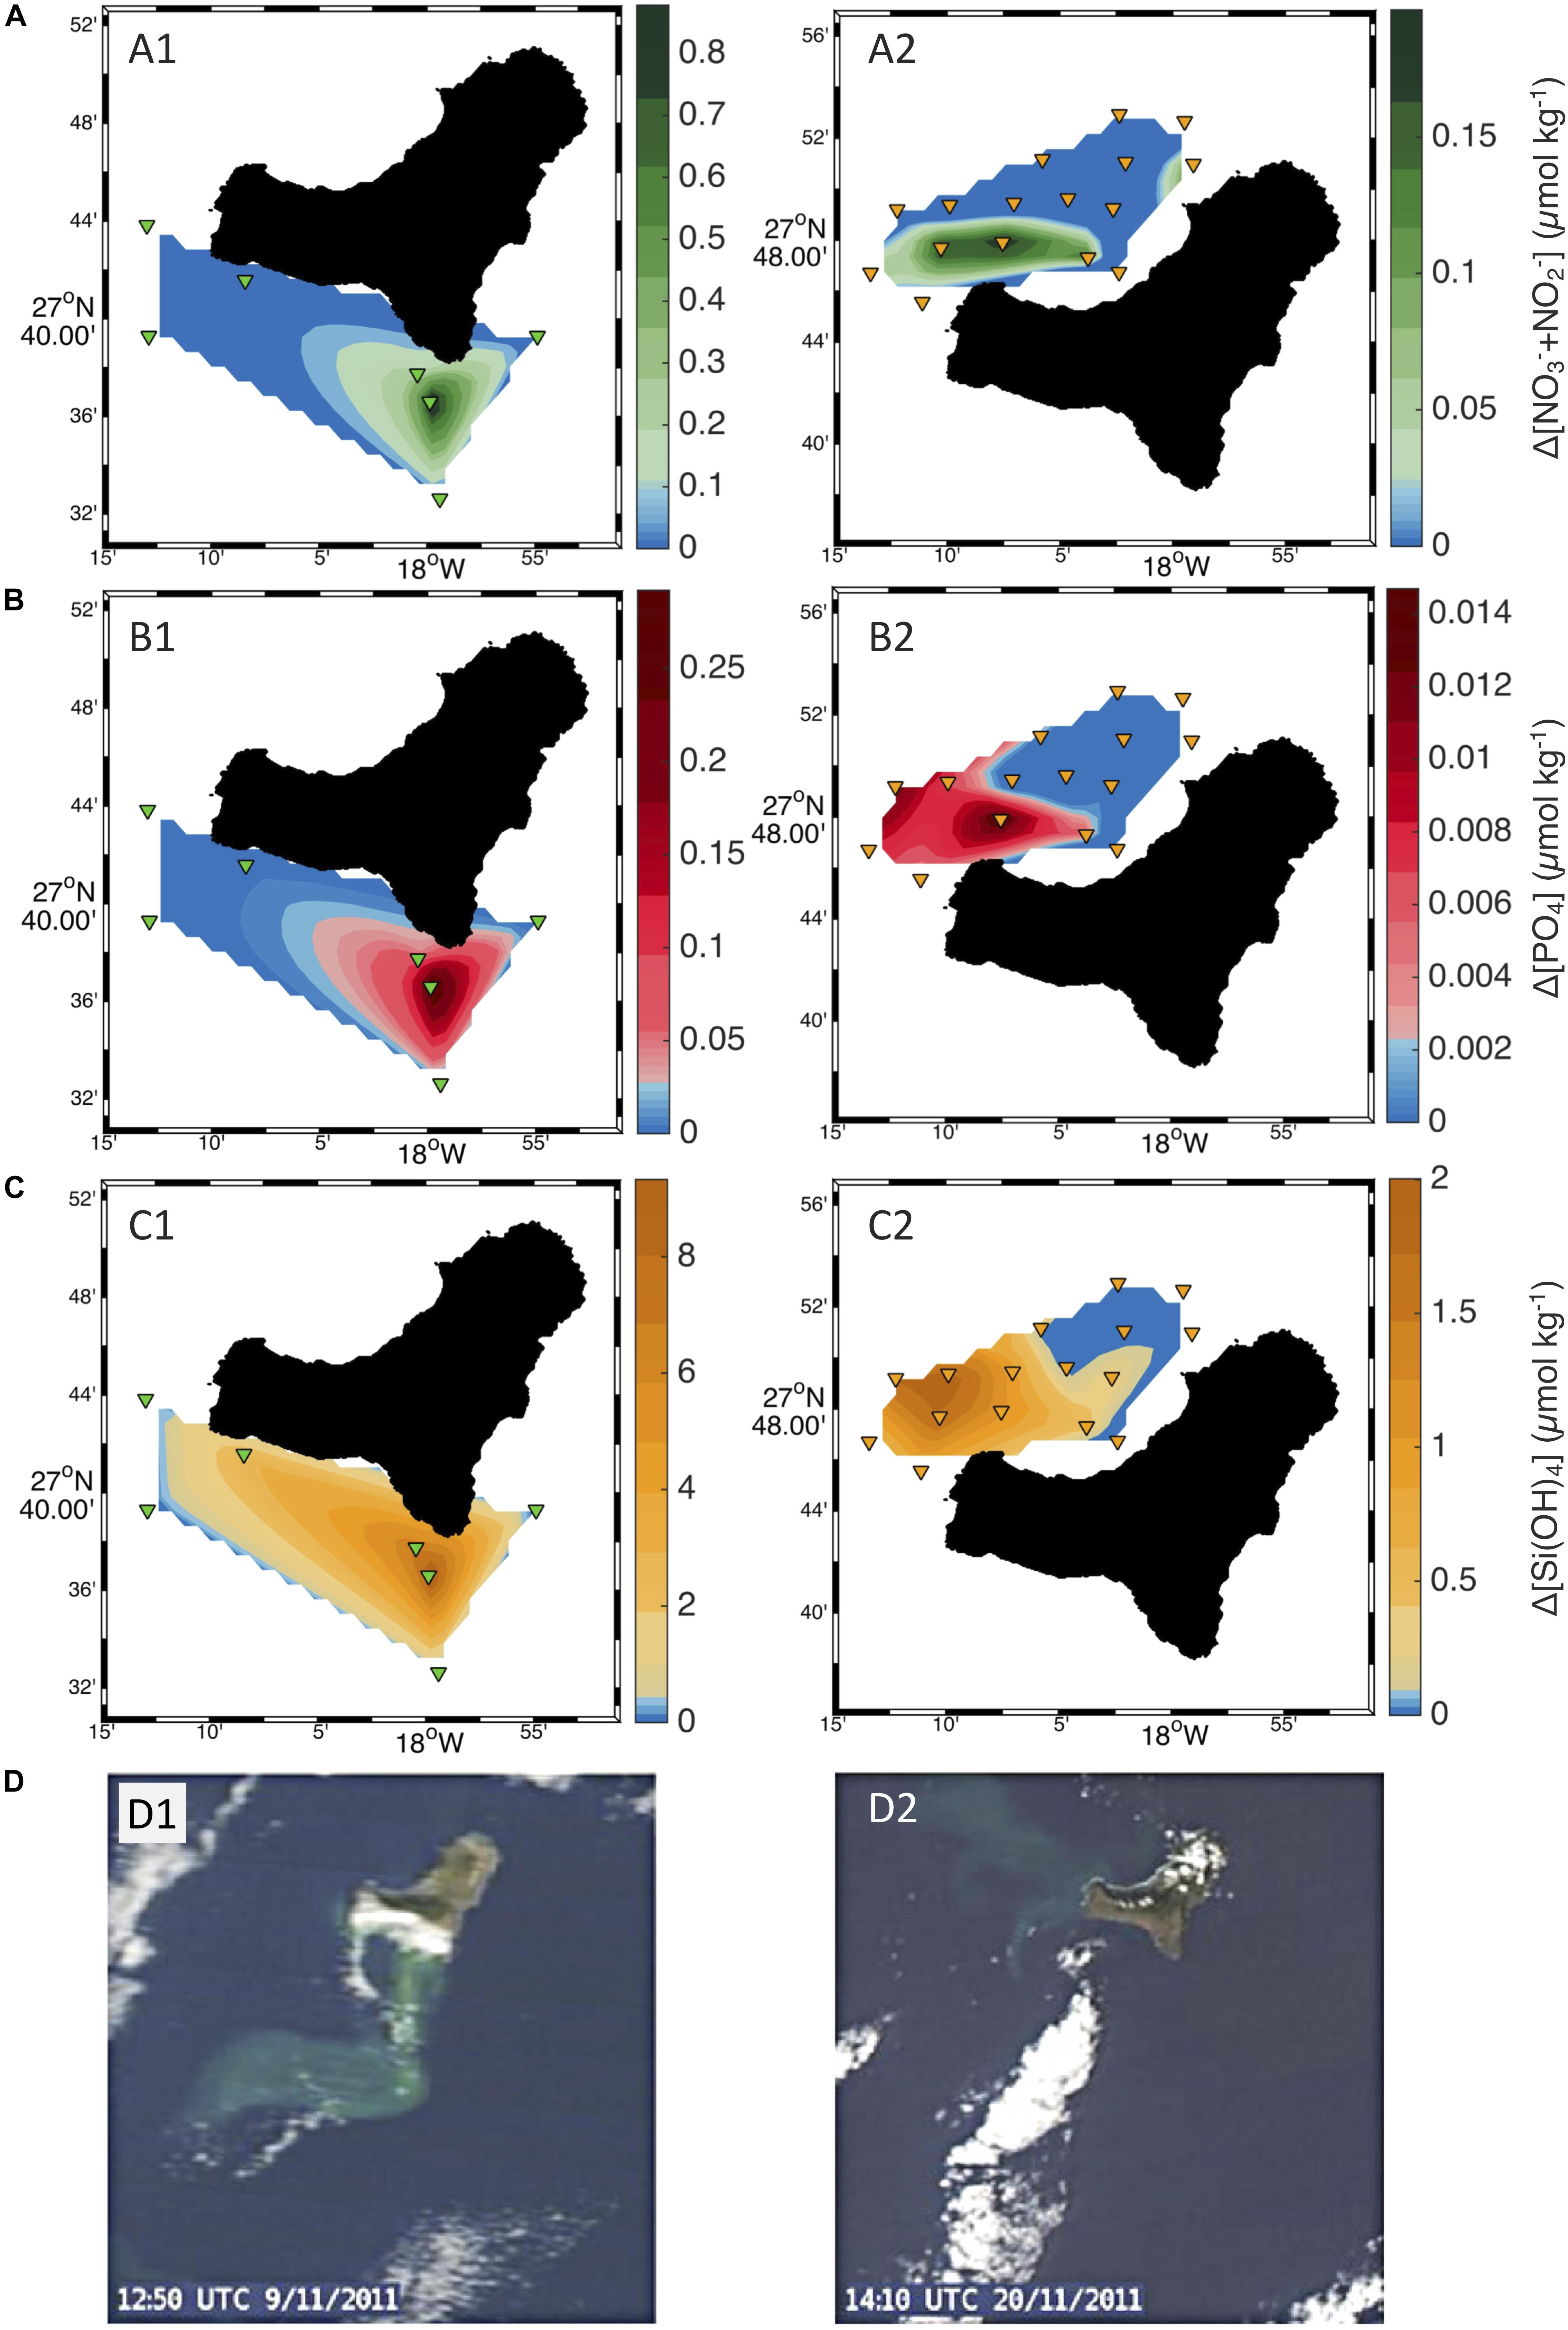
Figure 4. Horizontal contours of nutrient anomalies for (A1, A2) nitrate, (B1, B2) phosphate, and (C1, C2) silicate in the eruptive stage, during cruises 1 and 2, respectively. The blue tones in the contours show anomalies below the standard deviation of the reference. (D) NASA MODIS RGB images of El Hierro island monitoring the eruptive event on (D1) November 9 and (D2) November 20, 2011. Note that the color of the plume is due to the chemicals injected by the volcano and not related to the accumulation of chlorophyll a in the water column (Eugenio et al., 2014).
During early November 2011, the plume of the volcanic emissions was transported southward and south-westward, as shown in the contours of cruise 1 (Figures 4A1,B1,C1) as well as in the satellite image (Figure 4D1). It should be noted that not all nutrients appear to be transported the same distance: silicate transport covers the widest area, followed by phosphate, and then nitrate; this could be related to the different detection limits of the nutrient analysis system. In late November 2011 (cruise 2), a plume was transported from the volcano-affected area northward by the local currents, as can be seen in the satellite images (Figure 4D2). This transport is also observed for the nutrient anomalies (Figures 4A2,B2,C2), which reached the northwest coast of El Hierro. For this area affected north of the island in late November 2011, new percentages of enrichment were calculated respect to the reference levels, obtaining enrichments up to 1. 1-, 1. 2-, and 2.0-fold for nitrate, phosphate, and silicate, respectively.
During the degassing stage, the effects of the volcanic emissions were detectable in a more constrained area in the vicinity of the main crater. With the purpose of studying these localized anomalies, during cruises 7–9 a high-resolution transect of vertical profiles was established across the main and secondary craters (Figure 1C). From these profiles, nutrient anomalies (Δ[X]) for the degassing stage were calculated and are shown in Figure 5 as vertical contours with latitude. The blue tones in the contours represent non-significant anomalies. Due to the cyclic behavior of the hydrothermal discharge (Fraile-Nuez et al., 2018) it is not possible to obtain all the maximum anomalies during one complete transect; for this reason, the vertical profiles that showed maximum anomalies obtained during cruises 7–9 have been selected for the contours, providing a representation of the hydrothermal discharge if it could be sampled simultaneously at all stations. Data from the vent samples of cruise 15 are also shown for phosphate and silicate (Figures 5B,C), but not for nitrate as the vent data did not present higher values than those collected in vertical profiles. Maximum anomalies in the water column are found at stations 55–61 (main crater) and 56 (summit), with maxima of 4.87 (N + N), 0.23 (PO4) and 16.36 (Si(OH)4) μmol kg–1, but remarkably higher anomalies are observed in the vent samples for phosphate and silicate (1.50 and 188.91 μmol kg–1, respectively). The anomalies are found in the first 50–75 m above the seabed and are usually transported southward of the main cones generally until station 52 (about 250 m away from the main cone), whereas northward the anomalies reach only station 57 (about 150 m away from the summit). This is in agreement with the predominant south-southwest current direction described for this region from ADCP data (Santana-Casiano et al., 2016). In total, the nutrient emissions can be detected as enhanced concentrations in a 400 m range around (but not centered on) the main cone.
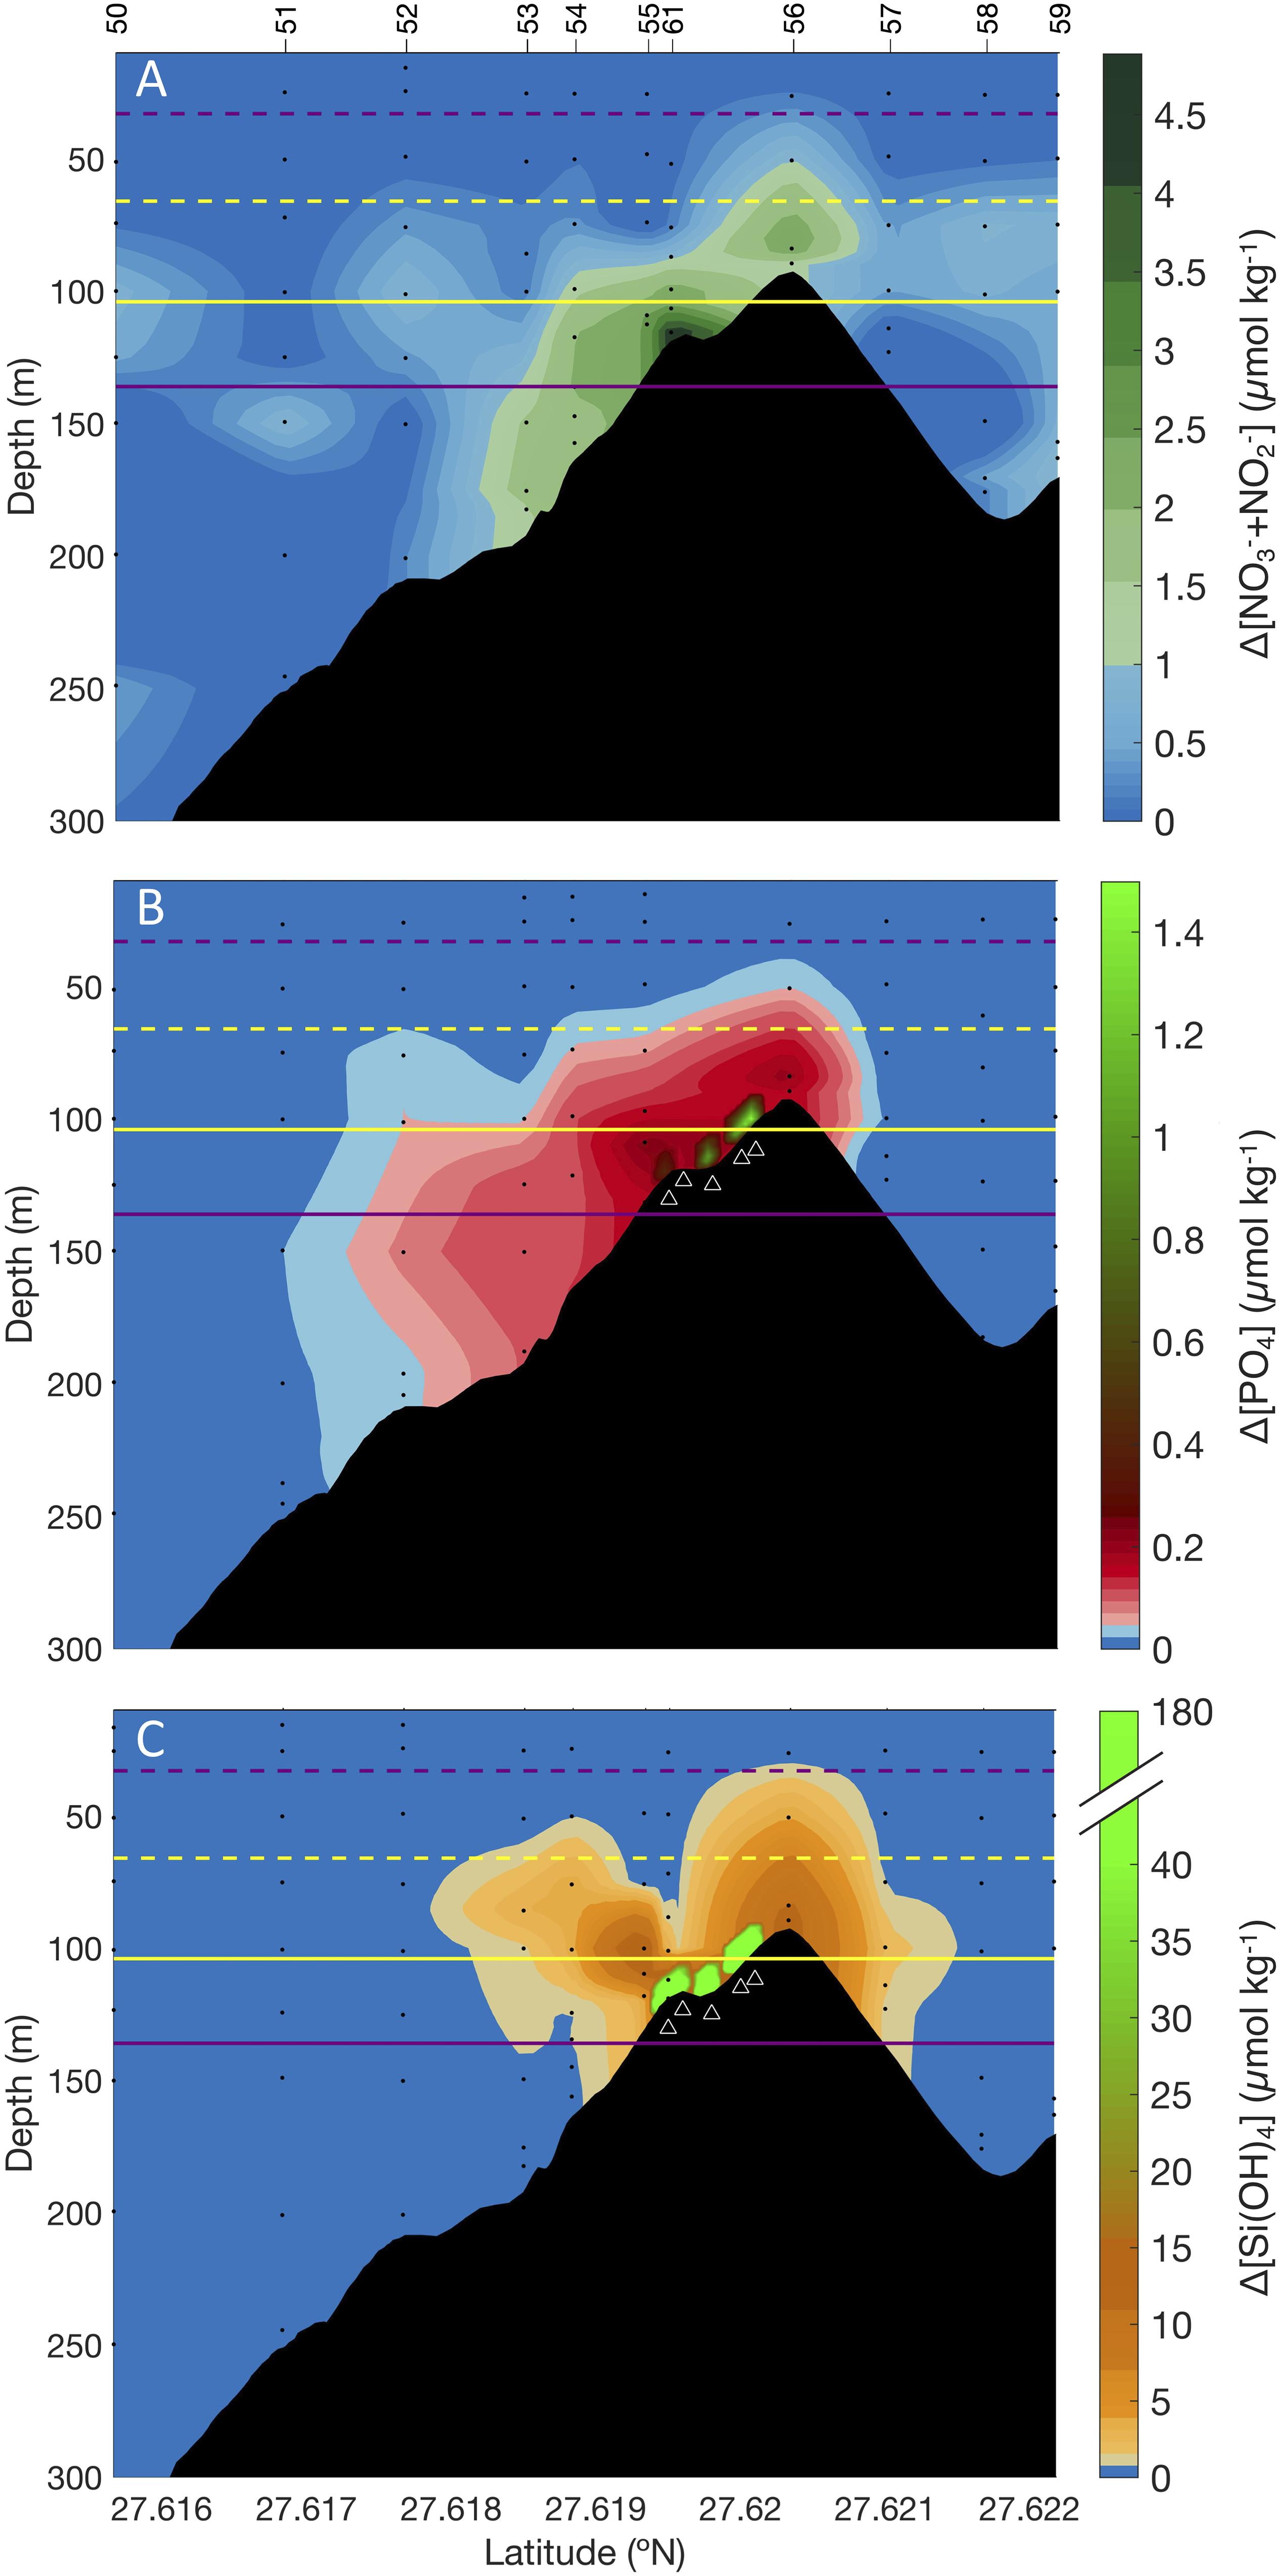
Figure 5. Vertical contours of anomalies of (A) nitrate, (B) phosphate, and (C) silicate in a high-resolution transect of the main cone during the degassing stage. The blue tones show anomalies within the standard deviation of the reference (non-significant anomalies). Stations that presented maximum anomalies from cruises 7–9 were selected for the contours. Data collected in cruise 15 from several vents (marked as triangles) are also shown in panels (B,C). Horizontal lines show the depth of the mixed layer (purple) and of the euphotic zone (yellow), as minimum and maximum values (dashed lines and solid lines, respectively) obtained from monthly averaged datasets provided by the Copernicus Marine Environment Monitoring Service (see Data and Methods).
The contours in Figure 5 conform a high-resolution transect above the main craters and perpendicular to the main current. From these anomaly data, nutrient fluxes for the degassing stage were obtained, representing an estimate of the volcanic nutrient emissions transported to the surrounding waters. The results of the fluxes averaged for the delimited area were 3.19 ± 1.17 mol m–2 year–1 for N + N, 0.02 ± 0.01 mol m–2 year–1 for PO4, and 0.60 ± 1.35 mol m–2 year–1 for Si(OH)4. The substantial standard deviations account for the high variability of concentrations found along the plume, dependent on the proximity to the source, but the averaged values are a representative estimation of the magnitude of these fluxes. In Table 2, these results are shown in detail and can be compared with other important nutrient sources in the region such as upwelling systems, mesoscale structures and upwelling filaments.
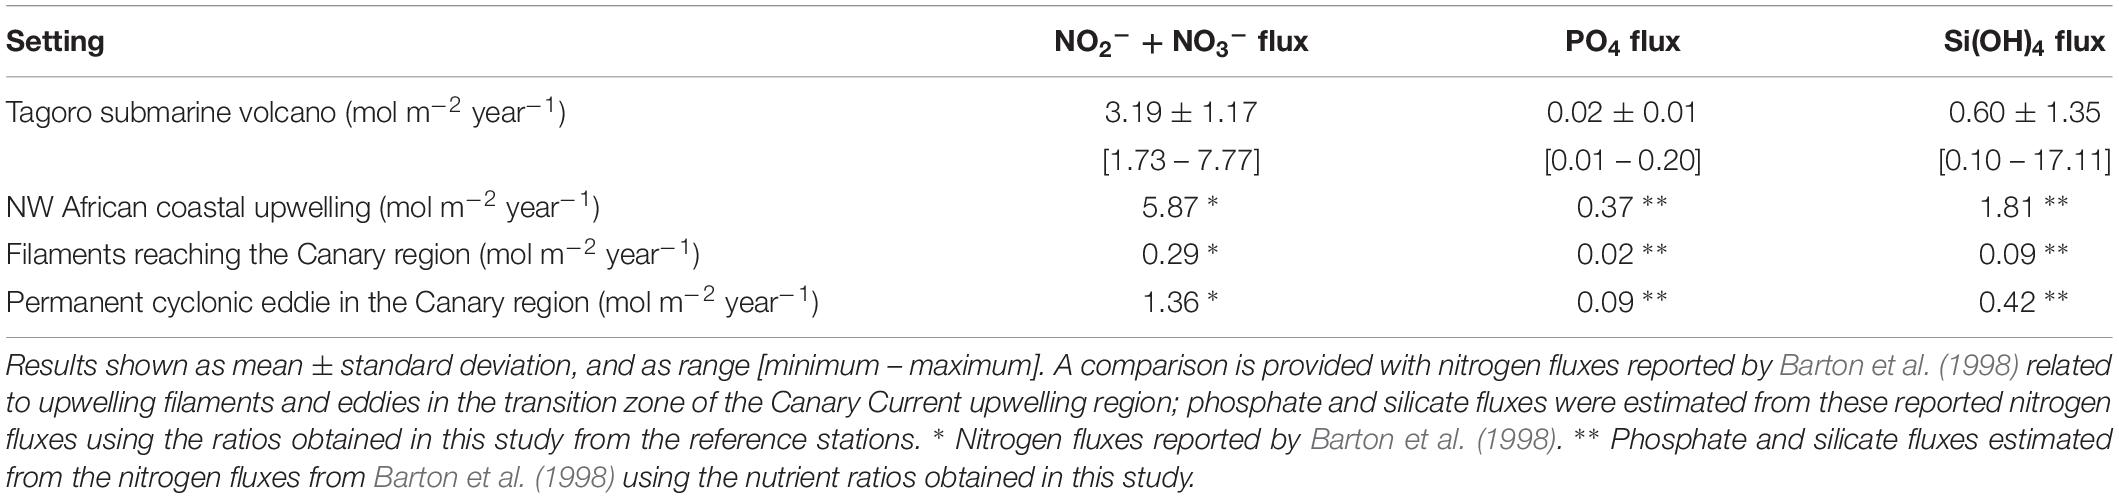
Table 2. Nutrient fluxes calculated from a transect perpendicular to the main current during the degassing stage.
Nutrient Ratios
The correlations between all three nutrients as well as a silicate-temperature correlation are presented in Figure 6. First, in order to evaluate whether silicate can act as a mixing tracer of the volcanic emissions, a correlation was made with a conservative component such as potential temperature (Figure 6D). In order to avoid seasonal and depth-related variability in temperature, the regression was calculated only with the data collected from the vents and some near-bottom (tow-yo) samples within the same depth range (100–130 m) and from the same season as the vent samples. The tow-yo data are quite condensed in a relatively small range of temperature and [Si(OH)4], providing an intercept for the regression line; whereas the vent data, although sparser, define a clear slope. This regression presents a r2 = 0.878 and p < 0.001, underlining an adequate linear relationship between the concentration of silicate and the temperature of the hydrothermal fluids in the area and thus allowing to use [Si(OH)4] as a mixing tracer.
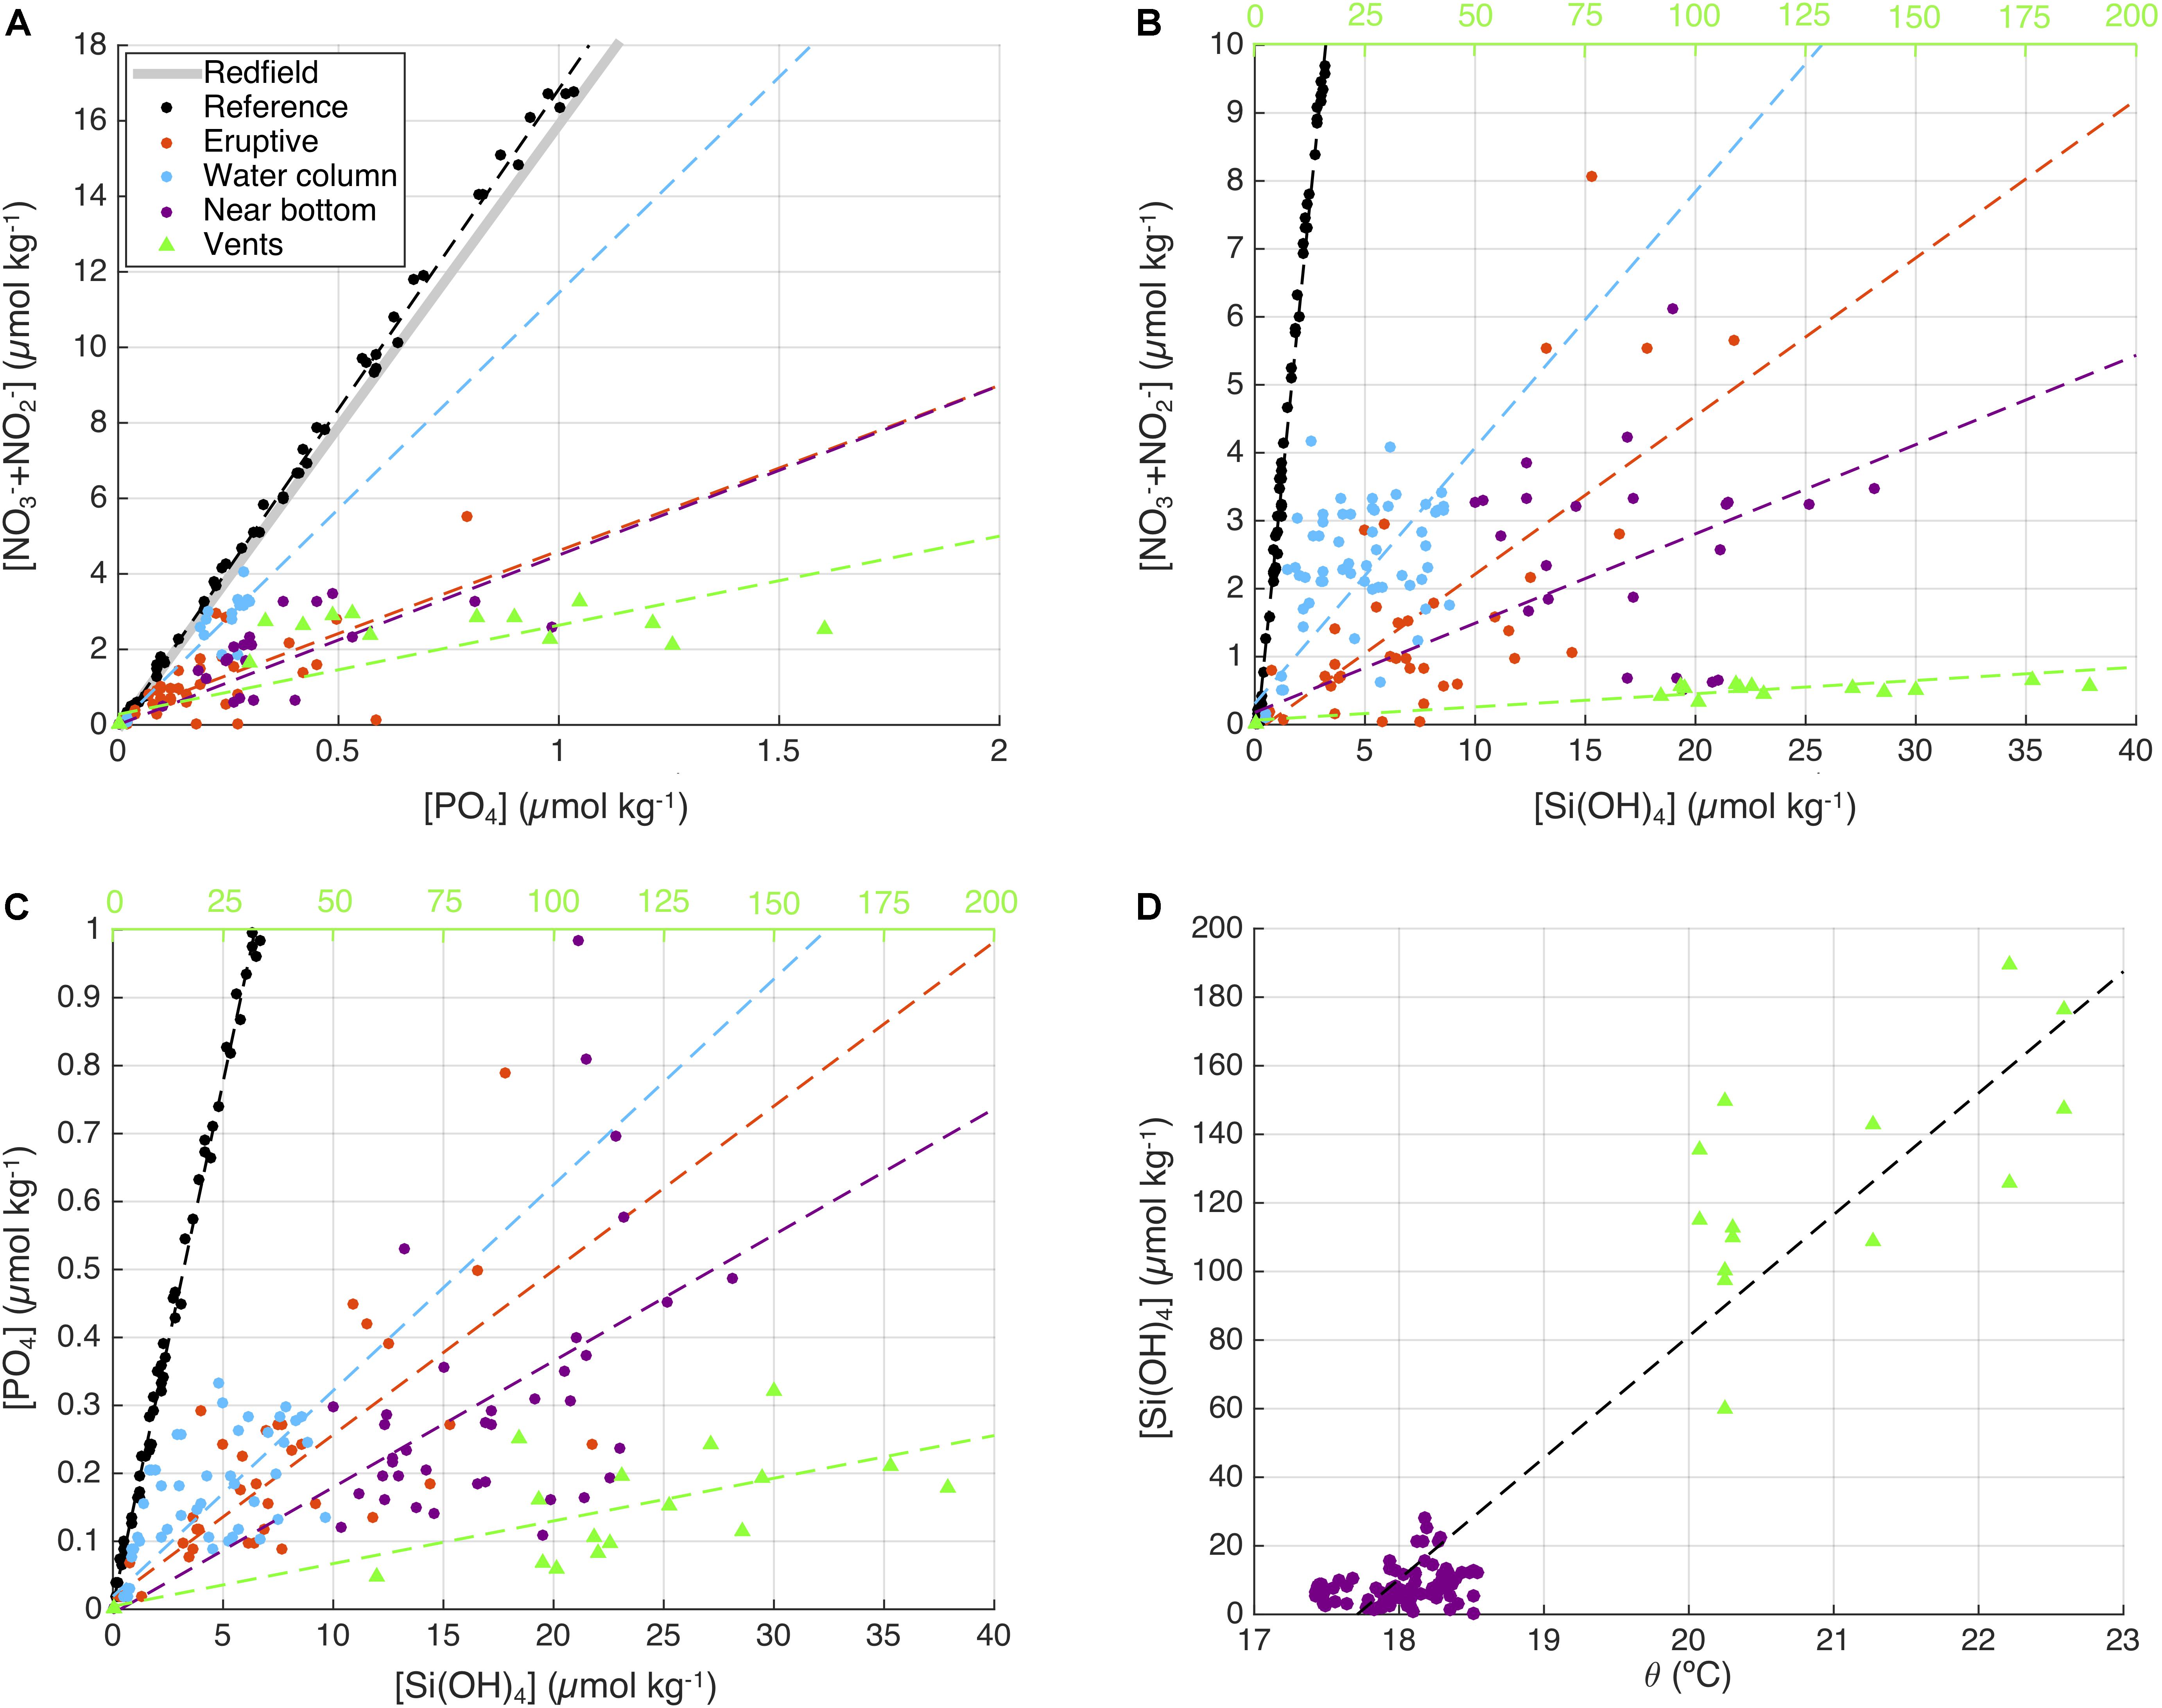
Figure 6. Nutrient ratios calculated as linear correlations, (A) (NO3– + NO2–):PO4 ratio, abbreviated as N:P (Redfield’s 16:1 ratio is shown), (B) (NO3– + NO2–):Si(OH)4 as N:Si, and (C) PO4: Si(OH)4 as P:Si, for the reference stations, the eruptive stage, and the degassing stage classified according to the grade of dilution of the samples (water-column/near-bottom/vents). Upper x-axis in panels (B,C) corresponds to silicate concentration in the vent samples (green). (D) Relation between silicate and potential temperature from the closest samples to the source.
Once silicate has been correlated to a conservative parameter as temperature, the ratios of all three nutrients were studied: nitrate to phosphate (abbreviated N:P, although more accurately NO2– + NO3–:PO4), nitrate to silicate (similarly abbreviated N:Si), and phosphate to silicate (P:Si). Figures 6A–C shows these correlations for reference and affected stations during both the eruptive and degassing stages, and discerning the latter according to the sample type. In this case, the data from the degassing stage were classified not only according to the sampling methodology used (vertical profiles/tow-yos) but also according to the dilution grade of the samples, using the silicate concentration as a mixing tracer. All slopes, r2 and p-values can be consulted in Table 3.
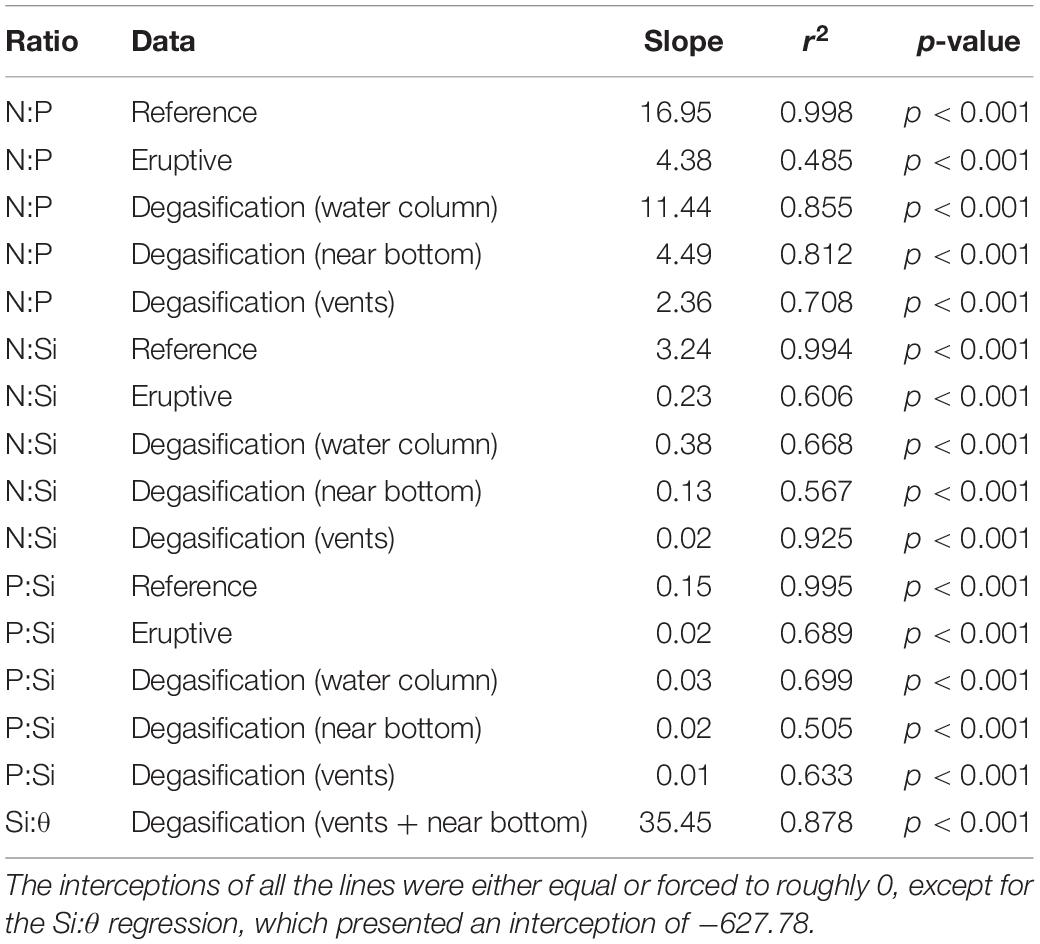
Table 3. Slopes and statistics for the correlations shown in Figure 6.
In general, reference data for all three ratios presented a better fit (r2 > 0.99) than the affected samples (r2 between 0.485 and 0.925). However, although the affected datasets are more dispersed, a general trend in the slopes is evident regarding the dilution grade (proximity to the source): water-column samples (blue), which are the most diluted, present the closest ratio to the reference (black); followed by near-bottom samples (purple); and finally vent samples (green), which are the closest to the source, present the smallest ratio (2.36:1). This trend is observed for all the three ratios (Figures 6A–C). In Figure 6A (N:P ratio) the Redfield ratio is also shown, a nearly constant 16:1 correlation between nitrate and phosphate that is commonly observed in seawater as well as in phytoplankton biomass (Gruber and Deutsch, 2014); our reference data are in close agreement with this ratio (16.95:1).
Discussion
The shallow submarine volcano Tagoro released significant amounts of dissolved inorganic macronutrients throughout the whole study period (2011–2018). We have quantified these emissions for the eruptive and the degassing stages of the volcano, and in the latter stage we have highlighted some noteworthy observations concerning the different sampling methodologies applied. Concentrations of phosphate and silicate increased with the proximity of the sample collection to the source: the least concentrated were the water-column samples, followed by the near-bottom samples, and finally the vent samples. Contrastingly, the maximum concentrations of N + N were found in the water-column samples (which are assumed to be the most diluted with ambient waters) and decreased in the near-bottom and vent samples. We hypothesize that dissolved inorganic nitrogen is emitted mainly in the form of ammonium (NH4+), as has been widely described for other hydrothermal systems (Karl et al., 1988, 1989; Sedwick and Stüben, 1996; Kilias et al., 2013). However, due to a lack of the necessary instrumentation we could not implement ammonium analyses until recently, and thus, we have only been able to measure a small number of ammonium samples collected from the vents with ROV (cruise 15). These were analyzed for ammonium long after their collection and might have been subject to losses of ammonium. Nonetheless, even with these limitations, we have found concentrations of NH4+ of up to 1.97 μM, in contrast to reference concentrations of 0.02 μM at the same depth. This supports our hypothesis and suggests that the higher concentrations of N + N observed in the water column with increasing distance from the vents are the result of oxidative processes, which have been observed elsewhere in hydrothermal systems from deep-sea (Lam et al., 2004, 2008; Baker et al., 2012) as well as shallow settings (Kilias et al., 2013). However, this would require a more specific study and the recollection of a larger dataset of NH4+ samples.
The boxplots of nutrient anomalies in Figure 3 also provide information regarding the changes in the emissions with the different sampling methodologies applied. When analyzing these data, it is important to keep in mind that the volcano exhibits a cyclic degassing behavior (Fraile-Nuez et al., 2018), with periodic emissions that then undergo mixing and dilution through the water column. Therefore, when collecting water samples during vertical profiles or tow-yos, samples may carry recently emitted concentrated fluids, or more previously emitted fluids that have been exposed to mixing and dilution for a longer time. This feature accounts for the high variability observed in the data distribution in Figure 3 even within each methodological dataset. Moreover, the outliers in the boxplots should not be interpreted as uncommonly high-concentrated episodic emissions, but rather as representatives of the most concentrated form of the hydrothermal fluids that can be detected in the water column before undergoing dilution or other withdrawal processes.
The present study provides an interesting overview on how hydrothermal emissions can have very different impacts depending on the depth at which the vents are found, as the ambient concentrations of nutrients vary markedly with depth. In Table 1 we provide nutrient concentrations and enrichments for Tagoro volcano and for three different hydrothermal settings: shallow active submarine warm springs off the island of Vulcano, Aeolian Archipelago, Italy (Sedwick and Stüben, 1996); Lucky Strike at 1700 m depth in the Mid-Atlantic Ridge (Sarradin et al., 1999); and Pele’s Vents at 1000 m depth in Lōihi Seamount, Hawaii (Karl et al., 1989). The samples in these studies were collected directly from the vents using different sampling methodologies, therefore they are comparable to the ROV-collected vent samples from Tagoro volcano. However, the comparison is not straightforward, as in the deep settings (Lucky Strike and Lôihi Seamount) the emitted hydrothermal fluids are mixed with nutrient-rich ambient waters. For instance, in Pele’s Vents (1000 m depth), an average of 2.8-fold enrichment in silicate was obtained considering a 102.1 μM reference and a range of 102.1–721.0 μM found in the emissions. A similar [Si(OH)4] range was found in the vent samples of Tagoro volcano (126.03–189.40 μmol kg–1); however, compared to the low ambient concentrations (0.49 μmol kg–1) at the 111 m depth of this vent, the resulting enrichment was as large as 325.4-fold. In the same way, a [PO4] range of 0.81–1.26 μmol kg–1 in Tagoro volcano represented a 10.5-fold enrichment, while in the nutrient-rich deep waters of the Lucky Strike, concentrations of similar magnitude (0.10–0.87 μM) did not constitute an enrichment, but a depletion of 0.4-fold. In contrast, the enrichments found in the shallow (0.3 m depth) fumaroles of Vulcano island are more similar to our results, with a 20.5-fold enrichment for phosphate and 12.3-fold for silicate, as well as significant enrichments in NH4+ of roughly three times the ambient concentrations. These results underline the importance of shallow submarine volcanoes as a source of nutrient enrichment for surface waters.
Average nutrient fluxes for the degassing stage were calculated from a transect perpendicular to the current (Table 2). Barton et al. (1998) estimated nitrogen fluxes related to upwelling filaments and eddies in the transition zone of the Canary Current upwelling region. With the purpose of comparing the magnitude of these different processes, we estimated phosphate and silicate fluxes from these reported nitrogen data by using the ratios obtained from the reference stations surrounding El Hierro island (ratios in Table 3). The reported fluxes for upwelling and mesoscale processes in the region are of similar magnitude as compared to the hydrothermal emissions of the Tagoro volcano when compared per units of area. For instance, a 5.87 mol m–2 year–1 nitrogen flux from the African coastal upwelling was described by Barton et al. (1998), comparable to the 3.19 mol m–2 year–1 nitrate flux found in Tagoro volcano. Similarly, the phosphate flux from the filaments reaching the Canary Islands is estimated as 0.02 mol m–2 year–1, coinciding with our results for the flux of this nutrient from the degasification of Tagoro. Additionally, the fluxes from a permanent cyclonic eddy in the Canary region (estimated silicate flux of 0.42 mol m–2 year–1) are of similar magnitude to our results of 0.60 mol m–2 year–1 for the same nutrient. These results underline that the shallow volcano Tagoro constitutes an additional relevant source for nutrient transport in the Canary region. A comparison with other volcanic and hydrothermal settings is troublesome, since estimates of nutrient fluxes from these sorts of sources are very scarce and are mostly found as global estimates (Tréguer et al., 1995; Paytan and McLaughlin, 2007; Tréguer and La Rocha, 2013) rather than regional approaches. Nevertheless, an interesting observation can be addressed in relation to phosphate emissions. Hydrothermal processes have often been described as a sink in the phosphorus cycle (Paytan and McLaughlin, 2007), mainly due to a net loss by formation of suspended iron oxyhydroxides and by direct uptake of phosphate through reaction with basalt (Föllmi, 1996). However, these estimations mostly account for deep hydrothermal systems where the ambient concentrations of nutrients are high. Conversely, our results show a net input of phosphate to the oligotrophic surrounding waters of El Hierro island, showing the importance of shallow hydrothermal emissions for estimating global nutrient fluxes to the surface ocean. In fact, our results show that hydrothermal nutrient emission at the Tagoro volcano occurred mostly around 50–75 m above the seabed. This means that nutrients will be occasionally injected in the mixed layer and well within the euphotic zone (Figure 5) where they could have a significant impact on primary production.
We aimed to study the relations among the different nutrients and the evolution of these ratios according to the dilution grade of the samples using correlation analysis. Figure 6A shows the commonly studied N:P ratio, although in this case it should be interpreted as NO2– + NO3–:PO4 relationships. Nevertheless, our reference data exhibits a 16.95:1 ratio, in notable agreement with the Redfield ratio (16:1), and with an excellent fit (r2 = 0.998; p < 0.001). The volcano-affected datasets are more scattered (r2 ranging between 0.485–0.855; p < 0.001); however, the slopes show a clear evolution of the ratio with the dilution grade: the smallest ratio is found at the vent samples (2.36:1), followed by the eruptive stage samples (4.38) and near-bottom degasification samples (4.49), and finally the water-column degasification samples (11.44:1).
This trend of the ratios according to the dilution grade of the samples can also be observed for the NO2– + NO3–:Si(OH)4 and PO4:Si(OH)4 correlations in Figures 6B,C, respectively. However, these plots also offer further information about the behavior of these species after their emission, as silicate is commonly used as a mixing tracer for volcanic and hydrothermal fluids (Edmond et al., 1979; Sansone et al., 1991; Sansone and Resing, 1995; Sedwick and Stüben, 1996). When species concentrations plot linearly against dissolved Si concentration, conservative behavior is suggested for that species during mixing of the hydrothermal fluids with seawater, whereas when a non-linear relationship is observed, non-conservative mixing behavior is suggested (Sedwick and Stüben, 1996). In order to assess whether our Si(OH)4 data could be used as a mixing tracer, the concentrations were plotted against potential temperature in Figure 6D. The data exhibited a good fit (r2 = 0.878; p < 0.001) with a linear relationship of y = 35.45x - 627.78, which is notably consistent with the relation of y = 31.0x - 601 found by Sedwick and Stüben (1996) in the beach fumaroles of Vulcano island. In the same study, the N + N concentrations showed no consistent trend against dissolved Si; however, in a study in Lôihi Seamount (Karl et al., 1989) a linear relationship was found when N + N and PO4 were plotted against Si. In this sense, the linear fits of our N:Si and P:Si data indicates a conservative mixing behavior of these species, but the notably lower r2 values of these fits (roughly 0.5–0.6) should be taken into account. Considering all the observations we have discussed, in particular the notable withdrawal of phosphate indicated by a marked difference in concentration between the near-bottom and the water-column samples (Figure 3 and Table 1) as well as the nitrifying processes hypothesized previously, it is likely that the scatter in the concentrations of these nutrients could be related to a non-conservative mixing behavior caused by chemical or biological processes that cannot be assessed in this study and should be considered for further research.
In addition to the hydrothermal input of dissolved inorganic nitrogen, phosphorus, and silicate described in this work as well as in the literature (Tunnicliffe et al., 1986; Karl et al., 1988, 1989; Sedwick and Stüben, 1996; Sarradin et al., 1999), recent studies also describe important inputs of biologically available iron [Fe(II)] from deep and shallow hydrothermal vents (Santana-Casiano et al., 2013; Resing et al., 2015; Buck et al., 2018). Consequently, the question of whether volcanic and hydrothermal emissions can fertilize shallow waters and have an impact on the local phytoplanktonic communities becomes a relevant one (Buck et al., 2018; Gómez-Letona et al., 2018; Wilson et al., 2019). Although this question is beyond the scope of this study, the fact the nutrients are occasionally injected into the euphotic zone and into the mixed layer at the Tagoro volcano warrant further investigation in the future.
Conclusion
Through this study, we have confirmed that the submarine volcano Tagoro has emitted significant amounts of dissolved inorganic nutrients from the beginning of its eruptive process in 2011 until the latest survey carried out in 2018. We have quantified these emissions and have found maximum concentrations for the eruptive stage of 8.06 μmol kg–1 of NO2– + NO3– (reference: 1.75 μmol kg–1), 0.79 μmol kg–1 of PO4 (reference: 0.11 μmol kg–1) and 21.76 μmol kg–1 of Si(OH)4 (reference: 1.23 μmol kg–1). For the degassing stage, remarkable differences in the results were observed with regard to the sampling methodology applied. The largest concentrations of phosphate and silicate were found in the samples collected directly from the vents with ROV, with maxima of 1.26 and 189.40 μmol kg–1, respectively; whereas for nitrate the maximum (6.21 μmol kg–1) was found in the most mixed (water-column) samples and decreased when approaching the source. From these vent samples, ammonium concentrations were analyzed, finding maximums of 1.97 μM (reference: 0.02 μM). Average enrichments were obtained, with water-column maxima of 8.8-fold (nitrate), 4.0-fold (phosphate) and 16.3-fold (silicate), and higher vent maxima of 10.5-fold (phosphate) and 325.4-fold (silicate). A preliminary analysis of ammonium (NH4+) in the vent samples showed maximum concentrations of 1.97 μM (reference: 0.02 μM), supporting the vast compilation of studies describing the emission of this species from hydrothermal vents and suggesting the occurrence of nitrifying processes, which should be assessed in future studies.
Nutrient fluxes transported from the hydrothermal emissions into the surrounding waters during the degassing stage were estimated as 3.19 ± 1.17 mol m–2 year–1 for NO2– + NO3–, 0.02 ± 0.01 mol m–2 year–1 for PO4, and 0.60 ± 1.35 mol m–2 year–1 for Si(OH)4. These results were found to be of similar magnitude as other important nutrient transport sources in the Canary region, such as NW-African coastal upwelling, upwelling filaments, and permanent cyclonic eddies. Notably, while hydrothermal processes are often described as a sink in the phosphorus cycle, our results highlight a positive phosphate transport from the volcano into the oligotrophic surroundings.
The nutrient ratios (N:P, N:Si, and P:Si) showed an evident relationship with the grade of dilution of the samples. The N:P ratio indicated a deviation from the 16:1 Redfield proportion, progressively decreasing with the proximity of the samples to the source until finding a 2.36:1 ratio in the vent samples. The N:Si and P:Si ratios also showed this behavior, with a minimum ratio in the vent samples of 0.02:1 (N:Si; reference: 3.24:1) and 0.01:1 (P:Si; reference: 0.15:1). Furthermore, seeing as silicate can act as a mixing tracer, the notable dispersion observed in the N:Si and P:Si fits might indicate a non-conservative mixing behavior of nitrate and phosphate.
The biogeochemical impact of hydrothermal emissions has typically been studied mainly from deep hydrothermal settings. However, the unprecedented 7-year dataset from a shallow active submarine volcano presented in this study has highlighted the need to account for shallow hydrothermal emissions as important sources of nutrients to the ocean.
Data Availability Statement
All datasets generated for this study are included in the article/supplementary material.
Author Contributions
AG-V and EF-N: study design. AG-V: data processing and graphical representations. JE-P: nutrient analysis. MG-B and OT: high resolution bathymetry. AG-V and EF-N: writing – original draft preparation. AG-V, EF-N, JS-C, MG-D, JE-P, MG-B, OT, and JA: writing – draft contribution. EF-N, JS-C, and JA: supervision. EF-N: project administration and funding acquisition.
Funding
This research was funded by the Ministerio de Economía y Competitividad del Gobierno de España (MINECO), FEDER through VULCANO-I (CTM2012-36317) and VULCANO-II (CTM2014-51837-R) projects and The Spanish Institute of Oceanography (IEO) through BIMBACHE (IEO-2011-2012), RAPROCAN-III (IEO-2010-2012), VULCANA-I (IEO-2015-2017), and VULCANA-II (IEO-2018-2020) projects. The use of the ROV Liropus 2000 was also funded by IEO. The inorganic nutrients were analyzed at IEO-Tenerife funded by IEO.
Conflict of Interest
The authors declare that the research was conducted in the absence of any commercial or financial relationships that could be construed as a potential conflict of interest.
Acknowledgments
We would like to thank Oris Höltsein 1904 for supporting the scholarship of AG-V at IEO through the creation of the Oris-El Hierro Limited Edition watches. We would also like to thank the officers and crew of the R/V Ramón Margalef and Ángeles Alvariño from the IEO and the technician team of ACSM (ROV) for their help at sea.
References
Aminot, A., and Kérouel, R. (2007). Dosage Automatique Des Nutriments Dans Les Eaux Marines: Méthodes En Flux Continu. Versailles: Editions Quae.
Aumont, O., Ethé, C., Tagliabue, A., Bopp, L., and Gehlen, M. (2015). PISCES-v2: an ocean biogeochemical model for carbon and ecosystem studies. Geosci. Model Dev. Discuss. 8, 2465–2513. doi: 10.5194/gmdd-8-1375-2015
Baker, B. J., Lesniewski, R. A., and Dick, G. J. (2012). Genome-enabled transcriptomics reveals archaeal populations that drive nitrification in a deep-sea hydrothermal plume. ISME J. 6, 2269–2279. doi: 10.1038/ismej.2012.64
Baker, E. T., Massoth, G. J., Walker, S. L., and Embley, R. W. (1993). A method for quantitatively estimating diffuse and discrete hydrothermal discharge. Earth Planet. Sci. Lett. 118, 235–249. doi: 10.1016/0012-821X(93)90170-E
Barton, E. D., Arístegui, J., Tett, P., Cantón, M., García-Braun, J., Hernández-León, S., et al. (1998). The transition zone of the canary current upwelling region. Prog. Oceanogr. 41, 455–504. doi: 10.1016/S0079-6611(98)00023-28
Buck, N. J., Resing, J. A., Baker, E. T., and Lupton, J. E. (2018). Chemical fluxes from a recently erupted shallow submarine volcano on the mariana arc. Geochem. Geophys. Geosyst. 19, 1660–1673. doi: 10.1029/2018GC007470
Carracedo, J. C., Day, S., Guillou, H., Rodríguez Badiola, E., Canas, J. A., and Pérez Torrado, F. J. (1998). Hotspot volcanism close to a passive continental margin: the canary Islands. Geol. Mag. 135, 591–604. doi: 10.1017/S0016756898001447
Desbruyères, D., Biscoito, M., Caprais, J. C., Colaço, A., Comtet, T., Crassous, P., et al. (2001). Variations in deep-sea hydrothermal vent communities on the mid-atlantic ridge near the azores plateau. Deep Sea Res. Part I Oceanogr. Res. Pap. 48, 1325–1346. doi: 10.1016/S0967-0637(00)00083-82
Edmond, J. M., Measures, C., McDuff, R. E., Chan, L. H., Collier, R., Grant, B., et al. (1979). Ridge crest hydrothermal activity and the balances of the major and minor elements in the ocean: the galapagos data. Earth Planet Sci. Lett. 46, 1–18. doi: 10.1016/0012-821X(79)90061-X
Eugenio, F., Martin, J., Marcello, J., and Fraile-Nuez, E. (2014). Environmental monitoring of El Hierro Island submarine volcano, by combining low and high resolution satellite imagery. Int. J. Appl. Earth Observ. Geoinform. 29, 53–66. doi: 10.1016/j.jag.2013.12.009
Föllmi, K. B. (1996). The phosphorus cycle, phosphogenesis and marine phosphate-rich deposits. Earth Sci. Rev. 40, 55–124. doi: 10.1016/0012-8252(95)00049-46
Fraile-Nuez, E., González-Dávila, M., Santana-Casiano, J. M., Arístegui, J., Alonso-González, I. J., Hernández-León, S., et al. (2012). The submarine volcano eruption at the island of El Hierro: physical-chemical perturbation and biological response. Sci. Rep. 2:486. doi: 10.1038/srep00486
Fraile-Nuez, E., Machín, F., Vélez-Belchí, P., López-Laatzen, F., Borges, R., Benítez-Barrios, V. M., et al. (2010). Nine years of mass transport data in the eastern boundary of the North Atlantic Subtropical Gyre. J. Geophys. Res. 115:C09009. doi: 10.1029/2010JC006161
Fraile-Nuez, E., Santana-Casiano, J., González-Dávila, M., Vázquez, J., Fernández-Salas, L., Sánchez-Guillamón, O., et al. (2018). Cyclic behavior associated with the degassing process at the shallow submarine volcano tagoro, canary Islands, Spain. Geosciences 8:457. doi: 10.3390/geosciences8120457
Garcia, H. E. (2005). On the variability of dissolved oxygen and apparent oxygen utilization content for the upper world ocean: 1955 to 1998. Geophys. Res. Lett. 32, L9604–L9608. doi: 10.1029/2004GL022286
Gómez-Letona, M., Arístegui, J., Ramos, A. G., Montero, M. F., and Coca, J. (2018). Lack of impact of the El Hierro (Canary Islands) submarine volcanic eruption on the local phytoplankton community. Sci. Rep. 8:4667. doi: 10.1038/s41598-018-22967-22966
Gruber, N., and Deutsch, C. A. (2014). Redfield’s evolving legacy. Nat. Geosci. 7, 853–855. doi: 10.1038/ngeo2308
Guieu, C., Bonnet, S., Petrenko, A., Menkes, C., Chavagnac, V., Desboeufs, K., et al. (2018). Iron from a submarine source impacts the productive layer of the Western Tropical South Pacific (WTSP). Sci. Rep. 8:9075. doi: 10.1038/s41598-018-27407-z
Karl, D. M., Brittain, A. M., and Tilbrook, B. D. (1989). Hydrothermal and microbial processes at Loihi Seamount, a mid-plate hot-spot volcano. Deep Sea Res. Part A Oceanogr. Res. Pap. 36, 1655–1673. doi: 10.1016/0198-0149(89)90065-90064
Karl, D. M., McMurtry, G. M., Malahoff, A., and Garcia, M. O. (1988). Loihi seamount, hawaii: a mid-plate volcano with a distinctive hydrothermal system. Nature 335, 532–535. doi: 10.1038/335532a0
Kérouel, R., and Aminot, A. (1997). Fluorometric determination of ammonia in sea and estuarine waters by direct segmented flow analysis. Mar. Chem. 57, 265–275. doi: 10.1016/S0304-4203(97)00040-46
Kilias, S. P., Nomikou, P., Papanikolaou, D., Polymenakou, P. N., Godelitsas, A., Argyraki, A., et al. (2013). New insights into hydrothermal vent processes in the unique shallow-submarine arc-volcano, Kolumbo (Santorini), Greece. Sci. Rep. 3:2421. doi: 10.1038/srep02421
Lam, P., Cowen, J. P., and Jones, R. D. (2004). Autotrophic ammonia oxidation in a deep-sea hydrothermal plume. FEMS Microbiol. Ecol. 47, 191–206. doi: 10.1016/S0168-6496(03)00256-253
Lam, P., Cowen, J. P., Popp, B. N., and Jones, R. D. (2008). Microbial ammonia oxidation and enhanced nitrogen cycling in the endeavour hydrothermal plume. Geochim. Cosmochim. Acta 72, 2268–2286. doi: 10.1016/j.gca.2008.01.033
Mitchell, N. (2012). Submarine volcanism: hot, cracking rocks deep down. Nat. Geosci. 5, 444–445. doi: 10.1038/ngeo1505
Paytan, A., and McLaughlin, K. (2007). The oceanic phosphorus cycle. Chem. Rev. 107, 563–576. doi: 10.1021/cr0503613
Resing, J. A., Baker, E. T., Lupton, J. E., Walker, S. L., Butterfield, D. A., Massoth, G. J., et al. (2009). Chemistry of hydrothermal plumes above submarine volcanoes of the mariana arc. Geochem. Geophys. Geosyst. 10:Q02009. doi: 10.1029/2008GC002141
Resing, J. A., Sedwick, P. N., German, C. R., Jenkins, W. J., Moffett, J. W., Sohst, B. M., et al. (2015). Basin-scale transport of hydrothermal dissolved metals across the South Pacific Ocean. Nature 523, 200–203. doi: 10.1038/nature14577
Sansone, F. J., and Resing, J. A. (1995). Hydrography and geochemistry of sea surface hydrothermal plumes resulting from Hawaiian coastal volcanism. J. Geophys. Res. 100, 13555–13569.
Sansone, F. J., Resing, J. A., Tribble, G. W., Sedwick, P. N., Kelly, K. M., and Hon, K. (1991). Lava-seawater interactions at shallow-water submarine lava flows. Geophys. Res. Lett. 18, 1731–1734. doi: 10.1029/91GL01279
Santana-Casiano, J. M., Fraile-Nuez, E., González-Dávila, M., Baker, E. T., Resing, J. A., and Walker, S. L. (2016). Significant discharge of CO2 from hydrothermalism associated with the submarine volcano of El Hierro Island. Sci. Rep. 6:25686. doi: 10.1038/srep25686
Santana-Casiano, J. M., González-Dávila, M., Fraile-Nuez, E., De Armas, D., González, A. G., Domínguez-Yanes, J. F., et al. (2013). The natural ocean acidification and fertilization event caused by the submarine eruption of El Hierro. Sci. Rep. 3:1140. doi: 10.1038/srep01140
Sarradin, P. M., Caprais, J. C., Riso, R., Kérouel, R., and Aminot, A. (1999). Chemical environment of the hydrothermal mussel communities in the Lucky Strike and Menez Gwen vent fields, Mid Atlantic Ridge. Cah. Biol. Mar. 40, 93–104.
Sedwick, P., and Stüben, D. (1996). Chemistry of shallow submarine warm springs in an arc-volcanic setting: Vulcano Island, Aeolian Archipelago, Italy. Mar. Chem. 53, 147–161. doi: 10.1016/0304-4203(96)00020-25
Smith, W. H. F., and Sandwell, D. T. (1997). Global sea floor topography from satellite altimetry and ship depth soundings. Science 277, 1956–1962. doi: 10.1126/science.277.5334.1956
Sorokin, Y. I., Sorokin, P. Y., and Zakuskina, O. Y. (1998). Microplankton and its functional activity in zones of shallow hydrotherms in the Western Pacific. J. Plankton Res. 20, 1015–1031. doi: 10.1093/plankt/20.6.1015
Sotillo, M. G., Cailleau, S., Lorente, P., Levier, B., Aznar, R., Reffray, G., et al. (2015). The myocean IBI ocean forecast and reanalysis systems: operational products and roadmap to the future copernicus service. J. Operat. Oceanogr. 8, 63–79. doi: 10.1080/1755876X.2015.1014663
Sotomayor-García, A., Rueda, J. L., Sánchez-Guillamón, O., Urra, J., Vázquez, J. T., Palomino, D., et al. (2019). First macro-colonizers and survivors around tagoro submarine Volcano, Canary Islands, Spain. Geosciences 9:52. doi: 10.3390/geosciences9010052
Staudigel, H., Hart, S. R., Pile, A., Bailey, B. E., Baker, E. T., Brooke, S., et al. (2006). Vailulu’u seamount, samoa: life and death on an active submarine volcano. Proc. Natl. Acad. Sci. U.S.A. 103, 6448–6453. doi: 10.1073/pnas.0600830103
Tarasov, V. G., Propp, M. V., Propp, L. N., Zhirmunsky, A. V., Namsakakv, B. B., Gorlenko, V. M., et al. (1990). Shallow-water gasohydrothermal vents of Ushishir volcano and the ecosystem of kraternaya bight (The Kurile Islands). Mar. Ecol. 11, 1–23. doi: 10.1111/j.1439-0485.1990.tb00225.x
Thorarinsson, S. (1967). The Surtsey eruption and related scientific work. Polar Rec. 13, 571–578. doi: 10.1017/S0032247400058113
Tréguer, P., Le Corre, P., and Courtot, P. (1976). Notes on techniques and methods for sea water analysis: dosage automatique des orthophosphates dans l“eau de mer utilisation de l”AutoAnalyzer (R) II. J. Mar. Sci. 36, 289–294. doi: 10.1093/icesjms/36.3.289
Tréguer, P., Nelson, D. M., Van Bennekom, A. J., Demaster, D. J., Leynaert, A., and Quéguiner, B. (1995). The silica balance in the world ocean: a reestimate. Science 268, 375–379. doi: 10.1126/science.268.5209.375
Tréguer, P. J., and La Rocha, D. C. L. (2013). The world ocean silica cycle. Annu. Rev. Mar. Sci. 5, 477–501. doi: 10.1146/annurev-marine-121211-172346
Tunnicliffe, V., Botros, M., De Burgh, M. E., Dinet, A., Johnson, H. P., Juniper, S. K., et al. (1986). Hydrothermal vents of explorer ridge, northeast Pacific. Deep Sea Res. Part A Oceanogr. Res. Pap. 33, 401–412. doi: 10.1016/0198-0149(86)90100-90107
Keywords: hydrothermal vents, Tagoro submarine volcano, inorganic nutrients, Canary Islands, nutrient fluxes
Citation: González-Vega A, Fraile-Nuez E, Santana-Casiano JM, González-Dávila M, Escánez-Pérez J, Gómez-Ballesteros M, Tello O and Arrieta JM (2020) Significant Release of Dissolved Inorganic Nutrients From the Shallow Submarine Volcano Tagoro (Canary Islands) Based on Seven-Year Monitoring. Front. Mar. Sci. 6:829. doi: 10.3389/fmars.2019.00829
Received: 16 October 2019; Accepted: 24 December 2019;
Published: 21 January 2020.
Edited by:
Johan Schijf, University of Maryland Center for Environmental Science (UMCES), United StatesReviewed by:
Wei-dong Zhai, Shandong University, ChinaThomas Browning, GEOMAR Helmholtz Centre for Ocean Research Kiel, Germany
Copyright © 2020 González-Vega, Fraile-Nuez, Santana-Casiano, González-Dávila, Escánez-Pérez, Gómez-Ballesteros, Tello and Arrieta. This is an open-access article distributed under the terms of the Creative Commons Attribution License (CC BY). The use, distribution or reproduction in other forums is permitted, provided the original author(s) and the copyright owner(s) are credited and that the original publication in this journal is cited, in accordance with accepted academic practice. No use, distribution or reproduction is permitted which does not comply with these terms.
*Correspondence: Eugenio Fraile-Nuez, eugenio.fraile@ieo.es