No Place Like Home? High Residency and Predictable Seasonal Movement of Whale Sharks Off Tanzania
 Christoph A. Rohner1*
  Jesse E. M. Cochran2
  E. Fernando Cagua2,3
  Clare E. M. Prebble1,4
  Stephanie K. Venables1,5
  Michael L. Berumen2
  Baraka L. Kuguru6
  Jason Rubens7,8
  Juerg M. Brunnschweiler9
  Simon J. Pierce1
- 1Marine Megafauna Foundation, Truckee, CA, United States
- 2Division of Biological and Environmental Science and Engineering, Red Sea Research Center, King Abdullah University of Science and Technology, Thuwal, Saudi Arabia
- 3Centre for Integrative Ecology, School of Biological Sciences, University of Canterbury, Christchurch, New Zealand
- 4National Oceanography Centre, University of Southampton, Southampton, United Kingdom
- 5Centre for Evolutionary Biology, School of Biological Sciences, The University of Western Australia, Crawley, WA, Australia
- 6Tanzania Fisheries Research Institute, Dar es Salaam, Tanzania
- 7Worldwide Fund for Nature (WWF) Tanzania Country Office, Dar es Salaam, Tanzania
- 8Sound Ocean Ltd, Dar es Salaam, Tanzania
- 9Independent Researcher, Zurich, Switzerland
Highly mobile marine megafauna species, while widely distributed and frequently threatened, often aggregate in distinct localized habitats. Implementation of local management initiatives within these hotspots is more achievable than developing effective conservation strategies that encompass their entire distributions. Such measures have the potential for disproportionate population-level benefits but rely on a detailed understanding of spatiotemporal habitat use. To that end, we examined the residency and small-scale habitat use of 51 whale sharks (Rhincodon typus) over 5 years at an aggregation site in Tanzania using passive acoustic telemetry. Whale sharks were highly resident within and across years, with a combined maximum residency index of 0.39. Although fewer sharks were detected from March to September, residency was high throughout the year. Ancillary photographic-identification data showed that individual residency persisted before and after tag attachment. Kernel utilization distributions (KUD) and movement networks both revealed the same spatiotemporal pattern of habitat use, with a small core habitat (50% KUD area for all sharks combined = 12.99 km2) that predictably changed on a seasonal basis. Activity spaces did not differ with time of day, sex, or size of the sharks, indicating a population-level pattern driven by prey availability. The small and predictable core habitat area at this site means that site-based management options to reduce shark injuries and mortality from boat strike and fishing gear entanglement can be spatially targeted for maximum effectiveness and compliance by human users.
Introduction
Large marine animals are often far-ranging, long-lived, and rare, making them difficult to observe on ecologically significant spatiotemporal scales. Even with a basic understanding of their movements, it can be challenging to effectively protect threatened marine megafauna over their vast, oceanic habitat (Game et al., 2009; Costa et al., 2012; Queiroz et al., 2019). Recently, increased tracking effort has revealed localized critical habitats for many of these species (Block et al., 2011; Costa et al., 2012; Hays et al., 2016). These hotspots can be vital to the ecology of marine megafauna as feeding grounds (Gill, 2002; Rohner et al., 2015a), breeding grounds (Cerchio et al., 1998; Marshall and Bennett, 2010), cleaning stations (O'Shea et al., 2010), or social gatherings (Lettevall et al., 2002; Perryman et al., 2019). However, individuals are often more vulnerable at aggregations (Williams et al., 2009), and threats specific to these areas can have a disproportionate effect on the survival of affected populations. Understanding animal movement and habitat use within aggregation areas is crucial for the effective protection of marine megafauna (Hays et al., 2016).
The whale shark, Rhincodon typus Smith 1828, is capable of directed movements spanning 1,000's of kilometers across open seas (Hueter et al., 2013; Hearn et al., 2016), but also aggregates predictably in several tropical and subtropical locations (Norman et al., 2017a). Most whale shark aggregations appear to be seasonal and are dominated by juveniles, with up to 420 individuals seen together (de la Parra Venegas et al., 2011; Norman et al., 2017a). Aggregations are often driven by dense prey patches that offer predictable and efficient feeding opportunities (Nelson and Eckert, 2007; Motta et al., 2010; Rohner et al., 2013, 2015a). Whale sharks are Endangered on the IUCN Red List of Threatened Species, with their main threats being direct harvesting, bycatch, and boat strike (Pierce and Norman, 2016). These threats can be amplified at aggregation sites if the spatial distribution of fishing/shipping efforts overlap the sharks' feeding aggregations (Pierce and Norman, 2016).
Mafia Island in Tanzania hosts a whale shark aggregation consisting largely of juvenile individuals attracted to the area by high prey availability (Rohner et al., 2015a,b), typical of most coastal feeding areas for whale sharks (Norman et al., 2017a). Photographic-identification (henceforth termed photo-ID) surveys over ~8 years (2012–2019) have identified ~200 individual sharks so far, making it a relatively small population at this site (Norman et al., 2017a). Unlike most other aggregations, however, whale sharks are unusually resident at Mafia Island. A previous acoustic telemetry study at Mafia Island showed that several individuals did not disperse widely after the main sighting season (October–February), but instead swam deeper and further from shore during the “off season” (Cagua et al., 2015). High levels of detections throughout the year revealed cryptic residency in whale sharks for the first time. Following that, a passive acoustic telemetry study at Ningaloo Reef in Australia also demonstrated that whale sharks were present throughout the year, contradicting the results of visual surveys (Norman et al., 2017b). Biochemical results of whale sharks sampled in the western Indian Ocean showed limited latitudinal ranging, suggesting that they feed within a relatively small area surrounding their respective aggregation sites (Prebble et al., 2018). Whale sharks tracked with visual surveys and passive acoustic and satellite telemetry in the Red Sea left their seasonal aggregation site, but many returned in subsequent years (Cochran et al., 2019). Thus, whale sharks appear to return to the same aggregation site and have a higher residency in some aggregations than previously assumed, although residency levels vary among sites.
Although whale sharks are legally protected in Tanzania some incidental fisheries catches have been reported in the country. Observational evidence of frequent scars and injuries on whale sharks at Mafia Island indicate that boat strike and conflict with fishers are likely to be the main local threats (Authors pers. obs.). The impact of these pressures is likely intensified by the sharks' high residency, as whale sharks here are almost continuously exposed to local threats. In the present study, we build on the earlier work at Mafia Island and expand the passive acoustic and photo-ID surveys from 2 years to 5, and more than double the tagging effort (from 30 to 67 tags). Some sharks were re-tagged after tag loss and overall we monitored the movements of 51 individual sharks, which equates to ~25% of the estimated population at this site. The extensive dataset allowed us to examine population-level movement patterns. First, we assess individual shark residency over an extended time period. Second, we are now able to examine the whale sharks' mesoscale habitat use, and how it changes through the year using kernel utilization distributions and movement network analyses. Third, to better understand fine-scale connectivity within the broader aggregation site, we use a network approach to characterize the sharks' movements between our acoustic monitoring stations, which enabled us to explore the relationship between various network metrics and ecological aspects of the population. Based on our results, we propose simple and enforceable spatial management measures for protecting local whale sharks, preserving the aggregation, and sustaining the local whale shark tourism industry.
Materials and Methods
Whale Shark Surveys
We visually searched for whale sharks in Kilindoni Bay, Mafia Island, Tanzania (7.92°S, 39.65°E) on each of 318 boat-based surveys from 2012–2017. Kilindoni Bay lies off the inshore western side of Mafia Island, ~20 km east of the Rufiji River Delta (Figure 1). The bay is shallow (<30 m depth) with predominantly sandy substrate and a wide, mangrove-lined intertidal zone. For further descriptions of the study site and regional overview maps, please refer to Rohner et al. (2015a). Survey paths varied daily and were chosen to maximize whale shark sightings, based on sightings in previous days, information from fishers, and local knowledge of the captain and researchers. We collected photo-ID data during visual surveys to assess when individual whale sharks were present before and after their acoustic tag was attached. Visual surveys were limited to the Oct–Feb period when whale sharks are regularly seen feeding at the surface in the bay [“sighting season” henceforth; Rohner et al. (2015a)]. When a whale shark was spotted, its location was recorded with a handheld GPS unit. We then photographed the shark in-water and used the global whale shark database www.whaleshark.org to re-identify an existing individual or add a new shark to the database based on its spot pattern (Arzoumanian et al., 2005). Any encountered whale sharks that could not be photographed were not included in this study. Photo-ID encounter data from public submissions (~9% of total) were also included in this study. Sex and maturity were assigned based on the presence and calcification of claspers in males, and the absence of claspers in females. Total length (TL) for each shark was estimated visually or via laser photogrammetry (Rohner et al., 2011) and binned into 50 cm increments.
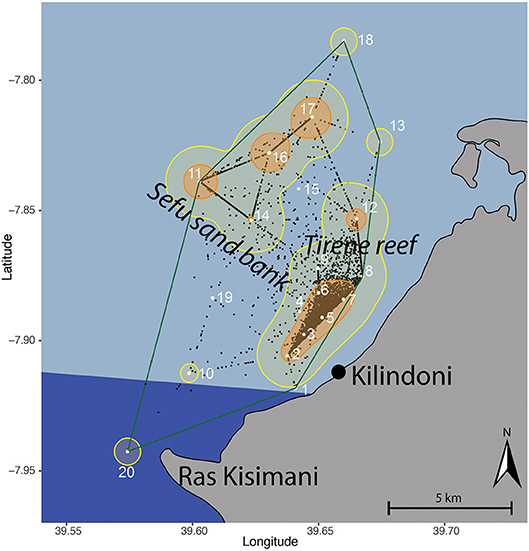
Figure 1. Kernel utilization distribution map of all tagged whale sharks combined based on centers of activity (black dots), with the location of acoustic stations (white dots and numbers) in Kilindoni Bay, Mafia Island, the minimum convex polygon (green), extent (95%; yellow), and core (50%; orange) home ranges. The marine park area is indicated in dark blue.
Receivers and Tags
We deployed acoustic receivers (Vemco, VR2W) at 20 stations in Kilindoni Bay during Oct–Nov 2012 (Figure 1). Receivers were spread over a 105.8 km2 area, with the farthest stations (18 and 20) being 19.9 km apart and stations 1 (closest inshore) and 11 (farthest offshore) being 9.7 km apart. Station locations were chosen to best cover the area in which whale shark sightings were reported by local boat captains. Receivers were attached to a ~1.5 m rebar metal pole embedded in a concrete foot and were placed on the sandy substrate in 5–30 m depth. We retrieved, downloaded and re-deployed receivers regularly. A range test estimated the average detection radius at 340 ± 30 m (Cagua et al., 2015). Several receivers were lost or damaged over the course of the 5-year study (Table 1). Deployment duration was calculated as the number of days between the first and last detection per station, due to data loss from damaged receivers.
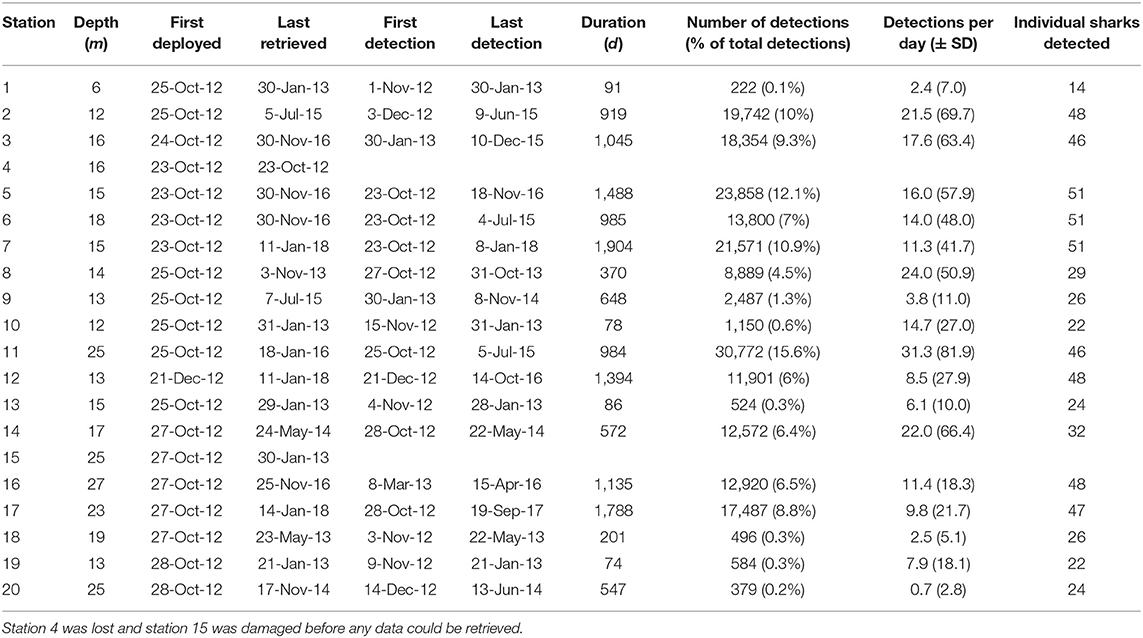
Table 1. Station information for the acoustic receiver array off Mafia Island, Tanzania, with depth, dates of deployment and retrieval, dates of the first and last tag detection, the duration of coverage per station, the total number of detections, the percentage of detections, per station, the mean number of detections per day of coverage, and the number of individual sharks detected.
We deployed 67 acoustic tags (Vemco, V16, 69 kHz), with 30 tags deployed between Oct–Dec 2012, seven tags deployed between Jan–Feb 2014, and 30 tags deployed in Dec 2014 (Table 2). All tagged sharks were photo-identified at the time of tagging to track tag loss over the course of the study. The first tag of shark TZ-003 tagged in October 2012 was never detected and was excluded from the analysis. This shark was retagged in December of the same year. Fourteen other sharks were re-tagged in 2014 after they had shed their tags from the 2012 deployment. One shark (TZ-040) was tagged a third time after shedding the second tag. This resulted in 51 individual sharks tagged over the course of the study. We tagged more males (n = 41) than females (n = 10), which reflects the male bias (87.5%) in the local whale shark population (Rohner et al., 2015b). Tagged sharks ranged in length from 4–9 m with a median of 6 m (mean ± SD = 5.99 ± 1.08 m). Most tags were connected to a stainless-steel anchor via an ~18 cm long tether made from Dyneema braid, although for the first few tags (deployed in 2012) we used stainless steel line. The anchor and most of the tether were embedded in the shark's skin on the flank beneath the 1st dorsal fin using a Hawaiian-sling pole spear. Minimum tag retention time was calculated as the duration (days) from tag deployment to its last recorded transmission. A single tag stayed attached to one shark (TZ-017) for longer than its calculated retention time, as evidenced by in-water encounters, but had ceased transmissions, presumably because the battery had drained.
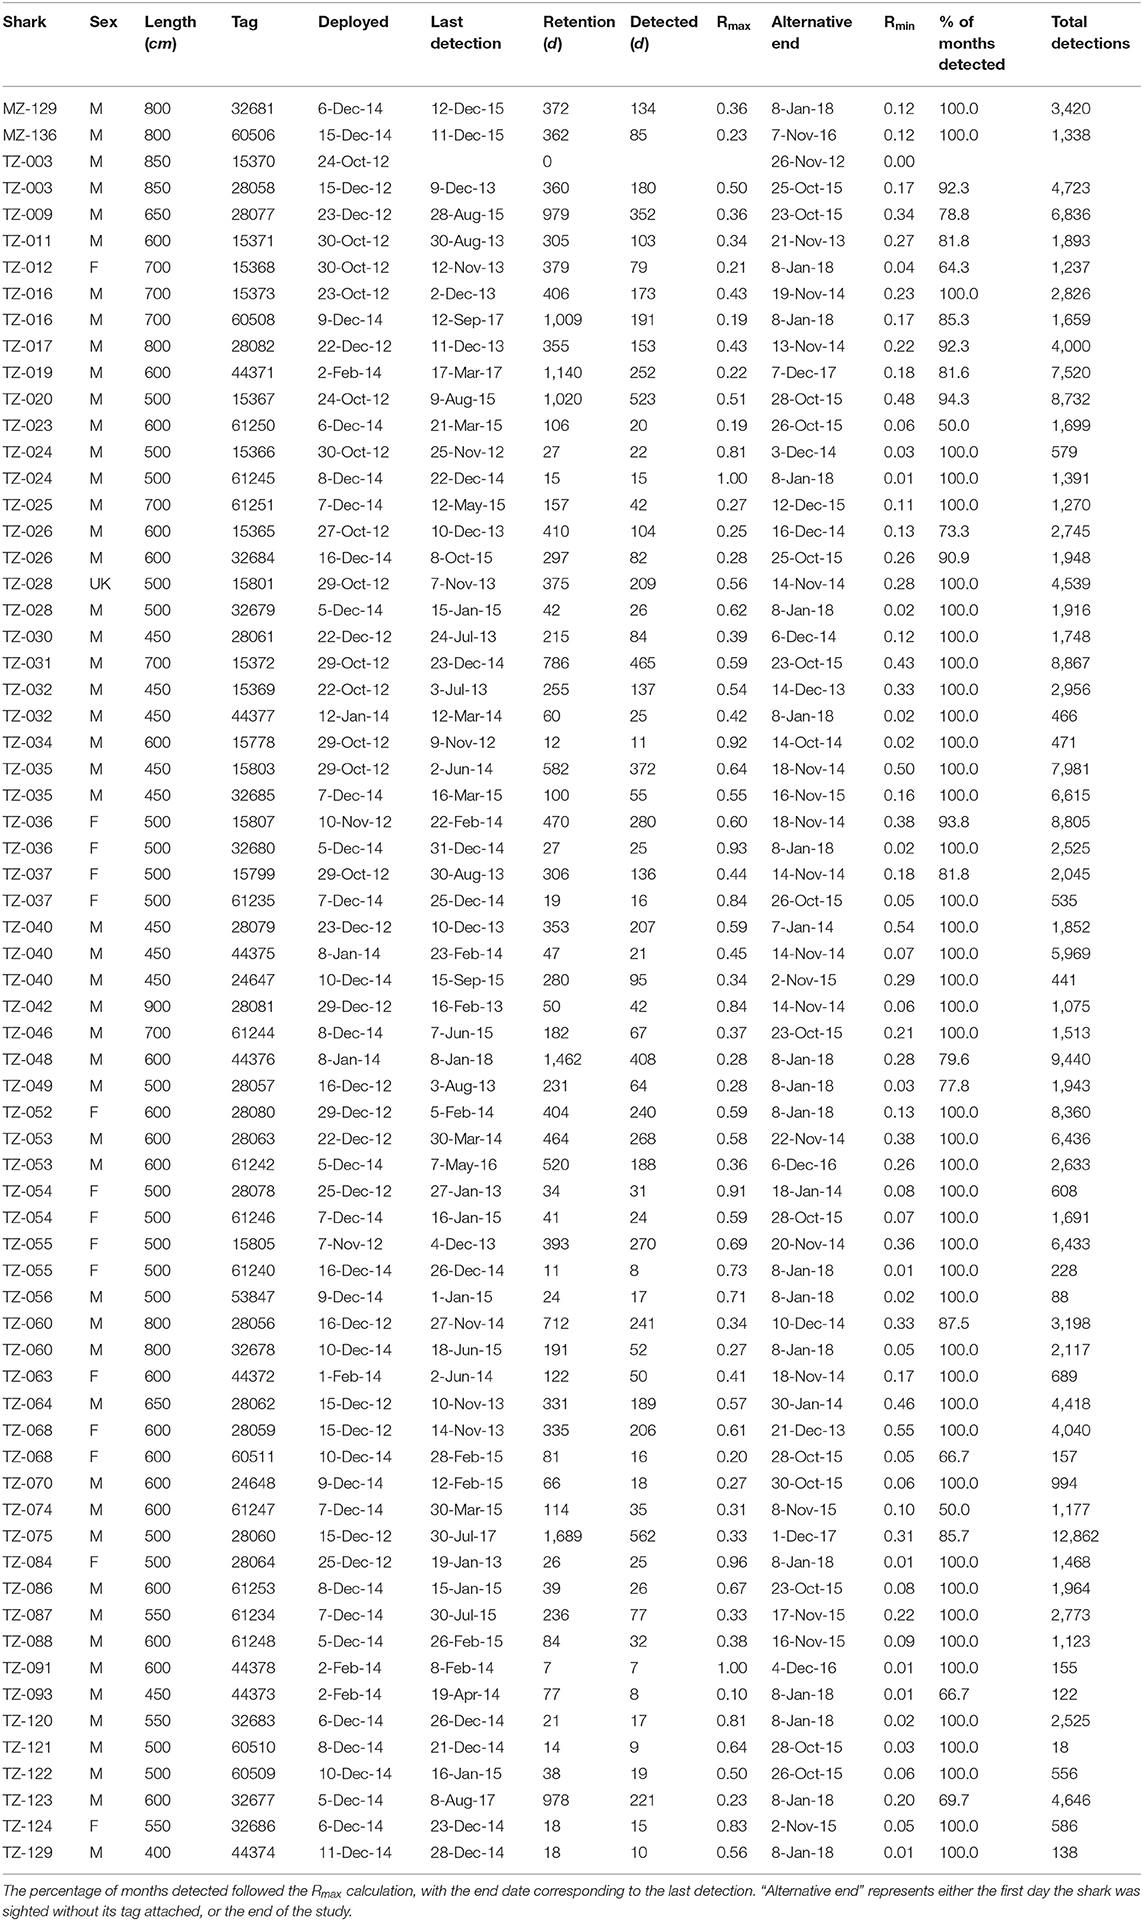
Table 2. Overview table of tagged whale sharks, with the tag deployment and last detection dates, tag retention, the two residency indices, and the total number of detections per tag.
Acoustic Analysis
Acoustic data were combined into one dataset in the Vemco User Environment (VUE) software and all further analyses were conducted in R Version 1.1.423 (R Core Team, 2008). To investigate diel changes in activity, timestamps were converted to local time and day and night periods calculated using the suncalc package (Agafonkin and Thieurmel, 2018). We summed the straight-line distances between detections and calculated the rate of movement (ROM) in km day−1 to quantify how far whale sharks moved within the array.
Residency
We calculated two residency indices reflecting the maximum (Rmax) and minimum (Rmin) residency behavior supported by the detection data (Cochran et al., 2019). The maximum residency index was the proportion of days a shark was detected at least once, divided by the deployment duration from tag deployment to last detection. The minimum residency index was the proportion of days a shark was detected, divided by the number of days between tag deployment and the first day the shark was resighted in-water without the tag, or the end of the study (8 Jan 2018). Over the course of the study 49 tags (73.1%) were shed and the sharks resighted without tags and Rmin calculations accounted for these known tag losses. Earlier studies (Cagua et al., 2015; Cochran et al., 2019) handled tag losses by ending the deployment period for affected animals at the last recorded detection before each shark was resighted without its tag. This method produced corrected Rmin values that were similar or even identical to the Rmax, limiting the value of comparing the two metrics. In the present study, we have slightly altered the tag-loss correction by setting the end of deployment to the date that a given shark was first resighted without its tag. This ensured that Rmin remained a strict minimum estimate of animal residency. In addition to fine scale residency calculations, we also calculated residency on a monthly scale to investigate if sharks moved away from the array for long periods. This coarser residency was based on the Rmax when binned by month. Residency indices were calculated for individual sharks and also expressed collectively, as a combined index in which the sum of all shark detection days was divided by the sum of all deployment days and as a mean index in which the residency values from all tagged sharks were averaged.
Habitat Use
To examine habitat use of whale sharks we first calculated centers of activity (COA) from the presence/absence data provided by the acoustic receivers. These COA are position estimates based on weighted means of the number of detections at stations over a time period. They can thus be spread across the array, estimating the location of animal activity at a continuous spatial scale rather than being restricted to receiver locations only (Simpfendorfer et al., 2002). We calculated COA for each shark based on their estimated location once per six hours. To assess the time step, we mapped COA for different times (30, 60, 120, 240, 360, 720 min) and visually inspected their spread. Centers of activity should fill the spatial gaps between stations, while keeping the time step to a minimum (Figure 1). To quantify the habitat-use area and activity spaces we first calculated minimum convex polygons (MCPs) in the adehabitatHR package (Calenge, 2006) to assess the extent of their range. We then calculated fixed kernel utilization distributions (KUD) to quantify the space use within their home range. We used the href smoothing parameter in the kernel density estimations of the sharks' 50% (core) and 95% (extent) utilization distribution. We calculated activity spaces (a) for all sharks combined over the entire study period, (b) for individual sharks, and also (c) grouped detections by month to investigate temporal changes in their habitat use.
Movement Networks
We used movement networks to further explore the space-use of whale sharks within the acoustic array. Movement networks offer a complementary approach to more commonly reported habitat use metrics by identifying central areas that are important for the connectivity within a habitat and revealing regular pathways between hotspots (Jacoby and Freeman, 2016). We constructed networks and graphed them spatially with the igraph package (Csardi and Nepusz, 2006), where nodes represent acoustic stations and edges represent movement paths between two stations. Movements from one node back to the same node were removed and square matrices were used to create directed and weighted networks. Nodes were weighted using the number of detections per station. Edges were weighted by the number of movements that occurred between nodes. We identified communities (groups of stations) from the overall network using several community detection algorithms [i.e., Betweeness, Label-Propagation, Fast-Greedy, Walk-Trap, Spin-Glass, Leading-Eigenvector, Multilevel, see Finn et al. (2014) for more detail] and used modularity to evaluate their quality.
We constructed a movement network for all sharks combined to compare with the KUD output for the overall hotspots of activity. We used three measures of centrality (node strength, eigenvector centrality, and closeness) to identify critical nodes, analogous to the core habitat areas defined by the KUD analysis (Lédée et al., 2015). Node strength is the sum of incoming and outgoing movements, for which a high value indicates a heavily used area. A high eigenvector centrality score means that a station had a high node strength and was connected to other stations with similarly high node strength values (Bodin et al., 2011). Closeness is the smallest number of edges required to link nodes, where a high value indicates that the station is close to the center of the network.
To compare temporal changes in habitat use we constructed a movement network for each month of the year, with all sharks combined, and assessed network metric means by season (in-season Oct–Feb; off-season Mar–Sep). Group comparisons were calculated with ANOVAs. Each comparison included a suite of network metrics: we counted the number of nodes and the total number of paths (total weight of edges) present in each network (Heupel et al., 2018). Edge density described the proportion of observed paths to the total number of paths available in the network (Wasserman and Faust, 1994). A low edge density means only a portion of the acoustic array was used by that shark. Reciprocity was the proportion of reciprocated ties, with a high value indicating that many of the movements were made in both directions. The degree was the number of edges connecting a node, and we took the mean of the degrees of all stations to compare networks, with a higher degree indicating a more connected network. The clustering coefficient was a measure of how connected parts of the acoustic array were to other well-connected areas. Network diameter was the longest minimum distance within the network, with a shorter diameter indicating faster movement through the network (Minor and Urban, 2008). Average path length (APL) was a measure of how fast and direct individuals moved within a network, with a short APL indicating rapid, direct movements (Mourier et al., 2019). We also constructed a movement network for each individual shark and took the means of these same network metrics to assess differences by sex (male; female) or size class (small <8 m; large ≥8 m TL).
Results
Tags and Receivers
The array recorded 197,708 detections from the 51 tagged sharks between 2012 and 2018. Receivers varied in deployment duration, activity, and the number of unique sharks detected (Table 1). Station 11 at the offshore tip of Sefu sandbank (Figure 1) had the highest total number of detections (~31,000) and also the highest number of detections per day (mean ± SD = 31.3 ± 81.9). Nearby station 14 at the edge of Sefu sandbank had 22 detections per day (± 66.4), but a smaller total number of detections, partially due to a shorter (<2 years) deployment duration. Inshore stations 2, 3, and 5 had high numbers of total detections and detections per day. Inshore stations also generally detected most of the tagged individual sharks, with stations 5, 6, and 7 detecting all 51 tagged sharks. Stations 18 and 20, at the north-eastern and south-western edges of our array, detected about half of all tagged sharks and had the lowest numbers of daily detections within the array (Table 1).
The 67 tags stayed attached to the sharks for a mean of 307 days (± 362), ranging from 0 for the first tag on shark TZ-003 to 1,689 days, or ~4.5 years, for TZ-075 (Table 2). Shark TZ-035 was detected the most, with 14,590 detections in total and 21.4 detections per day. The sharks with the lowest number of detections all had short tag retention times rather than any obvious differences in residency patterns.
Residency
Tagged whale sharks showed a high degree of residency to Kilindoni Bay. The percentage of tagged sharks that were detected at least once per month, based on the Rmax, exceeded 67% over the three consecutive years in which >5 sharks still had tags attached (Figure 2A). When only fewer than 5 sharks were tagged at the end of the study, that percentage remained high during the sighting season, but decreased in the off season (Figure 2A). The monthly mean percentage of tagged sharks in the array was highest during the sighting season, with 100% of sharks detected in October and November and 99% in December and dipped to a minimum of 58% in June (Figure 2B). Individual sharks were detected in the array at least once per month for between 50–100% of months (mean = 89.6%) while a functional tag was attached (deployment to last detection, as per Rmax; Table 2). That percentage was highest for tags with short deployment periods, but even sharks tagged for >3 years were detected in 80–86% of months (Table 2).
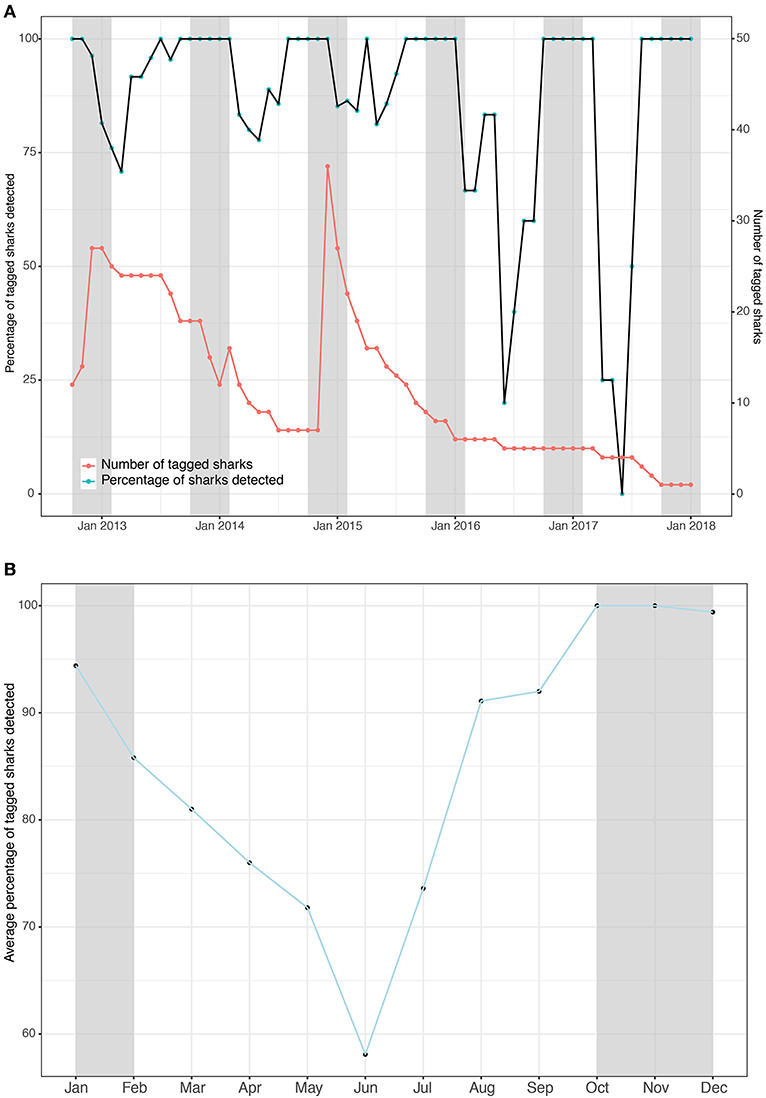
Figure 2. The number of whale sharks with tags attached (red) and the percentage of tagged sharks that were detected in the array (black) binned by month as a timeseries (A) and the means of that percentage per month as a composite (B). Gray shading indicates the whale shark sighting season.
At a higher, daily, temporal resolution, the overall residency index Rmax for all sharks combined was 0.39. Individually, Rmax ranged from 0.10 (TZ-093) to 1.0 (TZ-024 and TZ-091), with a mean of 0.5 ± 0.23 (Table 2). The more conservative Rmin for all sharks combined was 0.15. Individually, Rmin ranged from 0.06 (TZ-093) to 0.55 (TZ-068), with a mean of 0.17 ± 0.15. Thirty-three sharks were detected on more than half of the days of their possible detection period (Rmax > 0.5), including some of the longer deployments such as TZ-020 that was detected on 523 of 1,020 days (Table 2).
Tagged whale sharks stayed in the array for up to 60 consecutive days. Photo-ID data showed that many whale sharks continued to remain resident to Kilindoni Bay after their tag had detached (Figure 3). For example, two sharks tagged in 2012 were encountered every year after tag loss (TZ-011: 2013–2017 and TZ-064: 2014-2017). Some sharks were photographically identified before and after tag attachment, for example TZ-086 and TZ-087 were photographed in all six years, despite shorter periods of tag retention (Figure 3). From a total of 107 occasions when a tagged shark was detected during a sighting season, only five sharks were detected by the acoustic array in a given sighting season without also being photographically identified.
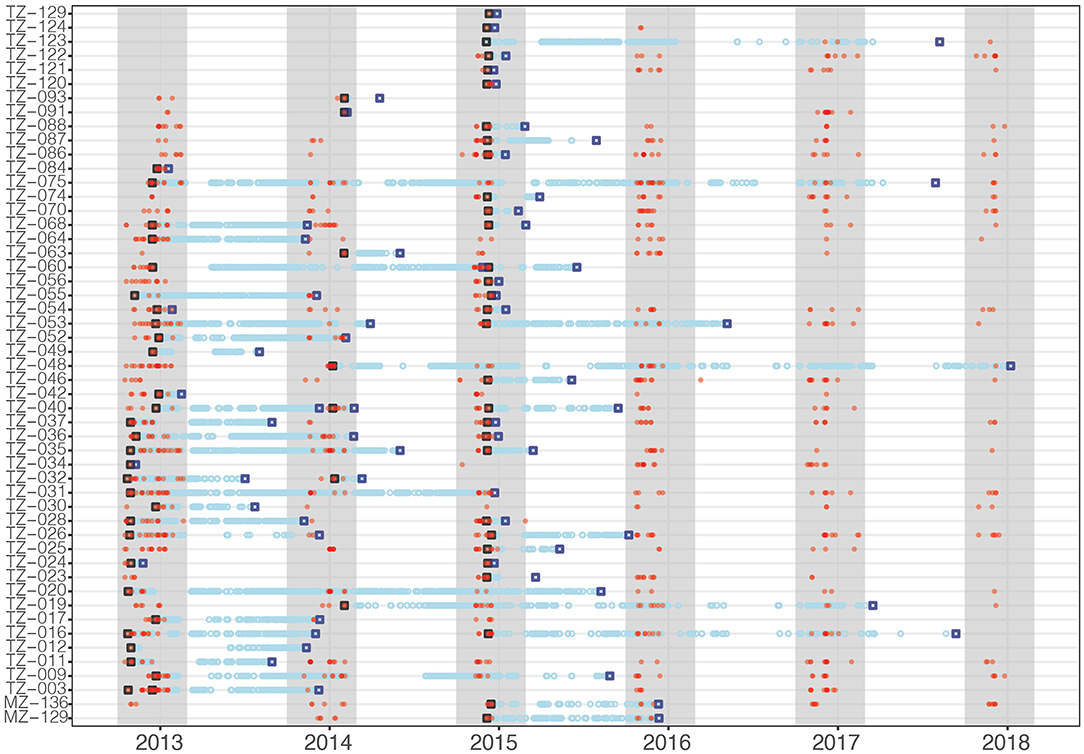
Figure 3. Acoustic tag deployment (black open square), detections (blue circles), last detection (blue open square), and photographic identification encounters (red dots) for all tagged whale sharks. Gray shading indicates the whale shark sighting season.
Spatial Patterns
Individual whale sharks swam up to ~4,000 km within the array, with a mean sum of the distances between consecutive detections of 1,238 ± 1,175 km. Total distance covered within the array correlated strongly with the number of days a shark was detected (linear regression R2 = 0.93). The daily distance covered within the array, or the rate of movement (ROM), was less variable with a mean of 8.9 ± 3.1 km.
Kernel utilization distributions (KUDs) of all tagged whale sharks combined showed that whale sharks used the array extensively (Figure 1). The 95% extent home range was 64.3 km2 and encompassed all stations except stations 1 and 19, which were only deployed for 2.5 and 3 months, respectively. The core habitat (50% KUD) was small at 12.99 km2 and was split between a large cluster around inshore stations 2–7 and around offshore stations 11, 16, and 17. These two activity hotspots differed in depth, with the inshore hotspot being shallower (15.2 ± 2.17 m) than the offshore hotspot (25 ± 2 m; t = −6.49, p = 0.002). There were also two additional, smaller hotspots at stations 12 and 14. All core habitat areas were in the center of the array, with stations in the north-east and south-west less frequented. The southern part of the bay that is encompassed within Mafia Island Marine Park was not identified as a core habitat, and only had a small area of extent home range around station 20 (Figure 1).
Individual whale sharks in Kilindoni Bay had a mean minimum convex polygon (MCP) area of 65.6 km2 (± 28.0, range = 13.6–105.8 km2). Extent (95%) home ranges were larger than the MCPs (mean ± SD = 103.2 ± 28.8 km2). Core (50%) home ranges were small, ranging from 6.4 to 47.9 km2 (mean ± SD = 23.4 ± 8.5 km2). The extent home range typically included the closest inshore stations and offshore stations in one area, but the 50% KUDs of the core home range never overlapped between these offshore and inshore hotspots.
Habitat use changed seasonally, with sharks shifting their core habitat use area from inshore during the sighting season (Oct–Feb) to offshore during Mar–Sep (Figure 4). The core habitat was split between offshore and inshore locations during the transition periods between the seasons (Oct, Nov and Mar), and the 50% KUD areas were at their largest as a result, at 19.9, 16.3, and 11.9 km2, respectively, compared to a mean of 8.8 km−2 in other months (range = 5.8–11.0 km2).
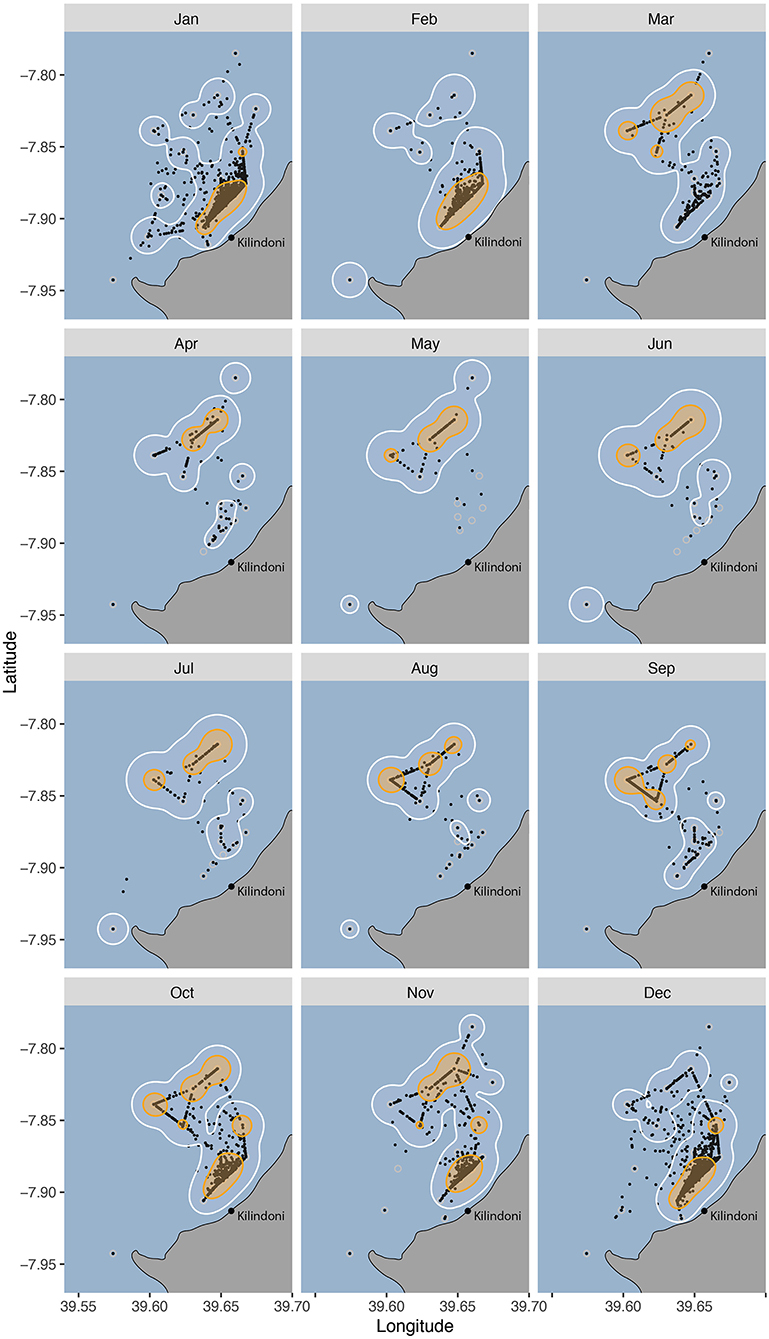
Figure 4. Habitat use of all tagged whale sharks between 2012–2018 grouped by month, with 50% (orange) and 95% (white) kernel utilization distributions (KUDs), and the centers of activity (COA, black dots).
Detections were relatively consistent throughout the day and night, with a slight increase in detections during the day (58%). Individually, most stations recorded between 42–65% of detections during the day, with stations 1 and 2 in very shallow water having more day-time detections (90 and 74%) and stations 10 and 19 having few day-time detections (29 and 40%), but also a low total number of overall detections (1,150 and 584, respectively). All sharks were recorded during both the night and the day. The KUD areas were similar in size and pattern for day (50% = 15.3 km2, 95% = 69.5 km2) and night (14.8 km2, 73.7 km2).
Movement Networks
The Walk-Trap algorithm had the best support for detecting communities among the nodes, resulting in three communities and a modularity of 0.297. The grouping made ecological sense, with the first group reflecting offshore stations in deeper water (11, 13, 14, 16, 17, 18, and 20), the second group reflecting inshore stations in shallower water (1, 2, 3, 5, 6, and 7), and the third group reflecting intermediary stations (8, 9, 10, 12, 19; Figure 5).
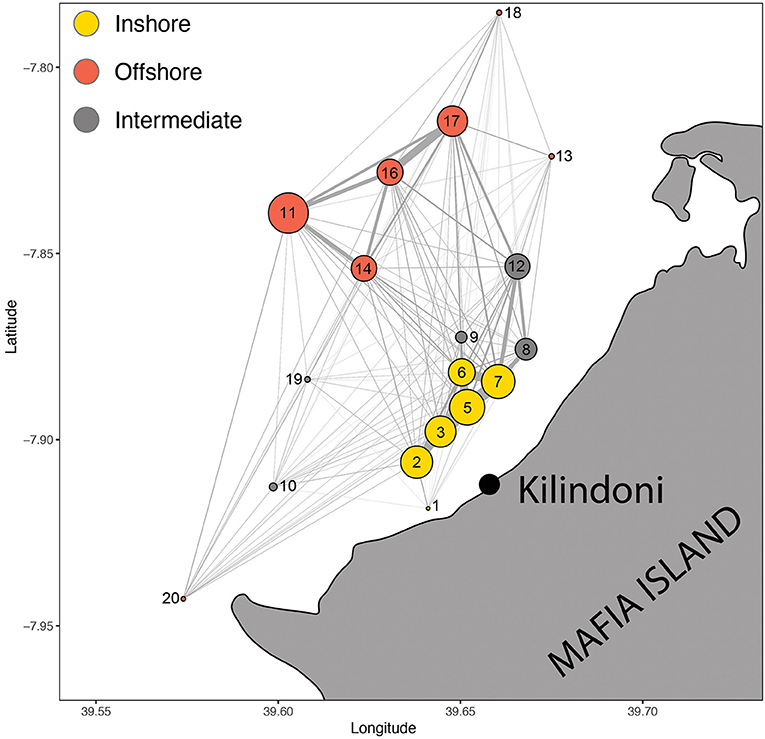
Figure 5. Spatial movement network of all sharks combined, with circles representing acoustic stations (nodes) and lines representing movements between nodes (edges). Node size is proportional to the number of detections and edge width is proportional to the number of movements. Colors represent the three communities of nodes.
The overall spatial movement network with all sharks combined showed the nodes (acoustic stations) and edges (movements between nodes), highlighting the most important edges in the array (Figure 5). These strongest edges were mostly inshore among stations 2, 3, 5, 6, and 7, and offshore among stations 11, 14, 16, and 17. Station 7 also linked strongly with nearby stations 8 and 12, but these grouped separately with the intermediate stations in the community analysis. Edges linking offshore and inshore hotspots were weaker than edges within the hotspots, with the strongest link in the eastern bay between stations 17 and 7.
Eight stations ranked in the top 10 for all three centrality metrics, indicating highly used areas in the array. These corresponded well to the core habitat areas from the KUD analysis, with stations 2, 5, 6, 7, 11, 12, and 17 directly overlapping and station 8 included in the centrality metrics but not in the KUD core habitat. The centrality metrics included node strength, eigenvector centrality and closeness. Node strength (sum of incoming and outgoing movements) had a wide range from 104 to 8,398 (mean ± SD = 2,734 ± 2550.9; Table 3). Six stations had a node strength of <300, indicating infrequently visited stations, while 10 nodes had a node strength of >2,040. Eigenvector centrality ranged from 0.4 to 1, with the 10 most central nodes in the network having a value of >0.9. Closeness was high throughout, ranging from 0.043 to 0.059, with the top 10 nodes having a value of >0.056 (Table 3).
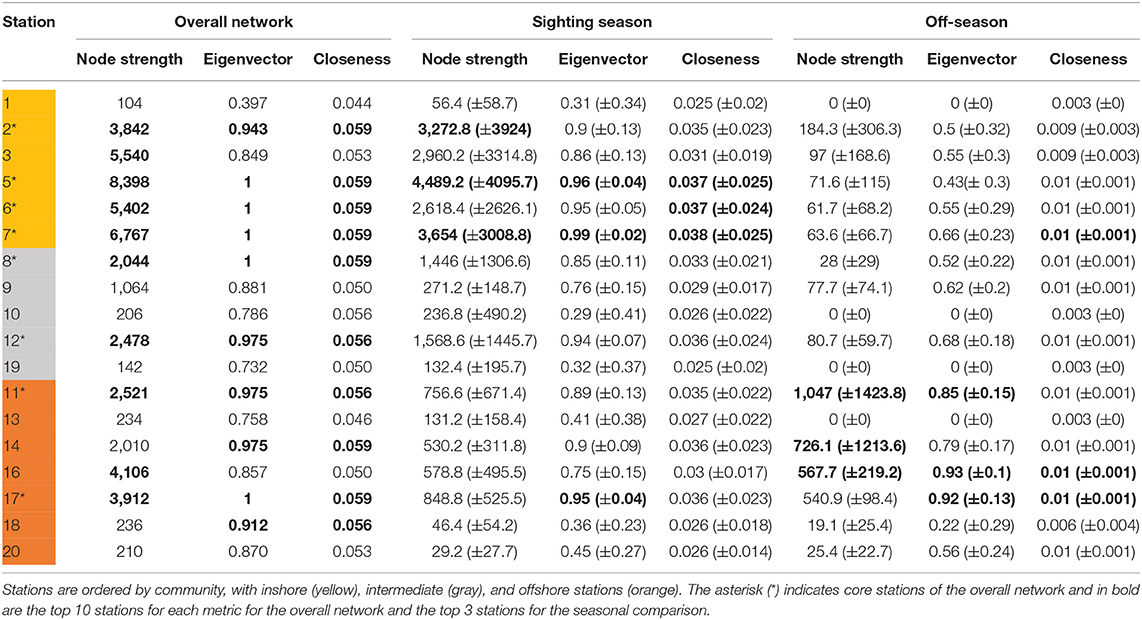
Table 3. Centrality metrics scores for acoustic stations in the overall movement network combining all whale sharks, and monthly networks in the comparison between sighting season (Oct–Feb) and the off-season (Mar–Sep) with means (±SD).
Many overall network characteristics differed between monthly networks during the sighting season (Oct–Feb) compared to during the off-season (Mar–Sep; Table 4). Whale sharks used more of the habitat covered by the array (i.e., a higher edge density) and swam more within the array (i.e., total weight of edges) in the sighting season compared to the off-season (Table 4). Movements between nodes were undertaken in both directions more often (i.e., higher reciprocity) and the network was more connected (i.e., higher degree) in the sighting season (Table 4). However, different sections of the acoustic array were similarly connected (i.e., mean of clustering coefficient) in both seasons, and network diameter and average path lengths were short in both seasons and did not differ, indicating fast dispersal within the array (Table 4). Centrality metrics (node strength, eigenvector centrality, and closeness) measured for each node also showed differences between the sighting season and the off-season. During the sighting season, inshore stations had the highest centrality scores, with stations 5 and 7 topping each metric (Table 3). Centrality scores were lower during the off-season, during which offshore stations had the highest values, with stations 11, 16, and 17 in the top 4 stations (Table 3). These network characteristics did not vary between males and females, nor between small (<8 m TL) and large (≥8 m TL) sharks (ANOVA p > 0.05 for all parameter comparisons).
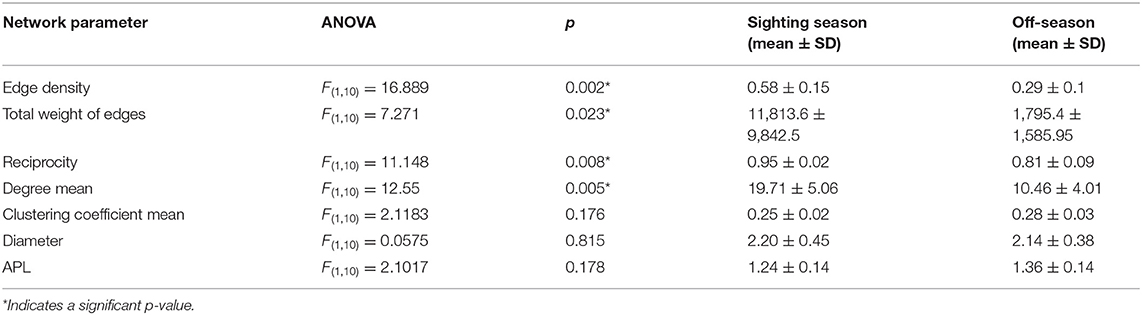
Table 4. Movement network characteristics for networks in the sighting season and the off-season, with ANOVA results, means, and standard deviations.
Discussion
Individual whale sharks were highly resident to Kilindoni Bay at Mafia Island over several years. As a whole, the core shark activity space was small and shifted on a predictable, seasonal basis within the bay. Sharks were highly mobile within these seasonal activity hotspots, while movements connecting hotspots were rarer and occurred mostly in the north-east of the bay. The high proportion of time spent in the bay, and the extensive movements within their core habitat area, demonstrate that whale sharks are potentially exposed to localized human threats and pressures over extended time periods. However, the small size of their core habitat areas and the predictability of their occurrence means that local conservation management of these areas is both highly achievable, in terms of spatial scope, and likely to be effective in reducing pressures on whale sharks, if implemented.
Long-Term Site Residency
Tagged whale sharks spent much of their time within the acoustic array off Kilindoni Bay. The total of 197,708 detections made by the 51 sharks over the 5 years was ~5 times more than that recorded in the Red Sea, which had more receivers, more tags and a similar study period (Cochran et al., 2019). The combined residency index Rmax was 0.39, meaning that whale sharks were detected on 39% of days while they were tagged over time periods extending to several years. Residency is often assessed from modeling sighting data and output as the number of days sharks were present per season or per year. As a rough comparison, an Rmax of 0.39 equates to 142 days per year. This is much higher than the longest residency reported to date for whale sharks, 50 days (McCoy et al., 2018), based on modeled sighting data. It is of course possible that whale sharks are also more resident than currently known in other aggregation areas, and that such cryptic residency is best revealed through sightings-independent methods (Cagua et al., 2015; Norman et al., 2017b). Passive acoustic telemetry of whale sharks at Ningaloo Reef found a combined Rmax of 0.16 (mean = 0.18; Norman et al., 2017b), less than half of what we found at Mafia Island. In the Red Sea, the mean Rmax was 0.26 (Cochran et al., 2019), also much lower than at Mafia Island, and again underlining the unusually high residency at our study site. However, the example from Ningaloo Reef also corroborates that sightings-independent methods can reveal a higher residency than expected from visual surveys. On the other hand, satellite-tagged juvenile (Araujo et al., 2018; Diamant et al., 2018) and juvenile and/or adult whale sharks (Hueter et al., 2013; Hearn et al., 2016; Ramírez-Macías et al., 2017) have demonstrated extensive movements away from aggregation sites, so a combination of approaches is required for a robust assessment of movement ecology.
High site fidelity has been noted from other whale shark aggregation hotspots, and individual sharks often return to particular sites on a seasonal basis (Norman et al., 2017a). However, long-term residency on a small geographical scale, as we describe here for Mafia Island, remains unique. Year-round residency of whale sharks at Mafia Island was first reported by Cagua et al. (2015). Building on these findings, we show that high residency continued over an extended timeframe, possibly exceeding 4.5 years. We also demonstrate that this pattern holds at a population level, with almost 25% of all photographically identified whale sharks from Mafia Island (n = 207) tagged over the course of this study. Photo-ID data further emphasized their long-term residency, with many individuals sighted before and after the period during which acoustic tags were attached. There was, however, some individual variation in shark residency patterns. Eight sharks were detected on <25% of possible days within the array, but importantly their visitations occurred over the whole calendar year. For example, TZ-016 and TZ-019 were both tagged for over 1,000 days and had a comparatively low Rmax, 0.19 and 0.22, respectively, but were detected in 85 and 82% of months spanning both the sighting- and off-seasons. Based on the Rmax of tag retention, sharks were available for possible detection over a combined total of 738 months and were detected in 661 or 90% of those months. This indicates that whale sharks probably do not move far from the array in Killindoni Bay when they are not detected for short periods. There was a seasonal pattern in residency, with whale sharks spending less time in the array during the off-season from Mar–Sep, but this trend was much weaker than that observed from sighting data (Cagua et al., 2015), and whale sharks were detected at high levels throughout the year. With regards to photo-ID data, however, it is important to reiterate that dedicated visual survey trips—from which ~91% of photo-ID sightings were obtained—only occurred during the sighting season.
Whale sharks were detected with similar frequency during the day and the night, with a weak trend toward more detections during the day. A range test at this site (Cagua et al., 2015) similarly did not find any diel changes in the detection range. Diel patterns appear to be location-specific as whale sharks display differences in habitat use during the day and the night at other aggregation sites, either by diving deeper at night (Robinson et al., 2017; Araujo et al., 2018) or deeper during the day (Ramírez-Macías et al., 2017). Manta rays also display diel differences in habitat use (Dewar et al., 2008; Couturier et al., 2018). The lack of a clear diurnal effect for whale sharks at Mafia Island suggests that their prey might be available reliably through the daily cycle, or the sharks are inclined to conserve energy by staying close to recently productive areas.
Small-Scale Habitat Use and Seasonal Movements
Whale sharks used the entire acoustic array in Kilindoni Bay, with all stations recording detections. The central part of the array was the most heavily used area overall and corresponded with our usual boat-based visual search area (Rohner et al., 2015a). Stations in the south-west of the bay were the least visited, yet this is the only part of our study area that is encompassed within the boundary of Mafia Island Marine Park. Park boundaries were established before the presence of whale sharks in Kilindoni Bay was widely known and were primarily designed to protect coral reef habitats rather than megafauna. North-eastern stations were also not frequently visited, indicating that our array covered whale shark activity space well along the north-east to south-west axis. However, central stations in the north-western extreme of our array furthest from shore were extensively visited. This hotspot at the edge of our array suggests that whale sharks likely also use habitat further offshore than our array could detect. Further research is required to assess habitat use of whale sharks outside Kilindoni Bay.
The overall core home range of whale sharks (50% KUD) was small (mean ~23 km2), less than half of the minimum convex polygon, and only a quarter of the extent home range (95% KUD), demonstrating that certain areas of Kilindoni Bay were used more than others. The two main hotspots of activity were in shallow water (~15 m deep), close to shore, and in deeper water (~25 m deep) offshore, respectively, in the central region of Kilindoni Bay. The movement network community analysis found the same grouping of an offshore and an inshore hotspot, with less-visited intermediary stations. Movement network centrality metrics also identified largely the same stations as core habitat as found by the KUD analysis. There were strong connections within each hotspot, and weak movement links among them. These patterns of habitat use were similar for all individuals irrespective of sex or size, suggesting that these core home ranges reflect clear preferences on a population level. Activity hotspots within a feeding area for whale sharks have not been assessed elsewhere on such a small scale.
The sharks' use of these activity hotspots in Kilindoni Bay varied through the year. Broadly, the core home ranges were inshore during the sighting season and in deeper water offshore during the off-season. This pattern has persisted from our initial study (Cagua et al., 2015) to the longer-term results here. Seasonality was also clear in the movement network results, with inshore stations having high centrality metrics scores in the sighting season, and offshore stations in the off-season. Also, whale sharks used a larger area of the array and made more movements within the area during the sighting season than in the off-season. Interestingly, different sections of the array were similarly connected or clustered in both seasons, indicating that the high-use areas persisted irrespective of the level of activity within the array.
Most movements between the two hotspots in the whale shark core home range were in the north-east of the bay. There was a lack of a strong connection in the center of the bay, perhaps influenced by the shorter deployment duration of station 14 in the center compared to station 12 in the north-east. However, station 11 in the offshore hotspot, which had the highest number of detections, is only 7 km away from the inshore hotspot, yet few movements were recorded between these locations. The movement network also showed that whale sharks generally arrive at the inshore hotspot from the north-east rather than swimming along the coast from the west (stations 10, 20) or east (station 13).
Most whale sharks at Mafia Island are juveniles (Rohner et al., 2015b) and feeding opportunities are likely to be the main driver of local-scale movements. The monthly activity space maps and the monthly movement networks showed the finer detail of this seasonal cycle. Their core habitat was exclusively inshore from Dec–Feb, corresponding with the period during which north-easterly winds prevail (Mahongo et al., 2012). Whale sharks are often observed feeding in high-density patches of sergestid shrimps during this season (Rohner et al., 2015a). While prey patches are highly mobile (Rohner et al., 2015a), this inshore activity hotspot may reflect a relatively consistent area of high prey availability. Such a consistent concentration of prey could be influenced by the local bathymetry, tides and currents. Our working hypothesis is that the consistent wind concentrates whale shark prey along the coast during this period. Further examinations of the prey field and its drivers are needed to better explain the locations of these hotspots within whale shark habitat.
The sharks' core habitat was further offshore from Mar–Sep, corresponding to the period dominated by south-easterly winds (Mahongo et al., 2012). There was no clear variation among monthly core habitats or movement networks within each of those two seasons. The only variation was in the transition months of October and November, with core home ranges spanning both inshore and offshore areas. This larger home range likely reflects a variation in prey patch location within the array during these months, potentially because the change in prevailing winds occurs over a period and is not consistent among years. It is conceivable that sergestid prey are also available in the off-season, but that they form patches outside the area covered by our acoustic array. Alternatively, sergestids may peak during the warmer months, as elsewhere (Ma et al., 2009; Xu, 2010), and that whale sharks either fast or target other prey within and adjacent to the acoustic array during the off-season.
Seasonal cycles of whale shark presence and absence are common at other aggregation sites (Norman et al., 2017a; McCoy et al., 2018), but likely occur on a much larger spatial scale than the few km2 seen here. Elsewhere, many of the satellite-tracked whale sharks made long-distance movements away from aggregation sites during the off-season [e.g., Hueter et al. (2013), Hearn et al. (2016), Diamant et al. (2018)]. Even when some tracked individuals returned sporadically during the off-season, their movements away spanned thousands of kilometers (Reynolds et al., 2017). It is possible that some whale sharks at Mafia Island also make long-distance movements away from the site, but we have recorded only one such movement among the 207 identified individuals at the time of writing. TZ-009 was photo-identified in the Seychelles in 2010, 2.5 years after having been sighted in Mafia Island (Norman et al., 2017a), and 2 years before we tagged it following its return to Mafia Island. Two other sharks (MZ-129 and MZ-136) were originally sighted in Mozambique and have since consistently been present at Mafia Island. Recent biochemical and photo-ID results from whale sharks in Mozambique, Tanzania, and Qatar similarly demonstrated limited connectivity among these sites (Prebble et al., 2018). Instead, each group of sharks fed within a relatively small area around their respective aggregation sites, at least over the duration of isotopic integration (2–3 years). Our acoustic telemetry data support the limited long-distance movements seen in photo-ID studies and the separation of sharks at different aggregation sites based on stable isotope values and suggest that seasonal long-range movements are infrequent here. Rather, most whale sharks at Mafia Island likely make shorter excursions away from Kilindoni Bay before returning.
Management Opportunities
Whale sharks are classified as Endangered on the IUCN Red List, largely as a result of declining sighting trends within the Indo-Pacific (Pierce and Norman, 2016). Suggested conservation actions include protecting their coastal aggregation sites specifically, as human pressures in high-density areas can have disproportionate negative effects on population declines (Pierce and Norman, 2016). The high residency of whale sharks at Mafia Island exacerbates this risk, as they spend a lot of their time in a small coastal area. Locally, vessel strike and fishing gear entanglement pose a threat based on a high frequency of observed scarring on sharks (Authors pers. obs.). Based on the results of our study, we recommend three main management strategies to enhance protection of whale sharks off Mafia Island: reduce fishing-related injuries and mortality through (1) a ban on bottom-set gill nets in the local extent habitat, and (2) season and area-specific controls on ring-nets; and (3) reduce vessel strike by creating a seasonal go-slow zone.
Whale sharks are not targeted in local fisheries at Mafia Island, however media reports do indicate that opportunistic, non-deliberate catches nearby off Dar es Salaam and Zanzibar are not uncommon. The primary local threat to whale sharks is the increasing use of large-mesh bottom-set gill nets in Kilindoni Bay (Authors pers. obs.) as these nets have the potential to catch whale sharks accidentally. None of the whale shark core home range fell within the current Mafia Island Marine Park boundary, where fishing is limited by regulations on allowable gear and boat size. In particular, ring-nets are not permitted within the marine park. Local SCUBA operators a popular activity within the park—report that whale sharks are rarely seen in the marine park, including in areas not covered by our array or visual surveys. Expanding the marine park area to include whale shark activity hotspots would potentially allow for improved control of boats and fishing gear used, however changing park boundaries would be challenging. The alternative, retaining whale shark management and the associated revenue from visitor fees under Mafia District Council, is likely a more practical approach. A localized ban on bottom-set gill nets in Kilindoni Bay would eliminate this direct threat to the local whale shark population.
Injuries from fishing gear can occur because whale sharks at Mafia Island often feed on the same prey as small planktivorous fishes, which are the target of the local ring-net fishery (Rohner et al., 2015a). This threat is likely to be greatest at night, when it is more difficult to see whale sharks in nets with catches. Fishing-related threats could be minimized by restricting ring-net fishing in the small inshore core activity hotspot from Oct–Feb. In this scenario, a large area of the productive bay would remain open to fishing year-round. The Mafia District Council would need to work with fishing communities in Kilindoni, Dongo, Ndagoni, and Chunguruma villages, who are part of a collaborative fisheries management area (CFMA) which covers all of the area in Figure 1, and which has its own CFMA fisheries management plan, reviewable every 5 years. Through appropriate consultation, it is possible those fishing communities would consent to control ring-net fishing in the core whale shark zone, in exchange for a share of the whale shark visitor fee revenue. Data on ring-net fishing locations and frequencies, in particular in the core whale shark areas, would need to be gathered to guide such a process.
The other major threat to whale sharks is vessel strike. This threat can be alleviated by reducing vessel speed, enabling boats to avoid whale sharks and allowing whale sharks time to swim away from approaching vessels. A go-slow zone would likely reduce vessel strikes (Speed et al., 2008). This zone could be seasonal and area-specific, because whale shark core home ranges were small and predictably shifted on a seasonal basis. During the sighting season (Oct–Feb), their inshore core habitat was close to Kilindoni harbor, where fishing, tourist, and transport vessels dock, and it extended in all directions only ~1.5 km from the harbor. This area would ideally serve as the recommended go-slow zone. Additionally, whale shark tourism is getting more popular at Mafia Island, with the average number of boats per survey trip increasing from 2.2 in 2012 to 5.1 in 2018. Increased boat traffic around whale sharks might lead to more boat strikes on whale sharks. We thus recommend the implementation of clear regulations for all boat operators.
Although whale sharks are legally protected in Tanzania they still face various threats, such as boat strike or accidental capture in fishing nets. There is a need to develop a dedicated component on whale sharks in the National Plan of Action for shark management in Tanzania, which is currently in process. Our detailed understanding of whale shark habitat use in the country's main aggregation site, Kilindoni Bay off Mafia Island, provides actionable data on improving the conservation management of this iconic, globally endangered and locally-important tourism species.
Data Availability Statement
The datasets generated for this study are available on request to the corresponding author.
Ethics Statement
Field work was conducted with permission from the Tanzania Commission for Science and Technology (COSTECH). The animal use protocol was approved by KAUST's Biosafety and Ethics Committee.
Author Contributions
CR, JC, EC, MB, JR, and SP designed the study. MB, JR, BK, JB, and SP provided materials. CR, JC, EC, CP, and SP conducted the field work. CR, JC, EC, and SV analyzed the data. CR wrote the first draft of the manuscript. JC, EC, JR, and SP added sections to the manuscript. All authors contributed to manuscript revision, read and approved the submitted version.
Funding
This project was funded by the King Abdullah University of Science and Technology (KAUST), WWF Tanzania, WWF Sweden/SIDA, Aqua-Firma, the Shark Foundation, Waterlust, two private trusts, and Patreon supporters.
Conflict of Interest
JR was employed by the company SoundOcean Ltd.
The remaining authors declare that the research was conducted in the absence of any commercial or financial relationships that could be construed as a potential conflict of interest.
Acknowledgments
We thank Liberatus Mokoki and his team for their assistance in the field, and Mathias Igulu, Haji Machano, Paul Kugopya, Sware Semesi, and the WWF Tanzania team, as well as Amin Abdallah from the Mafia Island Marine Park for facilitating the project. Thanks to Carlos Omari and the team at Whale Shark Lodge and to Jean & Anne de Villiers for hosting us. We thank Tane Sinclair-Taylor, Royale Hardestine, Kenny Wolfe, Jens Paulsen, Rilke Ballero, Alexandra Watts, Stella Diamant, Sophia Lind, Lydie Couturier, David Robinson, and Danielle Keates and David von Helldorff of Mafia Island Diving for their help in the field and Alina Riensema and Michael Pfundt for help with photo-ID processing. We thank all citizen scientists who contributed photo-ID data, particularly the team from Kitu Kiblu. Thanks also to the MMF team and board for administrative support.
References
Agafonkin, V., and Thieurmel, B. (2018). Suncalc: Compute Sun Position, Sunlight Phases, Moon Position and Lunar Phase. R Package Version 0.4. Available online at: https://CRAN.R-project.org/package=suncalc (accessed November, 2019).
Araujo, G., Rohner, C. A., Labaja, J., Conales, S. J., Snow, S. J., Murray, R., et al. (2018). Satellite tracking of juvenile whale sharks in the Sulu and Bohol Seas, Philippines. PeerJ 6:e5231. doi: 10.7717/peerj.5231
Arzoumanian, Z., Holmberg, J., and Norman, B. (2005). An astronomical pattern-matching algorithm for computer-aided identification of whale sharks Rhincodon typus. J. Appl. Ecol. 42, 999–1011. doi: 10.1111/j.1365-2664.2005.01117.x
Block, B. A., Jonsen, I. D., Jorgensen, S. J., Winship, A. J., Shaffer, S. A., Bograd, S. J., et al. (2011). Tracking apex marine predator movements in a dynamic ocean. Nature 475, 86–90. doi: 10.1038/nature10082
Bodin, Ö., Ramirez-Sanchez, S., Ernstson, H., and Prell, C. (2011). “Some basic structural characteristics of networks,” in Social Networks and Natural Resource Management - Uncovering the Social Fabric of Environmental Governance, eds Ö. Bodin and C. Prell (Cambridge: Cambridge University Press), 29–43. doi: 10.1017/CBO9780511894985
Cagua, E. F., Cochran, J. E. M., Rohner, C. A., Prebble, C. E. M., Sinclair-Taylor, T. H., Pierce, S. J., et al. (2015). Acoustic telemetry reveals cryptic residency of whale sharks. Biol. Lett. 11:20150092. doi: 10.1098/rsbl.2015.0092
Calenge, C. (2006). The package adehabitat for the R software: a tool for the analysis of space and habitat use by animals. Ecol. Modell. 197, 516–519. doi: 10.1016/j.ecolmodel.2006.03.017
Cerchio, S., Gabriele, C. M., Norris, T. F., and Herman, L. M. (1998). Movements of humpback whales between Kauai and Hawaii: implications for population structure and abundance estimation in the Hawaiian Islands. Mar. Ecol. Prog. Ser. 175, 13–22. doi: 10.3354/meps175013
Cochran, J. E. M., Braun, C. D., Cagua, E. F., Campbell, M. F. Jr., Hardenstine, R. S., Kattan, A., et al. (2019). Multi-method assessment of whale shark (Rhincodon typus) residency, distribution, and dispersal behavior at an aggregation site in the Red Sea. PLoS ONE 14:e0222285. doi: 10.1371/journal.pone.0222285
Costa, D. P., Breed, G. A., and Robinson, P. W. (2012). New insights into pelagic migrations: implications for ecology and conservation. Annu. Rev. Ecol. Evol. Syst. 43, 73–96. doi: 10.1146/annurev-ecolsys-102710-145045
Couturier, L. I. E., Newman, P., Jaine, F. R. A., Bennett, M. B., Venables, W. N., Cagua, E. F., et al. (2018). Variation in occupancy and habitat use of Mobula alfredi at a major aggregation site. Mar. Ecol. Prog. Ser. 599, 125–145. doi: 10.3354/meps12610
Csardi, G., and Nepusz, T. (2006). The Igraph software package for complex network research. InterJournal Complex Systems 1695. Available online at: http://igraph.org
de la Parra Venegas, R., Hueter, R., González Cano, J., Tyminski, J., Gregorio Remolina, J., Maslanka, M., et al. (2011). An unprecedented aggregation of whale sharks, Rhincodon typus, in Mexican coastal waters of the Caribbean Sea. PLoS ONE 6:e18994. doi: 10.1371/journal.pone.0018994
Dewar, H., Mous, P., Domeier, M., Muljadi, A., Pet, J., and Whitty, J. (2008). Movements and site fidelity of the giant manta ray, Manta birostris, in the Komodo Marine Park, Indonesia. Mar. Biol. 155, 121–133. doi: 10.1007/s00227-008-0988-x
Diamant, S., Rohner, C. A., Kiszka, J. J., D'Echon, A. G., D'Echon, T. G., Sourisseau, E., et al. (2018). Movements and habitat use of satellite-tagged whale sharks off western Madagascar. Endanger. Species Res. 36, 49–58. doi: 10.3354/esr00889
Finn, J. T., Brownscombe, J. W., Haak, C. R., Cooke, S. J., Cormier, R., Gagne, T., et al. (2014). Applying network methods to acoustic telemetry data: modeling the movements of tropical marine fishes. Ecol. Modell. 293, 139–149. doi: 10.1016/j.ecolmodel.2013.12.014
Game, E. T., Grantham, H. S., Hobday, A. J., Pressey, R. L., Lombard, A. T., Beckley, L. E., et al. (2009). Pelagic protected areas: the missing dimension in ocean conservation. Trends Ecol. Evol. 24, 360–369. doi: 10.1016/j.tree.2009.01.011
Gill, P. C. (2002). A blue whale (Balaenoptera musculus) feeding ground in a southern Australian coastal upwelling zone. J. Cetacean Res. Manag. 4, 179–184.
Hays, G. C., Ferreira, L. C., Sequeira, A. M. M., Meekan, M. G., Duarte, C. M., Bailey, H., et al. (2016). Key questions in marine megafauna movement ecology. Trends Ecol. Evol. 31, 463–475. doi: 10.1016/j.tree.2016.02.015
Hearn, A. R., Green, J., Román, M. H., Acuña-Marrero, D., Espinoza, E., and Klimley, A. P. (2016). Adult female whale sharks make long-distance movements past Darwin Island (Galapagos, Ecuador) in the Eastern Tropical Pacific. Mar. Biol. 163:214. doi: 10.1007/s00227-016-2991-y
Heupel, M. R., Lédée, E. J. I., and Simpfendorfer, C. A. (2018). Telemetry reveals spatial separation of co-occurring reef sharks. Mar. Ecol. Prog. Ser. 589, 179–192. doi: 10.3354/meps12423
Hueter, R. E., Tyminski, J. P., and de la Parra, R. (2013). Horizontal movements, migration patterns, and population structure of whale sharks in the Gulf of Mexico and northwestern Caribbean Sea. PLoS ONE 8:e71883. doi: 10.1371/annotation/491b9b6c-7f77-4fb0-b336-572078aec830
Jacoby, D. M. P., and Freeman, R. (2016). Emerging network-based tools in movement ecology. Trends Ecol. Evol. 31, 301–314. doi: 10.1016/j.tree.2016.01.011
Lédée, E. J. I., Heupel, M. R., Tobin, A. J., Knip, D. M., and Simpfendorfer, C. A. (2015). A comparison between traditional kernel-based methods and network analysis: an example from two nearshore shark species. Anim. Behav. 103, 17–28. doi: 10.1016/j.anbehav.2015.01.039
Lettevall, E., Richter, C., Jaquet, N., Slooten, E., Dawson, S., Whitehead, H., et al. (2002). Social structure and residency in aggregations of male sperm whales. Can. J. Zool. 80, 1189–1196. doi: 10.1139/z02-102
Ma, Z., Xu, Z., and Zhou, J. (2009). Effect of global warming on the distribution of Lucifer intermedius and L. hanseni (Decapoda) in the Changjiang estuary. Prog. Nat. Sci. 19, 1389–1395. doi: 10.1016/j.pnsc.2008.12.008
Mahongo, S. B., Francis, J., and Osima, S. E. (2012). Wind patterns of coastal Tanzania: their variability and trends. West. Indian Ocean J. Mar. Sci. 10, 107–120.
Marshall, A. D., and Bennett, M. B. (2010). Reproductive ecology of the reef manta ray Manta alfredi in southern Mozambique. J. Fish Biol. 77, 169–190. doi: 10.1111/j.1095-8649.2010.02669.x
McCoy, E., Burce, R., David, D., Aca, E. Q., Hardy, J., Labaja, J., et al. (2018). Long-term photo-identification reveals the population dynamics and strong site fidelity of adult whale sharks to the coastal waters of Donsol, Philippines. Front. Mar. Sci. 5, 1–11. doi: 10.3389/fmars.2018.00271
Minor, E. S., and Urban, D. L. (2008). A graph-theory framework for evaluating landscape connectivity and conservation planning. Conserv. Biol. 22, 297–307. doi: 10.1111/j.1523-1739.2007.00871.x
Motta, P. J., Maslanka, M., Hueter, R. E., Davis, R. L., de la Parra, R., Mulvany, S. L., et al. (2010). Feeding anatomy, filter-feeding rate, and diet of whale sharks Rhincodon typus during surface ram filter feeding off the Yucatan Peninsula, Mexico. Zoology 113, 199–212. doi: 10.1016/j.zool.2009.12.001
Mourier, J., Lédée, E. J. I., Guttridge, T., and Jacoby, D. M. P. (2019). “Network analysis and theory in shark ecology–methods and applications,” in Shark Research: Emerging Technologies and Applications for the Field and Laboratory, eds J. C. Carrier, M. R. Heithaus, and C. A. Simpfendorfer (Boca Raton: CRC Press, 337–356.
Nelson, J. D., and Eckert, S. A. (2007). Foraging ecology of whale sharks (Rhincodon typus) within Bahía de Los Angeles, Baja California Norte, México. Fish. Res. 84, 47–64. doi: 10.1016/j.fishres.2006.11.013
Norman, B. M., Holmberg, J. A., Arzoumanian, Z., Reynolds, S. D., Wilson, R. P., Rob, D., et al. (2017a). Undersea Constellations: the global biology of an endangered marine megavertebrate further informed through citizen science. Bioscience 67, 1029–1043. doi: 10.1093/biosci/bix127
Norman, B. M., Whitty, J. M., Beatty, S. J., Reynolds, S. D., and Morgan, D. L. (2017b). Do they stay or do they go? Acoustic monitoring of whale sharks at Ningaloo Marine Park, Western Australia. J. Fish Biol. 91, 1713–1720. doi: 10.1111/jfb.13461
O'Shea, O. R., Kingsford, M. J., and Seymour, J. (2010). Tide-related periodicity of manta rays and sharks to cleaning stations on a coral reef. Mar. Freshw. Res. 61, 65–73. doi: 10.1071/MF08301
Perryman, R. J. Y., Venables, S. K., Tapilatu, R. F., Marshall, A. D., Brown, C., and Franks, D. W. (2019). Social preferences and network structure in a population of reef manta rays. Behav. Ecol. Sociobiol. 73:114. doi: 10.1007/s00265-019-2720-x
Pierce, S. J., and Norman, B. (2016). Rhincodon typus. The IUCN Red List of Threatened Species. Whale Shark e.T19488A2365291. doi: 10.2305/IUCN.UK.2016-1.RLTS.T19488A2365291.en
Prebble, C. E. M., Rohner, C. A., Pierce, S. J., Robinson, D. P., Jaidah, M. Y., Bach, S. S., et al. (2018). Limited latitudinal ranging of juvenile whale sharks in the Western Indian Ocean suggests the existence of regional management units. Mar. Ecol. Prog. Ser. 601, 167–183. doi: 10.3354/meps12667
Queiroz, N., Humphries, N. E., Couto, A., Vedor, M., da Costa, I., Sequeira, A. M. M., et al. (2019). Global spatial risk assessment of sharks under the footprint of fisheries. Nature 572, 461–466. doi: 10.1038/s41586-019-1444-4
Ramírez-Macías, D., Queiroz, N., Pierce, S. J., Humphries, N. E., Sims, D. W., and Brunnschweiler, J. M. (2017). Oceanic adults, coastal juveniles: tracking the habitat use of whale sharks off the Pacific coast of Mexico. PeerJ 5:e3271. doi: 10.7717/peerj.3271
Reynolds, S. D., Norman, B. M., Beger, M., Franklin, C. E., and Dwyer, R. G. (2017). Movement, distribution and marine reserve use by an endangered migratory giant. Divers. Distrib. 23, 1268–1279. doi: 10.1111/ddi.12618
Robinson, D. P., Jaidah, M. Y., Bach, S. S., Rohner, C. A., Jabado, R. W., Ormond, R., et al. (2017). Some like it hot: repeat migration and residency of whale sharks within an extreme natural environment. PLoS ONE 12, 1–23. doi: 10.1371/journal.pone.0185360
Rohner, C. A., Armstrong, A. J., Pierce, S. J., Prebble, C. E. M., Cagua, E. F., Cochran, J. E. M., et al. (2015a). Whale sharks target dense prey patches of sergestid shrimp off Tanzania. J. Plankton Res. 37, 352–362. doi: 10.1093/plankt/fbv010
Rohner, C. A., Couturier, L. I. E., Richardson, A. J., Pierce, S. J., Prebble, C. E. M., Gibbons, M. J., et al. (2013). Diet of whale sharks Rhincodon typus inferred from stomach content and signature fatty acid analyses. Mar. Ecol. Prog. Ser. 493, 219–235. doi: 10.3354/meps10500
Rohner, C. A., Richardson, A. J., Marshall, A. D., Weeks, S. J., and Pierce, S. J. (2011). How large is the world's largest fish? Measuring whale sharks Rhincodon typus with laser photogrammetry. J. Fish Biol. 78, 378–385. doi: 10.1111/j.1095-8649.2010.02861.x
Rohner, C. A., Richardson, A. J., Prebble, C. E. M., Marshall, A. D., Bennett, M. B., Weeks, S. J., et al. (2015b). Laser photogrammetry improves size and demographic estimates for whale sharks. PeerJ 3:e886. doi: 10.7717/peerj.886
Simpfendorfer, C. A., Heupel, M. R., and Hueter, R. E. (2002). Estimation of short-term centers of activity from an array of omnidirectional hydrophones and its use in studying animal movements. Can. J. Fish. Aquat. Sci. 59, 23–32. doi: 10.1139/f01-191
Speed, C. W., Meekan, M. G., Rowat, D., Pierce, S. J., Marshall, A. D., and Bradshaw, C. J. A. (2008). Scarring patterns and relative mortality rates of Indian Ocean whale sharks. J. Fish Biol. 72, 1488–1503. doi: 10.1111/j.1095-8649.2008.01810.x
Wasserman, S., and Faust, K. (1994). Social Network Analysis: Methods and Applications. Cambridge: Cambridge University Press. doi: 10.1017/CBO9780511815478
Williams, R., Lusseau, D., and Hammond, P. S. (2009). The role of social aggregations and protected areas in killer whale conservation: the mixed blessing of critical habitat. Biol. Conserv. 142, 709–719. doi: 10.1016/j.biocon.2008.12.004
Keywords: Rhincodon typus, Mafia Island, tagging, conservation, movement ecology, photo-ID
Citation: Rohner CA, Cochran JEM, Cagua EF, Prebble CEM, Venables SK, Berumen ML, Kuguru BL, Rubens J, Brunnschweiler JM and Pierce SJ (2020) No Place Like Home? High Residency and Predictable Seasonal Movement of Whale Sharks Off Tanzania. Front. Mar. Sci. 7:423. doi: 10.3389/fmars.2020.00423
Received: 05 March 2020; Accepted: 14 May 2020;
Published: 12 June 2020.
Edited by:
Mark Meekan, Australian Institute of Marine Science (AIMS), AustraliaReviewed by:
Eric Hoffmayer, Southeast Fisheries Science Center (NOAA), United StatesNuno Queiroz, Universidade Do Porto, Portugal
Mourier Johann, Institut De Recherche Pour le Développement (IRD), France
Copyright © 2020 Rohner, Cochran, Cagua, Prebble, Venables, Berumen, Kuguru, Rubens, Brunnschweiler and Pierce. This is an open-access article distributed under the terms of the Creative Commons Attribution License (CC BY). The use, distribution or reproduction in other forums is permitted, provided the original author(s) and the copyright owner(s) are credited and that the original publication in this journal is cited, in accordance with accepted academic practice. No use, distribution or reproduction is permitted which does not comply with these terms.
*Correspondence: Christoph A. Rohner, chris@marinemegafauna.org