Borealization of the Arctic Ocean in Response to Anomalous Advection From Sub-Arctic Seas
 Igor V. Polyakov1,2*
  Matthew B. Alkire3
  Bodil A. Bluhm4
  Kristina A. Brown5
  Eddy C. Carmack5
  Melissa Chierici6
  Seth L. Danielson7
  Ingrid Ellingsen8
  Elizaveta A. Ershova4,9
  Katarina Gårdfeldt10 Randi B. Ingvaldsen4,11
  Andrey V. Pnyushkov12
  Dag Slagstad8
  Paul Wassmann4
- 1International Arctic Research Center and College of Natural Science and Mathematics, University of Alaska Fairbanks, Fairbanks, AK, United States
- 2Finnish Meteorological Institute, Helsinki, Finland
- 3Polar Science Center, Applied Physics Lab and School of Oceanography, University of Washington, Seattle, WA, United States
- 4Department of Arctic and Marine Biology UiT - The Arctic University of Norway, Tromsø, Norway
- 5Institute of Ocean Sciences, Fisheries and Oceans Canada, Sidney, BC, Canada
- 6Institute of Marine Research, Fram Centre, Tromsø, Norway
- 7College of Fisheries and Ocean Sciences, University of Alaska Fairbanks, Fairbanks, AK, United States
- 8SINTEF Ocean AS, Trondheim, Norway
- 9Shirshov Institute of Oceanology, Russian Academy of Sciences, Moscow, Russia
- 10Chalmers University of Technology, Gothenburg, Sweden
- 11Institute of Marine Research, Bergen, Norway
- 12International Arctic Research Center, University of Alaska Fairbanks, Fairbanks, AK, United States
An important yet still not well documented aspect of recent changes in the Arctic Ocean is associated with the advection of anomalous sub-Arctic Atlantic- and Pacific-origin waters and biota into the polar basins, a process which we refer to as borealization. Using a 37-year archive of observations (1981–2017) we demonstrate dramatically contrasting regional responses to atlantification (that part of borealization related to progression of anomalies from the Atlantic sector of sub-Arctic seas into the Arctic Ocean) and pacification (the counterpart of atlantification associated with influx of anomalous Pacific waters). Particularly, we show strong salinification of the upper Eurasian Basin since 2000, with attendant reductions in stratification, and potentially altered nutrient fluxes and primary production. These changes are closely related to upstream conditions. In contrast, pacification is strongly manifested in the Amerasian Basin by the anomalous influx of Pacific waters, creating conditions favorable for increased heat and freshwater content in the Beaufort Gyre halocline and expansion of Pacific species into the Arctic interior. Here, changes in the upper (overlying) layers are driven by local Arctic atmospheric processes resulting in stronger wind/ice/ocean coupling, increased convergence within the Beaufort Gyre, a thickening of the fresh surface layer, and a deepening of the nutricline and deep chlorophyll maximum. Thus, a divergent (Eurasian Basin) gyre responds altogether differently than does a convergent (Amerasian Basin) gyre to climate forcing. Available geochemical data indicate a general decrease in nutrient concentrations Arctic-wide, except in the northern portions of the Makarov and Amundsen Basins and northern Chukchi Sea and Canada Basin. Thus, changes in the circulation pathways of specific water masses, as well as the utilization of nutrients in upstream regions, may control the availability of nutrients in the Arctic Ocean. Model-based evaluation of the trajectory of the Arctic climate system into the future suggests that Arctic borealization will continue under scenarios of global warming. Results from this synthesis further our understanding of the Arctic Ocean’s complex and sometimes non-intuitive Arctic response to climate forcing by identifying new feedbacks in the atmosphere-ice-ocean system in which borealization plays a key role.
Introduction
The role that oceanic warmth penetrating the Arctic Ocean from the lower latitude regions with major oceanic currents plays in the state of polar ocean and sea ice was realized over a century ago (see map of the Arctic Ocean with geographical names and pathways of major water masses in Figure 1). The first instrumental observations on this topic carried out by Nansen and his crew aboard Fram in the Eurasian Basin (EB; explanation of abbreviations used in the text are given in Table 1) in the early 1890s revealed the major features of water mass structure in the polar basins (Figure 2). They found warm (temperature > 0°C, Figure 2) and salty water of Atlantic origin (Atlantic Water, AW) which was distributed throughout the deep basins of the EB at intermediate depths (∼150-900 m). They also observed near-freezing and relatively fresh water in the ∼50 m surface layer and beneath, within the 50–150 m depth range, large vertical salinity and density gradients associated with halocline overlying the AW. This expedition also provided the first lists of species for the Arctic Ocean, and found the biodiversity to be very similar to the Atlantic Ocean (Sars, 1900). See also a nice overview of earlier works by Rudels (2011).
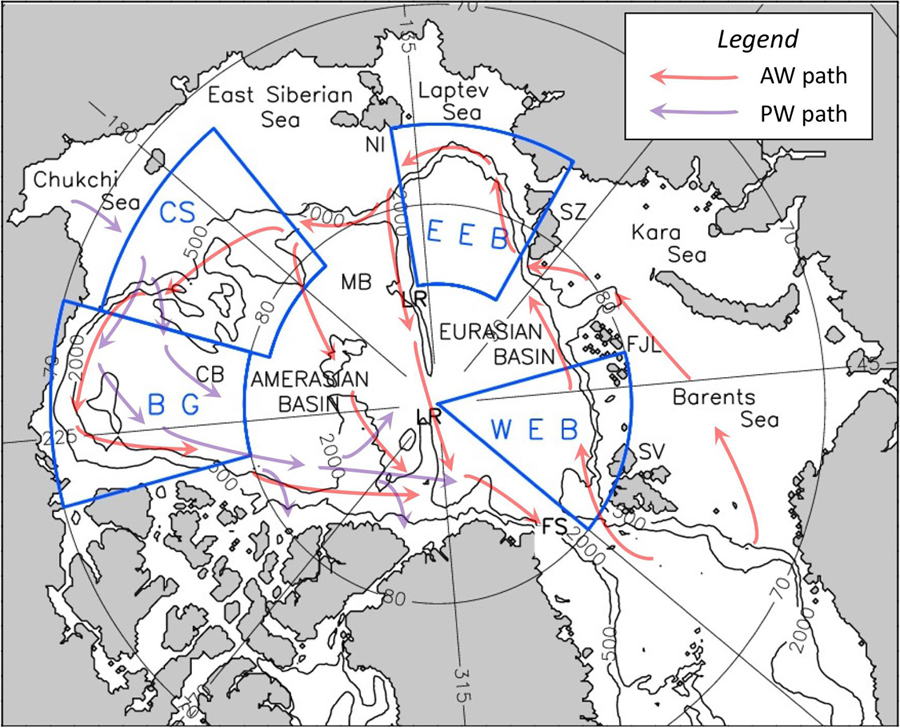
Figure 1. Arctic Ocean map with identified regions. Eastern Eurasian Basin region (EEB), western Eurasian Basin region (WEB), Beaufort Gyre region (BG), and Chukchi Sea region (CS) are indicated (blue). The Lomonosov Ridge (LR), Novosibirskiye Islands (NI), Severnaya Zemlya (SZ), Franz Joseph Land (FJL), Svalbard (SV), Makarov Basin (MB), and Canada Basin (CB) are indicated (black). Pathways of intermediate Atlantic Water (AW) and Pacific Water (PW) are shown by red and purple arrows.
Table 1. Abbreviations used in the text.
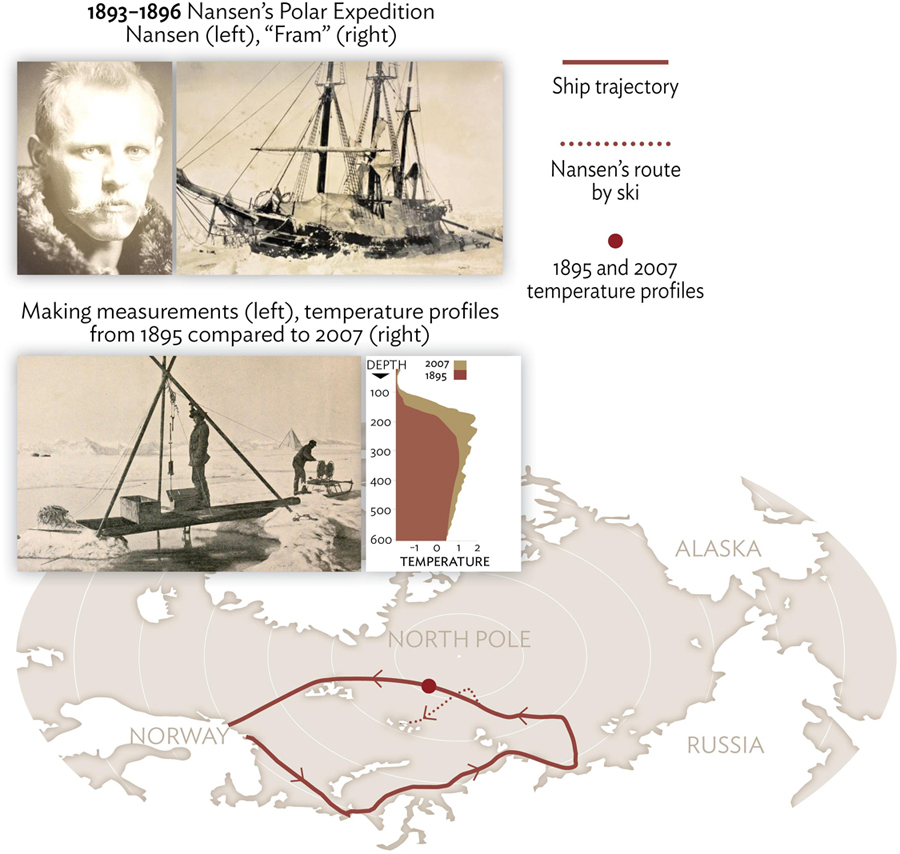
Figure 2. First instrumental observations in the central Arctic Ocean. Nansen’s expedition in 1893–1896 aboard “Fram” delivered first deep-water profiles of temperature from the Eurasian Basin thus providing vital background information for evaluation of recent changes in the Arctic Ocean.
Later expeditions provided further details to this general picture. Particularly, observations conducted in the Amerasian Basin (AB) from the Russian drifting station North Pole #2 (NP-2) in 1950–1951 documented a temperature maximum in the halocline above the AW depth range – a signature of summer water of Pacific origin (Gudkovich, 1955). Biological observations carried out during the NP-2 drift revealed that AW strongly influences the distribution of the zooplankton in the central Arctic (e.g., Brodsky and Nikitin, 1955). They also discovered Pacific species of zooplankton in the halocline layer as far as the North Pole, thus supporting the northern Pacific as the source for these halocline waters in the AB (Brodsky, 1956). Basin-scale Russian surveys conducted in the 1950s established the spatial extent of the Pacific Water (PW, Treshnikov, 1959). Based on the analysis of 230 available hydrographic stations, Coachman and Barnes (1961) concluded that the inflowing PW has little influence on ice conditions since summer PW transports very little heat to the interior and the winter PW is already near the freezing temperature (e.g., Figure 3). Moreover, later McLaughlin et al. (2004) and Steele et al. (2004) suggested that the relatively fresh and warm summer variety of PW at depths of 40-80 m and the colder and more saline winter variety of PW at depths of 80-220 m (Figure 3) greatly strengthen stratification in the halocline and inhibit heat exchange between the AW and the surface mixed layer (SML).
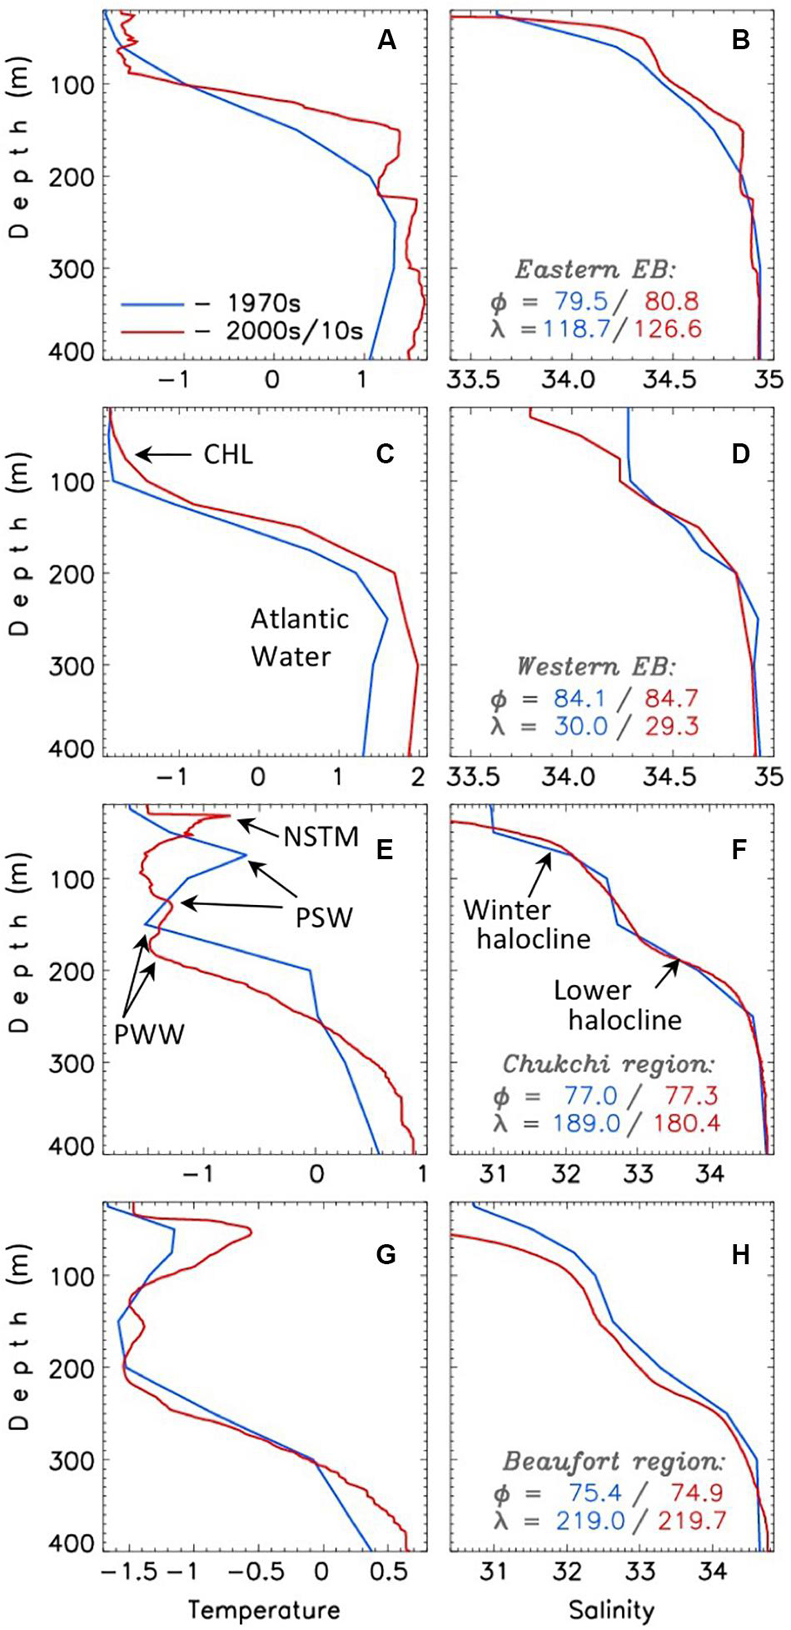
Figure 3. Vertical profiles of winter (NDJFMA) potential temperature (θ, left column, °C, A,C,E,G) and salinity (S, right column, psu, B,D,F,H) for the central points of the four selected regions of the Arctic Ocean (regions are identified in the right column, their geographical locations are shown in Figure 1) from the 1970s (blue) and 2000s-2010s (red). CHL, NSTM, PSW, and PWW identify Cold Halocline Layer, Near-Surface Temperature Maximum, Pacific Summer Water and Pacific Winter Water.
The key point related to the present paper is that the influx of PW leads to a much more complex halocline in the AB. This is discussed in Bluhm et al. (2015) and illustrated in Figure 4 from Carmack et al. (2016) showing vertical sections of water temperature and salinity across major polar basins made in August–September 2014. The position of the Atlantic/Pacific halocline front is strongly constrained by topography, with its location alternating between the Lomonosov and Makarov ridges (Rudels et al., 1994; McLaughlin et al., 1996). The front itself serves as an underwater fence separating two – Amerasian and Eurasian – halocline domains (Figure 4). Pacific halocline waters are generally nutrient rich, oxygen depleted, and acidic/CO2-rich compared to Atlantic-origin halocline waters (e.g., McLaughlin et al., 1996). In addition, PW has also been associated with a dissolved inorganic nitrogen deficit, relative to phosphate, due to sedimentary denitrification on the highly productive Bering and Chukchi sea shelves (e.g., Jones et al., 1998). The relative distribution of these two distinct halocline domains has implications for supporting primary production within the Arctic Basins as well as downstream, in regions such as Baffin Bay and the North Atlantic (e.g., Yamamoto-Kawai et al., 2006).
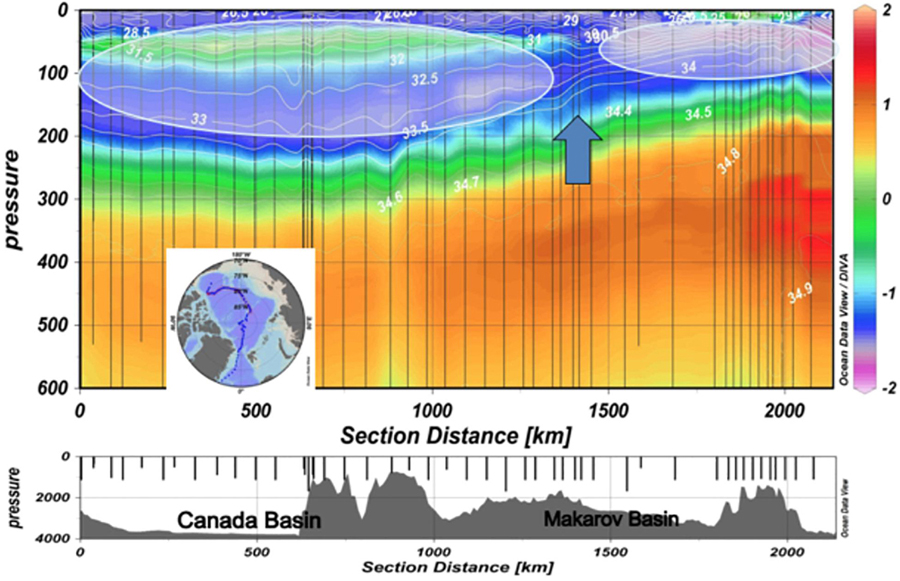
Figure 4. The Atlantic/Pacific halocline front identified by blue arrow that separates the two systems: the shaded ovals show the two – Amerasian and Eurasian – halocline domains (from Carmack et al., 2016). Observations (ship trajectory is shown in insert) are made in August–September 2014. Temperature (°C) is shown by color and salinity is shown by isolines.
The front between PW and AW roughly tracks the Transpolar Drift which moves ice and cold fresh upper ocean waters from the Siberian shelf across the central Arctic toward Fram Strait (e.g., Mysak, 2001). However, there are extended time periods when the AW/PW front and Transpolar Drift are shifted toward the Makarov Basin, reducing the PW domain so that AW spreads farther into the Arctic interior (McLaughlin et al., 1996; Morison et al., 2012). The major drivers of these pathway variations of currents and sea ice drift are alternating anticyclonic and cyclonic local atmospheric circulation regimes (Proshutinsky and Johnson, 1997; Mysak, 2001; Morison et al., 2012). The atmospheric Arctic Oscillation dominates large-scale changes in wind pattern causing shifts (strengthening or weakening) of the upper ocean circulation and ice drift in the BG (e.g., Petty et al., 2016; Armitage et al., 2018). Sometimes, in summer months, the BG has been reversing directions probably changing upwelling/downwelling and accumulation of surface heat (Proshutinsky and Johnson, 1997).
Both observations (e.g., Woodgate et al., 2001; Schauer et al., 2004; Polyakov et al., 2005) and modeling results (Karcher et al., 2003) indicate that AW fluctuations in the Arctic Ocean interior are also linked to the highly variable nature of the AW inflows, with abrupt cooling/warming events. The first evidence of strong, up to 1°C, AW warming was found in 1990 when a warm pulse entered the Nansen Basin (Quadfasel et al., 1991) and began its propagation around the Arctic perimeter, reaching the Makarov Basin by 1993 and the Canada Basin by 2000 (Carmack et al., 1995; Steele and Boyd, 1998; Morison et al., 1998). It was accompanied by a displacement of the PW/AW boundary toward the AB (McLaughlin et al., 1996; Morison et al., 1998). Another warm AW pulse was detected in Fram Strait in 1999 (Schauer et al., 2004) and later in the eastern EB in 2004 (e.g., Polyakov et al., 2005). The pulse peaked in 2007-08 when AW temperature was, on average, ∼0.2°C higher than in the 1990s.
Increasing warming of the AW was accompanied by weakening of the EB halocline (Steele and Boyd, 1998; Polyakov et al., 2010). By the mid-2010s, the system had passed a threshold beyond which the halocline in this part of the Arctic Ocean had lost its fundamental property of being an effective barrier for the AW heat. The combination of weaker stratification and shoaling of the AW, coupled with net loss in ice volume, has allowed progressively deeper winter ventilation in the eastern EB (Polyakov et al., 2017, 2020). This ventilation has resulted in enhanced upward AW heat fluxes, which were sufficiently large to contribute substantially to the diminished sea-ice cover in the eastern EB (Polyakov et al., 2017). Weakening of the halocline and accelerated loss of sea ice may increase primary production via enhanced nutrient availability (Nishino et al., 2008, 2013; Ardyna et al., 2014). Polyakov et al. (2017) called this transition in sea ice state and upper ocean stratification to conditions previously unique to the western Nansen Basin ‘atlantification.’
A distinct signature of climate change in the Pacific sector of the Arctic Ocean is the increase of influx and warming of the PW documented by mooring observations in Bering Strait since the 1990s (Woodgate, 2018). Even over cooling season, heat flux into the Chukchi Sea has increased by over 40% (70 EJ to 100 EJ for 2014–2018 relative to the prior climatology, Danielson et al., 2020). The increased PW heat flux through Bering Strait contributed to heating and sea ice loss in the AB (e.g., Shimada et al., 2006; Woodgate et al., 2010) when a doubling of heat flux from 2001 through 2007 was enough to explain a third of 2007 summer Arctic ice volume loss (Woodgate et al., 2010). However, since winter PW is colder, saltier, and denser, it underlies its summer counterpart (Figure 3) and has little effect on regional sea ice changes. Moreover, a significant fraction of winter PW is formed in the Chukchi Sea after Bering Strait (Danielson et al., 2020) and since there is much more heat in the shelf system now so (we speculate) the number of days to form dense winter PW has significantly decreased and its role in shaping regional environmental changes further diminished. Enhanced inflow of warm PW into the AB triggers a positive feedback mechanism (Shimada et al., 2006) in which diminished ice cover becomes more susceptible to atmospheric wind forcing furthering wind-driven transport of PW off the shelf and into the central basin (Woodgate et al., 2010; Timmermans et al., 2014). There are numerous examples of biological responses to increased PW inflow in the AB (Section “Biological Oceanography”) which attest to rapid ‘pacification’ of this region of the Arctic Ocean. In that, winter PW does not really contribute to the changes mediated by increased inflows from the northern North Pacific, especially for the upper ocean biology and it is the summer PW variety that matters.
These rapid and unforeseen changes in the Arctic climate system are complex, poorly understood, and require careful evaluation. Specifically, developing an insight into the role that the joint thermal and haline states of the ocean plays in enhancing oceanic upward heat fluxes in the EB is critical; this knowledge can improve seasonal sea ice predictions. The role of PW heat and freshwater influx through Bering Strait in shaping changes in the AB interior is not well constrained either. With this in mind, the overarching goal of this study is to further our understanding of Arctic climate changes associated with increasing impacts of Atlantic and Pacific inflows. Following this goal and using extensive updated archives of physical and chemical observations complemented by a thorough overview of biological observations and modeling experiments we evaluate changes over 1981–2017 in physical component of the Arctic Ocean and synthesize their impacts on geochemical and biological components of the Arctic climate system. Specifically, this study is distinct focusing on multidisciplinary changes which are mediated by increased inflows from the northern North Atlantic and North Pacific. We refer to these changes ‘atlantification’ and ‘pacification,’ respectively. We will refer to their joint effect as ‘borealization.’1
Data
Archive of CTD and ITP Data
In this study we use Arctic Ocean observations collected, with a few exceptions, from 1981 to 2017; data from earlier years were used to place changes in the AW and halocline layers in 1981–2017 in a broader temporal context. This is an update of a data archive previously applied to describing long-term changes in the AW temperatures and Arctic freshwater content changes (e.g., Polyakov et al., 2004, 2008, 2013a, 2018). Temporal and spatial data coverage is shown in Supplementary Figures S1–S5. Aircraft and ship expeditions and year-round drifting stations provide data from the 1980s. Most observations prior to the mid-1980s were made using Nansen bottles. Typical measurement errors are 0.01°C for temperature and 0.02 for titrated salinity. In the late 1980s and the 1990s, icebreakers and submarines provided high-quality measurements covering vast areas of the central Arctic Ocean. A significant increase of oceanographic observations was achieved over the 2000s and 2010s (Supplementary Figure S1). Ship-based (mostly summer) measurements in the 2000s and 2010s were complemented by ITP (Ice-Tethered Profilers2) drifters, providing year-round extensive CTD (conductivity-temperature-depth) measurements in the upper ∼800 m. CTD/ITP instruments have good vertical resolution (1 m) and accuracy of temperature (0.001°C) and salinity (0.003 psu) measurements.
Satellite SSTs and Sea Ice Concentration
The Advanced Very High Resolution Radiometer (AVHRR) satellite archive includes global daily sea surface temperature (SST) and ice concentration with 0.25 × 0.25° resolution.3 The polar region is sparsely covered by in situ SST observations, therefore, the blended OISST (Optimum Interpolation Sea Surface Temperature) data set for the Arctic Ocean relies mostly on satellite data. This product utilized AVHRR measurements from the two satellite missions, NOAA-19 and METOP-A, both of them cover the Arctic Ocean with SST observations. Moreover, METOP-A was specifically designed by the European Space Agency (ESA) to monitor polar environment and has a lower polar orbit. Along with the 6-hourly Navy AVHRR SST data, to restore the SST in the marginal and perennial ice zones, sea ice concentration data are used to obtain proxy SST estimates. The conversion of sea ice concentration to SST is performed based on the NCEP (National Centers for Environmental Prediction) real-time sea ice product available at a 1/2° grid (Grumbine, 1996) using an empirically derived linear equation from Reynolds et al. (2007). These data are used to complement in situ ocean temperature observations (Supplementary Material).
Geochemical Observations
Observations of nutrient concentrations, including Silicates (Si(OH)4, herein Si), Nitrates (NO3–+ NO2–, herein N + N), and Phosphates (PO43–, herein P), as well as dissolved oxygen (O2), stable oxygen isotopes of seawater (δ18O), salinity, and temperature were accumulated from multiple sources spanning between 1981 and 2017. The primary source of nutrient data included the Arctic Nutrient Atlas compiled by Codispoti et al. (2013). Additional data sets were collected to supplement and extend the Codispoti Atlas (see Supplementary Material for full list of data sets). The data were restricted to latitudes ≥ 60°N and summer months (May through October), as the majority of geochemical measurements were collected during summer cruises. All geochemical variables were measured on seawater samples collected from bottles tripped at discrete depths during oceanographic expeditions. Temperature, salinity, and dissolved oxygen measurements were matched from CTD profiles to bottle trip depths. Additionally, discrete measurements of salinity and dissolved oxygen were also collected and used to check the accuracy of the sensor-based measurements.
Biological Observations
Given the lack of biological time series in the focus areas of the physical and geochemical analyses, the biological section instead primarily presents a brief literature review of biological changes on the Atlantic and Pacific inflow shelves of the Arctic. In addition, primary production was simulated using a numerical model, see section “Model Description.”
Methods
Methods in Physical Observations
SML Depth
For each CTD and ITP profile we identify the depth of the surface mixed layer (SML) by identifying the depth at which the water density exceeds that at the ocean surface by 0.125 kg.m–3 (Monterey and Levitus, 1997). This definition was successfully used by Polyakov et al. (2013b) to study winter convection in the EB. For more details on definition of the SML depth see Peralta-Ferriz and Woodgate (2015). Within the SML, the average potential temperature θSML and salinity SSML are calculated for each profile. Using these estimates from all available stations within each region, a monthly mean seasonal cycle of θSML and SSML was calculated and subtracted from each individual estimate of θSML and SSML to form monthly anomaly time series.
Halocline Base Depth
For each CTD and ITP profile the lower halocline boundary is defined following Bourgain and Gascard (2011) who show that the density ratio Rρ = (α∂θ/∂z)/(β∂S/∂z) = 0.05 (α is the thermal expansion coefficient and β is the haline contraction coefficient, θ is potential temperature and S is salinity) may be used to identify the cold halocline base depth. This algorithm is used in Figures 12, 13. The depth of the 0°C isotherm defines the total halocline base depth; it is used in all other figures where the depth of the halocline base is required (Figures 7, 8, 14, 15 and Supplementary Figure S7).
Satellite-Derived SST
Regression-like relationships (offset and scaling) between satellite-derived SST and in situ θSML were built for each region (Supplementary Figure S6). SSTs were then used to fill gaps in situ data.
Characterizing Stratification
Stratification in the SML and halocline layer is quantified using Brunt-Väisälä buoyancy frequency (N), N2 = −(g/ρo)∂ρ/∂z, where ρ is the potential density of seawater, ρo is the reference density (1030 kg m–3), and g is the acceleration due to gravity. Change of N2 results from both variations of density contrasts between two vertical levels (Δσθ) and vertical stretching of halocline layer (ΔHhalo = – HSML). N2 and Δσθ provide similar spatial patterns, but maps of N2 are generally noisier so we used Δσθ for mapping.
The halocline is complex, typically consisting of several different water masses and N2 and Δσθ do not provide any information about changes in the halocline interior. Available potential energy (APE) is a good integral indicator of changes in halocline and SML strength (Polyakov et al., 2018). It is calculated as:
where z2 is the surface and z1 is the depth of the halocline base, g is the gravity acceleration, ρref is potential density at the base of the halocline, and z is depth.
Regional Composite Time Series
The annual and summer regional time series are composed using a technique similar to the method used for analysis of long-term AW and freshwater content variability (Polyakov et al., 2004, 2008). Using this method, the area of each analysis region was divided into boxes matching the 0.25 × 0.25° satellite grid. Mean SML potential temperature (θSML), salinity (SSML), SML thickness (HSML) and mean halocline potential temperature (θhalo), salinity (Shalo), N2, APE and depth of its base (Hhalo) in these boxes were averaged within a given month and box to produce local seasonal cycles. The derived monthly values were used to remove the monthly climatology for all individual parameters. Next, these monthly anomalies were averaged to produce annual anomaly time series for each grid box. The resulting time series for each box were averaged again, taking into account the size of each box, to obtain an area-weighted single regional time series. This technique provides an accurate spatial representation of area-averaged indices, since these results are less skewed by heterogeneity of sparse data coverage.
Several time series from sub-Arctic seas and straits are used to show connections to the high-latitude regions. The northern Barents Sea time series was taken from Lind et al. (2018) for a spatially averaged, surface layer salinity over a subarea in the northern Barents Sea. The data set is based on annual, in situ salinity profiles, and the surface layer was identified as above the pycnocline which was defined as the maximum vertical salinity gradient.
The annual time series of Bering Strait water transport WBS is from the A2 mooring (Woodgate, 2018).
Mapping
Spatial distributions of oceanic parameters over selected periods of time are presented as individual colored circles with values taken directly from data profiles, thus avoiding errors associated with spatial interpolation. However, comparison of evolution between different time periods is made using spatially interpolated data. For interpolation and presentation of differences between time periods we used a 0.25° (latitude) × 0.75° (longitude) grid. Interpolation based on simple averaging of all available points within each grid cell and using a reverse distance weighting from the center of grid cells yielded essentially the same results and the latter used in Figures 6, 8, 11.
Analysis was carried out for the 37 years spanning 1981–2017, which is long enough for capturing climatic changes while maintaining relatively good data coverage and overlap with satellite-based observations. Finally we note that all statistical confidence intervals discussed in the text are provided for a 95% level.
Methods in Geochemical Observations
A strict protocol of quality control measures was performed on all data sets included in the collection. The details of these measures are described in the Supplementary Material. Maps of variable concentrations averaged over the halocline during two specific time periods (1981–2005 vs. 2006–2017) were constructed to assess geochemical changes in the Beaufort Gyre (BG), Chukchi Sea (CS), Eastern Eurasian Basin (EEB), and Western Eurasian Basin (WEB) regions. Changes in the spatial distributions of meteoric water (MW) and net sea ice meltwater (SIM) were investigated by combining observations of salinity, δ18O, N + N, and P in a water type analysis (Yamamoto-Kawai et al., 2008; see Supplementary Material). To determine whether the changes in nutrient concentration were controlled mostly by changes in advection and/or mixing (physical) versus remineralization (biological), measurements of N + N and O2 were used to calculate the semi-conservative parameter NO after Broecker (1974), (NO = 9 × [N + N] + [O2]), and preformed-NO3 after Emerson and Hayward (1995), (Preformed-NO3 = [N + N] - (O2saturation - [O2])/9). These two tracers provide an opportunity to assess the impact of physical processes; additional changes to oxygen and/or nutrient concentrations are generally assumed to be due biological processes.
Model Description
Lack of systematic biological observations in the central Arctic was partially compensated by the use of results of a numerical model. Particularly, the levels of pelagic primary production were estimated using the numerical model system called SINMOD, a 3D coupled model system incorporating hydrodynamic, ice, and ecosystem components (details can be found in, e.g., Slagstad and McClimans, 2005; Wassmann et al., 2006). In the present work we used a regional configuration with a model grid that covers the Nordic Seas and the Arctic Ocean with a 20 km horizontal resolution (Slagstad et al., 2015). The model uses atmospheric forcing from European Centre for Medium-range Weather Forecast (ECMWF4). Freshwater influxes from R-Arctic Net program are used for Russian, American and Canadian rivers. Greenland runoff was taken from Bamber et al. (2018). Norwegian runoffs from the Norwegian Water Resource and Energy Directorate (NVE5) and climatology applied for other rivers discharging freshwater into the Nordic Seas. Tidal forcing is included by specifying tidal elevation and current along the open boundary based on data from TPXO Tide Model.6 Open boundary conditions for chemical and physical model parameters are prescribed following Wassmann et al. (2010). Initial conditions are based on World Ocean Atlas (WOA) and World Ocean Circulation Experiment (WOCE) data climatology (Koltermann et al., 2011). The model simulations cover 1979–2017.
In addition, the SINMOD system was used in this study for projections of future Arctic climate system trajectories. For that, the model was run using atmospheric forcing data from an ensemble run of the global MPI-ESM model system (Notz et al., 2013) for the IPCC RCP 8.5 scenario. More information on the configuration is described in Armstrong et al. (2019).
Statistical Information
Statistical significance of linear trends was estimated using the Student t test. Statistical significance of means was evaluated using the standard error (SE) of the mean, SE = σ/(Neff)0.5, where σ is the standard deviation of the time series (sample) and Neff is effective sample size. Neff takes into account internal correlations (or the number of independent observations) and was estimated as Neff = N∗(1-r)/(1 + r) where N is the length of the time series and r is auto-correlation at lag = 1 (von Storch and Zwiers, 1999). Two SEs were used for evaluation of statistical significance of means at 95% confidence level.
Results
Changes of Physical Parameters
In this section, we show pan-Arctic SML warming and contrasting regional differences associated with the loss of stratification in the upper EB halocline and strengthening of water column stability in the upper AB. Using statistical analyses and modeling, we partially attribute these changes to advection of anomalous Atlantic and Pacific waters from upstream locations into the Arctic Ocean interior – as indicated in the Introduction, we call these changes atlantification and pacification, correspondingly.
Regional Changes in the AW Layer
We start with analysis of changes in the AW layer – the most explicit manifestation of atlantification of the deep Arctic basins. We consider the record expanded back in time to the 1950s in order to place AW changes in the 1980s–2010s in the broader context.
The pan-Arctic time series of normalized AW core temperature (Figure 5), defined as the maximum temperature found within the AW layer is an update of Polyakov et al. (2004; 2012; 2013a) with additional data from the 1990s–2010s. The record shows that warming is the dominant signal since 1950 and is associated with a statistically significant linear trend of 0.21 ± 0.04 per decade evaluated by the least-squares best-fit method. The 1981–1995 was a relatively cool period as evidenced by its mean shown by blue horizontal line in Figure 5 (for details, see Polyakov et al., 2012). The warming began in the second half of the 1980s. Observations from the 1990s documented positive AW temperature anomalies of up to 1°C relative to temperatures measured in the 1970s throughout vast areas of the Eurasian and Makarov basins (Quadfasel et al., 1991; Carmack et al., 1995; Swift et al., 1997; Morison et al., 1998; Steele and Boyd, 1998; Polyakov et al., 2004). The 2000s showed the steepest AW temperature increase, with 2006 being the warmest year in more than a century long history of instrumental observations (Polyakov et al., 2013a). Newly available data from the 2010s demonstrate that the temperatures have reached a temporary equilibrium since the 2000s with a mean temperature of +0.95±0.28 in 2006–2017. These statistical estimates provide evidence for progressive atlantification of the Arctic Ocean interior from the 1980s into the 2010s.
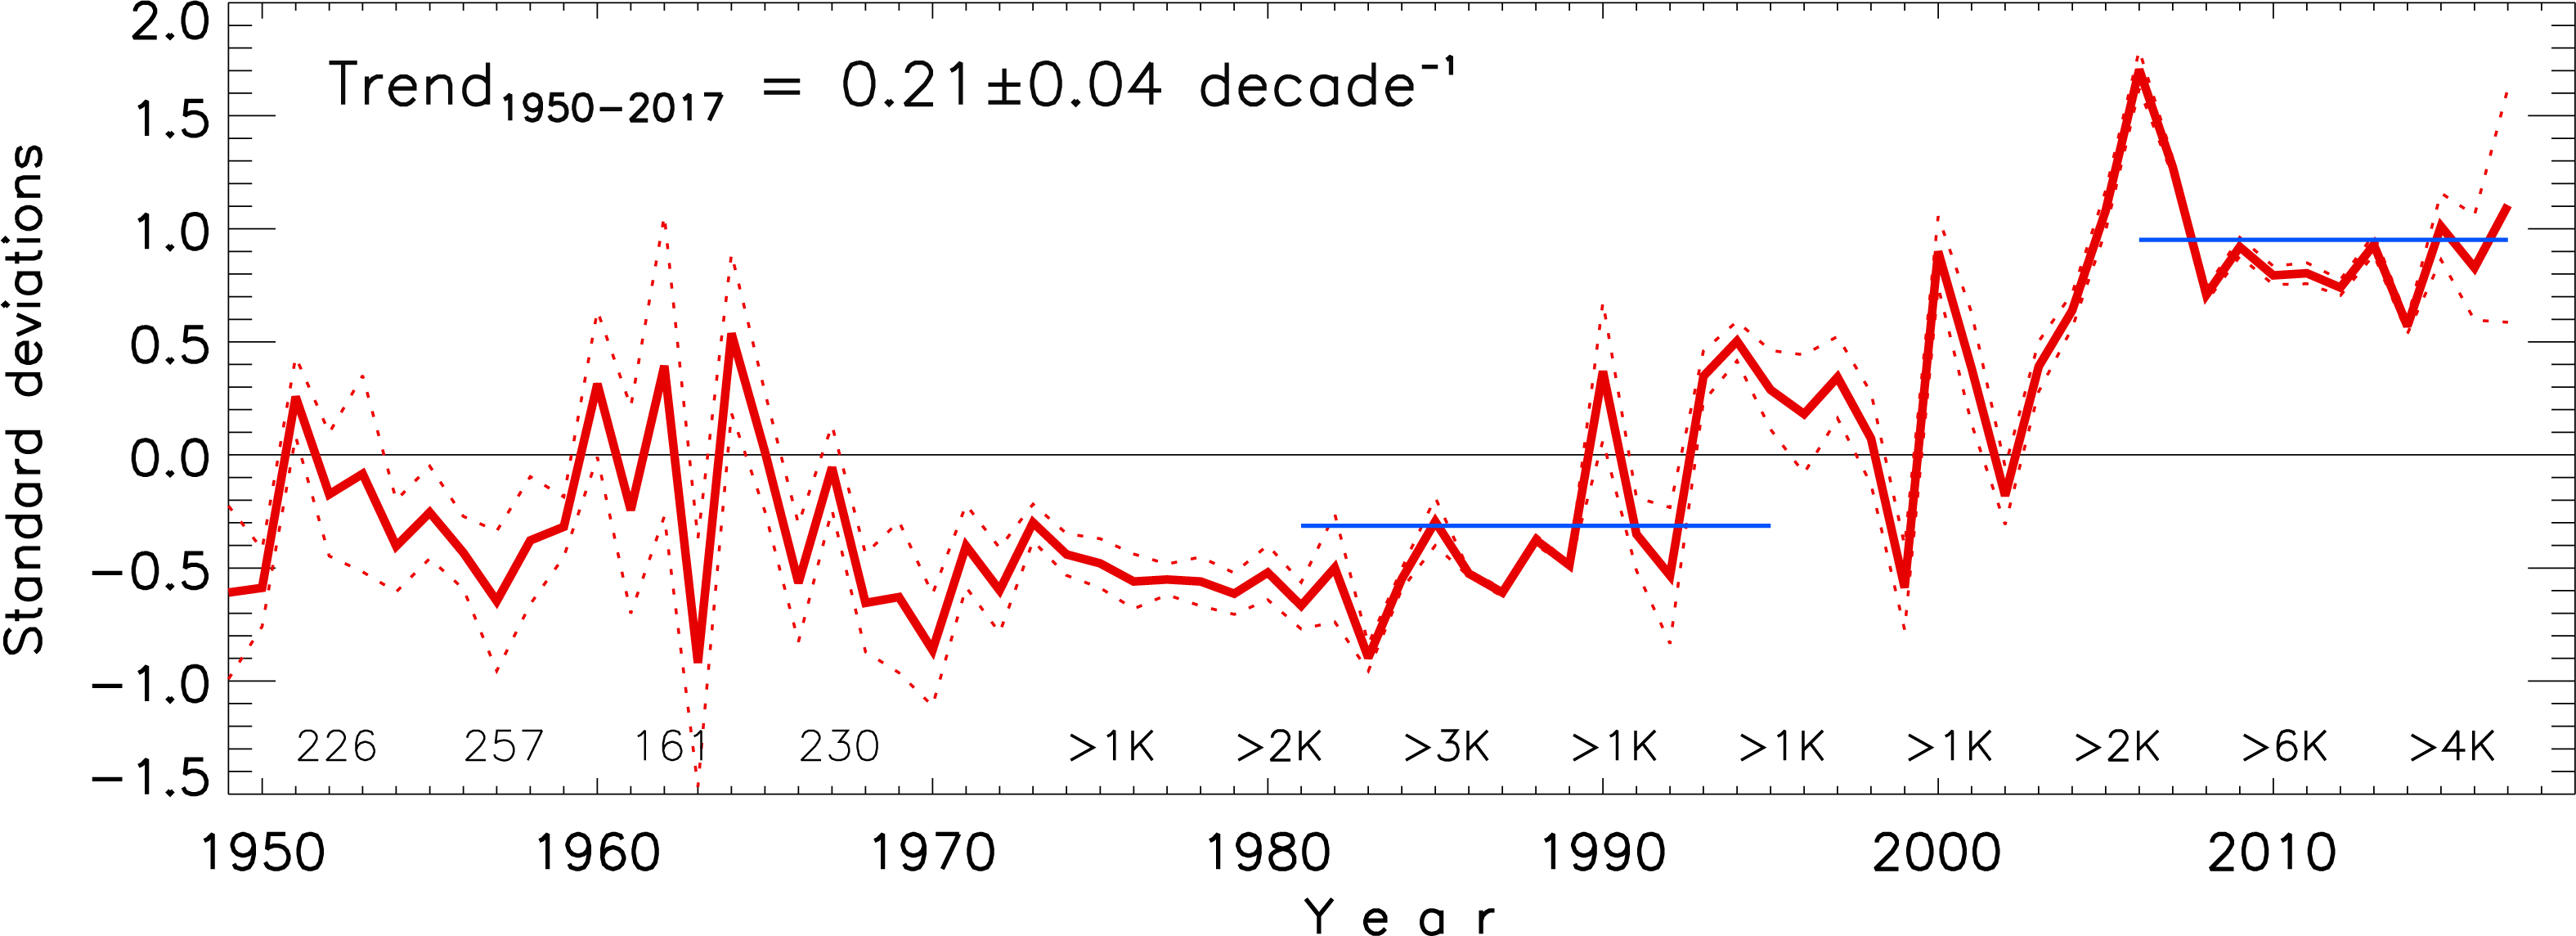
Figure 5. The Arctic Ocean normalized annual AW core temperature anomalies (from Polyakov et al., 2013a, extended by recent years). Red dotted lines show its 95% confidence interval defined by two standard errors. Numbers at the bottom denote the 5-yr averaged number of stations used in the data analysis. Horizontal blue lines show means over 1981–1995 and 2006–2017.
The spatial pattern of AW layer atlantification is shown in Figure 6. There is a strong basin-wide temperature increase in 2006–2017 compared with 1981–1995 (Figure 6C). Warming in 2010–2017 detected by CTD and ITP observations in the eastern EB is consistent with mooring observations that captured warming of the AW from the early 2010s. A consequence is that the eastern EB water temperature in 2018 was, on average, 0.5–0.7°C higher than in 2011 (Polyakov et al., 2020). Since changes of the AW core temperature and AW layer heat content are highly correlated (e.g., Polyakov et al., 2013a), we are not surprised to find consistent spatial patterns of temperature and heat content changes (Figures 6C,I, e.g., Polyakov et al., 2012). AW temperature changes were associated with basin-wide (except eastern part of the CS region and Fram Strait) shoaling of the upper boundary of the AW layer (Figure 6F, Polyakov et al., 2017, 2020).
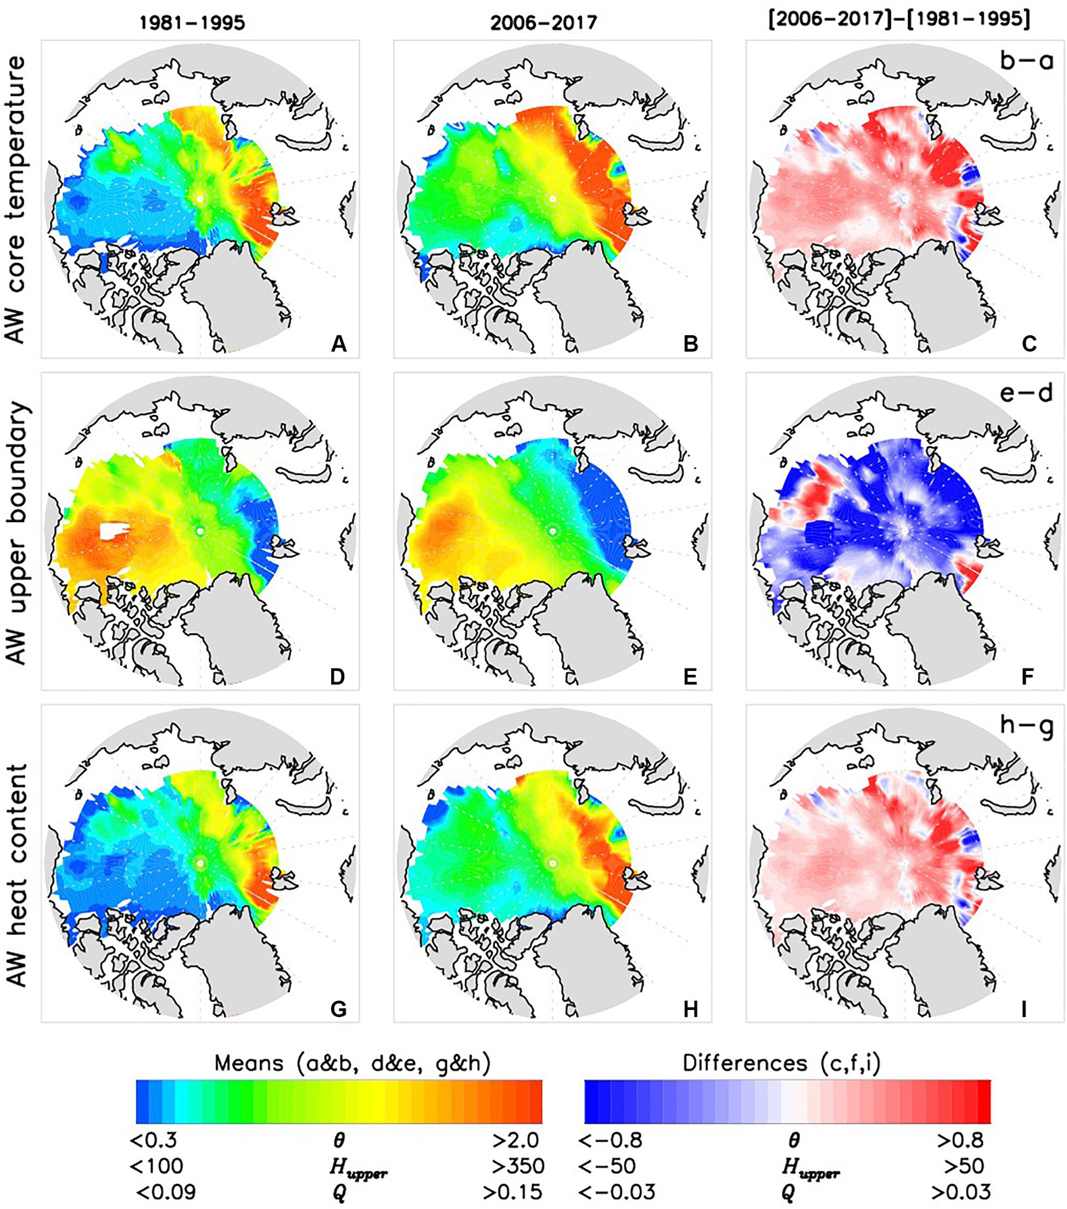
Figure 6. Averaged over (left column) 1981–1995 and (middle column) 2006–2017 AW core temperatures (A,B, θ, °C), depths of AW upper boundary (D,E, Hupper, m) and AW heat content density (G,H, Q, 108 J.m–3) and (right column) their difference (C,F,I).
Regional Changes in the Arctic Halocline
We next analyze pan-Arctic and regional changes in the Arctic Ocean’s halocline, constructing annual time series of halocline potential temperature θhalo, salinity Shalo, available potential energy APE, and depth of halocline base Hhalo (Figure 7). Spatial distributions of these parameters are averaged over 1981–1995 and 2006–2017 (Figure 8). Vertical profiles of decadal mean anomalies of potential temperature and salinity (relative to the 1980-2017 mean) and θ – S diagrams of decadal means are shown in Figure 9; as with our analysis of AW changes, we expand this analysis by adding anomalies in the 1970s which allows us to provide background information for changes in the 1980s–2010s.
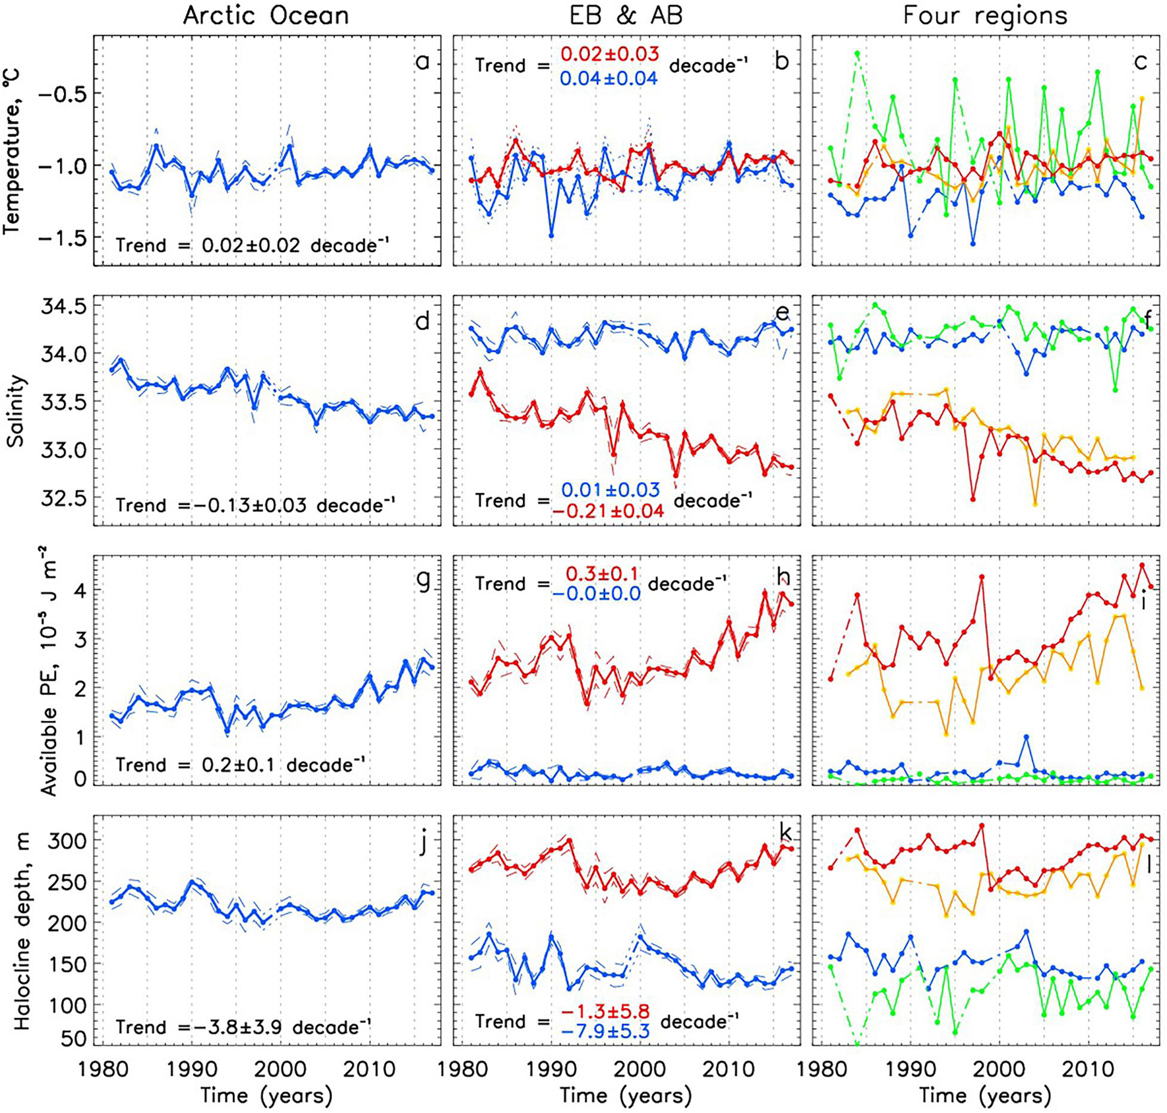
Figure 7. Annual pan-Arctic and regional halocline potential temperature θhalo (a–c), salinity Shalo (d–f), available potential energy APE (g–i), and depth of halocline base Hhalo (j–l). Solid lines connect dots with no gaps in between whereas dash-dotted lines are used to fill gaps. Dashed or dotted lines show standard errors at 95% confidence level; errors and trends for regional time series are shown in Supplementary Figure S7. In (b,e,h,k) red lines are used for AB and blue lines are used for EB. In (c,f,i,l) blue, green, yellow, and red lines are used for EEB, WEB, CS, and BG regions, respectively.
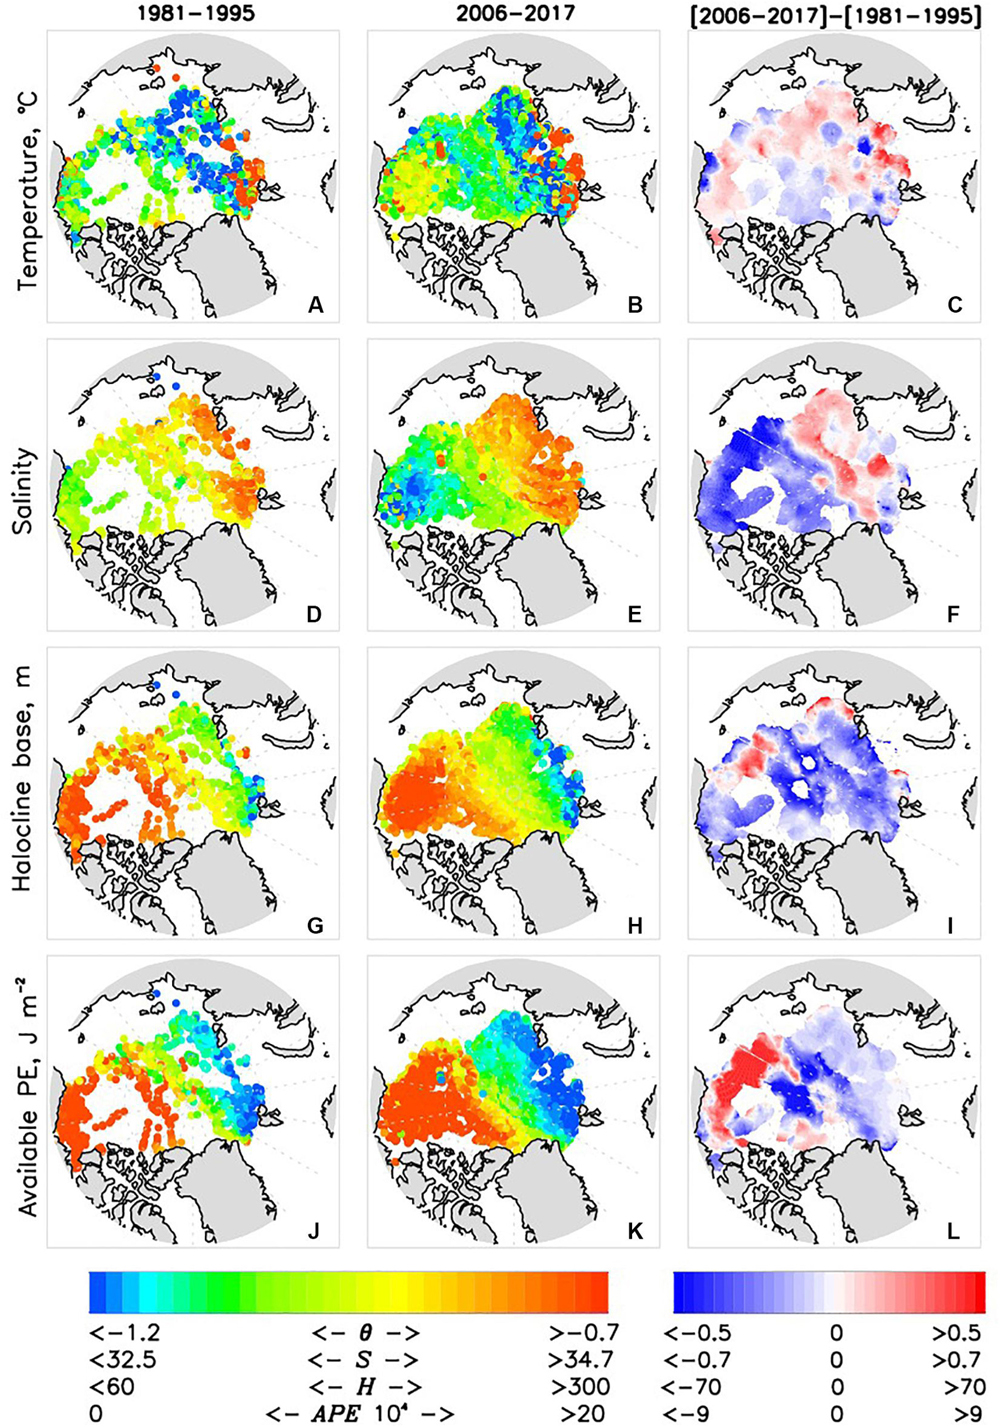
Figure 8. Halocline (A,B) potential temperature θhalo, (D,E) salinity Shalo, (G,H) depth of the base Hhalo, and (J,K) available potential energy APE averaged over the 1981–1995 (left column) and 2006–2017 (middle column). Corresponding [2006–2017]–[1981-1995] differences are shown in right column (C) = b-a, (F) = e-d, (I = h-g, and (L) = k-j].
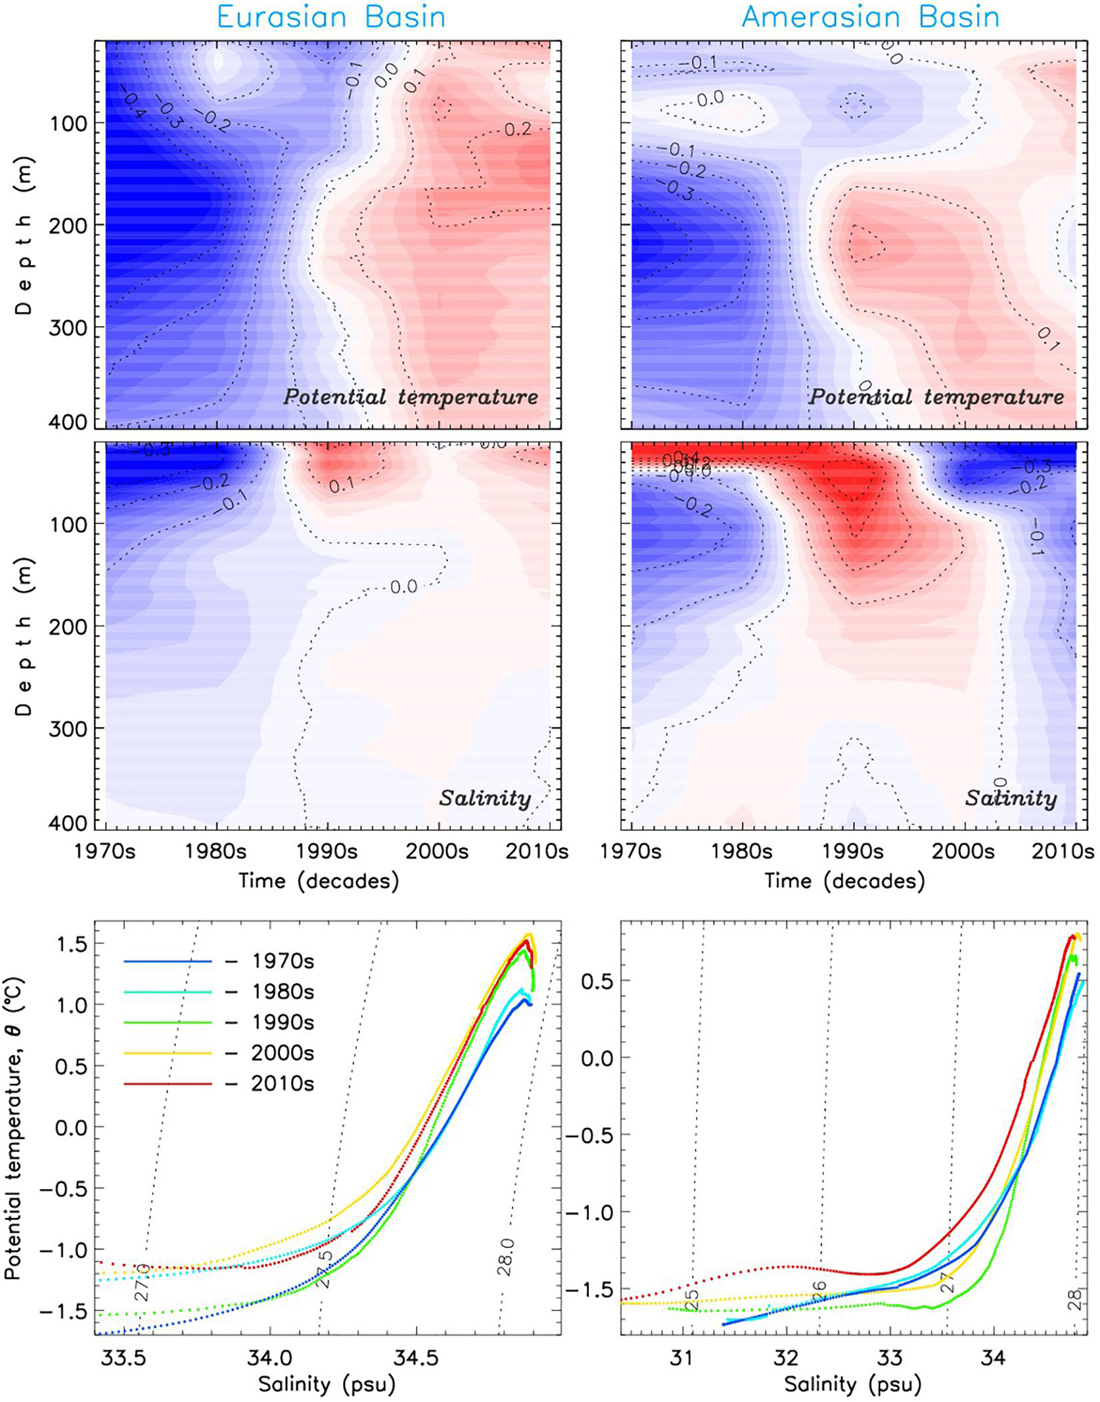
Figure 9. Decadal changes in the (left) EB and (right) AB of the Arctic Ocean since the 1970s. Anomalies relative to 1980-2017 mean of (top) potential temperature θ, and (middle) salinity S and (bottom) θ -S diagrams for decadal mean θ and S profiles.
Over almost four decades, θhalo shows that thermal changes in halocline were weak (Figures 7a-c). Figure 9 provides evidence that the warming in the lower halocline and upper AW was stronger than in the underlying and overlying water layers, both in the EB and AB.
Freshening of the upper AB in recent decades is well documented (e.g., Proshutinsky et al., 2009; Carmack et al., 2016). Our observations complement these findings by quantifying trends of continuous and spatially homogeneous halocline freshening in the AB and its regions (both CS and BG) since 1980 (Figure 7, Supplementary Figure S7). We note that the AB halocline is a complex system, incorporating several different water masses with distinct physical characteristics (Figure 3) and formation mechanisms. For example, analysis of CTD and ITP observations from the AB revealed a 18% increase of Pacific Winter Water volume from 2002 through 2016 and a 70 m deepening of its lower boundary over 2003–2011 in the northeastern basin as a result of Ekman pumping and lateral flux convergence (Zhong et al., 2019). Observations over three decades (1987–2017) demonstrated doubling of heat in the BG halocline associated with lateral pumping and subduction of warmer waters from the Chukchi Sea where they were anomalously warmed due to local sea-ice retreat and intensive absorption of atmospheric heat by ice-free upper ocean (Timmermans et al., 2018).
Halocline salinity Shalo in the EB shows a positive trend which, however, is not statistically significant (Figure 7e). Distribution of the halocline salinity difference between 1980s and 1990s vs. 2000s and 2010s in the EB shows that the signal captured by the regional time series is consistent with the salinization of the EB (Figures 8, 9). We note that changes in Shalo are readily transferrable to freshwater content changes.
Following Polyakov et al. (2018), APE is used to document changes in stratification of the upper Arctic Ocean. Spatial patterns of APE show contrasting changes in two major Arctic Ocean basins associated with strengthening of stratification in the AB (positive values, including both CS and BG regions) and overall weakening in the EB (negative values, including both WEB and EEB) (Figures 8J–L). These regional tendencies are accelerated in the 2010s compared with the 2000s as evidenced by estimates of linear trends (Table 2). This spatial pattern is partially related to changes of the depth of the halocline base. This relationship is confirmed by a relatively high correlation (R = 0.75 for both AB and EB) between regional time series of APE and Hhalo. However, in section “Attribution of 1981–2017 Changes in the Arctic Ocean to Borealization” we provide arguments that freshening of the AB and salinification of the EB by advection from upstream locations also play a role. For example, the trend toward stronger stratification in the upper AB is consistent with continued freshening in this region and deepening of the surface fresh layer due to intensification of the Arctic high and wind-driven convergence of upper ocean currents (e.g., Proshutinsky et al., 2009; McPhee et al., 2009). Contrasting changes in the upper EB are consistent with the recent findings of atlantification in the eastern EB (Polyakov et al., 2017).
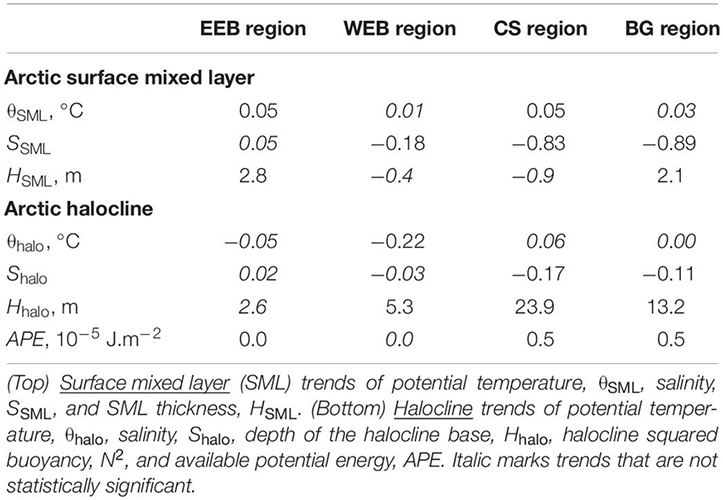
Table 2. Regional Arctic trends (per decade) in 1981–2017.
Regional Changes in the SML
Moving from deeper to shallower layers, we next consider changes in the Arctic Ocean’s SML. Annual time series of SML potential temperature θSML, salinity SSML, and layer thickness HSML are shown in Figure 10. Standard errors at 95% confidence level are presented for each time series in Supplementary Figure S8. Estimates of trends are shown in Supplementary Figure S8 and Table 2.
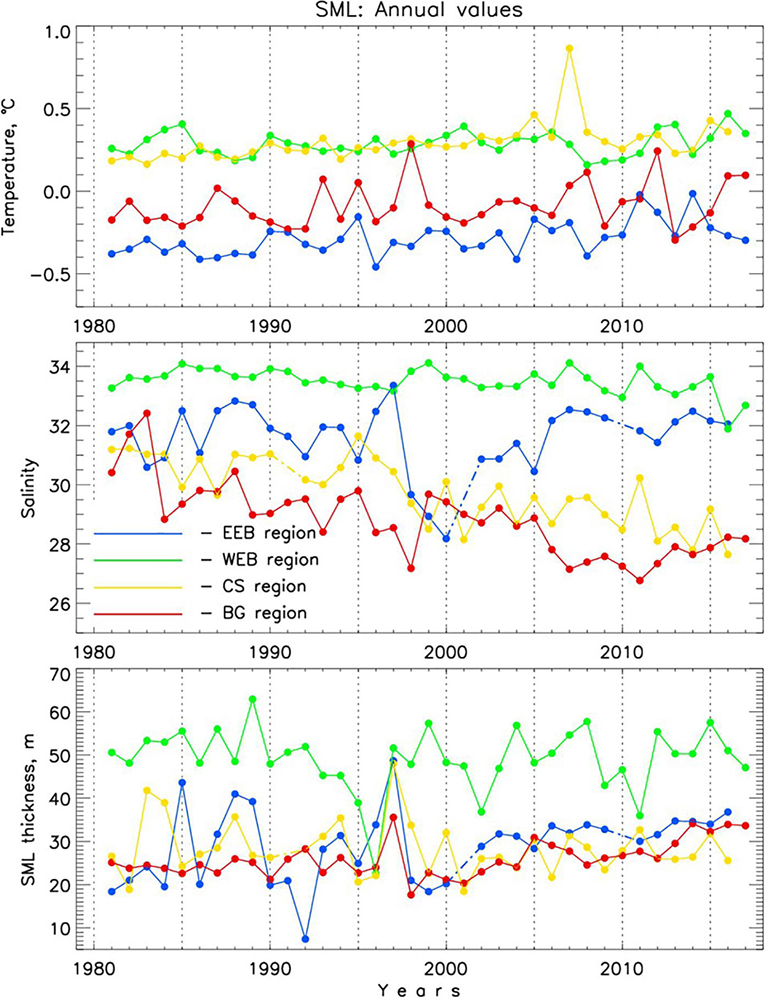
Figure 10. Regional annual Arctic Ocean surface mixed layer (SML) potential temperature, θSML, salinity, SSML, and thickness, HSML. Solid lines connect dots with no gaps in between whereas dash-dotted lines are used to fill gaps. EEB denotes eastern Eurasian Basin, WEB denotes western Eurasian Basin, CS denotes Chukchi Sea region, and BG denotes Beaufort Gyre region (see Figure 1 for definitions of the regions).
Over the last 37 years, the SML in all four regions became warmer as demonstrated by warming trends (Supplementary Figure S8, Table 2). SML warming in the EB in the most recent decade was accelerated relative to the 2000s whereas in the AB the warming rate decelerated. This dominant warming signal is consistent with the overall positive regional trends of the SML temperature estimated by Peralta-Ferriz and Woodgate (2015) for 1979–2012. The spatial pattern of SML temperature anomalies shows dependence on ice coverage, with enhanced warm anomalies in the areas of maximum ice retreat (Figure 11C). This is tied to the number of open water days (Frey et al., 2018) and is consistent with the amount of incoming solar radiation absorbed by the sea or ice surface with greater warming occurring in ice free areas and the pattern of satellite-derived sea surface temperature change (Timmermans and Ladd, 2018). Extensive overview (with numerous references therein) of regional impacts of the sea ice reduction on thermal state of the upper Arctic Ocean can be found in Carmack et al. (2015). Bintanja and Krikken (2016) provided a useful modeling perspective on the role of radiative forcing in shaping the upper Arctic Ocean warming.
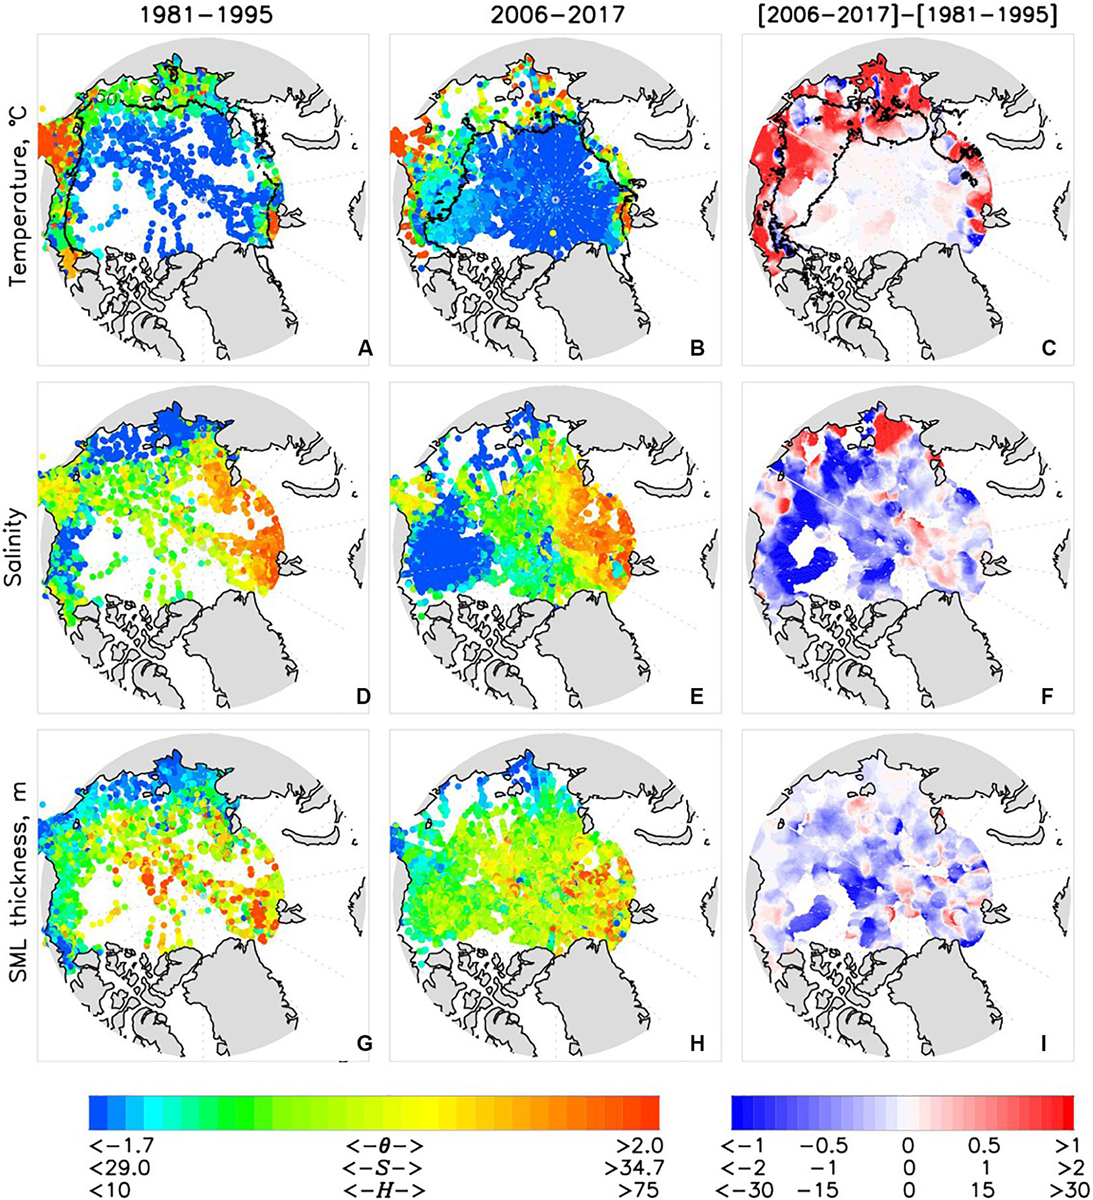
Figure 11. Averaged over (left column) 1981–1995 and (middle column) 2006–2017 SML (A–C) θSML, (D–F) SSML, and (G–I) HSML and (right column) their difference. Black line shows (A,B) 50% September sea ice concentration and (C) 30% sea-ice concentration difference.
In all regions but the EEB the SML experienced freshening over 1981–2017 (Table 2). Freshening and deepening of the SML in the AB (including CS and BG regions) is driven by a combination of enhanced sea-ice melt, redirection of Siberian riverine waters into the BG, and Ekman pumping due to anomalous atmospheric circulation of the Arctic High (e.g., Proshutinsky et al., 2009). We note here that the rate of freshening in both AB regions during the recent decade was comparable with that observed in the 1980s–1990s (Figure 10). The apparent increase of SSML in the EB was dominated by strong salinification over shallow Laptev Sea shelf (Figure 11F). Salinification of the EEB region since 1999–2000 led to almost as high EEB SSML as in the WEB – potentially a manifestation of atlantification of the EB (Figure 10). At the same time, the thickness of the SML increased in the EEB region since the late 1990s (Figures 10, 11); both SML salinification and thickening may be a signature of locally intensified sea-ice formation processes. We discuss the relative role of borealization in recent Arctic Ocean changes in the next section.
Attribution of 1981–2017 Changes in the Arctic Ocean to Borealization
Attribution of changes in the upper ocean (including halocline and SML) to borealization is not an easy task due to a host of local and remote forcings and complex feedbacks driving these changes.
However, concerning atlantification, our analysis confirms that at least in part the loss of stratification in the eastern EB halocline lies in processes originating upstream. Figure 12 (top) shows that changes of the halocline salinity, the main contributor to water column stability in the eastern EB, are well correlated with the lagged upper ocean salinity changes in the northern Barents Sea (Lind et al., 2018). The main drivers of the observed upper ocean salinity changes in the northern Barents Sea are sea ice changes in the western EB and eastern Barents Sea and Kara Sea (Lind et al., 2018), implying a similar response in the eastern EB. Sea ice changes in these regions are in turn closely linked to increasing AW temperatures (Årthun et al., 2012; Onarheim et al., 2014), and over the last decades the upstream AW temperatures have shown a substantial warming (Barton et al., 2018) as well as increasing salinities (not shown).
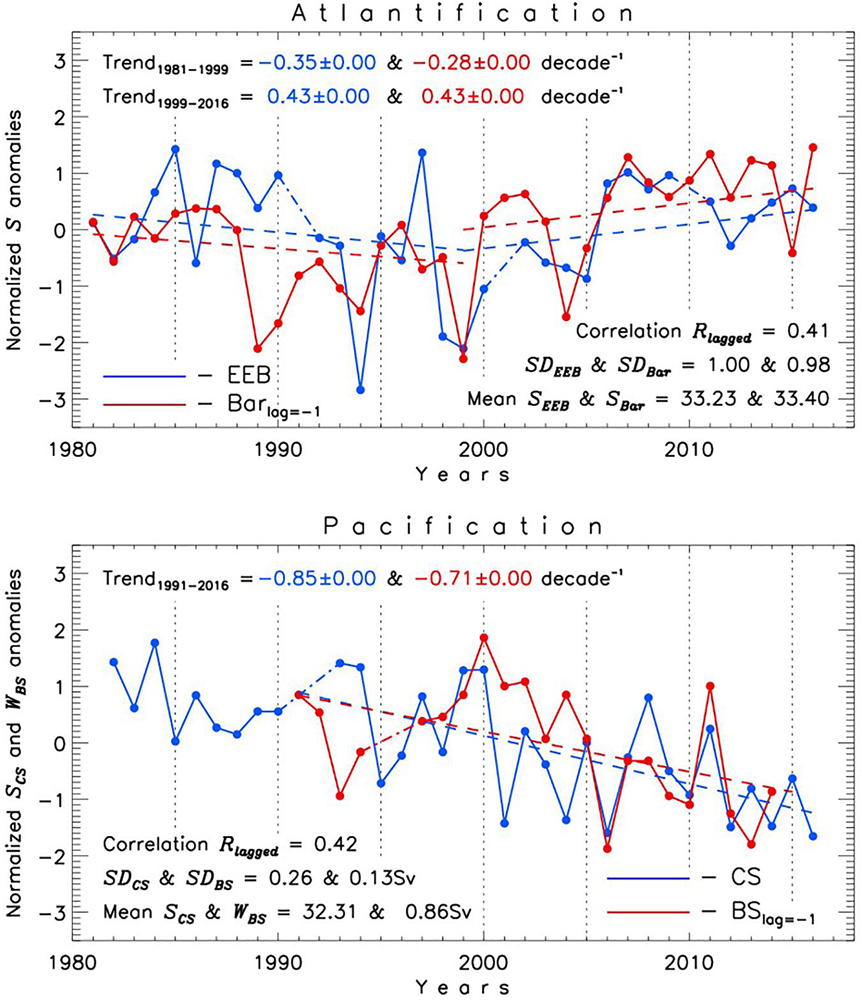
Figure 12. Normalized (reduced to anomalies and divided by standard deviation SD) regional annual time series of (upper panel) EEB halocline salinity SEEB and upper northern Barents Sea (Bar) salinity SBar and (lower panel) CS halocline salinity SCS and Bering Strait (BS) water transport WBS (Sv, reversed sign is used for this time series). Time series for SBar is from Lind et al. (2018). Data for WBS time series are from BS a2 mooring (Woodgate, 2018). SBar and WBS time series are lagged by one year. Dash-dotted lines are used to fill gaps (interpolated values are not used for statistical estimates). Trends are shown by dashed lines; trends in the upper panel are based on annual salinity values whereas trends in the lower panel are computed using normalized anomalies.
The role of pacification in recent high-latitude oceanic changes is illustrated by Figure 12 (bottom) showing decreasing Shalo in the CS region resulting from an increasing influx of relatively fresh Pacific waters through Bering Strait (the latter leads by one year) over the past almost four decades. The same lagged correlation is found for the BG Shalo time series (not shown).
We further this analysis by considering the relative roles of advective (remote) vs. local atmospheric heat sources in warming of the BG halocline. In this analysis, we followed the approach used by Timmermans et al. (2018) who compared pentadal changes in total heat content in the BG halocline with the amount of atmospheric heat absorbed by the upper ocean in summer in the northern Chukchi Sea over 1987–2017. Via this comparison, they argued that doubling of the amount of heat stored in the BG halocline over the past three decades appears attributable to the local summer solar heating of the upper ocean due to sea ice losses and larger oceanic absorption of atmospheric heat. In that, the relative role of this heat source in comparison with oceanic heat carried by the transport of water through the Bering Strait was neglected. Here we complement their analysis via a direct comparison of these two sources of heat for the BG halocline warming.
Using our estimates of halocline temperature for the BG region (Figure 7c), we evaluate the amount of heat stored in the BG region (Figure 13A) and find a doubling since 1981, in agreement with Timmermans et al.’s (2018) estimates. Figure 13A also shows the annual amount of heat passed through the Bering Strait (Figure 3 from Woodgate, 2018) and heat pumped into the northern Chukchi Sea (NCS) from atmosphere in summer. Following Timmermans et al. (2018), for the latter we used the same area limited by 70–75°N latitudes and 190–210°E longitudes, monthly SST, and subduction rates of 0.2 Sv (1 Sv = 106 m3.s–1). Temperatures measured in the Bering Strait were lower than SSTs from the NCS; both were higher than halocline temperatures in the BG region (Figure 13B). From Figure 13A, we find that the advective source of heat exceeds the local atmospheric source significantly, by a factor of approximately 25.
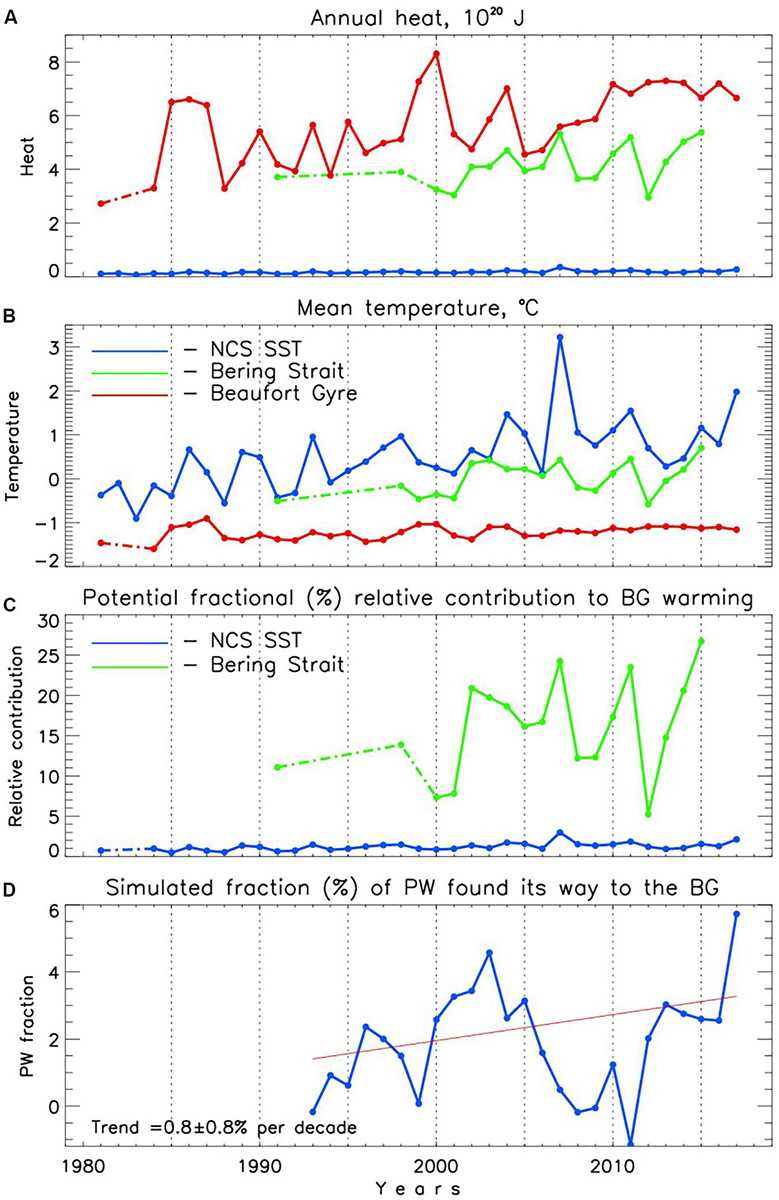
Figure 13. (A) Time series of the amount of heat accumulated in the BG region annually since 1981 (red), carried by Pacific waters through Bering Strait (green), and pumped into the ocean interior by summer (July–September) atmospheric heating (blue). (B) Annual mean water temperature of the BG halocline (red) and of Pacific waters passing through Bering Strait (green) and summer mean sea surface temperature (SST) of the northern Chukchi Sea (NCS, blue). (C) Relative contribution of Bering Strait (green) and NCS (blue) heat influxes to warming of the BG halocline. Broken lines are used to fill gaps. (D) Percentage of the PW increase that has entered the BG halocline layer (from SINMOD simulations). The red line shows linear trend.
We note that care should be exercised when comparing contributions of heat from different sources to changes of the total regional heat content. The relative contribution of influxes of heat from the Bering Strait and NCS region to BG halocline warming is estimated using Qsource = ρcp (Tsource – TBG)*Volsource*P/ΔQBG, where subscript BG refers to the Beaufort Gyre, source identifies either Bering Strait or NCS, ρ is the density of seawater (∼1030 kg.m–3), cp is the specific heat of seawater (∼3900 J.kg–1.K–1), T is temperature, Vol is an estimate of water transport across the Bering Strait (Figure 3D from Woodgate, 2018) or subduction rate of 0.2 Sv for the NCS (Timmermans et al., 2018), P is period of time (one year for the Bering Strait and three months for the NCS), and ΔQBG = 1.01 × 10¹⁹ J is the annual change of heat in the BG region over 1981–2017 evaluated using a linear trend. This formula assumes that a volume of source water with temperature Tsource substitutes the same volume of water in the BG with temperature TBG and confirms our earlier conclusion that the PW is potentially a greater source of heat for the BG warming compared with the local atmospheric heat fluxes (Figure 13C).
The utility of this comparison is limited, however, since this approach neglects heat losses on its way from each source to the BG interior. It is safe to assume that some portion of atmospheric heat pumped into the ocean locally, within the area of the Chukchi Sea slope, does not reach the BG interior due to ventilation of this heat back into the atmosphere in fall or storage of this heat in the upper ocean and later use to reduce the rate of sea ice formation. The fate of PW heat is not that clear either. For example, using reanalysis surface heat fluxes Danielson et al. (2020) demonstrated that the PW was losing up to 2.5 × 10²⁰ J annually into the atmosphere (equivalent to ∼14 ± 1 W/m2, mostly pronounced in fall and winter) while traveling over the Chukchi shelf prior 2014 but in more recent years the heat loss was enhanced reaching 3.1 × 10²⁰ J (∼18 ± 4 W/m2). These heat losses constitute up to 50–60% of the total amount of oceanic heat delivered into the Chukchi Sea through the Bering Strait (Figure 13A). An additional and poorly known PW heat sink is the contribution to regional summer ice melt. However, this heat loss can be roughly assessed by assuming that, in addition to atmospheric thermodynamic forcing, every summer oceanic heat melts ∼50% of 1.5–2 m of the Chukchi Sea ice cover (∼500,000 km2). This conservative approach yields ∼0.7–1.0 × 10²⁰ J of PW heat losses reducing estimates of the amount of PW heat reaching the BG interior by additional ∼20%. Another constituent of the potential PW heat losses is the amount of PW heat advecting around the BG without mixing with ambient gyre waters because of being trapped within the upper slope boundary current. Using mooring observations, Brugler et al. (2014) estimated PW heat transport (referenced to −1.91°C) of the Beaufort shelf break jet. In 2002–2004 the annual heat transport was ∼0.5 × 10²⁰ J, but in 2008-2010 it was reduced to ∼0.1 × 10²⁰ J due to increased easterly winds (R. Pickart, personal communication). These estimates of heat losses compared with the overall heat gain by the influx of PW heat through the Bering Strait (Figure 13A) suggest that prior to 2004 the identifiable heat fluxes balanced, while in later years they increased to approximately 0.3 × 10²⁰ J, which is sufficient to explain the observed warming trend of ΔQBG = 1.01 × 10¹⁹ J per year in the BG solely by pacification.
These estimates are in qualitative agreement with modeling results. SINMOD (Methods) was used to investigate the impact of pacification on changes in the BG. For that, the model was run twice. In one experiment, the PW transport across the Bering Strait was kept constant at 0.9 Sv. The second experiment repeated the first one but PW inflow across the Bering Strait increased from 0.9 Sv in 1992 to 1.1 Sv in recent years. The results from the simulations were used to estimate the percentage of PW entering the BG halocline layer due to anomalous PW influx (Figure 13D). This is calculated as the percentage of change in volumetric salinity in the BG halocline (PCSBG) compared to the increase in volumetric salinity influx across the Bering Strait:
where dS is the difference in annual halocline salinity in the BG halocline between the two model experiments, Vhalo is annual volume of the halocline layer in BG, SPW is the annual salinity of inflowing PW, and VPW is the volume of increased inflow across Bering Strait between the two model runs. Figure 13D shows strong interannual variability and underlying positive trend of PCSBG which explains an increasing role of PW in shaping the thermohaline state of the BG interior. Particularly, in the 2010s, the simulated PCSBG was as high as 2–5% which, applied to the PW heat transport across the strait, yields 0.1–0.2 × 10¹⁹ J per year, sufficient to explain warming of the BG interior by pacification. This conclusion resonates with results of Shimada et al. (2006) and Serreze et al. (2016) who emphasized the important role of the oceanic heat inflow through Bering Strait for the sea-ice edge position in the Chukchi Sea and beyond into the Beaufort Sea. It also contributes a critical addition to findings of Timmermans et al., 2018 who suggested that local atmospheric heat is an important contributor to warming in the BG interior.
In the next section, geochemical data provide further insights to the ongoing pacification of the western Arctic Ocean.
Geochemical Oceanography
In this section, we assess changes in the concentrations of geochemical parameters (Figure 14) and water types (Figure 15) averaged over the halocline in each region between two time periods (1981–2005 vs. 2006–2017). The use of maps averaged over longer time periods reduces biases associated with insufficient spatial coverage of the specific regions on interannual timescales. We show the combined influences of warming and freshening on the distributions of geochemical parameters across the pan-Arctic, and the influence of altered circulation pathways on the expanded distribution of Pacific sourced nutrients into the northern CS, Canada Basin, and central Arctic Ocean.
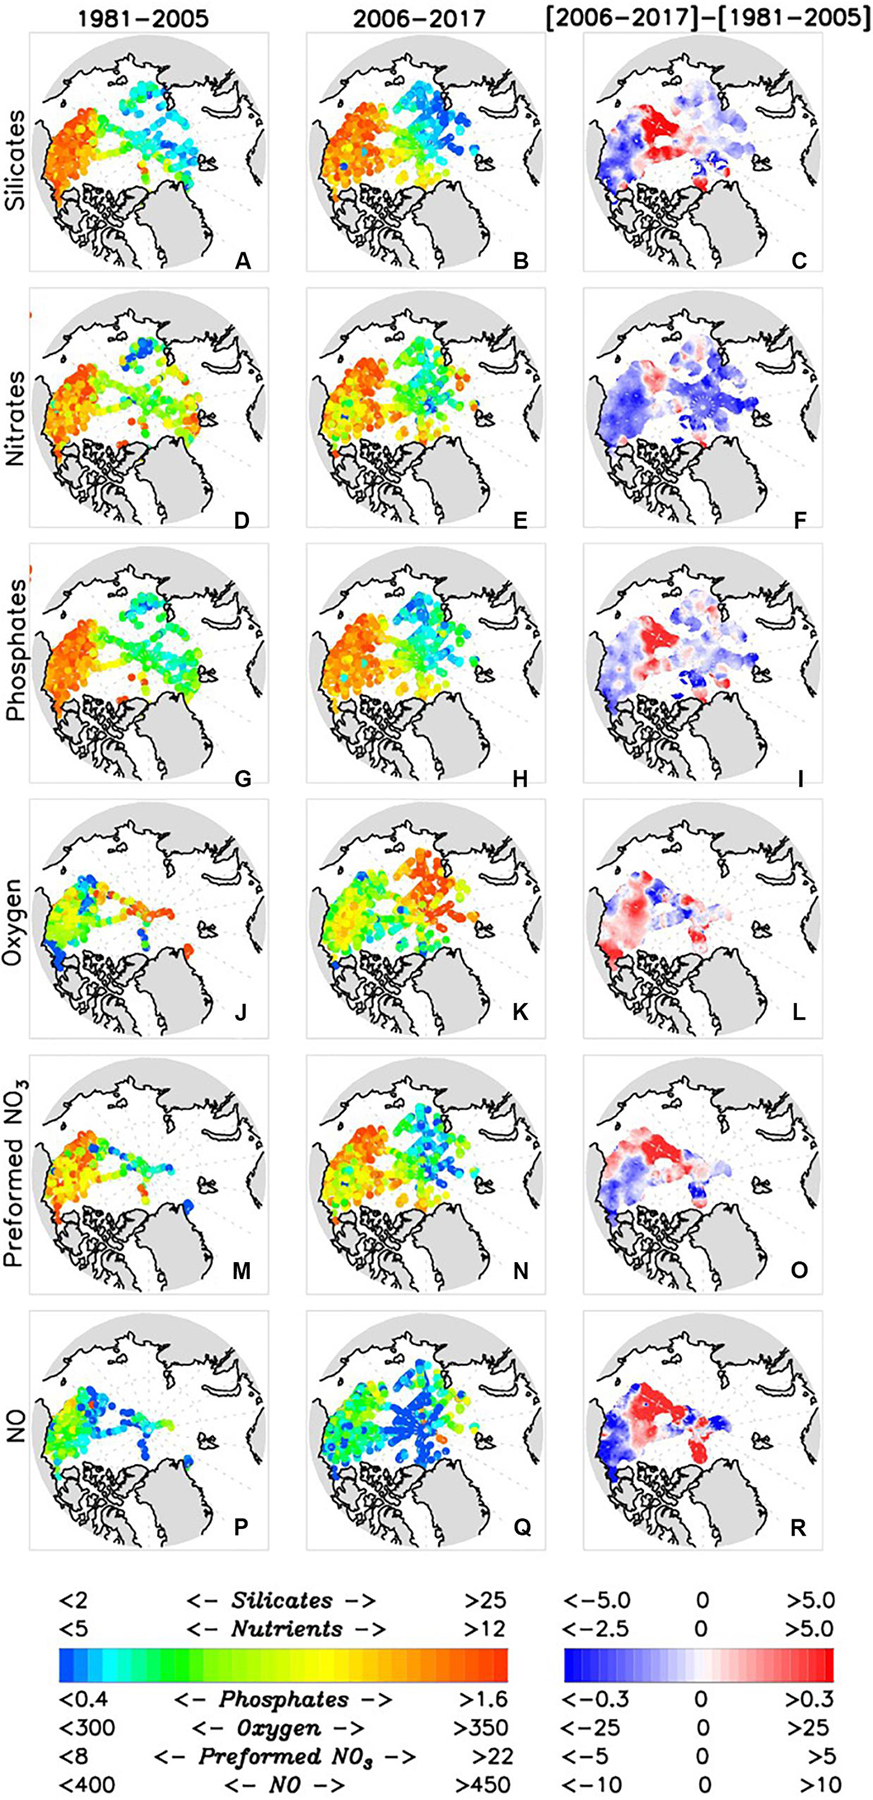
Figure 14. Geochemical observations in the halocline averaged over 1981–2005 (left column), 2006–2017 (middle column), and their difference (right column), including (A–C) silicates, (D–F) nitrates, (G–I) phosphates, (J–L) dissolved oxygen, (M–O) preformed NO3, and (P–R) NO. All variables are in mmol.m–3.
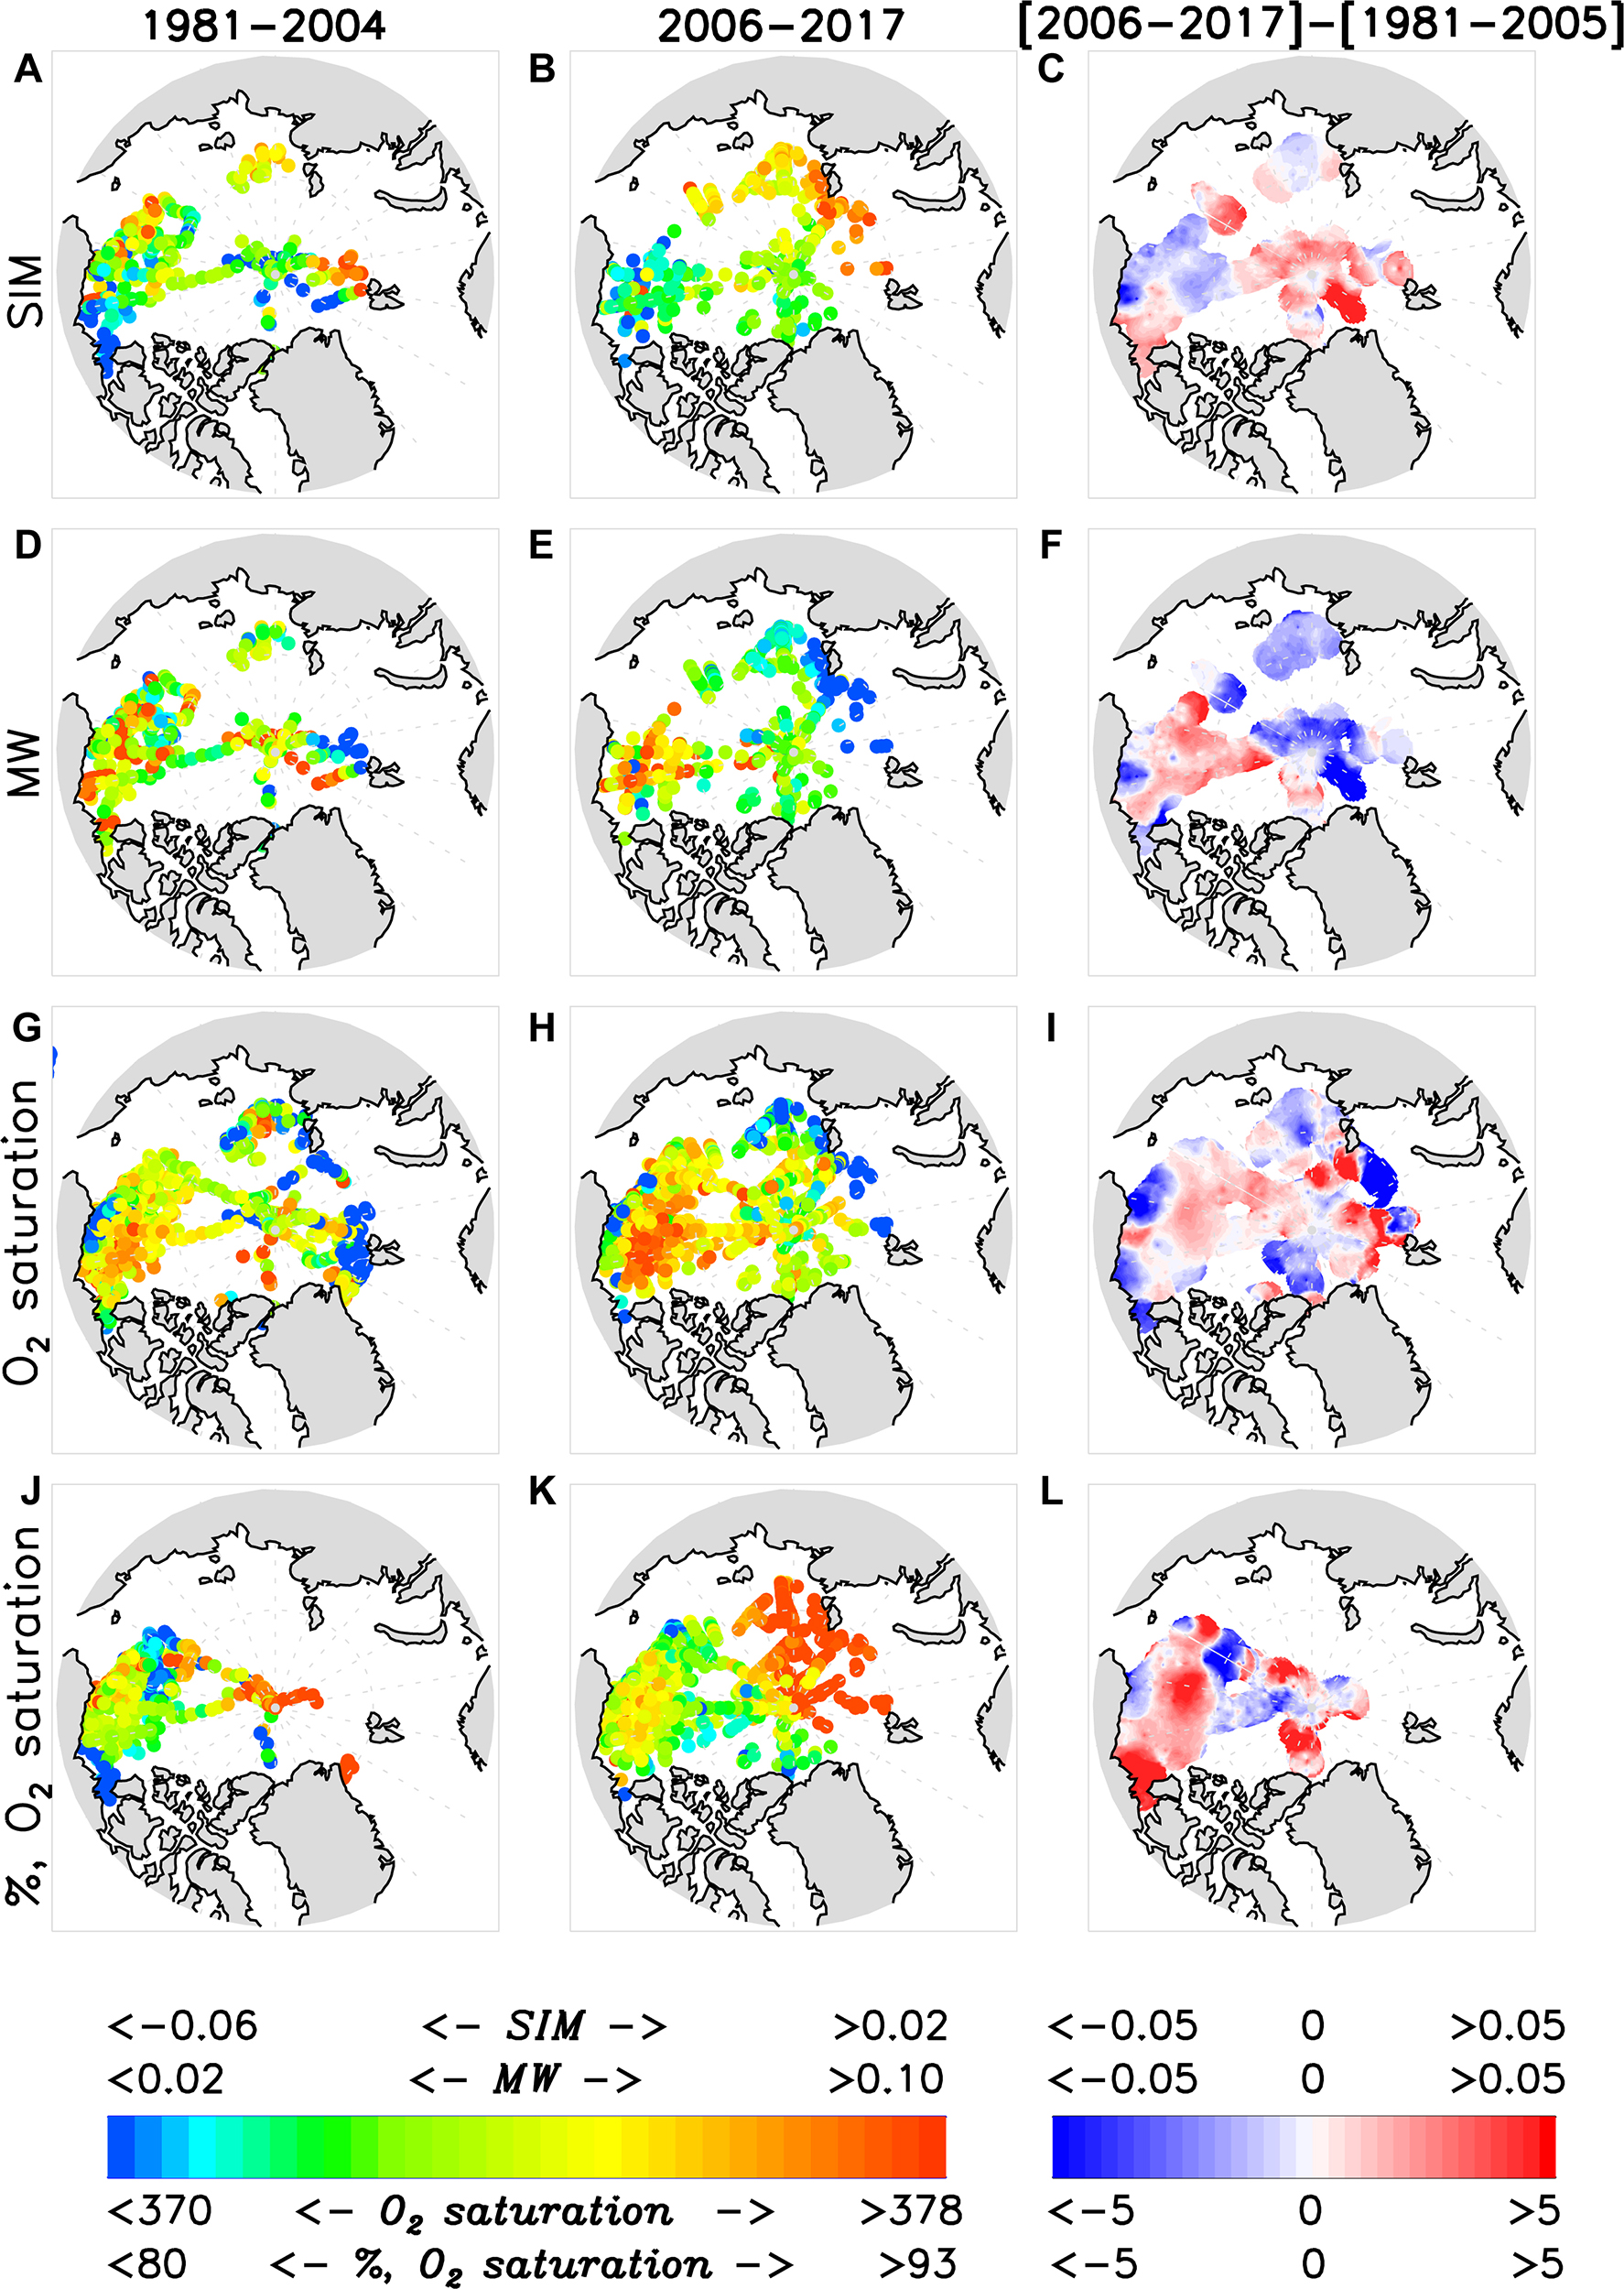
Figure 15. Geochemical observations in the halocline averaged over 1981–2005 (left column), 2006–2017 (middle column), and their difference (right column), including (A–C) SIM, %, (D–F) MW, %, (G–I) O2 saturation, mmol m−3, and (J–L) O2 saturation, %.
Geochemical Changes in the Eurasian Basin
Although few geochemical data are available in the EEB and WEB during the first time period [1981–2005], some interesting observations can be made concerning changes between the two time periods for the areas where data are sufficient.
Dissolved oxygen
O2 concentration data are lacking across the EEB and WEB during the first time interval; however, the small area of coverage in the northern WEB indicates O2 increased slightly between the two periods (Figure 14L). O2 saturation (a function of temperature and salinity where saturation increases with decreasing salinity and temperature) decreased in the EEB and generally increased in the WEB between the two time periods (Figure 15I).
Nutrients
Generally, the concentrations of all three nutrients, Si (Figure 14C), N + N (Figure 14F), and P (Figure 14I), decreased across the EEB and WEB between the two time periods. Much stronger decreases in N + N are seen in the WEB and slight increases in Si and P are observed in the central EEB (Figures 14C,F,I). These trends are consistent with a general decrease in N + N and P in the central Arctic Ocean, but are in contrast to the increase observed in Si, preformed-NO3 and NO (Figures 14O,R). This higher NO, coupled with increased Si and P, could be associated with an increased influence of Pacific halocline waters in the central Arctic Ocean between the two time periods, as previously discussed (e.g., de Steur et al., 2013; Krishfield et al., 2014; Alkire et al., 2015).
Water types
Meteoric water decreased in both EEB and WEB regions, consistent with results presented by Morison et al. (2012) and Alkire et al. (2015) suggesting MW was diverted from the Eurasian to Canadian Basins. These changes in MW content in the EEB and WEB are accompanied by a general decrease in MW in the central Arctic Ocean and an increase in SIM, whereas the proportion of SIM decreased within the EEB and increased in the WEB (Figures 15C,F).
Geochemical Changes in the Amerasian Basin
Dissolved oxygen
The O2 concentration increased over most of the AB domain between the two time periods (Figure 14L). To investigate the potential causes of this O2 increase, the changes in O2 saturation and percent saturation were also plotted (see Figures 15I,L). The change in percent saturation matches the change in O2 concentration but differs considerably from the change in O2 saturation in some areas. For example, the southwestern corner of the Chukchi Sea exhibited declines in O2 concentration, saturation, and percent saturation, suggesting that warming temperatures (Figure 8) drove the oxygen decrease (i.e., the saturation decrease due to warming exceeded the saturation increase resulting from freshening). In contrast, the O2 concentration and percent saturation increased in the southeastern Beaufort Gyre region despite a decrease in saturation. This indicates that the warming effect on saturation also exceeded that of the freshening, but the O2 increased regardless, perhaps due to biological processes.
Nutrients
Concentrations of Si (Figure 14C), N + N (Figure 14F), and P (Figure 14I) decreased throughout most of the BG and the southeast portion of the CS between the two time periods. Increased mean nutrient concentrations are notable in the central Arctic Ocean (generally, the central and deep areas of the Amundsen and Makarov basins) and the northernmost regions of the Canada Basin and CS, in addition to a small area off the western coast of Banks Island (Si and N + N only). Similar to the changes in nutrients, preformed-NO3 largely decreased in the BG and southeastern CS, but increased in the central Arctic Ocean and the northernmost regions of the Canada Basin and CS (Figure 14O).
The broad decrease in nutrients and preformed-NO3 in the BG are likely direct consequences of the impacts of Ekman pumping and the reduced salinity/increased stratification observed in the halocline (Figures 7, 8, 14C,F,I,O). Prior studies have shown a deepening of the nutricline in the Beaufort Sea and Canada Basin resulting from the increase in stratification and suggested that the increase in the stability of the water column will prevent new nutrients from entering the region via vertical mixing (McLaughlin and Carmack, 2010).
Presumably, lateral advection has not changed in the BG in such a way as to increase nutrient concentrations; however, it may play a primary role in the northernmost regions of the Chukchi Sea and Canada Basin, and further into the central Arctic Ocean. These northern regions generally correspond with areas exhibiting a deepening of the halocline base (Figures 7, 8). In addition, these areas also coincide with the position of the bottom/recirculation edge of the Beaufort Gyre and/or observed changes in the Pacific Winter Water circulation (Zhong et al., 2019). Winter PW is characterized by high nutrient concentrations, preformed-NO3 and NO (Shimada et al., 2005; Nishino et al., 2008; Alkire et al., 2019) and alterations to its circulation pathway(s) may have impacted nutrient concentrations in the halocline in this region.
Similarly, the general decrease in nutrient concentrations over much of the BG and CS could be a consequence, at least in part, of the advection of low nutrient waters into the region. Freshening of the upper halocline would entail drawing near-surface waters from nearby regions (e.g., Bering, Chukchi, and East Siberian Seas) that might have been depleted of nutrients during transport (since they were previously at, or near, the surface). The increased stratification prevents vertical mixing of these (now nutrient depleted) waters in winter. Overall, this would result in a decrease of the mean nutrient concentrations of waters being supplied to the halocline. Freshening also increases the O2 saturation and, if nutrients were depleted in the waters that are contributing to the halocline, an increase in O2 concentrations due to biological production might be retained, partially explaining the general O2 increase over the study region.
In combination with potential nutrient drawdown, reduced nutrient concentrations could be a consequence of the specific sources of freshwater that are being accumulated in the halocline of the CS and BG regions. For example, increases in the contributions of meteoric water/river runoff and sea ice meltwater to the halocline, especially at the expense of nutrient replete Pacific halocline waters, would likely lower nutrient concentrations.
Water types
The MW distributions also indicate an overall increase, in agreement with work by Morison et al. (2012). The MW increase in the northern half of the study region might be indicative of an influence from Siberian river runoff (Yamamoto-Kawai et al., 2005, 2009; Alkire et al., 2010; Morison et al., 2012), increased freshwater flux through Bering Strait (Figure 12; Woodgate et al., 2012), or a consequence of Ekman convergence (e.g., Proshutinsky et al., 2009). Unfortunately, we cannot specify the sources of the MW increases with the available data.
The SIM fraction is seen to increase in the southeast region of the Canada Basin and eastern Beaufort Sea. This region is prone to thin ice and early break up due to persistent easterly wind forcing that advects ice out of the region in the fall and spring (Steele et al., 2015). Summer sea ice concentrations across the Arctic as a whole, and in particular in the Beaufort Sea, have decreased precipitously between the periods compared in our study [1981–2005] and [2006–2017]. We speculate that the strong increase in SIM observed in Figure 15C reflects the more persistent seasonal melt-back of sea ice in this region since 2006, and the general anti-cyclonic gyre circulation that drives ice from the north eastern portion of the basin to melt in the south, contributing to an increase in net SIM fraction.
Summary of Geochemical Changes Between 1981–2005 and 2006–2017
Although spatial coverage was limited, particularly over the EB, some patterns have emerged in the geochemical data. Dissolved oxygen concentrations increased over most of the Arctic (including AB, central Arctic Ocean, and WEB) but decreased in the EEB. These changes were primarily associated with opposing changes in the saturation, which were impacted by higher temperatures (decreasing saturation) and decreasing salinity (increasing saturation); the O2 typically increased where the salinity effect exceeded the temperature effect.
Nutrient concentrations, in contrast, generally decreased over most of the Arctic, except in the northern CS and Canada Basin, as well as the central Arctic Ocean, where concomitant increases in preformed-NO3 and the NO parameter suggest an increase in the influence of Pacific halocline water. The decrease in nutrient concentrations to the southern CS and BG could reflect increased biological utilization, a loss of winter PW to this region and/or increased influences from Atlantic halocline waters or Alaskan coastal waters (relatively low nutrient content). The decline in nutrients over the EB occurs despite the atlantification of the EEB and associated deeper vertical mixing. The possible mechanisms responsible for this unexpected decrease, such as enhanced uptake of these nutrients upstream in the Barents Sea and/or reduction of Siberian shelf water influences to the halocline, require further study.
Biological Oceanography
Biological ‘borealization’ is a consequence of the physical and chemical conditions and processes described in the above sections given many organisms or their larvae are either transported with the water they are living in or follow the environmental niches formed by water masses properties and related processes. A tight connection between physical-chemical and biological ‘borealization’ is, therefore, thought to be associated with altered water mass transport and, with it, the transport of taxa biomass, propagules and/or prey communities from boreal areas into the Arctic. Changes in light regime, and warming and freshening of the Arctic halocline also have consequences for biological borealization through its effect on primary productivity and cascading effects on subsequent consumer levels. In this section, we first discuss changes in primary production based on literature and numerical modeling approaches. Thereafter we review published literature documenting borealization with regard to changes in species distribution and ecosystem function. Given the lack of observational biological time series placed in the areas matching the physics and geochemical sections of this paper, the review of the higher trophic levels is restricted to shelf areas.
Borealization and Primary Production
Coincident with the sea ice retreat and the altered light regimes, substantial changes have occurred at the base of the food web in the Arctic Ocean over the last decades and these are likely to alter entire marine ecosystems. The productive season has been prolonged (Arrigo and van Dijken, 2015), and both open water and nearby under-ice advected blooms (Johnsen et al., 2018) and early pelagic under-ice blooms have been observed (Arrigo et al., 2012; Assmy et al., 2017). The presence of autumn blooms has increased across all shelf seas and by as much as 70% along the EB margin during the last decade (Ardyna et al., 2014). The steepest increase in open water chlorophyll-a concentrations (reflecting algal biomass, not production) over the years 2003–2016 for the entire Arctic has occurred during May in localized areas of the ice-free Barents Sea, with an overall positive trend averaging 0.79 mg m–3 yr–1 (Frey et al., 2017).
Beside the direct effects of light and nutrient concentrations, primary production is also impacted by changes in temperature and stratification, through their impacts on metabolism and nutrient supply, respectively. Generally, increasing temperatures increase metabolic rates including growth but also maintenance metabolism. This change must be balanced by nutrient availability to be turning into enhanced production levels. Nutrient availability is enhanced with decreasing stratification (as observed in the EB) and higher ocean surface-atmosphere interaction, but decreases with increasing stratification (as observed in the AB in Li et al., 2009). Consistent with observations, SINMOD predicted an increase in new primary production in both large parts of the EB as well as the perimeter of the AB over the last years (Figure 16). The highest primary production estimates per m–2 was in WEB and the growth in annual primary production was also higher in this region compared to the other regions. From around the year 2000, the model predicted increase in primary production in all regions. In EB, the increase was a result of both a longer productive season and in some regions increased vertical fluxes of nutrients due to changes in the water mass structure shown above and the mixing regime. The model also shows that in this region, changes in light conditions increased the productive season and that the increase in production followed the path of the nutrient rich PW.

Figure 16. (a–c) Pan-Arctic (PA) and regional time series of mean annual primary production simulated by SINMOD. (d–f) Maps of simulated annual new primary production averaged over (d) 1981–1995, (e) 2006–2017 and (f) their difference. (g–i) Maps of simulated decadal mean sea surface temperature for (g) 2006-2015 and (h) 2090-2099 for the IPCC scenario RCP8.5 and (i) their difference. (j–l) Maps of simulated decadal mean new primary production for (j) 2006-2015 and (k) 2090-2099 for the IPCC scenario RCP8.5 and (l) their difference.
Effects of Atlantification on Consumer Trophic Levels
Coincident with warming, sea ice retreat and atlantification in the Atlantic Arctic gateway (i.e., southern area of the WEB, Figure 1) (see Section “Changes of Physical Parameters”), as well as with changes in primary production (section “Borealization and Primary Production”), substantial changes were also reported at consumer trophic levels in the Barents Sea. Changes in secondary production or growth have been observed with a doubling of the total biomass of the pelagic compartment, specifically krill and pelagic fishes, from the 1990s to the 2000s (Eriksen et al., 2017). Demersal commercial fish species such as Atlantic cod (Gadus morhua), haddock (Melanogrammus aeglefinus), saithe (Pollachius virens) and redfish (Sebastes spp.) have also shown positive trends in biomass through the last decades (Johannesen et al., 2012; Kjesbu et al., 2014; Bogstad et al., 2015; Haug et al., 2017).
Furthermore, substantial species distributional changes have been documented associated with the warming documented in section “Changes of Physical Parameters.” As for zooplankton, the favorable thermal habitat for boreal species such as the copepod C. finmarchicus and krill, has expanded northwards, whereas Arctic species (e.g., the amphipod Themisto libellula) have retreated further north (Zhukova et al., 2009; Orlova et al., 2010, 2015; Dalpadado et al., 2012; Eriksen et al., 2017). Observations show also recent northern expansions (141 km over 8 years) of boreal fish species such as capelin (Mallotus villotus), Atlantic cod, haddock, saithe and redfish through the last decade (Fossheim et al., 2015; Haug et al., 2017). In contrast and matching the warming trends shown above, Arctic fishes such as polar cod (Boreogadus saida) have declined in distribution area and biomass (Hop and Gjøsæter, 2013; Eriksen et al., 2015). In addition, expansion of boreal demersal species into the southern perimeter of WEB has resulted in increased predation pressure on the Arctic demersal fish community thereby altering the food web, reorganizing ecological communities and influencing ecosystem functions (Wiedmann et al., 2014; Fossheim et al., 2015; Kortsch et al., 2015; Frainer et al., 2017). Changes in functional characterization and food web configuration, driven by climate warming in general and atlantification in particular, have already transformed the Barents Sea ecosystem toward increased borealization (Fossheim et al., 2015; Kortsch et al., 2015).
Through the Fram Strait pathway, 30–50 kg C s–1 of zooplankton, primarily composed of C. finmarchicus (Basedow et al., 2018) are advected from the North Atlantic into the Arctic, a level of biomass that far exceeds local production. That biomass is transported eastward with the Arctic boundary current waters, contributing significantly to zooplankton biomass in the EB. Although the numbers of C. finmarchicus decline dramatically already in the Kara Sea, it has been observed in low abundances as far east as the East Siberian Sea (Ershova and Kosobokova, 2019). It is presumed that all C. finmarchicus biomass in the Arctic Ocean are allochtonous, since no reproduction or early life stages have ever been registered here for this species. The exact mechanism for this functional sterility is unclear, as is the exact northern boundary where this species is no longer able to complete its life cycle. However, increasing atlantification is likely to shift their biogeographical range northward and/or eastward, consistent with AW warming (Figures 5, 6). A 10-year time series in the Fram Strait showed that in recent years advected C. finmarchicus is developing faster, reaching later developmental stages by the end of the summer either due to earlier spawning or accelerated growth under warmer temperatures (Weydmann et al., 2018). Together with the above mentioned shifting patterns in primary production, this phenology change may lead to fundamental shifts in the biogeography of the Calanus complex in the Arctic Ocean in the future.
In the WEB, west and north of Svalbard, recent observations have revealed a marked epipelagic layer (< 50 m) dominated by copepods, krill and amphipods in addition to young-of-the-year fish advected northwards presumably fueling higher trophic levels (Knutsen et al., 2017). In addition, there is a distinct mesopelagic layer containing a range of larger organisms (krill, and amphipods and mesopelagic fish) associated with the AW between 200 and 600 m (Knutsen et al., 2017; Gjøsæter et al., 2017). This Atlantic mesopelagic layer is a continuation from the Norwegian Sea. With further atlantification, the biomass of this Atlantic mesopelagic layer may change, as can the patterns and structures of the layer. This might in turn imply changes in the pelagic ecosystem in the WEB.
As in the northern Barents Sea, northward expansions of the larger, mobile species are also documented in the WEB. Recent observations showed mackerel (Scomber scombrus) west of Svalbard (Berge et al., 2015), and Atlantic cod, haddock, capelin, Greenland Halibut (Reinhardtius hippoglossoides), redfish (Sebastes spp.) and shrimp (Pandulus borealis) are currently found as far north as the shelf break north of Svalbard (Haug et al., 2017). Although Atlantic cod in the region leaves the shelf break on feeding migrations (Ingvaldsen et al., 2017), they and the other demersal species cannot establish themselves in the deep Arctic Ocean, and any expansions are more likely to be eastwards than northwards (Hollowed et al., 2013).
Both the WEB and the northern Barents Sea shelf are home for several marine mammal species, some of them endemic, some of them ice-associated, and others seasonal migrants, and they respond differently to the warming and atlantification. Ringed seals (Pusa hispida) that are extremely dependent on sea ice seem to have followed the marginal ice zone in Svalbard that shifted from a position over the continental shelf northward to the EB (Haug et al., 2017). Such behavioral changes require increased energetic costs in finding food (Hamilton et al., 2015), and continued declines in sea ice are likely to result in further distributional changes, range reductions and population declines in this key Arctic species (Haug et al., 2017). The ice-associated harp seal (Pagophilus groendlandicus) has exhibited a significant decrease in body condition in the last decade, apparently with associated declines in pup production (Haug et al., 2017). Although this is likely associated directly with sea ice reductions, it has also been suggested that the species has been outperformed by the record-large cod stock in the area (Bogstad et al., 2015), supporting the earlier posed hypothesis that competition from northward expanding temperate area species may gain importance. Also, temperate marine mammals are showing northward expansions of their ranges (Skaug et al., 2004; Kovacs et al., 2011), which are likely to cause additional competitive pressure on some Arctic species, as well as putting them at risk of additional predation and diseases (Kovacs et al., 2011).
Effects of Pacification on Consumer Trophic Levels
In the Pacific Arctic gateway (CS region), evidence has also been accumulating over the past decade that representation of Pacific species and/or communities has increased. As in the Atlantic inflow areas, these are mediated through increased influence of Pacific-origin waters (Woodgate et al., 2012; Woodgate, 2018), though not all community shifts are readily tied directly to this cause, and some appear to be intermittent and related to periods of warmer and colder conditions. The evidence is primarily based on data from the Pacific Arctic shelves, namely the northern Bering, Chukchi and Beaufort Seas, where biological time series such as NOAA fisheries surveys (Stevenson and Lauth, 2019), the Distributed Biological Observatory (Grebmeier et al., 2010, 2018) and other comparisons from two or more time points or periods have become available. A lack of biological time series in the AB largely prevents any observations on potential pacification from these deep areas.
The first reported trans-Arctic transport of a Pacific diatom, Neodenticula seminae, into the Atlantic was associated with the increased flow of PW into north-west Atlantic (Reid et al., 2007). An important primary producer in the temperate Pacific including the Bering Sea (Katsuki et al., 2003), this species is thought to have been transported by the 1998/99 PW pulse along the Arctic boundary current and then likely through the Canadian Arctic Archipelago before it was picked up and tracked by the extensive North Atlantic continuous plankton recorder data set in 1999–2004 (Reid et al., 2007). Other trans-Arctic migrations (as were common during pre-glacial times in the Arctic) are expected in the future.
At the zooplankton level, a time-series compiled from a multitude of sources and covering the period from 1945–2012 showed the zooplankton community on the Chukchi shelf to have had Bering-Pacific biogeographic affinity throughout the record, but with warming and ice decline having increased the influence of the Bering-Pacific components (Ershova et al., 2015). Consistent with increased PW influx across the Bering Strait (Woodgate, 2018), zooplankton biomass increased overall – embedded in large interannual variation and gear-biases, mostly driven by increases in abundance of C. glacialis transported from the North Bering Sea. There is limited evidence of northward shifts in distribution of other Pacific copepod species, such as Metridia pacifica and Neocalanus spp.
Despite the increasing inflow of PW into the CS region, the long residence time on the broad and shallow northern Bering/Chukchi shelf serves as a significant impediment for range expansions of most pelagic Pacific species into the AB. While some Pacific zooplankton, such as Eucalanus bungii and Metridia pacifica are regularly observed over the Chukchi and Beaufort sea slopes in the BG and northern CS regions (Kosobokova et al., 2011; Smoot and Hopcroft, 2017) and even in the off the shelf of the East Siberian Sea (Ershova and Kosobokova, 2019), they never compose a significant portion of the plankton in the these regions, in contrast to C. finmarchicus. Just like C. finmarchicus, these Pacific species are only observed as late stages and are presumed to be sterile expatriates (Kosobokova et al., 2011). Even “pan-Arctic” species, such as C. glacialis may be represented by a separate population in the Pacific Arctic, which does not survive far past the shelf break. This is supported by the distribution of developmental stages, which in Pacific-origin water are composed only of late stages, suggesting absence of recent reproduction (Ershova et al., 2015), as well as, on the genetic level, the sharp boundary in distribution between “Pacific” and “Arctic” C. glacialis haplotypes (Nelson et al., 2009).
At the seafloor, northward shifts in otherwise persistent macrofaunal biomass hotspots in the northern Bering and southern Chukchi seas between 1998 and 2015 coincide with sea ice decline and ocean warming in those regions (Grebmeier et al., 2018). Community shifts were variable across the region in terms of taxonomic composition and patterns in trends, and are at least partially indirectly associated with hydrographic changes through their effect on sediment grain size composition. In addition, macrofaunal studies relate the discussed biological changes primarily to ice decline (Grebmeier, 2012; Grebmeier et al., 2018) which is linked to pacification in the CS. Shifts in relative dominance of certain indicator species (in this case two brittle star species) in the Alaskan Beaufort Sea between the 1970s and 2010s were also thought to be related to the strength of the boundary current, a transport pathway of pelagic larvae for the species more common in the CS (Ravelo et al., 2015). Whether any of these benthic shifts would perpetuate into the basin is doubtful given Pacific-affinity species are virtually absent in deep slope and basin areas of the CS and BG margins today and seem to have limited depth tolerance (Zhulay et al., 2019; Ravelo et al., 2020). As with holozooplankton, range expansions of largely immobile benthic animals are limited by residence time of their pelagic larvae on the CS shelf. While larvae of north Pacific species get carried through the Bering Strait (Ershova et al., 2019), it is unlikely that they can successfully settle to become adults outside of the Chukchi and western Beaufort Sea shelves.
In contrast to the Atlantic gateway, the so-called cool pool in the Bering Sea has so far kept commercial fish species out of the Chukchi and Beaufort Seas at harvestable levels (Norcross et al., 2010; Logerwell et al., 2015). The center of distribution of several Pacific fish and shellfish species, however, has moved northward between 1982–2006 related to the retreat of the Bering Sea cold pool obvious in warming bottom water temperatures (Mueter and Litzow, 2008). In the subsequent decade, northward range expansion has continued and is also suspected for additional commercial fish species such as Chinook salmon (Logerwell et al., 2015) with several stocks of fish and shellfish Bering flounder and snow crab evaluated to have the potential to reach the CS in commercially relevant numbers (Hollowed et al., 2013). After the virtual disappearance of the cold pool in 2018 it is suspected that low research catches in traditional fishing grounds could be related to fish having moved north (Cornwall, 2019; Huntington et al., 2020) which was confirmed for some species by a northern Bering Sea survey in 2019.
At even higher trophic levels, seabird composition changes from a more piscivorous to a more planktivorous community in the north-eastern Chukchi Sea from 1975–1981 to 2007–2012 are interpreted in light of the above mentioned increased availability of large zooplankton species and sea ice declines in that region (Gall et al., 2017). A combination of hydrographic and benthic community changes may be the basis for pacification in marine mammal distributions such as the northward shift of East Pacific gray whales which have increased the length of their stay in the Arctic region (Moore, 2016).
Synthesis
Analysis of observations and modeling results reveals that fundamental changes in key components of the Arctic climate system have resulted from borealization. These changes are persistent in time, have large-scale spatial patterns, and are multidisciplinary by their nature. A brief synthesis of changes in the physical, geochemical, and biological components of the system and trajectory of the future changes is given below.
Summary of Arctic Changes Associated With Borealization
Changes in Physical Component
Strong warming in the SML has a pan-Arctic signature; this transformation of the upper ocean is driven by local processes and is not directly related to borealization. Increased SML temperatures, particularly in the marginal ice zone, have direct impact on biological rates (e.g., Krumpen et al., 2019). In contrast to the nearly ubiquitous pattern of warming in the SML, changes of salinity and stratification in Arctic halocline show striking regional differences. Particularly, in the EB, shoaling of the AW layer, driven by atlantification, brings nutrient rich waters closer to the surface; injection of saltier and denser water from the Barents Sea into the EB halocline (also driven by atlantification) makes the upper ocean less stratified and more susceptible to mixing. Overall, changes in the physical components in the EB establish more favorable conditions for higher biological productivity in the central basin. At the same time, as a result of local processes the upper central AB has become more stratified, thus constraining communication between the surface and underlying waters and limiting vertical mixing and the flux of nutrients to the surface layer. The effects of pacification are well pronounced at the basin’s periphery where PW enters.
Changes in Geochemical Component
Few data were available to assess geochemical changes in the WEB and EEB, but still suggest that O2 and nutrient concentrations generally decreased in the halocline despite the atlantification of the EEB and associated increased vertical mixing. In the data richer CS and BG regions, nutrient concentrations also decreased (except in the northern CS and Canada Basin) but O2 mostly increased. These changes can be explained by the overall reduction in salinity of the halocline by nutrient depleted waters. However, it is difficult to discern to what extent these changes are driven by the accumulation of low nutrient waters (e.g., in the Beaufort Gyre), changes in the advective pathways of nutrient-replete halocline waters, and/or suppression of vertical mixing; though all three processes likely contribute to some degree. Although the decrease in mean salinity of the halocline was widespread over the BG and CS regions and correlated strongly with the increased influx of Pacific water through Bering Strait, the geochemical analyses suggest that increased nutrients were generally restricted to the northern half of the CS and Canada Basin. Thus, the observed changes in the biogeochemical properties of the BG and CS are significantly influenced by modifications to the circulation pathways of the different varieties of Pacific halocline waters (probably mostly driven by remote factors), meteoric water/river runoff (local factor), and sea ice melt resulting from enhanced Ekman pumping and reduced sea ice cover (also mostly local factor).
In general, increased nutrient concentrations were only found in regions suspected of increased Pacific water influence (specifically Pacific Winter Water). The overall decline in nutrient concentrations within the Arctic halocline has important implications for biological production. While changes in stratification may have opposing impacts on the potential for vertical mixing in the EB and AB, the pattern of change in the mean nutrient concentrations within the halocline suggests any increases in primary production may be restricted to those regions that have experienced both an increase in PW influence and vertical mixing.
Changes in Biological Component
There is clear evidence for borealization (northward range expansions and associated ecosystem changes) of a series of invertebrate and vertebrate species including commercial species and their prey in both the northern Barents Sea and WEB (‘atlantification’) and CS (‘pacification’) regions. Regarding biomass levels, these changes are more substantial in the Atlantic inflow, especially considering levels of (potentially) harvestable species. The majority of the documented shifts are confined to the shelves while the further expansion into the basins is less documented and for many species not very likely. This is because very specific habitat requirements related to food availability, reproductive behavior etc. confine them to shelf areas. Substantial biomass inflow of primarily the boreal staple prey Calanus finmarchicus, however, arriving with the AW and getting carried into and through the WEB with the Arctic Circumpolar Boundary Current along the slope (Bluhm et al., 2020, this issue) could change the basin ecology if they would be able to survive in the deep polar basins in the future. Similarly, potential northward shifts in the distribution of mesopelagic organisms combined with observed and predicted increased primary production in the Arctic Basins may have the potential to shift the level of the current oligotrophic state, at least in the EB; but such scenarios are hypothetical at this point.
Feedback Mechanisms Induced by Borealization
Discussing recent changes in the eastern EB, Polyakov et al. (2020) identified a positive ice/ocean-heat feedback as an attribute of atlantification. In this feedback, increased winter ventilation of the ocean interior associated with declining sea-ice cover and weakening of halocline stratification enhances release of heat from the ocean interior to the sea surface resulting in further sea ice loss. This mechanism is somewhat analogous to the ice-albedo feedback, in which atmospheric warming leads to a reduction of ice and snow coverage and decreasing albedo, resulting in further snow and sea ice retreat (Manabe and Stouffer, 1980). Similarly, Danielson et al. (2020) and Tachibana et al. (2019) described and demonstrated positive feedbacks in the Pacific Arctic associated with enhanced oceanic heat content that triggers anomalous northward winds that in turn reduce sea ice growth and contribute to anomalous oceanic warming in the following year. Shimada et al. (2006) also suggested a positive feedback mechanism in which increased inflow of warmer PW also plays the key role in shaping diminishing sea ice cover.
As with the ice-albedo feedback, the contribution of the ice/ocean-heat feedback to long-term sea ice trends depends on a host of local and remote (borelaization-related) factors that affect vertical heat transfers across the ocean halocline to the upper layers and sea ice. The local forcings include sea ice concentration and thickness altering the intensity of winter convective mixing, baroclinic tidal response to changing stratification (Baumann et al., 2020), and wind stress impacts on sea ice and on AW upwelling. Polyakov et al. (2020) argued that the recent transition of the eastern EB in dominant mixing regime from slow, molecularly driven, double diffusion to more intense shear-driven mixing (an atlantification-related process) also affects the relative magnitudes of vertical heat fluxes. We add here that the effect of the ice/ocean-heat feedback is more far-reaching given that the sea ice affected by this feedback also alters ice-albedo feedback. The results are that multiple feedback mechanisms become a part of more general and powerful feedback (ice-albedo/ocean-heat feedback) incorporating interacting Arctic atmosphere, ice, and ocean. These feedbacks merge effects of local and remote forcings making them an efficient and powerful component of high-latitude climate change.
Borealization in the Future (Modeling Perspective)
The trajectory of Arctic borealization into the future was evaluated using SINMOD simulations with atmospheric forcing from MPI-ESM data for the RCP 8.5 scenario (e.g., Slagstad et al., 2011, 2015). While model limitations are acknowledged, there is no indication in model results that the Arctic Ocean interior will become cooler. The model showed increased water temperature in the inflow regions of both PW and AW forced by increasing air temperatures in Arctic and sub-Arctic regions and further reduction in sea ice cover (Figures 16g–i). According to the model, there is no sign of systematic slowing of the tendency for atlantification in the EB, which will continue over the next decades with a particularly large impact on water column structure and properties in the northern Barents Sea and along the inflow paths of AW (e.g., Slagstad et al., 2015). The model also projects some increase of water temperature on the Chukchi and Beaufort seas shelves and slopes. Because the inflow of PW through Bering Strait was kept constant in these experiments, however, the simulated changes in water temperature are forced by increasing air temperature and changing ice conditions in the proximity to the strait. Still, it is reasonable to assume that future changes in PW inflow rate and temperature will additionally impact the oceanographic conditions in the region.
By analogy with the currently observed integrative multidisciplinary changes in the Arctic Ocean, these projected changes in the physical component should have strong impact on the future state of geochemical and biological components of the Arctic climate system. Indeed, SINMOD has predicted that physical changes related to atlantification will lead to increasing new primary production along the major AW pathways (Figures 16j–l). In the AB, the model suggests that the strongest changes will occur along the slope and the path of inflowing nutrient rich PW. In the central AB, however, freshening will reduce nutrient availability and will limit new primary production (Figures 16j–l). Previous studies where SINMOD was run with an ice-free summer scenario in the Arctic Ocean, indicate that nutrient limitation will eventually set a limit to annual primary production in both the EB and AB (Slagstad et al., 2015). We note that even though the model predicts increasing production, in the Arctic Ocean it will be still low compared to that in subarctic seas where commercial fishery is important.
There is a tight coupling between the atmosphere, cryosphere and the ocean in the Arctic (e.g., Callaghan et al., 2011) that needs to be captured by the models in order to provide high quality predictions. Globally forced physical and biogeochemical models show similar trends but deviation between models (e.g., validity of vertical mixing algorithms, assumptions about nutrient distribution and the selection what autotrophic and heterotrophic organism) can be extensive. Regional, nested models do better. Previous comparison of observations and SINMOD data provided good agreement regarding ice cover and hydrography in the Atlantic sector of the Arctic (e.g., Slagstad et al., 2015). The skill of the biophysical models is in turn closely related to how well ice and ocean physics are represented. Uncertainties associated with future projections of primary production is thus tightly connected to uncertainties related to Earth System Models (e.g., Vancoppenolle et al., 2013; Slagstad et al., 2015). Predictions of primary production are sensitive to representation of light penetration through ice and water (e.g., Babin et al., 2015). Lee et al. (2016) compared observations of primary production and nitrate with output from 21 models. In general the models were found to reproduce the spatial variability of primary production in the Arctic relatively well, but also that there is a need for improving parameterization of biological processes.
Concluding Remark
A conceptual model of the substantial but fundamentally different changes in the physics and biology of upper 100–300 m of the two main basins of the Arctic Ocean that have occurred over recent decades is presented in Figure 17. And while both the Eurasian and Amerasian basins are forced by climate warming, they are structurally responding in almost opposite directions. Why is this? The incoming AW provides the base of the halocline complex while the inflowing PW interleaves the halocline complex. This sets the stage for the ‘double estuary’ state of the Arctic Ocean, such that AW leaving the Arctic is fresher and cooler than the AW that entered. As both subarctic (Atlantic and Pacific) sources are changing, and because an underwater barrier (the Lomonosov Ridge) largely confines the effects the PW to the AB, we argue that the AB now experiences pacification and the EB now experiences atlantification. Topographically steered slope currents will play a big role here, as transport and pathways may also change (Bluhm et al., 2020, this issue).
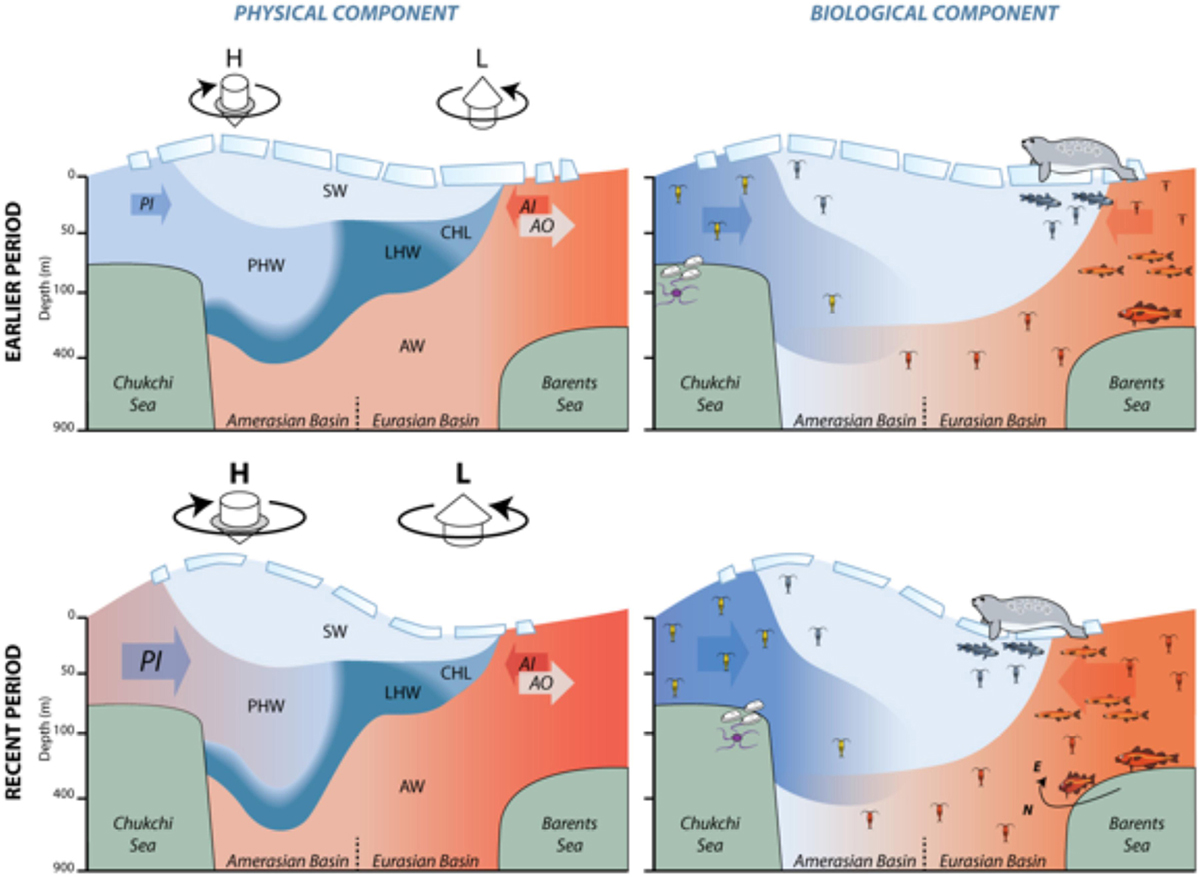
Figure 17. Conceptual model of borealization of the Arctic climate system. (Left) Conceptual model of change of Arctic halocline strength and state of the AW and SML showing: (i) Decrease in time of sea ice, (ii) Enhanced impact of Arctic High on ocean circulation, (iii) Increase of thickness of SML and halocline in the AB and decrease in the EB, (iv) Increase of influx of warmer PW (PI), (v) Increase of influx of AW heat. Adopted from Polyakov et al. (2018). (Right) Conceptual model of the shifting borealization domains of biological communities in the Pacific and Atlantic inflow regions, showing: (i) increasing biomass of zooplankton in the CS region driven by increased inflow of PW, (ii) shifts of benthic biomass “hotspots” in the CS region related to sea ice decline, (iii) shifts in zooplankton, pelagic fish and marine mammal communities in the northern Barents from a dominance of Arctic to boreal species, (iv) range shifts of Atlantic demersal fish, such as Atlantic cod, with eastward expansions along the outer shelf, (v) earlier development of expatriate Calanus finmarchicus in inflowing AW into the EB. Zooplankton: illustrated with copepod symbol; Benthic: illustrated with brittle star and clam symbols; Calanus: expatriate copepod Calanus.
There are still fundamental questions about present-day and future high-latitude responses to anomalous, poleward transports from the northern North Atlantic and North Pacific. Just recently, high-latitude climate research entered the phase in which new, powerful feedbacks in the atmosphere-ice-ocean system were identified in which borealization plays a key role. Understanding and quantification of these feedbacks may be regarded as a grand challenge of the future of Arctic system science. Particularly, the complex interplay between physical, geochemical, and biological processes requires a fully holistic perspective on the evolution of the complete Arctic climate system into the future. Enhancement of observational networks and the improved sophistication and credibility of models is a high priority if we are to meet these challenges and to develop reliable forecasts of the future state of the Arctic climate system.
Data Availability Statement
1981–2017 CTD data are available online via Pangaea Data Publisher. The ITP data were collected and made available by the Ice-Tethered Profiler Program (Krishfield et al., 2008) based at the Woods Hole Oceanographic Institution (http://www.whoi.edu/itp). All chemical data were obtained from open sources online and sources are cited in the Supplementary Material. Other datasets generated for this study are available on request to the corresponding author.
Author Contributions
IP perceived the general concept. EC, SD, AP, and IP performed analysis of physical changes. MA and KB led and MC and KG took part in analysis of geochemical changes. BB, RI and EE led and PW participated in analysis of biological changes. IE and DS developed and elaborated the modeling approach. All authors participated in writing the manuscript.
Funding
IP and AP acknowledge support from United States NSF grants (AON-1203473, AON-1724523, AON-1947162, and 1708427), and the Norwegian Nansen Legacy program (project #276730) and CarbonBridge program (project #226415) both funded by the Research Council of Norway (RCN). MA acknowledges funding from Royalty Research Fund, University of Washington, Award Number A133987. Analyses presented in this manuscript are also supported and with funding from Fisheries and Oceans Canada. IE and BB were supported by RCN Project “Arctic ABC” (project # 244319) and EE and BB by Arctic SIZE. The contribution of EE was performed in the framework of the state assignment of IO RAS (theme no. 0149-2019-0008). This manuscript is based in part on ideas discussed at an international workshop on pan-Arctic marine systems in Motovun Croatia, organized by PW and supported by funding from Arctic SIZE by the Norwegian Government and Tromsø Research Foundation (project #01vm/h15).
Conflict of Interest
The authors declare that the research was conducted in the absence of any commercial or financial relationships that could be construed as a potential conflict of interest.
The handling Editor is currently organizing a Research Topic with some of the authors BB and PW, and confirms the absence of any other collaboration.
Supplementary Material
The Supplementary Material for this article can be found online at: https://www.frontiersin.org/articles/10.3389/fmars.2020.00491/full#supplementary-material
Footnotes
- ^ The term ‘atlantification’ was introduced for the first time by Wassmann et al. (2004) in relation to biological changes in the Barents Sea and associated changes in physical conditions.
- ^ www.whoi.edu/itp
- ^ https://www.ncdc.noaa.gov/oisst
- ^ www.ecmwf.int
- ^ www.nve.no
- ^ https://www.tpxo.net/
References
Alkire, M. B., Falkner, K. K., Morison, J., Collier, R. W., Guay, C. K., Desiderio, R. A., et al. (2010). Sensor-based profiles of the NO parameter in the central Arctic and southern Canada Basin: new insights regarding the cold halocline. Deep Sea Res. I 57, 1432–1443. doi: 10.1016/j.dsr.2010.07.011
Alkire, M. B., Morison, J., and Andersen, R. (2015). Variability and trends in the meteoric water, sea-ice melt, and Pacific water contributions to the central Arctic Ocean, 2000-2013. J. Geophys. Res. 120, 1573–1598. doi: 10.1002/2014jc010023
Alkire, M. B., Rember, R., and Polyakov, I. V. (2019). Discrepancy in the identification of the Atlantic/Pacific front in the central Arctic Ocean: NO versus nutrient relationships. Geophys. Res. Lett. 46, 3843–3852. doi: 10.1029/2018GL081837
Ardyna, M., Babin, M., Gosselin, M., Devred, E., Rainville, L., Tremblay, J.-E., et al. (2014). Recent Arctic Ocean sea ice loss triggers novel fall phytoplankton blooms. Geophys. Res. Lett. 41, 6207–6212. doi: 10.1002/2014gl061047
Armitage, T. W. K., Bacon, S., and Kwok, R. (2018). Arctic sea level and surface circulation response to the Arctic Oscillation. Geophy. Res. Lett. 45, 6576–6584. doi: 10.10/2018GL078386
Armstrong, C. W., Foley, N. S., Slagstad, D., Chierici, M., Ellingsen, I., and Reigstad, M. (2019). Valuing blue carbon changes in the Arctic Ocean. Front. Mar. Sci. 6:331. doi: 10.3389/fmars.2019.00331
Arrigo, K. R., Perovich, D. K., Pickart, R. S., Brown, Z. W., Van Dijken, G. L., Lowry, K. E., et al. (2012). Massive phytoplankton blooms under Arctic sea ice. Science 336, 1408–1408.
Arrigo, K. R., and van Dijken, G. L. (2015). Continued increases in Arctic Ocean primary production. Prog. Oceanogr. 136, 60–70. doi: 10.1016/j.pocean.2015.05.002
Årthun, M., Eldevik, T., Smedsrud, L. H., and Skagseth, Ø, and Ingvaldsen, R. B. (2012). Quantifying the influence of Atlantic heat on the Barents Sea ice variability and retreat. J. Climate 25, 4736–4743. doi: 10.1175/jcli-d-11-00466.1
Assmy, P., Fernandez-Mendez, M., Duarte, P., Meyer, A., Randelhoff, A., Mundy, J., et al. (2017). Leads in Arctic pack ice enable early phytoplankton blooms below snow covered sea ice. Sci. Rep. 7:40850. doi: 10.1038/srep40850
Babin, M., Bélanger, S., Ellingsen, I., Forest, A., Le Fouest, V., Lacour, T., et al. (2015). Estimation of primary production in the Arctic Ocean using ocean colour remote sensing and coupled physical–biological models: strengths, limitations and how they compare. Prog. Oceanogr. 139, 197–220. doi: 10.1016/j.pocean.2015.08.008
Bamber, J. L., Tedstone, A. J., King, M. D., Howat, I. M., Enderlin, E. M., van den Broeke, M. R., et al. (2018). Land ice freshwater budget of the arctic and north atlantic oceans: 1. data, methods, and results. J. Geophys. Res. Oceans 123, 1827–1837. doi: 10.1002/2017JC013605
Barton, B. I., Lenn, Y., and Lique, C. (2018). Observed Atlantification of the Barents Sea causes the Polar Front to limit the expansion of winter sea ice. J. Phys. Oceanogr. 48, 1849–1866. doi: 10.1175/JPO-D-18-0003.1
Basedow, S. L., Sundfjord, A., von Appen, W.-J., Halvorsen, E., Kwasniewski, S., and Reigstad, M. (2018). Seasonal variation in transport of zooplankton into the arctic basin through the atlantic gateway, fram strait. Front. Mar. Sci. 5:194. doi: 10.3389/fmars.2018.00194
Baumann, T. M., Polyakov, I. V., Padman, L., Danielson, S., Fer, I., Howard, S., et al. (2020). Semidiurnal current dynamics in the Arctic Ocean’s eastern eurasian basin. J. Geophys. Res.
Berge, J., Heggland, K., Lønne, O. J., Cottier, F., Hop, H., Gabrielsen, G. W., et al. (2015). First records of Atlantic mackerel (Scomber scombrus) from the Svalbard archipelago, Norway, with possible explanations for the extension of its distribution. Arctic 68, 65–61.
Bintanja, R., and Krikken, F. (2016). Magnitude and pattern of Arctic warming governed by the seasonality of radiative forcing. Sci. Rep. 6:38287.
Bluhm, B. A., Carmack, E. C., Janout, M., Danielson, S., Ellingsen, I., Gavrilo, M., et al. (2020). The pan-Arctic continental slope: a narrow band of strong physical gradients affecting pelagic and benthic ecosystems. Front. Mar. Sci.
Bluhm, B. A., Kosobokoba, K. N., and Carmack, E. C. (2015). A tale of two basins: An integrated physics and biology perspective of the deep Arctic Ocean. Prog. Oceanogr. 139, 89–121. doi: 10.1016/j.pocean.2015.07.011
Bogstad, B., Gjøsæter, H., Haug, T., and Lindstrøm, U. (2015). A review of the battle for food in the Barents Sea: cod vs marine mammals. Front. Ecol. Evol. 3:29. doi: 10.3389/fevo.2015.00029
Bourgain, P., and Gascard, J.-C. (2011). The Arctic Ocean halocline and its interannual variability from 1997 to 2008. Deep Sea Res. I 58, 745–756. doi: 10.1016/j.dsr.2011.05.001
Brodsky, K. A., and Nikitin, M. M. (1955). Hydrobiological Study: Observations of Research Drifting Station 1950/51. Leningrad: Marine Transport.
Broecker, W. S. (1974). “NO”, A conservative water mass tracer, Earth & Planet. Sci. Lett. 23, 100–107. doi: 10.1016/0012-821x(74)90036-3
Brugler, E. T., Pickart, R. C., Moore, G. W. K., Roberts, S., Weingartner, T. J., and Statscewich, H. (2014). Seasonal to interannual variability of the Pacific water boundary current in the Beaufort Sea. Prog. Oceanogr. 127, 1–20. doi: 10.1016/j.pocean.2014.05.002
Callaghan, T. V., Johansson, M., Key, J., Prowse, T., Ananicheva, M., Klepikov, A., et al. (2011). Feedbacks and interactions: from the arctic cryosphere to the climate system. AMBIO 40, 75–86. doi: 10.1007/s13280-011-0215-8
Carmack, E., Polyakov, I., Padman, L., Fer, I., Hunke, E., Hutchings, J., et al. (2015). The new Arctic: towards quantifying the increasing role of oceanic heat in sea ice loss. BAMS 96, 2079–2105. doi: 10.1175/bams-d-13-00177.1
Carmack, E. C., Macdonald, R. W., Perkin, R. G., McLaughlin, F. A., and Pearson, R. J. (1995). Evidence for warming of Atlantic water in the southern Canadian Basin of the Arctic Ocean: results from the Larsen-93 expedition. Geophys. Res. Lett. 22, 1061–1064. doi: 10.1029/95gl00808
Carmack, E. C., Yamamoto-Kawai, M., Haine, T. W. N., Bacon, S., Bluhm, B. A., Lique, C., et al. (2016). Fresh water and its role in the Arctic marine system: sources, delivery, disposition, storage, export, and physical and biogeochemical consequences in the Arctic and global oceans. J. Geophys. Res. Glob. Biogeochem. Cycles 121, 675–717. doi: 10.1002/2015JG003140/full
Coachman, L. K., and Barnes, C. A. (1961). The contribution of Bering sea water to the Arctic Ocean. Arctic 14, 146–161.
Codispoti, L. A., Kelly, V., Thessen, A., Matrai, P., Suttles, S., Hill, V., et al. (2013). Synthesis of primary production in the Arctic Ocean: III. Nitrate and phosphate based estimates of net community production. Prog. Oceanogr. 110, 126–150. doi: 10.1016/j.pocean.2012.11.006
Cornwall, W. (2019). Vanishing Bering Sea ice threatens one of the richest U.S. seafood resources. Science 364, 616–617. doi: 10.1126/science.aay0513
Dalpadado, P., Ingvaldsen, R. B., Stige, L. C., Bogstad, B., Knutsen, T., Ottersen, G., et al. (2012). Climate effects on Barents Sea ecosystem dynamics. ICES J. Mar. Sci. 69, 1303–1316. doi: 10.1093/icesjms/fss063
Danielson, S. L., Ahkinga, O., Ashjian, C., Basyuk, E., Cooper, L. W., Eisner, L., et al. (2020). Manifestation and consequences of Arctic amplification in the Bering and Chukchi Seas. Deep Sea Res.
de Steur, L., Steele, M., Hansen, E., Morison, J., Polyakov, I., Olsen, S. M., et al. (2013). Hydrographic changes in the Lincoln Sea in the Arctic Ocean with focus on an upper ocean freshwater anomaly between 2007 and 2010. J. Geophys. Res. 118, 4699–4715. doi: 10.1002/jgrc.20341
Emerson, S., and Hayward, T. L. (1995). Chemical tracers of biological processes in shallow waters of North Pacific: preformed nitrate distributions. J. Mar. Res. 53, 499–513. doi: 10.1357/0022240953213179
Eriksen, E., Ingvaldsen, R. B., Nedreaas, K., and Prozorkevich, D. (2015). The effect of recent warming on polar cod and beaked redfish juveniles in the Barents Sea. Reg. Stud. Mar. Sci. 2, 105–112. doi: 10.1016/j.rsma.2015.09.001
Eriksen, E., Skjoldal, H. R., Gjøsæter, H., and Primicerio, R. (2017). Spatial and temporal changes in the Barents Sea pelagic compartment during the recent warming. Progr. Oceanogr. 151, 206–226. doi: 10.1016/j.pocean.2016.12.009
Ershova, E. A., Descoteaux, R., Wangensteen, O., Iken, K., Hopcroft, R., Smoot, C., et al. (2019). Diversity and distribution of meroplanktonic larvae in the Pacific Arctic and connectivity with adult benthic invertebrate communities. Front. Mar. Sci. 6:490. doi: 10.3389/fmars.2019.00490
Ershova, E. A., Hopcroft, R. R., Kosobokova, K. N., Matsuno, K., Nelson, R. J., Yamaguchi, A., et al. (2015). Long-term changes in summer zooplankton communities of the western Chukchi Sea, 1945–2012. Oceanography 28, 100–115. doi: 10.5670/oceanog.2015.60
Ershova, E. A., and Kosobokova, K. N. (2019). Cross-shelf structure and distribution of mesozooplankton communities in the East-Siberian Sea and the adjacent Arctic Ocean. Polar Biol. 42, 1353–1367. doi: 10.1007/s00300-019-02523-2
Fossheim, M., Primicerio, R., Johannesen, E., Ingvaldsen, R. B., Aschan, M. M., and Dolgov, A. V. (2015). Recent warming leads to a rapid borealization of fish communities in the Arctic. Nat. Clim. Change 5, 673–677. doi: 10.1038/nclimate2647
Frainer, A., Primicerio, R., Kortsch, S., Aune, M., Dolgov, A. V., Fossheim, M., et al. (2017). Functional biogeography of the Arctic: alterations in functional trait composition of large marine communities under climate change. Proc. Natl. Acad. Sci. U.S.A. 114, 12202–12207.
Frey, K., Comiso, J. C., Cooper, L. W., Gradinger, R. R., Grebmeyer, J. M., Tremblay, J. E., et al. (2017). Arctic Ocean Primary Productivity. Arctic Report Card Update 2016. Silver Spring: NOAA.
Frey, K., Comiso, J. C., Cooper, L. W., Grebmeier, J. M., and Stock, L. V. (2018). Arctic Report Card. Available at: https://arctic.noaa.gov/Report-Card/Report-Card-2018/ArtMID/7878/ArticleID/778/Arctic-Ocean-Primary-Productivity-The-Response-of-Marine-Algae-to-Climate-Warming-and-Sea-Ice-Decline (accessed December, 2019).
Gall, A. E., Morgan, T. C., Day, R. H., and Kuletz, K. J. (2017). Ecological shift from piscivorous to planktivorous seabirds in the Chukchi Sea, 1975–2012. Polar Biol. 40, 61–78. doi: 10.1007/s00300-016-1924-z
Gjøsæter, H., Wiebe, P. H., Knutsen, T., and Ingvaldsen, R. B. (2017). Evidence of diel vertical migration of mesopelagic sound-scattering organisms in the Arctic. Front. Mar. Sci. 4:332. doi: 10.3389/fmars.2017.00332
Grebmeier, J. M. (2012). Shifting patterns of life in the Pacific Arctic and sub-Arctic seas. Ann. Rev. Mar. Sci. 4, 63–78. doi: 10.1146/annurev-marine-120710-100926
Grebmeier, J. M., Frey, K. E., Cooper, L. W., and Kędra, M. (2018). Trends in benthic macrofaunal populations, seasonal sea ice persistence, and bottom water temperatures in the bering strait region. Oceanography 31, 136–151.
Grebmeier, J. M., Moore, S. E., Overland, J. E., Frey, K. E., and Gradinger, R. (2010). Biological response to recent Pacific Arctic sea ice retreats. EOS Trans. Am. Geophys. Union 91, 161–162.
Grumbine, R. W. (1996). Automated Passive Microwave Sea Ice Concentration Analysis at NCEP. NOAA Tech. Note 120. Camp Springs, MD: NOAA.
Gudkovich, Z. M. (1955). Results of Preliminary Analysis of Deep-Water Hydrologic Observations. Materials of Observations by Research Drifting Station in 1950/1951. Vladivostok: Morskoi Transport, 41–46.
Hamilton, C. D., Lydersen, C., Ims, R. A., and Kovacs, K. M. (2015). Predictions replaced by facts: a keystone species’ behavioural responses to declining Arctic sea-ice. Biol. Lett. 11:20150803. doi: 10.1098/rsbl.2015.0803
Haug, T., Bogstad, B., Chierici, M., Gjøsæter, H., Hallfredsson, E. H., Høines, A. S., et al. (2017). Future harvest of living resources in the Arctic Ocean of the Nordic and Barents Seas: a review of possibilities and constraints. Fish. Res. 188, 38–57. doi: 10.11016/j.fishres.2016.12.002
Hollowed, A. B., Planque, B., and Loeng, H. (2013). Potential movement of fish and shellfish stocks from the sub-Arctic to the Arctic Ocean. Fish. Oceanogr. 22, 355–370. doi: 10.1111/fog.12027
Hop, H., and Gjøsæter, H. (2013). Polar cod (Boreogadus saida) and capelin (Mallotus villosus) as key species in marine food webs of the Arctic and the Barents Sea. Mar. Biol. Res. 9, 878–894. doi: 10.1080/17451000.2013.775458
Huntington, H. P., Danielson, S. L., Wiese, F. K., Baker, M., Boveng, P., Citta, J. J., et al. (2020). Evidence suggests potential transformation of the Pacific Arctic ecosystem is underway. Nat. Clim. Change 10, 342–348. doi: 10.1038/s41558-020-0695-2
Ingvaldsen, R. B., Gjøsæter, H., Ona, E., and Michalsen, K. (2017). Atlantic cod (Gadus morhua) feeding over deep water in the high Arctic. Polar Biol. 40, 2105–2111. doi: 10.1007/s00300-017-2115-2
Johannesen, E., Ingvaldsen, R. B., Bogstad, B., Dalpadado, P., Eriksen, E., Gjøsæter, H., et al. (2012). Changes in Barents Sea ecosystem state, 1970-2009: climate fluctuations, human impact, and trophic interactions. ICES J. Mar. Sci. 69, 880–889. doi: 10.1093/icesjms/fss046
Johnsen, G., Norli, M., Moline, M., Robbins, I., von Quillfeldt, C., Sørensen, K., et al. (2018). The advective origin of an under-ice spring bloom in the Arctic Ocean using multiple observational platforms. Polar Biol. 41, 1197–1216. doi: 10.1007/s00300-018-2278-5
Jones, E. P., Anderson, L. G., and Swift, J. H. (1998). Distribution of Atlantic and Pacific waters in the Arctic Ocean: implications for circulation. Geophys. Res. Lett. 25, 765–768. doi: 10.1029/98gl00464
Karcher, M. J., Gerdes, R., Kauker, F., and Koberle, C. (2003). Arctic warming: evolution and spreading of the 1990s warm event in the Nordic seas and the Arctic Ocean. J. Geophys. Res. 108:3034. doi: 10.1029/2001JC001265
Katsuki, K., Takahashi, K., and Okada, M. (2003). Diatom assemblage and productivity changes during the last 340,000 years in the subarctic Pacific. J. Oceanography 59, 695–707. doi: 10.1023/b:joce.0000009598.93075.78
Kjesbu, O. S., Bogstad, B., Devine, J. A., Gjøsæter, H., Howell, D., Ingvaldsen, R. B., et al. (2014). Synergies between climate and management for Atlantic cod fisheries at high latitudes. Proc. Natl. Acad. Sci. U.S.A. 111, 3478–3483. doi: 10.1073/pnas.1316342111
Knutsen, T., Wiebe, P. H., Gjøsæter, H., Ingvaldsen, R. B., and Lien, G. (2017). High latitude epipelagic and mesopelagic scattering layers - a reference for future arctic ecosystem change. Front. Mar. Sci. 4:334. doi: 10.3389/fmars.2017.00334
Koltermann, K. P., Gouretski, V. V., and Jancke, K. (2011). “Hydrographic Atlas of the World Ocean Circulation Experiment (WOCE),” in Atlantic Ocean, eds M. Sparrow, P. Chapman, and J. Gould (Southampton: International WOCE Project Office).
Kortsch, S., Primicerio, R., Fossheim, M., Dolgov, A. V., and Aschan, M. (2015). Climate change alters the structure of arctic marine food webs due to poleward shifts of boreal generalists. Proc. R. Soc. B Biol. Sci. 282:20151546. doi: 10.1098/rspb.2015.1546
Kosobokova, K. N., Hopcroft, R. R., and Hirche, H. J. (2011). Patterns of zooplankton diversity through the depths of the Arctic’s central basins. Mar. Biodiv. 41, 29–50. doi: 10.1007/s12526-010-0057-9
Kovacs, K. M., Lydersen, C., Overland, J. E., and Moore, S. E. (2011). Impacts on changing sea-ice conditions on Arctic marine mammals. Mar. Biodiv. 41, 181–194. doi: 10.1007/s12526-010-0061-0
Krishfield, R., Toole, J., Proshutinsky, A., and Timmermans, M.-L. (2008). Automated Ice-Tethered Profilers for seawater observations under pack ice in all seasons. J. Atmos. Ocean. Technol. 25, 2091–2095. doi: 10.1175/2008JTECHO587.1
Krishfield, R. A., Proshutinsky, A., Tateyama, K., Williams, W. J., Carmack, E. C., McLaughlin, F. A., et al. (2014). Deterioration of perennial sea ice in the Beaufort Gyre from 2003 to 2012 and its impact on the oceanic freshwater cycle. J. Geophys. Res. Oceans 119, 1271–1305. doi: 10.1002/2013JC008999
Krumpen, T., Belter, H. J., Boetius, A., Damm, E., Haas, C., Hendricks, S., et al. (2019). Arctic warming interrupts the Transpolar Drift and affects long-range transport of sea ice and ice-rafted matter. Sci. Rep. 9:5459.
Lee, Y. J., Matrai, P. A., Friedrichs, M. A. M., Saba, V. S., Aumont, O., Babin, M., et al. (2016). Net primary productivity estimates and environmental variables in the Arctic Ocean: an assessment of coupled physical-biogeochemical models. J. Geophys. Res. Oceans 121, 8635–8669. doi: 10.1002/2016JC011993
Li, W. K. W., McLaughlin, F. A., Lovejoy, C., and Carmack, E. C. (2009). Smallest algae thrive as the Arctic Ocean freshens. Science 326:539. doi: 10.1126/science.1179798
Lind, S., Ingvaldsen, R. B., and Furevik, T. (2018). Arctic warming hotspot in the northern Barents Sea linked to declining sea-ice import. Nat. Clim. Change 8, 634–639. doi: 10.1038/s41558-018-02050y
Logerwell, E., Busby, M., Carothers, C., Cotton, S., Duffy-Anderson, J., Farley, E., et al. (2015). Fish communities across a spectrum of habitats in the western Beaufort Sea and Chukchi Sea. Progr. Oceanogr. 136, 115–132. doi: 10.1016/j.pocean.2015.05.013
Manabe, S., and Stouffer, R. J. (1980). Sensitivity of a global climate model to an increase of CO2 concentration in the atmosphere. J. Geophys. Res. 85, 5529–5554.
McLaughlin, F. A., Carmack, E., and Macdonald, R. (1996). Physical and geochemical properties across the Atlantic/Pacific water mass front in the southern Canadian Basin. J. Geophys. Res. 101, 1183–1197. doi: 10.1029/95jc02634
McLaughlin, F. A., and Carmack, E. C. (2010). Nutricline deepening in the Canada Basin, 2003-2009. Geophys. Res. Lett. 37:L24602. doi: 10.1029/2010GL045459
McLaughlin, F. A., Carmack, E. C., Macdonald, R. W., Melling, H., and Swift, J. H. (2004). On the juxtaposition of Atlantic and Pacific–origin waters in the Canada Basin, 1997-1998. Deep Sea Res. 51, 107–128. doi: 10.1016/j.dsr.2003.09.010
McPhee, M. G., Proshutinsky, A., Morison, J. H., Steele, M., and Alkire, M. B. (2009). Rapid change in freshwater content of the Arctic Ocean. Geophys. Res. Lett. 36:L10602.
Monterey, G., and Levitus, S. (1997). NOAA Atlas NESDIS 14. Washington, DC: U.S. Gov. Printing Office.
Moore, S. E. (2016). Is it ‘boom times’ for baleen whales in the Pacific Arctic region? Biol. Lett. 12:20160251. doi: 10.1098/rsbl.2016.0251
Morison, J., Kwok, R., Peralta-Ferriz, C., Alkire, M., Rigor, I., Andersen, R., et al. (2012). Changes in Arctic Ocean circulation and freshwater measure with ICESat altimetry, GRACE gravimetry, and in situ observations. Nature 481, 66–70. doi: 10.1038/nature10705
Morison, J., Steele, M., and Andersen, R. (1998). Hydrography of the upper Arctic Ocean measured from the nuclear submarine U.S.S. Pargo. Deep Sea Res. 1, 15–38. doi: 10.1016/s0967-0637(97)00025-3
Mueter, F. J., and Litzow, M. A. (2008). Sea ice retreat alters the biogeography of the Bering Sea continental shelf. Ecol. Appl. 18, 309–320. doi: 10.1890/07-0564.1
Mysak, L. A. (2001). Patterns of Arctic circulation. Science 293, 1269–1270. doi: 10.1126/science.1064217
Nelson, R. J., Carmack, E. C., McLaughlin, F. A., and Cooper, G. A. (2009). Penetration of Pacific zooplankton into the western Arctic Ocean tracked with molecular population genetics. Mar. Ecol. Prog. Ser. 381, 129–138. doi: 10.3354/meps07940
Nishino, S., Itoh, M., Williams, W. J., and Semiletov, I. (2013). Shoaling of the nutricline with an increase in near-freezing temperature water in the Makarov Basin. J. Geophys. Res. 118, 1–15. doi: 10.1029/2012JC008234
Nishino, S., Shimada, K., Itoh, M., Yamamoto-Kawai, M., and Chiba, S. (2008). East-west differences in water mass, nutrient, and chlorophyll a distribution in the sea ice reduction region of the western Arctic Ocean. J. Geophys. Res. 113:C00A01. doi: 10.1029/2007JC004666
Norcross, B. L., Holladay, B. A., Busby, M. S., and Mier, K. L. (2010). Demersal and larval fish assemblages in the Chukchi Sea. Deep Sea Res. Part II 57, 57–70. doi: 10.1016/j.dsr2.2009.08.006
Notz, D., Haumann, F. A., Haak, H., Jungclaus, J. H., and Marotzke, J. (2013). Arctic sea-ice evolution as modeled by Max Planck Institute for meteorology’s Earth system model. J. Adv. Model. Earth Syst. 5, 173–194. doi: 10.1002/jame.20016
Onarheim, I. H., Smedsrud, L. H., Ingvaldsen, R., and Nilsen, F. (2014). Loss of sea ice during winter north of Svalbard. Tellus A 66:23933. doi: 10.3402/tellusa.v66.23933
Orlova, E. L., Dolgov, A. V., Renaud, P. E., Greenacre, M., Halsband, C., Ivshin, V. A., et al. (2015). Climatic and ecological drivers of euphausiid community structure vary spatially in the Barents Sea: relationships from a long time series (1952-2009). Front. Mar. Sci. 1:74. doi: 10.3389/fmars.2014.00074
Orlova, E. L., Rudneva, G. B., Renaud, P. E., Eiane, K., Savinov, V., Yurko, A. S., et al. (2010). Climate impacts on feeding and condition of capelin (Mallotus villosus) in the Barents Sea. Evidence and mechanisms from a 30-year data series. Aquat. Biol. 10, 105–118. doi: 10.3354/ab00265
Peralta-Ferriz, C., and Woodgate, R. (2015). Seasonal and interannual variability of pan-Arctic surface mixed layer properties from 1979 to 2012 from hydrographic data, and the dominance of stratification for multiyear mixed layer depth shoaling. Prog. Oceanogr. 134, 19–53. doi: 10.1016/j.pocean.2014.12.005
Petty, A. A., Hutchings, J. K., Richter-Menge, J. A., and Tschudi, M. A. (2016). Sea ice circulation around the Beaufort Gyre: the changing role of wind forcing and the sea ice state. J. Geophys. Res.: Oceans 121, 3278–3296. doi: 10.1002/2015jc010903
Polyakov, I. V., Alekseev, G. V., Timokhov, L. A., Bhatt, U., Colony, R. L., Simmons, H. L., et al. (2004). Variability of the intermediate Atlantic Water of the Arctic Ocean over the last 100 years. J. Clim. 17, 4485–4497. doi: 10.1175/jcli-3224.1
Polyakov, I. V., Alexeev, V., Belchansky, G. I., Dmitrenko, I. A., Ivanov, V., Kirillov, S., et al. (2008). Arctic Ocean freshwater changes over the past 100 years and their causes. J. Clim. 21, 364–384. doi: 10.1175/2007jcli1748.1
Polyakov, I. V., Beszczynska, A., Carmack, E. C., Dmitrenko, I. A., Fahrbach, E., Frolov, I. E., et al. (2005). One more step toward a warmer Arctic. Geophys. Res. Lett. 32:L17605. doi: 10.1029/2005GL023740
Polyakov, I. V., Bhatt, U. S., Walsh, J. E., Abrahamsen, E. P., Pnyushkov, A. V., and Wassmann, P. F. (2013a). Recent oceanic changes in the Arctic in the context of long-term observations. Ecol. Appl. 23, 1745–1764. doi: 10.1890/11-0902.1
Polyakov, I. V., Pnyushkov, A. V., Alkire, M., Ashik, I. M., Baumann, T., Carmack, E., et al. (2017). Greater role for Atlantic inflows on sea-ice loss in the Eurasian Basin of the Arctic Ocean. Science 356, 285–291. doi: 10.1126/science.aai8204
Polyakov, I. V., Pnyushkov, A. V., and Carmack, E. C. (2018). Stability of the arctic halocline: a new indicator of arctic climate change. Environ. Res. Lett. 13:125008. doi: 10.1088/1748-9326/aaec1e
Polyakov, I. V., Pnyushkov, A. V., Rember, R., Padman, L., Carmack, E. C., and Jackson, J. (2013b). Winter convection transports Atlantic Water heat to the surface layer in the eastern Arctic Ocean. J. Phys. Oceanogr. 43, 2148–2162. doi: 10.1175/JPO-D-12-0169.1
Polyakov, I. V., Pnyushkov, A. V., and Timokhov, L. A. (2012). Warming of the intermediate Atlantic Water of the Arctic Ocean in the 2000s. J. Clim. 25, 8362–8370. doi: 10.1175/JCLI-D-12-00266.1
Polyakov, I. V., Rippeth, T. P., Fer, I., Alkire, M. B., Baumann, T. M., Carmack, E. C., et al. (2020). Weakening of cold halocline layer exposes sea ice to oceanic heat in the eastern Arctic Ocean. J. Clim.
Polyakov, I. V., Timokhov, L. A., Alexeev, V. A., Bacon, S., Dmitrenko, I. A., Fortier, L., et al. (2010). Arctic Ocean warming reduces polar ice cap. J. Phys. Oceanogr. 40, 2743–2756.
Proshutinsky, A., Krishfield, R., Timmermans, M.-L., Toole, J., Carmack, E. C., McLaughlin, F., et al. (2009). Beaufort Gyre Fresh Water Reservoir: state and variability from observations. J. Geophys. Res. 114:C00A10. doi: 10.1029/2008JC005104
Proshutinsky, A. Y., and Johnson, M. A. (1997). Two circulation regimes of the wind-driven Arctic Ocean. J. Geophys. Res. 102, 493–514.
Ravelo, A. M., Bluhm, B. A., Foster, N., and Iken, K. B. (2020). Biogeography of epibenthic assemblages in the central Beaufort Sea. Mar. Biodivers. 50:8.
Ravelo, A. M., Konar, B., and Bluhm, B. A. (2015). Spatial variability of epibenthic communities on the Alaska Beaufort Shelf. Polar Biol. 38, 1783–1804. doi: 10.1007/s00300-015-1741-9
Reid, P. C., Johns, D. G., Edwards, M., Starr, M., Poulin, M., and Snoeijs, P. (2007). A biological consequence of reducing Arctic ice cover: arrival of the Pacific diatom Neodenticula seminae in the North Atlantic for the first time in 800 000 years. Glob. Change Biol. 13, 1910–1921. doi: 10.1111/j.1365-2486.2007.01413.x
Reynolds, R. W., Smith, T. M., Liu, C., Chelton, D. B., Casey, K. S., and Schlax, M. G. (2007). Daily High-resolution Blended Analyses for sea surface temperature. J. Clim. 20, 5473–5496. doi: 10.1175/2007jcli1824.1
Rudels, B. (2011). Arctic Ocean circulation and variability – Advection and external forcing encounter constraints and local processes. Ocean Sci. 8, 2313–2376. doi: 10.5194/osd-8-2313
Rudels, B., Jones, E. P., Anderson, L. G., and Kattner, G. (1994). “On the intermediate depth waters of the Arctic Ocean,” in The Polar Oceans and Their Role in Shaping the Global Environment: The Nansen Centennial Volume, Geophys. Monogr. Ser, Vol. 85, eds O. M. Johannessen, R. D. Muench, and J. E. Overland (Washington, DC: AGU), 33–46. doi: 10.1029/gm085p0033
Schauer, U., Fahrbach, E., Osterhus, S., and Rohardt, G. (2004). Arctic warming through the Fram Strait: oceanic heat transport from 3 years of measurements. J. Geophys. Res. 109:C06026. doi: 10.1029/2003JC001823
Serreze, M. C., Crawford, A. D., Stroeve, J., and Barrett, A. P. (2016). Variability, trends and predictability of seasonal sea ice retreat and advance in the southern Chukchi Sea. J. Geophys. Res. Oceans 121, 7308–7325. doi: 10.1002/2016JC011977
Shimada, K., Itoh, M., Nishino, S., McLaughlin, F., Carmack, E., and Proshutinsky, A. (2005). Halocline structure in the Canada Basin of the Arctic Ocean. Geophys. Res. Lett. 32:L03605. doi: 10.1029/2004GL021358
Shimada, K., Kamoshida, T., Itoh, M., Nishino, S., Carmack, E., McLaughlin, F., et al. (2006). Pacific Ocean inflow: influence on catastrophic reduction of sea ice cover in the Arctic Ocean. Geophys. Res. Lett. 33:L08605. doi: 10.1029/2005GL025624
Skaug, H. J., Øien, N., Schweder, T., and Bøthun, G. (2004). Abundance of minke whales (Balaenoptera acutorostrata) in the Northeastern Atlantic. Can. J. Fish Aquat. Sci. 61, 870–886.
Slagstad, D., Ellingsen, I. H., and Wassmann, P. (2011). Evaluating primary and secondary production in an Arctic Ocean void of summer sea ice: an experimental simulation approach. Prog. Oceanogr. 90, 117–131. doi: 10.1016/j.pocean.2011.02.009
Slagstad, D., and McClimans, T. A. (2005). Modeling the ecosystem dynamics of the Barents sea including the marginal ice zone: I. Physical and chemical oceanography. J. Mar. Syst. 58, 1–18. doi: 10.1016/j.jmarsys.2005.05.005
Slagstad, D., Wassmann, P. F. J., and Ellingsen, I. (2015). Physical constrains and productivity in the future Arctic Ocean. Front. Mar. Sci. 2:85. doi: 10.3389/fmars.2015.00085
Smoot, C. A., and Hopcroft, R. R. (2017). Depth-stratified community structure of Beaufort Sea slope zooplankton and its relations to water masses. J. Plankton Res. 39, 79–91. doi: 10.1093/plankt/fbw087
Steele, M., and Boyd, T. (1998). Retreat of the cold halocline layer in the Arctic Ocean. J. Geophys. Res. 103, 10419–10435. doi: 10.1029/98jc00580
Steele, M., Dickinson, S., Zhang, J., and Lindsay, R. W. (2015). Seasonal ice loss in the Beaufort Sea: toward synchrony and prediction. J. Geophys. Res. Oceans 120, 1118–1132. doi: 10.1002/2014JC010247
Steele, M., Morison, J., Ermold, W., Rigor, I., Ortmeyer, M., and Shimada, K. (2004). Circulation of summer Pacific halocline water in the Arctic Ocean. J. Geophys. Res. 109:C02027. doi: 10.1029/2003JC002009
Stevenson, D. E., and Lauth, R. R. (2019). Bottom trawl surveys in the northern Bering Sea indicate recent shifts in the distribution of marine species. Polar Biol. 42, 407–421. doi: 10.1007/s00300-018-2431-1
Swift, J. H., Jones, E. P., Aagaard, K., Carmack, E. C., Hingston, M., MacDonald, R. W., et al. (1997). Waters of the Makarov and Canada basins. Deep Sea Res. 44, 1503–1529. doi: 10.1016/s0967-0645(97)00055-6
Tachibana, Y., Komatsu, K. K., Alexeev, V. A., Cai, L., and Ando, Y. (2019). Warm hole in Pacific Arctic sea ice cover forced mid-latitude Northern Hemisphere cooling during winter 2017–18. Sci. Rep. 9:5567.
Timmermans, M.-L., and Ladd, C. (2018). Sea Surface Temperature. [in Arctic Report Card 2018]. Available at: https://www.arctic.noaa.gov/Report-Card (accessed December, 2019).
Timmermans, M.-L., Proshutinsky, A., Golubeva, E., Jackson, J. M., Krishfield, R., McCall, M., et al. (2014). Mechanisms of Pacific Summer Water variability in the Arctic’s Central Canada Basin. J. Geophys. Res. Oceans 119, 7523–7548. doi: 10.1002/2014JC010273
Timmermans, M.-L., Toole, J., and Krishfield, R. (2018). Warming of the interior Arctic Ocean linked to sea ice losses at the basin margins. Sci. Adv. 4:eaat6773. doi: 10.1126/sciadv.aat6773
Vancoppenolle, M., Bopp, L., Madec, G., Dunne, J., Ilyina, T., Halloran, P. R., et al. (2013). Future Arctic Ocean primary productivity from CMIP5 simulations: uncertain outcome, but consistent mechanisms. Glob. Biogeochem. Cycles 27, 605–619. doi: 10.1002/gbc.20055
von Storch, H., and Zwiers, F. W. (1999). Statistical Analysis in Climate Research. Cambridge University Press, 494.
Wassmann, P., Bauernfeind, E., Fortier, M., Fukuchi, M., Hargrave, B., Moran, B., et al. (2004). “Particulate organic carbon flux to the sea floor,” in The Organic Carbon Cycle in the Arctic Ocean, eds R. Stein and R. M. Macdonald (Berlin: Springer-Verlag), 101–138. doi: 10.1007/978-3-642-18912-8_5
Wassmann, P., Slagstad, D., Riser, C. W., and Reigstad, M. (2006). Modelling the ecosystem dynamics of the Barents Sea including the marginal ice zone II. Carbon flux and interannual variability. J. Mar. Syst. 59, 1–24. doi: 10.1016/j.jmarsys.2005.05.006
Wassmann, P. F., Slagstad, D., and Ellingsen, I. H. (2010). Primary production and climatic variability in the European sector of the Arctic Ocean prior to 2007: preliminary results. Polar Biol. 33, 1641–1650. doi: 10.1007/s00300-010-0839-3
Weydmann, A., Walczowski, W., Carstensen, J., and Kwaśniewski, S. (2018). Warming of Subarctic waters accelerates development of a key marine zooplankton Calanus finmarchicus. Glob. Change Biol. 24, 172–183. doi: 10.1111/gcb.13864
Wiedmann, M. A., Aschan, M., Certain, G., Dolgov, A., Greenacre, M., Johannesen, E., et al. (2014). Functional diversity of the Barents Sea fish community. Mar. Ecol. Prog. Ser. 495, 205–218. doi: 10.3354/meps10558
Woodgate, R. A. (2018). Increases in the Pacific inflow to the Arctic from 1990 to 2015, and insights into seasonal trends and driving mechanisms from year-round Bering Strait mooring data. Prog. Oceanogr. 160, 124–154. doi: 10.1016/j.pocean.2017.12.007
Woodgate, R. A., Aagaard, K., Muench, R. D., Gunn, J., Bjork, G., Rudels, B., et al. (2001). The Arctic Ocean boundary current along the Eurasian slope and the adjacent lomonosov ridge: water mass properties, transports and transformations from moored instruments. Deep Sea Res. 1, 1757–1792. doi: 10.1016/s0967-0637(00)00091-1
Woodgate, R. A., Weingartner, T., and Lindsay, R. (2010). The 2007 Bering Strait oceanic heat flux and anomalous Arctic sea-ice retreat. Geophys. Res. Lett. 37:L01602. doi: 10.1029/2009GL041621
Woodgate, R. A., Weingartner, T. J., and Lindsay, R. (2012). Observed increases in Bering Strait oceanic fluxes from the Pacific to the Arctic from 2001 to 2011 and their impacts on the Arctic Ocean water column. Geophys. Res. Lett. 39:L24603. doi: 10.1029/2012GL054092
Yamamoto-Kawai, M., Carmack, E., and McLaughlin, F. (2006). Nitrogen balance and Arctic throughflow. Nature 443:43. doi: 10.1038/443043a
Yamamoto-Kawai, M., McLaughlin, F. A., Carmack, E. C., Nishino, S., and Shimada, K. (2008). Freshwater budgets of the Canada Basin, Arctic Ocean, from salinity, d18O, and nutrients. J. Geophys. Res. 113:C01007. doi: 10.1029/2006JC003858
Yamamoto-Kawai, M., McLaughlin, F. A., Carmack, E. C., Nishino, S., Shimada, K., and Kurita, N. (2009). Surface freshening of the Canada Basin, 2003-2007: river runoff versus sea ice meltwater. J. Geophys. Res. 114:C00A05. doi: 10.1029/2008JC005000
Yamamoto-Kawai, M., Tanaka, N., and Pivovarov, S. (2005). Freshwater and brine behaviors in the Arctic Ocean deduced from historical data of δ18O and alkalinity (1929–2002 A.D.). J. Geophys. Res. 110:C10003. doi: 10.1029/2004JC002793
Zhong, W., Steele, M., Zhang, J., and Cole, S. T. (2019). Circulation of Pacific Winter Water in the western Arctic Ocean. J. Geophys. Res. Oceans 124, 863–881. doi: 10.1029/2018JC014604
Zhukova, N. G., Nesterova, V. N., Prokopchuk, I. P., and Redneva, G. B. (2009). Winter distributions of euphausiids (Euphausiacea) in the Barents Sea (200-2005). Deep Sea Res. II 56, 1959–1967. doi: 10.1016/j.dsr2.2008.11.007
Keywords: Arctic ocean, climate change, atlantification and pacification, multidisciplinary changes, future projections
Citation: Polyakov IV, Alkire MB, Bluhm BA, Brown KA, Carmack EC, Chierici M, Danielson SL, Ellingsen I, Ershova EA, Gårdfeldt K, Ingvaldsen RB, Pnyushkov AV, Slagstad D and Wassmann P (2020) Borealization of the Arctic Ocean in Response to Anomalous Advection From Sub-Arctic Seas. Front. Mar. Sci. 7:491. doi: 10.3389/fmars.2020.00491
Received: 30 November 2019; Accepted: 02 June 2020;
Published: 03 July 2020.
Edited by:
Dorte Krause-Jensen, Aarhus University, DenmarkReviewed by:
David George Barber, University of Manitoba, CanadaSheldon Bacon, University of Southampton, United Kingdom
Jean Claude Jacques Gascard, UMR 7159 Laboratoire d’Océanographie et du Climat Expérimentations et Approches Numériques (LOCEAN), France
Copyright © 2020 Polyakov, Alkire, Bluhm, Brown, Carmack, Chierici, Danielson, Ellingsen, Ershova, Gårdfeldt, Ingvaldsen, Pnyushkov, Slagstad and Wassmann. This is an open-access article distributed under the terms of the Creative Commons Attribution License (CC BY). The use, distribution or reproduction in other forums is permitted, provided the original author(s) and the copyright owner(s) are credited and that the original publication in this journal is cited, in accordance with accepted academic practice. No use, distribution or reproduction is permitted which does not comply with these terms.
*Correspondence: Igor V. Polyakov, ivpolyakov@alaska.edu