Ecosystem-Based Harvest Control Rules for Norwegian and US Ecosystems
 Isaac C. Kaplan1*
  Cecilie Hansen2
  Hem Nalini Morzaria-Luna3,4,5
  Raphael Girardin6
  Kristin N. Marshall7
- 1Conservation Biology Division, Northwest Fisheries Science Center, National Marine Fisheries Service, NOAA, Seattle, WA, United States
- 2Institute of Marine Research, Bergen, Norway
- 3CEDO Intercultural, Tucson, AZ, United States
- 4CEDO Intercultural, Puerto Peñasco, Mexico
- 5Northwest Fisheries Science Center, National Marine Fisheries Service, NOAA, Seattle, WA, United States
- 6L’Institut Français de Recherche pour l’Exploitation de la Mer (IFREMER) Halieutique Manche Mer du Nord, Boulogne-sur-Mer, France
- 7Fishery Resource Analysis and Monitoring Division, Northwest Fisheries Science Center, National Marine Fisheries Service, NOAA, Seattle, WA, United States
Management strategy evaluation (MSE) provides a simulation framework to test the performance of living marine resource management. MSE has now been adopted broadly for use in single-species fishery management, often using a relatively simple “operating model” that projects population dynamics of one species forward in time. However, many challenges in ecosystem-based management involve tradeoffs between multiple species and interactions of multiple stressors. Here we use complex operating models, multi-species ecosystem models of the California Current and Nordic and Barents Seas, to test threshold harvest control rules that explicitly address the linkage between predators and prey, and between the forage needs of predators and fisheries. Specifically, within Atlantis ecosystem models we focus on how forage (zooplankton) availability affects the performance of harvest rules for target fish, and how these harvest rules for fish can account for environmentally-driven fluctuations in zooplankton. Our investigation led to three main results. First, consistent with studies based on single-species operating models, we found that compared to constant F = FMSY policies, threshold rules led to higher target stock biomass for Pacific hake (Merluccius productus) in the California Current and mackerel (Scomber scombrus) in the Nordic and Barents Seas. Performance in terms of catch of these species varied depending partly on the biomass and recovery trajectory for the simulated stock. Secondly, the multi-species operating models and the harvest control rules that linked fishing mortality rates to prey biomass (zooplankton) led to increased catch variability; this stemmed directly from the harvest rule that frequently adjusted Pacific hake or mackerel fishing rates in response to zooplankton, which are quite variable in these two ecosystems. Thirdly, tests suggested that threshold rules that increased fishing when productivity (zooplankton) declined had the potential for strong ecosystem effects on other species. These effects were most apparent in the Nordic and Barents Seas simulations. The tests of harvest control rules here do not include uncertainty in monitoring of fish and zooplankton, nor do they include uncertainty in stock assessment and implementation; these would be required for full MSE. Additionally, we intentionally chose target fish with strong mechanistic links to particular zooplankton groups, with the simplifying assumption that zooplankton biomass followed a forced time series. Further developing and testing of ecosystem-level considerations can be achieved with end-to-end ecosystem models, such as the Atlantis models applied here, which have the added benefit of tracking the follow-on effects of the harvest control rule on the broader ecosystem.
Introduction
Management strategy evaluation (MSE) provides a simulation framework to test the performance of living marine resource management (Sainsbury, 2000; Punt et al., 2016a). MSE has now been adopted broadly for use in single-species fishery management, often using a relatively simple “operating model” that projects population dynamics of one species forward in time. However, many challenges in ecosystem-based management involve tradeoffs between multiple species and interactions of multiple stressors (Link, 2010). Efforts are underway to include these dynamics in more complex “end-to-end” ecosystem models that can serve as operating models for MSE, but to date the most fruitful ecosystem-based MSE approach has often been to strip the ecosystem model (operating model) down to intermediate levels of complexity (often 3–5 species) (Punt and Butterworth, 1995; Plagányi et al., 2012; Punt et al., 2016b; ICES, 2018b). Here we take a different tack, retaining the complexity of the end-to-end ecosystem models, but stripping down the simulated assessment in the MSE. We test threshold harvest control rules (synonymously HCRs or simply “rules”) that explicitly address the linkage between predators and prey, and between forage needs of predators and fisheries. Specifically, within Atlantis ecosystem models we focus on how forage (zooplankton) availability affects the performance of harvest rules for target fish, and how these harvest rules for fish can account for environmentally-driven fluctuations in zooplankton. The same set of harvest control rules are applied in the California Current and Nordic and Barents Sea models (Figure 1), where recent conditions and future scenarios suggest climate-driven shifts in prey productivity and spatial distribution (Drinkwater, 2005; Ellingsen et al., 2008; Bond et al., 2015; Cheung et al., 2015; Leising et al., 2015). For the two systems, we test for common responses to the harvest control rules.
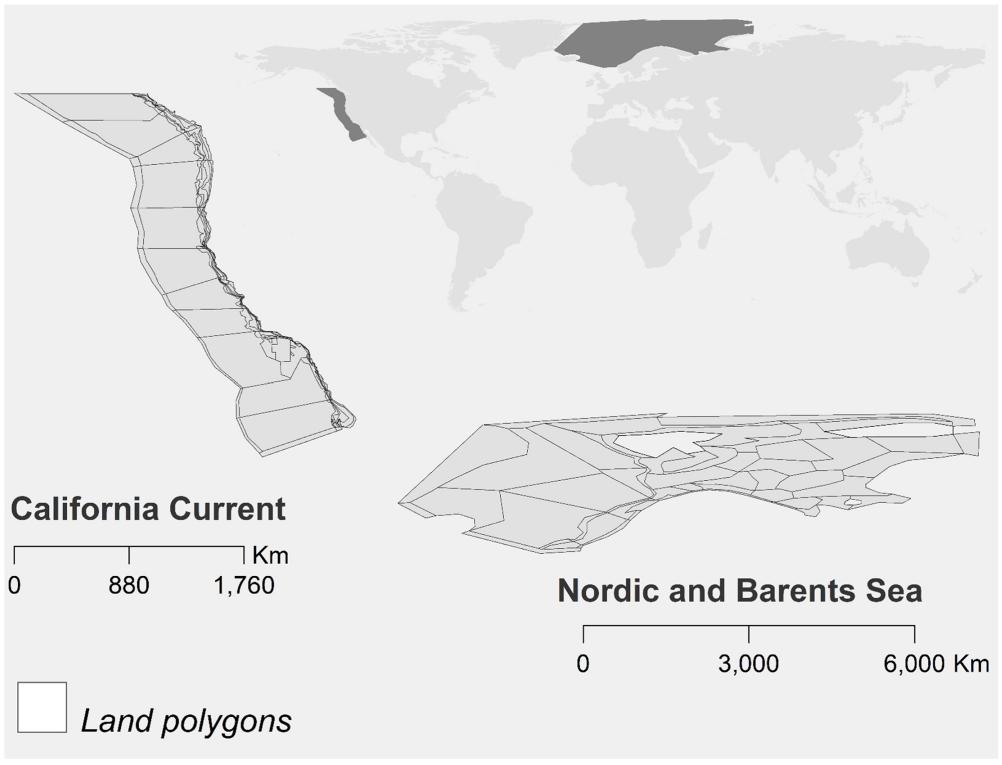
Figure 1. Atlantis model domains for California Current and Nordic and Barents Seas.
Single-Species Threshold Harvest Control Rules
Threshold harvest control rules have been advocated, tested, and applied in fisheries management, particularly as a robust means to cope with variability in stock productivity (recruitment) and uncertainty in stock size and policy implementation. This originally included simple “constant escapement” policies (commonly for salmon and capelin) that prohibit fishing below a certain stock size (the limit reference point), and that harvest all biomass above that stock size (sensu, Reed, 1979). More recently this has evolved into proportional threshold control rules that apply a fixed fishing mortality rate above a limit reference point. For instance, Engen et al. (1997) found that this approach outperformed constant escapement policies in the face of uncertainty in stock size. Lillegård et al. (2005) also tested proportional threshold harvest control rules for Norwegian spring spawning herring (Clupea harengus), illustrating the high performance of this HCR when stock size was uncertain. Norwegian spring spawning herring are a particularly relevant example because of their high variability in recruitment and resulting strong fluctuations in stock size (Toresen and Østvedt, 2000). Sethi et al. (2005) tested the impacts of uncertainty in stock size, stock productivity (recruitment), and implementation on optimal policy choices for simulated species. Given highly stochastic stock size (recruitment) these authors ultimately advised a proportional threshold harvest control policy with a limit reference point at approximately 0.3–0.4 of stock carrying capacity and a constant harvest rate above that of 0.6–0.7 of the stock. This literature has also led to attempts in fishery management to more precisely define limit reference points and target reference points, i.e., the stock size at which maximum fishing rates are applied (Mace, 1994; Clark, 2002). Most current applications for marine fish involve a modified threshold policy (Spencer and Collie, 1997) that specifies “hockey stick-shaped” increases in fishing mortality rates (or catch) as biomass increases from the limit reference point to the target reference point, with constant fishing rates at biomass above that target (Figure 2A). Threshold harvest rules are in place for Pacific hake (Merluccius productus) (US Congress Senate Committee on Foreign Relations, 2004), other groundfish on the US West Coast (Pacific Fishery Management Council, 2016), Northeast Arctic haddock (Melanogrammus aeglefinus) and other demersal fish in the Barents Sea (ICES, 2018a) and many other stocks. Globally, simulation testing of harvest control rules, most often variants on threshold rules, plays an important role in the Precautionary Approach to fisheries (FAO, 1996; Punt, 2006).
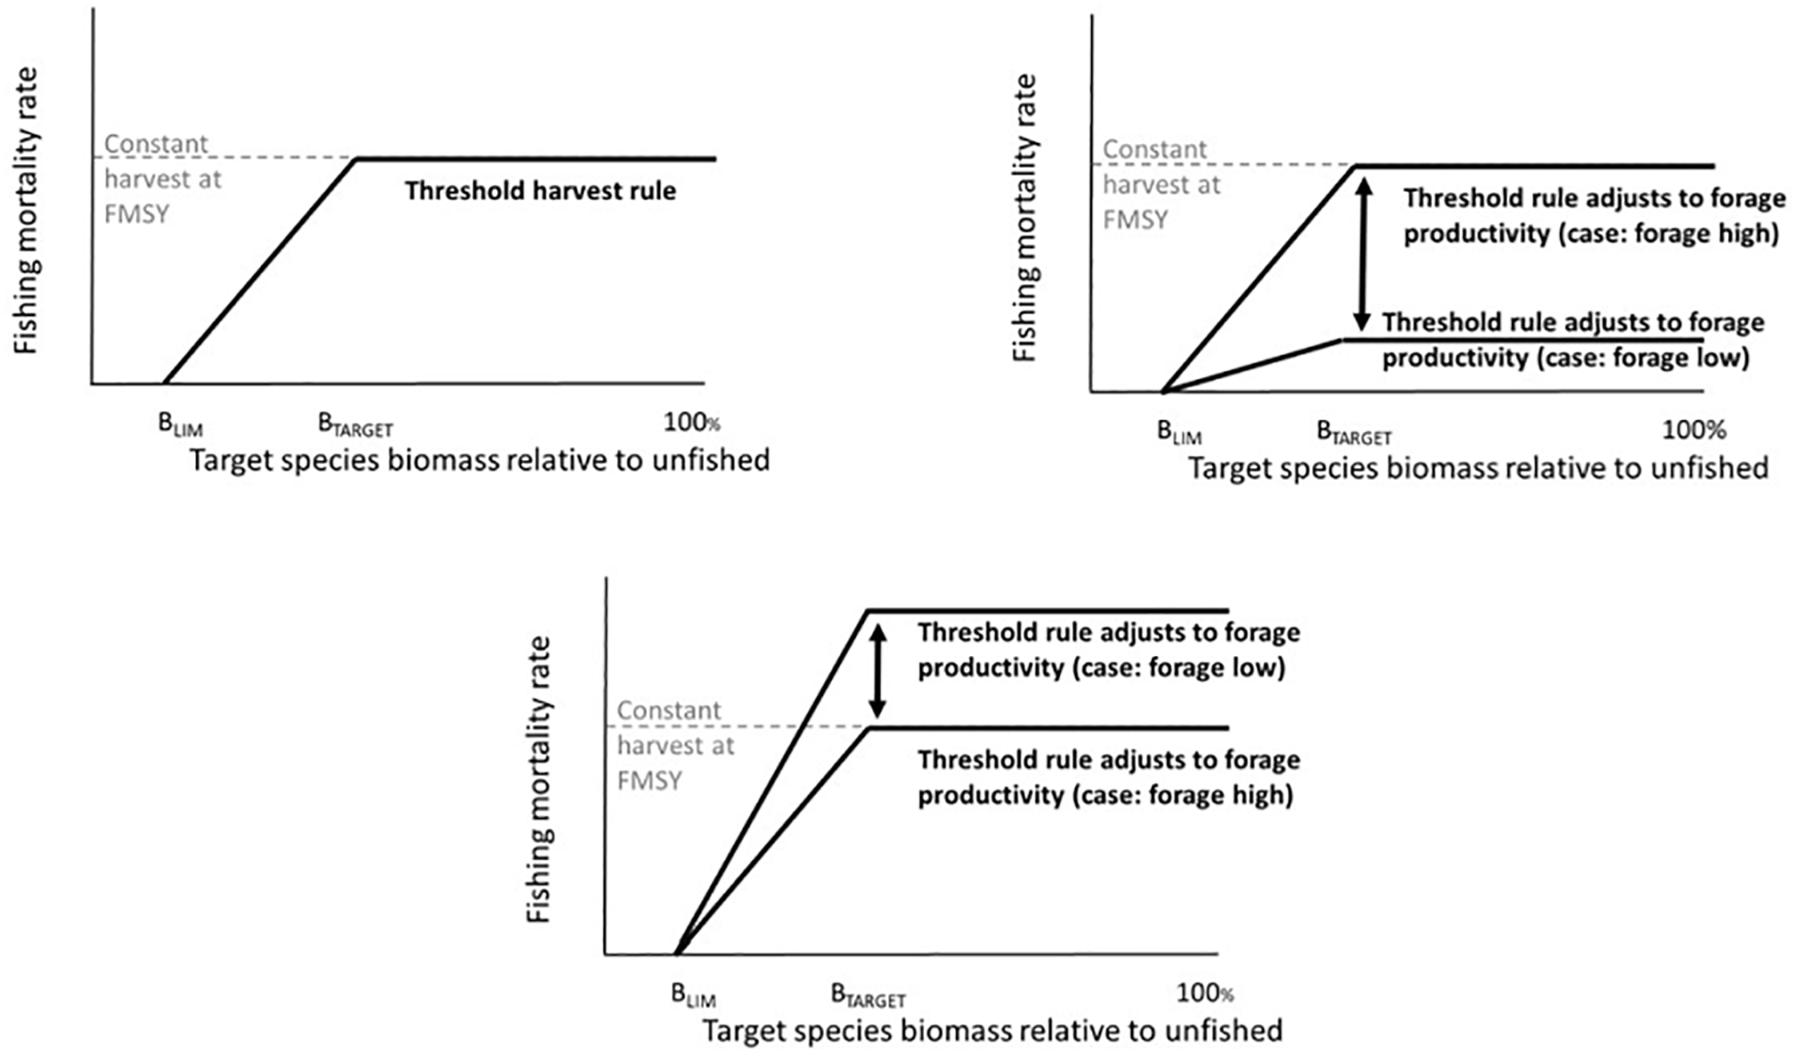
Figure 2. Top left panel: Threshold harvest control rule and constant fishing mortality rate at FMSY. Top right panel: Threshold harvest control rule that decreases F when the forage base declines. Bottom panel: Threshold harvest control rule that increases F when the forage base declines.
Threshold Harvest Control Rules That Respond to Ecosystem Productivity and Forage Base
In practice, most harvest control rules applied for fisheries management assume stock productivity varies only with the size of the target population or by including predation mortality, but previous simulation testing has considered harvest rules that respond to fluctuations in ocean conditions and prey (e.g., ICES, 2016b). In particular, fishery managers may take one of two divergent policies to respond to declining prey resources. The first perspective treats leaving fish unharvested in the ocean as an “investment” that is preferable when productivity is high (Costello et al., 1998, 2001), with the implication that fishing rates should be lowered during periods of high productivity and raised during periods of low productivity.
The alternative policy is to increase fishing when productivity is high, and fish less aggressively when productivity is low. “Less aggressive fishing” can mean upward adjustments to escapement, or decreasing fishing mortality rates in step with declining stock size, or simply maintaining constant fishing mortality rates such that catch (e.g., in tons) declines with a declining stock size (Parma, 1990; Walters and Parma, 1996; Carson et al., 2008). Overall, there is a clear understanding that refinement of harvest control rules is an important next step toward addressing both single-species goals and economic and conservation objectives within ecosystem-based fishery management (Froese et al., 2011; Levin et al., 2018; Trenkel, 2018).
Goals
Here, we apply an ecosystem modeling approach to test simple versions of threshold harvest control rules where fishing rates are adjusted with productivity, focusing on productivity driven by the abundance of key zooplankton forage taxa. We focus on major target fish stocks in the California Current and the Nordic and Barents Seas: Pacific hake and mackerel (Scomber scombrus), respectively. For these target species, we simulate alternative threshold harvest control rules that either increase or decrease fishing rates when forage productivity declines, and compare these rules to a simpler threshold harvest control rule that approximates current management policy in these regions. As a benchmark, we also apply a constant fishing rate based on maximum sustainable yield (FMSY). These ecosystem-based harvest rules that address shifting productivity or threshold forage biomass are not novel, but here we explore their implications for different trophic levels and the structure, function, and catches at the ecosystem level. We adopt lessons learned from other (mostly single-species) MSE efforts in terms of how to score, plot, and summarize model performance. Overall, there is recognition that harvest control rules are key tools for achieving ecosystem-based fisheries management goals such as coping with climate change (Kritzer et al., 2019), and for implementing the precautionary approach (Punt, 2006). Below we demonstrate that applying end-to-end “operating models” allows simulation testing of novel harvest control rules that include ecosystem considerations, and allows us to screen the implications of those rules on the ecosystem level.
Ecosystems and Methods
California Current Ecosystem
The California Current (Figure 1) is a southward-flowing eastern boundary current, and the coastal ecosystem is dominated by episodic upwelling on the scale of days to months, with long-term variability driven by the basin-scale Pacific Decadal Oscillation and the El Niño-Southern Oscillation (Checkley and Barth, 2009). Sardine (Sardinops sagax) and anchovy (Engraulis mordax) in particular demonstrate decade-long cycles (Chavez et al., 2003), and other species such as hake and rockfish (Sebastes spp.) exhibit high inter-annual variability in recruitment (Berger et al., 2017). Fisheries in this region range from large vessels with at-sea processing capability to small coastal vessels. Dominant species in landings include Pacific hake, sardine, and squid (Doryteuthis opalescens). Major contributors to landed value also include Dungeness crab (Metacarcinus magister), shrimp (Pandalus jordani), albacore tuna (Thunnus alalunga), sablefish (Anoplopoma fimbria), and salmon (Oncorhynchus spp.). Hake dominate the midwater fish biomass on the continental shelf and slope, and account for about 12% of total fish biomass (Marshall et al., 2017). Hake feed heavily on euphausiid species including Euphausia pacifica and Thysanoessa spinifera, and their distinct diel vertical migration may track euphausiids’ vertical movements (Ressler et al., 2007). Larger hake consume more fish than smaller hake. Nonetheless, recent diet syntheses suggest that approximately 80% of adult hake diet is euphausiids (Dufault et al., 2009; Wippel et al., 2017).
Pacific hake are a transboundary stock managed jointly by the US and Canada following a simple threshold harvest rule. The default fishing mortality rate when abundance is high is based on a proxy for MSY, which leads to a spawning biomass per recruit that is 40% of that without fishing (FSPR = 40%). The 40:10 threshold harvest rule decreases catch linearly to zero as spawning biomass declines from 40 to 10% of unfished levels (Berger et al., 2017). No fishery exists for zooplankton in the California Current, and in fact such fisheries were recently banned (NMFS, 2009), but natural fluctuations alone drive strong oscillations in euphausiid abundance (Ralston et al., 2015).
Nordic and Barents Seas
The Nordic and Barents Seas, where the Nordic Seas include the Greenland, Iceland, and Norwegian Sea (Figure 1), are dominated by contrasting water masses, with a large heat transport into the Barents Sea from the Norwegian Atlantic slope Current (Orvik and Skagseth, 2005). High seasonal variability follows changes in light and stratification. The ecosystems are tightly linked together by an inflow of zooplankton from the Norwegian Sea to the Barents Sea (Skaret et al., 2014) and species migrating between the two. The Norwegian Sea ecosystem is dominated by three pelagic fish species: Norwegian Spring Spawning (NSS) herring, blue whiting (Micromesistius poutassou), and mackerel, all of which compete for plankton prey items including copepods and euphausiids. Mackerel enter the Norwegian Sea for summer feeding and spend the remaining part of the year (including spawning) slightly south of the model domain, where it also spawns. The dominant prey of mackerel is the copepod Calanus finmarchicus, which has a standing stock biomass of close to 31 million tons in the Norwegian Sea (Broms et al., 2016).
Present day management for mackerel in the Norwegian Sea is complicated. Although three partners (Norway, EU, and the Faroe Islands) agreed upon a management strategy in 2015 which should be valid for the subsequent 5 years, the total quotas for 2015 to 2017 have all exceeded the advice from ICES (ICES, 2019). ICES advice, though not followed, was based upon harvest control rules in 2010 and since 2016 (ICES, 2019). A limited fishery for Calanus finmarchicus is active in the Norwegian Sea (Grimaldo and Gjøsund, 2012), though with a low quota (165,000 tons) relative to the standing stock biomass (∼31 million tons) (Broms et al., 2016).
Atlantis Ecosystem Model
To evaluate the implications of alternative harvest rules on the broader ecosystem, we implement the end-to-end Atlantis C++ code framework (Fulton et al., 2004, 2011; Audzijonyte et al., 2019). As an end-to-end model, Atlantis simulates oceanography, nutrient cycling, food web dynamics, fisheries, and other human uses on a three-dimensional domain. In most applications including ours, simulations involve forward projections of differential equations, solved on 12 or 24 h time steps using adaptive-difference techniques. The model tracks species abundance in terms of nitrogen concentrations per model cell (for invertebrates and primary producers), and in terms of numbers-at-age and weights-at-age (in nitrogen units) for vertebrates. Vertebrates typically are driven by fixed seasonal migrations or foraging behavior, while plankton are advected between model cells. Over 30 Atlantis models have now been implemented worldwide (Weijerman et al., 2016). The Atlantis code base is maintained by CSIRO Australia and made available via an online request at https://research.csiro.au/atlantis/.
California Current Atlantis
The California Current Atlantis model has been described in depth (Kaplan et al., 2017; Marshall et al., 2017). Briefly, the model includes five primary producer groups, 25 benthic and planktonic invertebrates, 36 fish groups, 10 marine mammal groups, three bird groups, and two detritus categories. The model domain represents 1.475 million km2 with 89 polygons (Figure 1), including US West Coast waters of the continental shelf, slope, and offshore to 200 nautical miles (322 km), as well as portions of Mexican and Canadian waters. The model is initialized in year 2013, and for most fish species, including hake, initial conditions for biomass are taken from recent stock assessments. Initial conditions for the “Large zooplankton” functional group (euphausiids) are taken from a summary of the CalCOFI plankton time series (Lavaniegos and Ohman, 2007), and from zooplankton samples taken along the Newport Oregon Hydrographic Line (W. Peterson, unpublished data, NOAA NWFSC, Newport Oregon). The model is forced by Regional Ocean Modeling System (ROMS) output for 2013, as in Marshall et al. (2017). This oceanography drives Atlantis daily temperature, salinity, and currents; in the present application we do not apply the values of pH from Marshall et al. (2017) to the biological response of the model. The California Current model generally does not require a spin-up, and after initialization in year 2013 reaches quasi-stable behavior (under constant fishing) by approximately year 30, before our results reporting years 41–50. In other applications, the model has been used to test implications of ocean acidification (Marshall et al., 2017) and reductions in forage fish abundance (Kaplan et al., 2017).
Nordic and Barents Sea Atlantis
The Nordic and Barents Sea Atlantis model (Hansen et al., 2016, 2019a,b) includes 54 species and functional groups, and was constructed to explore combined fisheries and climate scenarios. Of the 54 components, 3 are primary producers, 20 fish groups, nine benthic and planktonic invertebrates, two bird groups, 10 marine mammal groups, and three detritus categories. The model domain represents 4 million km2 with 60 polygons (Figure 1), which are designed to be as homogeneous as possible. For this study, the model is initialized representing 2003, and fish biomasses are taken primarily from stock assessments, including for mackerel (ICES, 2017). Biomass of the functional group “Mesozooplankton” (primarily C. finmarchicus) was taken from surveys in the Norwegian Sea (Skjoldal et al., 2004) and in the Barents Sea (SJØMIL)1. Daily inputs of temperature, salinity and currents were interpolated from a set of ROMS models representing the period used in these simulations (NorESM; Sandø et al., 2014). This Atlantis model required a 24 year spin-up period, where the physical forcing was looped 24 times using the same year (2004). These first 24 years were not used in any analyses. Mackerel is a migratory species within this model (Hansen et al., 2016), and only enters the model during the summer months for feeding. During the period it stays outside the model domain, it experiences no mortality or growth. Fisheries prior to 2017 were represented using historical fishing pressures for the larger commercial stocks (ICES, 2017, 2018a). Along with the California Current model, the Nordic and Barents Sea Atlantis implementation has recently been used as part of a global suite of models to test a range of fisheries policies and marine protected areas (Olsen et al., 2018), and for a sensitivity study of the key groups and parameters included in the model system (Hansen et al., 2019a).
Simulation Design
For both ecosystems, we simulate 50-year forward projections of the harvest control rules described in detail below. The simulations are based on the parameterizations described in Hansen et al. (2016, 2019a) and Kaplan et al. (2017), recently applied jointly in Olsen et al. (2018). In the California Current simulations, fishing rates for all species other than our “target” (Pacific hake) were held at 2013 fishing mortality rates (F units of yr–1). In the Nordic and Barents Seas simulations, fishing rates for all species other than “target” mackerel represented historical F rates until 2017, when they switch to average, representative values for each component based on the fishing pressure for the last decade.
We tested six harvest control rules (Table 1). To establish parameters for the harvest rules, prior to the simulations described here, estimates of B100 (unfished biomass) and FMSY for the target fish groups were calculated iteratively from multiple simulations, by varying (or turning off) fishing rates on one target species and holding all other species at base case fishing rates. The calculated FMSY was applied in the “Constant FMSY” simulations, and was also used to define the maximum fishing mortality rate in the threshold harvest rule simulations (Figure 2 and Table 1, Rule 1). The B100 was also used to define B40 (40% of unfished biomass) and B10 (10% of unfished biomass), which we used to define Btarget (target biomass) and Blim (limit reference point below which harvest is stopped) in the threshold rules, respectively (Figure 2 and Table 1, Rule 2). (We adopt the terminology “target” following common usage on the US West Coast (Punt et al., 2008), but note that readers from other regions may have other terminology, such as Btrigger).
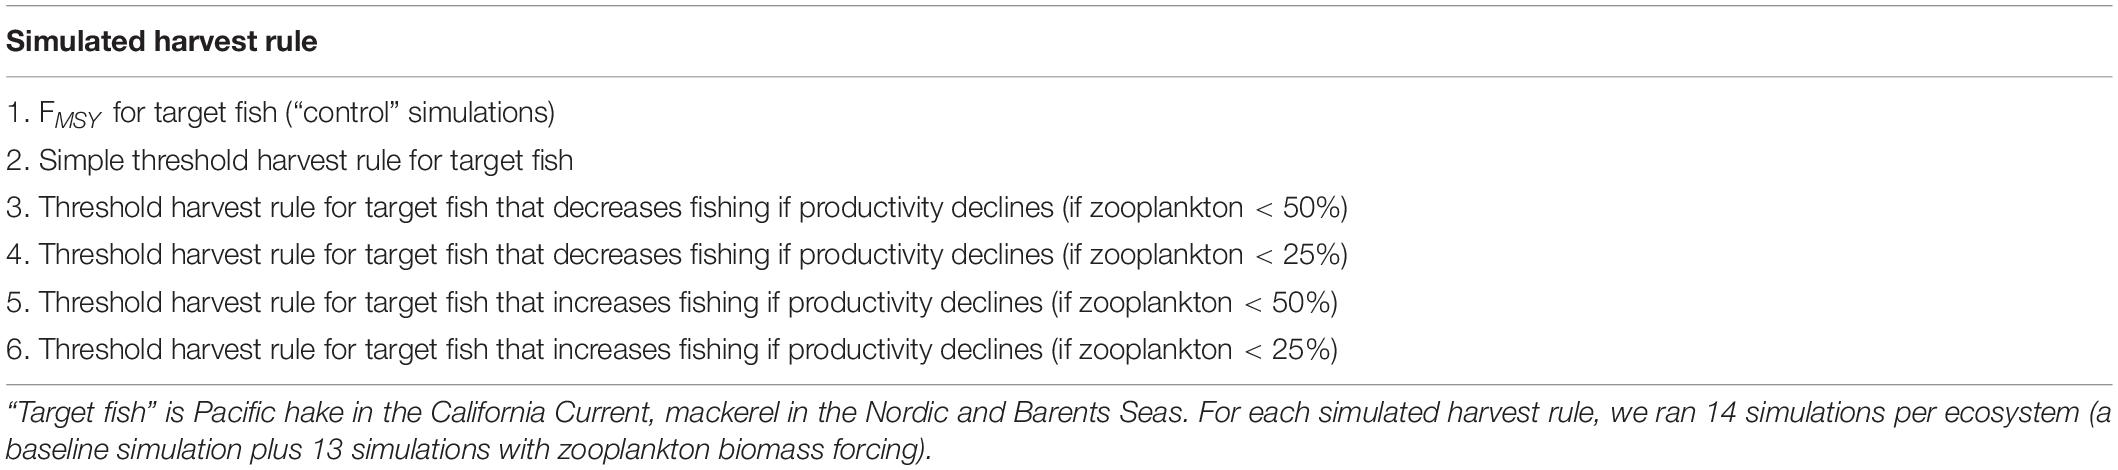
Table 1. Simulations performed.
Due to the strong feeding preference from hake and mackerel on euphausiids and copepods respectively, we designed harvest rules with precautionary reductions in fishing on target stocks that were triggered when their zooplankton prey declined below threshold levels. Specifically, we reduced fishing mortality rates (F, yr–1) on target fish when zooplankton fell below either 50% of average biomass (Table 1, Rule 3) or below 25% of average biomass (Table 1, Rule 4). Fishing mortality was reduced proportional to the diet fraction comprised of the zooplankton. For the California Current, this was a 79% reduction in fishing mortality rate from the simple threshold rule (based on 79% of hake diet from euphausiids in the base case; Wippel et al., 2017), and for the Nordic and Barents Seas this was similarly a 75% reduction in fishing mortality rate (based on Iversen, 2004). This strong reduction in fishing illustrates a case where fishery managers institute very precautionary policies, assuming little ability of hake or mackerel to locate zooplankton aggregations or switch prey when productivity declines.
In addition, we tested the possible effects of increasing the fishing pressure on the target fish when its main zooplankton prey fell below the threshold. For this specific harvest control rule, we increased the fishing mortality rate by 25% when the zooplankton fell below either 50% (Table 1, Rule 5) or 25% (Table 1, Rule 6) of average biomass.
Time Series of Plankton Productivity
The threshold harvest rules are intended to adjust to shifts in stock abundance and productivity, and hence we simulate an ensemble of fluctuating time series of zooplankton productivity that will drive these shifts (Figure 3). California Current euphausiids and Nordic and Barents Seas copepods are major prey items for Pacific hake and mackerel respectively (Dufault et al., 2009; Bachiller et al., 2016; Wippel et al., 2017), and sensitivity analyses support the key role of zooplankton for fish food webs (Hansen et al., 2019a). For the California Current, we drive ecosystem productivity with observations of annual euphausiid abundance from midwater net surveys off Central California, for 1990–2017 (Sakuma et al., 2016). For the Nordic and Barents Seas, we drive the ecosystem model with a Norwegian Sea copepod survey for 1995–2017 (Broms et al., 2016). We scaled the plankton time series for each ecosystem such that the mean of the time series was 1. We then created 13 replicates of the time series (for a total of 14), each with a distinct starting point in the original survey data (e.g., starting years 1,3,5,…,27), and then we “looped” or repeated the time series for the simulation duration (50 years). We used each of these 14 time series as annual multipliers of base zooplankton biomass, and used these time series of zooplankton biomass to drive the 14 replicates testing each harvest rule listed in Table 1. Performance of a harvest rule in each simulation (e.g., Simple Threshold harvest rule for hake with zooplankton time series #1) was calculated by comparing to outputs from an FMSY simulation forced by the identical zooplankton time series (e.g., zooplankton time series #1). The choice of 14 replicates was driven by practical considerations related to available computer processing power: 14 × 6 harvest rules × 2 ecosystems represents approximately 8,000 h of compute time.
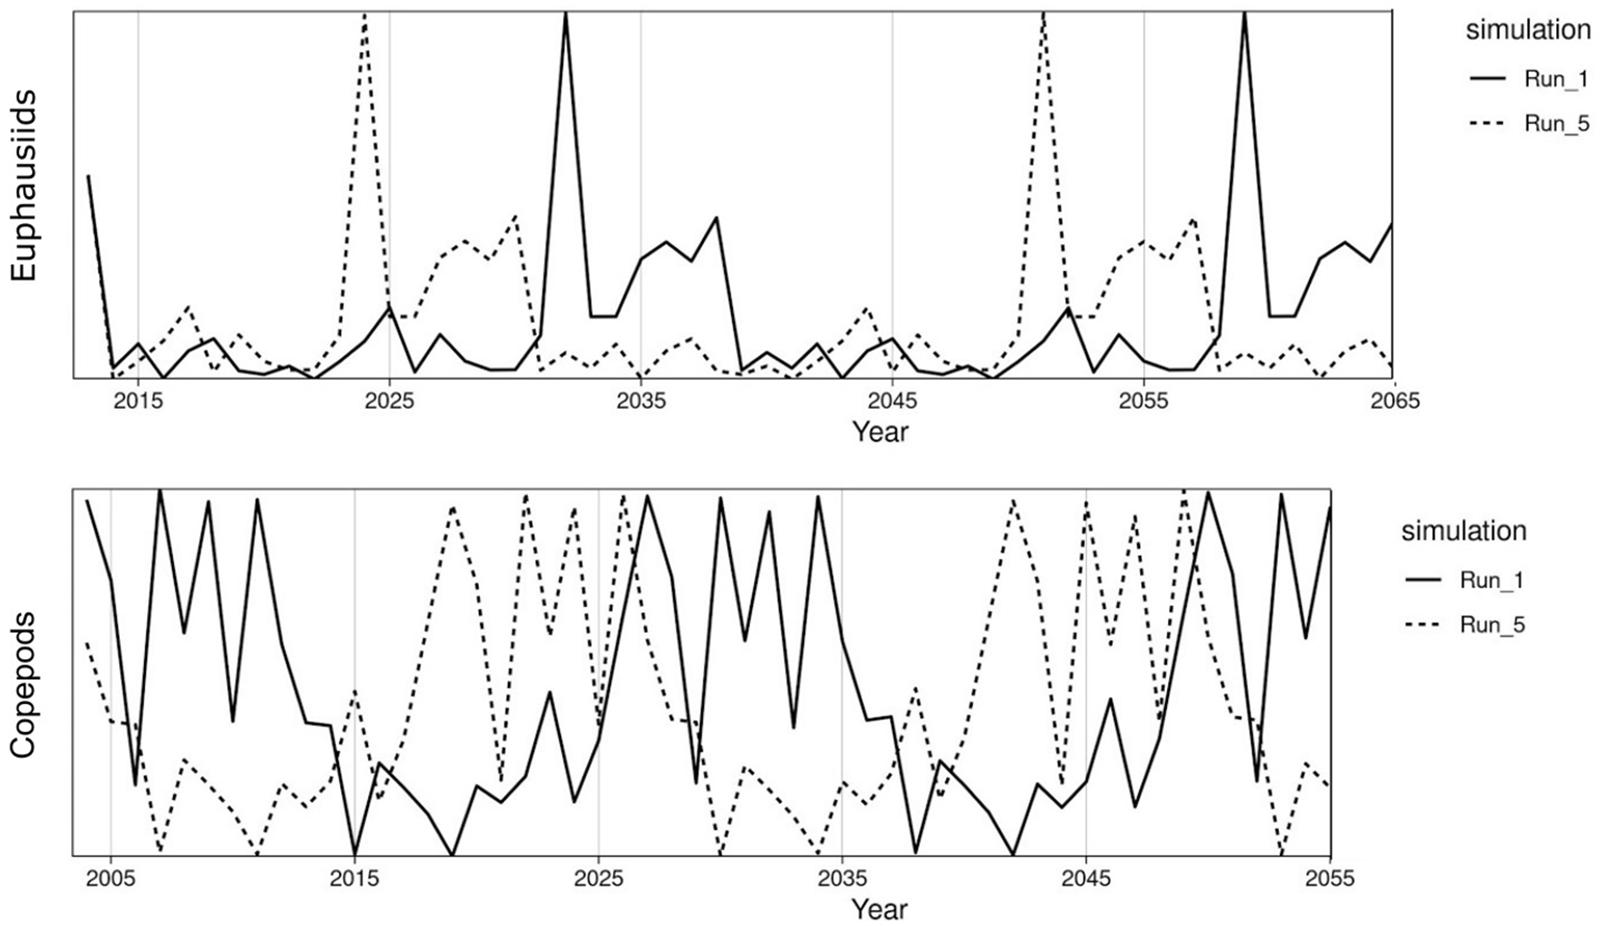
Figure 3. Biomass trajectories of euphausiids from the California Current Atlantis model (top) and of copepods from the Nordic and Barents Seas Atlantis model (bottom). For each ecosystem, simulations 1 and 5 are shown as examples. The pattern is shifted by 2 years between each simulation, e.g., simulations 1 and 5 are 8 years lagged. Biomass trajectories are forced based on zooplankton abundance time series for the Norwegian Sea (copepods, 1995–2017), and the California Current (euphausiids, 1990–2017), with the time series “looped” to stretch the duration of the Atlantis simulations.
Performance Metrics
We evaluated performance of the harvest rules in terms of ecosystem metrics, following Olsen et al. (2018). The ecosystem metrics largely follow those from the IndiSeas project (Shin and Shannon, 2010) and others (Fulton et al., 2005; Rice and Rochet, 2005; Methratta and Link, 2006). We calculated seven metrics of ecological community properties and eight metrics of fisheries and economic properties, averaging over the last 10 years of each fifty year scenario (Table 2). The economic properties are very simple, only taking the value of the catch (current value) into consideration, using values from Olsen et al. (2018). Consistent with other MSEs (e.g., Tommasi et al., 2017), we also plotted the biomass, catch, and coefficient of variation of catch, for both target fish species (hake or mackerel).
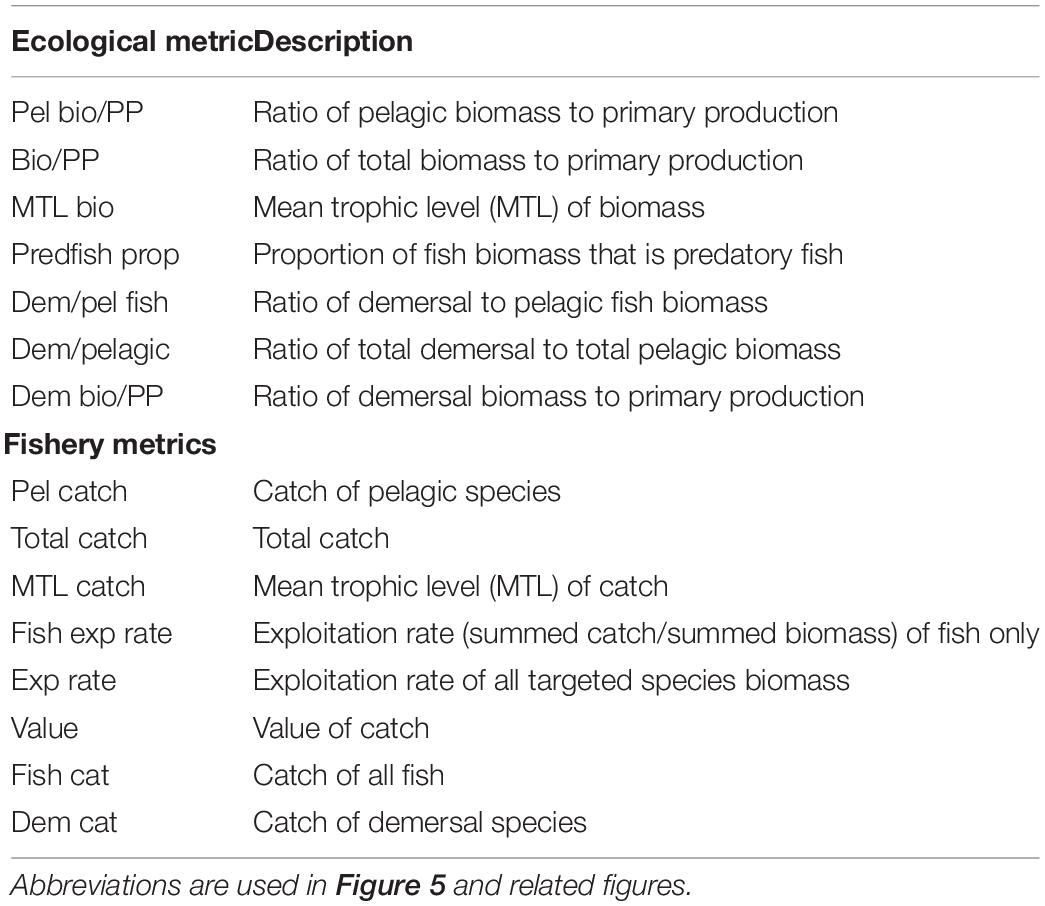
Table 2. Ecological and fishery indicators used as performance metrics.
The biomass responses of modeled groups in the last 10 years of the simulation were plotted relative to biomass in the FMSY case, and were also aggregated into 11 guilds, as in Olsen et al. (2018): “mammals,” “seabirds,” “shark,” “demersal fish,” “pelagic fish,” “squid,” “filter feeder,” “epibenthos,” “zooplankton,” “primary producer,” and “infauna.”
Results
Example of Dynamic Outputs: California Current Harvest Control Rules for Hake
The simulations implemented the harvest control rules specified in Figure 2 and Table 1, and projected impacts on stock dynamics. For example, the California Current hake threshold rule decreasing F when prey abundance declined had the expected upper and lower limbs corresponding to periods with high or low euphausiid abundance (Figure 4, corresponding to harvest rule #4 in Table 1). Frequent (annual) adjustment of the F rates led to high variability in hake F and catch. Similar diagnostic plots for other harvest control rules suggest the simulations were able to recreate the set of rules listed in Table 1.
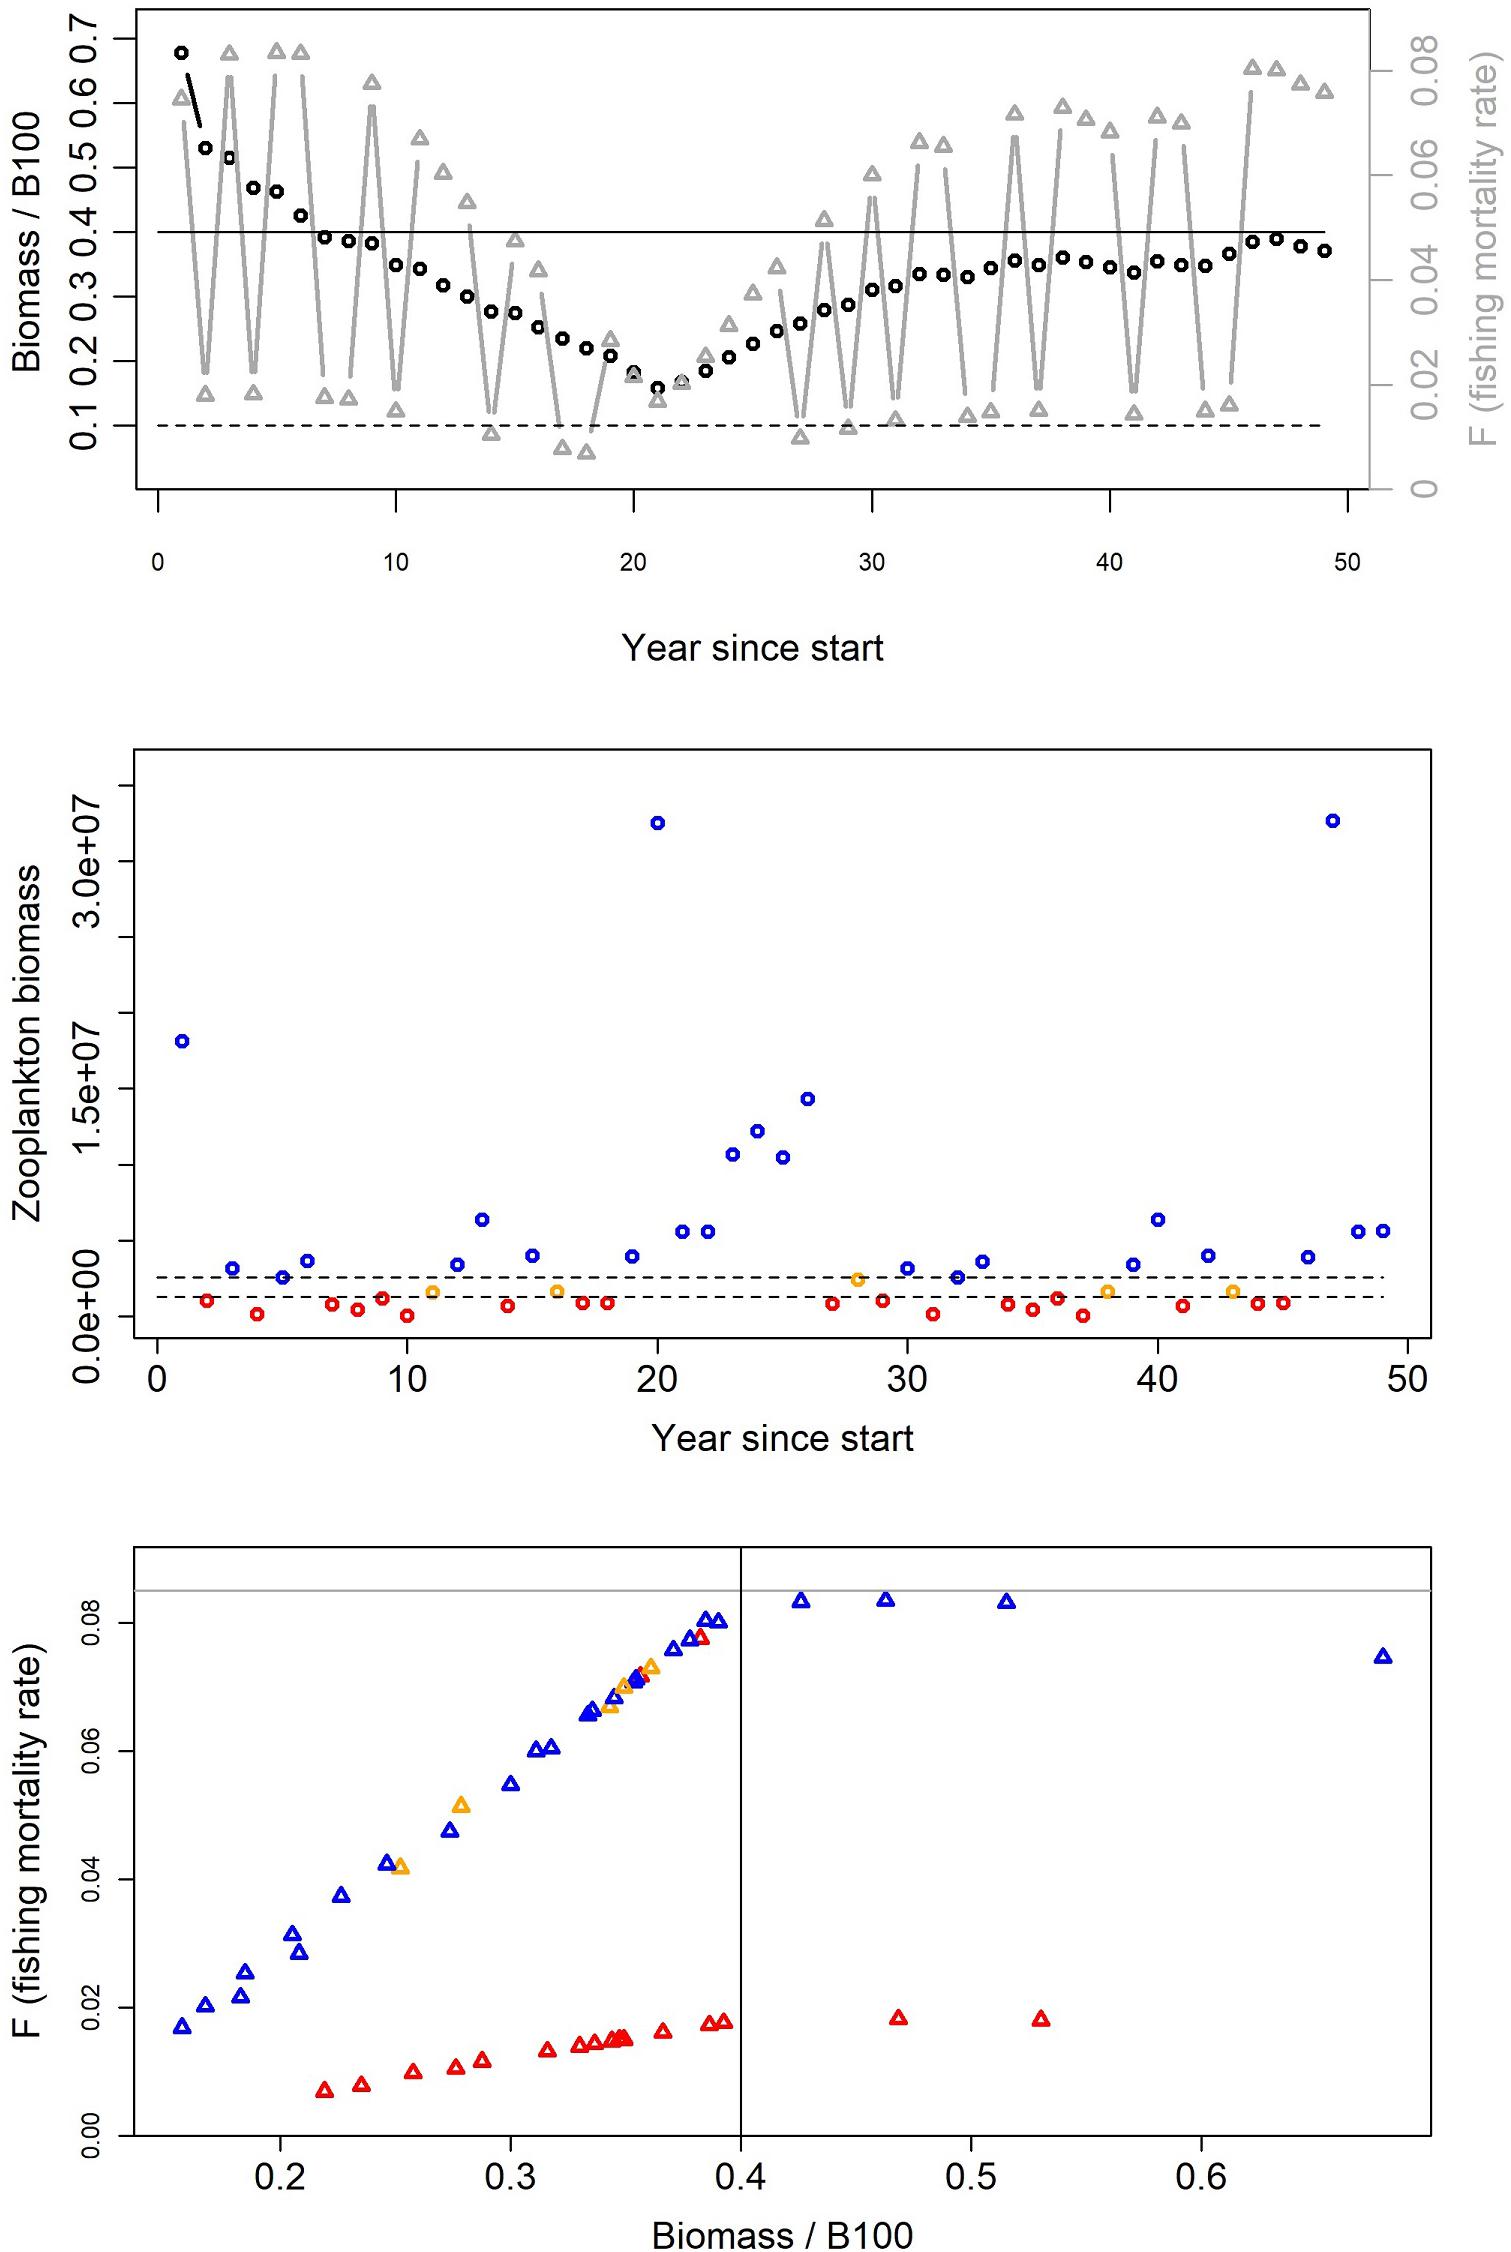
Figure 4. Example time series of Pacific hake biomass and F (top panel), zooplankton biomass (middle panel), and F versus biomass (bottom panel) from the California Current Atlantis model. These are outputs from a threshold harvest rule for target fish that scales fishing in step with productivity (if zooplankton falls below < 25%; Table 1, Rule 4). More specifically, for this US example, F rates from the 40/10 hake threshold rule are decreased by 79% if euphausiid abundance falls below 25% of baseline euphausiid abundance. Note the high variability in F for this harvest rule (top panel, gray symbols linked by gray lines). In the top panel the solid black line indicates the BTARGET reference point below which the fishing mortality rate is reduced (B40), and the dashed black line indicates the BLIM reference point below which harvest is stopped (B10). In the middle panel, points indicate whether zooplankton abundance is below 25% (red), between 25 and 50% (orange), or above 50% (blue). In the bottom panel, the solid gray horizontal line indicates the maximum fishing mortality rate (FMSY), the solid black line indicates the BTARGET reference point, and points are colored identically to the middle panel.
Threshold Harvest Rules for Target Fish
For both the California Current and Nordic and Barents Seas, as expected, the scenarios suggest higher target fish biomass (hake or mackerel, respectively) in the final years of the simulation under a threshold harvest control rule than under constant FMSY (rule #2 in Table 1, Figures 5, 6 top left panels, Supplementary Table S1). This was due to lower average F imposed at low biomasses under this harvest rule (Figure 2A). Variation in catches with the threshold rule, as compared to variation in catch under FMSY, was higher for mackerel, and only slightly higher for hake (Figures 5, 6, top right panels). Average catches of both hake and mackerel were within ∼5–10% of average catches under an FMSY base case. Lower F resulted in lower average catches for mackerel. For hake in the California Current, catches were slightly higher under this threshold rule (and all variants of the threshold rule below) than the FMSY case. This was due primarily to the trend in hake biomass in the base run (decline followed by recovery over years 25–50), and the fact that lower Fs in the threshold rule during the early part of the recovery led to higher biomass and catch by the final years of the simulation. The hake stock starts the simulation at 3.8 million metric tons, which is 67% of the model’s estimate of unfished biomass (5.7 million metric tons), but approximately double the model estimate of BMSY (1.94 metric tons). The decline below BMSY is driven primarily by model internal dynamics (physical forcing and trophic interactions, including effects of management on other commercial species), rather than by fishing rates on hake; however, the recovery from this decline is influenced by hake F and harvest rule. In both ecosystems, target fish biomass trends were slightly modified by the zooplankton forcing, but were consistent enough that we see moderate or little variability in target species biomass and catch across the 14 simulations, as demonstrated by the narrow range of biomass outcomes for hake and mackerel (Figures 5, 6, top left panels).
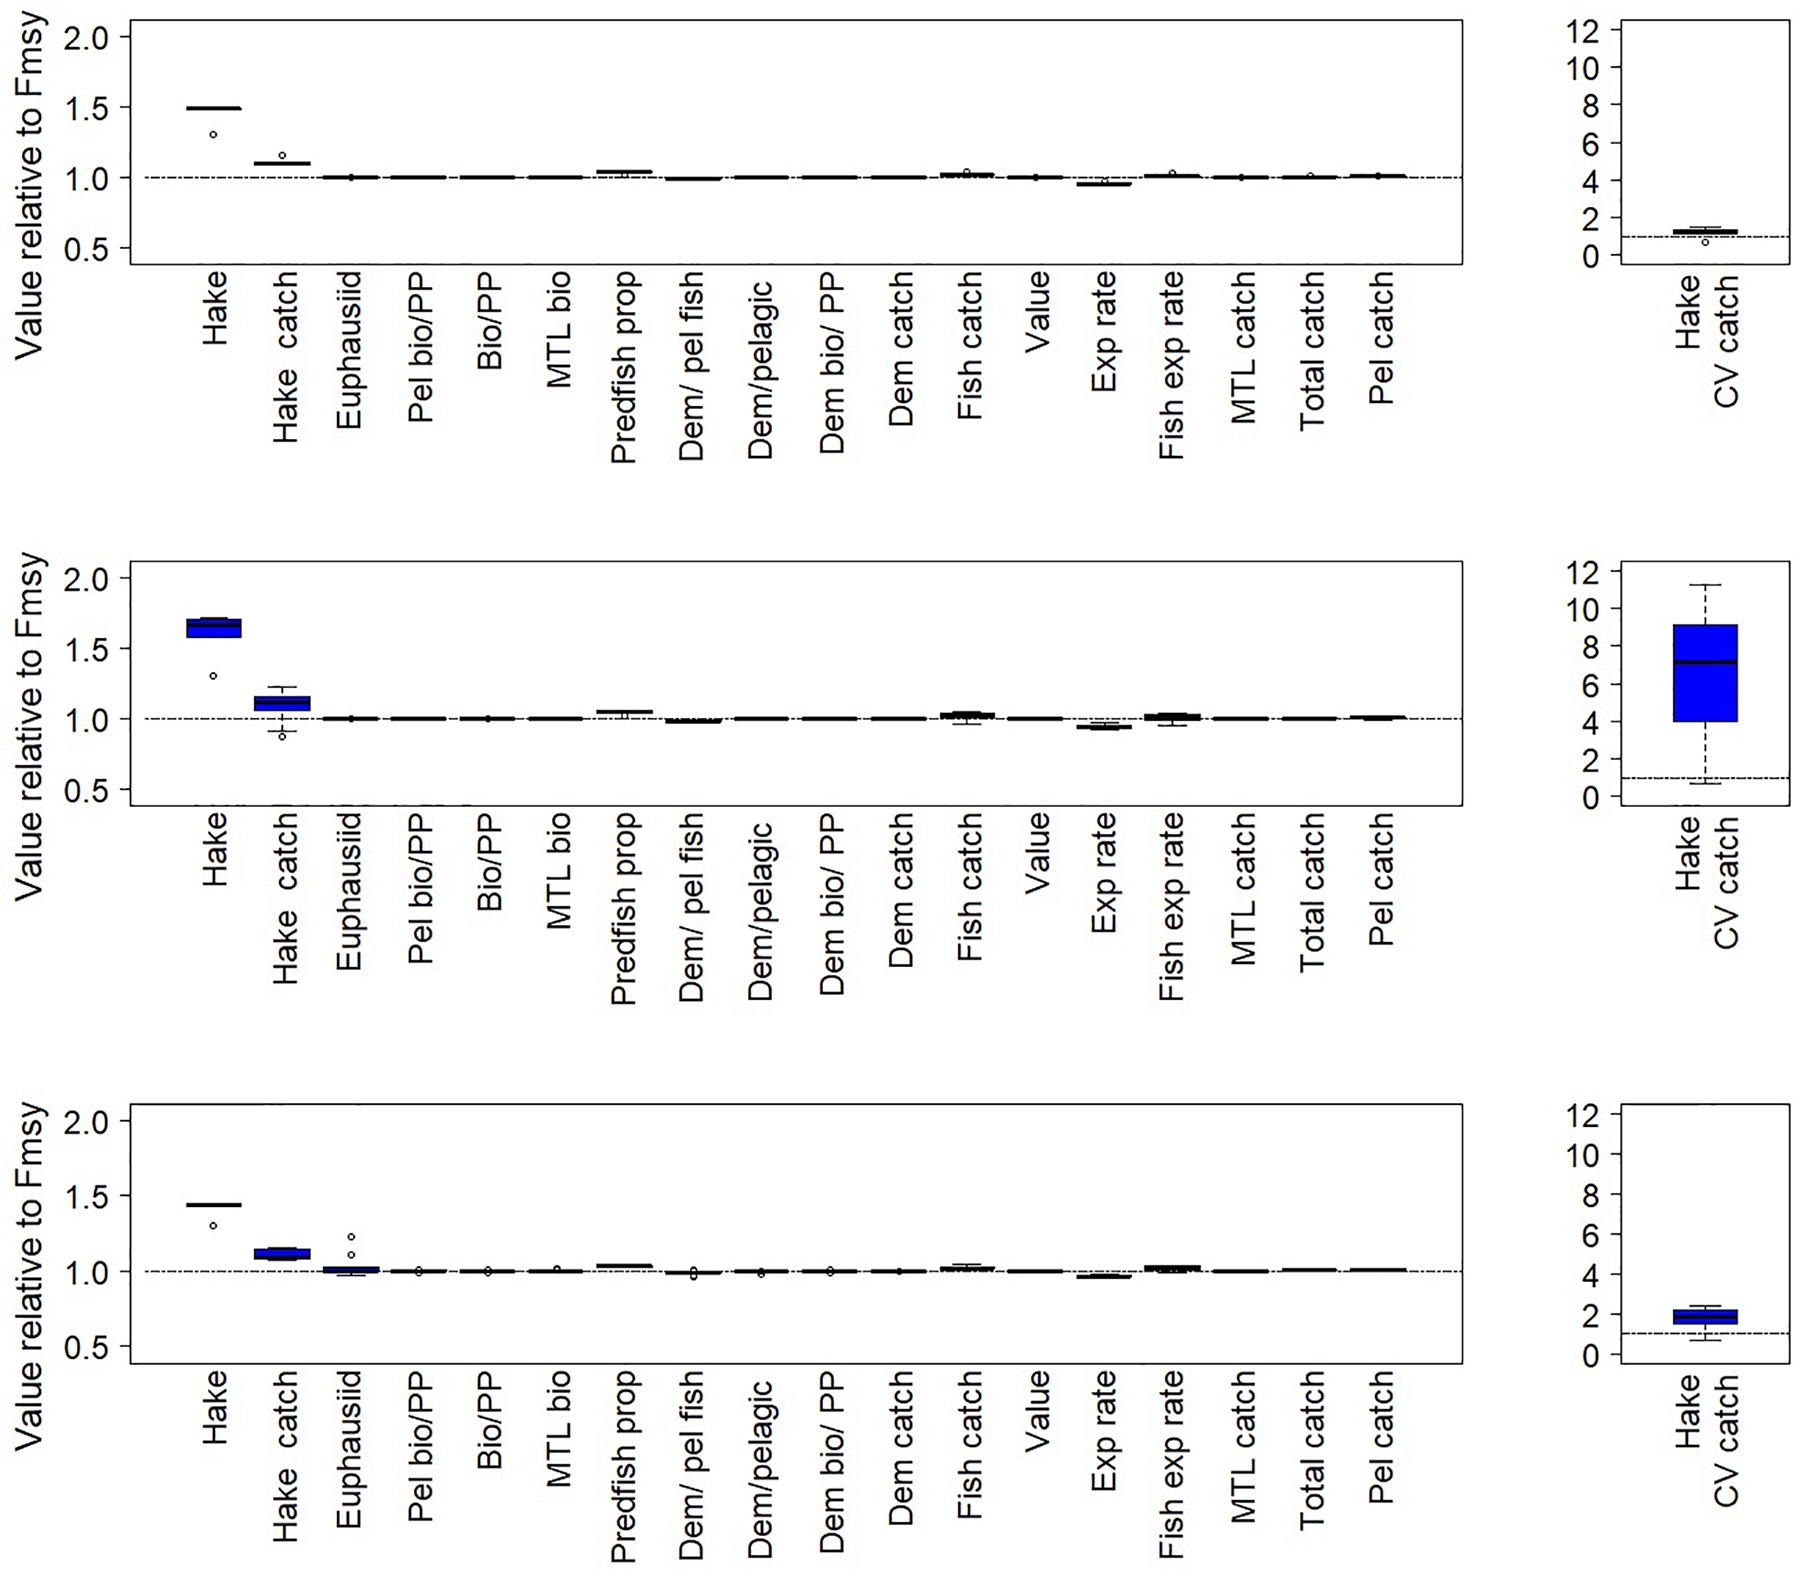
Figure 5. Fishery and ecological metrics for the California Current results, with Pacific hake as target fish. These performance metrics are scored against comparable base cases with target fish F = FMSY. Each of the pairs of simulations here is forced with a different time series of euphausiid biomass. Top left panel: Performance metrics for simulations with a simple threshold harvest control rule (rule #2 in Table 1). Middle left panel: Performance metrics for a threshold rule for target fish that decreases fishing if productivity declines (if zooplankton < 25%). This threshold rule is #4 in Table 1. Bottom left panel: Performance metrics for a threshold rule for target fish that increases fishing if productivity declines (if zooplankton < 25%). This threshold rule is #6 in Table 1. Right panels: Coefficient of variation of catch. In all panels, boxes span the lower to upper quartiles, horizontal black lines within each box represent median values, and whiskers extend to the highest and lowest values excluding outliers. Outliers are indicated by open circles, defined as points beyond 1.5 times the interquartile range.
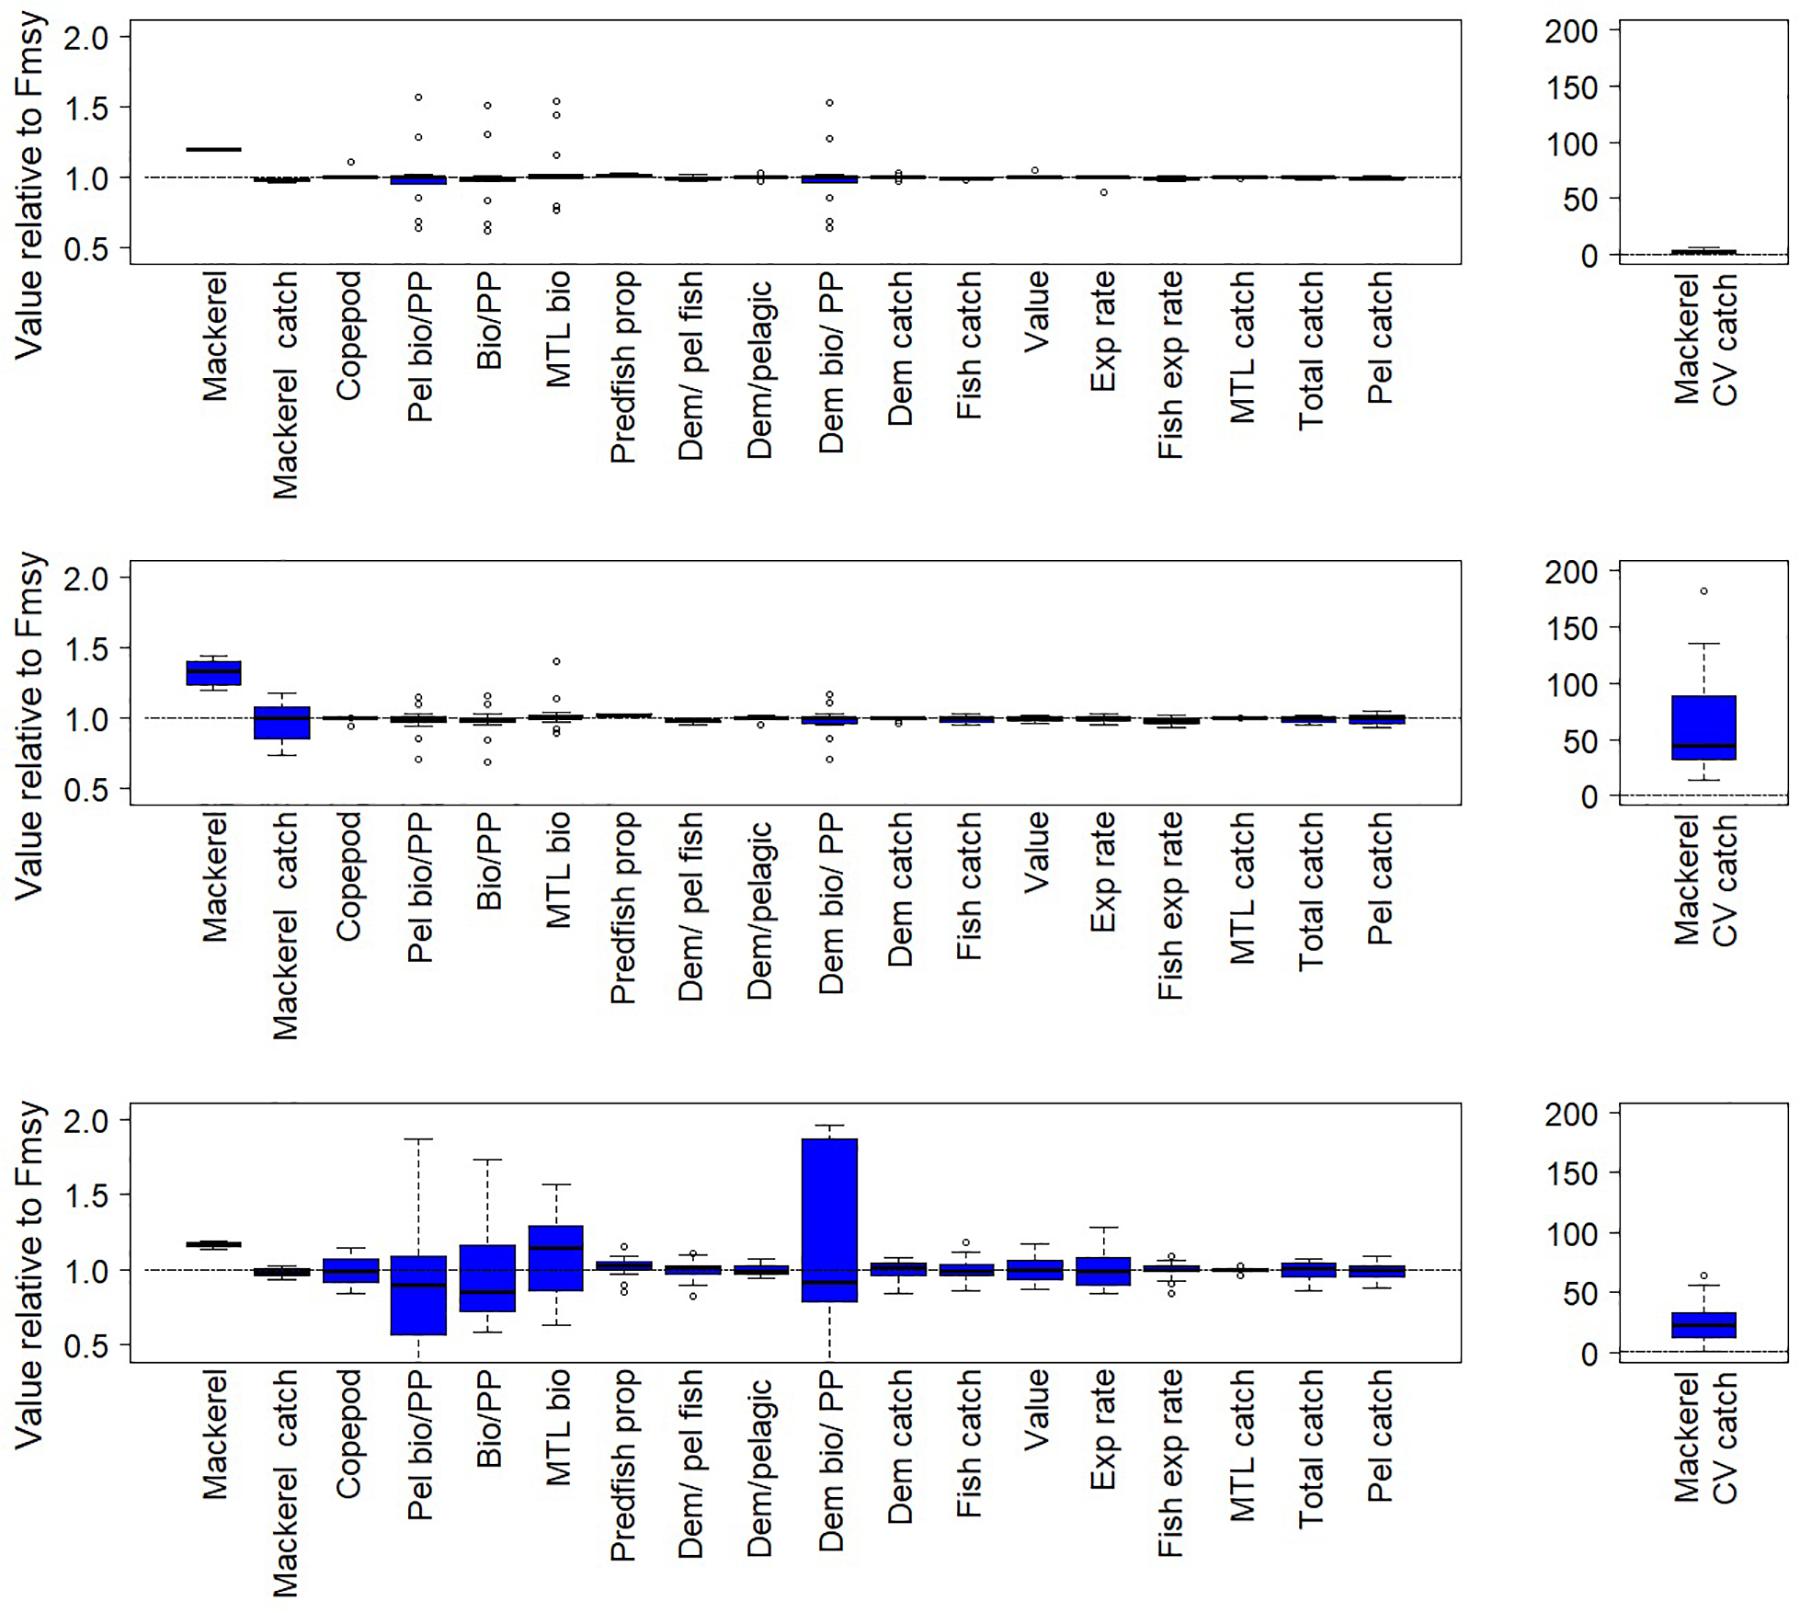
Figure 6. Fishery and ecological metrics as in Figure 5, but for the Nordic and Barents Seas, with mackerel as target fish. Each of the pairs of simulations here is forced with a different time series of copepod biomass.
The ecosystem-level performance of the threshold harvest rule differed little from the FMSY scenario. Other than metrics related directly to target fish, the ratios of ecological metrics (Figures 5, 6, top left panels) in these two scenarios were generally near 1, especially in the California Current. Guild-level biomasses for the most part did not differ substantially between the scenario with this threshold rule and the corresponding FMSY simulations (Figure 7). Hake and mackerel are both categorized for these purposes as pelagic fish, and were the only species in the pelagic guild that exhibited strong increases in biomass. Other guilds showed minimal responses. For the California Current, the strongest impact (∼+15%) was in the demersal fish guild, for Large Piscivorous Flatfish (halibut); empirical diet studies suggest adult halibut have a diet of 38% hake and juveniles have diet of 6% hake (Wippel et al., 2017). For the Nordic and Barents Seas, the strongest impacts were on individual zooplankton and primary producer groups, but these were generally less than 30% and were present in a minority of the 14 simulations. One caveat is that the direct forcing of copepod biomass (see “Time Series of Plankton Productivity” above) can lead to stronger responses in the lower trophic levels than might exist if copepod biomass dynamics were limited by model feedbacks.
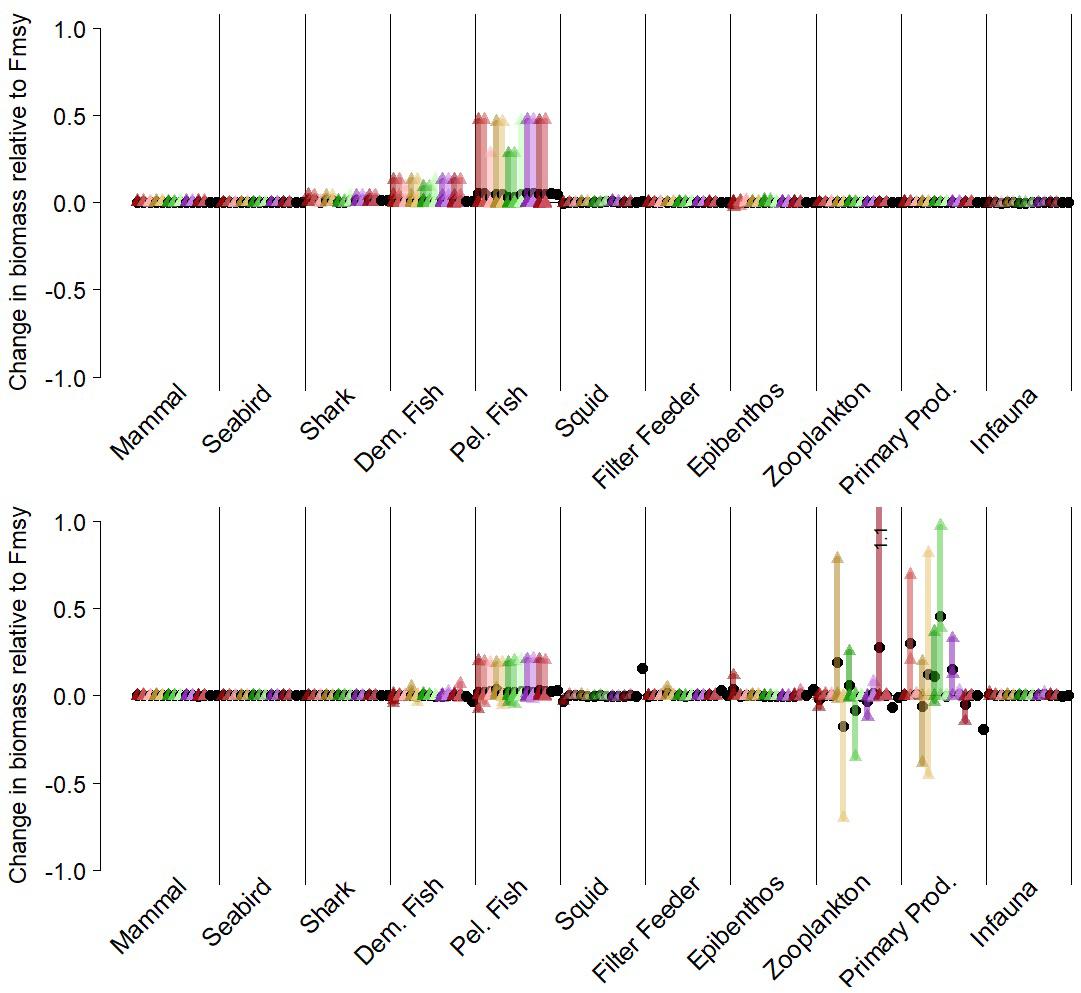
Figure 7. Guild-level biomasses for simulations with a simple threshold harvest control rule for target fish (rule #2 in Table 1), scored against comparable “control” simulations with target fish F = Fmsy. Each simulation is represented by a unique color. Vertical bars represent the range of functional group responses, grouped by guilds, within each simulation. Small triangles are individual functional group responses, and black circles are the average responses per simulation. Top panel: California Current results for Pacific hake as target fish. Lower panel: Nordic and Barents Seas results for mackerel as target fish. Both target fish are in the pelagic fish guild.
Threshold Rules That Scale Fishing Mortality Rate With Forage Productivity
Threshold harvest control rules that decrease fishing on target fish if forage productivity declines (i.e., zooplankton abundance declined below 25%) led to frequent abrupt declines in F (as exemplified in Figure 4), resulting in lower average F, high target fish (hake or mackerel) biomass and very high variability in catch (Figures 5, 6, middle panels). In the California Current this variability resulted in higher target fish (hake) catches compared to the fixed FMSY scenario; this pattern was consistent with hake catch results in the simple threshold rule, as described above. In the Nordic and Barents Seas, this variability resulted in target fish (mackerel) catch similar to levels in the fixed FMSY scenario. Target fish biomass was higher than under the simple threshold harvest rule (i.e., compared to top panels in Figures 5, 6).
As compared to FMSY scenarios, threshold harvest control rules that increase fishing if productivity declines also exhibited lower average F, high target fish biomasses and high variability in catch (Figures 5, 6, bottom panels). However, compared to scenarios that decrease fishing on target fish if productivity declines, threshold harvest control rules that increase fishing on target fish if productivity declines led to lower target fish biomass, but also lower catch variability (Figures 5, 6, bottom panels, Supplementary Table S1). Catches outperformed FMSY scenarios by ∼10% for hake, but not for mackerel; this was consistent with catch results in the simple threshold rule, as described above.
As would be expected, the harvest rules that adjusted to more moderate (50%) declines in zooplankton (Rules #3 and #5; Supplementary Figures S1, S2) have even more frequent adjustments in F and larger variation in target fish catches, i.e., trends for target fish catch and biomass are more extreme examples of those in Figures 5, 6, middle and lower panels.
For the harvest rule that decreased fishing on target fish if productivity declined, ecological performance differed little from the FMSY scenario. Other than metrics related directly to target fish, the ratio of ecological metrics (Figures 5, 6, middle panels) in these two scenarios was generally near 1. Guild-level biomasses for the most part did not differ substantially between the threshold rules that scaled fishing with productivity and the corresponding FMSY simulations (Supplementary Figure S3). Similar to results from the simple threshold rule, for the California Current the largest effect on a species other than hake was a 19–22% increase in Large Piscivorous Flatfish. For the Nordic and Barents Seas, the largest effect at the guild level, other than for pelagic fish (i.e., mackerel), was for individual zooplankton and primary producer groups in a minority of the 14 simulations, consistent with results testing the simple threshold harvest rule for mackerel.
In contrast, for the harvest rule that increased fishing on target fish if productivity declined, ecological performance was more variable, particularly for the Nordic and Barents Seas (Figures 5, 6 lower panels and Supplementary Table S1). Median effects across simulations were as high as 15%, and the performance of individual simulations varied, particularly for metrics related to primary production (“PP”) and also for Mean Trophic Level of Biomass. Under this harvest rule, the Nordic and Barents Seas experienced high variability (across simulations) in terms of the guilds Epibenthos, Zooplankton, and Primary producers, and some variability in the Demersal fish guild, as well as increases in Pelagic fish (mackerel) (Supplementary Figure S4). In the California Current, guild-level effects were more rare.
Discussion
Acknowledgment of and attempts to incorporate variability and directional change in environmental conditions into fisheries management is increasing as ecosystem-based management approaches gain popularity (Marshall et al., 2018; Haltuch et al., 2019). Many countries now embrace the principles of ecosystem-based fisheries management (Pitcher et al., 2009), even if the implementation of these management approaches has been somewhat slow (Skern-Mauritzen et al., 2016). While future ocean conditions will be driven by warming, ocean acidification, deoxygenation, and interactions with multiple anthropogenic stressors such as fishing and nutrient loading (Gattuso et al., 2015), climate change is not required to demonstrate the potential value of responsive harvest control rules. However, we expect some of the most dramatic future changes to occur in sub-arctic and arctic ecosystems such as the Nordic and Barents Seas (Cheung et al., 2010; Fossheim et al., 2015), and eastern boundary currents such as the California Current that are marked by upwelling of deep, nutrient rich water (Gruber et al., 2012). Future scenarios involve not only projections of the biophysical responses, but also aspects of governance, economy, and management (Maury et al., 2017). Management response to variable and changing ocean conditions may require flexible, responsive policies that adapt to changing productivity and fishery demands (Pinsky and Mantua, 2014; Schindler and Hilborn, 2015). Here we have evaluated the ecosystem and fishery consequences of one set of such responsive policies for key pelagic species for the California Current and Nordic and Barents Seas ecosystems.
Our main results agree in many ways with those from previous single-species simulation studies, but the application of the full ecosystem model identifies two dimensions of tradeoffs that are not apparent with simpler operating models. Consistent with studies based on single-species operating models (see review by Deroba and Bence, 2008), we found that compared to constant F = FMSY policies, threshold rules led to higher target stock biomass for Pacific hake in the California Current and mackerel in the Norwegian Sea. Performance in terms of catch varied depending partly on the biomass and recovery trajectory for the individual target stocks, largely due to the dynamics of the individual target stocks.
The first major tradeoff illustrated by applying the full ecosystem model was the increased catch variability apparent for all the harvest control rules that link fishing mortality rates to prey (zooplankton) availability, due to rapid and frequent changes in those fishing rates. In these two systems zooplankton abundance is highly variable (Figure 3), and this tradeoff stems directly from the structure of the harvest rule, rather than from modeled trophic dynamics. Variability in catches is often reported as a performance metric (Punt et al., 2016a), and if one goal of fisheries managers and fishers is to minimize fluctuations in catch, we expect that they would be unwilling to accept management strategies with order-of-magnitude increases in catch variability. For example, threshold rules that decreased fishing when zooplankton declined led to extremely high variability in catch. Overall our simulations found little benefit to this policy versus either the simple threshold rule or constant F = FMSY scenario. Previous authors have also suggested that constant F rates often perform well in terms of single species performance metrics such as catch or natural log of catch (Parma, 1990; Walters and Parma, 1996), dampening variability in biomass and yield. Simple threshold rules are an extension to this which accounts for stochasticity and uncertainty in stock size (Lillegård et al., 2005; Sethi et al., 2005).
The second major tradeoff illustrated by our results stems from the full representation of the ecosystem in the operating model, and in particular when testing the threshold rules that increase fishing when productivity (zooplankton) declined. This perspective treats leaving fish unharvested in the ocean as an “investment,” meaning that they should be harvested more heavily when productivity declines. Our application of end-to-end ecosystem models here illustrates a possible disadvantage to this policy, the potential for stronger ecosystem effects across other species. These effects were most apparent in the Nordic and Barents Seas model, where higher fishing on mackerel ultimately led to shifts in phytoplankton abundance, and subsequent effects on Epibenthos, Zooplankton, and Primary producers. The direction of these shifts varied across our simulations, but our results suggest a destabilizing effect of added fishing mortality on mackerel. Nordic and Barents Seas mackerel had maximum F (FMSY) of 0.15, compared to roughly 0.08 for hake in the simulated California Current, and this higher F led to stronger effects when fishing rates on mackerel were increased (to 1.25∗FMSY). Additionally, copepods are a higher proportion of the animal biomass in the Nordic and Barents Seas than are euphausiids in the California Current (23% versus 15% in our base Atlantis models). Overall, the Nordic and Barents Seas simulations that increased fishing when zooplankton declined suggest that frequent strong adjustments to a relatively high fishing rate on a major ecosystem component (mackerel) may lead to highly variable responses across the ecosystem, and low predictability (evidenced by performance differences among simulations that varied only in the timing of the zooplankton forcing). These results suggest that episodic or “bang-bang” harvest policies, which have some parallels to constant escapement policies (sensu Reed, 1979), may lead not only to high variability in yield and profits (Deroba and Bence, 2008), but also to high ecological variability. The difference between regions illustrates the value of having multiple models and species in our tests – a strength of this multi-region comparison.
Though this tradeoff between increased fishing (to 1.25 ∗ FMSY) versus stability in the ecosystem arose in our simulations for the Nordic and Barents Seas, overall most of the threshold rules considered here for both ecosystems had only minor effects across ecological metrics and other species guilds. We expect that this insensitivity of the simulated ecosystem is because these policies alter harvest of only single target stocks. Other applications of these Atlantis model have tested the effects of fishing on California Current forage fish (Kaplan et al., 2017) and Nordic and Barents Seas zooplankton and key fish stocks other than mackerel (Hansen et al., 2019a, b), and have found stronger effects across the food web. Nonetheless we note that spatially explicit, full ecosystem-scale models like Atlantis often have dampened predator-prey dynamics compared to non-spatial food web models. This is in part because they include prey refuges in size and space, age structure, and additional density dependent mechanisms besides prey limitation (Walters et al., 2016).
Punt et al. (2013) suggested that Atlantis ecosystem models could be applied as operating models for MSE related to the changing climate and ocean conditions, particularly due to expected future shifts in predator-prey relationships. Here we demonstrate one such application, showing that end-to-end models can be used to test ecosystem-level effects of rules that respond to shifts in target species and prey productivity in the California Current and Nordic and Barents Seas. Understanding how yields of target species vary according to other ecosystem factors is not confined to theoretical research, but is beginning to enter tactical fisheries management. Capelin (Mallotus villosus) in the Barents Sea has been managed since 1991 via a constant escapement strategy where the consumption by Northeast Arctic cod (Gadus morhua) is taken into account when setting the capelin quota (ICES, 2015). The capelin quota is therefore dependent on the abundance of cod in the region. HCRs dependent on environmental or feeding conditions are also beginning to be developed. The most recent MSE for Northeast Arctic cod (ICES, 2016a) evaluated 10 different HCRs, including fishing harder at high stock sizes to account for density dependent effects and fishing harder at high cod stock sizes under conditions of low prey (capelin) abundance. Both of these sets of rules attempt to explicitly account for food availability in the management of a high trophic level target species, and the HCR implemented in management accounts for density dependent effects. A more wide ranging approach is proposed for the Irish Sea in ICES (2018b), where it is suggested that the choice of target F for the groundfish species in the region could be allowed to vary within pre-defined precautionary FMSY-ranges (ICES, 2016a) depending on the environmental conditions in the region. Studies of the kind described here are therefore critical in providing the theoretical understanding to support this ongoing move toward more holistic fisheries management.
Caveats
The analysis presented here is a stepping stone that allows simulation testing of harvest control rules within two ecosystems, however, full MSE would include uncertainty in monitoring, stock assessment, and implementation (Punt et al., 2016a). In essence we have taken shortcuts by assuming that the tested harvest control rules have perfect knowledge, and this may have important consequences. For instance, Sethi et al. (2005) suggest that high uncertainty in stock size may argue for lower thresholds and higher exploitation rates. Implementation uncertainty may be particularly important, as annual harvest advice may often be ignored in practice (Patterson and Résimont, 2007). Embedding all sources of uncertainty in MSEs within computationally-intensive end-to-end models is challenging but technically possible (see Fulton et al., 2016; Dichmont et al., 2017). However, end-to-end models such as Atlantis can also be used to screen or winnow harvest policies before further MSE with models of simpler taxonomic and ecological resolution (e.g., MICE models, Plagányi et al., 2012; Punt et al., 2016b).
The threshold rules that we tested here assume that managers have accurate and timely surveys of prey (euphausiid or copepod) abundance. Though such surveys exist (Ohman and Smith, 1995; Peterson et al., 2014; Broms et al., 2016), it is challenging to directly link these to the drivers of productivity of target fish stocks, and ultimately to real-world fisheries management. In the context of harvest control rules for single species, other authors have pointed out the dangers of mis-identifying shifts in recruitment and their underlying mechanisms (Haltuch and Punt, 2011; Szuwalski and Punt, 2012), and the importance of timely action in relation to climate and productivity shifts (Brown et al., 2012). However, Kritzer et al. (2019) showed that a simple threshold control rule outperformed fixed fishing mortality for a range of species in the face of directional climate-induced changes in stock productivity. This suggests that simple threshold control rules may be sufficient in many cases. We intentionally chose and tested strong mechanistic links in our operating model, between target fish (Pacific hake and mackerel) and planktonic prey that they feed heavily upon. Weaker relationships between prey or environmental variables and fish production (recruitment) may be common, and problematic for use in fisheries management (De Oliveira and Butterworth, 2005). Nonetheless there is continued interest in zooplankton surveys, and interest from fishery managers in understanding these trends in the context of broader ecosystem status and productivity (Zador and Yasumiishi, 2017; Harvey et al., 2018).
The Atlantis models used here are best viewed as operating models or “testbeds,” rather than exact representations of the California Current and Nordic and Barents Seas. This is consistent with the overall strategic role of end-to-end models such as Atlantis (Fulton et al., 2011). Key assumptions include those related to predator-prey functional responses, density dependence in some species’ stock-recruit relationships, and representation of most fisheries as constant mortality rates applied uniformly in space and across all age classes. Complex end-to-end models, such as these applied here, do introduce structural uncertainty due to the explicit representation of complex ecological processes and the associated large number of parameters (Link et al., 2012). As an example of one such process, in the Nordic and Barents Seas model, the mackerel necessarily was impacted by its role (and parameterization) as a migratory species, not spending its whole life-cycle within the model domain. A separate, large omission in our work above is that social and economic aspects of fisheries and related performance metrics are not considered for either ecosystem here, but have been in other recent studies using Atlantis models (Fulton et al., 2019). Also, we note that for simplicity, zooplankton biomasses were directly forced in our tests of harvest control rules for hake and mackerel, eliminating the feedback-loop from zooplankton’s predators and prey. From other studies (e.g., Pantus, 2007; Hansen et al., 2019a), parameter perturbations at the lower trophic levels, and in particular zooplankton, potentially have a large impact on the ecosystem in the Atlantis models. Thus, our assumptions regarding zooplankton forcing affect the simulations, though we control for this by pairing each scenario (i.e., simulation of a harvest control rule) with a comparable FMSY simulation forced by the identical zooplankton time series.
Conclusion
The proposed control rules that we test here are intentionally narrow, focused on the value of including predator-prey considerations into harvest strategies for target stocks. We undertook this analysis in the same spirit as Tommasi et al. (2017) careful exploration of the value of incorporating sea surface temperature information into harvest control rules for Pacific sardine (Sardinops sagax), simulating control rules that affect fishing on a single target stock, and intentionally neglecting some aspects of uncertainty. Expanding beyond such focused control rules, Link (2005) and Fay et al. (2015) suggested broader ecosystem-level indicators (such as total pelagic biomass) and corresponding warning thresholds and limit reference points that could directly be incorporated into harvest rules. Further development and testing of such ecosystem-level considerations can be achieved with end-to-end ecosystem models, such as the Atlantis models applied here, which have the added benefit of tracking the follow-on effects of the control rule on the broader ecosystem. For the California Current and Nordic and Barents Seas, our explorations with the harvest rules tested here represent bi-directional effects: from the ecosystem to the forage-dependent harvest rule, via information about variability in zooplankton; and from the harvest rule to ecosystem, via follow-on food web effects and variable responses across lower trophic levels, particularly in the Nordic and Barents Seas model under tests of relatively high fishing rates.
Data Availability Statement
The datasets generated for this study are available on request to the corresponding author.
Author Contributions
IK, CH, HM-L, RG, and KM conceived and designed the experiments, contributed reagents, materials, and analysis tools, interpreted the results, and wrote the manuscript. IK and CH performed the experiments and analyzed the data. All authors contributed to the article and approved the submitted version.
Funding
The project was supported by the REDUS project, a NOAA Fisheries International Fellowship, the PRIME tradeoffs project, and a Microsoft AI for Earth grant.
Conflict of Interest
The authors declare that the research was conducted in the absence of any commercial or financial relationships that could be construed as a potential conflict of interest.
The reviewer AB declared a past co-authorship with one of the authors, KM, to the handling Editor.
Acknowledgments
We thank John Field (NOAA SWFSC) and Cecilie Broms (IMR) for zooplankton time series for the California Current and the Nordic and Barents Seas. Daniel Howell (IMR) and Chris Harvey, Jameal Samhouri, and the Ecosystem Science Program (NOAA NWFSC) provided feedback on early versions or drafts of this work.
Supplementary Material
The Supplementary Material for this article can be found online at: https://www.frontiersin.org/articles/10.3389/fmars.2020.00652/full#supplementary-material
Footnotes
References
Audzijonyte, A., Pethybridge, H., Porobic, J., Gorton, R., Kaplan, I., and Fulton, E. A. (2019). Atlantis : a spatially explicit end-to-end marine ecosystem model with dynamically integrated physics, ecology and socio-economic modules. Methods Ecol. Evol. 10, 1814–1819. doi: 10.1111/2041-210x.13272
Bachiller, E., Skaret, G., Nøttestad, L., and Slotte, A. (2016). Feeding ecology of northeast atlantic mackerel, norwegian spring-spawning herring and blue whiting in the Norwegian Sea. PLoS One 11:e0149238. doi: 10.1371/journal.pone.0149238
Berger, A. M., Grandin, C. J., Taylor, I. G., Edwards, A. M., and Cox, S. (2017). Status of the Pacific Hake (whiting) stock in U.S. and Canadian waters in 2017. Silver Spring, MD: National Marine Fisheries Service and Fisheries and Oceans Canada.
Bond, N. A., Cronin, M. F., Freeland, H., and Mantua, N. (2015). Causes and impacts of the 2014 warm anomaly in the NE Pacific. Geophys. Res. Lett. 42, 3414–3420. doi: 10.1002/2015gl063306
Broms, C., Strand, E., Utne, K. R., Hjøllo, S., Sundby, S., and Melle, W. (2016). Vitenskapelig Bakgrunnsmateriale for Forvaltningsplan for Raudåte. Available online at: https://imr.brage.unit.no/imr-xmlui/handle/11250/2440945 (accessed June 15, 2017).
Brown, C. J., Fulton, E. A., Possingham, H. P., and Richardson, A. J. (2012). How long can fisheries management delay action in response to ecosystem and climate change? Ecol. Appl. 22, 298–310. doi: 10.1890/11-0419.1
Carson, R. T., Granger, C., Jackson, J., and Schlenker, W. (2008). Fisheries management under cyclical population dynamics. Environ. Resour. Econ. 42, 379–410. doi: 10.1007/s10640-008-9254-4
Chavez, F. P., Ryan, J., Lluch-Cota, S. E., and Niquen, C. M. (2003). From anchovies to sardines and back: multidecadal change in the Pacific Ocean. Science 299, 217–221. doi: 10.1126/science.1075880
Checkley, D. M., and Barth, J. A. (2009). Patterns and processes in the California current system. Prog. Oceanogr. 83, 49–64. doi: 10.1016/j.pocean.2009.07.028
Cheung, W. W. L., Brodeur, R. D., Okey, T. A., and Pauly, D. (2015). Projecting future changes in distributions of pelagic fish species of Northeast Pacific shelf seas. Prog. Oceanogr. 130, 19–31. doi: 10.1016/j.pocean.2014.09.003
Cheung, W. W. L., Lam, V. W. Y., Sarmiento, J. L., Kearney, K., Watson, R., Zeller, D., et al. (2010). Large-scale redistribution of maximum fisheries catch potential in the global ocean under climate change. Glob. Chang. Biol. 16, 24–35. doi: 10.1111/j.1365-2486.2009.01995.x
Costello, C., Polasky, S., and Solow, A. (2001). Renewable resource management with environmental prediction. Can. J. Econ. 34, 196–211. doi: 10.1111/0008-4085.00070
Costello, C. J., Adams, R. M., and Polasky, S. (1998). The value of El niño forecasts in the management of salmon: a stochastic dynamic assessment. Am. J. Agric. Econ. 80, 765–777.
De Oliveira, J. A. A., and Butterworth, D. S. (2005). Limits to the use of environmental indices to reduce risk and/or increase yield in the South African anchovy fishery. Afr. J. Mar. Sci. 27, 191–203. doi: 10.2989/18142320509504078
Deroba, J. J., and Bence, J. R. (2008). A review of harvest policies: understanding relative performance of control rules. Fish. Res. 94, 210–223. doi: 10.1016/j.fishres.2008.01.003
Dichmont, C. M., Fulton, E. A., Gorton, R., Sporcic, M., Little, L. R., Punt, A. E., et al. (2017). From data rich to data-limited harvest strategies—does more data mean better management? ICES J. Mar. Sci. 74, 670–686. doi: 10.1093/icesjms/fsw199
Drinkwater, K. F. (2005). The response of Atlantic cod (Gadus morhua) to future climate change. ICES J. Mar. Sci. 62, 1327–1337. doi: 10.1016/j.icesjms.2005.05.015
Dufault, A. M., Marshall, K. N., and Kaplan, I. C. (2009). A Synthesis of Diets and Trophic Overlap of Marine Species in the California Current. U.S. Dept. Commer. NOAA Tech. Memo. NMFS-NWFSC-103. Silver Spring, MD: NOAA.
Ellingsen, I. H., Dalpadado, P., Slagstad, D., and Loeng, H. (2008). Impact of climatic change on the biological production in the Barents Sea. Clim. Change 87, 155–175. doi: 10.1007/s10584-007-9369-6
Engen, S., Lande, R., and Sæther, B.-E. (1997). Harvesting strategies for fluctuating populations based on uncertain population estimates. J. Theor. Biol. 186, 201–212. doi: 10.1006/jtbi.1996.0356
Fay, G., Link, J. S., Large, S. I., and Gamble, R. J. (2015). Management performance of ecological indicators in the Georges Bank finfish fishery. ICES J. Mar. Sci. 72, 1285–1296. doi: 10.1093/icesjms/fsu214
Fossheim, M., Primicerio, R., Johannesen, E., Ingvaldsen, R. B., Aschan, M. M., and Dolgov, A. V. (2015). Recent warming leads to a rapid borealization of fish communities in the Arctic. Nat. Clim. Change 5:673. doi: 10.1038/nclimate2647
Froese, R., Branch, T. A., Proelß, A., Quaas, M., Sainsbury, K., and Zimmermann, C. (2011). Generic harvest control rules for European fisheries. Fish Fish 12, 340–351. doi: 10.1111/j.1467-2979.2010.00387.x
Fulton, E. A., Link, J. S., Kaplan, I. C., Savina-Rolland, M., Johnson, P., Ainsworth, C., et al. (2011). Lessons in modelling and management of marine ecosystems: the Atlantis experience. Fish Fish. 12, 171–188. doi: 10.1111/j.1467-2979.2011.00412.x
Fulton, E. A., Parslow, J. S., Smith, A. D. M., and Johnson, C. R. (2004). Biogeochemical marine ecosystem models II: the effect of physiological detail on model performance. Ecol. Modell. 173, 371–406. doi: 10.1016/j.ecolmodel.2003.09.024
Fulton, E. A., Punt, A. E., Dichmont, C. M., Gorton, R., Sporcic, M., Dowling, N., et al. (2016). Developing risk equivalent data-rich and data-limited harvest strategies. Fish. Res. 183, 574–587. doi: 10.1016/j.fishres.2016.07.004
Fulton, E. A., Punt, A. E., Dichmont, C. M., Harvey, C. J., and Gorton, R. (2019). Ecosystems say good management pays off. Fish Fish. 20, 66–96. doi: 10.1111/faf.12324
Fulton, E. A., Smith, A. D. M., and Punt, A. E. (2005). Which ecological indicators can robustly detect effects of fishing? ICES J. Mar. Sci. 62, 540–551. doi: 10.1016/j.icesjms.2004.12.012
Gattuso, J.-P., Magnan, A., Billé, R., Cheung, W. W. L., Howes, E. L., Joos, F., et al. (2015). Contrasting futures for ocean and society from different anthropogenic CO2 emissions scenarios. Science 349:aac4722. doi: 10.1126/science.aac4722
Grimaldo, E., and Gjøsund, S. H. (2012). “Commercial exploitation of zooplankton in the Norwegian Sea,” in The Functioning of Ecosystems, ed. M. Ali (Rijeka: IntechOpen).
Gruber, N., Hauri, C., Lachkar, Z., Loher, D., Frölicher, T. L., and Plattner, G.-K. (2012). Rapid progression of ocean acidification in the California current system. Science 337, 220–223. doi: 10.1126/science.1216773
Haltuch, M. A., Brooks, E. N., Brodziak, J., Devine, J. A., Johnson, K. F., Klibansky, N., et al. (2019). Unraveling the recruitment problem: a review of environmentally-informed forecasting and management strategy evaluation. Fish. Res. 217, 198–216. doi: 10.1016/j.fishres.2018.12.016
Haltuch, M. A., and Punt, A. E. (2011). The promises and pitfalls of including decadal-scale climate forcing of recruitment in groundfish stock assessment. Can. J. Fish. Aquat. Sci. 68, 912–926. doi: 10.1139/f2011-030
Hansen, C., Drinkwater, K. F., Jähkel, A., Fulton, E. A., Gorton, R., and Skern-Mauritzen, M. (2019a). Sensitivity of the Norwegian and Barents Sea Atlantis end-to-end ecosystem model to parameter perturbations of key species. PLoS One 14:e0210419. doi: 10.1371/journal.pone.0210419
Hansen, C., Nash, R. D., Drinkwater, K. F., and Hjøllo, S. S. (2019b). Management scenarios under climate change–a study of the Nordic And Barents Seas. Front. Mar. Sci. 6:668. doi: 10.3389/fmars.2019.00668
Hansen, C., Skern-Mauritzen, M., van der Meeren, G., Jähkel, A., and Drinkwater, K. (2016). Set-Up of the Nordic and Barents Seas (NoBa) Atlantis Model. Report nr. 2/2016. Bergen: Institute of Marine Research.
Harvey, C. J., Garfield, N., Williams, G. D., Tolimieri, N., Schroeder, I. S., Hazen, E. L., et al. (2018). Ecosystem Status Report of the California Current for 2018: A Summary of Ecosystem Indicators Compiled by the California Current Integrated Ecosystem Assessment Team (CCIEA). Copenhagen: ICES.
ICES (2015). Report of the Benchmark Workshop on Arctic Stocks (WKARCT), 26–30 January 2015. ICES CM 2015/ACOM:31. Copenhagen: ICES.
ICES (2016a). EU Request to ICES to Provide Plausible and Updated FMSY Ranges for the Stocks of Species Inhabiting Western EU Waters. sr.2018.04. Copenhagen: ICES.
ICES (2016b). Report of the Second Workshop on Management Plan Evaluation on Northeast Arctic cod and haddock and Barents Sea capelin (WKNEAMP-2). ICES CM 2016/ACOM:47. Kirkenes: ICES.
ICES (2017). Report of the Working Group on Widely Distributed Stocks (WGWIDE), 30 August -5 September 2017. ICES CM 2017/ACOM:23. Copenhagen: ICES.
ICES (2018a). Report of the Arctic Fisheries Working Group (AFWG. ICES CM 2018/ACOM:06. Ispra: ICES.
ICES (2018b). Report of the Working Group on Multispecies Assessment Methods (WGSAM), 15–19 October 2018. ICES CM 2018/HAPISG:20. Paris: ICES.
ICES (2019). Norway Special Request for Revised 2019 Advice on Mackerel (Scomber scombrus) in subareas 1–8 and 14, and in Division 9.a (the Northeast Atlantic and adjacent waters). Report of the ICES Advisory Committee, 2019. ICES Advice 2019, sr.2019.09. Copenhagen: ICES.
Iversen, S. (2004). “Mackerel and horse mackerel,” in The Norwegian Sea Ecosystem, ed. H. Skjoldal (Trondheim: Tapir Academic Press), 289–300.
Kaplan, I. C., Koehn, L. E., Hodgson, E. E., Marshall, K. N., and Essington, T. E. (2017). Modeling food web effects of low sardine and anchovy abundance in the California Current. Ecol. Modell. 359, 1–24. doi: 10.1016/j.ecolmodel.2017.05.007
Kritzer, J. P., Costello, C., Mangin, T., and Smith, S. L. (2019). Responsive harvest control rules provide inherent resilience to adverse effects of climate change and scientific uncertainty. ICES J. Mar. Sci. 76, 1424–1435. doi: 10.1093/icesjms/fsz038
Lavaniegos, B. E., and Ohman, M. D. (2007). Coherence of long-term variations of zooplankton in two sectors of the California current system. Prog. Oceanogr. 75, 42–69. doi: 10.1016/j.pocean.2007.07.002
Leising, A. W., Schroeder, I. D., Bograd, S. J., Abell, J., Durazo, R., Gaxiola-Castro, G., et al. (2015). State of the California current 2014–15: impacts of the warm-water “Blob.”. CalCOFI Rep. 56, 31–68.
Levin, P. S., Essington, T. E., Marshall, K. N., Koehn, L. E., Anderson, L. G., Bundy, A., et al. (2018). Building effective fishery ecosystem plans. Mar. Policy 92, 48–57. doi: 10.1016/j.marpol.2018.01.019
Lillegård, M., Engen, S., Sæther, B.-E., and Toresen, R. (2005). Harvesting strategies for Norwegian spring-spawning herring. Oikos 110, 567–577. doi: 10.1111/j.0030-1299.2005.13966.x
Link, J. (2010). Ecosystem-Based Fisheries Management: Confronting Tradeoffs. Cambridge, MA: Cambridge University Press.
Link, J. S. (2005). Translating ecosystem indicators into decision criteria. ICES J. Mar. Sci. 62, 569–576. doi: 10.1016/j.icesjms.2004.12.015
Link, J. S., Ihde, T. F., Harvey, C. J., Gaichas, S. K., Field, J. C., Brodziak, J. K. T., et al. (2012). Dealing with uncertainty in ecosystem models: the paradox of use for living marine resource management. Prog. Oceanogr. 102, 102–114. doi: 10.1016/j.pocean.2012.03.008
Mace, P. M. (1994). Relationships between common biological reference points used as thresholds and targets of fisheries management strategies. Can. J. Fish. Aquat. Sci. 51, 110–122. doi: 10.1139/f94-013
Marshall, K. N., Kaplan, I. C., Hodgson, E. E., Hermann, A., Busch, D. S., McElhany, P., et al. (2017). Risks of ocean acidification in the California Current food web and fisheries: ecosystem model projections. Glob. Chang. Biol. 23, 1525–1539. doi: 10.1111/gcb.13594
Marshall, K. N., Koehn, L. E., Levin, P. S., Essington, T. E., and Jensen, O. P. (2018). Inclusion of ecosystem information in US fish stock assessments suggests progress toward ecosystem-based fisheries management. ICES J. Mar. Sci. 76, 1–9. doi: 10.1093/icesjms/fsy152
Maury, O., Campling, L., Arrizabalaga, H., Aumont, O., Bopp, L., Merino, G., et al. (2017). From shared socio-economic pathways (SSPs) to oceanic system pathways (OSPs): building policy-relevant scenarios for global oceanic ecosystems and fisheries. Glob. Environ. Change 45, 203–216. doi: 10.1016/j.gloenvcha.2017.06.007
Methratta, E. T., and Link, J. S. (2006). Evaluation of quantitative indicators for marine fish communities. Ecol. Indic. 6, 575–588. doi: 10.1016/j.ecolind.2005.08.022
NMFS (2009). Fisheries Off West Coast States; Coastal Pelagic Species Fishery; Amendment 12 to the Coastal Pelagic Species Fishery Management Plan. Silver Spring MD: National Marine Fisheries Service.
Ohman, M. D., and Smith, P. E. (1995). A comparison of zooplankton sampling methods in the CalCOFI time series. Rep. CA Coop. Ocean. Fish. Invest. 36, 153–158.
Olsen, E., Kaplan, I. C., Ainsworth, C., Fay, G., Gaichas, S., Gamble, R., et al. (2018). Ocean futures under ocean acidification, marine protection, and changing fishing pressures explored using a worldwide suite of ecosystem models. Front. Mar. Sci. 5:64. doi: 10.3389/fmars.2018.00064
Orvik, K. A., and Skagseth, Ø (2005). Heat flux variations in the eastern Norwegian Atlantic Current toward the Arctic from moored instruments, 1995-2005. Geophys. Res. Lett. 32:L14610. doi: 10.1029/2005GL023487
Pacific Fishery Management Council (2016). Pacific Coast Groundfish Fishery Management Plan For the California, Oregon and Washington Groundfish Fishery. Portland, OR: Pacific Fishery Management Council.
Pantus, F. J. (2007). Sensitivity Analysis for Complex Ecosystem Models. Ph.D. thesis, School of Physical Sciences, the University of Queensland, Australia.
Parma, A. M. (1990). Optimal harvesting of fish populations with non-stationary stock-recruit relationships. Nat. Resour. Model. 4, 39–76. doi: 10.1111/j.1939-7445.1990.tb00131.x
Patterson, K., and Résimont, M. (2007). Change and stability in landings: the responses of fisheries to scientific advice and TACs. ICES J. Mar. Sci. 64, 714–717. doi: 10.1093/icesjms/fsm036
Peterson, W. T., Fisher, J. L., Peterson, J. O., Morgan, C. A., Burke, B. J., and Fresh, K. L. (2014). Ecosystem indicators of ocean conditions inform fisheries management in the california current. Oceanography 27, 80–89. doi: 10.5670/oceanog.2014.88
Pinsky, M., and Mantua, N. (2014). Emerging adaptation approaches for climate-ready fisheries management. Oceanography 27, 146–159. doi: 10.5670/oceanog.2014.93
Pitcher, T. J., Kalikoski, D. C., Short, K., Varkey, D., and Pramod, G. (2009). An evaluation of progress in implementing ecosystem-based management of fisheries in 33 countries. Mar. Policy 33, 223–232. doi: 10.1016/j.marpol.2008.06.002
Plagányi, ÉE., Punt, A. E., Hillary, R., Morello, E. B., Thébaud, O., Hutton, T., et al. (2012). Multispecies fisheries management and conservation: tactical applications using models of intermediate complexity. Fish Fish. 15, 1–22. doi: 10.1111/j.1467-2979.2012.00488.x
Punt, A. E. (2006). The FAO precautionary approach after almost 10 years: have we progressed towards implementing simulation-tested feedback-control management systems for fisheries management? Nat. Resour. Model. 19, 441–464. doi: 10.1111/j.1939-7445.2006.tb00189.x
Punt, A. E., A’mar, T., Bond, N. A., Butterworth, D. S., de Moor, C. L., De Oliveira, J. A. A., et al. (2013). Fisheries management under climate and environmental uncertainty: control rules and performance simulation. ICES J. Mar. Sci. 71, 2208–2220. doi: 10.1093/icesjms/fst057
Punt, A. E., and Butterworth, D. S. (1995). The effects of future consumption by the Cape fur seal on catches and catch rates of the Cape hakes. 4. Modelling the biological interaction between Cape fur seals Arctocephalus pusillus pusillus and the Cape hakes Merluccius capensis and M. paradoxus. S. Afr. J. Mar. Sci. 16, 255–285. doi: 10.2989/025776195784156494
Punt, A. E., Butterworth, D. S., de Moor, C. L., De Oliveira, J. A. A., and Haddon, M. (2016a). Management strategy evaluation: best practices. Fish Fish. 17, 303–334. doi: 10.1002/9781118835531.ch5
Punt, A. E., Dorn, M. W., and Haltuch, M. A. (2008). Evaluation of threshold management strategies for groundfish off the U.S. West Coast. Fish. Res. 94, 251–266. doi: 10.1016/j.fishres.2007.12.008
Punt, A. E., MacCall, A. D., Essington, T. E., Francis, T. B., Hurtado-Ferro, F., Johnson, K. F., et al. (2016b). Exploring the implications of the harvest control rule for Pacific sardine, accounting for predator dynamics: a MICE model. Ecol. Modell. 337, 79–95. doi: 10.1016/j.ecolmodel.2016.06.004
Ralston, S., Field, J. C., and Sakuma, K. M. (2015). Long-term variation in a central California pelagic forage assemblage. J. Mar. Syst. 146, 26–37. doi: 10.1016/j.jmarsys.2014.06.013
Reed, W. J. (1979). Optimal escapement levels in stochastic and deterministic harvesting models. J. Environ. Econ. Manage. 6, 350–363. doi: 10.1016/0095-0696(79)90014-7
Ressler, P. H., Holmes, J. A., Fleischer, G. W., Thomas, R. E., and Cooke, K. C. (2007). Pacific hake, Merluccius productus, autecology: a timely review. Mar. Fish. Rev. 69, 1–24.
Rice, J. C., and Rochet, M.-J. (2005). A framework for selecting a suite of indicators for fisheries management. ICES J. Mar. Sci. 62, 516–527. doi: 10.1016/j.icesjms.2005.01.003
Sainsbury, K. (2000). Design of operational management strategies for achieving fishery ecosystem objectives. ICES J. Mar. Sci. 57, 731–741. doi: 10.1006/jmsc.2000.0737
Sakuma, K. M., Field, J. C., Mantua, N. J., Ralston, S., Marinovic, B. B., and Carrion, C. N. (2016). Anomalous epipelagic micronekton assemblage patterns in the neritic waters of the California Current in spring 2015 during a period of extreme ocean conditions. Rep. CA Coop. Ocean. Fish. Invest. 57, 163–183.
Sandø, A. B., Melsom, A., and Budgell, W. P. (2014). Downscaling IPCC control run and future scenario with focus on the Barents Sea. Ocean Dyn. 64, 927–949. doi: 10.1007/s10236-014-0731-8
Schindler, D. E., and Hilborn, R. (2015). Sustainability. Prediction, precaution, and policy under global change. Science 347, 953–954. doi: 10.1126/science.1261824
Sethi, G., Costello, C., Fisher, A., Hanemann, M., and Karp, L. (2005). Fishery management under multiple uncertainty. J. Environ. Econ. Manage. 50, 300–318. doi: 10.1016/j.jeem.2004.11.005
Shin, Y.-J., and Shannon, L. J. (2010). Using indicators for evaluating, comparing, and communicating the ecological status of exploited marine ecosystems. 1. The IndiSeas project. ICES J. Mar. Sci. 67, 686–691. doi: 10.1093/icesjms/fsp273
Skaret, G., Dalpadado, P., Hjøllo, S. S., Skogen, M. D., and Strand, E. (2014). Calanus finmarchicus abundance, production and population dynamics in the Barents Sea in a future climate. Prog. Oceanogr. 125, 26–39. doi: 10.1016/j.pocean.2014.04.008
Skern-Mauritzen, M., Ottersen, G., Handegard, N. O., Huse, G., Dingsør, G. E., Stenseth, N. C., et al. (2016). Ecosystem processes are rarely included in tactical fisheries management. Fish Fish. 17, 165–175. doi: 10.1111/faf.12111
Skjoldal, H. R., Dalpadado, P., and Dommasnes, A. (2004). “Food webs and trophic interactions,” in The Norwegian Sea Ecosystem, ed. H. R. Skjoldal (Trondheim: Tapir Academic Press), 447–506.
Spencer, P. D., and Collie, J. S. (1997). Effect of nonlinear predation rates on rebuilding the Georges Bank haddock (Melanogrammus aeglefinus) stock. Can. J. Fish. Aquat. Sci. 54, 2920–2929. doi: 10.1139/f97-197
Szuwalski, C. S., and Punt, A. E. (2012). Fisheries management for regime-based ecosystems: a management strategy evaluation for the snow crab fishery in the eastern Bering Sea. ICES J. Mar. Sci. 70, 955–967. doi: 10.1093/icesjms/fss182
Tommasi, D., Stock, C. A., Pegion, K., Vecchi, G. A., Methot, R. D., Alexander, M. A., et al. (2017). Improved management of small pelagic fisheries through seasonal climate prediction. Ecol. Appl. 27, 378–388. doi: 10.1002/eap.1458
Toresen, R., and Østvedt, O. J. (2000). Variation in abundance of Norwegian spring-spawning herring (Clupea harengus, Clupeidae) throughout the 20th century and the influence of climatic fluctuations. Fish Fish 1, 231–256. doi: 10.1046/j.1467-2979.2000.00022.x
Trenkel, V. M. (2018). How to provide scientific advice for ecosystem-based management now. Fish Fish 19, 390–398. doi: 10.1111/faf.12263
US Congress Senate Committee on Foreign Relations (2004). Agreement between the government of the United States of America and the government of Canada on Pacific hake/whiting (Treaty Doc. 108-24): Report (to accompany Treaty Doc. 108-24). US Congress Senate Committee on Foreign Relations. Washington, DC: US Congress Senate Committee on Foreign Relations.
Walters, C., Christensen, V., Fulton, B., Smith, A. D. M., and Hilborn, R. (2016). Predictions from simple predator-prey theory about impacts of harvesting forage fishes. Ecol. Modell. 337, 272–280. doi: 10.1016/j.ecolmodel.2016.07.014
Walters, C., and Parma, A. M. (1996). Fixed exploitation rate strategies for coping with effects of climate change. Can. J. Fish. Aquat. Sci. 53, 148–158. doi: 10.1139/f95-151
Weijerman, M., Fulton, E. A., and Brainard, R. E. (2016). Management strategy evaluation applied to coral reef ecosystems in support of ecosystem-based management. PLoS One 11:e0152577. doi: 10.1371/journal.pone.0152577
Wippel, B., Dufault, A. M., Marshall, K., and Kaplan, I. C. (2017). Data from: A Synthesis of Diets and Trophic Overlap of Marine Species in the California Current. Hague, NL: Data Archiving and Networked Services.
Keywords: harvest control rules, California Current, Nordic and Barents Seas, Pacific hake, Atlantic mackerel, management strategy evaluation
Citation: Kaplan IC, Hansen C, Morzaria-Luna H, Girardin R and Marshall KN (2020) Ecosystem-Based Harvest Control Rules for Norwegian and US Ecosystems. Front. Mar. Sci. 7:652. doi: 10.3389/fmars.2020.00652
Received: 03 January 2020; Accepted: 16 July 2020;
Published: 11 August 2020.
Edited by:
Johanna Jacomina Heymans, European Marine Board (EMB), BelgiumReviewed by:
Alida Bundy, Bedford Institute of Oceanography (BIO), CanadaCatherine Sarah Longo, Marine Stewardship Council (MSC), United Kingdom
Copyright © 2020 Kaplan, Hansen, Morzaria-Luna, Girardin and Marshall. This is an open-access article distributed under the terms of the Creative Commons Attribution License (CC BY). The use, distribution or reproduction in other forums is permitted, provided the original author(s) and the copyright owner(s) are credited and that the original publication in this journal is cited, in accordance with accepted academic practice. No use, distribution or reproduction is permitted which does not comply with these terms.
*Correspondence: Isaac C. Kaplan, isaac.kaplan@noaa.gov