The Seasonal Distribution of a Highly Commercial Fish Is Related to Ontogenetic Changes in Its Feeding Strategy
 Elena Lloret-Lloret1,2*
  Joan Navarro1
  Joan Giménez1,3
  Nieves López1
  Marta Albo-Puigserver1
  Maria Grazia Pennino4
  Marta Coll1
- 1Institut de Ciències del Mar, Consejo Superior de Investigaciones Científicas (ICM-CSIC), Barcelona, Spain
- 2Department of Evolutionary Biology, Ecology and Environmental Sciences, Faculty of Biology, University of Barcelona, Barcelona, Spain
- 3Marine Ecology Group, MaREI, Centre for Marine and Renewable Energy, Beaufort Building, Environmental Research Institute, University College Cork, Cork, Ireland
- 4Instituto Español de Oceanografía, Centro Oceanográfico de Vigo, Vigo, Spain
Improving the knowledge on the biology, ecology and distribution of marine resources exploited by fisheries is necessary to achieve population recovery and sustainable fisheries management. European hake (Merluccius merluccius) is one of the most important target species in the Mediterranean Sea and is largely overexploited by industrial fisheries. Here, we used two methodological approaches to further investigate the seasonal variation in the spatial distribution of European hake considering ontogenetic changes and trophic ecology in the western Mediterranean Sea. Our main aim was to explore if spatial changes in hake distribution were related to trophic behavior, in addition to key environmental factors. We employed a hierarchical Bayesian species distribution modeling approach (B-SDM), using spatial data from two oceanographic surveys conducted during winter and summer. We analyzed how the environmental variables, together with abundance and mean weight distribution of the main preys identified for European hake, affected the seasonal distribution of the species. Results revealed clear differences in the distribution of the European hake between seasons, which were indeed partially correlated to the distribution of their main preys, in addition to the environment. Stable isotope values and Bayesian isotopic mixing models (MixSIAR) revealed substantial seasonal and ontogenetic differences in trophic habits of European hake, partly matching the spatial distribution results. These findings could have implications for a future seasonal-based adaptive fisheries management, as local depletion of prey, or variation in size and condition may affect European hake presence in this area. Moreover, this study illustrates how the sequential application of methodologies provides a more holistic understanding of species seasonality, which is essential to understand the phenological processes of exploited species and their potential shifts due to environmental changes.
Introduction
Identifying and understanding the main factors that affect the spatial distribution of marine organisms is important to evaluate the current distribution patterns and predict potential impacts of human activity (Lasram et al., 2010; Morfin et al., 2012). Changes in species distributions may be driven by environmental seasonal variation, as well as by prey availability (Carney, 2005; Morfin et al., 2012). Seasonal variations of life cycle events in animals and plants characterize the seasonal phenology and long term dynamics of a species, which is one of the most sensitive indicators to environmental changes (Cormon et al., 2014; Scranton and Amarasekare, 2017).
Seasonality takes place in all marine ecosystems, but their duration and intensity varies according to the geographical area, in general terms being more evident in tropical waters than in temperate waters (Valiela, 1995). Nevertheless, at a more regional scale, the western Mediterranean Sea is characterized by having a high seasonality (Coll et al., 2010); with a marked thermocline in summer and a lack of nutrients on the surface layer versus a mixing of the water column and an upraise of nutrients to the photic layer during winter (Margalef, 1985). Variations in environmental factors drive the distribution of nutrients and primary production, in fact phytoplankton blooms in this area peak in winter-spring coinciding with the stabilization of the water column and again in autumn, when the waters start to mix again (Estrada, 1996; Salat et al., 2002). The seasonal changes in environmental and biological variables in the entire Mediterranean basin is a well-studied subject (Psarra et al., 2000; Bosc et al., 2004; Zveryaev, 2015) and some studies have also been done on the effect of seasonality at different levels of biological organization (Gaertner, 2000; De Souza et al., 2011; Puerta et al., 2016). Nevertheless, the analysis of the interplay of seasonality with higher level trophic organisms tends to be scarce and patchy. Environmental factors have shown to affect species distribution (Katsanevakis et al., 2009; Pennino et al., 2013; Navarro et al., 2015; Puerta et al., 2015) and these environmental factors also show strong intra-annual variation in the Mediterranean Sea (Salat et al., 2002), therefore it could be relevant to take seasonality into account when analyzing species spatial patterns in this basin.
Several studies have used species distribution models (SDM) (Guisan and Zimmermann, 2000) to investigate the spatial patterns of marine species and most agreed on biological, environmental and human related variables affecting species distributions in the Mediterranean Sea (Katsanevakis et al., 2009; Navarro et al., 2015). On this context, several Mediterranean commercial marine species, including the European hake (Merluccius merluccius), present seasonality on their spatial distribution (Demestre and Sánchez, 1998; Paradinas et al., 2015; Sion et al., 2019; Lloret-Lloret et al., under review). European hake is one of the most important demersal target species for commercial fisheries in the Mediterranean basin (Sánchez et al., 2007), but it is reaching overexploitation levels in numerous areas (Lleonart and Maynou, 2003; Fernandes et al., 2017) to the point that it is currently listed as Vulnerable species by the International Union for the Conservation of the Nature (IUCN)(Di Natale et al., 2011). Therefore, achieving a better understanding of spatial patterns of European hake and how they relate to seasonal processes could be of use to inform ecosystem-based management actions that result on more sustainable fisheries.
Due to the ecological and economic importance of European hake, different published studies had been focused on its spatial distribution (e.g., Demestre et al., 2000; Abella et al., 2005; Druon et al., 2015; Sion et al., 2019). These studies indicated that European hake occupies a wide bathymetric distribution range (from 20 to 1,000 meters), inhabiting the shelf and upper slope in the Mediterranean Sea (Fisher et al., 1987; Demestre et al., 2000; Orsi-Relini et al., 2002). Oceanographically, this species is mainly present in cooler bottom waters (from 9.65 to 19.23°C) (Maravelias et al., 2006). Seasonal variations in the density of European hake have been recorded in some areas of the Mediterranean Sea and the Atlantic Ocean with movements to deeper and cooler waters during summer (Fariña et al., 1997; Maravelias and Papaconstantinou, 2006; Maravelias et al., 2006; Lloret-Lloret et al. under review).
SDMs generally focus on abiotic factors, however species spatial patterns are also related to the availability and preference of prey, hence the importance of considering information on feeding strategies when analyzing the spatial distribution of a species (Navarro et al., 2016). In the case of European hake, many studies have analyzed its feeding ecology (Bozzano et al., 1997; Carpentieri et al., 2005; Cartes et al., 2009) but few have directly studied the relationship between trophic behavior and spatial distribution in the Mediterranean Sea (Johnson et al., 2012, 2013).
European hake has been described as an ambush demersal predator (Pitcher and Alheit, 1995), which also feeds on the water column performing nocturnal diel migrations, important for the juvenile individuals (Bozzano et al., 2005; Aguzzi et al., 2015). Trophic studies of this species have generally focused on immature individuals (Oliver and Massuti, 1995; Bozzano et al., 2005) except for a few number that include a wider range of sizes (Bozzano et al., 1997; Carpentieri et al., 2005; Mellon-Duval et al., 2017). Despite these studies, there is still a lack of information on the ecology of European hake, especially regarding variation of the diet with seasonality.
The study of the diet of marine fish normally relies on stomach content analyses (Hyslop, 1980). Although this technique provides quantitative diet composition, it is limited by degradation and ingestion rates, amongst other constraints (Hyslop, 1980). In addition, high levels of regurgitation have been recorded for European hake (Modica et al., 2011), which difficult the analysis of the diet based on stomach content analysis. As an alternative, the use of stable isotopes analysis and isotopic mixing models are additional techniques to examine the diet of marine predators (Davis and Pineda-Munoz, 2016). Despite the extended use of these methodologies, only a small number of studies have used them to characterize the feeding ecology of European hake in the western Mediterranean Sea [e.g., (Sinopoli et al., 2012; Fanelli et al., 2018)] and more specifically in the northwestern Mediterranean Sea [e.g., (Ferraton et al., 2007; Albo-Puigserver et al., 2016; Mellon-Duval et al., 2017; Rueda et al., 2019)].
In this study, we aimed to investigate the seasonal differences in the spatial distribution and trophic habits of European hake in a highly exploited area of the northwestern Mediterranean Sea, considering ontogenetic variations. To analyze the seasonal spatial distribution, we employed a hierarchical Bayesian species distribution modeling approach (B-SDM) and we used the mean weight values estimated from two oceanographic surveys conveyed in winter and summer 2013, as a proxy of body size (Chih-Lin et al., 2010) and consequently age class. We expected that juvenile (i.e., lower mean weight) and adult individuals (i.e., higher mean weight) will distribute differently within the same season and between seasons and these differences might be explained by feeding preferences on top of environmental variables. We included depth and sea bottom temperature (SBT) as environmental variables, in addition to potential preys’ abundance and mean weight distribution as trophic components. Furthermore, we used stable isotope values of δ13C and δ15N to determine the ontogenetic and seasonal changes in diet using Bayesian mass-balanced isotopic mixing models (MixSIAR) (Stock and Semmens, 2016) and corrected standard ellipses area (SEAc) and Bayesian standard ellipses area (SEAb) using SIBER – Stable Isotope Bayesian Ellipses in R (Jackson et al., 2011) to estimate niche width and overlap. Then, we examined if spatial differences did coincide with seasonal differences in the trophic habits and plasticity. This is to our knowledge one of the first studies to use this multidisciplinary approach to analyze the spatial and seasonal variations of European hake distribution and trophic ecology, accounting for ontogenetic changes. Specifically, we hypothesized that seasonal changes observed in European hake distribution could be partly due to prey availability, in addition to environmental variability, which could change between the juvenile and the adult stages of the population due to dissimilar trophic preferences or feeding capabilities.
Materials and Methods
Data Collection
In order to estimate biomass and abundance, European hake individuals were collected from two experimental fishing surveys conducted in winter (22 February-8 March) and summer (2–17 July) 2013 (ECOTRANS Project, Institut de Ciències del Mar - CSIC) on board of the RV Ángeles Alvariño. These surveys were conducted in the northwestern Mediterranean Sea (Figure 1) covering an extension of ∼8,000 km2, including the continental shelf and upper slope. Sampling sites were randomly distributed over the continental shelf areas and the upper slopes, with a total of 82 hauls conducted; 37 in winter and 45 in summer (Figure 1). Experimental fishing surveys were performed following EU-funded Mediterranean Trawl Survey (MEDITS) trawling protocols (see Bertrand et al., 2002) using a GO73 experimental mesh of 10 mm (stretched mesh). On board, all organisms were identified and classified to the lowest taxonomic level. In addition, the length frequency distribution (TL, in cm) and total number of individuals per haul was recorded. Biological sampling on board was done for 103 European hake’s individuals, the body length (TL, in cm) and weight (to the nearest 0.001 g) was measured and a piece of muscle tissue was taken and frozen at −20°C. Sampled individuals ranged from 7.3 to 50.2 cm in total length. We classified individuals into two size ranges (juveniles, TL < 25 cm, and mature adults, TL ≥ 25 cm; Supplementary Table 1) based on the first maturity for this area of the Mediterranean Sea (Bozzano et al., 1997; Lleonart, 2002).
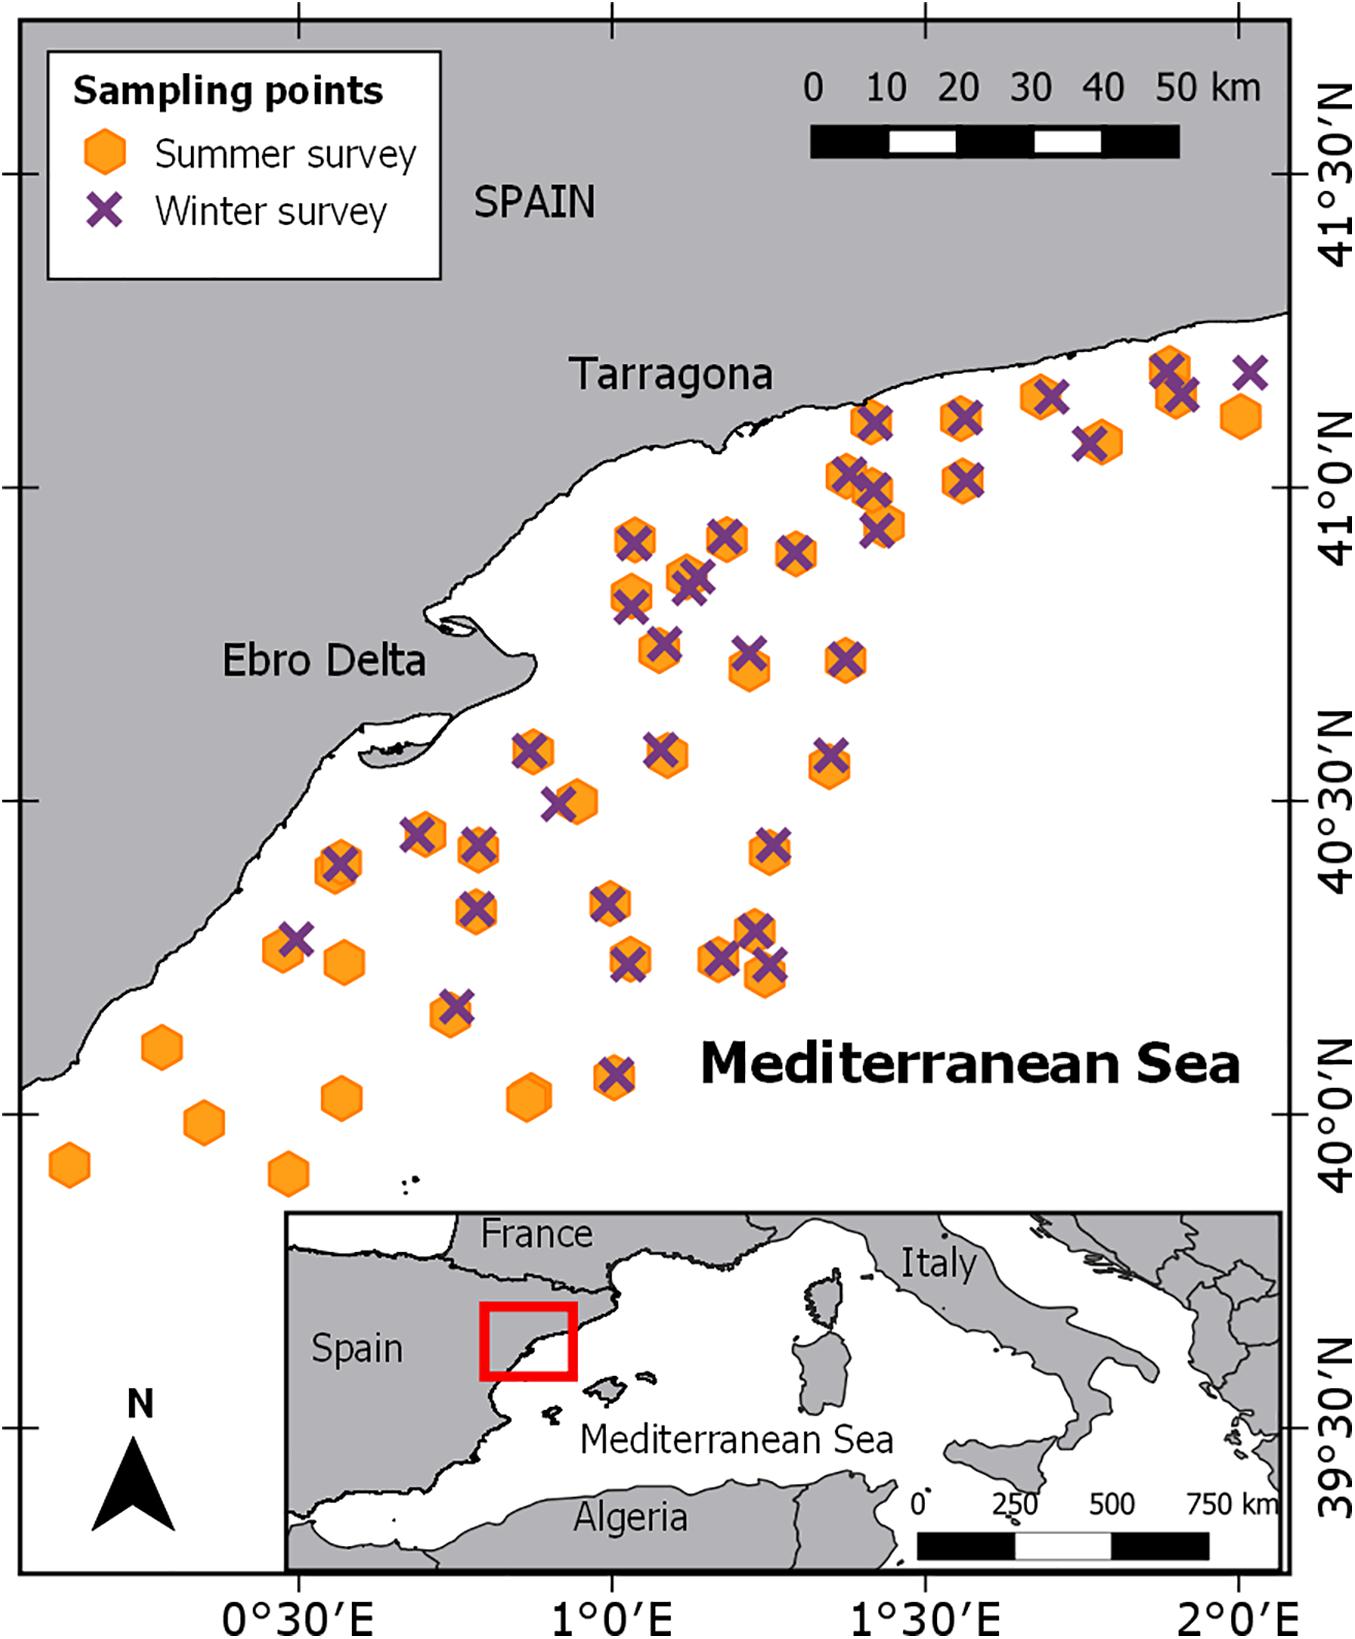
Figure 1. Study area and geographical positions of the sample sites of ECOTRANS survey for winter and summer.
Estimates of biomass (kg/km2) and abundance (n/km2) were calculated with the standard swept area method for all the species collected.
Bayesian Species Distribution Models
Explanatory and Response Variables
The biomass and abundance data for European hake was used to calculate mean weight data (kg/n) (biomass/abundance in kg/n) (Chih-Lin et al., 2010; Garofalo et al., 2018) per haul and was used as the response variable to develop the B-SDMs. As European hake weight increases with length and age, generally heavier individuals are larger and older (i.e., adults), whereas lighter individuals are smaller and younger (i.e., juveniles) (Recasens et al., 1998; Mellon-Duval et al., 2010; Soykan et al., 2015). According to the length-weight relationship for European hake for the western Mediterranean (a = 0.048, b = 3.055) (Morey et al., 2003), for an individual of 25 cm (adult), the corresponding mean weight would be around 0.0895 kg. Mean weight is used here as a proxy of body size and consequently age class (Supplementary Table 6).
Sea Bottom Temperature (SBT, in °C) and bathymetry (in meters, m) were selected as the main environmental explanatory predictors for the species distribution models. We chose these two environmental predictors based on previous studies conducted with European hake in the Mediterranean Sea (Lleonart, 2002; Maravelias et al., 2006; Katsanevakis et al., 2009; Sion et al., 2019). Bathymetry data was obtained from EMODnet bathymetry (http://portal.emodnet-bathymetry.eu/) and Sea Bottom Temperature (SBT, °C) for each haul was collected through CTDs conducted during the survey cruises (Supplementary Figure 2). QGIS software (QGIS-Development-Team, 2012) was used to generate raster maps [Inverse Distance Weighted (IDW) interpolation], at a 0.1° x 0.1°; resolution) with the interpolate SBT data collected in situ during the survey to the entire study area for both seasons (Supplementary Figure 2).
To create prey distributions variables, we first identified potential prey for European hake in the western Mediterranean Sea based on published studies (Bozzano et al., 1997, 2005; Cartes et al., 2004, 2009; Ferraton et al., 2007; Mellon-Duval et al., 2017) (Supplementary Table 2). From the prey species identified in these studies, we selected those that were also collected during our surveys. We ended up with a total of 54 potential preys’ species in winter and 38 in summer (Supplementary Table 3), aggregated in two functional categories (fish and crustaceans), for each season. For both potential prey groups, total values of biomass (kg/km2) and abundance (n/km2), as well as mean weight (biomass/abundance, in kg/n), were calculated per haul. Abundance and mean weight data for each group were plotted and interpolated [Inverse Distance Weighted (IDW) interpolation] at a 0.1 × 0.1 degree spatial resolution, for both seasons, using QGIS software (QGIS-Development-Team, 2012; Figure 2).
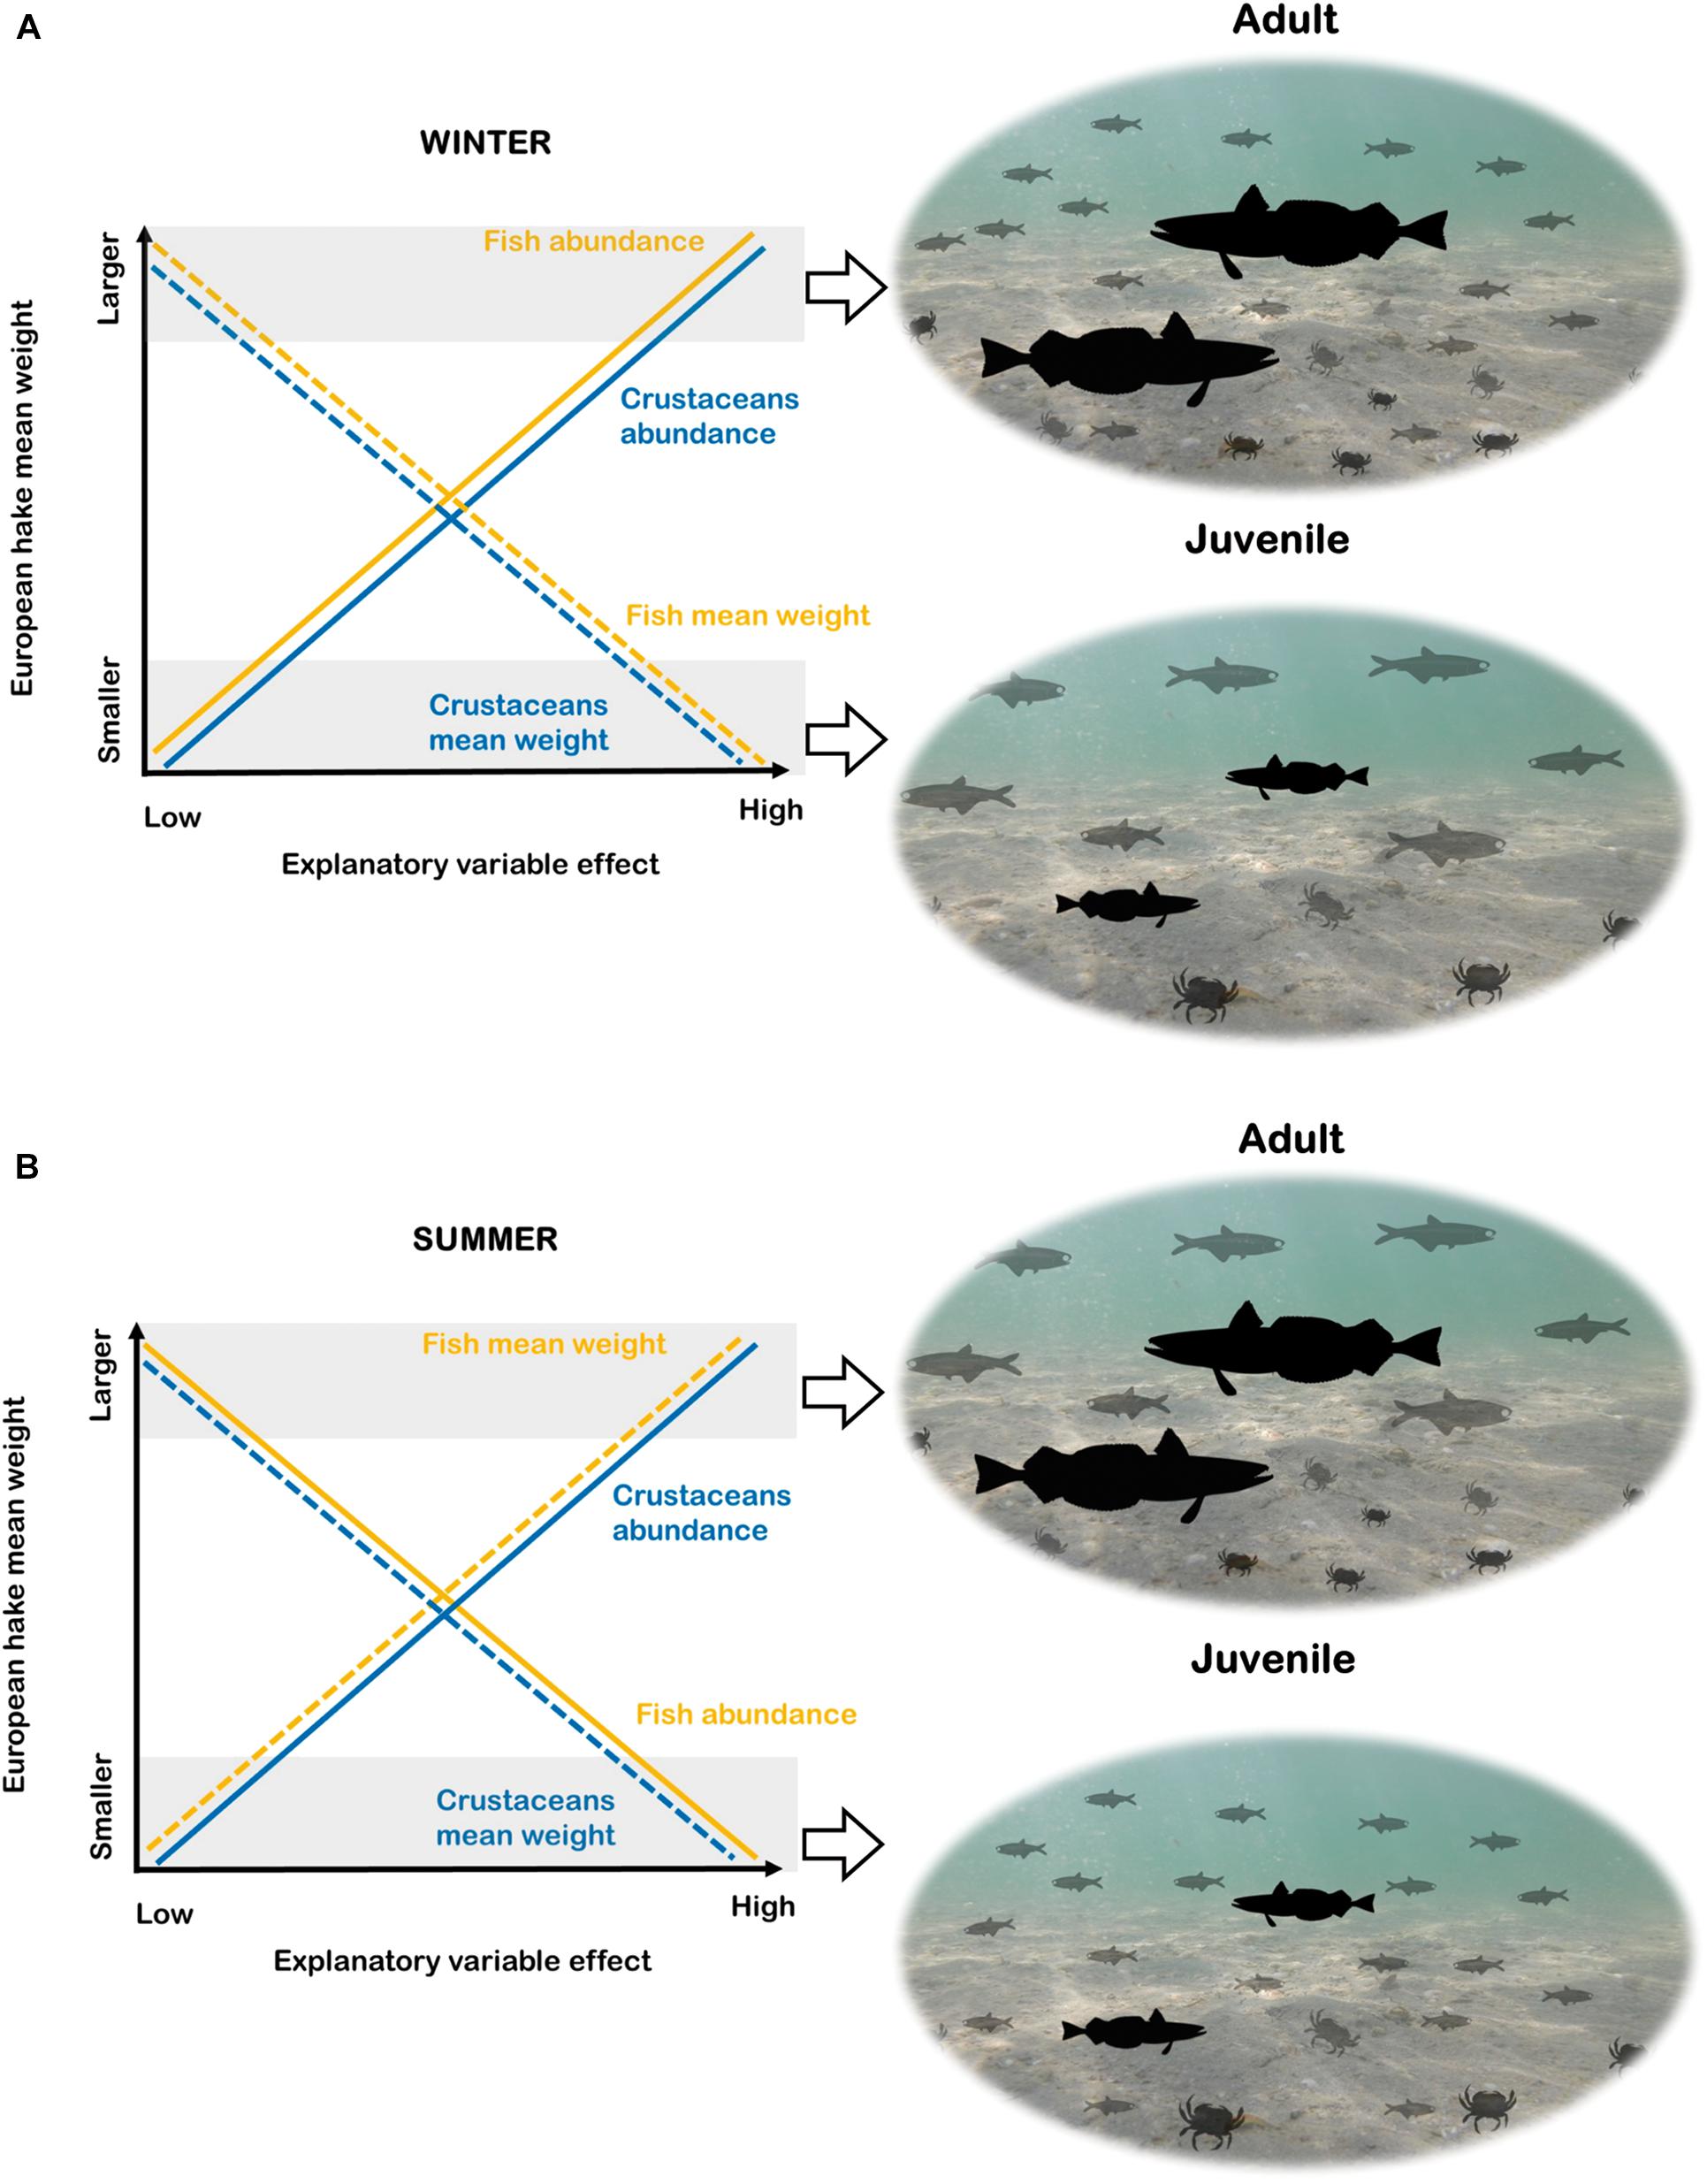
Figure 2. Graphical interpretation of the results for the species distribution models (B-SDM) in winter (A) and summer (B). The y-axis of the graphs show the response variable (European hake mean weight) and the x-axis the intensity (from lower to higher) of the explanatory variables of “Fish” and “Crustaceans.” The yellow lines represent “Fish” and the blue lines “Crustaceans”. In both cases, the straight line is used to represent the response variables related to abundance and the dotted line the response variables related to mean weight. Images from PhyloPic: European hake (“http://phylopic.org/image/8d92b454-3131-4bbd-ac9c- e1df14c2fc5a/”) this image available for reuse under the Public Domain Mark 1.0, Engraulidae (“http://phylopic.org/image/6bd3702d-3ef1-44d0-83bf-93377 875017c/”) by M. Kolmann this image available for reuse under the Public Domain Mark 1.0 and Liocarcinus depurator “http://phylopic.org/image/01dd976b- f6e9-4204-bae1-c15a32234f73/”) by Hans Hillewaert (vectorized by T. Michael Keesey) this image available for reuse under the Creative commons attribution-share Alike 3.0 Unported. “license.”
Response variables were aggregated at the same spatial resolution of 0.1 × 0.1 degrees for each season using the “raster” package (Hijmans, 2018) in the R software (R version 3.5.1.) (R Core Team, 2018). Standardized data exploration techniques were used to identify any outliers and possible correlation and collinearity between the explicative variables (Zuur et al., 2010). In particular, all the variables were checked for linearity with the draftsman’s plot, for multi-collinearity using the corvif function in R software (R version 3.5.1) (R Core Team, 2018) that assesses the Generalized Variance-Inflation Factors (GVIF) (Fox and Weisberg, 2011), and for correlation using Spearman measure with the corrplot function (Wei and Simko, 2017) in R software. A GVIF lower than 3 and a correlation lower than 0.70 were found for all the explanatory variables in winter and summer (Supplementary Figure 8) (Zuur et al., 2010; Dormann et al., 2013). Moreover, to better interpret both the direction (positive or negative) and magnitudes (effect sizes) of the parameter estimates in relation to the others, the explanatory variables were standardized, i.e., difference from the mean divided by the corresponding standard deviation (Gelman et al., 2008).
Spatial Model Fitting, Estimation, Validation and Prediction
Hierarchical Bayesian species distribution models (B-SDMs) were implemented to identify the relationships of the explanatory variables with the European hake’s mean weight and to map posterior predicted probabilities of this species in both seasons. In particular, we developed and compared four different models, two for each season, using the environmental characteristics corresponding to the season (bathymetry and SBT), and alternating the corresponding seasonal abundance and mean weight of the preys (fish and crustaceans, see Table 1).
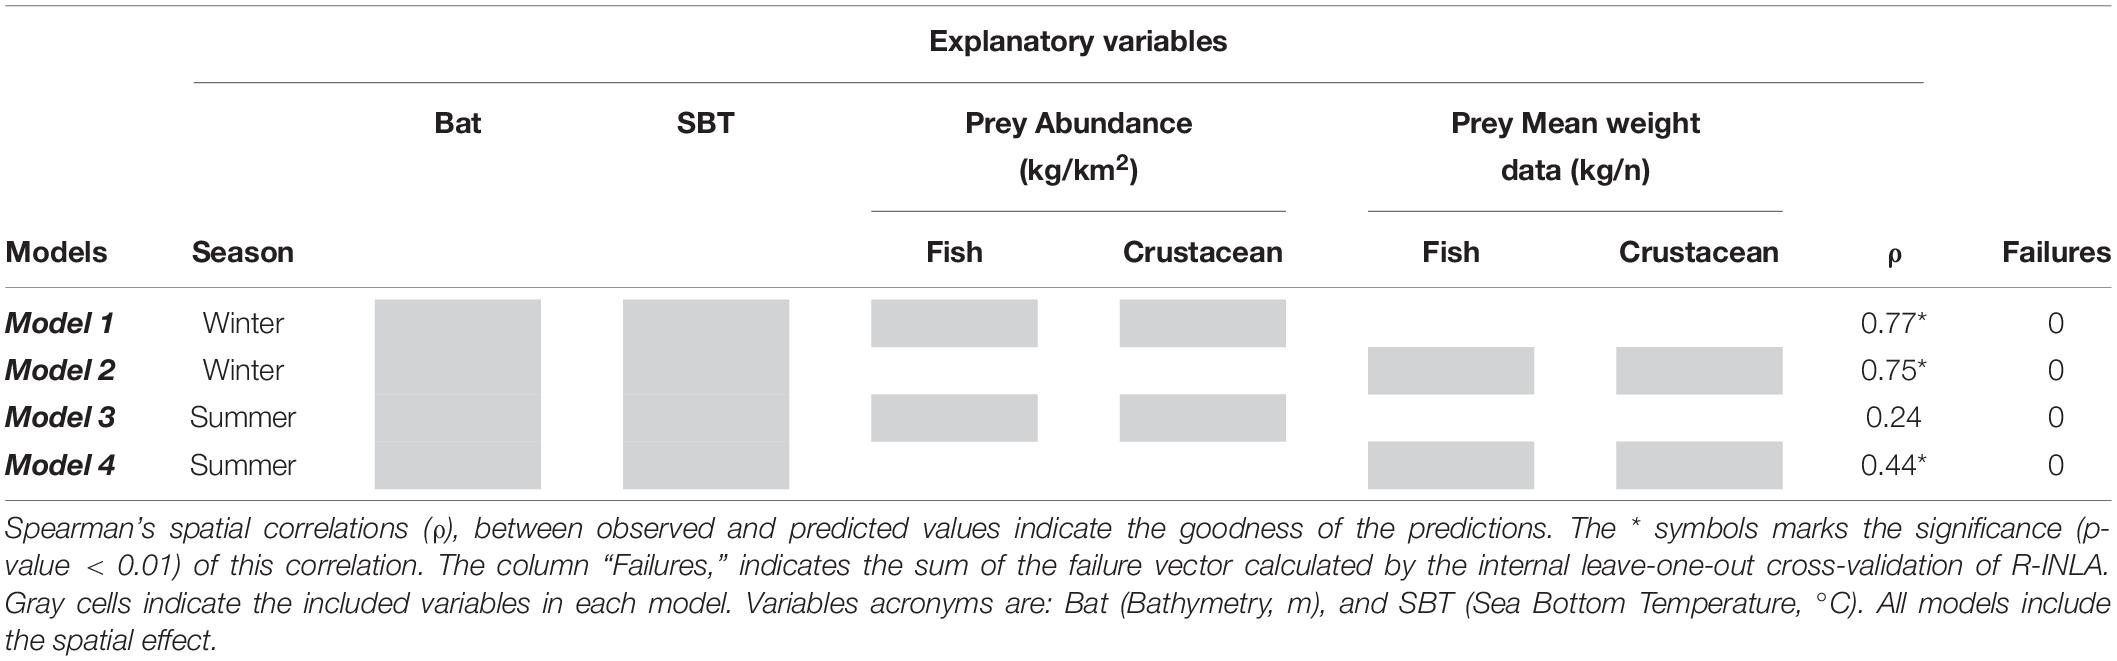
Table 1. Summary table of the four Bayesian species distribution models performed (Model 1, Model 2, Model 3, and Model 4).
Despite mean weight data could take any positive value, in this specific case the European hake’s mean weight data ranged between 0 and 1. Therefore, for each model, we used a beta distribution Yi ∼ Be (μi, Φi) for the response variable Yi at the location i. This type of beta distribution fulfils the required characteristics of this dataset while being very flexible in terms of shapes (Gupta and Nadarajah, 2004; Paradinas et al., 2016). Nevertheless, in the event that these kind of models are repeated and the mean weight values exceed 1, a beta distribution would not be suitable. In addition to the explanatory variables a spatial unstructured random effect was added to each model to account for the spatial correlation. For this spatial component, a multivariate Gaussian distribution with mean zero and a Matérn correlation matrix was assumed (Muñoz et al., 2013). For the fixed effects, we assigned a non-informative zero-mean Gaussian prior distribution with a variance of 100, as no prior information was available. B-SDMs were performed using the Integrated Nested Laplace Approximation (INLA) methodology and software1 (Rue et al., 2009). To evaluate the goodness-of-fit of each model, we used the R-INLA (Rue et al., 2009) internal cross validation procedure, which consists on a leave-one-out cross-validations that generate a failure vector ranging from 0 to 1 (values equal to 0 mean that the predictive measure is reliable while values equal to 1 indicate that the predictive measure for that particular observation is not reliable) (Blangiardo and Cameletti, 2015).
Seasonal European hake’s mean weight predictions were then generated predicting the response variable for the entire study area using linear interpolation via a Bayesian kriging (Pennino et al., 2013). To assess the fit of the predicted model, predicted and observed values were compared using using the corLocal function (Hijmans, 2018) of the R software that compute the Spearman’s spatial correlations r. As usual, values of Spearman’s correlation range from −1 to 1, being 1 equal to a perfect positive correlation between the two datasets (Spearman, 1904).
Stable Isotopes Analysis
All collected muscle hake samples were freeze-dried and powdered, and 0.28-0.33 mg of each sample was packed into tin capsules. Stable isotope analyses were performed at the Laboratorio de Isótopos Estables Estación Biológica de Doñana2. Samples, were combusted at 1020°C using a continuous flow isotope-ratio mass spectrometry system by means of a Flash HT Plus elemental analyzer coupled to a Delta-V Advantage isotope ratio mass spectrometer via a CONFLO IV interface (Thermo Fisher Scientific, Bremen, Germany). The isotopic composition was reported in the conventional delta (δ) per mil notation (‰), relative to atmospheric N2 (δ15N) and Vienna Pee Dee Belemnite (δ13C). Replicate assays of standards routinely inserted within the sampling sequence indicated analytical measurement errors of ± 0.2 and ± 0.1 for δ15N and δ13C, respectively. The standards used were: EBD-23 (cow horn, internal standard), LIE-BB (whale baleen, internal standard) and LIE-PA (razorbill feathers, internal standard). These laboratory standards were previously calibrated with international standards supplied by the International Atomic Energy Agency (IAEA, Vienna). Because all samples showed a C:N ratio lower than 3.5‰ we did not correct the δ13C values to account for the presence of lipids in muscle samples (Logan and Lutcavage, 2008).
The values of δ15N and δ13C were used to calculate corrected standard ellipses area (SEAc, area containing 40% of the data) and Bayesian standard ellipses area (SEAb) as a measure of trophic width, using “SIBER” – Stable Isotope Bayesian Ellipses in R (Jackson et al., 2011). These metrics allowed comparing the degree of niche width and overlap between seasons (winter vs. summer) and between life stages (adults vs juveniles) (Table 3). Differences on δ15N and δ13C values between hake ontogenetic groups (adults vs juveniles) and seasons (winter vs summer) were tested using a 2-way semiparametric permutation multivariate analyses (PERMANOVA tests) and pairwise tests on the Euclidian distance matrix with the software PRIMER-E 6 with PERMANOVA (Anderson et al., 2008); the latter only performed in the case of significance results (p < 0.05) for the interaction of both factors (season∗stage).
To assess the relative contribution of different preys in the diet of juveniles and adults of European hake in winter and summer, we used the mass-balanced Bayesian stable isotope mixing model MixSIAR (Stock et al., 2018). Bayesian isotopic mixing models incorporate uncertainty in the consumers, sources and diet-to-tissue discrimination factors and are capable of producing robust estimates on complex dietary systems (Parnell et al., 2010), as it is the case of this generalist predator. Prey items included in the MixSIAR models were selected based on the diet published information from stomach content analysis (Supplementary Tables 2, 4). Only those species/groups representing > 5% of the stomach content in percentage of weight (%W) or index of relative importance (%IRI) were included in the MixSIAR models. Potential prey species were 21 (Supplementary Table 4). Stable isotope values from these identified prey species were taken from an isotopic database containing demersal and pelagic species collected during the same oceanographic survey as hake (ECOTRANS Project Isolibrary) and published literature (Madurell et al., 2008; Fanelli et al., 2009; Valls et al., 2014; Barría et al., 2015, 2018; Table 6). In order to reduce the end-members of the mixing model a priori cluster analysis was performed. Potential preys were grouped in 5 different clusters based in their isotopic similarities after applied Ward’s hierarchical cluster analysis. Some clusters are exclusively formed of crustaceans’ species; as it is the case of cluster 2, 3, and 4, whereas cluster 1 is exclusively formed of fish species. On the other hand, cluster 5 consists on a mixture of fish and crustaceans’ species. (Cluster 1: Cepola macrophthalma, Boops boops, Spicara maena, Spicara smaris, Argentina sphyraena, Trisopterus minutus, Lepidopus caudatus, Sardina pilchardus, Maurolicus muelleri, Gadiculus argenteus, and Micromesistius poutassou; Cluster 2: Chlorotocus crassicornis, Nematoscelis megalops, and Phronima sedentaria; Cluster 3: Vibilia armata; in violet, Cluster 4: Anchialina agilis and Meganyctiphanes norvegica and Cluster 5: Engraulis encrasicolus, Plesionika heterocarpus, Sardinella aurita, and Solenocera membranacea, Figure 5 and Supplementary Figure 3). These five prey groups were likely to explain the isotopic signature of all the consumers as they all fell within the 95% probabilities of the mixing region (see Supplementary Figure 4), verifying that the fitted model could correctly calculate the source contribution for all the consumers (Smith et al., 2013).
Five MixSIAR models were constructed (Supplementary Table 5) using season and stage as categorical variables, as well as total length as continuous variable. The continuous variable was included as the linear regression between the isotopic values of δ15N and δ13C and individual’s total length (TL, in cm) was found to be significant (Supplementary Figure 5). Model selection was based on the deviance information criterion (DIC) and on the relative support for each model (Leave-one-out cross validation (LOO) and Akaike weights) using compare_models function of the “MixSIAR” packages in R software (Supplementary Table 5). When running the models, a diet-to-tissue discrimination factors (DTDF) of Δ13C = −0.25 δ13C − 3.48 and Δ15N = −0.28 δ15N + 5.88 was used (Caut et al., 2009). Convergence was assessed using the Geweke-test and Gelman-Rubin diagnostics. MixSIAR models were run on the “extreme” setting (with 3 Markov chains Monte Carlo (MCMC), 3,000,000 iterations, a burn-in-phase of 1,500,000 and a thinning of 100). Residual and process error were included in the models, except for when total length is a covariate, in which cases, following recommendations (Stock et al., 2018), process error was not included.
Results
Spatial Explanatory Variables
According to the winter models (Model 1 and Model 2) there was a positive relationship of fish and crustaceans’ abundance with European hake mean weight and negative relationship with fish and crustaceans’ mean weight (Tables 1, 2, Figure 2). This means that adults of European hake (areas with higher mean weight) were related to higher abundances of small-size (low mean weight) fish and crustaceans (Figure 2). The opposite occurred for low values of the response variable (areas with lower mean weight, thus more presence of juveniles) that were related to lower abundances of large-size (high mean weight) fish and crustaceans (Figure 2). On the other hand, in summer (Model 3 and Model 4), high values of the response variables (high mean weight, more presence of adults) were related to higher abundances of small-size (low mean weight) crustaceans and with lower abundance of large-size (high mean weight) fish. Again, the opposite occurred for low values of the response variable (areas with more presence of juveniles) that were related to higher abundances of small-size (low mean weight) fish and lower abundances of large-size (high mean weight) crustaceans (Figure 2). Related to the environmental variables, overall SBT had a negative relationship with the response variable, meaning that the larger mean weight individuals (adults) prefer lower SBT and thus, colder temperatures (Table 2 and Supplementary Figure 6). According to previous results, overall bathymetry has a positive relationship with the European hake’s mean weight on the continental shelf, meaning that larger mean weight individuals (adults) tend to prefer deeper waters (Table 2 and Supplementary Figure 6).
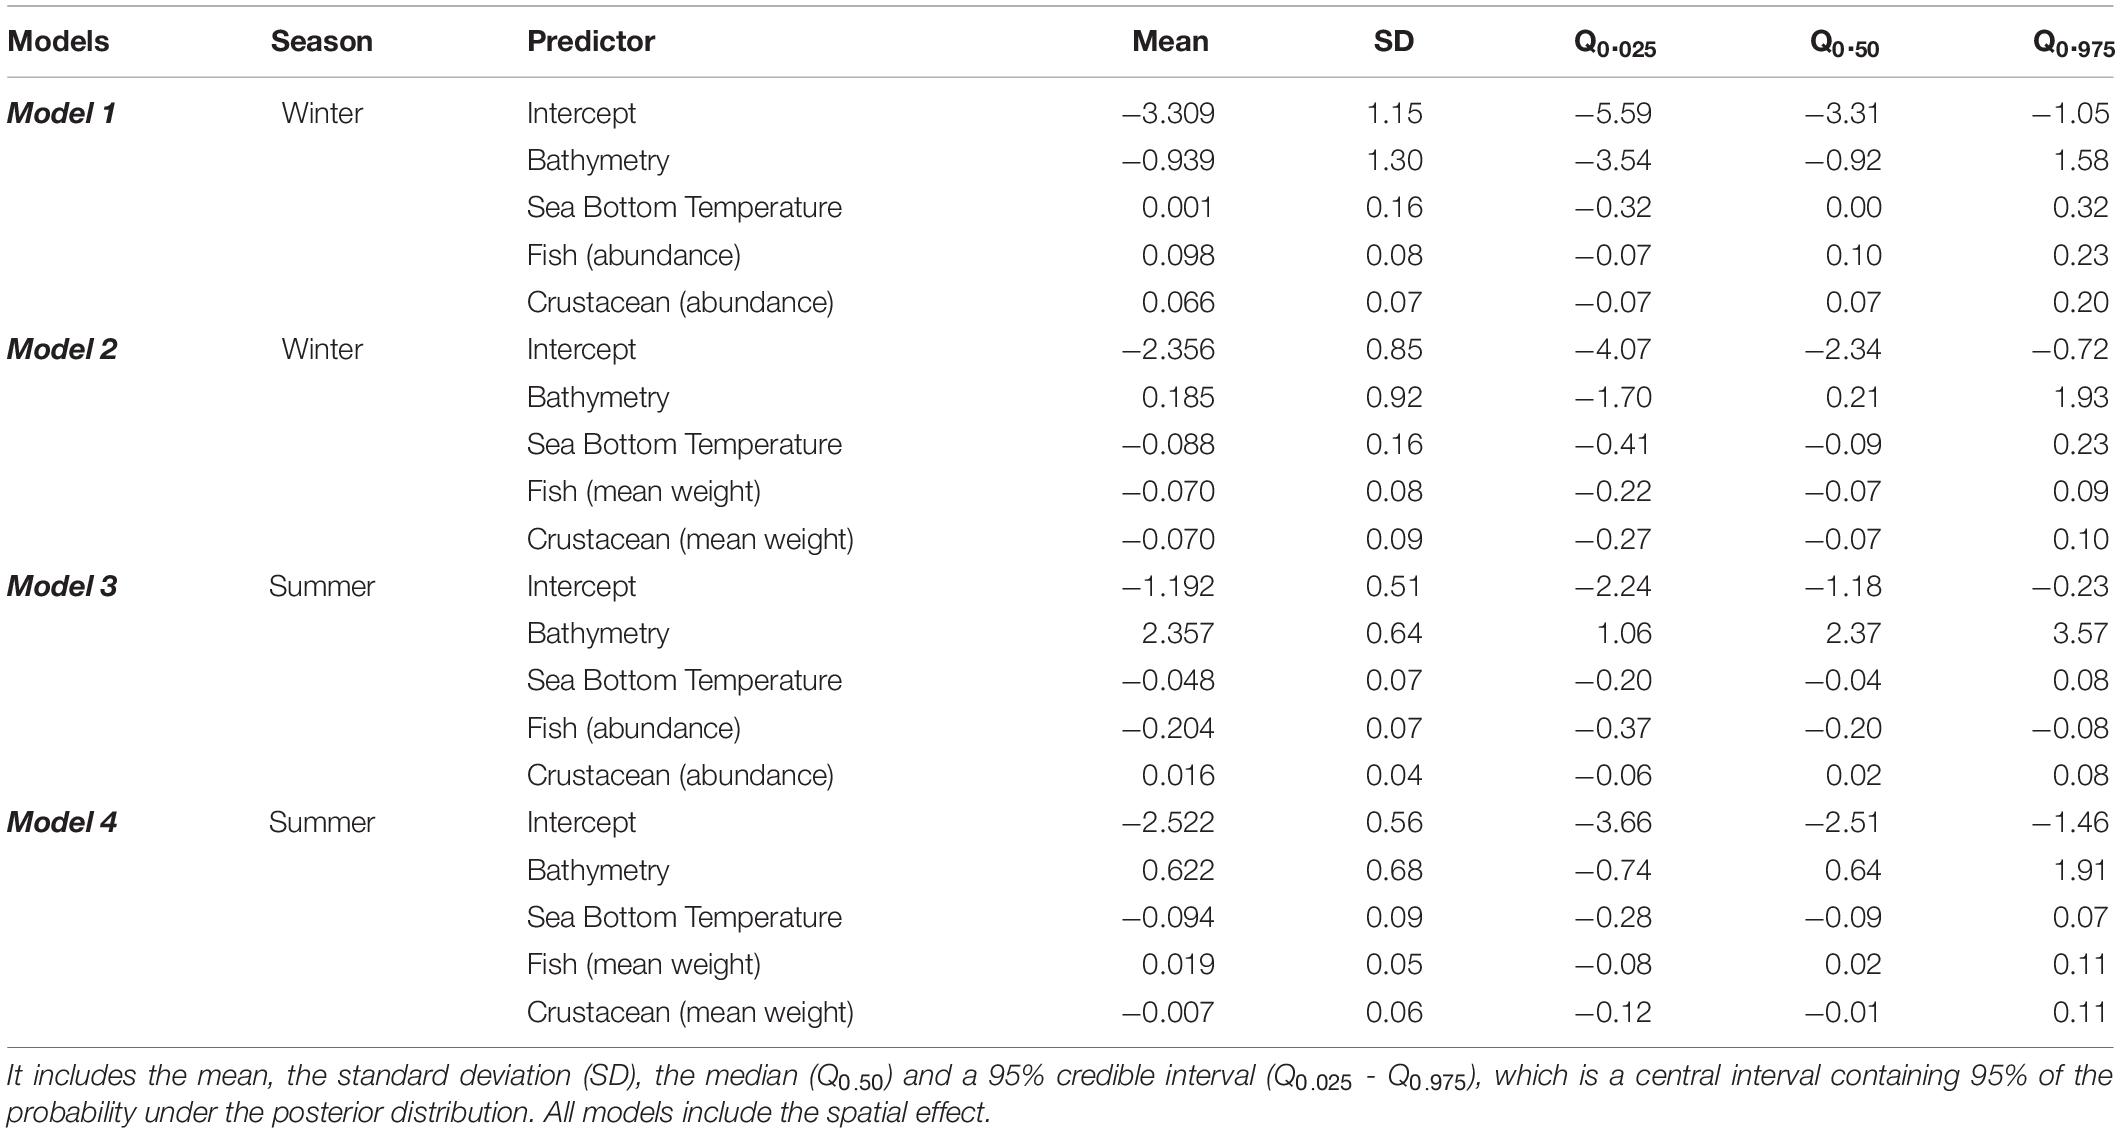
Table 2. Summary of the posterior distribution for the four models (Model 1, Model 2, Model 3, and Model 4).
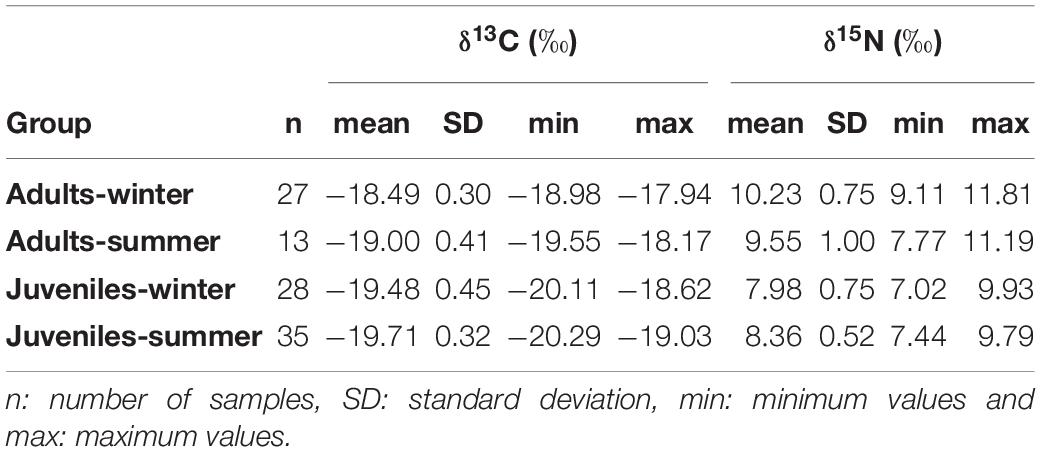
Table 3. Summary table of δ13C and δ15N stable isotopes values of European hake for each age and season.
European Hake’s Spatial Distributions
The “failure vector” showed extremely low values in all cases (<0.1), proving a good goodness of fit of the models (Table 1). Furthermore, Spearman’s correlation between the predicted and observed mean weight also showed significant correlations in three of the four models (Table 1). The predicted posterior mean weight distribution of European hake showed spatial differences between winter and summer (Figure 3). In winter, higher mean weight areas were predicted on the southern of the Ebro Delta, close to the coast; whereas in summer, higher mean weight were predicted in all the northern part of the study area, showing respectively clustering areas southern to the Ebro Delta and northern of Tarragona (Figures 1, 3). Both winter models (Model 1 and Model 2) predict very similar posterior spatial distribution patterns and same occurred for both summer models (Model 3 and Model 4). The only distinguishable difference for models using fish and crustacean’s abundance (Model 2 and Model 4) being that the predicted areas of high mean weight are subtly more confined and concentrated (Figures 3B–D).
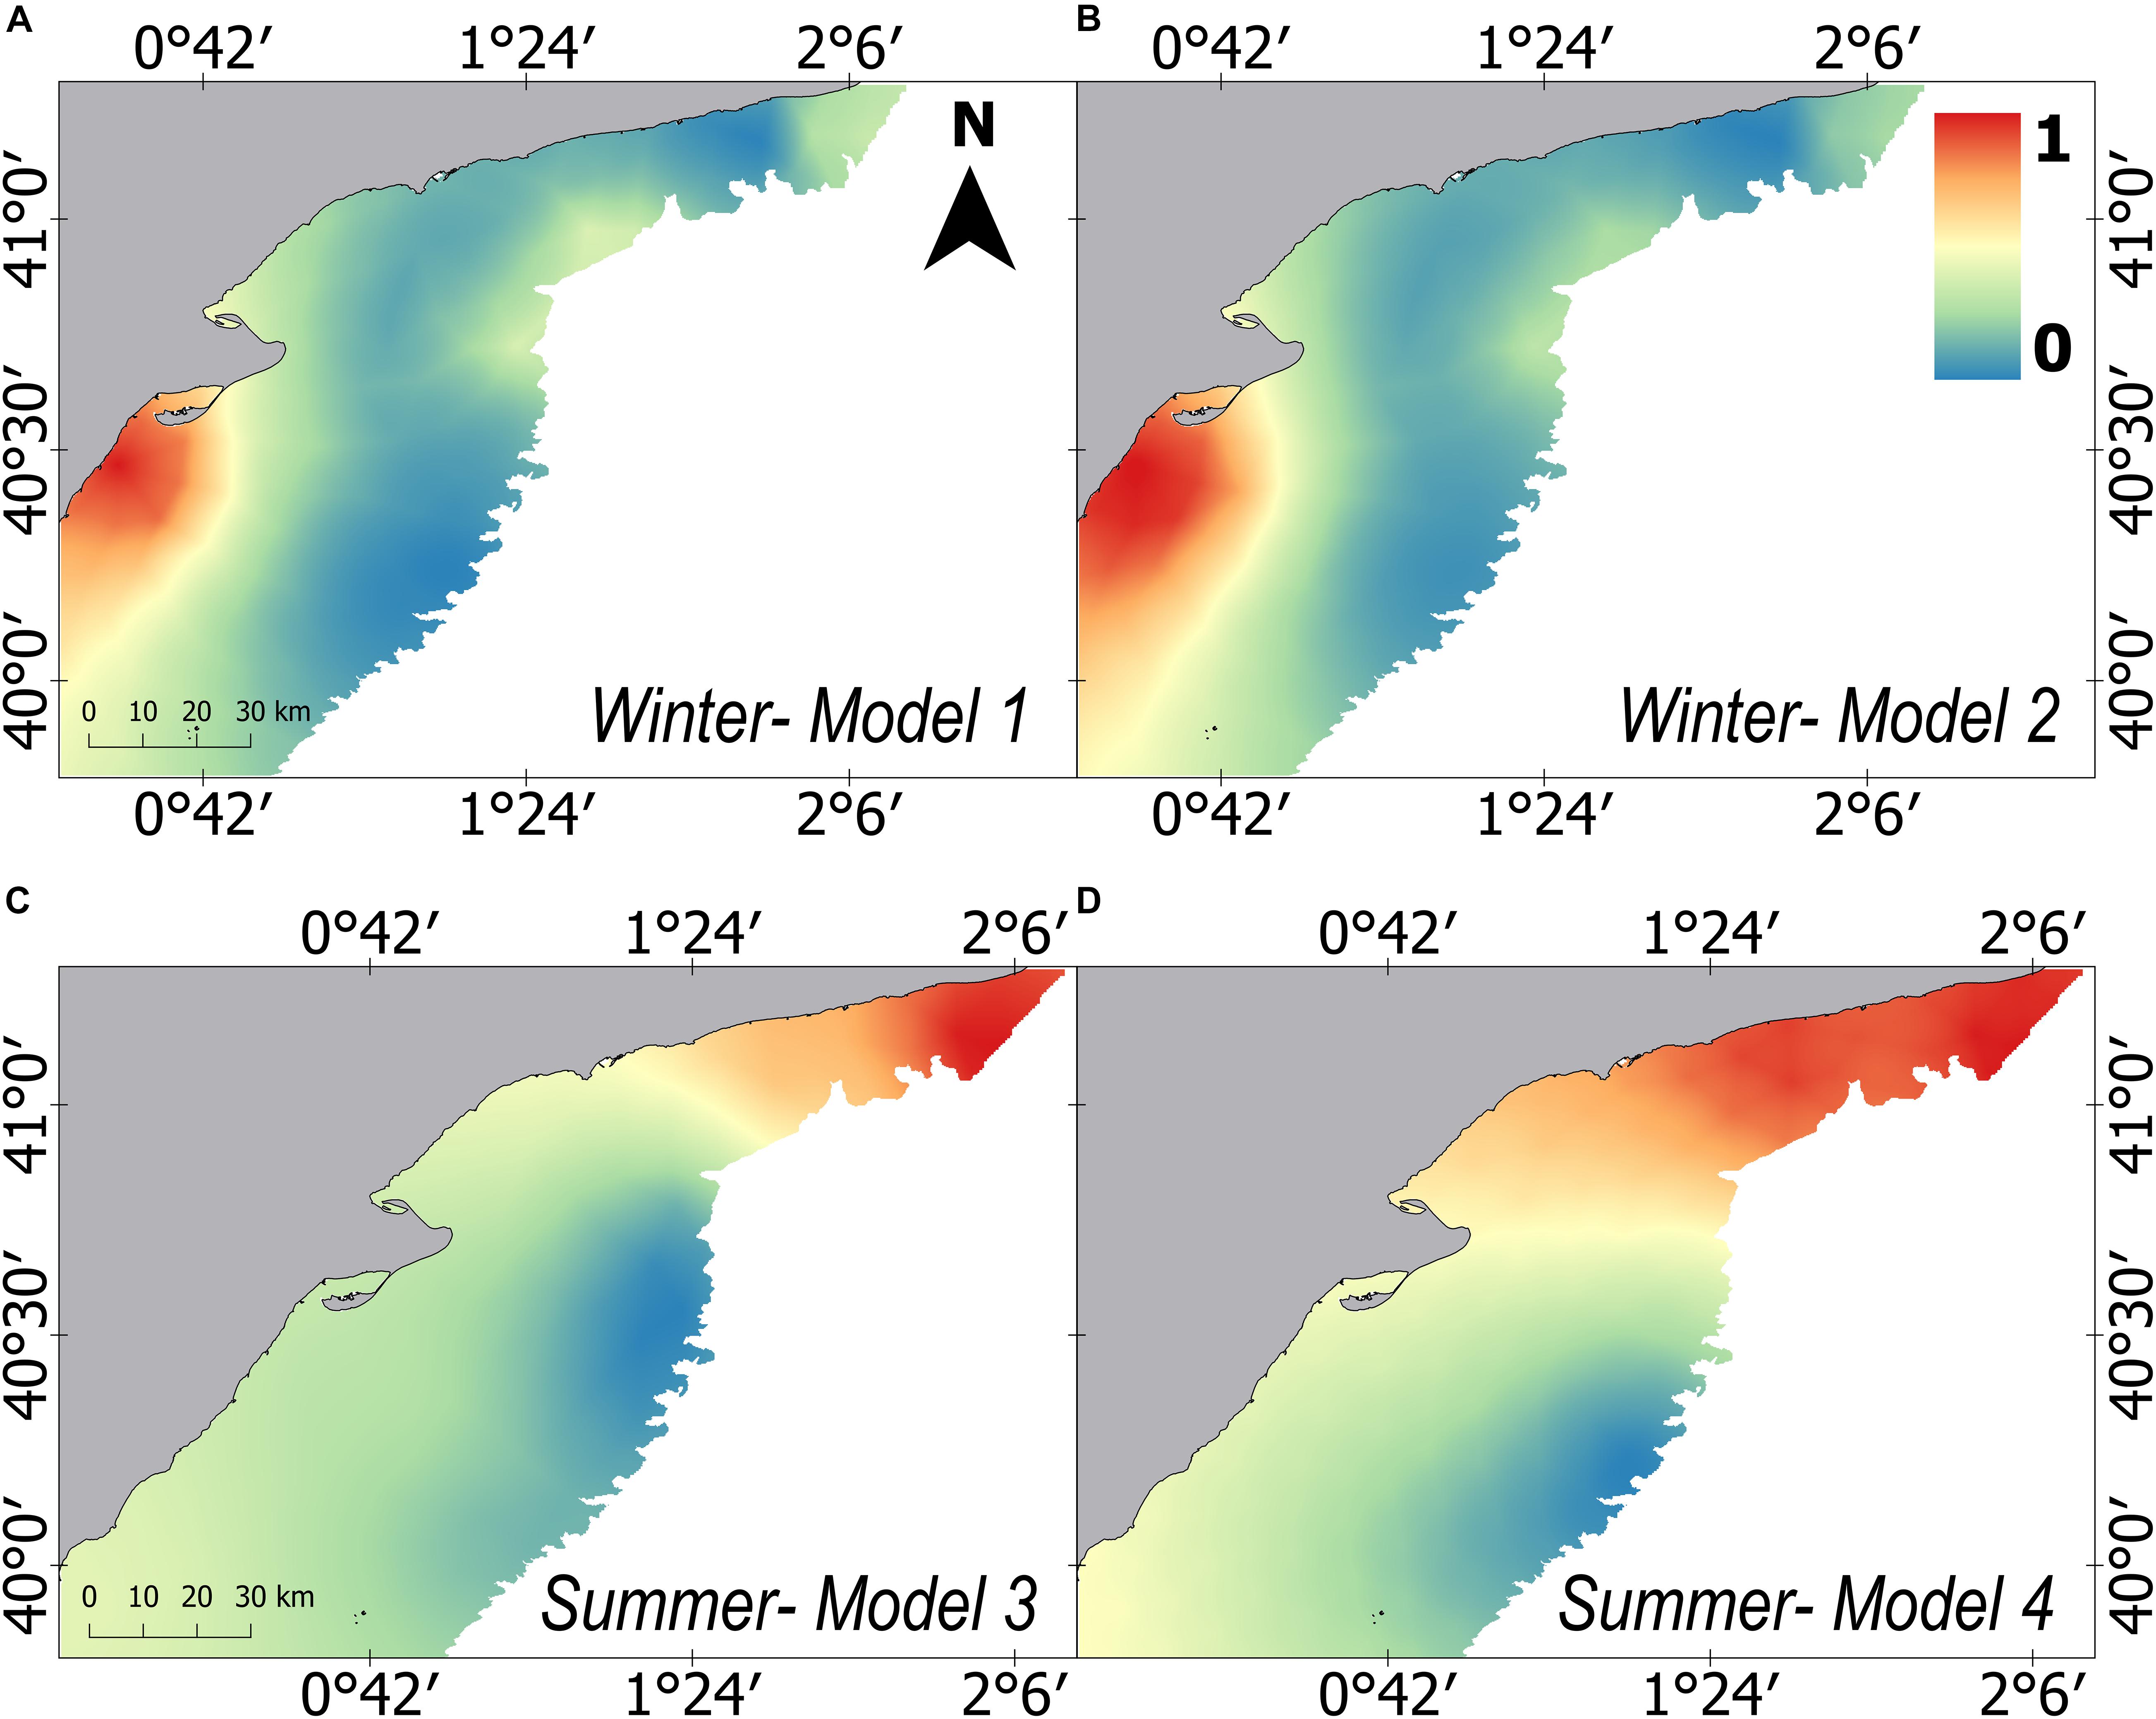
Figure 3. Predicted distribution of the posterior mean of the relative mean weight (kg/n) for European hake in winter (A,B) and summer (C,D) for each one of the four models developed. Model 1 and Model 3 consider prey explanatory variables on abundance measure, whereas Model 2 and Model 4 include prey explanatory variables on mean weight measure. All results have been standardized and share a common scale ranging from 0 to 1.
Stable Isotopes Results
δ13C values of European hake ranged from −20.29 ‰ to −17.94 ‰, and from 7.44 ‰ to 11.81 ‰ in the case of δ15N values (Table 3). Significant differences were found for δ13C between life stages (pseudo-F = 119.82, p < 0.001) and season (pseudo-F = 22.72, p < 0.001) but not for the interaction between season and stage (pseudo-F = 3.01, p = 0.08). For δ15N values, we only found differences between stages (pseudo-F = 129.21, p-value < 0.001) and for the interaction between season and stage (pseudo-F = 12.32, p-value < 0.001). Pairwise analysis showed differences between juveniles and adults for summer (p-value < 0.001) and winter (p-value < 0.001). Differences were also observed in the case of juveniles and adults between winter and summer (p-values < 0.05) (Tables 4, 5 and Figure 4). Regarding the isotopic niche, the group of juveniles-summer presented the smallest standard ellipses area (SEAB), followed by adults-winter, juveniles-winter and finally, adults-summer (Figure 4 and Table 4).
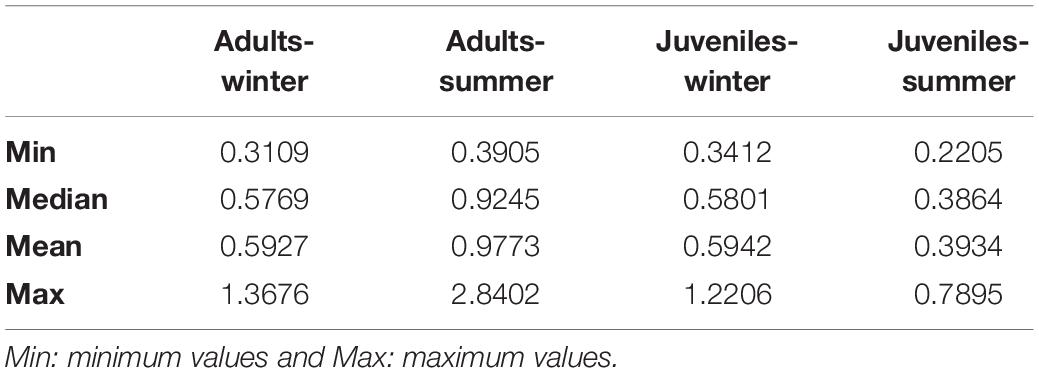
Table 4. Bayesian Standard Ellipses Area (SEAB) values for each life stage (Adult-Juvenile) and each season (winter-summer).
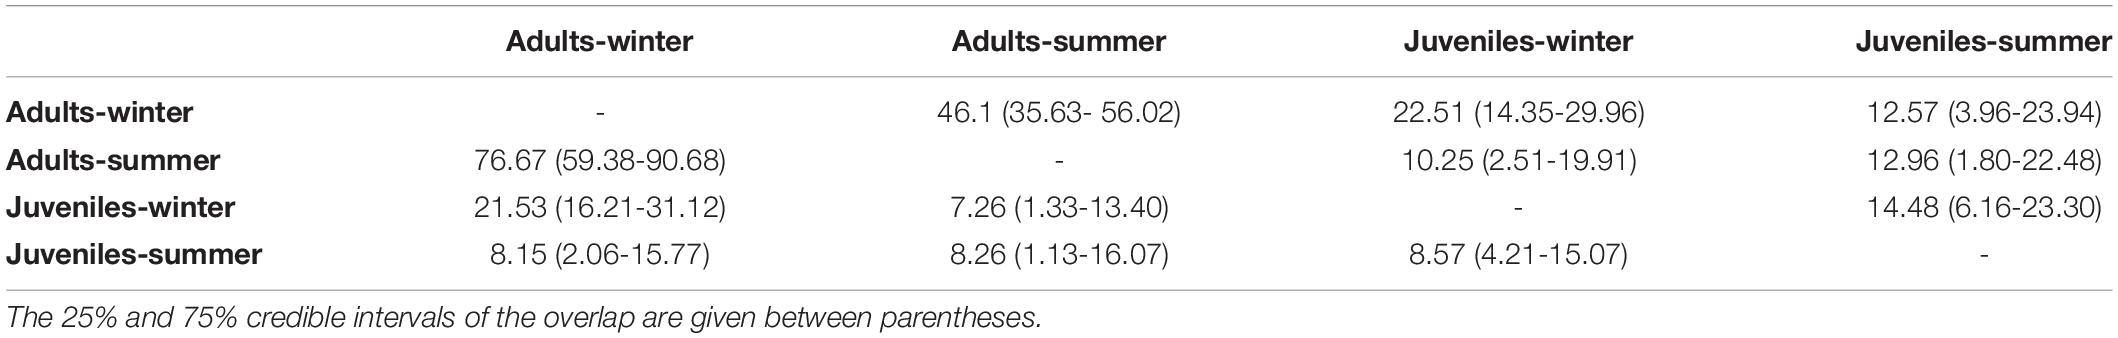
Table 5. Percentage of Bayesian Standard Ellipses Area (SEAB) overlap between European hake adults and juveniles for summer and winter.
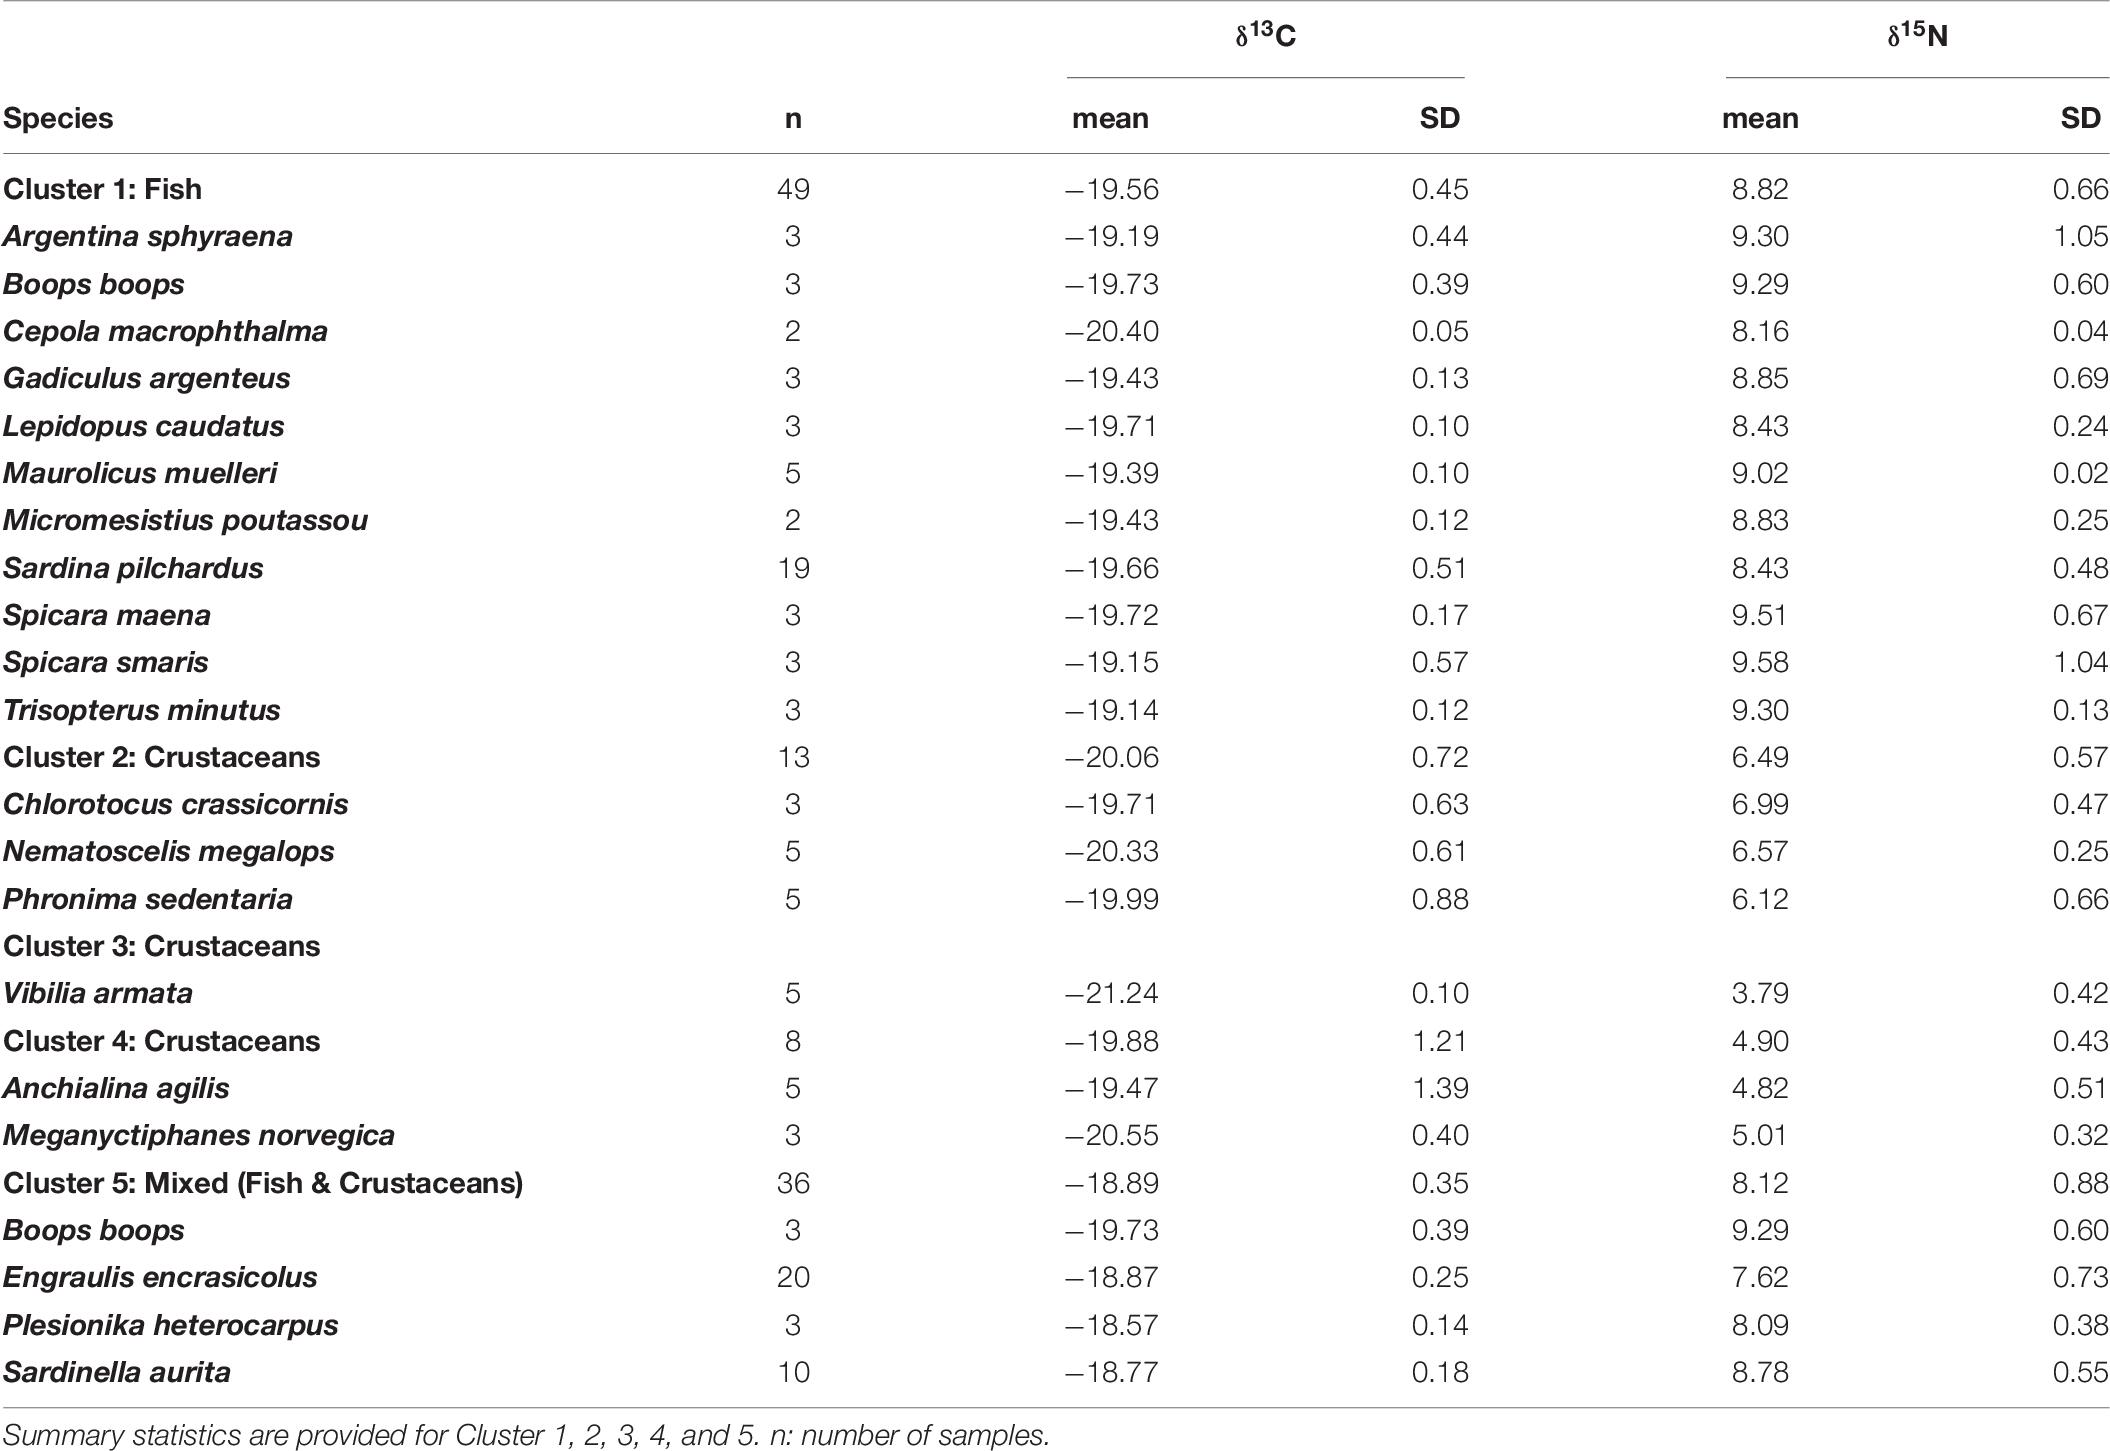
Table 6. Number of samples, mean, standard deviation (SD) of δ13C and δ15N values of the prey used in the Bayesian mixing models to estimate the diet of European hake.
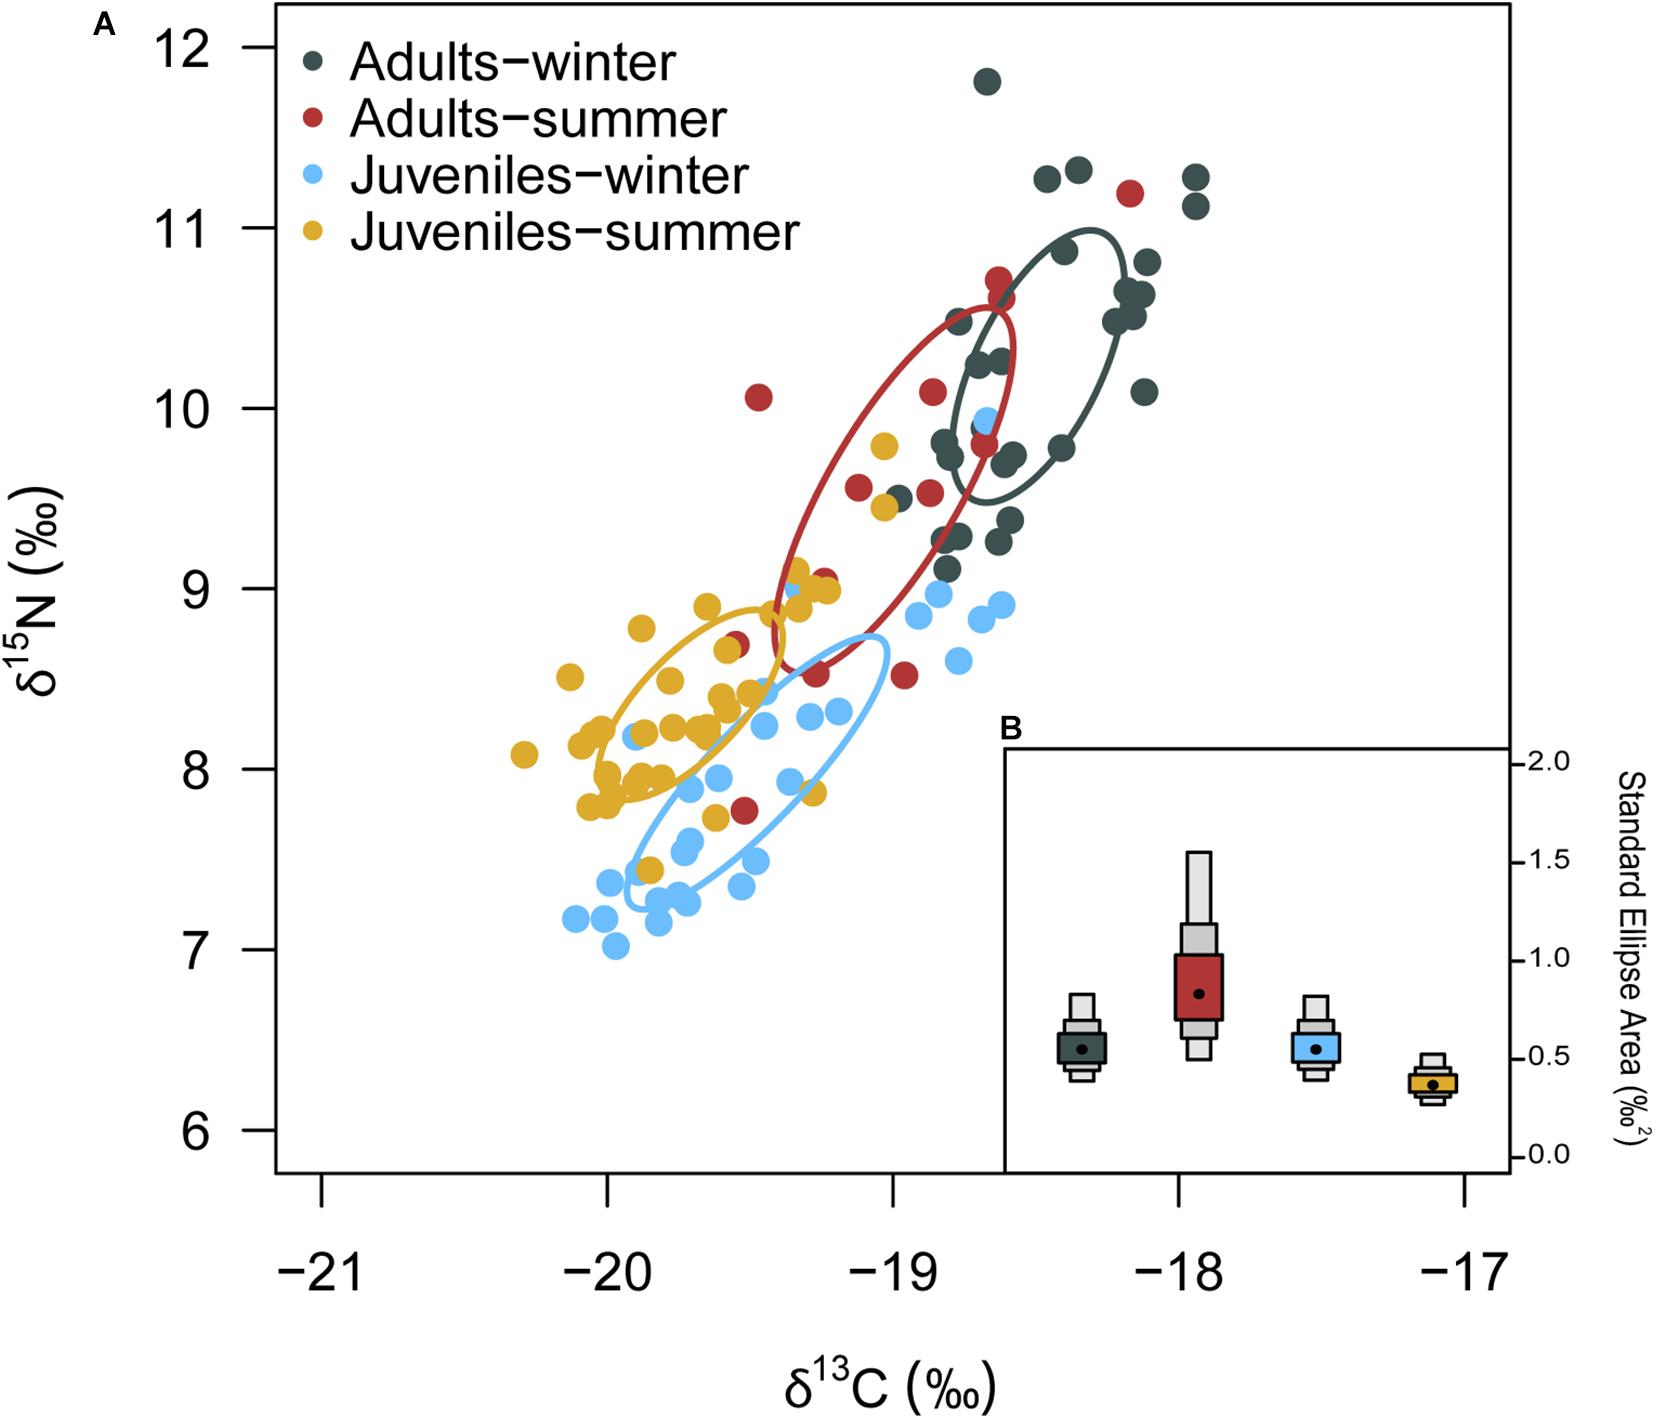
Figure 4. (A) δ13C and δ15N values and corrected Standard Ellipses Area (SEAc) for European hake by season and stage. (B) Bayesian standard ellipses area (SEAB) for each groups. Density plots represent the 95, 75 and 50% credibility intervals of SEAB.
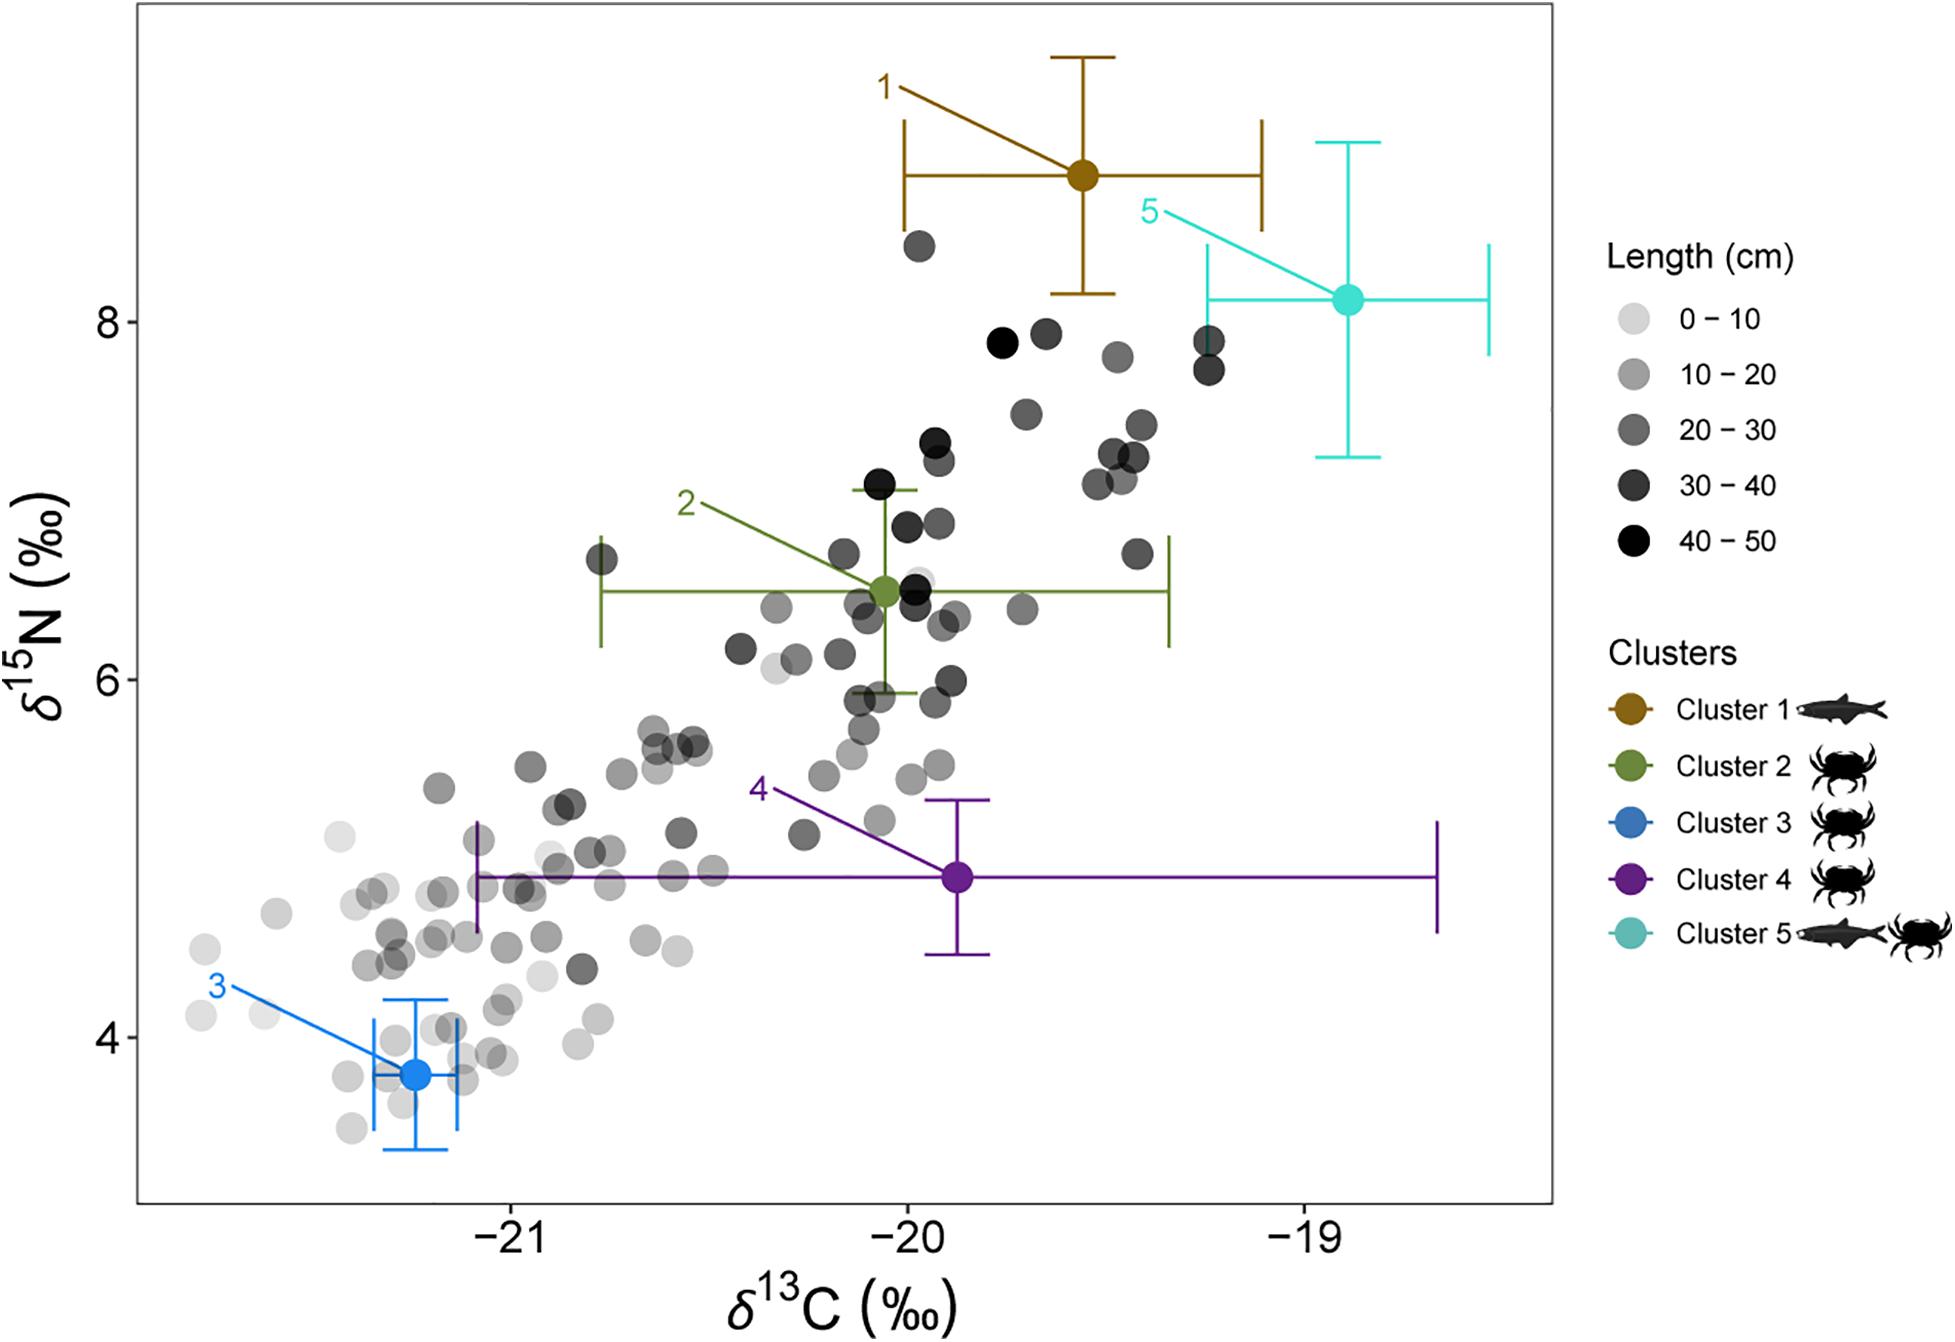
Figure 5. Individual European hake δ13C and δ15N values and mean and standard deviation δ13C and δ15N values of the potential prey sources. Black shaded scale of European hake represents the body length of the individuals. In brown, Cluster 1: Cepola macrophthalma, Boops boops, Spicara maena, Spicara smaris, Argentina sphyraena, Trisopterus minutus, Lepidopus caudatus, Sardina pilchardus, Maurolicus muelleri, Gadiculus argenteus and Micromesistius poutassou; in green, Cluster 2: Chlorotocus crassicornis, Nematoscelis megalops and Phronima sedentaria; in blue, Cluster 3: Vibilia armata; in violet, Cluster 4: Anchialina agilis and Meganyctiphanes norvegica and in aquamarine, Cluster 5: Engraulis encrasicolus, Plesionika heterocarpus, Sardinella aurita and Solenocera membranacea.
The best MixSIAR model was the one that included fish length as a continuous variable and season as a factor (Supplementary Table 5). Outputs indicated that the relative importance of the different prey groups in the diet of European hake changed with season and fish length (cm) (Figure 6). In winter, the smallest European hakes consumed mainly the prey included in Cluster 3, followed by Cluster 4 and Cluster 5. As we moved to larger sizes, there was a sharp decrease in Cluster 3 and an increase in Cluster 2. Moreover, Cluster 4 also decreased with size, representing almost 0% of the diet proportion for the largest individuals. The opposite occurred for Cluster 2, which was absent in the diet of small individuals and its proportion increased with fish length. Noteworthy, the highest proportion of Cluster 5 occurred for intermediate fish lengths. On the other hand, in summer, Cluster 4 dominated the diet of the smallest individuals followed by Cluster 3, the latter at a lower proportion than in winter. The proportion of Cluster 4 decreased with fish length at the same time that Cluster 2 increased. During summer, Cluster 5 represented lower proportion for all fish length, but maintained maximum values at intermediate fish length. Cluster 1 appeared similar to winter results.
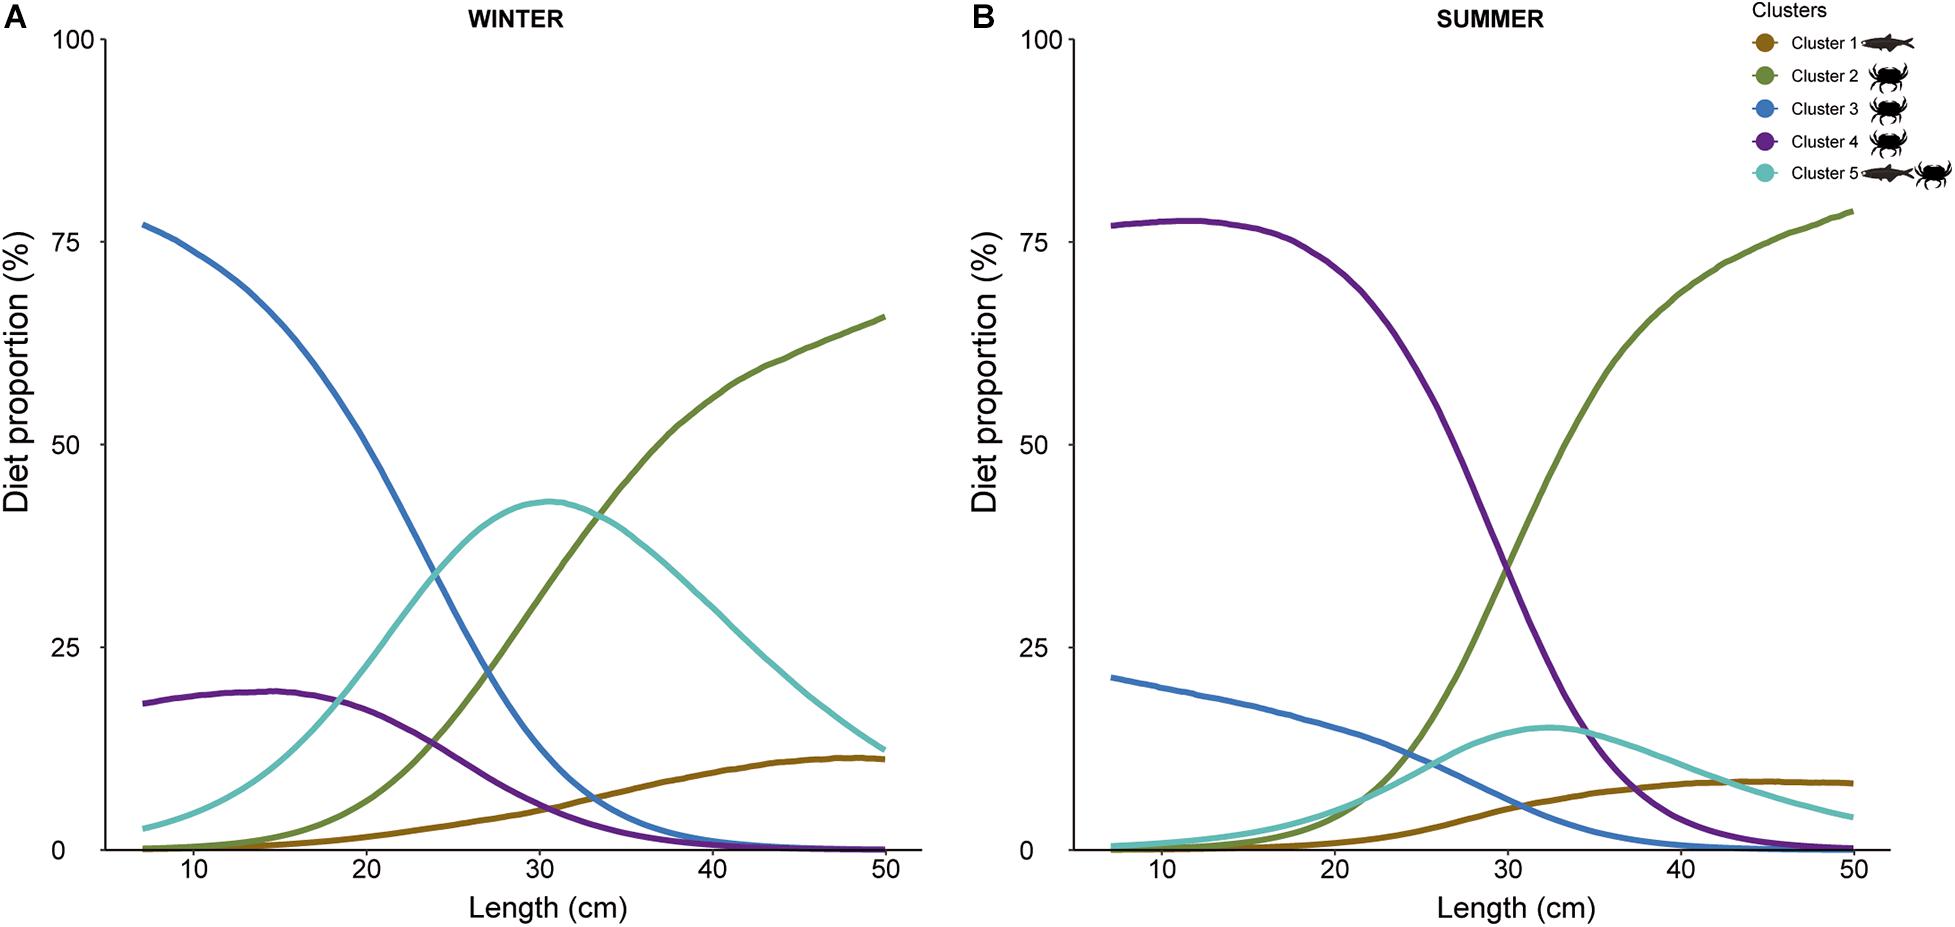
Figure 6. MixSIAR model results showing estimated diet proportions of each potential prey clusters (1, 2, 3, 4, and 5) contributing to European hake diet, as a function of length (in cm) for each season ((A): winter and (B): summer). Cluster 1: Cepola macrophthalma, Boops boops, Spicara maena, Spicara smaris, Argentina sphyraena, Trisopterus minutus, Lepidopus caudatus, Sardina pilchardus, Maurolicus muelleri, Gadiculus argenteus, and Micromesistius poutassou, Cluster 2: Chlorotocus crassicornis, Nematoscelis megalops, and Phronima sedentaria, Cluster 3: Vibilia armata, Cluster 4: Anchialina agilis and Meganyctiphanes norvegica, and Cluster 5: Engraulis encrasicolus, Plesionika heterocarpus, Sardinella aurita, and Solenocera membranacea.
Discussion
The spatial distribution of marine species is known to be affected by interannual and seasonal environmental factors and habitat parameters, but also by species interactions factors (Gilinsky, 1984; Hixon and Carr, 1997; Carney, 2005; Morfin et al., 2012). In the present study, we applied a multidisciplinary approach that analyses the spatial distribution of European hake, using its main environmental and feeding related drivers explaining European hake distribution. For this, we applied Hierarchical Bayesian species distribution models (B-SDMs) and stable isotope analysis, considering a seasonal and ontogenetic perspective. Overall, our results showed seasonal and ontogenetic differences in the spatial distribution of European hake in the northwestern Mediterranean Sea. In addition to the effect of particular environmental factors, these spatial changes were partially explained by the distribution of the main prey consumed by European hake. We also gathered information about the ontogenetic and seasonal variation in European hake diet to provide further insight into how feeding preferences may affect species spatial occurrence.
Our species distribution models showed that adult individuals had a tendency to be present in deeper areas, with lower bottom temperatures. These environmental preferences have already been described for this species in the Mediterranean Sea (Demestre and Sánchez, 1998; Maravelias et al., 2006; Katsanevakis et al., 2009; Sion et al., 2019). Particularly, bathymetry has repeatedly been reported as a main driver in hake spatial distribution (Recasens et al., 1998; Orsi-Relini et al., 2002; Maynou et al., 2003; Paradinas et al., 2015). The importance of temperature and depth as key factors on SDMs has also been reported to vary intra-annually. For example, in the Aegean Sea (Central Mediterranean Sea) in 2016, the effect of temperature in the distribution of European hake was more pronounced during months of thermal stratification (Yalçln and Gurbet, 2016). Indeed the influence of environmental factors on determining abundance of demersal fish in general are reported to be intensified during summer and autumn in the Aegean Sea (Katsanevakis et al., 2009). Furthermore, a seasonal and ontogenetic migration along the bathymetric gradient was also observed for European hake outside the Mediterranean Sea, for example in the Galician waters (Atlantic Ocean) (Fariña et al., 1997).
Our results showed a spatial segregation between adult and juvenile European hakes, with adults mainly present in the southern area during winter and in the northern area during summer. Ontogenetic spatial differentiation and areas of aggregation for this species have previously been related to life cycle events (Demestre and Sánchez, 1998), nursery areas (Druon et al., 2015), areas with high food availability (Sion et al., 2019) or changes in diet (Carpentieri et al., 2005; Garofalo et al., 2018). In general, it seems that adult females choose deeper areas whereas juveniles prefer the shallower continental shelf (Demestre and Sánchez, 1998). For instance, a study from late spring of 2015 using the same modeling approach than us detected three main hotspots area for European hake nurseries in the northwestern Mediterranean Sea, one of the three located northern of the Ebro Delta, similar to the distribution found here for adults’ hake in winter (Paradinas et al., 2015). In this context, European hake in the western Mediterranean Sea presents a spawning peak during autumn and winter (Maynou et al., 2003), hence the aggregation found close to the Ebro Delta during winter in our study might also correspond to a reproduction/nursery area. Furthermore, changes in the spatial distribution between seasons have also previously been detected in our study area, with individuals intensifying their spatial differentiation during summer and spring (Demestre and Sánchez, 1998).
In addition to the importance of the environmental variables on the distribution of European hake and although bathymetry showed the highest impact in all four models, the distribution of European hake main prey, both fish and crustaceans, also provided valuable information explaining the distribution of hake in the northwestern Mediterranean Sea. Specifically, the spatial distributions and abundance of potential preys were used as indirect proxies of trophic behavior in species spatial occurrence (Navarro et al., 2016). However, just including prey distribution was not enough in this case, as European hake is an ambush predator and its mouth gape is a limiting factor for prey selection and ingestion (this being especially true for juvenile individuals) (Johnson et al., 2012). This is why we also considered the information about potential preys’ size as an explanatory variable. In this regard, our results indicated that European hake’s juveniles in winter were associated with low abundance of relatively large fish preys. The size of these individuals could potentially outbound the mouth gape limitations of the predators, and thus juvenile’s European hake would mostly be feeding on small crustaceans as has been described in previous feeding studies (Mellon-Duval et al., 2017). However, in summer, juveniles are correlated with smaller and more abundant fish prey implying a potential capacity of also ingesting available small fish, in addition to crustaceans. Nevertheless, these results on their own were not sufficient to drawn a robust conclusion and the use of stable isotope analyses complemented the SDMs results providing additional information of European hake seasonal and ontogenetic trophic metrics.
In this context, differences in δ13C and δ15N values pointed out to potential differences in trophic habits of adults and juveniles between winter and summer. Furthermore, the low overlap between the different isotopic niches showed a strong degree of niche differentiation between seasons and stages, also confirmed by the mixing model. More specifically, the wide isotopic niche observed for adults suggests a more diversified feeding behavior, contrasting with the narrow isotopic niche breadth recorded for juveniles. This is in contrast with previous studies, in the same area and in the Tyrrhenian Sea (central Mediterranean Sea), that have described juveniles as being more opportunistic than adults (Modica et al., 2013). Our isotopic results also suggest a seasonal differentiation in adults’ diet, with higher consumption of crustaceans during summer compared to winter. To a certain extent, this relates to our observations of the SDMs, as adults’ hake during summer were correlated with small-size crustaceans. Related to juveniles, the differences in δ15N values when compared to adults, and the positive trend with body size (Supplementary Figure 5) indicated ontogenetic variations in diet; with the lower values recorded for juveniles suggesting a consumption of lower trophic level organisms. In addition, MixSIAR outputs showed that cluster 3 (formed uniquely of the amphipod Vibilia armata) represented the highest diet proportion for juveniles in winter, followed by cluster 4 (formed exclusively of crustaceans) and the same clusters but in the opposite level of importance dominated for summer. This concurred with previous findings that reported a diet based on crustaceans for juveniles of European hake (Bozzano et al., 1997; Cartes et al., 2004, 2009; Ferraton et al., 2007).
However, partly contrasting the results of the B-SDM, juveniles larger than 20 cm in winter showed a higher proportion of cluster 5 (formed by several crustaceans and small fish, i.e., Sardinella aurita and Engraulis encrasicolus) when compared to juveniles from summer. Consumption of small pelagic fish has also been recorded for this species for individuals as small as 7 cm in nearby areas (Gulf of Lions) (Mellon-Duval et al., 2017). Within this context, the SIA results suggested that summer juveniles may have been feeding on higher trophic levels prey sources, as they showed higher δ15N values (Navarro et al., 2011) compared to juveniles in winter. However, rather than an increase of piscivorous diet during summer, it could be due to the fact that at this time of the year, juveniles feed more on cluster 4 than cluster 3, which occupied a slightly higher isotopic position. Nevertheless, it is important to consider that changes in δ15N values can also reflect variations in the baseline rather than in diet, especially when comparing values from different seasons (Costalago et al., 2012; Mellon-Duval et al., 2017). Thus, further and more extensive analysis that include this aspect should be done to verify this seasonal variation in the diet.
Overall, our trophic analysis results were partly consistent with published data (Bozzano et al., 1997; Cartes et al., 2004, 2009; Ferraton et al., 2007), where juveniles showed a crustaceans dominated diet and switch to a more piscivorous diet as they reached larger body size. Here we observed an evident ontogenetic variation in diet, with increased consumption of fish preys as individuals reach intermediate and large body size. We also observed that the species of crustaceans consumed varied with ontogenetic stage and season. However, not all the studies concur on the body length and the reason why this switch occurs. It has been suggested that the diet’s switch corresponds to an increase in individual’s mobility in the water column (Mellon-Duval et al., 2017) along a proportional increase in mouth dimensions (Karpouzi and Stergiou, 2003) that facilitates ingestion of larger preys (Modica et al., 2013). Piscivorous diet has also been associated with the retinal changes and the improvement in vision acuity (Bozzano and Catalán, 2002) that permit European hake detects prey from higher distances and even in more turbid waters. These physiological changes altogether will ease prey selectivity and an intake preference for higher energy preys (Stagioni et al., 2011; Modica et al., 2013).
Overall, our results show that seasonality plays a role when looking at the distribution and feeding behavior of European hake. Seasonality can affect prey availability and thus predators’ diet. In our study, despite diet variations were more distinct between stages, differences between seasons should not be disregarded. Previous studies have also recorded diet variation with seasonality in the Western Mediterranean Sea (Mellon-Duval et al., 2017) and non-Mediterranean areas (Velasco and Olaso, 1998), with mixed conclusions. A study from the north-eastern Mediterranean Sea showed an increase in fish ingestion in winter and dominance of crustaceans during summer (Stagioni et al., 2011). This is partly in line with our results, as despite high proportions of cluster 2, 3, and 4 (formed exclusively of crustaceans) were observed during both seasons, consumption of cluster 5 (formed of fish and crustaceans) was overall higher during winter. Some studies have also recorded an increase on juveniles feeding on euphausiids in spring, coinciding with the aggregating reproductive behavior of this species (Ferraton et al., 2007), as well as an increase of gobiids consumption during autumn. Furthermore, a study from the Gulf of Lyon (northwestern Mediterranean Sea) found lower proportion of pelagic fish ingestion in adults’ diet in spring when compared to autumn (Mellon-Duval et al., 2017).
Despite valuable information, and the novelty and benefits of using a continuous covariate in the MixSIAR analyses, which is a relatively novel technique (Francis et al., 2011; Stock and Semmens, 2016; Gagne et al., 2018; Stock et al., 2018; Gorman et al., 2019), this study is subjected to some limitations. Unfortunately, this study only covers one year and it is not possible to prove repeatability of the seasonal pattern observed in the analysis. Moreover, the use of the mean weight as a proxy of European hake size and life stages in the B-SDM is appropriate to identify areas mostly occupied by juveniles and large adults in winter and summer. This type of variable can be of interest when wanting to account for changes related to life stages but where data of individuals’ body length is scarce, not available or not feasible. For example, oceanographic surveys where total biomass and abundance per haul is usually recorded but the individual sampling of all specimens for biological analysis is unrealistic. However, this kind of proxy also presents some limitations, not directly informing of the less extreme phases of the life cycle, as intermediate values of mean weight cannot be categorized into adults other juveniles and are likely composed of mixed life stages. Furthermore, according to the length-weight relationship for European hake in the western Mediterranean Sea (Morey et al., 2003), for an individual of 25 cm, which is the length above which we classified individuals as “adults” (Bozzano et al., 1997; Lleonart, 2002), the corresponding mean weight is around 0.0895 kg. This means that for our data, only a reduced number of hauls had mean weight values over this threshold (Supplementary Table 6). This translates into an under-representation of adult individuals, especially during summer. This is partly related to the fact that all the data for this study was collected through bottom trawling, whereas generally larger individuals of European hake are caught trough long net gears. This means that adults were not very abundant and that our maximum individuals’ size is 50.2 cm, but European hake in these waters can reach body lengths of more than 80 cm. Therefore, the diet and spatial distribution described here is not representing the entire population, omitting the largest individuals.
Our findings could have clear implications for a future seasonal-based adaptive fisheries management, as local depletion of prey, or variation in prey size and/or condition may affect hake presence in an area. This is of particular interest for this study as overfishing has led to a general decrease on demersal species (FAO-MED, 2018), some of which are prey to European hake, as well as a decline in small pelagic fish (e.g., Sardina pilchardus and Engraulis encrasicolus) (Coll and Bellido, 2019). Indeed, previous studies have already expressed their concerns about the underlying effect of these alterations for hake’s population stock and distribution (Sion et al., 2019). Combining this information with future climate-change scenarios could result on major variations of the potential distribution of European hake in this area. Therefore, this study presents important information in the context of phenological processes of exploited species and their potential changes due to climate change. It does also emphasize, the need for additional monitoring efforts that consider a seasonal sampling of the marine ecosystems. Further information about spatial trophic analysis with season and ontogenetic stages is necessary if we want to fully understand species ecological roles, spatial-temporal population and food-web dynamics within marine ecosystems.
Data Availability Statement
The raw data supporting the conclusions of this article will be made available by the authors, without undue reservation.
Ethics Statement
The authors declare that all fieldwork was approved by the Ethics Committee of CSIC, in accordance with the Spanish and EU legislation on the protection of animals used for scientific purposes.
Author Contributions
EL-L, MC, JN, and MA-P: conceptualization and design of the experiment. MC, JN, NL and MA-P: samples collection. NL and MA-P: samples preparations. EL-L, MA-P, and JG: formal analysis. EL-L: writing–original draft preparation. MP, JN, MC, JG, MA-P, NL, and EL-L: writing–reviewing and editing. All authors contributed to the article and approved the submitted version.
Funding
This study took advantage of data collected under the ECOTRANS projects (CTM2011-26333, 2012–2014, Spanish Ministry of Economy and Competiveness, Spain). EL-L was supported by a FPU grant (FPU1704395, Spanish Ministry of Education). JN was supported by the Spanish National Program Ramón y Cajal (RYC-2015-17809, Spanish Ministry of Economy and Competiveness, Spain). Also funded by Project IMPRESS (RTI2018-099868-B-I00) project, ERDF, Ministry of Science, Innovation and Universities – State Research Agency.
Conflict of Interest
The authors declare that the research was conducted in the absence of any commercial or financial relationships that could be construed as a potential conflict of interest.
Acknowledgments
The authors would like to acknowledge all participants of the ECOTRANS project that helped in the sampling and laboratory work. We also would like to acknowledge Brian Stock for his assistance and support on developing the continuous MixSIAR models. This study is a contribution of the projects PELWEB (CTM2017-88939-R) and RESNEP (CTM2017-82991-C2-1-R) of the Spanish Ministry of Economy and Competiveness of Spain). The authors declare that all experimental procedures were conducted in strict accordance with good animal practice as defined by the current Spanish, Catalonian and European legislation.
Supplementary Material
The Supplementary Material for this article can be found online at: https://www.frontiersin.org/articles/10.3389/fmars.2020.566686/full#supplementary-material
Footnotes
References
Abella, A., Serena, F., and Ria, M. (2005). Distributional response to variations in abundance over spatial and temporal scales for juveniles of European hake (Merluccius merluccius) in the Western Mediterranean Sea. Fish. Res. 71, 295–310. doi: 10.1016/j.fishres.2004.08.036
Aguzzi, J., Sbragaglia, V., Tecchio, S., Navarro, J., and Company, J. B. (2015). Rhythmic behaviour of marine benthopelagic species and the synchronous dynamics of benthic communities. Deep Res. Part I 95, 1–11. doi: 10.1016/j.dsr.2014.10.003
Albo-Puigserver, M., Navarro, J., Coll, M., Layman, C. A., and Palomera, I. (2016). Trophic structure of pelagic species in the northwestern Mediterranean Sea. J. Sea Res. 117, 27–35. doi: 10.1016/j.seares.2016.09.003
Anderson, M. J., Gorley, R. N., and Clarke, K. R. (2008). PERMANOVA+ for PRIMER. Plymouth: Guid. to Softw. Stat. methods. Prim. Ltd.
Barría, C., Coll, M., and Navarro, J. (2015). Unravelling the ecological role and trophic relationships of uncommon and threatened elasmobranchs in the western Mediterranean Sea. Mar. Ecol. Prog. Ser. 539, 225–240. doi: 10.3354/meps11494
Barría, C., Navarro, J., and Coll, M. (2018). Feeding habits of four sympatric sharks in two deep-water fishery areas of the western Mediterranean Sea. Deep Res. Part I 142, 34–43. doi: 10.1016/j.dsr.2018.09.010
Bertrand, J. A., de Sola, L. G., Papaconstantinou, C., Relini, G., and Souplet, A. (2002). The general specifications of the MEDITS surveys. Sci. Mar. 66, 169–182. doi: 10.3989/scimar.2002.66s2169
Blangiardo, M., and Cameletti, M. (2015). Spatial and Spatio-temporal Bayesian Models with R-INLA. Hoboken, NJ: John Wiley.
Bosc, E., Bricaud, A., and Antoine, D. (2004). Seasonal and interannual variability in algal biomass and primary production in the Mediterranean Sea, as derived from 4 years of SeaWiFS observations. Glob. Biogeochem. Cycles 18, 1–17. doi: 10.1029/2003GB002034
Bozzano, A., and Catalán, A. (2002). Ontogenetic changes in the retinal topography of the European hake, Merluccius merluccius: implications for feeding and depth distribution. Mar. Biol. 141, 549–559. doi: 10.1007/s00227-002-0840-7
Bozzano, A., Recasens, L., and Sartor, P. (1997). Diet of the european hake Merluccius merluccius (Pisces: Merluciidae) in the Western Mediterranean (Gulf of Lions). Sci. Mar. 61, 1–8.
Bozzano, A., Sardà, F., and Ríos, J. (2005). Vertical distribution and feeding patterns of the juvenile European hake, Merluccius merluccius in the NW Mediterranean. Fish. Res. 73, 29–36. doi: 10.1016/j.fishres.2005.01.006
Carney, R. (2005). Zonation of deep biota on continental margins. Oceanogr. Mar. Biol. Annu. Rev. 43, 211–278. doi: 10.1201/9781420037449.ch6
Carpentieri, P., Colloca, F., Cardinale, M., Belluscio, A., and Ardizzone, G. D. (2005). Feeding habits of European hake (Merluccius merluccius) in the central Mediterranean Sea. Fish. Bull. 103, 411–416.
Cartes, J. E., Hidalgo, M., Papiol, V., Massutí, E., and Moranta, J. (2009). Changes in the diet and feeding of the hake Merluccius merluccius at the shelf-break of the Balearic Islands: influence of the mesopelagic-boundary community. Deep. Res. Part I Oceanogr. Res. Pap. 56, 344–365. doi: 10.1016/j.dsr.2008.09.009
Cartes, J. E., Rey, J., Lloris, D., and Gil De Sola, L. (2004). Influence of environmental variables on the feeding and diet of European hake (Merluccius merluccius) on the Mediterranean Iberian coasts. J. Mar. Biol. Assoc. U.K. 84, 831–835. doi: 10.1017/S0025315404010021h
Caut, S., Angulo, E., and Courchamp, F. (2009). Variation in discrimination factors (Δ 15 N and Δ 13 C): the effect of diet isotopic values and applications for diet reconstruction. J. Appl. Ecol. 46, 443–453. doi: 10.1111/j.1365-2664.2009.01620.x
Chih-Lin, W., Rowe, G. T., Escobar-Briones, E., Boetius, A., Soltwedel, T., Julian, C. M., et al. (2010). Global patterns and predictions of seafloor biomass using random forests. PLoS One 5:e0015323. doi: 10.1371/journal.pone.0015323
Coll, M., and Bellido, J. M. (2019). Evaluation of The Population Status and Specific Management Alternatives for the Small Pelagic Fish Stocks in the Northwestern Mediterranean Sea (SPELMED). Final Report SC NR 02 - TENDER EASME/EMFF/2016/32 – SPELMED:85. Brussels: EU.
Coll, M., Piroddi, C., Steenbeek, J., Kaschner, K., Lasram, F. B. R., Aguzzi, J., et al. (2010). The biodiversity of the Mediterranean Sea: estimates, patterns, and threats. PLoS One 5:e0011842. doi: 10.1371/journal.pone.0011842
Cormon, X., Loots, C., Vaz, S., Vermard, V., and Marchal, P. (2014). Spatial interactions between saithe (Pollachius virens) and hake (Merluccius merluccius) in the North Sea. ICES J. Mar. Sci. 71, 1342–1355. doi: 10.1038/278097a0
Costalago, D., Navarro, J., Álvarez-Calleja, I., and Palomera, I. (2012). Ontogenetic and seasonal changes in the feeding habits and trophic levels of two small pelagic fish species. Mar. Ecol. Prog. Ser. 460, 169–181. doi: 10.3354/meps09751
Davis, M., and Pineda-Munoz, S. (2016). The temporal scale of diet and dietary proxies. Ecol. Evol. 6, 1883–1897. doi: 10.1002/ece3.2054
De Souza, C. S., Mafalda, P., Sallés, S., Ramirez, T., Cortés, D., Garcia, A., et al. (2011). Seasonal changes in the distribution and abundance of marine cladocerans of the Northwest Alboran Sea (Western Mediterranean), Spain. Braz. Arch. Biol. Technol. 54, 543–550.
Demestre, M., and Sánchez, P. (1998). Spatio-temporal distribution of the European hake Merluccius merluccius off Catalan coast (Northwestern Mediterranean). Rapp. Comm. Int. Mer. Médit. 35, 420–421.
Demestre, M., Sánchez, P., and Abelló, P. (2000). Demersal fish assemblages and habitat characteristics on the continental shelf and upper slope of the north-western Mediterranean. J. Mar. Biol. Assoc. U.K. 80, 981–988. doi: 10.1017/S0025315400003040
Di Natale, A., Molinari, A., Öztürk, B., Srour, A., and Pollard, D. (2011). Merluccius Merluccius. The IUCN Red List of Threatened Species 2011: e.T198562A9031395. Gland: IUCN.
Dormann, C. F., Elith, J., Bacher, S., Buchmann, C., Carl, G., Carré, G., et al. (2013). Collinearity: a review of methods to deal with it and a simulation study evaluating their performance. Ecography 36, 27–46. doi: 10.1111/j.1600-0587.2012.07348.x
Druon, J. N., Fiorentino, F., Murenu, M., Knittweis, L., Colloca, F., Osio, C., et al. (2015). Modelling of European hake nurseries in the Mediterranean Sea: an ecological niche approach. Prog. Oceanogr. 130, 188–204. doi: 10.1016/j.pocean.2014.11.005
Fanelli, E., Cartes, J. E., Rumolo, P., and Sprovieri, M. (2009). Food-web structure and trophodynamics of mesopelagic – suprabenthic bathyal macrofauna of the Algerian Basin based on stable isotopes of carbon and nitrogen. Deep Res. Part I 56, 1504–1520. doi: 10.1016/j.dsr.2009.04.004
Fanelli, E., Rumolo, P., Barra, M., Basilone, G., Genovese, S., and Bonanno, A. (2018). Mesoscale variability in the trophic ecology of the European hake Merluccius merluccius in the Strait of Sicily. Hydrobiologia 821, 57–72. doi: 10.1007/s10750-017-3268-2
Fariña, A. C., Freire, J., and González-Gurriaran, E. (1997). Demersal fish assemblages in the Galician continental shelf and upper slope (NW Spain): spatial structure and long-term changes. Estuar. Coast. Shelf Sci. 44, 435–454. doi: 10.1006/ecss.1996.0148
Fernandes, P. G., Ralph, G. M., Nieto, A., Criado, M. G., Vasilakopoulos, P., Maravelias, C. D., et al. (2017). Coherent assessments of Europe’s marine fishes show regional divergence and megafauna loss. Nat. Ecol. Evol. 1:0170. doi: 10.1038/s41559-017-0200
Ferraton, F., Harmelin-Vivien, M., Mellon-Duval, C., and Souplet, A. (2007). Spatio-temporal variation in diet may affect condition and abundance of juvenile European hake in the Gulf of Lions (NW Mediterranean). Mar. Ecol. Prog. Ser. 337, 197–208. doi: 10.3354/meps337197
Fisher, W., Bauchot, W. M., and Schneider, M. (1987). Fiches FAO d’indetification des espèces pour les besoins de la pêche. Zone de Pêche 37. Rome: FAO.
Fox, J., and Weisberg, S. (2011). “Multivariate linear models in R∗,” in An R Companion to Applied Regression, 2nd Edn, Thousand Oaks: Sage, 1–31.
Francis, T. B., Schindler, D. E., Holtgrieve, G. H., Larson, E. R., Scheuerell, M. D., Semmens, B. X., et al. (2011). Habitat structure determines resource use by zooplankton in temperate lakes. Ecol. Lett. 14, 364–372. doi: 10.1111/j.1461-0248.2011.01597.x
Gaertner, J. C. (2000). Seasonal organization patterns of demersal assemblages in the Gulf of Lions (north-western Mediterranean Sea). J. Mar. Biol. Assoc. U.K. 80, 777–783. doi: 10.1017/S0025315400002745
Gagne, T. O., Hyrenbach, K. D., Hagemann, M. E., and Van Houtan, K. S. (2018). Trophic signatures of seabirds suggest shifts in oceanic ecosystems. Sci. Adv. 4:eaao3946.
Garofalo, G., Fezzani, S., Gargano, F., Milisenda, G., Ben Abdallah, O., Ben Hadj Hamida, N., et al. (2018). Predictive distribution models of European hake in the south-central Mediterranean Sea. Hydrobiologia 821, 153–172. doi: 10.1007/s10750-017-3338-5
Gelman, A., Jakulin, A., Pittau, M. G., and Su, Y. S. (2008). A weakly informative default prior distribution for logistic and other regression models. Ann. Appl. Stat. 2, 1360–1383. doi: 10.1214/08-AOAS191
Gilinsky, E. (1984). The role of fish predation and spatial heterogeneity in determining benthic community structure. Ecology 65, 455–468. doi: 10.2307/1941408
Gorman, D., Pucci, M., Soares, L. S. H., Turra, A., and Schlacher, T. A. (2019). Land – ocean connectivity through subsidies of terrestrially derived organic matter to a nearshore marine consumer. Ecosystems 22, 796–804. doi: 10.1007/s10021-018-0303-8
Guisan, A., and Zimmermann, N. E. (2000). Predictive habitat distribution models in ecology. Ecol. Modell. 135, 147–186. doi: 10.1016/S0304-3800(00)00354-9
Gupta, A. K., and Nadarajah, S. (2004). Handbook of Beta Distribution and Its Applications. New York: Chapman and Hall.
Hijmans, R. J. (2018). Package Raster: Geographic Data Analysis and Modeling. R package version 2.8-4.
Hixon, M. A., and Carr, M. H. (1997). Synergistic predation, density dependence, and population regulation in marine fish. Science 277, 946–949. doi: 10.1126/science.277.5328.946
Hyslop, E. J. (1980). Stomach contents analysis-a review of methods and their application. J. Fish Biol. 17, 411–429. doi: 10.1111/j.1095-8649.1980.tb02775.x
Jackson, A. L., Inger, R., Parnell, A. C., and Bearhop, S. (2011). Comparing isotopic niche widths among and within communities: SIBER - stable isotope bayesian ellipses in R. J. Anim. Ecol. 80, 595–602. doi: 10.1111/j.1365-2656.2011.01806.x
Johnson, A. F., Jenkins, S. R., Hiddink, J. G., and Hinz, H. (2013). Linking temperate demersal fish species to habitat: scales, patterns and future directions. Fish Fish. 14, 256–280. doi: 10.1111/j.1467-2979.2012.00466.x
Johnson, A. F., Valls, M., Moranta, J., Jenkins, S. R., and Hiddink, J. G. (2012). Effect of prey abundance and size on the distribution of demersal fishes. Can. J. Fish. Aquat. Sci. 69, 191–200. doi: 10.1139/f2011-138
Karpouzi, V. S., and Stergiou, K. I. (2003). The relationships between mouth size and shape and body length for 18 species of marine fishes and their trophic implications. J. Fish Biol. 62, 1353–1365. doi: 10.1046/j.1095-8649.2003.00118.x
Katsanevakis, S., Maravelias, C. D., Damalas, D., Karageorgis, A. P., Tsitsika, E. V., Anagnostou, C., et al. (2009). Spatiotemporal distribution and habitat use of commercial demersal species in the eastern Mediterranean Sea. Fish. Oceanogr. 18, 439–457. doi: 10.1111/j.1365-2419.2009.00523.x
Lasram, F. B. R., Guilhaumin, G., Albouy, C., Somot, S., Thuillers, W., and Mouillot, D. (2010). The Mediterranean Sea as a ‘cul-de-sac’ for endemic fishes facing climate change. Glob. Chang. Biol. 16, 3233–3245. doi: 10.1111/j.1365-2486.2010.02224.x
Lleonart, J. (2002). Impact of Fishery and Environment on Hake Recruitment in Northwestern Mediterranean. Final Report European Commission Conract FAIR CT-97-3522. Alicante: Editorial Club Universitario.
Lleonart, J., and Maynou, F. (2003). Fish stock assessments in the Mediterranean: state of the art Fish stock assessments in the Mediterranean: state of the art. Sci. Mar. 67, 37–49. doi: 10.3989/scimar.2003.67s137
Logan, J. M., and Lutcavage, M. E. (2008). A comparison of carbon and nitrogen stable isotope ratios of fish tissues following lipid extractions with non-polar and traditional chloroform/methanol solvent systems. Rapid. Commun. Mass Spectrom. 22, 1081–1086. doi: 10.1002/rcm.3471
Madurell, T., Fanelli, E., and Cartes, J. E. (2008). Isotopic composition of carbon and nitrogen of suprabenthic fauna in the NW Balearic Islands (western Medterranean). J. Mar. Syst. 71, 336–345. doi: 10.1016/j.jmarsys.2007.03.006
Maravelias, C. D., and Papaconstantinou, C. (2006). Geographic, seasonal and bathymetric distribution of demersal fish species in the eastern mediterranean. J. Appl. Ichthyol. 22, 35–42. doi: 10.1111/j.1439-0426.2006.00695.x
Maravelias, C. D., Tsitsika, E. V., and Papaconstantinou, C. (2006). Environmental influences on the spatial distribution of European hake (Merluccius merluccius) and red mullet (Mullus barbatus) in the Mediterranean. Ecol. Res. 22, 678–685. doi: 10.1007/s11284-006-0309-0
Maynou, F., Lleonart, J., and Cartes, J. E. (2003). Seasonal and spatial variability of hake (Merluccius merluccius L.) recruitment in the NW mediterranean. Fish. Res. 60, 65–78. doi: 10.1016/S0165-7836(02)00062-0
Mellon-Duval, C., Harmelin-Vivien, M., Métral, L., Loizeau, V., Mortreux, S., Roos, D., et al. (2017). Trophic ecology of the European hake in the Gulf of Lions, northwestern Mediterranean Sea. Sci. Mar. 81:7. doi: 10.3989/scimar.04356.01a
Mellon-Duval, C., Pontual, H., Métral, L., and Quemener, L. (2010). Growth of European hake (Merluccius merluccius) in the Gulf of Lions based on conventional tagging. ICES J. Mar. Sci. 67, 62–70.
Modica, L., Bozzano, A., and Velasco, F. (2013). The influence of body size on the foraging behaviour of European hake after settlement to the bottom. J. Exp. Mar. Bio. Ecol. 444, 46–54. doi: 10.1016/j.jembe.2013.03.001
Modica, L., Bozzano, A., Velasco, F., Albertelli, G., and Olaso, I. (2011). Predation, feeding strategy and food daily ration in juvenile European hake. Mar. Ecol. Prog. Ser. 440, 177–189. doi: 10.3354/meps09341
Morey, G., Moranta, J., Massutí, E., Grau, A., Linde, M., Riera, F., et al. (2003). Weight–length relationships of littoral to lower slope fishes from the western Mediterranean. Fish. Res. 63, 89–96. doi: 10.1016/S0165-7836(02)00250-3
Morfin, M., Fromentin, J. M., Jadaud, A., and Bez, N. (2012). Spatio-temporal patterns of key exploited marine species in the Northwestern Mediterranean sea. PLoS One 7:e0037907. doi: 10.1371/journal.pone.0037907
Muñoz, F., Pennino, M. G., Conesa, D., López-Quílez, A., and Bellido, J. M. (2013). Estimation and prediction of the spatial occurrence of fish species using Bayesian latent Gaussian models. Stoch. Environ. Res. Risk Assess. 27, 1171–1180. doi: 10.1007/s00477-012-0652-3
Navarro, J., Cardador, L., Fernández, ÁM., Bellido, J. M., and Coll, M. (2016). Differences in the relative roles of environment, prey availability and human activity in the spatial distribution of two marine mesopredators living in highly exploited ecosystems. J. Biogeogr. 43, 440–450. doi: 10.1111/jbi.12648
Navarro, J., Coll, M., Cardador, L., Fernández, ÁM., and Bellido, J. M. (2015). The relative roles of the environment, human activities and spatial factors in the spatial distribution of marine biodiversity in the Western Mediterranean Sea. Prog. Oceanogr. 131, 126–137. doi: 10.1016/j.pocean.2014.12.004
Navarro, J., Coll, M., Louzao, M., Palomera, I., Delgado, A., and Forero, M. G. (2011). Comparison of ecosystem modelling and isotopic approach as ecological tools to investigate food webs in the NW Mediterranean Sea. J. Exp. Mar. Bio. Ecol. 401, 97–104. doi: 10.1016/j.jembe.2011.02.040
Oliver, P., and Massuti, E. (1995). “Biology and fisheries of western Mediterranean hake (M. merluccius),” in Hake-Fisheries, Ecology And Markets, eds J. Alheit and T.J. Pitcher (Dordrecht: Springer), 181–202.
Orsi-Relini, L., Papaconstantinou, C., Jukic-peladic, S., Souplet, A., De Sola, L. G., Piccinetti, C., et al. (2002). Distribution of the Mediterranean hake populations (Merluccius merluccius smiridus Rafinesque, 1810) (Osteichthyes : Gadiformes) based on six years monitoring by trawl-surveys : some implications for management. Sci. Mar. 66, 21–38. doi: 10.3989/scimar.2002.66s221
Paradinas, I., Conesa, D., Pennino, M. G., Muñoz, F., Fernández, A. M., López-Quílez, A., et al. (2015). Bayesian spatio-temporal approach to identifying fish nurseries by validating persistence areas. Mar. Ecol. Prog. Ser. 528, 245–255. doi: 10.3354/meps11281
Paradinas, I., Mar, M., Pennino, M. G., Antonio, L., Conesa, D., Barreda, D., et al. (2016). Identifying the best fishing-suitable areas under the new European discard ban. ICES J. Mar. Sci. 73, 2479–2487. doi: 10.1093/icesjms/fsw114
Parnell, A. C., Inger, R., Bearhop, S., and Jackson, A. L. (2010). Source partitioning using stable isotopes: coping with too much variation. PLoS One 5, 1–5. doi: 10.1371/journal.pone.0009672
Pennino, M. G., Muñoz, F., Conesa, D., López-Qúlez, A., and Bellido, J. M. (2013). Modeling sensitive elasmobranch habitats. J. Sea Res. 83, 209–218. doi: 10.1016/j.seares.2013.03.005
Pitcher, T. J., and Alheit, J. (1995). “What makes a hake? A review of the critical biological features that sustain global hake fisheries,” in Hake, eds J. Alheit and T.J. Pitcher (Dordrecht: Springer), 1–14.
Psarra, S., Tselepides, A., and Ignatiades, L. (2000). Primary productivity in the oligotrophic Cretan Sea (NE Mediterranean): seasonal and interannual variability. Prog. Oceanogr. 46, 187–204. doi: 10.1016/S0079-6611(00)00018-5
Puerta, P., Hunsicker, M. E., Quetglas, A., Álvarez-Berastegui, D., Esteban, A., González, M., et al. (2015). Spatially explicit modeling reveals cephalopod distributions match contrasting trophic pathways in the western mediterranean sea. PLoS One 10:e0133439. doi: 10.1371/journal.pone.0133439
Puerta, P., Quetglas, A., and Hidalgo, M. (2016). Seasonal variability of cephalopod populations: a spatio-temporal approach in the Western Mediterranean Sea. Fish. Oceanogr. 25, 373–389. doi: 10.1111/fog.12159
R Core Team (2018). R: A Language and Environment for Statistical Computing. Vienna: R Foundation for Statistical Computing. Available online at: https://www.r-project.org
Recasens, L., Lombarte, A., Morales-Nin, B., and Torres, G. J. (1998). Spatiotemporal variation in the population structure of the European hake in the NW Mediterranean. J. Fish Biol. 53, 387–401. doi: 10.1006/jfbi.1998.0709
Rue, H., Martino, S., and Chopin, N. (2009). Approximate Bayesian inference for latent Gaussian models using integrated nested Laplace approximations. J. R. Stat. Soc. Ser. b, Stat. Methodol. 71, 319–392. doi: 10.1111/j.1467-9868.2008.00700.x
Rueda, L., Valls, M., Hidalgo, M., Guijarro, B., Esteban, A., and Massutí, E. (2019). From trophic ecology to fish condition: contrasting pathways for European hake in the western Mediterranean. Mar. Ecol. Prog. Ser. 623, 131–143. doi: 10.3354/meps13025
Salat, J., Garcia, M. A., Cruzado, A., Palanques, A., Arín, L., Gomis, D., et al. (2002). Seasonal changes of water mass structure and shelf slope exchanges at the Ebro shelf (NW Mediterranean). Cont. Shelf Res. 22, 327–348. doi: 10.1016/S0278-4343(01)00031-0
Sánchez, P., Sartor, P., Recasens, L., Ligas, A., Martin, J., and De Ranieri, S. (2007). Trawl catch composition during different fishing intensity periods in two Mediterranean demersal fishing grounds. Sci. Mar. 71, 765–773. doi: 10.3989/scimar.2007.71n4765
Scranton, K., and Amarasekare, P. (2017). Predicting phenological shifts in a changing climate. PNAS 114, 13212–13217. doi: 10.1073/pnas.1711221114
Sinopoli, M., Fanelli, E., Anna, G. D., Badalamenti, F., and Pipitone, C. (2012). Assessing the effects of a trawling ban on diet and trophic level of hake, Merluccius merluccius, in the southern Tyrrhenian Sea. Sci. Mar. 76, 677–690. doi: 10.3989/scimar.03564.29A
Sion, L., Zupa, W., Calculli, C., Garofalo, G., and Hidalgo, M. (2019). Spatial distribution pattern of European hake, Merluccius merluccius (Pisces : Merlucciidae), in the Mediterranean Sea Spatial distribution pattern of European hake, Merluccius merluccius (Pisces: Merlucciidae), in the Mediterranean Sea. Sci. Mar. 83, 21–32. doi: 10.3989/scimar.04988.12A
Smith, J. A., Mazumder, D., Suthers, I. M., and Taylor, M. D. (2013). To fit or not to fit : evaluating stable isotope mixing models using simulated mixing polygons. Methods Ecol. Evol. 4, 612–618. doi: 10.1111/2041-210X.12048
Soykan, O., Ilkyaz, A. T., Metrin, G., and Tuncay Kinacigil, H. (2015). Age, growth and reproduction of European hake (Merluccius merluccius (Linn., 1758)) in the Central Aegean Sea, Turkey. Mar. Biol. Assoc. U.K. 95, 829–937. doi: 10.1017/S002531541400201X
Spearman, C. (1904). The proof and measurement of association between two things. Am. J. Psychol. 15, 72–101. doi: 10.1037/h0065390
Stagioni, M., Montanini, S., and Vallisneri, M. (2011). Feeding habits of European hake, Merluccius merluccius (Actinopterygii: Gadiformes: Merlucciidae), from the northeastern Mediterranean sea. Acta Ichthyol. Piscat. 41, 277–284. doi: 10.3750/AIP2011.41.4.03
Stock, B. C., Jackson, A. L., Ward, E. J., Parnell, A. C., Phillips, D. L., and Semmens, B. X. (2018). Analyzing mixing systems using a new generation of Bayesian tracer mixing models. Peer 6, 1–27. doi: 10.7717/peerj.5096
Valls, M., Sweeting, C. J., Olivar, M. P., Puelles, M. L. F., De Pasqual, C., Polunin, N. V. C., et al. (2014). Structure and dynamics of food webs in the water column on shelf and slope grounds of the western Mediterranean. J. Mar. Syst. 138, 171–181. doi: 10.1016/j.jmarsys.2014.04.002
Velasco, F., and Olaso, I. (1998). European hake Merluccius merluccius (L., 1758) feeding in the Cantabrian Sea: seasonal, bathymetric and length variations. Fish. Res. 38, 33–44. doi: 10.1016/S0165-7836(98)00111-8
Wei, T., and Simko, V. (2017). R Package “Corrplot”: Visualization of a Correlation Matrix (Version 0.84). Available online at: https://github.com/taiyun/corrplot
Yalçln, E., and Gurbet, R. (2016). Environmental influences on the spatio-temporal distribution of european hake (Merluccius merluccius) in izmir Bay, Aegean Sea. Turk. J. Fish. Aquat. Sci. 14, 1–14. doi: 10.4194/1303-2712-v16
Zuur, A. F., Ieno, E. N., and Elphick, C. S. (2010). A protocol for data exploration to avoid common statistical problems. Methods Ecol. Evol. 1, 3–14. doi: 10.1111/j.2041-210X.2009.00001.x
Keywords: European hake, fisheries, marine predator, mediterranean sea, Merluccius merluccius, spatial distribution, stable isotopes, trophic ecology
Citation: Lloret-Lloret E, Navarro J, Giménez J, López N, Albo-Puigserver M, Pennino MG and Coll M (2020) The Seasonal Distribution of a Highly Commercial Fish Is Related to Ontogenetic Changes in Its Feeding Strategy. Front. Mar. Sci. 7:566686. doi: 10.3389/fmars.2020.566686
Received: 28 May 2020; Accepted: 16 November 2020;
Published: 18 December 2020.
Edited by:
Steven W. Purcell, Southern Cross University, AustraliaReviewed by:
Davide Agnetta, National Institute of Oceanography and Experimental Geophysics (OGS), ItalyGermana Garofalo, Institute for Biological Resources and Marine Biotechnology (CNR), Italy
Copyright © 2020 Lloret-Lloret, Navarro, Giménez, López, Albo-Puigserver, Pennino and Coll. This is an open-access article distributed under the terms of the Creative Commons Attribution License (CC BY). The use, distribution or reproduction in other forums is permitted, provided the original author(s) and the copyright owner(s) are credited and that the original publication in this journal is cited, in accordance with accepted academic practice. No use, distribution or reproduction is permitted which does not comply with these terms.
*Correspondence: Elena Lloret-Lloret, elloret@icm.csic.es; elloret@cmima.csic.es