Energetic Effects of Whale-Watching Boats on Humpback Whales on a Breeding Ground
 Damian Villagra
 Ana García-Cegarra
 Diego I. Gallardo
 Aldo S. Pacheco
- 1Faculteit Wetenschappen en Bio-Ingenieurswetenschappen, Vrije Universiteit Brussel, Brussels, Belgium
- 2Centro de Investigación de Fauna Marina y Avistamiento de Cetáceos (CIFAMAC), Mejillones, Chile
- 3Departamento de Ciencias Básicas, Facultad de Ciencias, Universidad Santo Tomás, Antofagasta, Chile
- 4Departamento de Matemáticas, Facultad de Ingeniería, Universidad de Atacama, Copiapó, Chile
- 5Facultad de Ciencias Biológicas, Universidad Nacional Mayor de San Marcos, Lima, Peru
Interactions between whale-watching boats and cetaceans can lead to changes in their behavior. From a management perspective, it is important to understand how this type of disturbance can be translated into physiological effects, such as changes in their energetic metabolism. Humpback whales (Megaptera novaeangliae) typically do not feed while in breeding grounds, thus they depend on finite energy reserves. The effect of whale-watching boats on the energetic metabolism of humpback whales, in the breeding ground of northern Peru (4°10′35″S, 81°08′03″W) was evaluated. Groups of humpback whales were tracked from land, under the following scenarios: with, without, and before-during-after the presence of whale-watching boats. Mass-specific cost of transport (COT) was used as a proxy of energetic efficiency and calculated from swimming speed and breath frequency estimations. No differences were detected in breath frequency, swimming speed, and COT when comparing whales with and without boats. However, in the presence of boats, swim speed increased, and COT decreased as the number of boats increased. Exponential increment in breathing frequency at higher swimming speed was not detected. The absence of swimming speeds beyond the assumed optimal range suggested no shifts into metabolic inefficiency. Our results suggest optimal swimming speed between 2 and 4.05 m/s, representing COT values between 0.020 and 0.041 J × (kg × m)–1. In light of our results, we encourage the implementation of regulations of the activity, particularly limiting the number of boats interacting with the same group of humpback whales.
Introduction
Whale watching, the observation of dolphins and whales in nature, is a growing economic activity in oceanic and coastal waters in many regions of the world. As whale watching grows, several studies have demonstrated the negative consequences of this activity on the behavior of cetacean species (reviewed in Senigaglia et al., 2016). Effects have been reported for small and large cetacean species including alterations in swimming speed, direction, breathing frequency, and overall behavior (e.g., Noren et al., 2009; Christiansen et al., 2010; Stamation et al., 2010; Senigaglia et al., 2016; García-Cegarra et al., 2019). Studies have linked those behavioral changes into effects on energy budget and metabolism of the species (e.g., Williams et al., 2006; Christiansen et al., 2013, 2014a). Physiological responses are essential for a better understanding of organismal and population consequences of the disturbance caused by whale-watching boats (Costa, 2012; New et al., 2015; Pirotta et al., 2018).
Mating, breeding, and migration are highly energy-demanding activities for cetacean species. Southern right whales (Eubalaena australis) lose on average of 25% of their body volume during the breeding season (Christiansen et al., 2018). To minimize the rate of decline in body condition and optimizing calf growth during migration to their feeding ground, lactating humpback whale females reduce their metabolic rate to half that of adults in foraging grounds (Bejder et al., 2019; Nielsen et al., 2019). During breeding, fin whales (Balaenoptera physalus) consume between 19 and 26% of their energy reserves (Lockyer, 1981, 1984). Significant reductions in net energy intake and/or increases in energy expenditure can lead to changes in body condition (Frid and Dill, 2002). Fetal growth (Christiansen et al., 2014b) and calf body condition (Christiansen et al., 2016, 2018) of mysticeti whales is significantly determined by the body condition of the maternal female. Energetic consequences of behavioral changes could lead to long-term reductions in body condition, reproductive success (fitness), leading to negative population consequences (Pirotta et al., 2018). Whale watching can disturb critical behaviors such as lactation thus, reducing the energy transfer from the mother to the calf, affecting growth rates, which can have consequences in migratory timing and heat loss. Overall, these effects may lead to negative consequences for the long-term individual survival, reproduction success, and recruitment into the population (Bejder, 2005; Lusseau, 2006; Nowacek et al., 2016).
Studying the physiology of large sized, free-ranging cetaceans is difficult due to the methodological and logistical constraints. However, based on indirect estimations several studies have showed how behavioral changes can translate into physiological variability (Christiansen and Lusseau, 2015; Pirotta et al., 2018). For example, a 23.2% increase in energy expenditure was detected for traveling minke whales (Balaenoptera acutorostrata) due to increasing breath frequencies during interactions with whale-watching boats (Christiansen et al., 2014a). Energy intake of minke whales and killer whales (Orcinus orca) was reduced by 42 and 18% because approaching whale-watching boats induced a reduction of feeding times (Williams et al., 2006; Christiansen et al., 2013). So far, no changes have been reported in the energetic budget of humpback whales (Megaptera novaeangliae) in feeding grounds during whale watching (Di Clemente et al., 2018). Understanding behavior variability and underlying changes in physiology can provide knowledge to establish links between short and long-term consequences of disturbance on species of cetaceans (New et al., 2015; Pirotta et al., 2018).
The humpback whale is one of the most popular species for whale watching (O’Connor et al., 2009). A suite of negative effects in response to whale-watching boats, such as the alteration of surfacing and diving behavior, aerial activity, acoustic behavior, and swimming speed (e.g., Corkeron, 1995; Scheidat et al., 2004; Sousa-Lima and Clark, 2008; Stamation et al., 2010; García-Cegarra et al., 2019) have been documented on the species. Humpback whales migrate from polar and temperate feeding grounds to tropical and subtropical breeding grounds (Dawbin, 1966). In the latter, humpbacks whales typically do not feed (Chittleborough, 1965), and depend on the energetic reserves stored in the blubber layer, muscles, visceral organs, and bones (Nordøy et al., 1995; Gunnlaugsson et al., 2020) acquired during the feeding season. Although feeding events have been observed in breeding and migratory routes (Stamation et al., 2007; Frisch-Jordán et al., 2019; De Weerdt and Ramos, 2020), energy intake is limited or absent during the breeding season.
Here, we investigated the effect of whale-watching boats on the energy consumption and efficiency of humpback whales in the coast of northern Peru, Southeast Pacific. This population is also known as stock G (IWC, 1998), and its breeding ground ranges from northern Peru to Costa Rica (Scheidat et al., 2000; Acevedo et al., 2017; Valdivia et al., 2017) and possibly up to Nicaragua (De Weerdt et al., 2020). Respiratory rates have been used to estimate the mass-specific cost of transport (COT), for large animals under undisturbed and disturbed conditions (Williams and Noren, 2009; Langman et al., 2012; Christiansen et al., 2014a; Maresh et al., 2014). This metric includes the mass and transport as a relative measure of the metabolic rate. COT can provide insights about the overall energy expenditure during movements, and how efficiently the energy is used relative to the distance traveled (Tucker, 1970). An optimal range of transport can then be estimated based on the range of swimming speeds where the COT is reduced to its minimum. Thus, variation in COT could be a useful proxy to understand the physiological effects of whale watching on cetaceans. We predicted that approaching whale-watching boats to whales would lead to an increase in energy consumption by increasing swimming speeds and breath frequencies.
Materials and Methods
Study Area
Daily land-based surveys were performed from a rocky cliff named “Cerro La Mesa” at 31 m above the sea level. From this position, we covered a panoramic view of 7 km of radius (153km2 of area) of the coastal area between El Ñuro (4°13′01″S, 81°10′35″W) and Máncora (4°06′26″S, 81°02′50″W), where whale-watching activities are conducted (Figure 1). Observation of whales and boats were performed daily, between 07:00 and 10:00 from July 17th to August 29th and from September 5th to October 15th in 2016. During the study period, weather conditions were favorable during 95% of the survey days with visibility of 6 to10 km. Sea conditions allowed the tracking of whales throughout the study period with Beaufort states between 0 (34%) and 1 (66%). The area has been described as the Southern limit of the breeding ground of Stock G with the season ranging from mid-July to the end of October (Pacheco et al., 2009; Guidino et al., 2014).
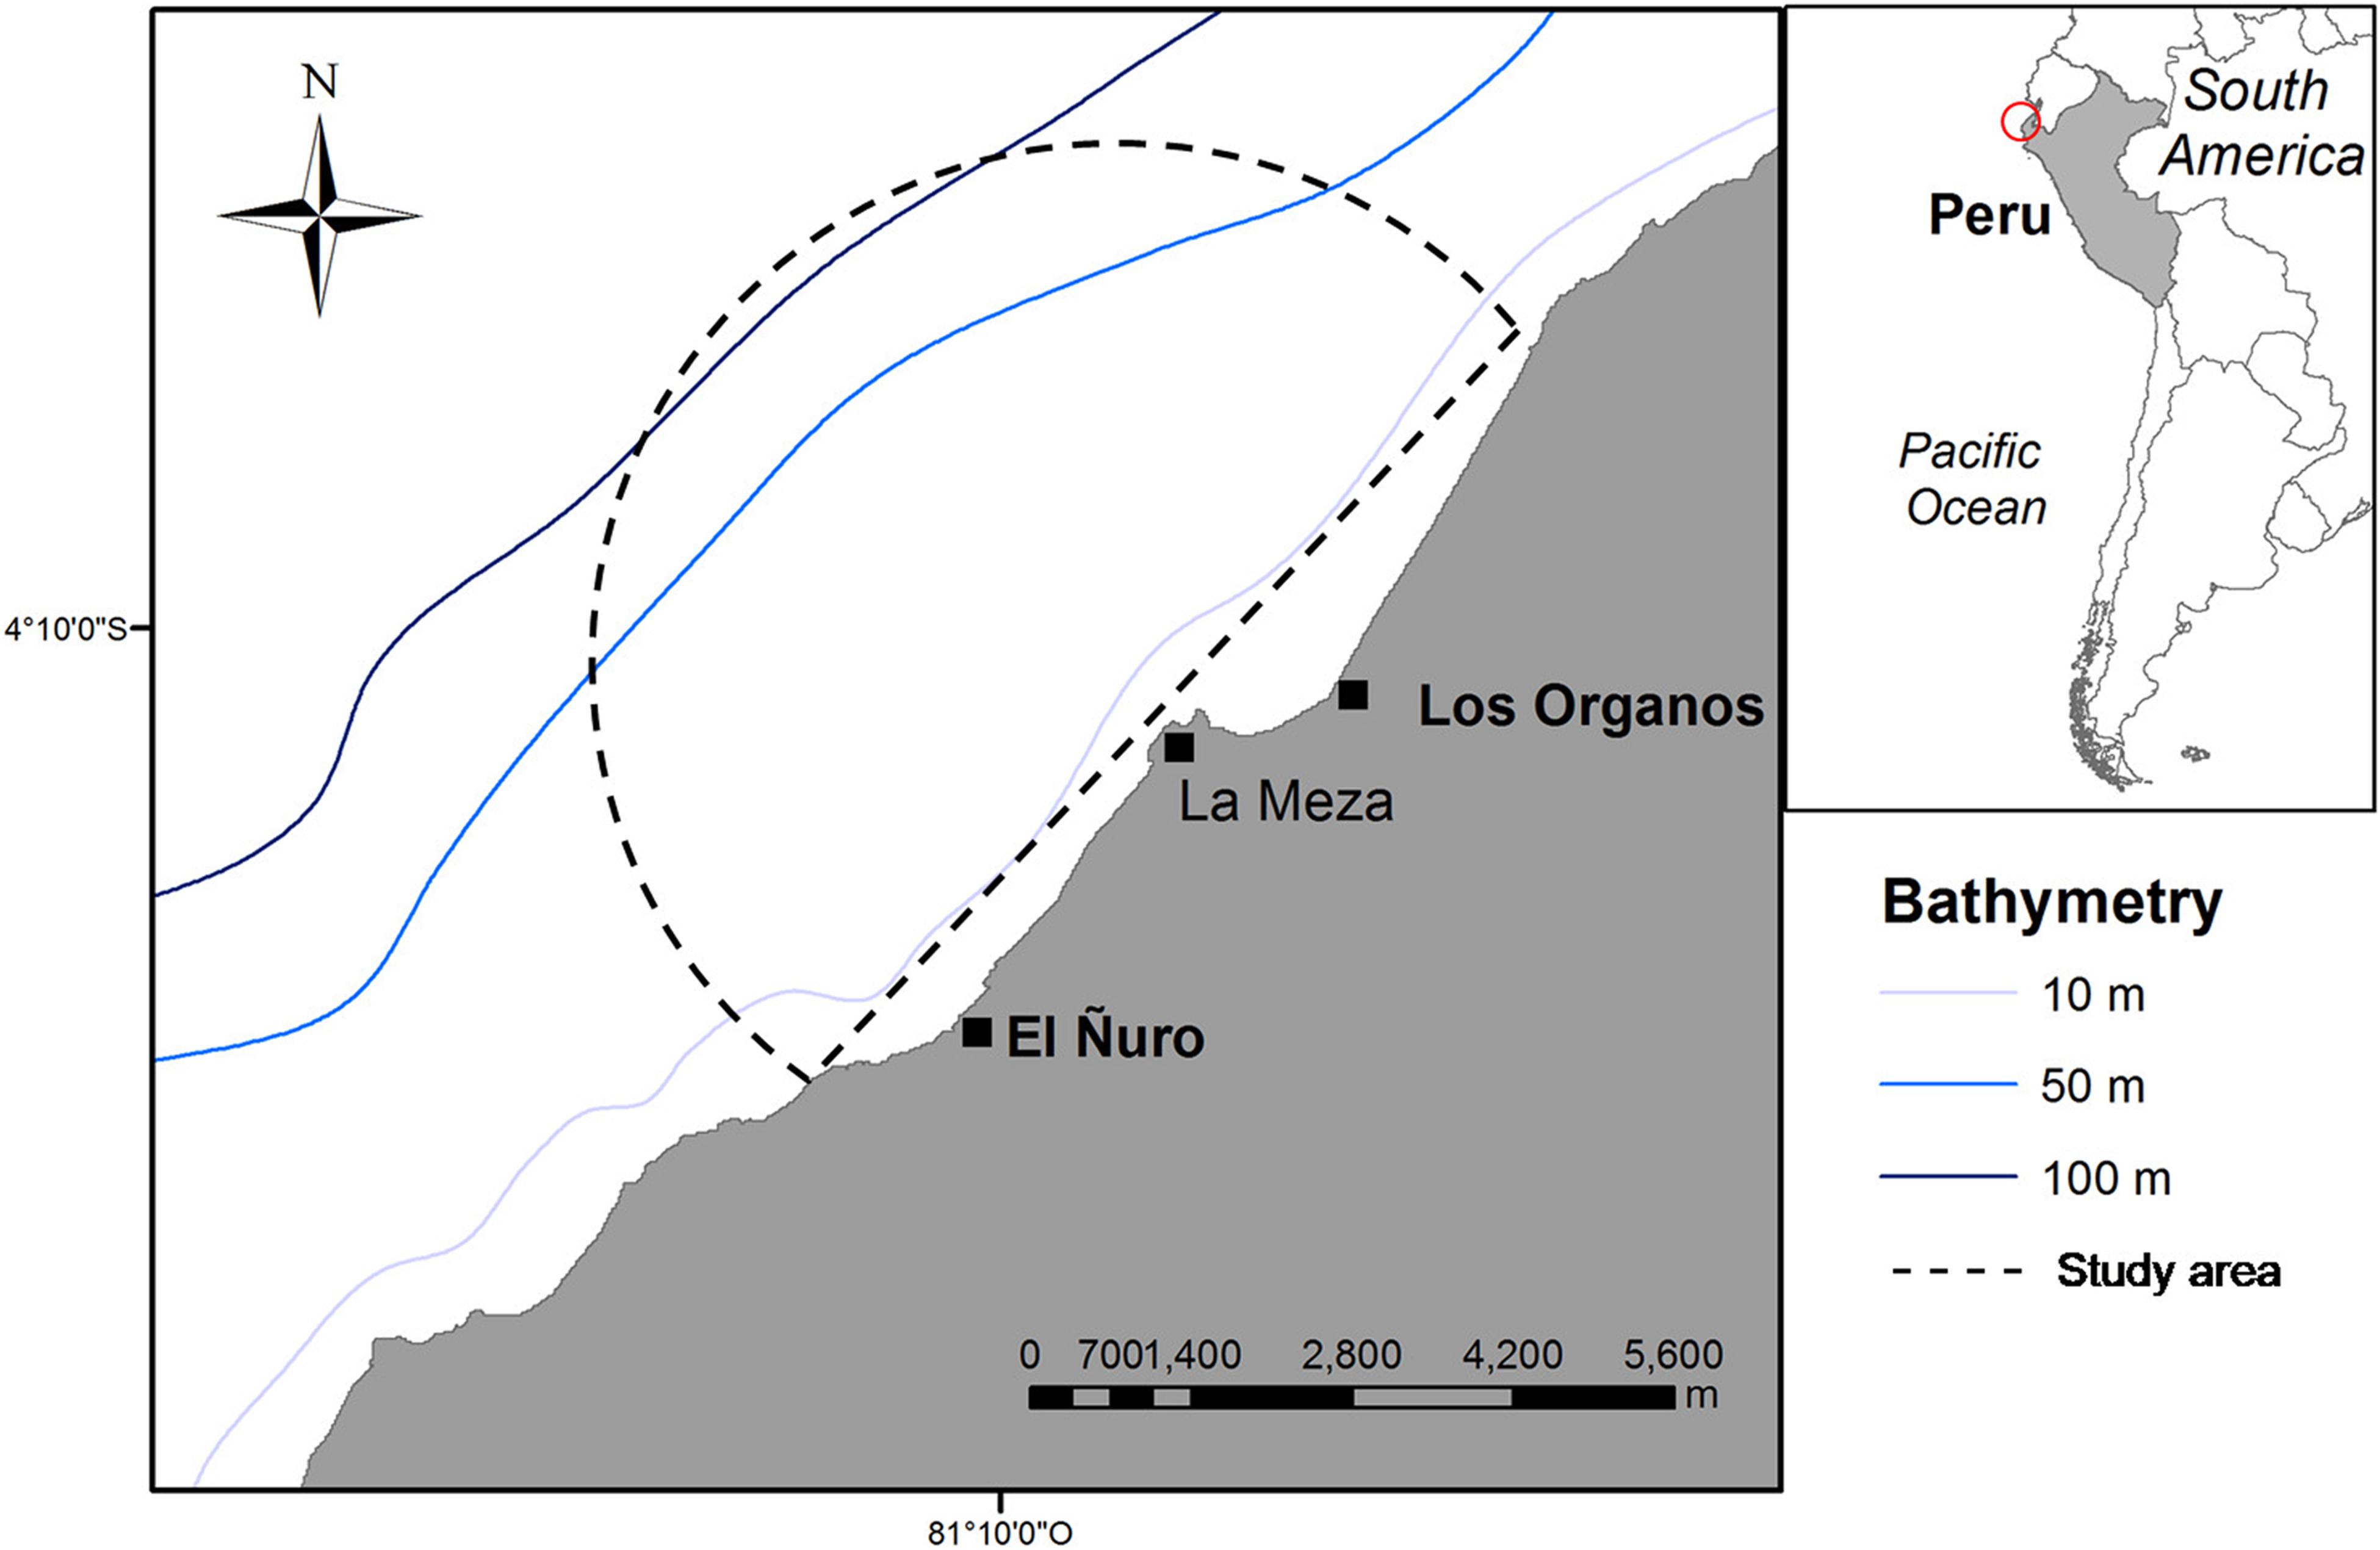
Figure 1. Location of the studied area. Semi-circle represents the 7 km vision range from the observation point at “Cerro la Meza.”
Sampling Methods
Groups of humpback whales were recorded by continuous focal group follows (Altmann, 1974) using a digital theodolite (Nikon NPL-322, Nikon Trimble, Tokyo, Japan) and 15×50 Nikon binoculars. A group was defined as individuals of whales within 100 m distance of each other, moving in the same direction and displaying almost synchronized diving and movement patterns (Whitehead, 1983; Mobley and Herman, 1985). Calves were identified as whales with sizes ranging from one to two-thirds of the size to their accompanying adult, assumed to be the mother (Herman and Antinoja, 1977; Mobley and Herman, 1985). Groups of humpback whales were classified into two main categories: groups with calves and groups without calves. Mother-calf and mother-calf with one or more escorts were considered as groups with calves, while groups including only adults or sub-adults were considered as groups without calves (Supplementary Table 1 provides a description of all group categories). Tracking of focal groups started when both observers (DV and AGC) spotted humpback whales with binoculars. Once the group was spotted and followed unequivocally for more than 10 min, the group was chosen as a focal group for tracking. The type of group and number of individuals was defined at the initial sighting and confirmed during the tracking. If the focal group splitted, one of the groups was chosen to continue tracking. When groups merged, the tracking continued for the focal group. However, this type of variability in the dynamics of the groups was not included in the analysis of this study.
Horizontal and vertical angles were recorded, based on a georeferenced reference point, for each emergence of the focal group using the digital theodolite. Using the sinus theorem, elevation, and coordinates of the reference point, the angles were converted into geographic coordinates and geographic tracks for each focal group. The specific details of the methodology are provided in García-Cegarra et al. (2019) including the geographic position of the tracks. A preliminary analysis of track accuracy was carried out by tracking a moving boat and recording its position every 5 min. A measurement error of 35 m for distances >4.5 km was estimated (Romero, 2015) and used to correct all geographic calculations. For groups with more than one adult, the first adult emerging to the surface was considered as reference for the overall group movement. The total distance traveled by each group was calculated as the sum of distances between each recorded surfacing location. Simultaneously, the number of breaths of each whale, the number of boats (when present), and the time surfacing of the whale group were recorded.
The distance between focal groups and whale-watching boats was measured using the digital theodolite, following the same method as for the focal groups. We considered an interaction threshold of 400 m distance between whales and boats following Baker and Herman (1989). However, behavioral changes can occur before boats enter this threshold distance (e.g., Watkins, 1986; Baker and Herman, 1989; Sprogis et al., 2020a). Sprogis et al. (2020b) demonstrated that vessel noise drives the behavioral response of humpback whales to boats. Although, we recorded the number of boats and their timing with the whales, the limitations imposed by the distance of the land-based survey, precluded us to unravel the role of noise of the boats on the behavior of the whales.
To measure the swimming speed and breath frequency of whales in the presence and absence of whale-watching boats, a minimum of 10 min of interaction was determined as lower time threshold. This value was determined to increase the precision of the measurements and to reduce the amount of interaction events inadequate for estimations. For example, for whales emerging every 8–9 min, the presence of a whale-watching boat for less than 10 min would only allow to register one emergence. This would only provide one record of breath thus traveled distance, and swimming speed cannot be estimated. Even though, whale responses to approaching boats may occur in a shorter period of time (<10 min), we assumed that these short burst events are unlikely to have an important impact on the overall energy efficiency. To avoid underestimation and bias in traveled distance, swimming speed and breath frequency estimations, only relative linear tracks were used in the analysis (Christiansen et al., 2014a). Tracks with whales logging at the surface were also removed from the analysis. Based on the presence and absence of whale-watching boats, focal groups were divided into three independent scenarios: before, during, and after the presence of whale-watching boats. Data from groups tracked before-during, during-after or before-during-after the presence of boats were divided into two and/or three dependent observations, respectively. For example, a before-during track was divided into two data observations, one going to the before scenario and the other to the during scenario. Tracks with the boat always present or absent provided one measurement each, while tracks before-during; during-after or before-during-after, provided 2 or 3 measurements, respectively.
The average swimming speed (S) of the focal groups was calculated by dividing the sum of the distances traveled between all emergence positions by the total time of the track. Breath frequencies (f) of humpback whales was calculated by dividing the total number of breaths per individual by the total time of the track. For groups with two or more adult whales, the total number of breaths was recorded for the group and finally divided by the number of adults to obtain the individual breath frequency. For groups with calves, breath frequencies and swimming speeds were calculated based only on the adult’s behavior. This study was carried out under the approval of the Comité de Ética de Investigación Científica de la Universidad de Antofagasta, Chile (CEIC REV N° 039/2017 and 7298/2015).
Data Analysis
Mass-Specific Cost of Transport Estimation
The calculated swimming speed and breath frequency were used to calculate the mass-specific cost of transport (COT) following the methodology described in Christiansen et al. (2014a). Supplementary Table 2 shows a summary of the parameters, equations, theoretical values, and references used for the estimation of COT in humpback whales.
The respiratory volume per minute, Vmin (l × min–1, the volume of air breathed per minute) was calculated from the measured breath frequency, f (breaths × min–1) and the tidal volume, Vt (l × breath–1, volume of air inhaled per respiratory cycle.
The tidal volume for humpback whale was assumed to be 60% of the volume or lung capacity, Vc (Wahrenbrock et al., 1974; Blix and Folkow, 1995).
The lung capacity (Vc) was estimated from the body mass of the humpback whale (Dolphin, 1987).
The body mass, W (kg), was estimated from the average length (Lockyer, 1976). L refers to the length of the whale in meters. The average size (12.2 m) for both sexes based on humpback whale catch data of Peru, between 1961 and 1966, (Ramírez, 1988) was used for this purpose, resulting in average weight for individuals of both sexes of 25 317 kg.
The oxygen consumption rate, VO2 (l O2 × min–1, volume of oxygen consumed per minute) was estimated from the respiratory volume per minute (Vt), the oxygen concentration in the air, PO2 (0.21, ratio of O2 in the inspired air) and the oxygen extraction rate, EO2 (Blix and Folkow, 1995). The oxygen extraction rate from the air in the lungs during a respiratory cycle was established at a value of 45% (Wahrenbrock et al., 1974; Blix and Folkow, 1995).
The metabolic rate, MR (J × min–1), energy consumed per minute, was estimated by transforming the oxygen consumption rate VO2, into energy units using the conversion factor 20.1 kJ × lO2–1 (Blix and Folkow, 1995).
Finally, the Mass-Specific Cost of Transport (COT; J × [kg × m]–1), energy consumed per kilogram of body weight and per meter displaced, was calculated based on the metabolic rate, MR (J × min–1), swimming speed, S (m × s–1) and body mass of humpback whales, W (kg) (Sumich, 1983; Culik et al., 1994; Williams and Noren, 2009).
Only adult whales were used in the analyses, to avoid confounding effects of growth on the metabolic rates. COT for calf groups was estimated from the breath frequency and swimming speed of the adult individual in each group (e.g., the mother). Even though this data would not reflect new-born metabolism, we assumed that the changes in behavior and metabolism of the adult/s in a group with calves could be an indirect proxy of the stress that the calf faces during whale watching.
Statistical Analysis
Effect of Whale-Watching Boats
We hypothesized that breath frequency and swimming speed will increase while COT decreases between before and during scenarios and return to normal conditions after the boats have left. Higher number of boats and longer times spent with the whale groups will increase the mentioned effect in the three variables during the activity. To test the differences in the breath frequency, swimming speed and mass-specific cost of transport, three regression models were developed using an estimation procedure based on generalizing estimating equations for the generalized linear models (glm) and for the normal model. Normality of the variables was obtained after a log transformation for breath frequency and swimming speed and a logit transformation for COT. Observations of the same groups of whales (e.g., Before-During) were not independent, thus an exchangeable correlation structure was used for these observations. Each model tested the effects of the scenario (before, during, after) and calf presence on the breath frequency, swimming speed and COT. We analyzed the effect of the presence of calf on each of the models as several studies have already reported significant differences in behavior between groups with and without calves (Corkeron, 1995; Stamation et al., 2010; Craig et al., 2014; Sprogis et al., 2020a). The effect of the number of boats and time spent with the group of whales in the three variables was tested for the during and after scenarios. The estimations were performed using the geepack (Højsgaard et al., 2006) package in R (R Core Team, 2020) version 4.0.2.
Energy Efficiency
Non-linear regressions were performed between COT and swimming speeds values to determine whether these variables follow a U-shaped curvilinear relationship (Schmidt-Nielsen, 1972) as it has been documented for other marine mammals species (Figure 2, e.g., Williams et al., 1993; Otani et al., 2001; Rosen and Trites, 2002; Williams and Noren, 2009). The curve indicates that optimal speed ranges of transport can be detected when COT reaches its minimum values due to higher efficiency in the consumption of energy for displacement. However, when swimming speed increase beyond this range, the breath frequency increases disproportionally due to an increasing oxygen demand. This drastically reduces the energetic metabolism efficiency during transport and can be observed as an inflection point followed by an exponential increase of the COT values. Similarly, when analyzing the link between swimming speed and breath frequency, the onset of energetic inefficiency can be observed by an exponential increase of the breath frequency when speed exceed its optimal range (Williams et al., 1993; Yazdi et al., 1999). Linear regressions between swimming speed and breath frequency were performed to determine the relationship between the two variables. All tests and statistical analyses were performed using R version 4.0.2.
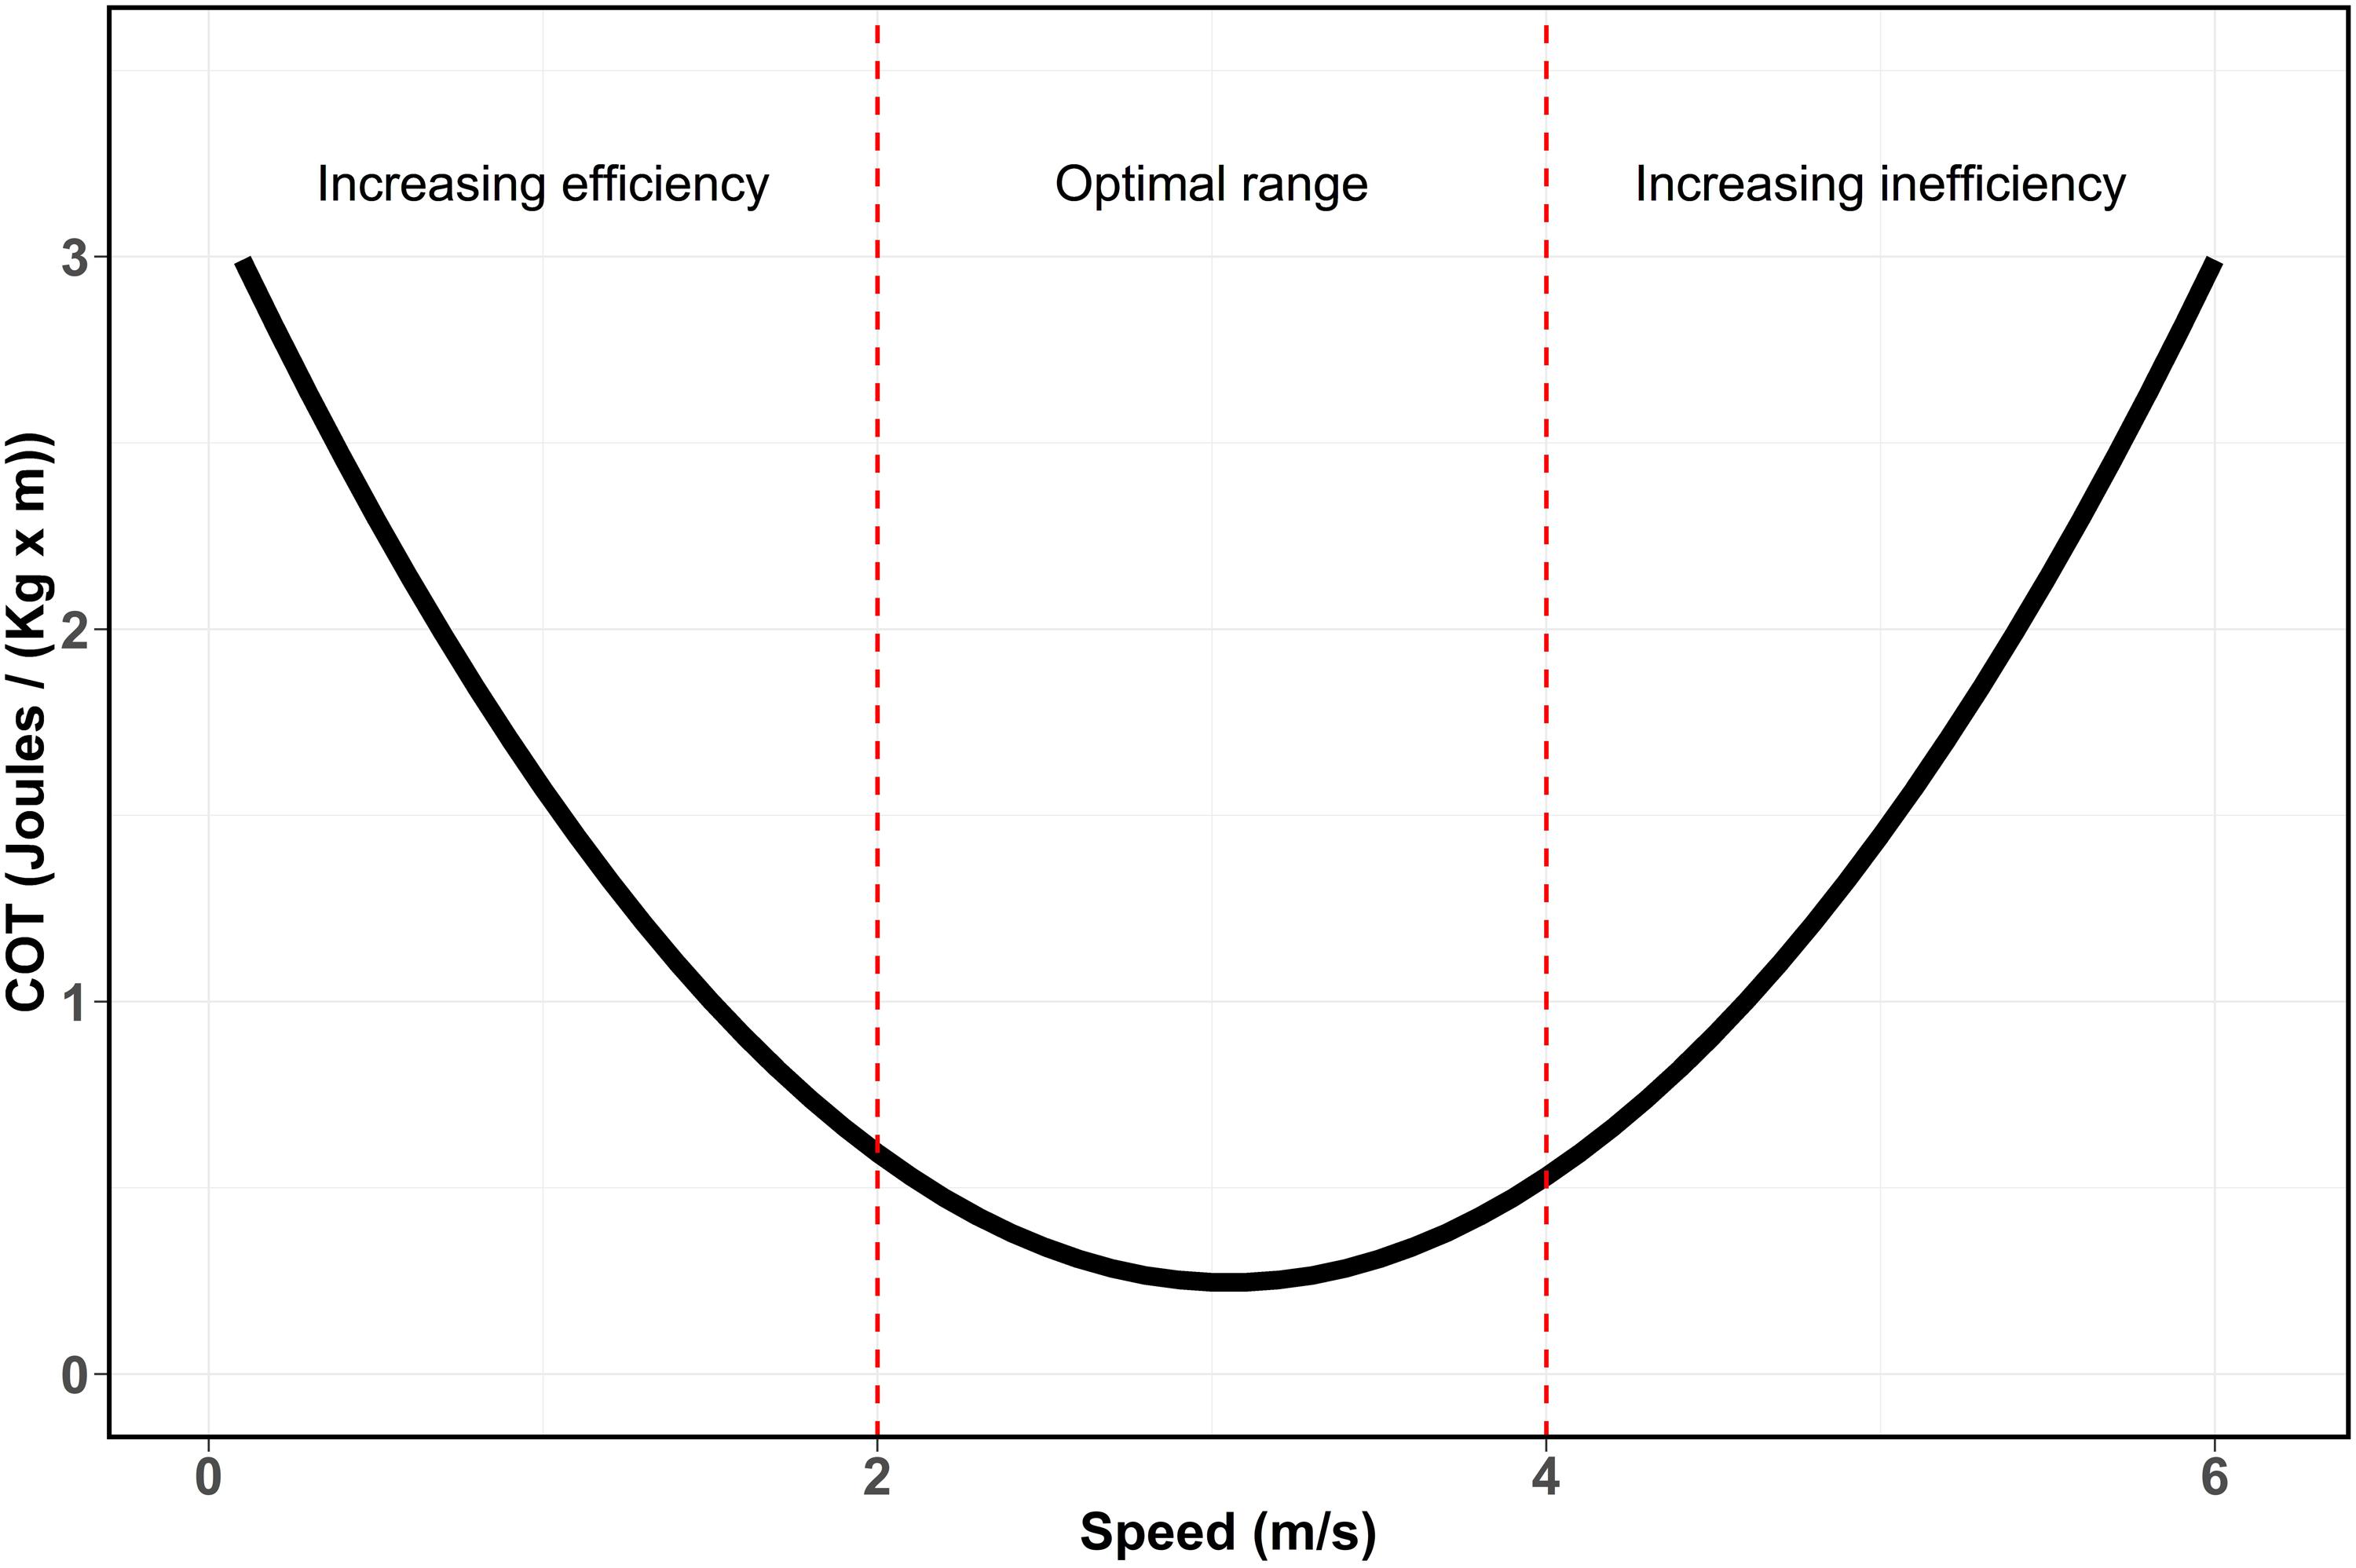
Figure 2. U-shaped curve (Schmidt-Nielsen, 1972) showing the relationship between speed and cost of transport based on energetic efficiency. Red dashed lines represent the theoretic division of the curve based on metabolic efficiency. Increasing swimming speed, increase the energetic efficiency by reducing the COT. This reduction continues until the optimal range of transport, where the maximum efficiency and minimum COT are reached. Finally, when speeds continue to increase, COT increases rapidly leading to an increasing energetic inefficiency.
Results
A total of 167.4 h of survey were completed. 132 h were used to visually follow focal groups; 39% (51.5 h) without and 61% (80.5 h) with whale-watching boats. A total of 412 humpback whales were followed in 173 focal groups: 91 groups without calves and 82 groups with calves (Table 1). From the 173 focal groups, 67 and 48 whale groups were tracked with boats always absent and absent, respectively. Also, 29, 20, and 9 groups were tracked before and during; during and after; and before, during, and after the presence of boats, respectively. Dividing groups into their respective encounter scenarios and adding the tracks where boats were always present (during) or absent (before), a total of 105, 106, and 29 breath frequency, swimming speed and COT measurements were, respectively, obtained for the encounter scenarios before, during, and after (Table 1). A mean of 3.13 (SD = 1.52; range: 1–9) and a maximum of 9 whale-watching boats were observed with the focal groups. On average boats followed groups of whales during 48.32 min (SD = 25.15 min, range: 13–125 min) and keeping an average minimum distance of 39.26 m (SD = 47.21 m, range: 6–125 m).
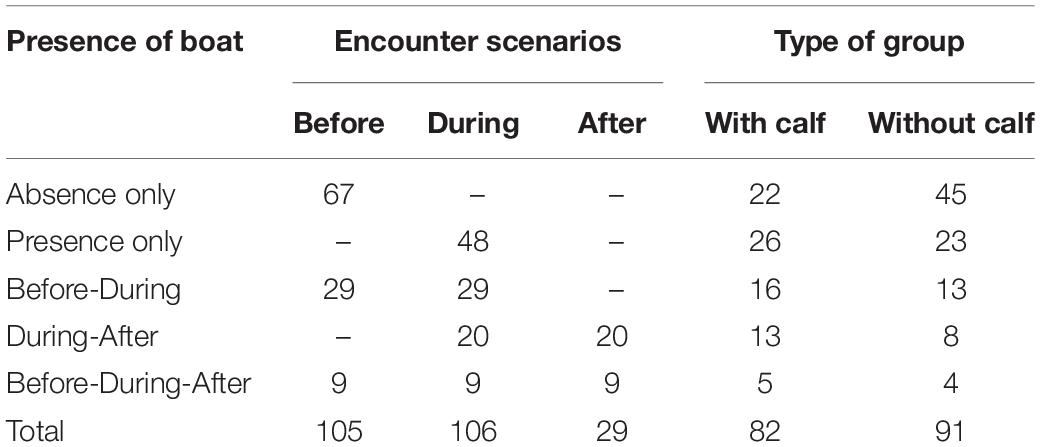
Table 1. Summary of the number of tracks registered per scenario and type of group (with/without calf).
Significant differences between groups with calves and without calves were found for breath frequency and swimming speed. Based on significant coefficients, groups without calves registered breath frequencies and swimming speeds 18.43 and 25.78% higher, respectively, than groups with calves (Tables 2, 3). Groups without calves breathed and swam at median values of 0.67 (IQR = 0.45) breaths × min–1 and 1.68 (IQR = 0.76) m × s–1, while groups with calves breathed and swam at median values of 0.561 (IQR = 0.34) breaths × min–1 and 1.3 (IQR = 0.82) m × s–1, respectively. No significant differences were found for the mass-specific cost of transport [COTwithoutcalf = 0.045 (IQR = 0.04); COTwithcalf 0.047 (IQR = 0.041) J × [kg × m]–1] between the these groups (Tables 3, 4).
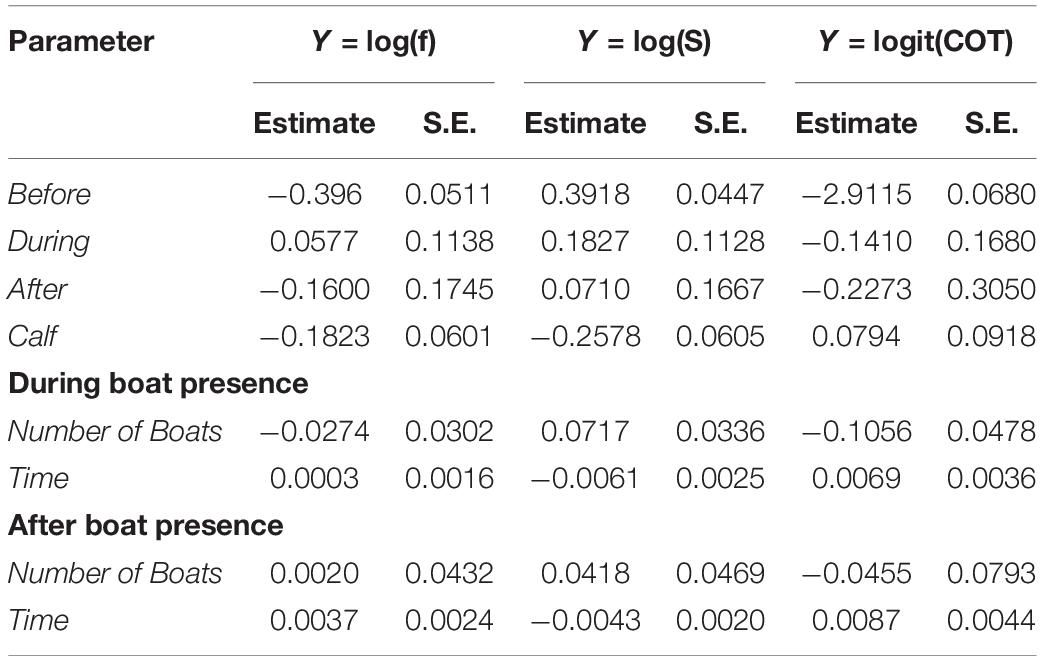
Table 2. Estimated coefficients and standard error (S.E.), for each of the parameters of the models developed for breath frequency (f), swimming speed (S), and mass-specific cost of transport (COT).
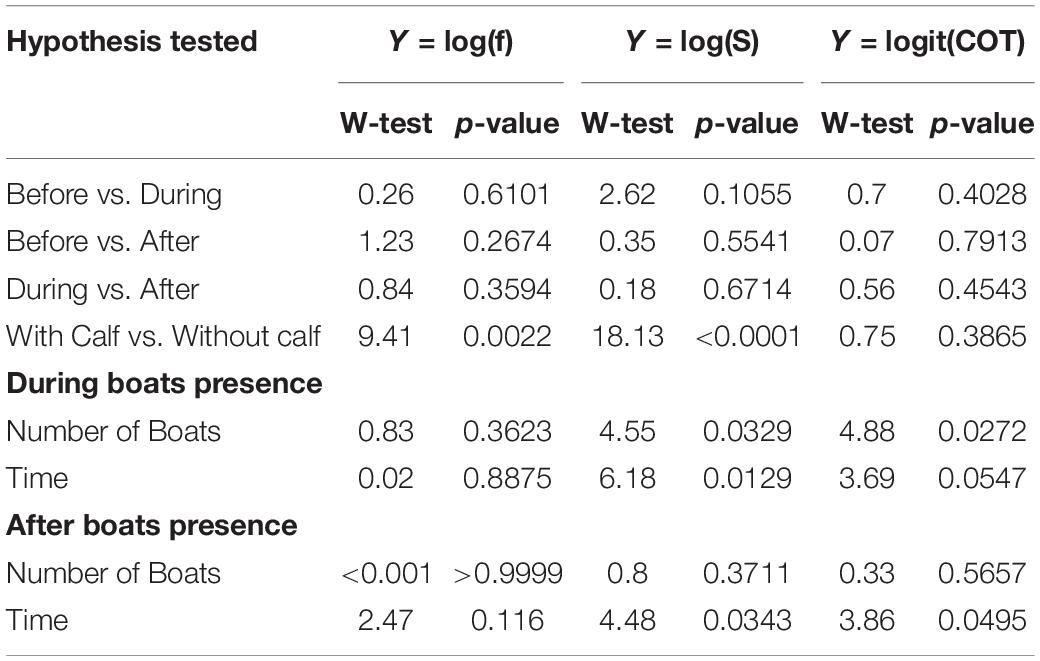
Table 3. Wald-test and p-values for each the hypothesis tested for the models developed for breath frequency (f), swimming speed (S), and mass-specific cost of transport (COT).
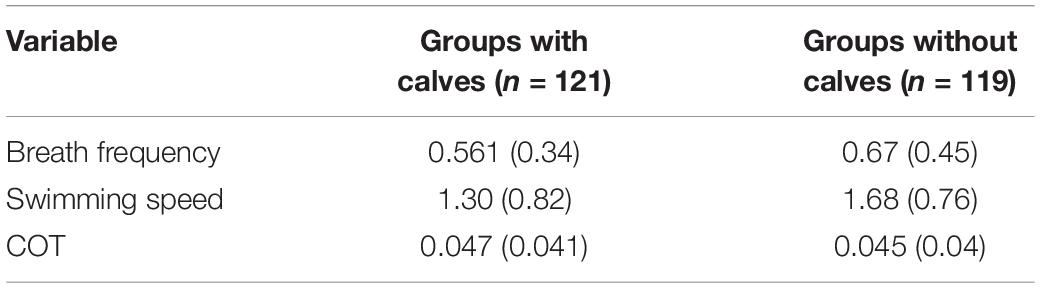
Table 4. Median (Interquartile range) values for groups with and without calves of humpback whales. n = number of observations.
Effects of Whale-Watching Boats
Breath frequency, swimming speed, and COT, did not change significantly between before and during the presence of whale-watching boats. Likewise, no significant differences in breath frequency, swimming speed and COT were found between before and after, or between during and after (Table 3). The number of boats present, and the duration of interactions had a significant effect on breath frequency, swim speed and COT. Each additional boat with the whale group (e.g., from 2 to 3 boats) led to a 7% increase of the median swimming speed and a 10% reduction of the median COT. Furthermore, boats spending more time with a whale group led to a reduction of the speed of the groups, as each additional minute spent with the whale groups represented a significant 0.5% decrease in the median of swimming speed. This effect was present even after the boat left, as each additional minute spent with the whale group lead to a significant 0.4% in the median of swimming speed (Tables 2, 3).
Energetic Efficiency
Groups with and without calves showed the same pattern; high COT values at low swim speeds (Figure 3). Increasing swimming speeds led to a significant decrease in the COT, following a power function in groups with calves (Figure 3A, COT = 0.069 × S–0.95, pseudoR2 = 0.63) and without calves (Figure 3B, COT = 0.085 × S–1.05, pseudoR2 = 0.53). Changes in swimming speed explained between 53 and 63% of the variation of the COT values. Minimum COT was registered between 2 and 3.2 m × s–1 for groups with calves and between 2 and 4.05 m × s–1 for groups without calves, determining mass-specific costs of transport between 0.023–0.036 and 0.020–0.041 J × [kg × m]–1, respectively. However, the true minimum COT values remain unknown as no inflection point, where COT is excepted to increase, was detected during the movement of groups with and without calves.
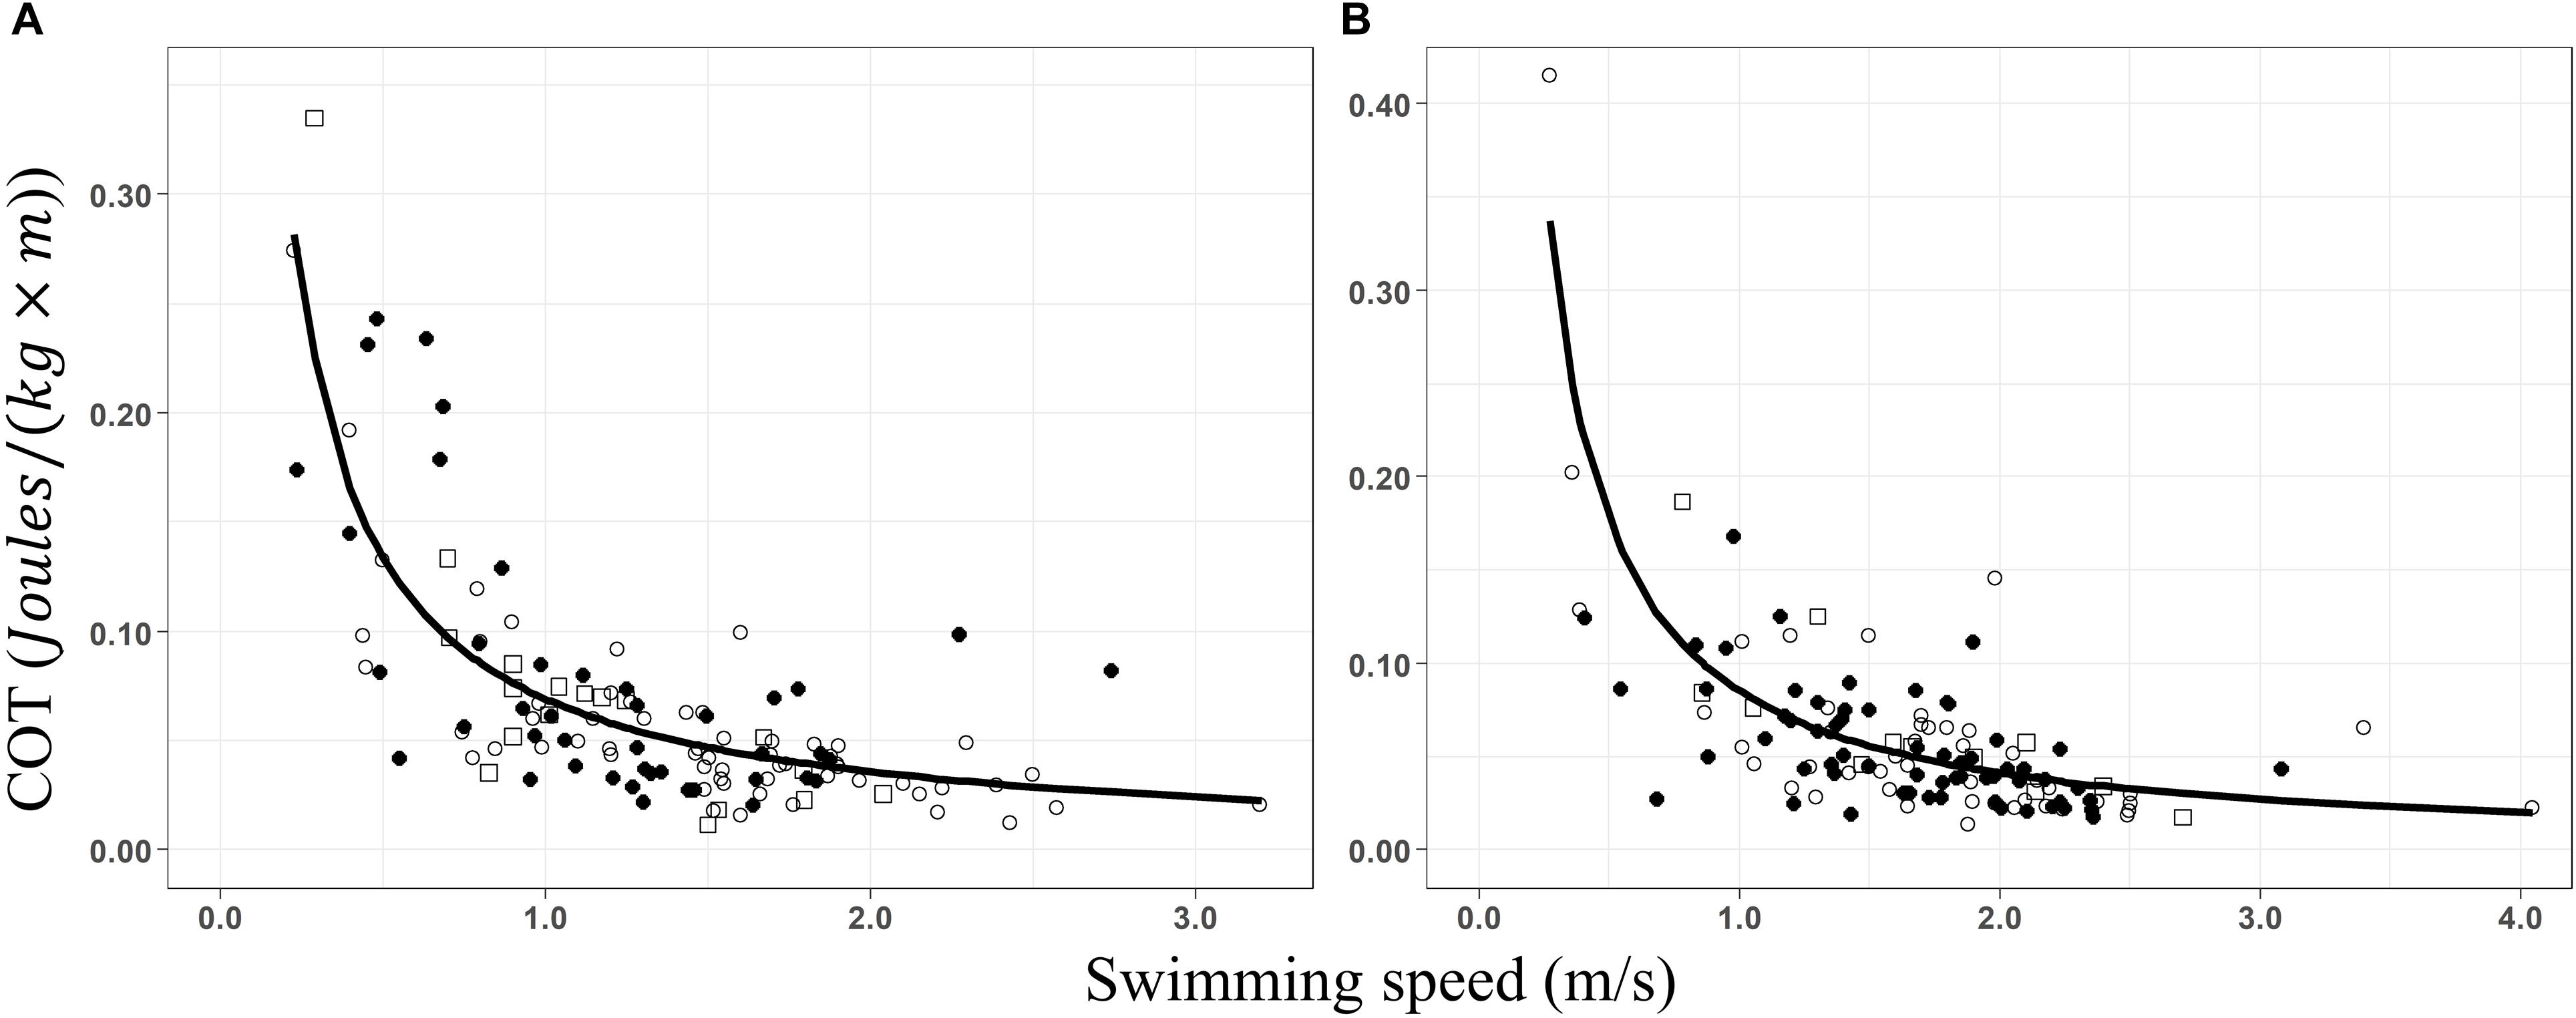
Figure 3. Non-linear regressions of the mass-specific cost of transport (COT; J × [kg × m]– 1) as a function of the swimming speed (m/s) for (A) groups of whales with calves (COT = 0.069 × S– 0.95, R2 = 0.63) and (B) groups without calves (COT = 0.085 × S– 1.05, R2 = 0.53). Data from before (○), during (•), and after (□) the presence of the whale-watching boats.
While the presence of whale-watching boats did not lead to significant increases in the breath frequency of humpback whales, breath frequency increased linearly with swimming speed (Figure 4 f= 0.57+0.07 × S; R2 = 0.018; F-stat = 2.17; p-value = 0.03), at a rate of 0.07 breaths × min–1 for every m × s–1 increase in swim speed. However, breath frequency in humpback whale groups might be influenced by other factors, as only 1.8% (R2: 0.018) of its variability was explained by changes in swimming speed.
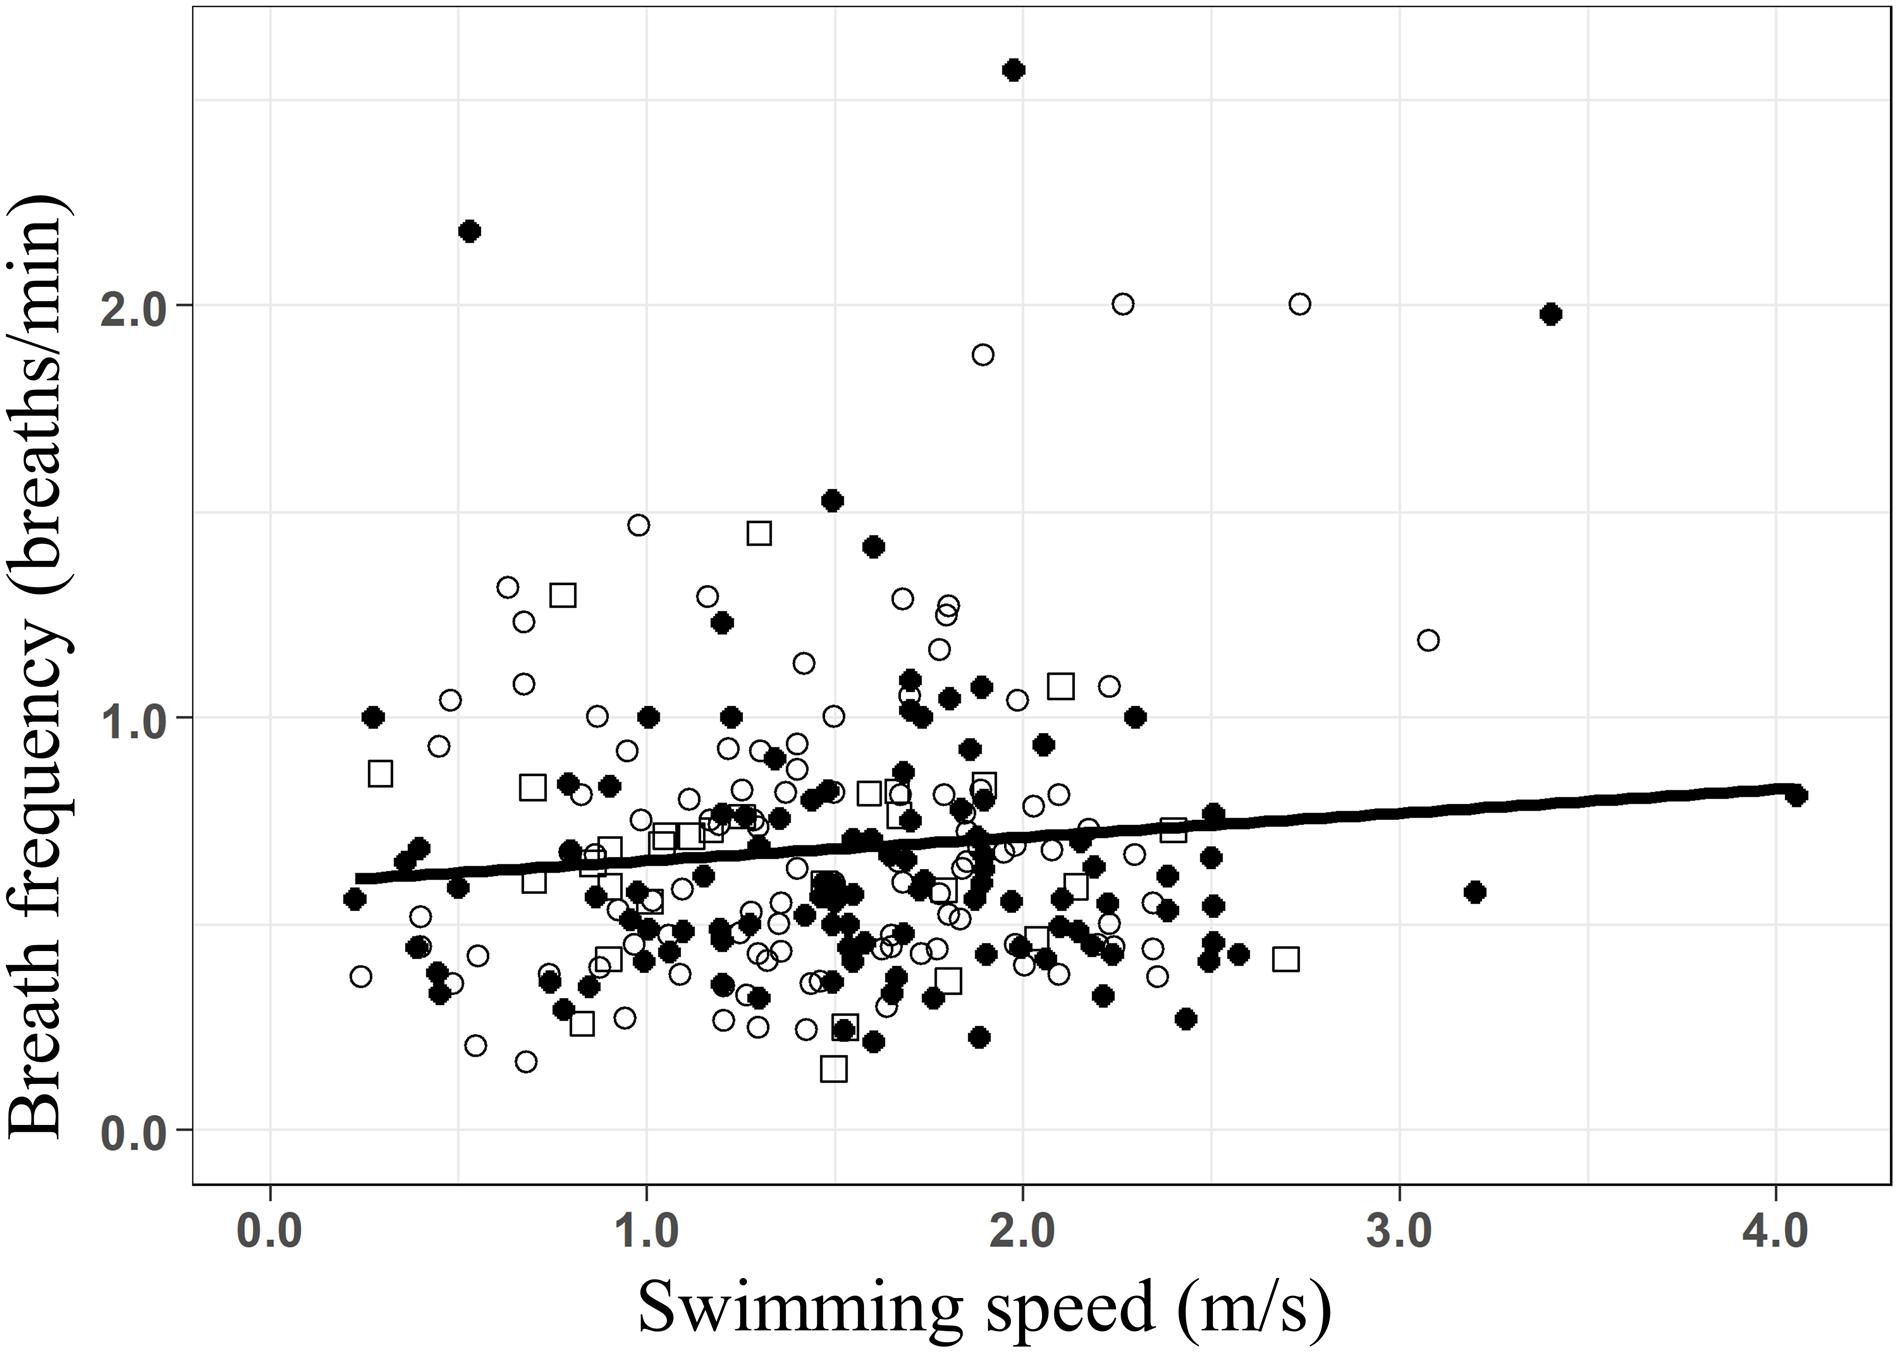
Figure 4. Linear regression of the breath frequency (breaths/min) as a function of the swimming speed (m/s) for all groups of whales (f = 0.57+0.07 × S; R2 = 0.018; F-stat = 2.17; p-value = 0.03). Data from before (○), during (•), and after (□) the presence of the whale-watching boats.
Discussion
Behavioral responses to whale-watching boats can potentially lead to an increase in the metabolic rate in cetaceans due to an increase in breath frequency and swimming speed (e.g., Christiansen et al., 2014a). Our results suggest that the mere presence of whale-watching boats does not lead to significant behavioral changes, but as the number of boats increased, so did the breath frequency and swim speed of the whales. Energy expenditure during transport remains near optimal values. No increments in mass-specific cost of transport were recorded and breath frequencies continued to increase linearly within the range of measured swimming speed.
When assessing the impact of whale-watching boats on humpback whales, typically breath frequencies, and swimming speeds have been estimated (e.g., Scheidat et al., 2004; Morete et al., 2007; Stamation et al., 2010). Both slower swimming speed and lower breath frequencies have been often reported for groups with calves (Carvalho-Gonçalves et al., 2018; Bejder et al., 2019). Mother and calf groups face physical and physiological challenges, because calves are learning social skills, have less muscle strength, and lung size compared to adults. This reduces their escape response capacity (e.g., fast swimming) when facing natural predators such as killer whales, harassment of competing adult males or whale-watching disturbance. In breeding grounds, calf groups inhabit shallow and calm waters to reduce disturbance by competitive adults (Smultea, 1994) and optimizes the energy transfer from the mother to the new-born during nursing (Cartwright and Sullivan, 2009; Sullivan and Cartwright, 2009; Videsen et al., 2017). Our minimal COT estimations for a 25,317 kg adult humpback whale, ranges around 0.023 J × [kg × m]–1 for groups with calves and 0.02 J × [kg × m]–1 for groups without calves. We developed a log-linear regression between body mass and COT values, using published values for other marine mammals including our results. Our estimates fitted into this regression (Figure 5, COT = 4.14–0.420 × log(W), R2 = 0.75, F-stat = 40.35, p = 3.653e–5), confirming that they occur within the expected range for an animal of 25,000 kg.
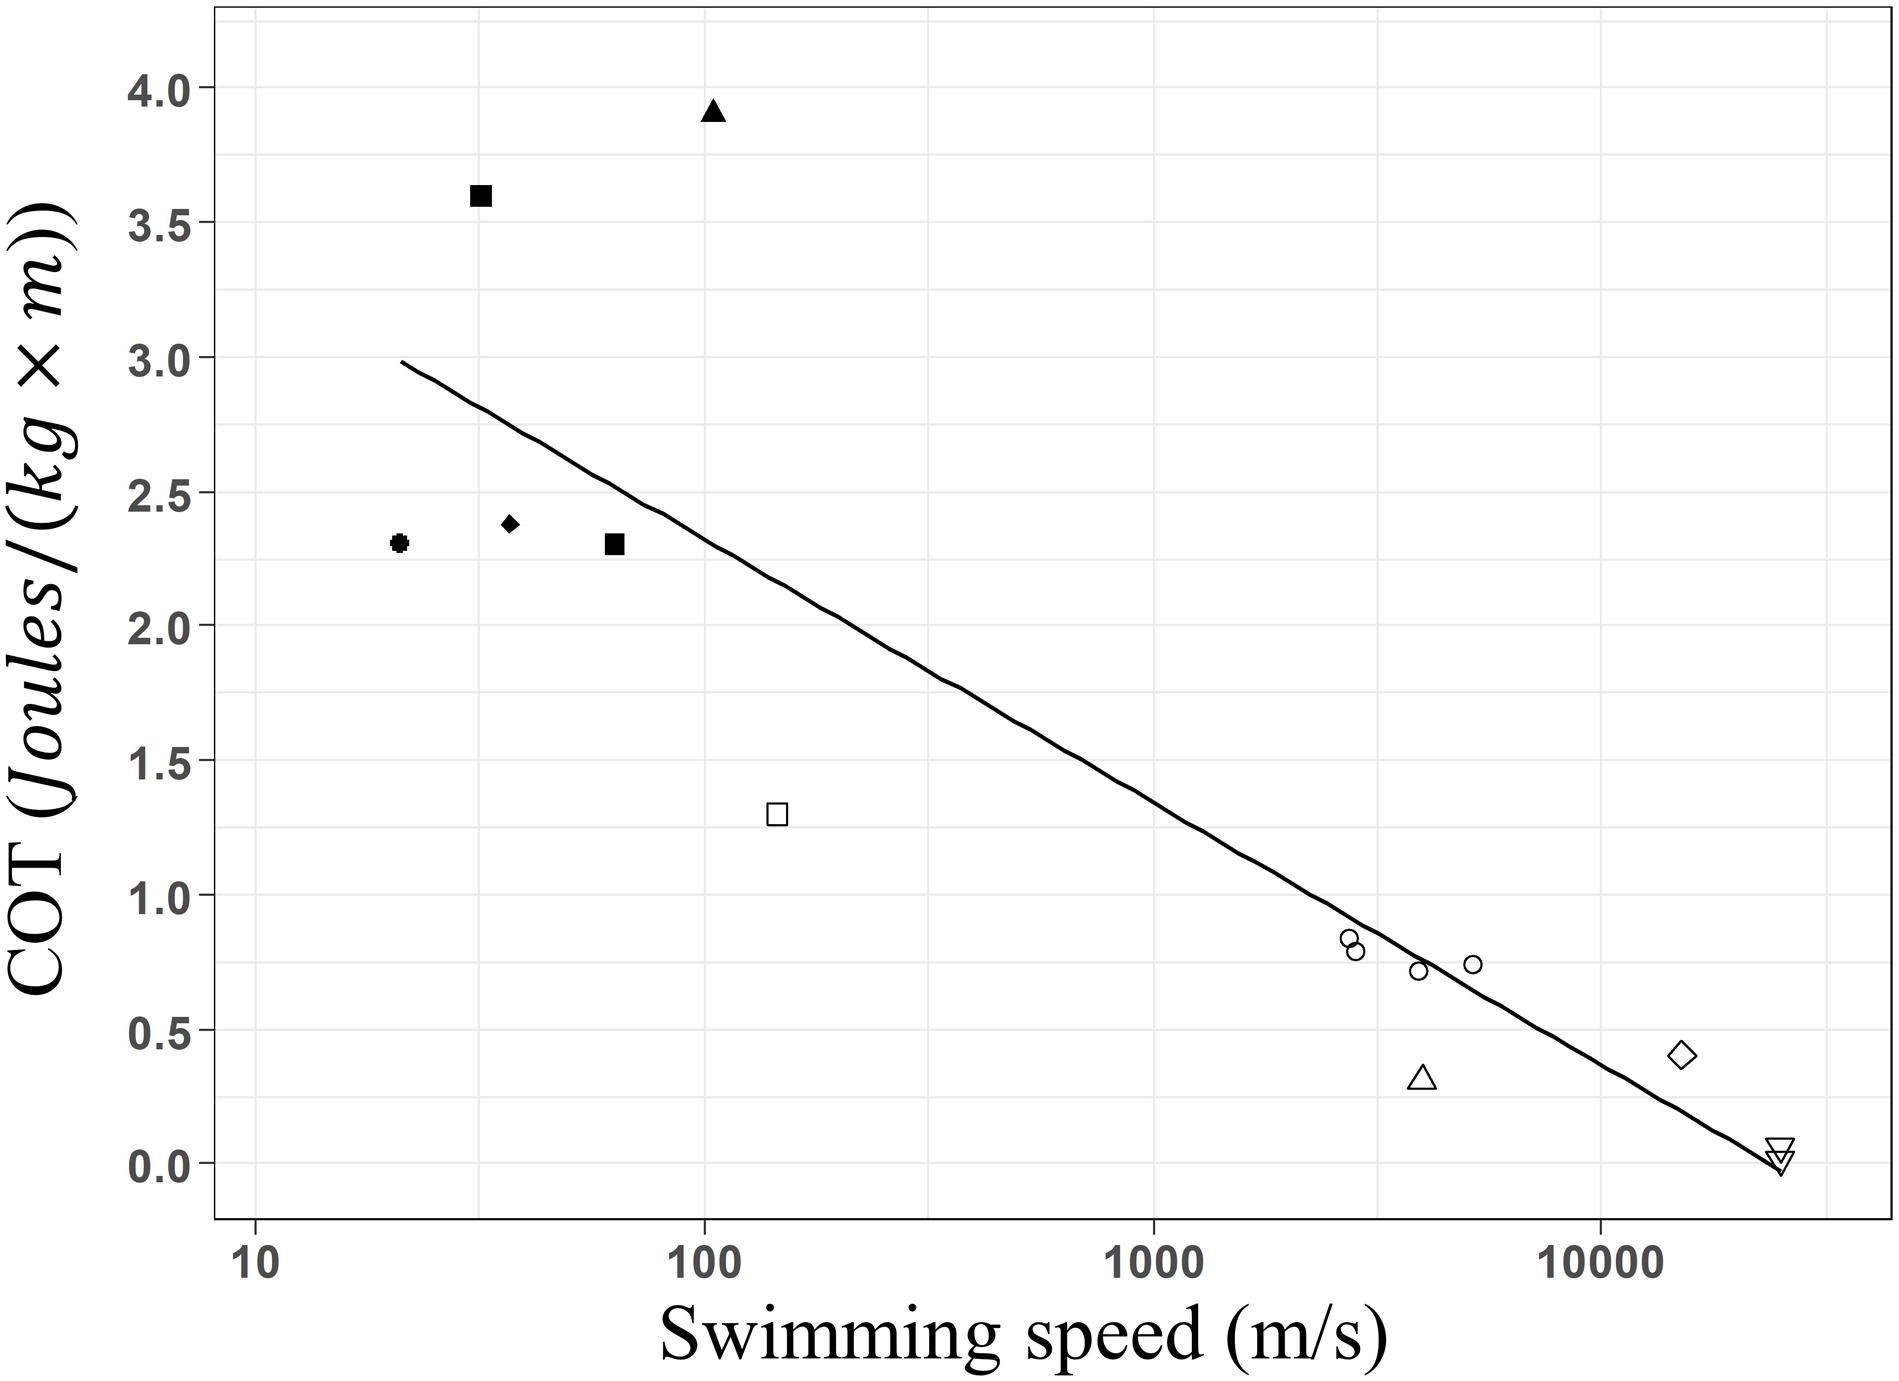
Figure 5. Linear regression between the estimated optimal mass-specific cost of transport and mass of cetacean species. California sea lion Zalophus californianus (•: Fedak and Seeherman, 1979; Williams et al., 1991; Williams, 1999), Harbor seal Phoca vitulina (■: Davis et al., 1985; Williams et al., 1991), Harbor porpoise Phocoena phocoena (◆: Otani et al., 2001), gray seal Halichoerus grypus (▲: Fedak and Seeherman, 1979), Bottlenose dolphin Tursiops truncatus (□; Williams et al., 1993), Killer whale Orcinus orca (○: Kriete, 1995; Williams and Noren, 2009), Minke whale Balaenoptera acutorostrata (△: Blix and Folkow, 1995; Christiansen et al., 2014a), Gray whale Eschrichtius robustus (◆: Sumich, 1983) and Humpback whale Megaptera novaeangliae (▽: present study). Minimum COT decreases linearly with weight of marine mammal species following the function: COT = 4.14–0.420 × log(W), R2 = 0.75, F-stat = 40.35, p = 3.653e– 5. Fitted values of the linear model are presented by the black line.
The Effects of Whale-Watching Boats
In contrast with results elsewhere (e.g., Corkeron, 1995; Scheidat et al., 2004; Schaffar et al., 2010; Stamation et al., 2010), the sole presence of whale-watching boats did not trigger changes in the behavior of humpback whales. However, each additional boat led to a significant 7% increase of the swimming speed, and consequently a 10% COT reduction. Similarly, a high number of whale-watching boats at less than 400 m induced killer whales to follow a more sinuous swimming path (Williams et al., 2002; Williams and Ashe, 2007) together with an increase in their swimming speed (Williams et al., 2002). Arguably a higher number of boats could result in a higher noise level. Higher noise levels can induce strong behavioral changes in humpback whales (Sprogis et al., 2020b). This can explain the differences in response of humpback in function of the numbers of boats observed in our study. Also, a high number of boats may lead to a lower degree of compliance with the voluntary guidelines for whale watching proposed for this region (Pacheco et al., 2011). Boats positioning themselves closer to the whales presumably to ensure the satisfaction of the tourist (García-Cegarra and Pacheco, 2017). Although this study did not gather information on specific features of the boats such as the type of engines, we recognize that different boat-engine configurations can lead to different noise levels, which may finally translate into different levels of disturbance. The time that boats spent with whales led to significant decreases in the swimming speed of groups of whales during and after the presence of the boat. The latter effect may be related to whale-watching boats performance. Groups of whales swimming at high speed will usually be sighted by boats for less time because they are more difficult to follow from a tour boat.
The data presented here fitted the first half of the typical U-shaped relationship between COT and swimming speeds. Increasing swimming speed, implies a reduction of breaths per kilometer traveled, hence reducing COT values and reaching a minimum when reaching the optimal range of transport. The second half of the U-shaped curve was not observed, as the recorded maximum swimming speeds (4.05 m × s–1) did not exceed the optimal range. Similarly, studies on harbor porpoises (Phocoena phocoena) (Otani et al., 2001), killer whales (Williams and Noren, 2009), and minke whales (Christiansen et al., 2014a) did not register the second half of the U-shaped curve. Conversely, Williams et al. (1993) and Yazdi et al. (1999) described the complete curve for bottlenose dolphins (Tursiops truncatus), showing that COT increases when reaching speeds beyond the optimal range. Both studies were performed by dolphins trained to reach specific speeds, in confined (e.g., dolphinarium) and open water (e.g., following boats). Our results suggest that such speeds may not be reached in natural conditions and individuals will tend to maintain energy efficiency during travel even when facing disturbance.
The optimal swimming speed estimated for humpback whales ranged between ca. 2 and the maximum speed recorded in our study, 4.05 m × s–1, generating minimum COT values between 0.020 and 0.041 J × [kg × m]–1. As no inflection point and subsequent increase of the COT were recorded, energetic efficiency was maintained during tracking. However, since the second half of the U-shaped curve was not detected, the upper limit of the optimal swimming speed range cannot be determined with accuracy. Records of humpback whales swimming at more than 4.05 m × s–1 would be needed to determine if the optimal range continues beyond our estimated range. Additionally, breath frequencies increased linearly with increasing swimming speed, confirming persistence of energetic efficiency (Williams et al., 1993) over the range of swimming speeds recorded. Similar results have been described for killer (Williams and Noren, 2009) and minke whales (Christiansen et al., 2014a). Performing a quadratic regression, a possible inflection and increase of COT was explored (Figure 6). An inflection point can be noted between 2.3 and 2.4 m × s–1 and an optimal swimming speed range between 2 and 2.6 m/s. However, the low number of groups of whales swimming at speeds exceeding this range (S>2.6 m/s), increases notably the standard error reducing prediction accuracy. The optimal range could extend further, or on the contrary higher swimming speed could directly lead to energetic inefficiency. Experiments carried in controlled conditions and with small cetaceans (Williams et al., 1993; Yazdi et al., 1999), allowed to exceed their optimal range. This performance is unlikely to occur in large cetaceans like the humpback whale in nature.
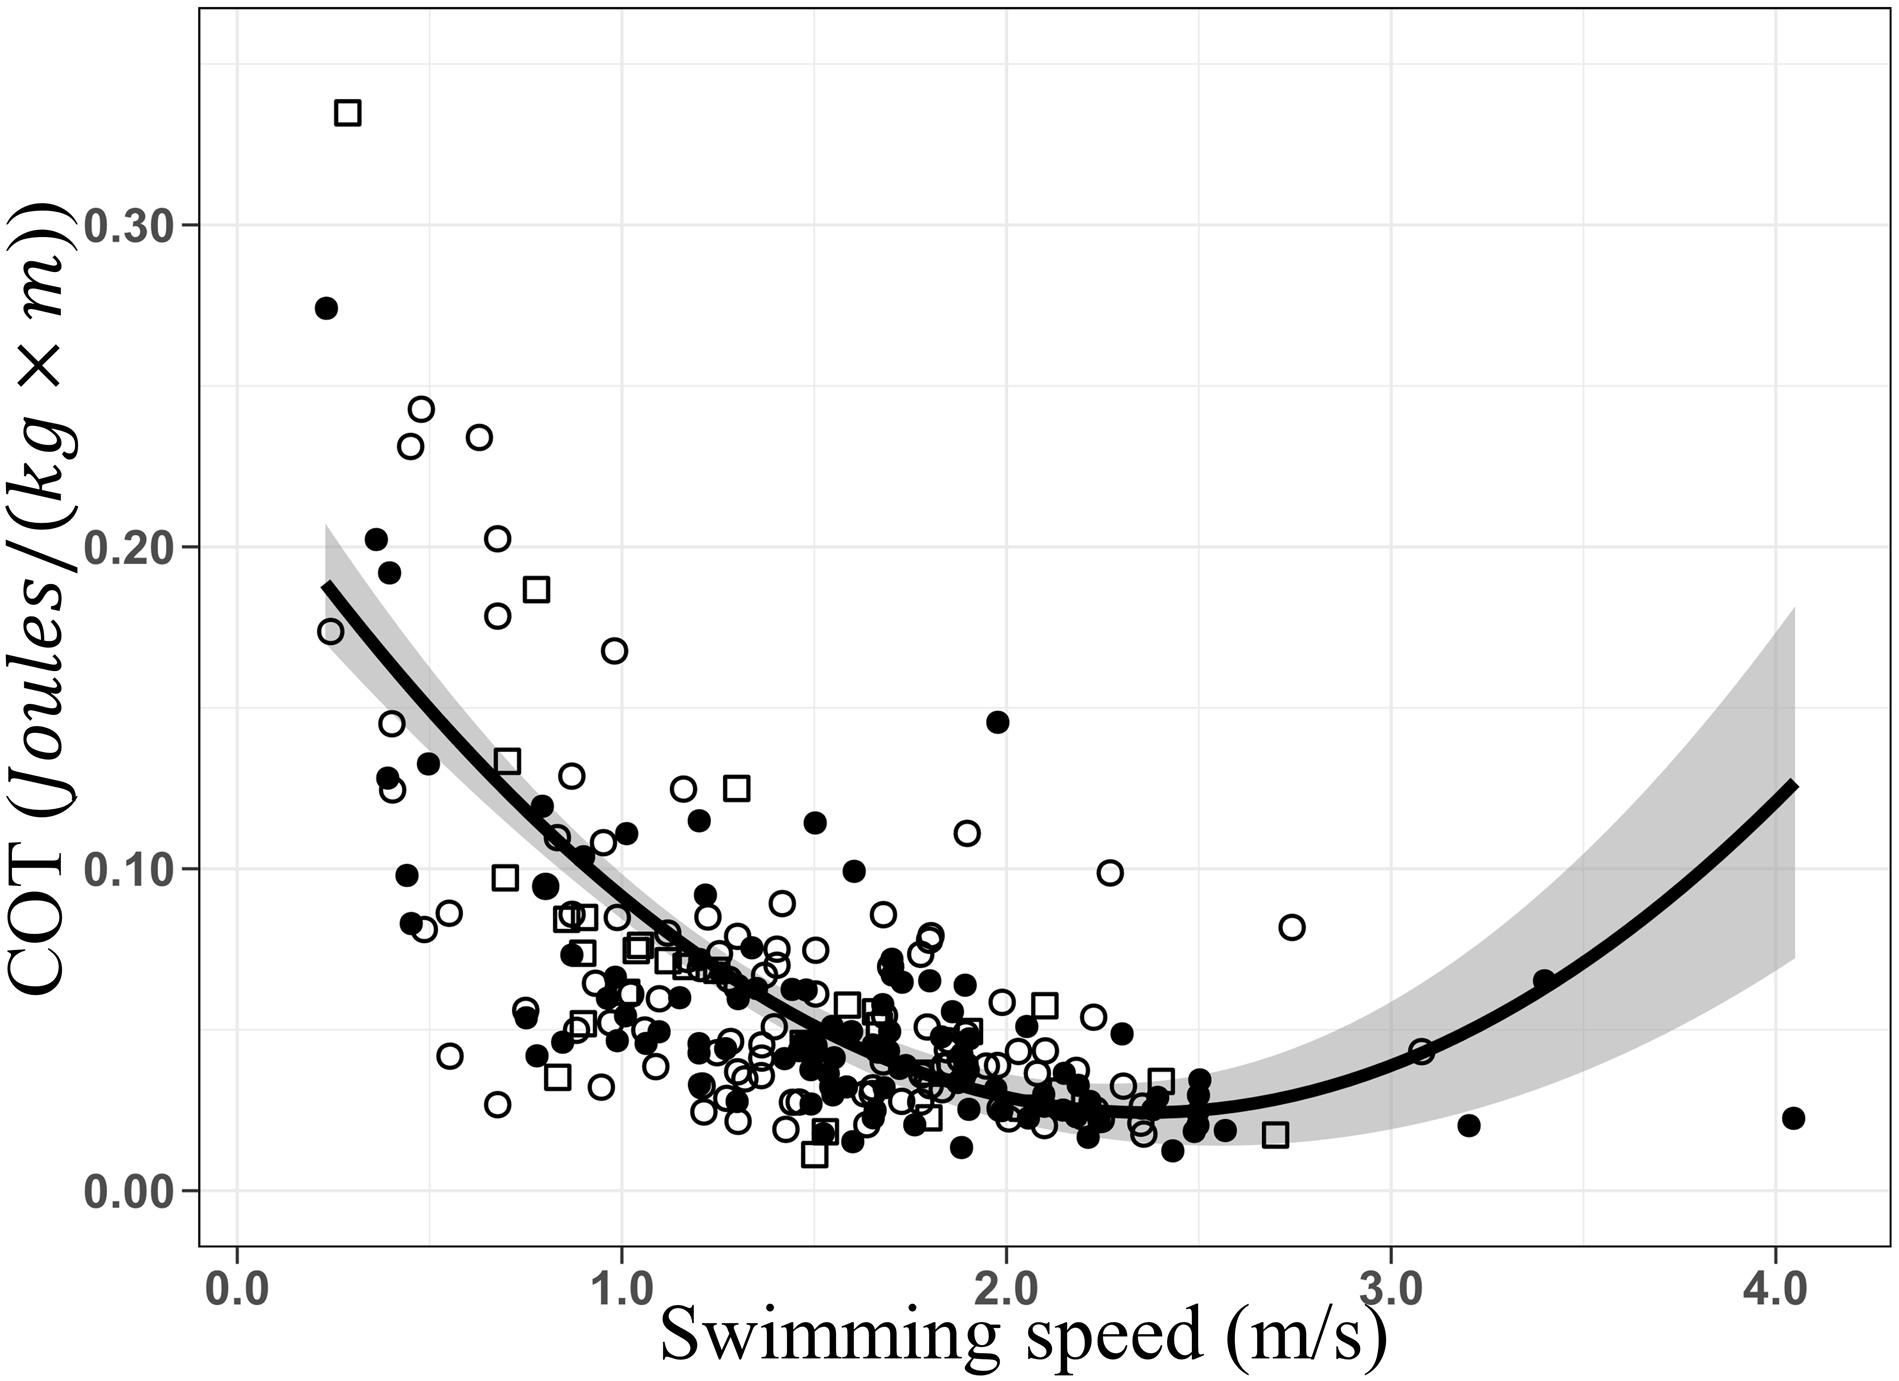
Figure 6. Quadratic regressions of the mass-specific cost of transport (COT; J × [kg × m]– 1) as a function of the swimming speed (m/s). COT = 0.22–0.17 × S+0.03 × S2, R2 = 0.46, F-stat = 103.8, p = 2.2e– 16. Data from before (○), during (•), and after (□) the presence of the whale-watching boats. Gray area represents the standard error.
Cetaceans may respond to human disturbance as they do against natural predators (e.g., killer whales) (Christiansen and Lusseau, 2012). Some species of baleen whales maintain high and sustained speeds to avoid killer whale attacks (Ford et al., 2005; Ford and Reeves, 2008). When chased by orcas, minke whales can keep high velocities for several hours (ca. 8.5 h) over large distances (ca. 18 km) (Ford et al., 2005). Humpback whales may physical defense themselves when confronting predators. Mothers would defend their calf when facing attacks from killer whales (Pitman et al., 2017). Species of cetacean that fight predators, tend to be less hydrodynamic but with a better ability to maneuver and with robust bodies with callosities that could be used as weapons or amour (Ford and Reeves, 2008). However, they can also sustain high speed when fleeing from predators. In humpback whales, the presence of a single boat may not trigger an escape response, however, several boats may elicit a fast response.
Humpback whales of Breeding Stock G face other anthropogenic stressors such as entanglement with fishing gears, shipping noise, and vessel collision, throughout their breeding and feeding grounds (O’Connor et al., 2009). The effect of whale-watching interaction cannot be considered only as a punctual and occasional event, because such repeated anthropogenic stressor events may occur for the same individual or group in addition to natural events (e.g., escape from predation, intraspecific competition). Vulnerable groups, such as mother and calf groups (Stamation et al., 2010; García-Cegarra et al., 2019) move slowly and are usually found closer to the coast, being easily approached by several whale-watching boats (García-Cegarra et al., 2019). Whale watching is a growing industry in Peru (Guidino et al., 2020) but is not regulated yet (Pacheco et al., 2011). We urge the establishment of regulations particularly measurements that controls the time and number of boats per group of whales especially in mother and calf groups (García-Cegarra et al., 2019).
Data Availability Statement
The minimum data to reproduce the analysis supporting the conclusions of this article is available in the Supplementary Table 3. Further inquiries can be directed to the corresponding author/s.
Ethics Statement
The animal study was reviewed and approved by the Comité de Ética de Investigación Científica de la Universidad de Antofagasta, Chile (CEIC REV N° 039/2017 and 7298/2015).
Author Contributions
DV and AP conceived the manuscript. AG-C provided most of the funds during the field works. DV and AG-C collected the data with the advice and guidance of AP. DV analyzed and interpreted the data and results of the study. DV led the preparation of the manuscript with the guidance of AP and AG-C. All authors edited the manuscript.
Funding
This study was funded by the Rufford Foundation via Rufford Small Grants for Nature Conservation (RSG: 15903-1). AG-C was also supported by a Ph.D. Scholarship from the Chilean National Commission for Scientific and Technological Research (CONICYT/63140172-2014).
Conflict of Interest
The authors declare that the research was conducted in the absence of any commercial or financial relationships that could be construed as a potential conflict of interest.
Acknowledgments
We thank Sebastian Silva, Belen Alcorta, Salvador Gubbins, and all the members of the Pacifico Adventures crew for their support during the realization of this study. Special thanks to Alexander Alburquerque for taking us every day to the land-based observation point. We very much appreciate the comments and corrections to this manuscript made by Nicola L. Ransome, Sebastian Uhlmann and two reviewers that help us to improve an early version of this manuscript.
Supplementary Material
The Supplementary Material for this article can be found online at: https://www.frontiersin.org/articles/10.3389/fmars.2020.600508/full#supplementary-material
References
Acevedo, J., Aguayo-Lobo, A., Allen, J. M., Botero-Acosta, N., Capella, J., Castro, C., et al. (2017). Migratory preferences of humpback whales between feeding and breeding grounds in the eastern South Pacific. Mar. Mamm. Sci. 33, 1035–1052. doi: 10.1111/mms.12423
Altmann, J. (1974). Observational study of behavior: sampling methods. Behaviour 49, 227–267. doi: 10.1080/14794802.2011.585831
Baker, C. S., and Herman, L. M. (1989). Behavioral Responses of Summering Humpback Whales to Vessel Traffic: Experimental and Opportunistic Observations. Report to National Park Service; NP-NR-TRS-89-01. Anchorage: Alaska Regional Office. doi: 10.13140/RG.2.1.1948.2481
Bejder, L. (2005). Linking Short and Long-terms Effects of Nature-based Tourism on Cetaceans. Ph.D. thesis, Dalhousie University, Dalhousie, NS.
Bejder, L., Videsen, S., Hermannsen, L., Simon, M., Hanf, D., and Madsen, P. T. (2019). Low energy expenditure and resting behaviour of humpback whale mother-calf pairs highlights conservation importance of sheltered breeding areas. Sci. Rep. 9, 1–11. doi: 10.1038/s41598-018-36870-7
Blix, A. S., and Folkow, L. P. (1995). Daily energy expenditure in free living minke whales. Acta Physiol. Scand. 153, 61–66. doi: 10.1111/j.1748-1716.1995.tb09834.x
Cartwright, R., and Sullivan, M. (2009). Behavioral ontogeny in humpback whale (Megaptera novaeangliae) calves during their residence in Hawaiian waters. Mar. Mamm. Sci. 25, 659–680. doi: 10.1111/j.1748-7692.2009.00286.x
Carvalho-Gonçalves, M. I., de Sousa-Lima, R. S., Teixeira, N. N., Carvalho, G. H., Danilewicz, D., and Baumgarten, J. E. (2018). Movement patterns of humpback whales (Megaptera novaeangliae) reoccupying a Brazilian breeding ground. Biota Neotrop. 18:e20180567. doi: 10.1590/1676-0611-bn-2018-0567
Chittleborough, R. G. (1965). Dynamics of two populations of the humpback whale, Megaptera novaeangliae (Borowski). Aust. J. Mar. Freshw. Res. 16, 33–128. doi: 10.1071/MF9650033
Christiansen, F., Dujon, A. M., Sprogis, K. R., Arnould, J. P. Y., and Bejder, L. (2016). Noninvasive unmanned aerial vehicle provides estimates of the energetic cost of reproduction in humpback whales. Ecosphere 7, 1–18. doi: 10.1002/ecs2.1468
Christiansen, F., and Lusseau, D. (2012). “Understanding the ecological effects of whale-watching on cetaceans,” in Whale-watching, Sustainable Tourism and Ecological Management, eds J. E. S. Higham, L. Bejder, and R. Williams (Cambridge: Cambridge University Press), 177–192. doi: 10.1017/CBO9781139018166.016
Christiansen, F., and Lusseau, D. (2015). Linking behavior to vital rates to measure the effects of non-lethal disturbance on wildlife. Conserv. Lett. 8, 424–431. doi: 10.1111/conl.12166
Christiansen, F., Lusseau, D., Stensland, E., and Berggren, P. (2010). Effects of tourist boats on the behaviour of Indo-Pacific bottlenose dolphins off the south coast of Zanzibar. Endanger. Species Res. 11, 91–99. doi: 10.3354/esr00265
Christiansen, F., Rasmussen, M. H., and Lusseau, D. (2013). Inferring activity budgets in wild animals to estimate the consequences of disturbances. Behav. Ecol. 24, 1415–1425. doi: 10.1093/beheco/art086
Christiansen, F., Rasmussen, M. H., and Lusseau, D. (2014a). Inferring energy expenditure from respiration rates in minke whales to measure the effects of whale watching boat interactions. J. Exp. Mar. Biol. Ecol. 459, 96–104. doi: 10.1016/j.jembe.2014.05.014
Christiansen, F., Víkingsson, G. A., Rasmussen, M. H., and Lusseau, D. (2014b). Female body condition affects foetal growth in a capital breeding mysticete. Funct. Ecol. 28, 579–588. doi: 10.1111/1365-2435.12200
Christiansen, F., Vivier, F., Charlton, C., Ward, R., Amerson, A., Burnell, S., et al. (2018). Maternal body size and condition determine calf growth rates in southern right whales. Mar. Ecol. Prog. Ser 592, 267–281. doi: 10.3354/meps12522
Corkeron, P. J. (1995). Humpback whales (Megaptera novaeangliae) in Hervey Bay, Queensland: behaviour and responses to whale-watching vessels. Can. J. Zool. 73, 1290–1299. doi: 10.1139/z95-153
Costa, D. P. (2012). A bioenergetics approach to developing a population consequences of acoustic disturbance model. Adv. Exp. Med. Biol 730, 423–426. doi: 10.1007/978-1-4419-7311-5
Craig, A. S., Herman, L. M., Pack, A. A., and Waterman, J. O. (2014). Habitat segregation by female humpback whales in Hawaiian waters: avoidance of males? Behaviour 151, 613–631. doi: 10.1163/1568539X-00003151
Culik, B. M., Wilson, R. P., and Bannasch, R. (1994). Underwater swimming at low energetic cost by pygoscelid penguins. J. Exp. Biol. 197, 65–78.
Davis, R. W., Williams, T. M., and Kooyman, G. L. (1985). Swimming metabolism of yearling and adult habour seals. Phoca vitulina. Physiol. Zool. 58, 590–596. doi: 10.1086/physzool.58.5.30158585
Dawbin, D. H. (1966). “The seasonal migratory cycle of humpback whales,” in Whale, Dolphins and Porpoises, Vol. 1966, ed. K. S. Norris (Berkeley, CA: University of California Press), 145–170.
De Weerdt, J., and Ramos, E. A. (2020). Feeding of humpback whales (Megaptera novaeangliae) on the Pacific coast of Nicaragua. Mar. Mamm. Sci. 36, 285–292. doi: 10.1111/mms.12613
De Weerdt, J., Ramos, E. A., and Cheeseman, T. (2020). Northernmost records of Southern Hemisphere humpback whales (Megaptera novaeangliae) migrating from the Antarctic Peninsula to the Pacific coast of Nicaragua. Mar. Mamm. Sci 36, 1015–1021. doi: 10.1111/mms.12677
Di Clemente, J., Christiansen, F., Pirotta, E., Steckler, D., Wahlberg, M., and Pearson, H. C. (2018). Effects of whale watching on the activity budgets of humpback whales, Megaptera novaeangliae (Borowski, 1781), on a feeding ground. Aquat. Conserv. 28, 810–820. doi: 10.1002/aqc.2909
Dolphin, W. F. (1987). Dive behavior and estimated energy expenditure of foraging humpback whales in southeast Alaska. Can. J. Zool. 65, 354–362. doi: 10.1139/z87-055
Fedak, M. A., and Seeherman, H. J. (1979). Reappraisal of energetics of locomotion shows identical cost in bipeds and quadrupeds including ostrich and horse. Nature 282, 713–716. doi: 10.1038/282713a0
Ford, J. K. B., Ellis, G. M., Matkin, D. R., Balcomb, K. C., Briggs, D., and Morton, A. B. (2005). Killer whale attacks on minke whales: prey capture and antipredator tactics. Mar. Mamm. Sci. 21, 603–618. doi: 10.1111/j.1748-7692.2005.tb01254.x
Ford, J. K. B., and Reeves, R. R. (2008). Fight or flight: antipredator strategies of baleen whales. Mamm. Rev. 38, 50–86. doi: 10.1111/j.1365-2907.2008.00118.x
Frid, A., and Dill, L. (2002). Human-caused disturbance stimuli as a form of predation risk. Cons. Ecol. 6, 1–16. doi: 10.5751/es-00404-060111
Frisch-Jordán, A., Ransome, N. L., Aranda-Mena, O., and Romo-Sirvent, F. (2019). Intensive feeding of humpback whales (Megaptera novaeangliae) in the breeding ground of Banderas. Lat. Am. J. Aquat. Mamm. 14, 27–33. doi: 10.5597/lajam00251
García-Cegarra, A. M., and Pacheco, A. S. (2017). Whale-watching trips in Peru lead to increases in tourist knowledge, pro-conservation intentions and tourist concern for the impacts of whale-watching on humpback whales. Aquat. Conserv. 27, 1011–1020. doi: 10.1002/aqc.2754
García-Cegarra, A. M., Villagra, D., Gallardo, D. I., and Pacheco, A. S. (2019). Statistical dependence for detecting whale-watching effects on humpback whales. J. Wildl. Manag. 83, 467–477. doi: 10.1002/jwmg.21602
Guidino, C., Campbell, E., Alcorta, B., Gonzalez, V., Mangel, J. C., Pacheco, A. S., et al. (2020). Whale watching in northern Peru: an economic boom? Tour. Mar. Environ. 15, 1–10. doi: 10.3727/154427320X15819596320544
Guidino, C., Llapapasca, M. A., Silva, S., Alcorta, B., and Pacheco, A. S. (2014). Patterns of spatial and temporal distribution of humpback whales at the southern limit of the Southeast Pacific breeding area. PLoS One 9:e112627. doi: 10.1371/journal.pone.0112627
Gunnlaugsson, T., Víkingsson, G. A., Halldórsson, S. D., Elvarsson, B., Haug, T., and Lydersen, C. (2020). Body mass, muscle, blubber and visceral fat content and their seasonal, spatial and temporal variability in North Atlantic common minke whales. J. Cetac. Res. Manage. 21, 59–70. doi: 10.47536/JCRM.V21I1.150
Herman, L. M., and Antinoja, R. C. (1977). Humpback whales in the Hawaiian breeding waters: population and pod characteristics. Sci. Rep. Whales Res. Inst. 29, 59–85.
Højsgaard, S., Halekoh, U., and Yan, J. (2006). The R package geepack for generalized estimating equations. J. Stat. Softw. 15, 1–11. doi: 10.18637/jss.v015.i02
IWC. (1998). Report of the scientific committee, annex G. Report of the sub-committee on the comprehensive assessment of southern hemisphere humpback whales. Rep. Int. Whal. Commn. 48, 170–182.
Kriete, B. (1995). Bioenergetics in the Killer Whale, Orcinus Orca. >Ph.D. thesis, The University of British Columbia: Vancouver, WA.
Langman, V. A., Rowe, M. F., Roberts, T. J., Langman, N. V., and Taylor, C. R. (2012). Minimum cost of transport in Asian elephants: do we really need a bigger elephant? J. Exp. Biol. 215(Pt 9), 1509–1514. doi: 10.1242/jeb.063032
Lockyer, C. (1976). Body weights of some species of large whales. ICES J. Mar. Sci. 36, 259–273. doi: 10.1093/icesjms/36.3.259
Lockyer, C. (1981). Estimation of the energy costs of growth, maintenance and reproduction of the female minke whale (Balaenoptera acutorostrata), from the Southern Hemisphere. Rep. Int. Whal. Commn. 31, 337–343.
Lockyer, C. (1984). Review of baleen whale (Mysticeti) reproduction and implications for management. Rep. Int. Whal. Commn. 6, 27–50.
Lusseau, D. (2006). The short-term behavioral reactions of bottlenose dolphins to interactions with boats in doubtful sound, New Zealand. Mar. Mamm. Sci. 22, 802–818. doi: 10.1111/j.1748-7692.2006.00052.x
Maresh, J. L., Simmons, S. E., Crocker, D. E., McDonald, B. I., Williams, T. M., and Costa, D. P. (2014). Free-swimming northern elephant seals have low field metabolic rates that are sensitive to an increased cost of transport. J. Exp. Biol. 217, 1485–1495. doi: 10.1242/jeb.094201
Mobley, J. R., and Herman, L. M. (1985). Transience of social affiliations among humpback whales (Megaptera novaeangliae) on the Hawaiian wintering grounds. Can. J. Zool. 63, 762–772. doi: 10.1139/z85-111
Morete, M. E., Bisi, T. L., and Rosso, S. (2007). Mother and calf humpback whale responses to vessels around the Abrolhos Archipelago. Bahia Brazil. J. Cetac. Res. Manage. 9, 241–248.
New, L. F., Hall, A. J., Harcourt, R., Kaufman, G., Parsons, E. C. M., Pearson, H. C., et al. (2015). The modelling and assessment of whale-watching impacts. Ocean Coast. Manage. 115, 10–16. doi: 10.1016/j.ocecoaman.2015.04.006
Nielsen, M. L. K., Sprogis, K. R., Bejder, L., Madsen, P. T., and Christiansen, F. (2019). Behavioural development in southern right whale calves. Mar. Ecol. Prog. Ser. 629, 219–234. doi: 10.3354/meps13125
Nordøy, E. S., Folkow, L. P., Mtensson, P. E., and Blix, A. S. (1995). Food requirements of Northeast Atlantic minke whales. Dev. Mar. Biol. 4, 307–317. doi: 10.1016/S0163-6995(06)80032-6
Noren, D. P., Johnson, A. H., Rehder, D., and Larson, A. (2009). Close approaches by vessels elicit surface active behaviors by southern resident killer whales. Endanger. Species Res. 8, 179–192. doi: 10.3354/esr00205
Nowacek, D. P., Christiansen, F., Bejder, L., Goldbogen, J. A., and Friedlaender, A. S. (2016). Studying cetacean behaviour: new technological approaches and conservation applications. Anim. Behav. 120, 235–244. doi: 10.1016/j.anbehav.2016.07.019
O’Connor, S., Campbell, R., Knowles, T., Cortez, H., and Grey, F. (2009). Whale Watching Worldwide: Tourism numbers, Expenditures and Economic Benefits. A special Report from the International Fund for Animal Welfare. Yarmouth MA: Economists at Large, 295.
Otani, S., Naito, Y., Kato, A., and Kawamura, A. (2001). Oxygen consumption and swim speed of the harbor porpoise Phocoena phocoena. Fish. Sci. 67, 894–898. doi: 10.1046/j.1444-2906.2001.00338.x
Pacheco, A. S., Silva, S., and Alcorta, B. (2009). Winter distribution and group composition of humpback whales (Megaptera novaeangliae) off northern Peru. Lat. Am. J. Aquat. Mamm. 7, 33–38. doi: 10.5597/lajam00131
Pacheco, A. S., Silva, S., and Alcorta, B. (2011). Is it possible to go whale watching off the coast of Peru? A case study of humpback whales. Lat. Am. J. Aquat. Res. 39, 189–196. doi: 10.3856/vol39-issue1-fulltext-20
Pirotta, E., Booth, C. G., Costa, D. P., Fleishman, E., Kraus, S. D., Lusseau, D., et al. (2018). Understanding the population consequences of disturbance. Ecol. Evol. 8, 9934–9946. doi: 10.1002/ece3.4458
Pitman, R. L., Deecke, V. B., Gabriele, C. M., Srinivasan, M., Black, N., Denkinger, J., et al. (2017). Humpback whales interfering when mammal-eating killer whales attack other species: mobbing behavior and interspecific altruism? Mar. Mamm. Sci. 33, 7–58. doi: 10.1111/mms.12343
R Core Team (2020). R: A language and Environment for Statistical Computing. Vienna: R Foundation for Statistical Computing.
Ramírez, A. P. (1988). La ballena jorobada en la costa norte de Perú. Periodo 1961-1965 y 1975-1985. Bol. Lima 56, 91–96.
Romero, A. (2015). Topografia Base Para el Seguimiento de Ballenas y Barcos en la Bahía de Mejillones. Ph.D. thesis, Universidad de Antofagasta: Antofagasta.
Rosen, D. A. S., and Trites, A. W. (2002). Cost of transport in Steller sea lions Eumetopis jubatus. Mar. Mamm. Sci. 18, 513–524. doi: 10.1111/j.1748-7692.2002.tb01052.x
Schaffar, A., Garrigue, C., and Constantine, R. (2010). Exposure of humpback whales to unregulated whale-watching activities in their main reproductive area in New Caledonia. J. Cetac. Res. Manage. 11, 147–152.
Scheidat, M., Castro, C., Denkinger, J., González, J., and Adelung, D. (2000). A breeding area for humpback whales (Megaptera novaeangliae) off Ecuador. J. Cetac. Res. Manage. 2, 165–172.
Scheidat, M., Castro, C., Gonzalez, J., and Williams, R. (2004). Behavioural responses of humpback whales (Megaptera novaeangliae) to whale-watching boats near Isla de la Plata, Machalilla National Park, Ecuador. J. Cetac. Res. Manage. 6, 63–68.
Schmidt-Nielsen, K. (1972). Locomotion: energy cost of swimming, flying, and running. Science 177, 222–228. doi: 10.1126/science.177.4045.222
Senigaglia, V., Christiansen, F., Bejder, L., Gendron, D., Lundquist, D., Noren, D. P., et al. (2016). Meta-analyses of whale-watching impact studies: comparisons of cetacean responses to disturbance. Mar. Ecol. Prog. Ser. 542, 251–263. doi: 10.3354/meps11497
Smultea, M. A. (1994). Segregation by humpback whale (Megaptera novaeangliae) cows with a calf in coastal habitat near the island of Hawaii. Can. J. Zool. 72, 805–811. doi: 10.1139/z94-109
Sousa-Lima, R. S., and Clark, C. W. (2008). Modelling the effect of boat traffic on the fluctuation humpback whales singing activity in the Abrolhos National Marine Park. Brazil. Can. Acoust. 36, 174–181.
Sprogis, K. R., Bejder, L., Hanf, D., and Christiansen, F. (2020a). Behavioural responses of migrating humpback whales to swim-with-whale activities in the Ningaloo Marine Park. Western Australia. J. Exp. Mar. Biol. Ecol. 522, 151254. doi: 10.1016/j.jembe.2019.151254
Sprogis, K. R., Videsen, S., and Madsen, P. T. (2020b). Vessel noise levels drive behavioural responses of humpback whales with implications for whale-watching. eLife 9, 1–17. doi: 10.7554/eLife.56760
Stamation, K. A., Croft, D. B., Shaughnessy, P. D., and Waples, K. A. (2007). Observations of humpback whales (Megaptera novaeangliae) feeding during Their southward migration along the coast of South-eastern New South Wales, Australia: identification of a possible supplemental feeding ground. Aquat. Mamm. 33, 165–174. doi: 10.1578/am.33.2.2007.165
Stamation, K. A., Croft, D. B., Shaughnessy, P. D., Waples, K. A., and Briggs, S. V. (2010). Behavioral responses of humpback whales (Megaptera novaeangliae) to whale-watching vessels on the Southeastern coast of Australia. Mar. Mamm. Sci. 26, 98–122. doi: 10.1111/j.1748-7692.2009.00320.x
Sullivan, M., and Cartwright, R. (2009). Associations with multiple male groups increase the energy expenditure of humpback whale (Megaptera novaeangliae) female and calf pairs on the breeding grounds. Behaviour 146, 1573–1600. doi: 10.1163/156853909x458377
Sumich, J. L. (1983). Swimming velocities, breathing patterns, and estimated costs of locomotion in migrating gray whales. Eschrichtius robustus. Can. J. Zool. 61, 647–652. doi: 10.1139/z83-086
Tucker, V. A. (1970). Energetic cost of locomotion in animals. Comp. Biochem. Physiol. B 34, 841–846. doi: 10.1016/0010-406X(70)91006-6
Valdivia, C. A., Pacheco, A. S., Félix, F., Haase, B., Rasmussen, K., Santillán, L., et al. (2017). Movements and timing of humpback whales (Megaptera novaeangliae) within the breeding region of the eastern south Pacific. Aquat. Mamm. 43, 324–330. doi: 10.1578/AM.43.3.2017.324
Videsen, S. K. A., Bejder, L., Johnson, M., and Madsen, P. T. (2017). High suckling rates and acoustic crypsis of humpback whale neonates maximise potential for mother–calf energy transfer. Funct. Ecol. 31, 1561–1573. doi: 10.1111/1365-2435.12871
Wahrenbrock, E., Maruschak, G., Elsner, R., and Kenney, D. (1974). Respiration and metabolism in two baleen whale calves. Mar. Fish. Rev. 36, 3–8.
Watkins, W. A. (1986). Whale reactions to human activities in Cape Cod water. Mar. Mamm. Sci 2, 251–262. doi: 10.1111/j.1748-7692.1986.tb00134.x
Whitehead, H. (1983). Structure and stability of humpback whale groups off Newfoundland (Megaptera novaeangliae). Can. J. Zool. 61, 1391–1397. doi: 10.1139/z83-186
Williams, T. M. (1999). The evolution of cost efficient swimming in marine mammals: limits to energetic optimization. Philos. Trans. R. Soc. Lond. B Biol. Sci. 354, 193–201. doi: 10.1098/rstb.1999.0371
Williams, R., and Ashe, E. (2007). Killer whale evasive tactics vary with boat number. J. Zool. 272, 390–397. doi: 10.1111/j.1469-7998.2006.00280.x
Williams, R., Lusseau, D., and Hammond, P. S. (2006). Estimating relative energetic costs of human disturbance to killer whales (Orcinus orca). Biol. Conserv. 133, 301–311. doi: 10.1016/j.biocon.2006.06.010
Williams, R., and Noren, D. P. (2009). Swimming speed, respiration rate, and estimated cost of transport in adult killer whales. Mar. Mamm. Sci. 25, 327–350. doi: 10.1111/j.1748-7692.2008.00255.x
Williams, R., Trites, A. W., and Bain, D. E. (2002). Behavioural responses of killer whales (Orcinus orca) to whale-watching boats: opportunistic observations and experimental approaches. J. Zool. 256, 255–270. doi: 10.1017/s0952836902000298
Williams, T. M., Friedl, W. A., and Haun, J. E. (1993). The physiology of bottlenose dolphins (Tursiops truncatus): heart rate, metabolic rate and plasma lactate concentration during exercise. J. Exp. Biol. 179, 31–46.
Williams, T. M., Kooyman, G. L., and Croll, D. A. (1991). The effect of submergence on heart rate and oxygen consumption of swimming seals and sea lions. J. Comp. Physiol. B 160, 637–644. doi: 10.1007/BF00571261
Keywords: mass-specific cost of transport, optimal swimming speed, efficiency of transport, anthropogenic perturbation, energy consumption, baleen whale
Citation: Villagra D, García-Cegarra A, Gallardo DI and Pacheco AS (2021) Energetic Effects of Whale-Watching Boats on Humpback Whales on a Breeding Ground. Front. Mar. Sci. 7:600508. doi: 10.3389/fmars.2020.600508
Received: 30 August 2020; Accepted: 15 December 2020;
Published: 11 January 2021.
Edited by:
Lars Bejder, University of Hawai‘i at Mānoa, United StatesReviewed by:
Fredrik Christiansen, Murdoch University, AustraliaMauricio Cantor, Federal University of Santa Catarina, Brazil
Copyright © 2021 Villagra, García-Cegarra, Gallardo and Pacheco. This is an open-access article distributed under the terms of the Creative Commons Attribution License (CC BY). The use, distribution or reproduction in other forums is permitted, provided the original author(s) and the copyright owner(s) are credited and that the original publication in this journal is cited, in accordance with accepted academic practice. No use, distribution or reproduction is permitted which does not comply with these terms.
*Correspondence: Damian Villagra, dvillagrapetre@gmail.com