Spatio-Temporal Assessment of the European Hake (Merluccius merluccius) Recruits in the Northern Iberian Peninsula
 Francisco Izquierdo1,2*
  Iosu Paradinas3
  Santiago Cerviño2
  David Conesa1
  Alexandre Alonso-Fernández4
  Francisco Velasco5
  Izaskun Preciado5
  Antonio Punzón5
  Fran Saborido-Rey4
  Maria Grazia Pennino2,6
- 1Departament d'Estadıstica i Investigació Operativa, Universitat de Valéncia, Burjassot, Spain
- 2Instituto Español de Oceanografía, Centro Oceanográfico de Vigo, Vigo, Spain
- 3Asociación Ipar Perspective, Sopela, Spain
- 4Instituto de Investigaciones Marinas (IIM-CSIC), Vigo, Spain
- 5Centro Oceanográfico de Santander, Instituto Español de Oceanografía, Promontorio de San Martín, Santander, Spain
- 6Fishing Ecology Management and Economics, Departamento de Ecología, Universidade Federal do Rio Grande do Norte, Natal, Brazil
The protection of fish nurseries has been recognized as a useful tool to efficiently manage fisheries given that protected areas enhance the recruitment of target species. To identify and locate potential nursery areas, a solid understanding of species-environment relationships and their spatio-temporal dynamics is needed. Within this context, in this study we assess where European hake (Merluccius merluccius) recruits persistently aggregate in the northern continental shelf of the Iberian Peninsula. Hake recruit data collected during scientific trawl surveys between 2005 and 2016 were analyzed using Bayesian hurdle hierarchical spatio-temporal models, considering the environmental variables bathymetry, sea bottom temperature and salinity. Additionally, three different spatio-temporal structures (i.e., persistent, progressive, or opportunistic) were compared to assess the temporal persistence of nurseries over time. Among all the environmental variables analyzed, bathymetry was the most important. The preferential habitat of recruits was found to be within a bathymetric range of 120–200 m. Our findings clearly show that there is a temporally persistent main nursery located along the continental shelf of the Artabrian gulf (off La Coruña) in addition to several areas with high aggregations of hake recruits but with strong inter-annual variability. We argue that the analytical framework applied in this study allowed us to identify European hake nurseries in the northern continental shelf of the Iberian Peninsula, as well as their spatio-temporal fluctuations throughout the study period (2005–2016), and to assess which environmental factors, among bathymetry, sea bottom temperature and salinity, influence the occurrence and abundance of recruits in the study area. Results of our models also produce a new abundance index that could be useful for improving traditional stock assessment models.
1. Introduction
Contemporary sustainable fisheries management advisory panels have acknowledged the importance of fisheries restricted areas (FRA) as a complementary tool to conventional stock management policies (FAO, 2016). Increased overfishing can lead to fluctuations in species stock abundance, and therefore, fully accounting for the age-structure and natural growth potential of fish stocks is crucial, being recruitment one of the most vulnerable phases (Diekert et al., 2010). There are some measures to protect this life stage, such as increasing mesh size or using a different net geometry (Carlucci et al., 2009), but other technical measures that involve protecting spatial or spatio-temporal FRAs may be key to accomplishing sustainable management (Colloca et al., 2015; Paradinas et al., 2015) as they are less susceptible to annual assessment strategies or political agreements (Pitchford et al., 2007).
European hake (Merluccius merluccius) is one of the most important commercial species in the northeast Atlantic and is assessed by the International Council for the Exploration of the Sea (ICES) in two units: the northern and the southern stocks. Despite the recovery plan for the southern stock implemented in 2006 (EC 2166/2005) and the Multiannual Management Plan for Western Waters (EU, 2019), the fish mortality rate is still above the maximum sustainable yield (Fmsy), even though the spawning stock biomass is above precautionary levels (ICES, 2018a). Diverse spatial studies have identified nursery areas for this species and stock (Casey and Pereiro, 1995). Sánchez and Gil (2000) found persistent nursery areas in the northwest coast of the Iberian Peninsula, while a more recent study by Pennino et al. (2019) identified four areas with different levels of overlap with the past study. This difference in results demonstrates the importance of dynamic spatio-temporal modeling, given that the effect of environmental conditions over time can vary the distribution, shape and abundance of hake nursery grounds.
Several studies have assessed whether different physical, environmental and biological factors can affect growth and survival rates of European hake during the early life stages (Alvarez et al., 2001, 2004; Bartolino et al., 2008; Korta et al., 2015). In the northeastern Atlantic, previous studies have determined that recruitment success has a direct relationship with regime shifts expressed through the sea surface temperature and the Ekman's transport index (Goikoetxea and Irigoien, 2013). Along the continental Galician shelf, random variations in the physical environment, such as North Atlantic Oscillation (NAO) and the upwelling, have been observed to directly affect the growth and size of mature hake females (Domínguez-Petit et al., 2008). Moreover, the interplay of westward larvae transport within anticyclonic eddies that collide with the shelf grounds favors high recruitment to nursery areas at depths of between 90 and 180 meters in the western shelf of the Cantabrian Sea (Sánchez and Gil, 2000).
Valuable information regarding ecological hake dynamics is being addressed both through various studies and the stock assessment working group developed by ICES, which relies on information from commercial landings and oceanographic surveys provided by research centers, such as the “Instituto Español de Oceanografía” (IEO) and the “Instituto Português do Mar e da Atmosfera” (IPMA). Since 2014, this data has been used as an input to the GADGET (Globally applicable Area Disaggregated General Ecosystem Toolbox) model (length based), which is currently one of the most complete methods to study the state of a population over time (ICES, 2018b). However, most of these stock assessment studies maintain the same assumption that spatial and environmental variability is implicitly intrinsic in the data, and therefore, it is not explicitly taken into consideration in assessment models. Survey abundance indices are used to calibrate dynamic models assuming some proportionality between survey abundance and modeled abundance. To guarantee that this proportionality is constant on time the sampling design is kept the same every year, allowing a random selection of hauls in each strata. However, changes on fish distribution can happen from year to year affecting the design based abundance estimation. If these abundance indices ignore spatial structures in estimates it can lead to biased results (Shelton et al., 2014; Cao et al., 2017).
Studying the spatial distribution of a species like hake over time is a medium-large scale process, which is influenced by changing environmental features. Geostatistical models take into account spatial autocorrelation, which allows spatial dependency between neighboring locations to be incorporated, following the principle that nearby locations are more similar than distant ones (Tobler, 1970; Dormann, 2007). Similarly, when analyzing time series data consecutive measurements of months and/or years are more similar than separated ones, and therefore, display temporal autocorrelation (Tsitsika et al., 2007). Taking explicitly spatial and temporal correlation in models into account is essential since observations are often collected close in time and space and are subject to similar environmental characteristics (Hurlbert, 1984; Hefley et al., 2017). Ignoring spatial and temporal dependence in this type of analysis can generate misleading results (Latimer et al., 2006; Agostini et al., 2008; Fahrmeir and Kneib, 2008). Recently, the use of Bayesian hierarchical spatio-temporal models has demonstrated to be a convenient approach when modeling species habitat preferred conditions (Muñoz et al., 2013) and also to identify species nurseries (Colloca et al., 2009; Paradinas et al., 2015, 2020), given their ability to incorporate the spatio-temporal correlation as well as the associated uncertainties. Moreover, to be useful for fisheries management, the identified nurseries need to be areas that persist over time (Fiorentino et al., 2003; Garofalo et al., 2011; Colloca et al., 2015; Druon et al., 2015). A variety of research approaches have been proposed to assess temporal persistence: Colloca et al. (2009) proposed Bayesian kriging maps by year associated to aggregation curves that identify the level of persistence; Paradinas et al. (2015) proposed a Bayesian approach that compared two spatio-temporal structures, one fitting persistent scenarios (i.e., spatial distributions that do not change with time), and the other accommodating opportunistic scenarios (i.e., spatial distributions that change unrelatedly across subsequent time events). Recently, Paradinas et al. (2017, 2020) enhanced the latter approach by including a third spatio-temporal structure to fit progressive processes (i.e., distributions that are neither totally persistent nor opportunistic but change progressively over time).
Within this context, here we apply a Bayesian hierarchical spatio-temporal hurdle-model (B-HSTHMs) to (1) identify European hake nurseries in the northern continental shelf of the Iberian Peninsula and their spatio-temporal fluctuations over time (2005–2016); (2) assess which environmental factors, among bathymetry, sea bottom temperature and salinity, influence recruit occurrence and abundance in the study area, and (3) produce a new habitat-based abundance index of recruits for traditional stock assessment models.
2. Methods
2.1. Study Region
The region of interest for this study is the northern continental shelf of the Iberian Peninsula (see Figure 1), a narrow area (10–60 km) of almost 18,000 km2 that is characterized by important and marked hydro dynamism (Abad et al., 2019). Over the shelf, currents are driven by regional factors, such as tides and wind (Gil and Sánchez, 2003). In the winter, a warm and saline poleward current moves eastward along the Cantabrian coast and enters the Bay of Biscay (Korta et al., 2015). In addition, the coastal upwelling off the Galician and Portuguese coasts appears during spring and summer which, combined with hydrographic mesoscale activities, has a strong influence on the primary production of the area (Sánchez and Olaso, 2004).
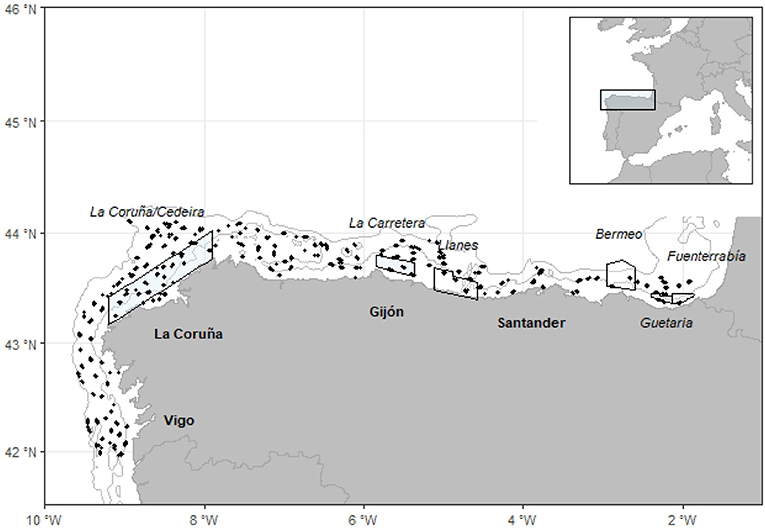
Figure 1. Sampling locations (black dots) of SP-NSGFS Q4 surveys (2005–2016). Bathymetric lines indicate the 100 and 800 m isobaths. Closure areas to trawl in Galician and Cantabrian Sea Waters. Colored polygons are permanent closed while White areas correspond to the temporal ones (BOE, 2015).
In this area, hake is caught by trawls, gillnetters, long-liners, and artisanal fleets (ICES, 2018a). The bottom-trawling fleet operate throughout the year exploiting the fishing grounds, but seasonal and permanent spatial closures for this fleet have been implemented since before 2000 (BOE, 1996, 2015). Specifically, the fishing grounds with seasonal closures for hake recruitment are La Coruña/Cedeira, where trawling is forbidden from October to January, and La Carretera, where trawling is forbidden from September to March (Figure 1).
2.2. Data Collection
Data on hake recruits were collected by the IEO for the scientific survey series SP NSGFS Q4, which is carried out annually in autumn (September to October), and the study period includes data from 2005 to 2016. This survey used a stratified sampling design based on depth with three bathymetric strata: 70–120, 121–200, and 201–500 m. Moreover, some samples from additional trawls at greater depths were also included. Sampling stations consisted of 30 min trawling hauls located randomly within each strata at the beginning of the survey design (Figure 1). Approximately 115 hauls divided between the three bathymetric strata were performed every year in this zone, using baka 44/60 gear (ICES, 2017) and following the International Bottom Trawl Survey Working Group protocols (IBTSWG) of ICES.
All individuals smaller than 21 centimeters were considered recruits (Murua, 2010). It should be noted that the fishing gear used is well-designed to catch recruit individuals (cod-end mesh size 10 mm), who settle at the bottom with about 10 cm (Sánchez and Gil, 2000).
Two different response variables were analyzed to characterize the spatio-temporal behavior of European hake recruits. First, we considered a presence/absence variable to measure the occurrence probability of the species. Second, we used the total number of individuals standardized by 30 min of trawling (i.e., number per unit effort, NPUE) as an indicator of the conditional-to-presence abundance of the species.
Due to the demersal nature of this species, only three environmental variables were considered to be potential drivers. Two oceanographic variables, Sea Bottom Temperature (SBT in °C) and Sea Bottom Salinity (SBS in PSU), and bathymetry (in meters).
SBT and SBS were added to the analysis as they are strongly related to marine system productivity given that they affect nutrient availability and water stratification (Muñoz et al., 2013). SBT and SBS values were collected during the survey with a sounding CTD SeaBird (conductivity, temperature and depth) in different random sampling points of the study area. Average SBT (Supplementary Figure 1) and SBS (Supplementary Figure 2) maps for the months of the survey (September–October) over the entire area were obtained for each year of the period studied with the Radial basis functions (RBF) tool in ArcGIS 10.1.
Bathymetry (Supplementary Figure 3) was obtained from the European Marine Observation and Data Network with a spatial resolution of 0.02 × 0.02 decimal degrees. In order to ensure the same spatial resolution, all environmental data were aggregated to the lower spatial resolutions (0.05 × 0.05 decimal degrees) using the raster package (Hijmans, 2018) in the R software (R Core Team, 2017).
All covariates were explored for collinearity, outliers, and missing values following the approach of Zuur et al. (2010) before being included in the models. Correlation among variables was tested using the Spearman's correlation (Supplementary Figure 4), whereas collinearity was computed using Generalized variance-inflation factors (GVIF) (Fox and Weisberg, 2011) (Supplementary Figure 5). To avoid numerical confounding within the model selection, the explanatory variables were standardized (difference from the mean divided by the corresponding standard deviation) (Gelman, 2008).
2.3. Characterizing the Spatio-Temporal Behavior of European Hake Recruits
This study used the spatio-temporal geostatistical model structure comparison proposed by Paradinas et al. (2017) to categorize the spatio-temporal behavior of European hake as either opportunistic, persistent or progressive (see Table 1 and Figure 2). These models use a geostatistical term that accounts for spatial autocorrelation in the data and can easily include different spatiotemporal extensions. In particular, opportunistic structures indicate that species change their spatial patterns every year without following any specific pattern, persistent structures imply that species have a spatial distribution that does not change every year, and progressive structures indicate that species change their spatial patterns in a correlated way from 1 year to another. The progressive structure contains an autoregressive ρt parameter (see Table 1) that controls the persistence level of the spatial effect. This ρt parameter is bound to [0, 1], where parameter values close to 0 represent more opportunistic behaviors and parameter values close to 1 represent more persistent distributions over time.
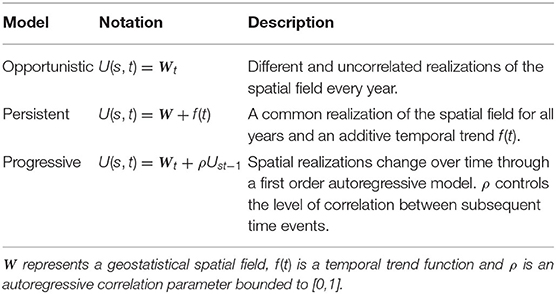
Table 1. Summary of fitted spatio-temporal models U(s, t).
Figure 2. Simulated spatio-temporal scenarios extracted from Paradinas et al. (2017). An opportunistic distribution shows big unrelated changes in the spatial structure among neighboring times. A persistent scenario has very similar spatial structures at every time. A progressive scenario has correlated spatial realization changes over time. (A) Opportunistic distribution. (B) Persistent distribution with trend. (C) Progressive spatio-temporal distribution.
The spatial field (Ws) (see Table 1) was modeled as a normal multivariate distribution with a zero mean and a Matérn covariance function that depends on its range (rw) and variance (σw). The temporal trend f(t) could follow any suitable function, for example, a linear effect, a smooth effect, an unstructured random term, etc.
2.4. Modeling European Hake Occurrence and Abundance Distribution
Spatio-temporal fisheries abundance data often involves a large proportion of zeros in observations, i.e., zero inflated data. These data are generally tackled using independent two-part models, also known as hurdle models. In these models, the occurrence and conditional-to-presence abundances (NPUE) are modeled independently. However, the variables abundance and detection probability are often related (Kéry et al., 2005), which violates the independence assumption in classic delta models. This study acknowledges that both processes could be related by fitting shared environmental and/or spatio-temporal effects through joint modeling techniques (Hogan and Laird, 1997; Held et al., 2005). We have a semi continuous dataset regarding the presence/absence and abundance data, as both processes are measured in the [0, ∞) interval (Paradinas et al., 2017). Moreover, the proportion of zeros in the data gets close to 30% for some of the years. Within this context, the application of a hurdle model enables that the first process determines the occurrence and the second the intensity when the response is non-zero, what makes the modeling process more informative.
Specifically, Y(s, t) and Z(s, t) denote the spatio-temporal distribution occurrence and the conditional-to-presence abundance (NPUE), respectively, where s = 1, ……, nt is the spatial location and t = 1, ...., T the temporal index, with i = 1, …, I representing the environmental variable in location s. As is generally done with these kinds of variables, we used a Bernoulli distribution to model the occurrence of Y(s, t). With respect to NPUE Z(s, t), we chose to model it with a gamma distribution, which is a probability distribution that helps to capture any possible overdispersion in the data. The mean of both variables was then related via the usual link functions (logit and log, respectively) to the environmental and spatio-temporal effects:
where π(s, t) represents the probability of occurrence at location s at time t, and μ(s, t) and ϕ represent the mean and dispersion of the conditional-to-presence abundance. The linear predictors, which indicate how parameters π(s, t) and μ(s, t) behave in space and time, are formed by: αY and αZ, i.e., the terms representing the intercepts of each variable; f() represents any function applied to our environmental variables Xi, which in our case were either a constant function (fixed effects) or a second order random walk (RW2) function to fit non-linear relationships (Fahrmeir and Lang, 2001); and the final terms, UY(s, t) and UZ(s, t) refer to the spatio-temporal structure of occurrence and the conditional-to-presence abundance, respectively, and may follow any of the three spatio-temporal structures described in the previous section. The scale parameters θi and θU permit differences in scale across both linear predictors in shared effects. It is important to note that sharing occurrence and conditional-to-presence abundance information to fit common environmental effects may not always improve the models, thus we tested all possible model combinations.
Vague prior distributions with a zero-mean and a standard deviation of 100 were implemented for all the fixed effects, the abundance process variance, and the scaling parameter (θ) of the shared effects. PC priors (Fuglstad et al., 2018) were used to describe prior knowledge of hyperparameters of the geostatistical terms and the ρ parameters of the RW2 functions. These priors were set as follows: if the prior probability of the spatial range was smaller than 0.5, it was set at 0.05, if the probability of the spatial variance was larger than 0.6, it was also set at 0.05, and if the probability that the precision of the RW2 effects was larger than 0.5, it was set at 0.01. A sensitivity analysis of the choice of priors was performed by verifying that the posterior distributions concentrated well within the support of the priors (Zuur et al., 2017).
Model selection was performed by testing all possible combinations among the possible spatio-temporal structures and variables using the Watanabe Akaike Information Criterion (WAIC) (Watanabe, 2010) for goodness of fit and the mean logarithm of the Conditional Predictive Ordinate (LCPO) (Roos et al., 2011) as a predictive quality measure. For both measures, the smaller the score, the better the model. All models were fitted using the integrated nested Laplace approximation (INLA) (Rue et al., 2009) approach in the R-INLA software. The R-INLA code for the applied models can be found on this GitHub repository.
From the final spatio-temporal model output we obtained the mean yearly habitat-based recruits abundance index. For comparison purposes, we created a stock assessment strata-based index for the number of hake recruits (<21 cm), standardized for the area of their corresponding bathymetric strata (from 70 to 500 m) (ICES, 2017).
Finally, we defined hake nurseries as high recruit aggregation areas which are persistent over the time. Thus, for the average of a given n-years period we are able to identify potential nursery areas with the contour polygon based on the NPUE above 90th percentile, as described in Paradinas et al. (2020).
3. Results
3.1. Spatio-Temporal Structure Selection
With respect to the spatio-temporal structures, the shared components showed better goodness of fit in the opportunistic and persistent models (Table 2). However, the best structure was the progressive model with non-shared spatio-temporal effects. This means that the spatial occurrence and abundance patterns of recruits change in a correlated way from 1 year to the next, but that both sub-processes behave considerably different from one another. This structure was selected for the final model because it had the lowest WAIC value. It should be mentioned that the progressive structure had the largest computational time, with a notable difference (Table 2).
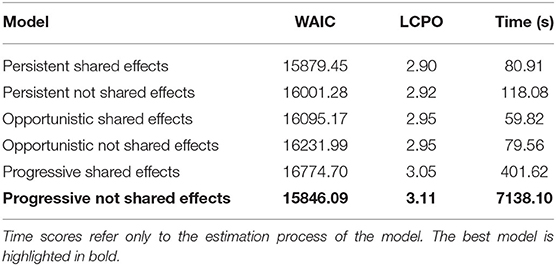
Table 2. Spatio-temporal structures comparison for the conditional-to-presence abundance distribution European hake recruits' model based on WAIC and LCPO scores.
3.2. Variable Selection
Concerning the environmental variables, bathymetry was the most important predictor to defining the distribution occurrence and abundance of hake recruits in the study area (Table 3). Although, in terms of WAIC, the best models were those that included bathymetry and either SBS or SBT, the difference between these models and the model that only included bathymetry was rather negligible (i.e., lower than 5 units). This means that the variability of the hake recruit abundance is mostly affected by bathymetry and spatio-temporal effects. Therefore, and following a parsimony principle, the selected model included only a shared bathymetric effect as a covariate.
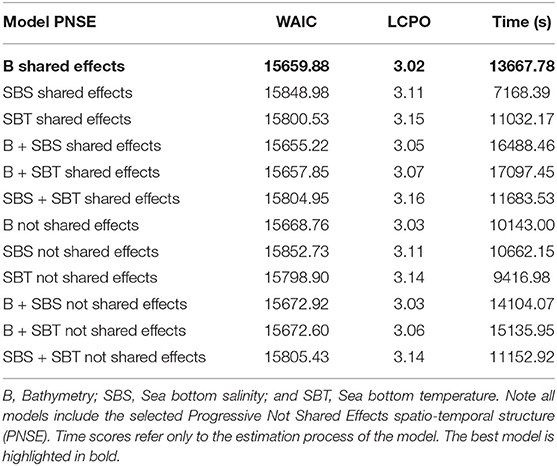
Table 3. Environmental effects comparison for the conditional-to-presence abundance distribution European hake recruits' model based on WAIC and LCPO scores.
3.3. Final Model
Given that the only relevant variable included in the final model was bathymetry, original scale units were used to facilitate interpretation of the partial effect. There is an optimum bathymetric range between 140 and 200 m for both the occurrence and abundance of hake recruits (see Figure 3). This means that hake recruit abundance decreases gradually with bathymetry, as presented in Figure 3.
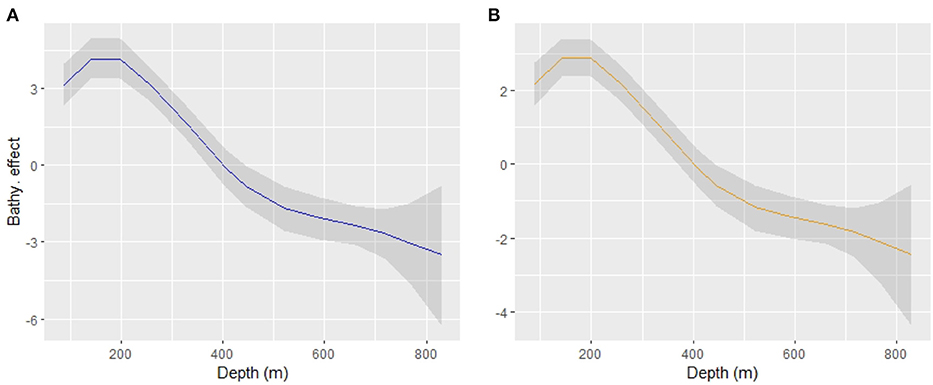
Figure 3. Smoothed bathymetric effect (“RW2”) for the sub-process Binomial (A) and Gamma (B) in the linear predictor scale (logarithmic link).
The selection of an autoregressive temporal term in the model suggests the presence of a certain degree of temporal persistence in the spatial distribution of hake recruits in the study area. These results were supported by the high temporal correlation parameters (ρ) of the progressive spatio-temporal structures (0.99 and 0.96 for the occurrence and conditional-to-presence abundances, respectively).
With respect to the posterior distribution mean of the occurrence spatial effect, only slight changes were observed between years (Figure 4). This result highlights a clear stable structure for the presence of hake recruits in the study area that remains constant throughout the whole period. However, the mean spatial effect for abundance had high inter-annual variation, thereby reflecting changes to recruit concentration areas over the time (Figure 5). We can observe similar patterns in the standard deviation maps of the posterior distribution of the spatial effect for both the occurrence and abundance sub-processes (see Supplementary Figures 6, 7).
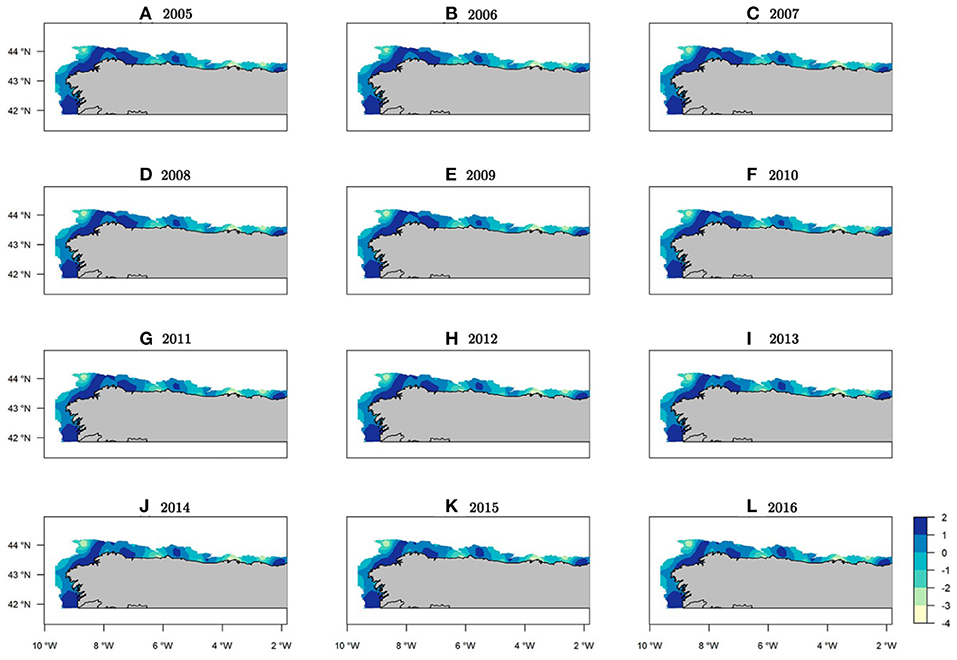
Figure 4. Spatio-temporal occurrence maps for Merluccius merluccius recruits in the northeast Atlantic showing mean spatial effects (log-scale) for the probability of presence.
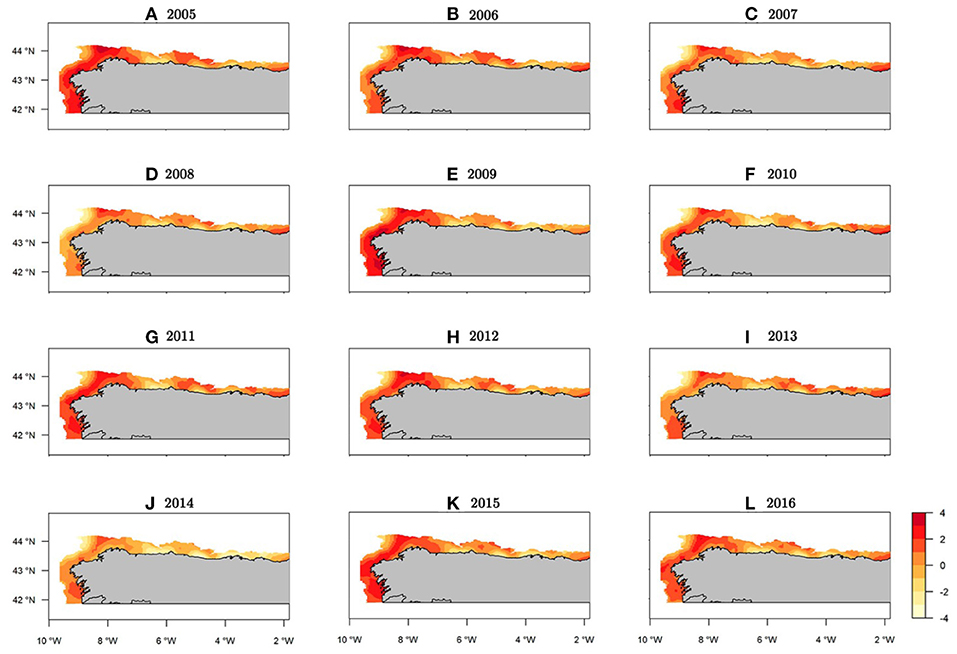
Figure 5. Spatio-temporal abundance (NPUE) maps for Merluccius merluccius recruits in the northeast Atlantic showing mean spatial effects (log-scale).
The median of the posterior predictive distribution for the occurrence revealed that the areas with the presence of hake recruits have a constant spatial pattern over time (Figure 6). However, abundance did not show the same spatio-temporal behavior. Indeed, we found areas with a persistent high concentrations of recruits over time, as well as intermittent zones (Figure 7).
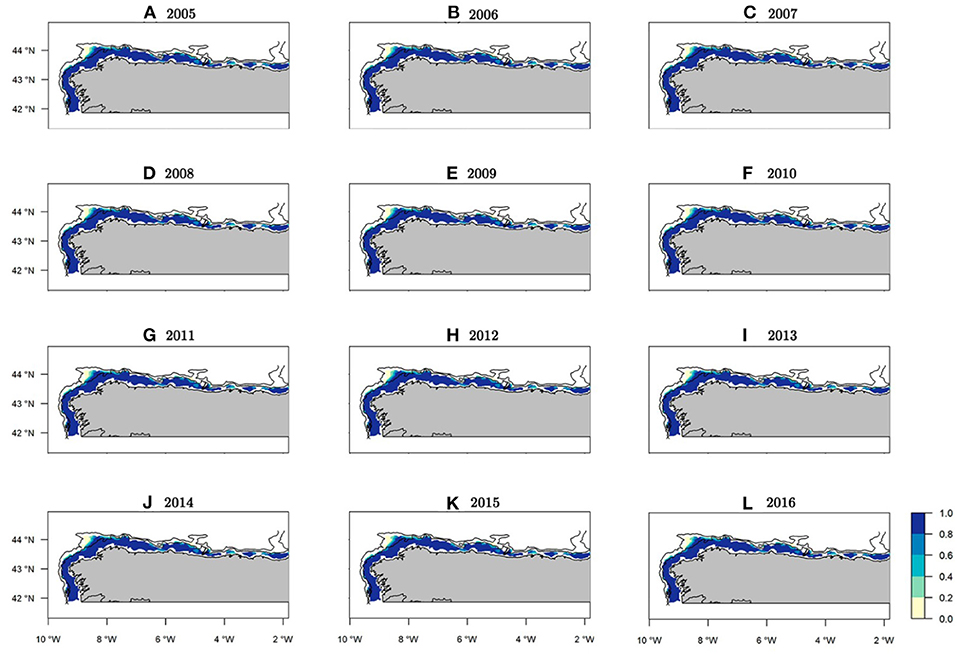
Figure 6. Median occurrence probability maps of the posterior predictive distribution for European hake recruits within the study period. Bathymetric lines correspond to 200 and 800 m isobath.

Figure 7. Median abundance (NPUE) maps of the posterior predictive distribution for European hake recruits within the study period. Bathymetric lines correspond to 200 and 800 m isobath. Note each year has it's own scale in order to show where the spatial hotspots are located along the study period.
Within the study area, the northwest area of the Iberian Peninsula presented the highest concentration of recruits throughout the entire period (Figure 7). Specifically, from west to east three persistent areas were identified: the area in front of Vigo, the Artabrian gulf (off La Coruña) and La Carretera (Figures 7, 1). Three intermittent areas were identified: one in front of Santander and the other two corresponding to the Bermeo and Guetaria-Fuenterrabía spatial closure areas (Figures 7, 1). The years with the greatest hake recruit abundance were 2005 and 2009, whereas the years with the lowest values were 2008 and 2014 (Supplementary Figure 8).
Regarding the variability of the generated predictions, estimates corresponding to the first and third quartiles showed a spatial pattern very similar to the predicted posterior median, thereby suggesting a good degree of accuracy with respect to the uncertainty of the model for both the occurrence and abundance of recruits (Figure 8). The yearly maps that correspond to the three quartiles for occurrence and abundance can be found in Supplementary Figures 8–13. In addition, we identified the main aggregation areas with a NPUE above the 90th percentile to be potential hake nurseries, taking into account the average of all study years (2005–2016) (Figure 8). The overlapping area between the FRA of La Coruña and the main identified nursery area is about the 27.46% (800.250 km2) (see Supplementary Figure 14).
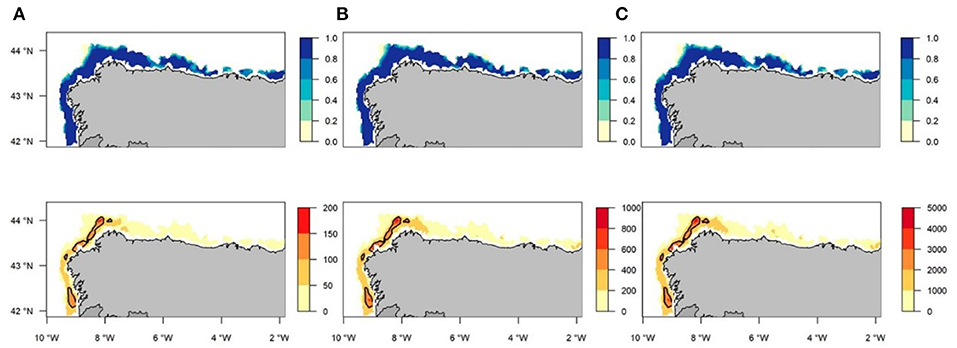
Figure 8. Total mean for all years (2005–2016) correspondent to the first (A), second (B), and third (C) quartiles for occurrence probability (blue) and abundance (orange) of European Hake recruits posterior predictive distribution maps. Contour lines indicates potential nursery areas identified with abundance (NPUE) above the 90th percentile.
The mean predicted posterior abundance trend of European hake recruits was similar to the trend of the designed strata-based index that would be commonly used as an input for stock assessment models. However, the output from our model showed lower mean abundance values within the entire study period, specifically for the years 2009 and 2015, where the strata based index values were high (Figure 9).
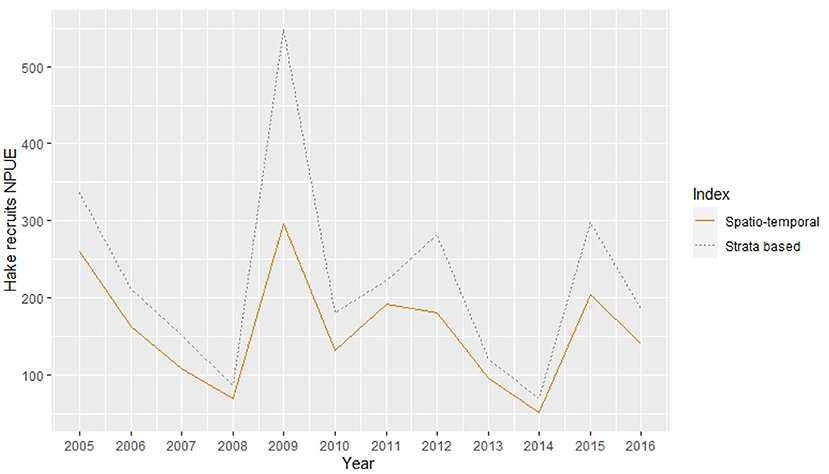
Figure 9. Mean hake recruits abundance (num. recruits/30 min. trawl) indices along the study period. Dashed line represent the strata based index while solid line represent the spatio-temporal model predicted output index.
4. Discussion
In order to implement fisheries restricted areas (FRAs), a spatial characterization of the key life–cycle habitats of commercial stocks, such hake nursery or spawning grounds, is required. Here, we apply a methodological approach to identify nursery grounds based on the spatio–temporal persistence of recruit aggregation areas.
Coinciding with Paradinas et al. (2017), the best spatio-temporal structure was the progressive one with non-shared effects. This result suggests that hake recruitment data is generated in two different steps : (1) identifying the probability of observing hake recruits, and if present, (2) identifying their abundance. However, the nature of the process under study leads us to believe that this apparent independence is a consequence of the survey sampling effort, rather than a result of two different processes. The SP-NSGFS Q4 survey trawls a relatively big area, and therefore the probability of observing at least one individual of an abundant fish species, such as hake, is quite high in environmentally not-too-challenging areas. However, if effort had been increased to deeper areas, the detection probability would have decreased proportionally, and thus, generated a lot more zeros in our dataset. Occurrence and abundance have been shown to respond equal and differently depending on the environmental variables, as it has been observed for different elasmobranch species in the Mediterranean, therefore, they are modeled by semi-independent processes (Lauria et al., 2015). This result is highly related to the life habits of a species and their age-size, since the individuals have a wide spatial distribution range where they are present, but they can be more abundant in areas where environmental preferred conditions take place (i.e., trophic niche). In our case of study, due to the benthic habits of European hake recruits, we consider that the occurrence, abundance and environmental variables are modeled by the same generating process.
Among all the covariates tested, SBS and SBT were the least relevant at explaining the occurrence and abundance of hake recruits in the study area. Similar results were observed by Paradinas et al. (2015), who found that surface temperature and type of substrate were not relevant to recruiting hake in the Mediterranean. However, different results have been reported in literature. A study of regime shifts carried out by Goikoetxea and Irigoien (2013) found that temperature increase anomalies had a positive effect on hake recruitment from the northeast Atlantic. In the Ligurian Sea northern hake nursery area, Abella et al. (2008) found a negative correlation between the North Atlantic Oscillation (NAO) index and recruitment success. In the Mediterranean, high peaks in water temperatures during summer resulted in a decreased abundance of hake recruits in autumn (Bartolino et al., 2008), therefore demonstrating that the changes produced in a given month have indirect effects on the abundance of individuals in subsequent months. Results from the present study indicate that SBT did not have a big influence on recruitment in the same month, however, it would be interesting to test environmental variables with temporal lags for future studies.
Regarding bathymetry, in recent studies it has been observed to be an important variable that contributes to explaining the spatial distribution of both hake recruits (Sánchez and Serrano, 2003; Abella et al., 2005; Colloca et al., 2015; Paradinas et al., 2015; Pennino et al., 2019) and adults (Agostini et al., 2008). The final model predicted the highest occurrence and abundance probabilities of hake recruits to be at a range of between 100 and 250 m deep, with a constant optimum range between 140 and 200 m. The same bathymetric range for hake at age 0 along the shelf break was identified by the authors Colloca et al. (2015) in Mediterranean nurseries. In contrast, our results differ from the study carried out by Sánchez and Gil (2000) for the southern hake stock in the study area, which found a range between 90 and 180 m deep with a maximum peak of abundance at 100 m. However, these authors analyzed a previous period of years and the defined size of the recruits was <17 cm instead of <21 cm. These differences could be associated with the ontogenetic deepening phenomena, as the average size of individuals could increase with depth over the time. Ontogenetic deepening in the northeast Atlantic has been reported for different species by Baudron et al. (2019), whereby the depth of medium and large northern hake presented a decreasing trend between 2000 and 2004, followed by lower values than the previous time period analyzed. However, further research in hake size-depth should be carried out to test this hypothesis given that we only analyzed a single size, and thus, other factors could be influencing this process, such as optimal growth temperatures, predation, or fishing pressure (Audzijonyte and Pecl, 2018).
The spatio-temporal concentration of hake juveniles has been found to be related to mesoscale oceanographic processes (eddies), as previously described by Sánchez and Gil (2000). These processes have an important influence on the retention of hake recruits and zooplankton. Moreover, the concentration of juveniles could also be due to spatial aggregation based on size-dependent shoaling or trophic behavior, as has been demonstrated in other Merluccius species (Gordoa and Duarte, 1991). In a study by Sánchez and Serrano (2003) in the Cantabrian sea, the hydrographic scenario best explained by the environmental variables had a weak Navidad current and high upwelling index events, with depth found to be the most influential abiotic factor in determining the assemblages of fish species, such as hake. These authors pointed out that a bathymetric spatial pattern structure of fish communities remained relatively constant throughout the study period, especially when there was a lack of mesoscale activity over the shelf. For these reasons, we consider that bathymetry may not directly explain the distribution of hake recruits, however, it could be associated to hake recruit habitat preference bathymetric conditions, given that environmental variables, such as temperature, chlorophyll and light, or processes, such as species aggregations, are distributed and reflected in the gradient of depth. To better understand the main drivers on recruit aggregations, other oceanographic events (upwelling, currents, mesoscale eddies, among others) and biotic variables (i.e., primary production) should be taken into account in future models.
With respect to abundance predictions throughout the study period, we identified persistent hake recruit aggregation areas to be the one in front of Vigo, the Artabrian gulf (off La Coruña), and La Carretera, and intermittent areas to be the one in front of Santander, Bermeo, and Guetaria-Fuenterrabía, respectively. These results differ slightly from the nursery areas identified by Sánchez and Gil (2000) studied up to the year 1995, who found the persistent areas to be La Coruña, La Carretera, and an intermediate area between both called Ribadeo, and two small aggregations that only appeared in years with high annual class strength, Fuenterrabía and the area off Vigo. In addition, we also defined potential nursery areas with NPUE above the 90th percentile for the total average study period (2005-2016), where four contoured regions in the northwestern part of the Iberian Peninsula have been identified. Our results are very similar to the results obtained by Pennino et al. (2019) for the period 1997–2016. However, an important difference between both studies is that the predicted abundance maps for each year can help us to assess the recruit inter-annual spatial aggregation patterns which could be different from distant years within a large time period. Thus, regarding spatio-temporal management goals, a recent and stable set of years must be selected, rather than the whole study period, in order to identify potential nursery areas.
It should be noted that certain areas identified as persistent coincide with permanent spatial closure areas (La Coruña and La Carretera), whereas some of the intermittent areas coincide with temporary spatial closure areas (Bermeo, Guetaria, and Fuenterrabía) that have a lower bathymetric limit of 100 meter isobath (BOE, 2015). It is worth mentioning that the functional hake size analyzed in this study (<21 cm) only partially coincides with the size that fishing closures are focused on, since smaller individuals are not captured by commercial trawls. In the Mediterranean, the authors Colloca et al. (2015) evidenced that the main persistent areas of hake overlapped in a 15.3% with the areas subjected to some kind of fishery restriction. We found that the main FRA of La Coruña coincides in a 27.46% with our identified nursery area. As was pointed by Carlucci et al. (2009), the non-take zones for this species could be positively influencing the main recruitment areas and a possible spillover may benefit the adults population. Thus, spatial management in order to increase the protection of these areas could be key in order to benefit the stock renewal of the species, specifically for years where the environment negatively affects them.
The results found in the present study provide important insights into hake nursery grounds along the time and demonstrate that they are stable, despite possible changes in external variables. Moreover, this information is important toward elaborating a spatially explicit management plan. Indeed, this study demonstrated that despite the high mobility and interannual variability in the peak of abundance locations, some areas consistently offer favorable nursery grounds for this species, thus making the task of protecting them easier.
By contrast, the resulting output index from our spatio-temporal model showed lower temporal variation in the mean abundance trend than in the strata-based index. The estimated mean abundance was lower for the whole study period, specifically for the years with considerably high recruit catch values. Recent studies with similar results have evidenced the advantages of including spatio-temporal variability and habitat covariates into abundance indices in order to calibrate stock assessment models. For example, Cao et al. (2017) pointed out that the resulting index from a spatio-temporal habitat model showed a similar trend to the classic strata-based index for the northern shrimp (Pandalus borealis) in Canadian waters. Despite this, the results from the assessment model showed a better goodness of fit, as well as better predicted abundance, for the spatio-temporal index input (Cao et al., 2017). In the study carried out by Shelton et al. (2014) of darkblotched rockfish (Sebastes crameri), the habitat model, including environmental covariates and spatial correlations, showed smoothed abundance changes over extreme values, whereas strata models with adjusted abundance were too sensitive for these events. Furthermore, changes in hake distribution among years can also bias the strata-based index as a abundance index for calibration purposes in stock assessment models. This indicates that spatio-temporal habitat model indices can give more precise and interpretable abundance estimates than classical design strata methods.
Given the above, we argue that our proposed model, which considerably reduces data uncertainty by including spatio-temporal and bathymetric effects, could be used as input data to calibrate length based assessment models, such as the GADGET (Taylor et al., 2007) and Stock Synthesis 3 (SS3) (Methot and Wetzel, 2013) models used by ICES. Results from B-HSTHMs could be used as a base to make catch recommendations to sustainable manage a population (ICES, 2018a) and could be applied to improve the quality of hake or other species abundance estimates included in stock assessments, thus contributing to increasing accuracy in scientific advice on catch recommendations.
Data Availability Statement
Publicly available datasets were analyzed in this study. The dataset analyzed for this study can be found in the DATRAS https://www.ices.dk/data/data-portals/Pages/DATRAS.aspx.
Author Contributions
FI, IPa, MP, SC, and DC designed the research. FI, IPa, MP, SC, DC, FS-R, and AF performed the research. FI, IPa, and MP analyzed the data. FV, AP, and IPr collected the data. All authors wrote the paper.
Funding
DEMERSALES surveys were co-funded by the EU within the Spanish national program for the collection, management, and use of data in the fisheries sector and support for scientific advice regarding the Common Fisheries Policy. This study was a contribution to the project IMPRESS (RTI2018-099868-B-I00), European Regional Development Fund (ERDF), Ministry of Science, Innovation and Universities—State Research Agency.
Conflict of Interest
The authors declare that the research was conducted in the absence of any commercial or financial relationships that could be construed as a potential conflict of interest.
Acknowledgments
The authors express their gratitude to all the people that work in the SP-NSGFS Q4 surveys. DC would like to thank project PID2019-106341GB-I100 also from Ministry of Science, Innovation and Universities—State Research Agency.
Supplementary Material
The Supplementary Material for this article can be found online at: https://www.frontiersin.org/articles/10.3389/fmars.2021.614675/full#supplementary-material
References
Abad, E., Pennino, M. G., Valeiras, J., Vilela, R., Bellido, J. M., Punzón, A., et al. (2019). Integrating spatial management measures into fisheries: the Lepidorhombus spp. case study. Mar. Policy 116:103739. doi: 10.1016/j.marpol.2019.103739
Abella, A., Fiorentino, F., Mannini, A., and Relini, L. O. (2008). Exploring relationships between recruitment of European hake (Merluccius merluccius l. 1758) and environmental factors in the ligurian sea and the strait of sicily (central Mediterranean). J. Mar. Syst. 71, 279–293. doi: 10.1016/j.jmarsys.2007.05.010
Abella, A., Serena, F., and Ria, M. (2005). Distributional response to variations in abundance over spatial and temporal scales for juveniles of European hake (Merluccius merluccius) in the western Mediterranean sea. Fish. Res. 71, 295–310. doi: 10.1016/j.fishres.2004.08.036
Agostini, V., Hendrix, A., Hollowed, A., Wilson, C., Pierce, S., and Francis, R. (2008). Climate-ocean variability and pacific hake: a geostatistical modeling approach. J. Mar. Syst. 71, 237–248. doi: 10.1016/j.jmarsys.2007.01.010
Alvarez, P., Fives, J., Motos, L., and Santos, M. (2004). Distribution and abundance of European hake Merluccius merluccius (L.), eggs and larvae in the north east Atlantic waters in 1995 and 1998 in relation to hydrographic conditions. J. Plankton Res. 26, 811–826. doi: 10.1093/plankt/fbh074
Alvarez, P., Motos, L., Uriarte, A., and Egaña, J. (2001). Spatial and temporal distribution of European hake, Merluccius merluccius (L.), eggs and larvae in relation to hydrographical conditions in the bay of biscay. Fish. Res. 50, 111–128. doi: 10.1016/S0165-7836(00)00245-9
Audzijonyte, A., and Pecl, G. T. (2018). Deep impact of fisheries. Nat. Ecol. Evol. 2, 1348–1349. doi: 10.1038/s41559-018-0653-9
Bartolino, V., Colloca, F., Sartor, P., and Ardizzone, G. (2008). Modelling recruitment dynamics of hake, Merluccius merluccius, in the central Mediterranean in relation to key environmental variables. Fish. Res. 92, 277–288. doi: 10.1016/j.fishres.2008.01.007
Baudron, A. R., Pecl, G., Gardner, C., Fernandes, P. G., and Audzijonyte, A. (2019). Ontogenetic deepening of northeast Atlantic fish stocks is not driven by fishing exploitation. Proc. Natl. Acad. Sci. U.S.A. 116, 2390–2392. doi: 10.1073/pnas.1817295116
BOE (1996). España. orden de 28 de noviembre de 1996 por la que se establece una zona de veda en determinada area del litoral cantábrico. Boletín Oficial del Estado 292, 36489–36490. Available online at: https://www.boe.es/eli/es/o/1996/11/28/(4)
BOE (2015). España. orden aaa/2534/2015, de 17 de noviembre, por la que se establece un plan de gestión para los buques de los censos del caladero nacional del cantábrico y noroeste. Boletín Oficial del Estado 286, 113184–113217. Available online at: https://www.boe.es/eli/es/o/2015/11/17/aaa2534
Cao, J., Thorson, J. T., Richards, R. A., and Chen, Y. (2017). Spatiotemporal index standardization improves the stock assessment of northern shrimp in the Gulf of Maine. Can. J. Fish. Aquat. Sci. 74, 1781–1793. doi: 10.1139/cjfas-2016-0137
Carlucci, R., Giuseppe, L., Porzia, M., Francesca, C., Alessandra, M. C., Letizia, S., et al. (2009). Nursery areas of red mullet (Mullus barbatus), hake (Merluccius merluccius) and deep-water rose shrimp (Parapenaeus longirostris) in the eastern-central Mediterranean sea. Estuar. Coast. Shelf Sci. 83, 529–538. doi: 10.1016/j.ecss.2009.04.034
Casey, J., and Pereiro, J. (1995). “European hake (M. merluccius) in the North-east Atlantic,” in Hake (Dordrecht: Springer), 125–147.
Colloca, F., Bartolino, V., Lasinio, G. J., Maiorano, L., Sartor, P., and Ardizzone, G. (2009). Identifying fish nurseries using density and persistence measures. Mar. Ecol. Prog. Ser. 381, 287–296. doi: 10.3354/meps07942
Colloca, F., Garofalo, G., Bitetto, I., Facchini, M. T., Grati, F., Martiradonna, A., et al. (2015). The seascape of demersal fish nursery areas in the north mediterranean sea, a first step towards the implementation of spatial planning for trawl fisheries. PLoS ONE 10:e0119590. doi: 10.1371/journal.pone.0119590
Diekert, F. K., Hjermann, D. Ø., Nævdal, E., and Stenseth, N. C. (2010). Spare the young fish: optimal harvesting policies for North-East Arctic Cod. Environ. Resour. Econ. 47, 455–475. doi: 10.1007/s10640-010-9388-z
Domínguez-Petit, R., Korta, M., Saborido-Rey, F., Murua, H., Sainza, M., and Piñeiro, C. (2008). Changes in size at maturity of European hake atlantic populations in relation with stock structure and environmental regimes. J. Mar. Syst. 71, 260–278. doi: 10.1016/j.jmarsys.2007.04.004
Dormann, C. F. (2007). Effects of incorporating spatial autocorrelation into the analysis of species distribution data. Glob. Ecol. Biogeogr. 16, 129–138. doi: 10.1111/j.1466-8238.2006.00279.x
Druon, J. N., Fiorentino, F., Murenu, M., Knittweis, L., Colloca, F., Osio, C., et al. (2015). Modelling of European hake nurseries in the Mediterranean sea: an ecological niche approach. Prog. Oceanogr. 130, 188–204. doi: 10.1016/j.pocean.2014.11.005
EU (2019). Regulation (EU) 2019/472 of the European Parliament and of the Council of 19 March 2019 establishing a multiannual plan for stocks fished in the western waters and adjacent waters, and for fisheries exploiting those stocks, amending regulations (EU) 2016/1139 and (EU) 2018/973, and repealing council regulations (EC) no 811/2004, (EC) no 2166/2005, (EC) no 388/2006, (EC) no 509/2007 and (EC) no 1300/2008. Off. J. Eur. Union 83/1-83/17. Available online at: https://eur-lex.europa.eu/eli/reg/2019/472/oj
Fahrmeir, L., and Kneib, T. (2008). “On the identification of trend and correlation in temporal and spatial regression,” in Recent Advances in Linear Models and Related Areas (Springer), 1–27. doi: 10.1007/978-3-7908-2064-5_1
Fahrmeir, L., and Lang, S. (2001). Bayesian semiparametric regression analysis of multicategorical time-space data. Ann. Inst. Stat. Math. 53, 11–30. doi: 10.1023/A:1017904118167
FAO (2016). Report of the “Workshop on Impacts of Marine Protected Areas on Fisheries Yield, Fishing Communities and Ecosystems”. FAO Fisheries and Aquaculture Report, 1–45.
Fiorentino, F., Garofalo, G., De Santi, A., Bono, G., Giusto, G. B., and Norrito, G. (2003). “Spatio-temporal distribution of recruits (0 group) of Merluccius merluccius and Phycis blennoides (Pisces, Gadiformes) in the Strait of Sicily (Central Mediterranean),” in Migrations and Dispersal of Marine Organisms. Developments in Hydrobiology, Vol. 174, eds M. B. Jones, A. Ingólfsson, E. Ólafsson, G. V. Helgason, K. Gunnarsson, and J. Svavarsson (Dordrecht: Springer). doi: 10.1007/978-94-017-2276-6_23
Fox, J., and Weisberg, S. (2011). CAR: Companion to Applied Regression. Available online at: http://cran.R-project.org/package=car
Fuglstad, G. A., Simpson, D., Lindgren, F., and Rue, H. (2018). Constructing priors that penalize the complexity of gaussian random fields. J. Am. Stat. Assoc. 114, 445–452. doi: 10.1080/01621459.2017.1415907
Garofalo, G., Fortibuoni, T., Gristina, M., Sinopoli, M., and Fiorentino, F. (2011). Persistence and co-occurrence of demersal nurseries in the strait of sicily (central Mediterranean): implications for fishery management. J. Sea Res. 66, 29–38. doi: 10.1016/j.seares.2011.04.008
Gelman, A. (2008). Scaling regression inputs by dividing by two standard deviations. Stat. Med. 27, 2865–2873. doi: 10.1002/sim.3107
Gil, J., and Sánchez, F. (2003). “Aspects concerning the occurrence of summer upwelling along the southern Bay of Biscay during 1993-2000,” in ICES Marine Science Symposia, Vol. 219, 337–339.
Goikoetxea, N., and Irigoien, X. (2013). Links between the recruitment success of northern European hake (Merluccius merluccius L.) and a regime shift on the NE Atlantic continental shelf. Fish. Oceanogr. 22, 459–476. doi: 10.1111/fog.12033
Gordoa, A., and Duarte, C. M. (1991). Size-dependent spatial distribution of hake (Merluccius capensis and Merluccius paradoxus) in Namibian waters. Can. J. Fish. Aquat. Sci. 48, 2095–2099. doi: 10.1139/f91-248
Hefley, T. J., Broms, K. M., Brost, B. M., Buderman, F. E., Kay, S. L., Scharf, H. R., et al. (2017). The basis function approach for modeling autocorrelation in ecological data. Ecology 98, 632–646. doi: 10.1002/ecy.1674
Held, L., Natário, I., Fenton, S. E., Rue, H., and Becker, N. (2005). Towards joint disease mapping. Stat. Methods Med. Res. 14, 61–82. doi: 10.1191/0962280205sm389oa
Hijmans, R. J., and van Etten, J. (2018). Raster: Geographic Analysis and Modeling With Raster Data. R package version 2.7-15. Available online at: http://CRAN.R-project.org/package=raster
Hogan, J. W., and Laird, N. M. (1997). Mixture models for the joint distribution of repeated measures and event times. Stat. Med. 16, 239–257. doi: 10.1002/(SICI)1097-0258(19970215)16:3<239::AID-SIM483>3.0.CO;2-X
Hurlbert, S. H. (1984). Pseudoreplication and the design of ecological field experiments. Ecol. Monogr. 54, 187–211. doi: 10.2307/1942661
ICES (2017). Manual of the IBTS North Eastern Atlantic Surveys. Series of ICES Survey Protocols SISP 15, 92. doi: 10.17895/ices.pub.3519
ICES (2018a). International Council for the Exploration of the Sea Report of the Working Group for the Bay of Biscay and the Iberian Waters Ecoregion (WGBIE). Copenhagen: ICES HQ; ICES CM/ACOM.
ICES (2018b). Hake (Merluccius merluccius) in Divisions 8.c and 9.a, Southern Stock (Cantabrian Sea and Atlantic Iberian Waters). ICES Advice on Fishing Opportunities, Catch, and Effort. Copenhagen: ICES HQ; ICES CM/ACOM. doi: 10.17895/ices.pub.4464
Kéry, M., Royle, J. A., and Schmid, H. (2005). Modeling avian abundance from replicated counts using binomial mixture models. Ecol. Appl. 15, 1450–1461. doi: 10.1890/04-1120
Korta, M., García, D., Santurtún, M., Goikoetxea, N., Andonegi, E., Murua, H., et al. (2015). “European hake (Merluccius merluccius) in the Northeast Atlantic Ocean,” in Hakes, ed H. Arancibia (John Wiley & Sons, Ltd), 1–37. doi: 10.1002/9781118568262.ch1
Latimer, A. M., Wu, S., Gelfand, A. E., and Silander, J. A. Jr. (2006). Building statistical models to analyze species distributions. Ecol. Appl. 16, 33–50. doi: 10.1890/04-0609
Lauria, V., Gristina, M., Attrill, M., Fiorentino, F., and Garofalo, G. (2015). Predictive habitat suitability models to aid conservation of elasmobranch diversity in the central mediterranean sea. Sci. Rep. 5:13245. doi: 10.1038/srep13245
Methot, R. D. Jr., and Wetzel, C. R. (2013). Stock synthesis: a biological and statistical framework for fish stock assessment and fishery management. Fish. Res. 142, 86–99. doi: 10.1016/j.fishres.2012.10.012
Muñoz, F., Pennino, M. G., Conesa, D., López-Quílez, A., and Bellido, J. M. (2013). Estimation and prediction of the spatial occurrence of fish species using bayesian latent gaussian models. Stoch. Environ. Res. Risk Assess. 27, 1171–1180. doi: 10.1007/s00477-012-0652-3
Murua, H. (2010). “Chapter two - the biology and fisheries of European Hake, Merluccius merluccius, in the North-East Atlantic,” in Advances in Marine Biology, Vol. 58, ed M. Lesser (Academic Press), 97–154. doi: 10.1016/B978-0-12-381015-1.00002-2
Paradinas, I., Conesa, D., López-Quílez, A., and Bellido, J. M. (2017). Spatio-temporal model structures with shared components for semi-continuous species distribution modelling. Spat. Stat. 22, 434–450. doi: 10.1016/j.spasta.2017.08.001
Paradinas, I., Conesa, D., López-Quílez, A., Esteban, A., Martín López, L., Bellido, J., et al. (2020). Assessing the spatiotemporal persistence of fish distributions: a case study on red mullet (Mullus surmuletus and M. barbatus) in the western Mediterranean. Mar. Ecol. Prog. Ser. 644, 173–185. doi: 10.3354/meps13366
Paradinas, I., Conesa, D., Pennino, M. G., Muñoz, F., Fernández, A. M., López-Quílez, A., et al. (2015). Bayesian spatio-temporal approach to identifying fish nurseries by validating persistence areas. Mar. Ecol. Prog. Ser. 528, 245–255. doi: 10.3354/meps11281
Pennino, M. G., Vilela, R., Bellido, J. M., and Velasco, F. (2019). Balancing resource protection and fishing activity: the case of the European hake in the northern Iberian peninsula. Fish. Oceanogr. 28, 54–65. doi: 10.1111/fog.12386
Pitchford, J. W., Codling, E. A., and Psarra, D. (2007). Uncertainty and sustainability in fisheries and the benefit of marine protected areas. Ecol. Modell. 207, 286–292. doi: 10.1016/j.ecolmodel.2007.05.006
R Core Team (2017). R: A Language and Environment for Statistical Computing. Vienna: R Foundation for Statistical Computing.
Roos, M.Held, L., et al. (2011). Sensitivity analysis in bayesian generalized linear mixed models for binary data. Bayes. Anal. 6, 259–278. doi: 10.1214/11-BA609
Rue, H., Martino, S., and Chopin, N. (2009). Approximate Bayesian inference for latent Gaussian models by using integrated nested Laplace approximations. J. R. Stat. Soc. B. 71, 319–392. doi: 10.1111/j.1467-9868.2008.00700.x
Sánchez, F., and Gil, J. (2000). Hydrographic mesoscale structures and poleward current as a determinant of hake (Merluccius merluccius) recruitment in southern Bay of Biscay. ICES J. Mar. Sci. 57, 152–170. doi: 10.1006/jmsc.1999.0566
Sánchez, F., and Olaso, I. (2004). Effects of fisheries on the Cantabrian sea shelf ecosystem. Ecol. Modell. 172, 151–174. doi: 10.1016/j.ecolmodel.2003.09.005
Sánchez, F., and Serrano, A. (2003). “Variability of groundfish communities of the Cantabrian Sea during the 1990s,” in ICES Marine Science Symposia, Vol. 219, 249–260.
Shelton, A. O., Thorson, J. T., Ward, E. J., and Feist, B. E. (2014). Spatial semiparametric models improve estimates of species abundance and distribution. Can. J. Fish. Aquat. Sci. 71, 1655–1666. doi: 10.1139/cjfas-2013-0508
Taylor, L., Begley, J., Kupca, V., and Stefansson, G. (2007). A simple implementation of the statistical modelling framework gadget for cod in icelandic waters. Afr. J. Mar. Sci. 29, 223–245. doi: 10.2989/AJMS.2007.29.2.7.190
Tobler, W. R. (1970). A computer movie simulating urban growth in the detroit region. Econ. Geogr. 46, 234–240. doi: 10.2307/143141
Tsitsika, E. V., Maravelias, C. D., and Haralabous, J. (2007). Modeling and forecasting pelagic fish production using univariate and multivariate arima models. Fish. Sci. 73, 979–988. doi: 10.1111/j.1444-2906.2007.01426.x
Watanabe, S., and Opper, M. (2010). Asymptotic equivalence of Bayes cross validation and widely applicable information criterion in singular learning theory. J. Machine Learn. Res. 11, 3571–3594.
Zuur, A. F., Ieno, E. N., and Elphick, C. S. (2010). A protocol for data exploration to avoid common statistical problems. Methods Ecol. Evol. 1, 3–14. doi: 10.1111/j.2041-210X.2009.00001.x
Keywords: bayesian models, European hake, hurdle-model, recruits, stock assessment, spatial ecology, INLA approach
Citation: Izquierdo F, Paradinas I, Cerviño S, Conesa D, Alonso-Fernández A, Velasco F, Preciado I, Punzón A, Saborido-Rey F and Pennino MG (2021) Spatio-Temporal Assessment of the European Hake (Merluccius merluccius) Recruits in the Northern Iberian Peninsula. Front. Mar. Sci. 8:614675. doi: 10.3389/fmars.2021.614675
Received: 06 October 2020; Accepted: 04 January 2021;
Published: 28 January 2021.
Edited by:
Antonio Di Franco, Stazione Zoologica Anton Dohrn, ItalyReviewed by:
Germana Garofalo, Institute for Biological Resources and Marine Biotechnology (CNR), ItalyNerea Goikoetxea, AZTI Foundation, Spain
Copyright © 2021 Izquierdo, Paradinas, Cerviño, Conesa, Alonso-Fernández, Velasco, Preciado, Punzón, Saborido-Rey and Pennino. This is an open-access article distributed under the terms of the Creative Commons Attribution License (CC BY). The use, distribution or reproduction in other forums is permitted, provided the original author(s) and the copyright owner(s) are credited and that the original publication in this journal is cited, in accordance with accepted academic practice. No use, distribution or reproduction is permitted which does not comply with these terms.
*Correspondence: Francisco Izquierdo, francisco.izqtar@gmail.com; orcid.org/0000-0002-0781-1354