Agouti overexpression in a transgenic model regulates integrity, permeability and electrogenic amino acid transport in zebrafish intestine
 Esther Leal1
  Anna Rita Angotzi1
  Alejandra Godino-Gimeno1
  Silvia F. Gregório2
  Josep Rotllant3
  Alfonso Saera-Vila4
  Juan Fuentes2
  José Miguel Cerdá-Reverter1*
- 1Control of Food Intake Group, Department of Fish Physiology and Biotechnology, Institute of Aquaculture de Torre de la Sal (IATS-Consejo Superior de Investigaciones Científicas (CSIC)), Castellón, Spain
- 2Centre of Marine Sciences (CCMar), Universidade do Algarve Campus de Gambelas, Faro, Portugal
- 3Instituto de Investigaciones Marinas, Consejo Superior de Investigaciones Científicas (IIM-CSIC), Vigo, Spain
- 4Sequentia Biotech, Barcelona, Spain
Overexpression of asip1 in transgenic zebrafish disrupts dorsoventral pigment pattern in addition to increasing food intake levels and linear growth. A higher feed intake is unnecessary in transgenic fish to enable larger and heavier growth. A plausible explanation may rely on the enhanced feeding efficiency mediated by improved nutrient absorption in transgenic animals. To test this hypothesis, wide scope transcriptomic techniques were used to elucidate the potential pathways involved in the enhanced nutrient absorption and intestinal epithelium permeability/integrity. In addition, the electrogenic capacity for amino acid transport was analysed. Transcriptomic analysis reveal that amino acid, monocarboxylates, ionic and vitamin transmembrane transporters were substantially modified. Enrichment analysis also revealed an inhibition of intestinal lipid metabolism and down-regulation of KEGG pathways related to membrane integrity suggesting augmented intestinal laxity that may enhance paracellular transport. Electrophysiological experiments carried out in Ussing chambers show that asip1 overexpression decrease membraned tissue resistance (Rt), indicating a modification of the intestinal barrier function in ASIP1 transgenic animals. Similarly, paracellular permeability was higher in transgenic zebrafish. Both the decrease in Rt and the increase in permeability point to an ASIP1-dependent decrease in the tissue barrier function. Electrogenic amino acid transport was also enhanced in transgenic animals providing strong indication that ASIP1 fish can extract more amino acids from their diet at similar feeding levels. Both transcriptomic and electrophysiological results suggest that asip1-overexpressing zebrafish display improved nutrient absorption and by extension a higher feed efficiency which explains enhanced growth in the absence of augmented food intake. The enhanced growth of ASIP1 zebrafish potentially mediated by improved nutrient uptake and feed efficiency suggests that the melanocortin system, specifically asip1 overexpression, is a potential target for the development of genetically engineered fish displaying improved performance and no differential lipid accumulation.
1 Introduction
Agouti protein, also known as agouti-signaling protein (ASIP) in species other than mice, is part of a complex hormonal system comprising the paralogue agouti-related protein (AGRP) and several melanocortin peptides encoded by the multifaceted precursor proopiomelanocortin (POMC). This prepropeptide includes different melanocyte-stimulating hormones (α-, β- and γ-MSH), as well as the adrenocorticotropic hormone (ACTH) and the C-terminal β-endorphin, an opioid peptide of the vertebrate brain (Cerdá-Reverter et al., 2011). Melanocortin signalling is mediated by a family of G-protein coupled receptors which comprises five paralogues (MC1R-MC5R) exhibiting distinct expression domains and pharmacological profiles underlying specific gene functions (Cortés et al., 2014). MC1R binds preferentially to α-MSH and is mainly expressed in the skin, where it plays a regulatory role in melanogenesis (Cal et al., 2017). MC2R is the only receptor exclusively activated by ACTH and is expressed in the adrenal gland regulating glucocorticoid synthesis and secretion. The functional expression of MC2R requires interaction with the melanocortin receptor accessory protein 1 (MRAP1) which promotes trafficking of the receptor to the plasma membrane (Cerdá-Reverter et al., 2013). MC3R and MC4R are mainly expressed in the central nervous system to regulate energy balance and feeding behavior and energy expenditure through specific binding to the endogenous MCRs agonists γ- and β-MSH, respectively (Schiöth et al., 2005). The MC5R displays a wide expression domain yet always at low levels. It is involved in the regulation of exocrine secretion (Schiöth et al., 2005).
ASIP and AGRP are endogenous competitive antagonists that inhibit agonists from binding the MC1R and MC4R respectively, yet ASIP also binds to MC4R. Both antagonists work as inverse agonists and inhibit the constitutive activity of their cognate receptors (Tao, 2014). The blockade of the central melanocortin signalling by suppression of MC4R expression (Huszar et al., 1997) as well as the overexpression of AGRP (Ollmann et al., 1997) in mice or central AGRP administration in rats (Rossi et al., 1998) result in hyperphagia and obesity. Similarly, disruption of the melanocortin central signalling by ubiquitous constitutive expression of the agouti gene in obese yellow mice (Ay) results in hyperphagia, hyperinsulinemia, increased linear growth, maturity-onset obesity and yellow fur (Lu et al., 1994). The metabolic syndrome exhibited by agouti yellow mice is mediated by the interaction with the central MC4R, i.e., the ectopic expression of agouti acts as an endogenous antagonist in MC4R signalling in the hypothalamic neurons, thus leading to hyperphagia and obesity (Fan et al., 1997).
Due to the additional teleost specific genome duplication (TSGD or 3R), the melanocortin receptor/peptide system is greatly expanded in this lineage. Consequently, teleost fish display paralogous ASIP (ASIP1 and ASIP2) and AGRP (AGRP1 and AGRP2) genes (Agulleiro et al., 2014; Cortés et al., 2014). Central melanocortin signalling also regulates energy balance in fish as central administration of synthetic agonists results in a severe decrease in food intake levels in goldfish (Cerdá-Reverter et al., 2003a; Cerdá-Reverter et al., 2003b). Consistently, fasting sharply up-regulates hypothalamic AGRP1 expression in the same species (Cerdá-Reverter and Peter, 2003). MC4R is constitutively activated in the brain, while AGRP1 functions as an endogenous inverse agonist (Sánchez et al., 2009). Overexpression of asip1 in transgenic zebrafish disrupts dorsoventral pigment pattern (Ceinos et al., 2015), yet also increase food intake levels and linear growth (Guillot et al., 2016; Godino-Gimeno et al., 2020). Unlike mammalian models, an obese phenotype is absent in zebrafish overexpressing ASIP (Guillot et al., 2016), moreover, a higher intake of feed is not necessary to grow longer and heavier. This is perhaps the result of an enhanced food conversion rate (Godino-Gimeno et al., 2020). The enhanced growth may be managed at the level of muscle development through the somatotropic axis (Löhr et al., 2018) or, alternatively, ASIP1 transgenic fish could have improved intestinal function with more efficient nutrient absorption. In this study, the latter was explored by comparing the intestinal transcriptome of ASIP1 transgenic zebrafish vs wild-type animals (WT), by analyzing intestinal epithelium permeability and the electrogenic capacity for amino acid transport in Ussing chambers.
2 Material and methods
2.1 Fish and tissue sampling
WT-Tu (Tuebingen, Nüsslein-Volhard Lab) strain and transgenic [Tg(Xla.Eef1a1:Cau.Asip1)iim04] zebrafish, generated with the Tol2 transposon system using the elongation factor 1-alpha (ef1-alpha) constitutive promoter (Ceinos et al., 2015), were obtained from our facilities at the Institute of Aquaculture from Torre de la Sal (IATS), and bred under the same conditions for 6 months. Eight specimens were size-selected [bodyweight (BW)= 0.15 g ± 0.01] and kept for 24 days in 8-litre tanks equipped with a conventional re-circulatory water system to maintain the identical physicochemical and biotic conditions. Specimens were kept under 12 light (L)/12 darkness (D) photoperiods with lights switched on at 8.00 am and fed once a day at 1.5% BW at 10.00 am (Zebrafeed, Sparos, 63% protein, 13% fat 1.8% fiber, 12% ash). Prior to tissue sampling for RNA extraction, fasting was carried out for 24h and the fish were subsequently euthanized by an overdose of anesthesia (MS222, tricaine methane sulfonate buffered solution; 300 mg/L). Gut samples were carefully dissected under stereomicroscope (Zeiss Stemi 305) and placed in 0.1 M phosphate saline buffer to remove any adhered non-intestinal tissue, including fat, spleen, gallbladder, gonadal tissue and free oocytes (females) with fine forceps. In addition, around 2-3 mm of the anal extreme was sectioned out with scalpel to avoid potential contamination by feces and gonadal tissue. Experiments were carried out in accordance with the principles published in the European animal directive (86/609/EEC) for the protection of experimental animals and approved by the “Superior Council of Scientific Investigations” (CSIC) ethics committee (project number PID2019-103969RB-C33) and the “General Directorate of Agriculture, Livestock and Fishing of Valencia”, registration number: nGVRTE/2021/217198.
2.2 RNA isolation and sequencing
Zebrafish tissue was extracted with Tri-reagent (Sigma), rapidly frozen in liquid nitrogen and stored at -70°C. Total RNA extraction was followed by DNase (Promega) treatment and a second phenol-chloroform extraction was performed to inactivate and remove denaturalized DNase protein. RNA quality was assessed using an Agilent 2100 Bioanalyzer (Agilent Technologies). An RIN (RNA integrity number) higher than 7 and a ratio of 28S:18S (rRNA) higher than 1,8 were required for all samples. Total RNA samples (1 µg) were used for library preparation (Illumina’s TruSeq Stranded mRNA LT Sample Prep Kit with poly A selection). Sequencing was performed using an Illumina NovaSeq 6000 System (150 length, paired-end) platform (Illumina, Inc., San Diego, CA).
2.3 RNA-seq data analysis
FASTQ files were obtained from the sequencer and subsequently the quality of the reads was evaluated using FASTQC v0.11.9 (http://www.bioinformatics.babraham.ac.uk/projects/fastqc/). This was followed by a trimming step in order to remove adapters and low-quality bases using BBDuk v35.85 (https://jgi.doe.gov/data-and-tools/bbtools/bb-tools-user-guide/bbduk-guide/) with the following parameters 35 bp minimum length and 25 minimum quality score. High quality reads were mapped against the Danio rerio genome (Ensembl GRCz11 reference genome and gene annotation) using the STAR v2.7.1a (Dobin et al., 2013). Feature Counts v 1.5.1 (Liao et al., 2014) was used to quantify gene expression as raw fragment counts. Raw count matrices were loaded in R v4.0.3 (R Core Team, 2020) and filtered using the HTSFilter package v1.30.1 (Rau et al., 2013) to remove the uninformative genes. Filtered raw counts were processed with the EdgeR package v3.32.1 (Robinson et al., 2010) to normalize the raw counts using the TMM method and perform differential gene expression analysis to identify up-regulated and/or down-regulated genes. Multiple testing correction was performed with the false discovery rate (FDR) method (Benjamini and Hochberg, 1995). The significance level was set at FDR < 0.05. Kyoto Encyclopedia of Genes and Genomes (KEGG) pathway. Gene Ontology (GO) term enrichment was analyzed performing hypergeometric tests (R phyper function; Johnson et al., 1992) for each individual pathway and FDR correction was applied (FDR < 0.05). The pathview package v1.30.1 (Luo and Brouwer, 2013) was used to visualize gene expression in the context of functional pathways.
2.4 Expression of MCRs in the zebrafish intestine measured by qPCR
In order to explore the expression of MCRs in the zebrafish intestine, the same total RNAs isolated for RNA-seq experiments were used. Briefly, two micrograms of DNase-treated total RNA were used for cDNA synthesis with Superscript III reverse transcriptase (Invitrogen) primed with random hexamers and oligo(dT)12–18 (Invitrogen) in the presence of RNase inhibitors (Promega). Subsequently, one microliter of pure or diluted cDNA was added to 20 μl of absolute SYBR Green fluorescein PCR master mix (ABgene, Thermo Scientific, Spain) each containing 10 pmol of forward and reverse specific primers (Supplementary Table 1). Reactions were carried out in triplicate in a CBX connectTM real-time system instrument (BioRad). Primer and cDNA concentrations were tested for each gene. Primer amplification efficiencies below 95% or over 110% were discarded from the analysis. The housekeeping gene β-actin was used as internal reference to normalize the cDNA template between samples. The thermal cycle protocol for all primer sets was as follows: denaturation at 95°C for 15 min, followed by 40 cycles at 95°C for 15’’ and 62°C for 30’’. The melting curves (62-95 °C) of the products were verified in order to confirm the specificity of PCR products. Normalized relative quantities of mRNA expression were calculated with the mathematical method of ΔΔCt (Livak and Schmittgen, 2001).
2.5 Analysis of plasma
Blood samples were collected by ablation of the tail in heparinized capillary and plasma tubes, samples were obtained by centrifugation of the whole blood (10,000 g for 3 min) and subsequently stored at -20°C until further analysis. Plasma osmolality was measured in 10 μL samples with a Vapro 5520 osmometer (Wescor, South Logan, UT, USA). Sodium concentrations were measured by flame photometry (BWB-XP Performance Plus, BWB Technologies, UK). Chloride was determined by Coulomb-metric titration (SAT-500, DKK-TOA, Japan). The results are expressed in mmol L-1. Calcium and magnesium were measured by colorimetric tests, using commercial kits (Spinreact, Reactivos Spinreact, SA, Girona, Spain) according to the manufacturer’s instructions using a Multi-Mode Microplate Reader BioTek SynergyTM 4 (BioTek® Instruments, Winooski, VT, USA).
2.6 Voltage clamp in Ussing chambers
The intestine was isolated and mounted as previously described (Fuentes et al., 2010; Gregório et al., 2013) with the apical (luminal) and basolateral (blood side) sides of the tissue identified on a 0.09 cm2 tissue holder and positioned between two half-chambers containing 2 ml of physiological saline solution. While carrying out the experiments, the tissue was gassed bilaterally with humified air, and experiments were run at a room temperature of 27-28°C. Short-circuit current (Isc, μA cm–2) was monitored by clamping the epithelia to 0 mV. Voltage clamping and current injections were performed using VCC MC6 or VCC MC8 voltage-clamp amplifiers (Physiologic Instruments, San Diego, USA). The bioelectrical parameters for each tissue were continuously recorded during the in vitro period in Labscribe3 on a Lenovo computer using IWorx188 and Lab-Trax-4 data acquisition systems, from the time of mounting and for a duration of 90 min. Epithelial resistance (Rt, Ω.cm2) was calculated manually (using Ohm’s law) from the current deflections induced by a bilateral +2 mV pulse of 4 s every minute. The basolateral side of the preparation was considered as the ground. Therefore, positive currents are absorptive, while secretory currents are negative.
2.7 Permeability assay
The ability to quantify the transepithelial transport in a barrier model is essential. Our technique is based on permeability assays and transepithelial electrical measurements. Following 20-30 minutes of tissue stabilization after mounting in vitro, the saline solution was replaced with a fresh well-gassed solution to a final volume of 2.2 ml per chamber. Fluorescein isothiocyanate–dextran (FITC, average mol wt ~4,000, Sigma) prepared as concentrated stocks of 100 mg/ml was added to final concentrations of 0.5 mg/ml to the apical chamber. A sample (0.2 ml) was collected from both the apical and the basolateral compartments after 15 min of mixing to establish time zero. Precisely 1-hour later new samples from both the donor and receiver compartments were placed in fresh vials. Fluorescence measurements were performed using a BioTek SynergyTM 4 Multi-Mode Microplate Reader (BioTekÒ Instruments, Winooski, VT, USA) and subsequently set for excitation wavelength at 492 nm and emission wavelength at 520 nm for FITC. Concentration standards in the range of 0.2-2000 ng/ml were used to establish concentrations in the apical and basolateral chambers. The apparent permeability (Papp) was estimated using the equation (Arnold et al., 2019): Papp= (V*dC)/(A*C0*dT), where Papp is the permeability in centimeters per second, V is the volume of the receiver chamber, A is the tissue surface area in square centimeters, C0 is the initial concentration in the donor compartment (apical), and dC/dT is the rate of concentration change (ng/sec) of FITC in the recipient (basolateral) chamber.
2.8 Electrogenic amino acid transport
The mid intestine was isolated and mounted as described above for the anterior intestine. In this subset of experiments, the apical side of the preparation is stimulated with an amino acid mixture (MEM Amino Acids Solution [50X], ThermoFisher). The amino acid pool consists of a complex mixture of essential amino acids: L-Arginine•HCl, L-Cystine•2HCl, L-Histidine•HCl•H2O, L-Isoleucine, L-Leucine L-Lysine•HCl L-Methionine L-Phenylalanine, L-Threonine, L-Tryptophan, L-Tyrosine, L- Valine. The principle of the test is to stimulate the epithelium with the presence of amino acids, thus generating a change in the current due to the cotransport of amino acids with ions (Bröer, 2008). The response is concentration-dependent, relatively fast and stabilizes within 30 min of adding amino acid. Therefore, the sequential effects of different concentrations in each epithelial preparation can be quantified. In this test, sequential concentrations of 4, 8 and 16 mM were used on the apical side. During the experimental manipulations, mannitol was added on the basolateral side at the same time and at the same concentrations (4, 8 and 16 mM) to avoid putative effects of osmolality imbalance in the current. For calculation and data presentation, Delta Isc (μA.cm-2) was calculated as the difference between the pre-stimulation values and the steady-state current measured after each stimulation.
2.9 Statistics
All results are shown as mean ± standard error of the mean (mean ± SEM). Furthermore, in some cases, individual values are shown to illustrate group variability. After assessing homogeneity of variance and normality, statistical analysis of the data was performed, as appropriate, by t-test or two-way analysis of variance (ANOVA) using GraphPad Prism 8. A P-value < 0.05 was considered statistically significant.
3 Results
To gain new insights into the gastrointestinal pathways involved in the melanocortin response, transcriptomic profiles of the intestine were analysed following the melanocortin pathway blockade mediated by asip1 overexpression in transgenic zebrafish. The aim of this experiment was to identify functional classes of genes underlying susceptibility to melanocortin signalling, elucidating the functional significance of sets of differentially-expressed genes (DEG) in the intestine, with particular emphasis on epithelium permeability/integrity and amino acid transport. Complete transcriptomic results were submitted to GEO (GSE206810).
3.1 Functional classes of DEG in male zebrafish
Principal component analysis (PCA) successfully clustered both WT and transgenic fish (data not shown). When comparing male transcriptome, 1509 genes were differentially expressed between WT and ASIP1 males with 757 and 752 up- and down-regulated genes in transgenic animals, respectively (Supplementary Tables 2A, B). Gene ontology (GO) enrichment analysis on up-regulated genes displayed 381 and 329 biological processes up- and down-regulated genes, respectively, the GO description “transmembrane transport” being the up-regulated biological process showing the lowest FDR and, by extension, the highest levels of significance for the enrichment analysis (Figure 1; Supplementary Table 3A). Within this biological process, 52 genes out of 857 were up-regulated, including several components of the solute carrier family (SLC) directly involved in the transmembrane amino acid and ion transport (Supplementary Table 4). Accordingly, some biological processes related to membrane transport, including amino acid and anion transport, were significantly up-regulated by asip1 overexpression (Supplementary Figure 1). These data are consistent with the prediction for the GO category “molecular function” in which the GO description “transmembrane transporter activity” showed the lowest FDR (Figure 1; Supplementary Table 3A). In contrast, the down-regulated biological processes showing the lowest FDR were related to lipid metabolism, including sterol synthesis as well as metabolic processes of cholesterol, isoprenoid, and steroid (Figure 1; Supplementary Table 3B), presumably crucial for membrane structure and integrity. The genes which down-regulated in the sterol and cholesterol biosynthesis processes are listed in Supplementary Table 5.
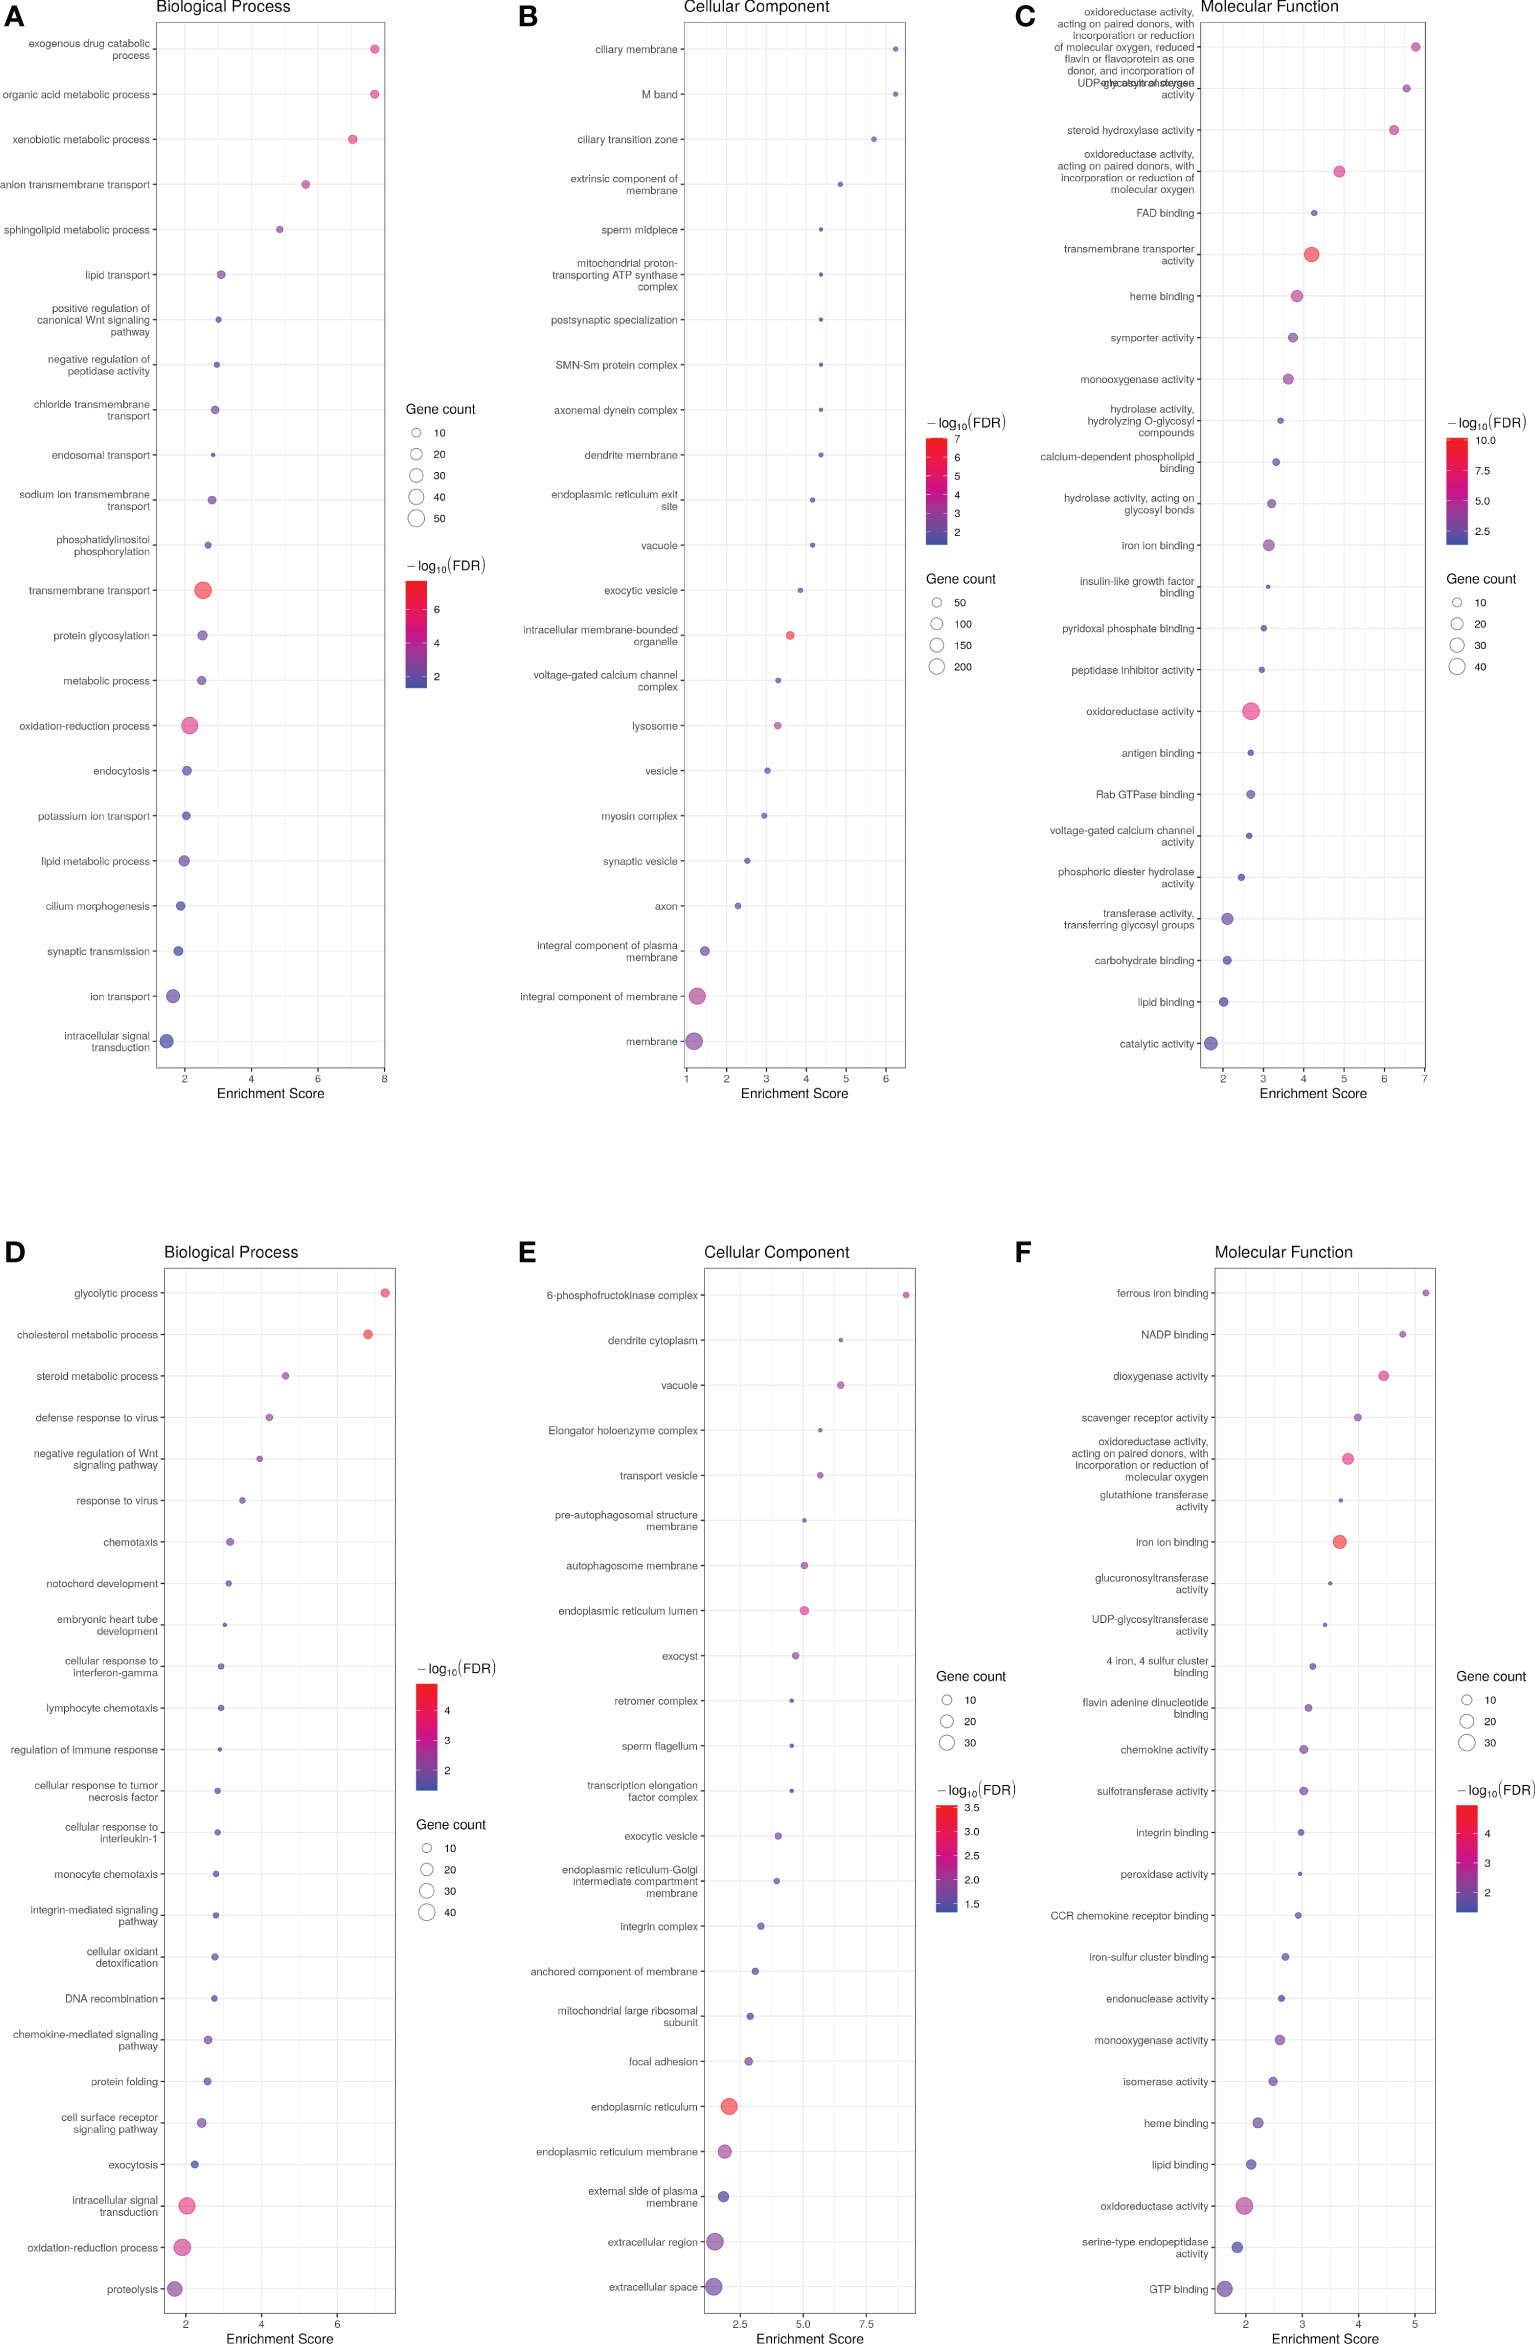
Figure 1 Bubble plot for gene ontology (GO) pathway enrichment analysis of up- (A-C) and down-regulated (D-F) genes in ASIP1 zebrafish males, grouped according to different Gene Ontology levels (A and D Biological Process, B and E Cellular Component and C and F Molecular Function). The Y-axis shows the name of Gene Ontology while the X-axis represents its enrichment. Bubble size is proportional to the number of genes assigned to Gene Ontology pathway; Colour represents enrichment significance (minus log10 transformed FDR), red indicates a greater significance level. The Y-axis shows the name of Gene Ontology while the X-axis represents its enrichment. Bubble size is proportional to the number of genes assigned to Gene Ontology pathway; Colour represents enrichment significance (minus log10 transformed FDR), red indicates a greater significance level.
Analysis of significantly up-regulated KEGG pathways corroborated the GO results. Thirty-seven and 13 KEGG pathways were up- and down-regulated in ASIP1 animals, respectively. Several pathways related to amino acid metabolism were significantly up-regulated by asip1 overexpression, including arginine/proline, β-alanine, histidine metabolism and valine/leucine/isoleucine degradation (Figure 2; Supplementary Table 6A). Moreover, KEGG pathway analysis of down-regulated genes in transgenic fish revealed down-regulation of fatty acid metabolism including arachidonic acid metabolism, fatty acid elongation and steroid biosynthesis as well as functions related to membrane integrity and permeability including focal adhesion and ECM-receptor interaction (Figure 2; Supplementary Table 6), particularly in the integrin and laminin systems (Supplementary Table 7).
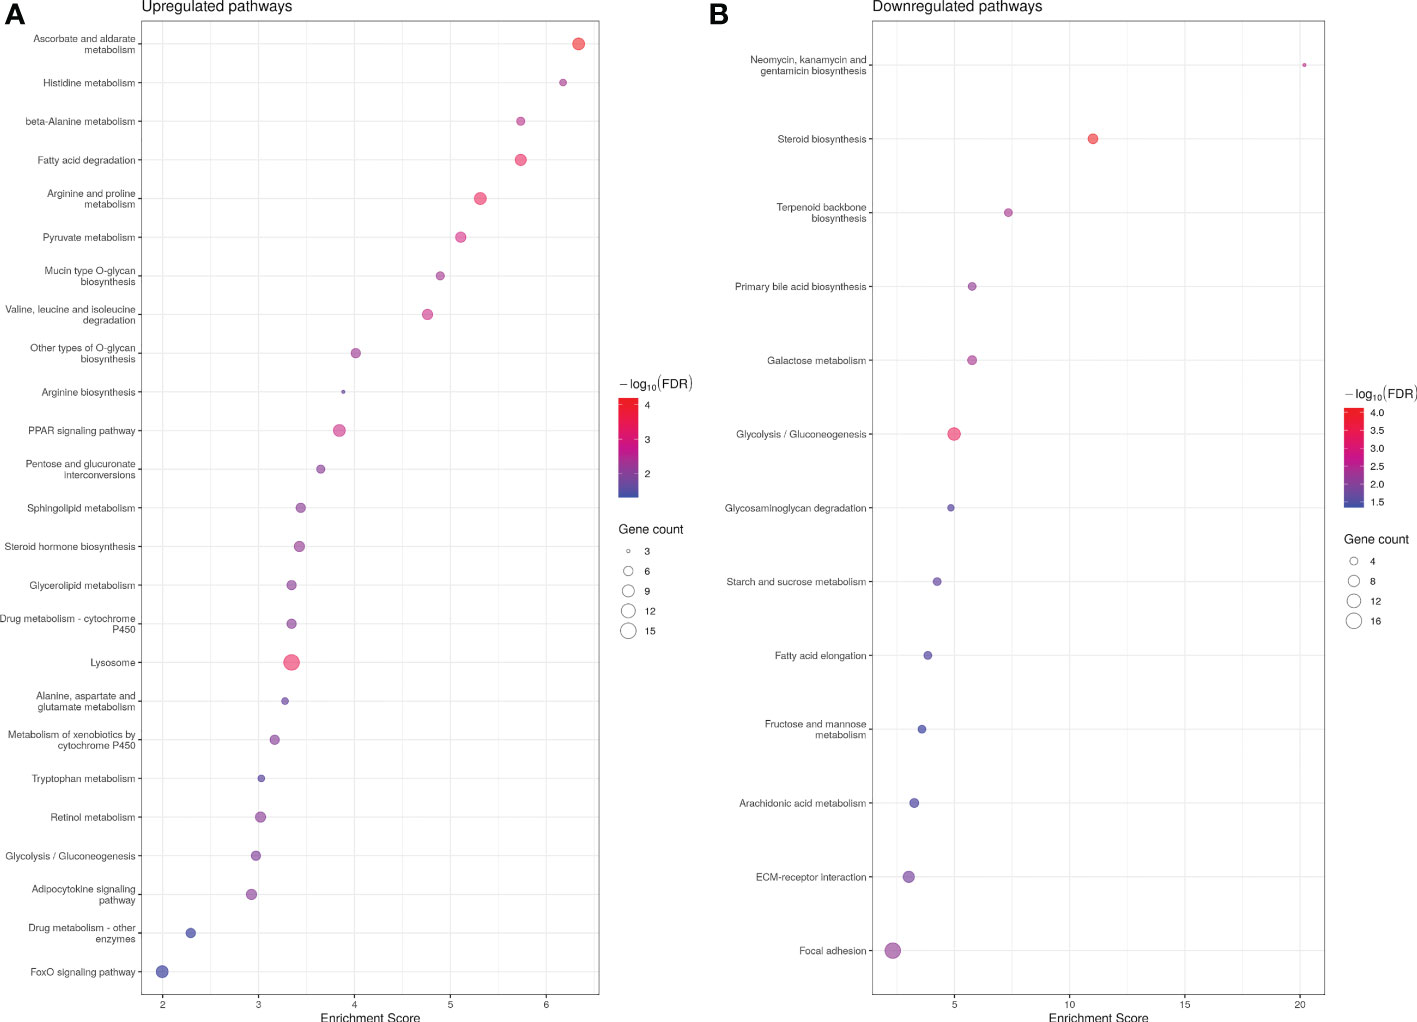
Figure 2 Bubble plot for KEGG (Kyoto Encyclopedia of Genes and Genomes) pathway enrichment of up- (A) and down (B)-regualted genes in ASIP1 zebrafish, grouped according to different KEGG pathways. See Figure 1 for details.
3.2 Functional classes of DEG in female zebrafish
PCA successfully clustered both WT and transgenic fish (data not shown). The transcriptome of ASIP1 females showed 641 DEG with 410 and 231 up- and down-regulated genes, respectively, compared to the transcriptome of WT females maintained under identical breeding conditions (Supplementary Tables 8A, B). GO enrichment analysis on up- and down-regulated genes revealed significant differences in 177 and 178 biological processes, respectively (Figure 3; Supplementary Tables 9A, B). In contrast to the male analysis, only GO-term analysis revealed differences in epithelium integrity showing down-regulation of biological processes related to skin morphogenesis, axoneme assembly, calcium-dependent cell-cell adhesion and adherent junction organization, homophilic cell adhesion via plasma membrane adhesion molecules, cell adhesion and cell-cell junction assembly among others (Figure 3, Supplementary Table 9B). Accordingly, both the integral component of membrane and membrane were the cellular components most significantly affected (lowest FDR) by asip1 overexpression in females (Figure 3; Supplementary Table 9B). Interestingly, metabolism of organic acids and amino acids, including histidine, tyrosine and tryptophan were also up-regulated, as was the transport of some ions and vitamins (Figure 3; Supplementary Table 9A).
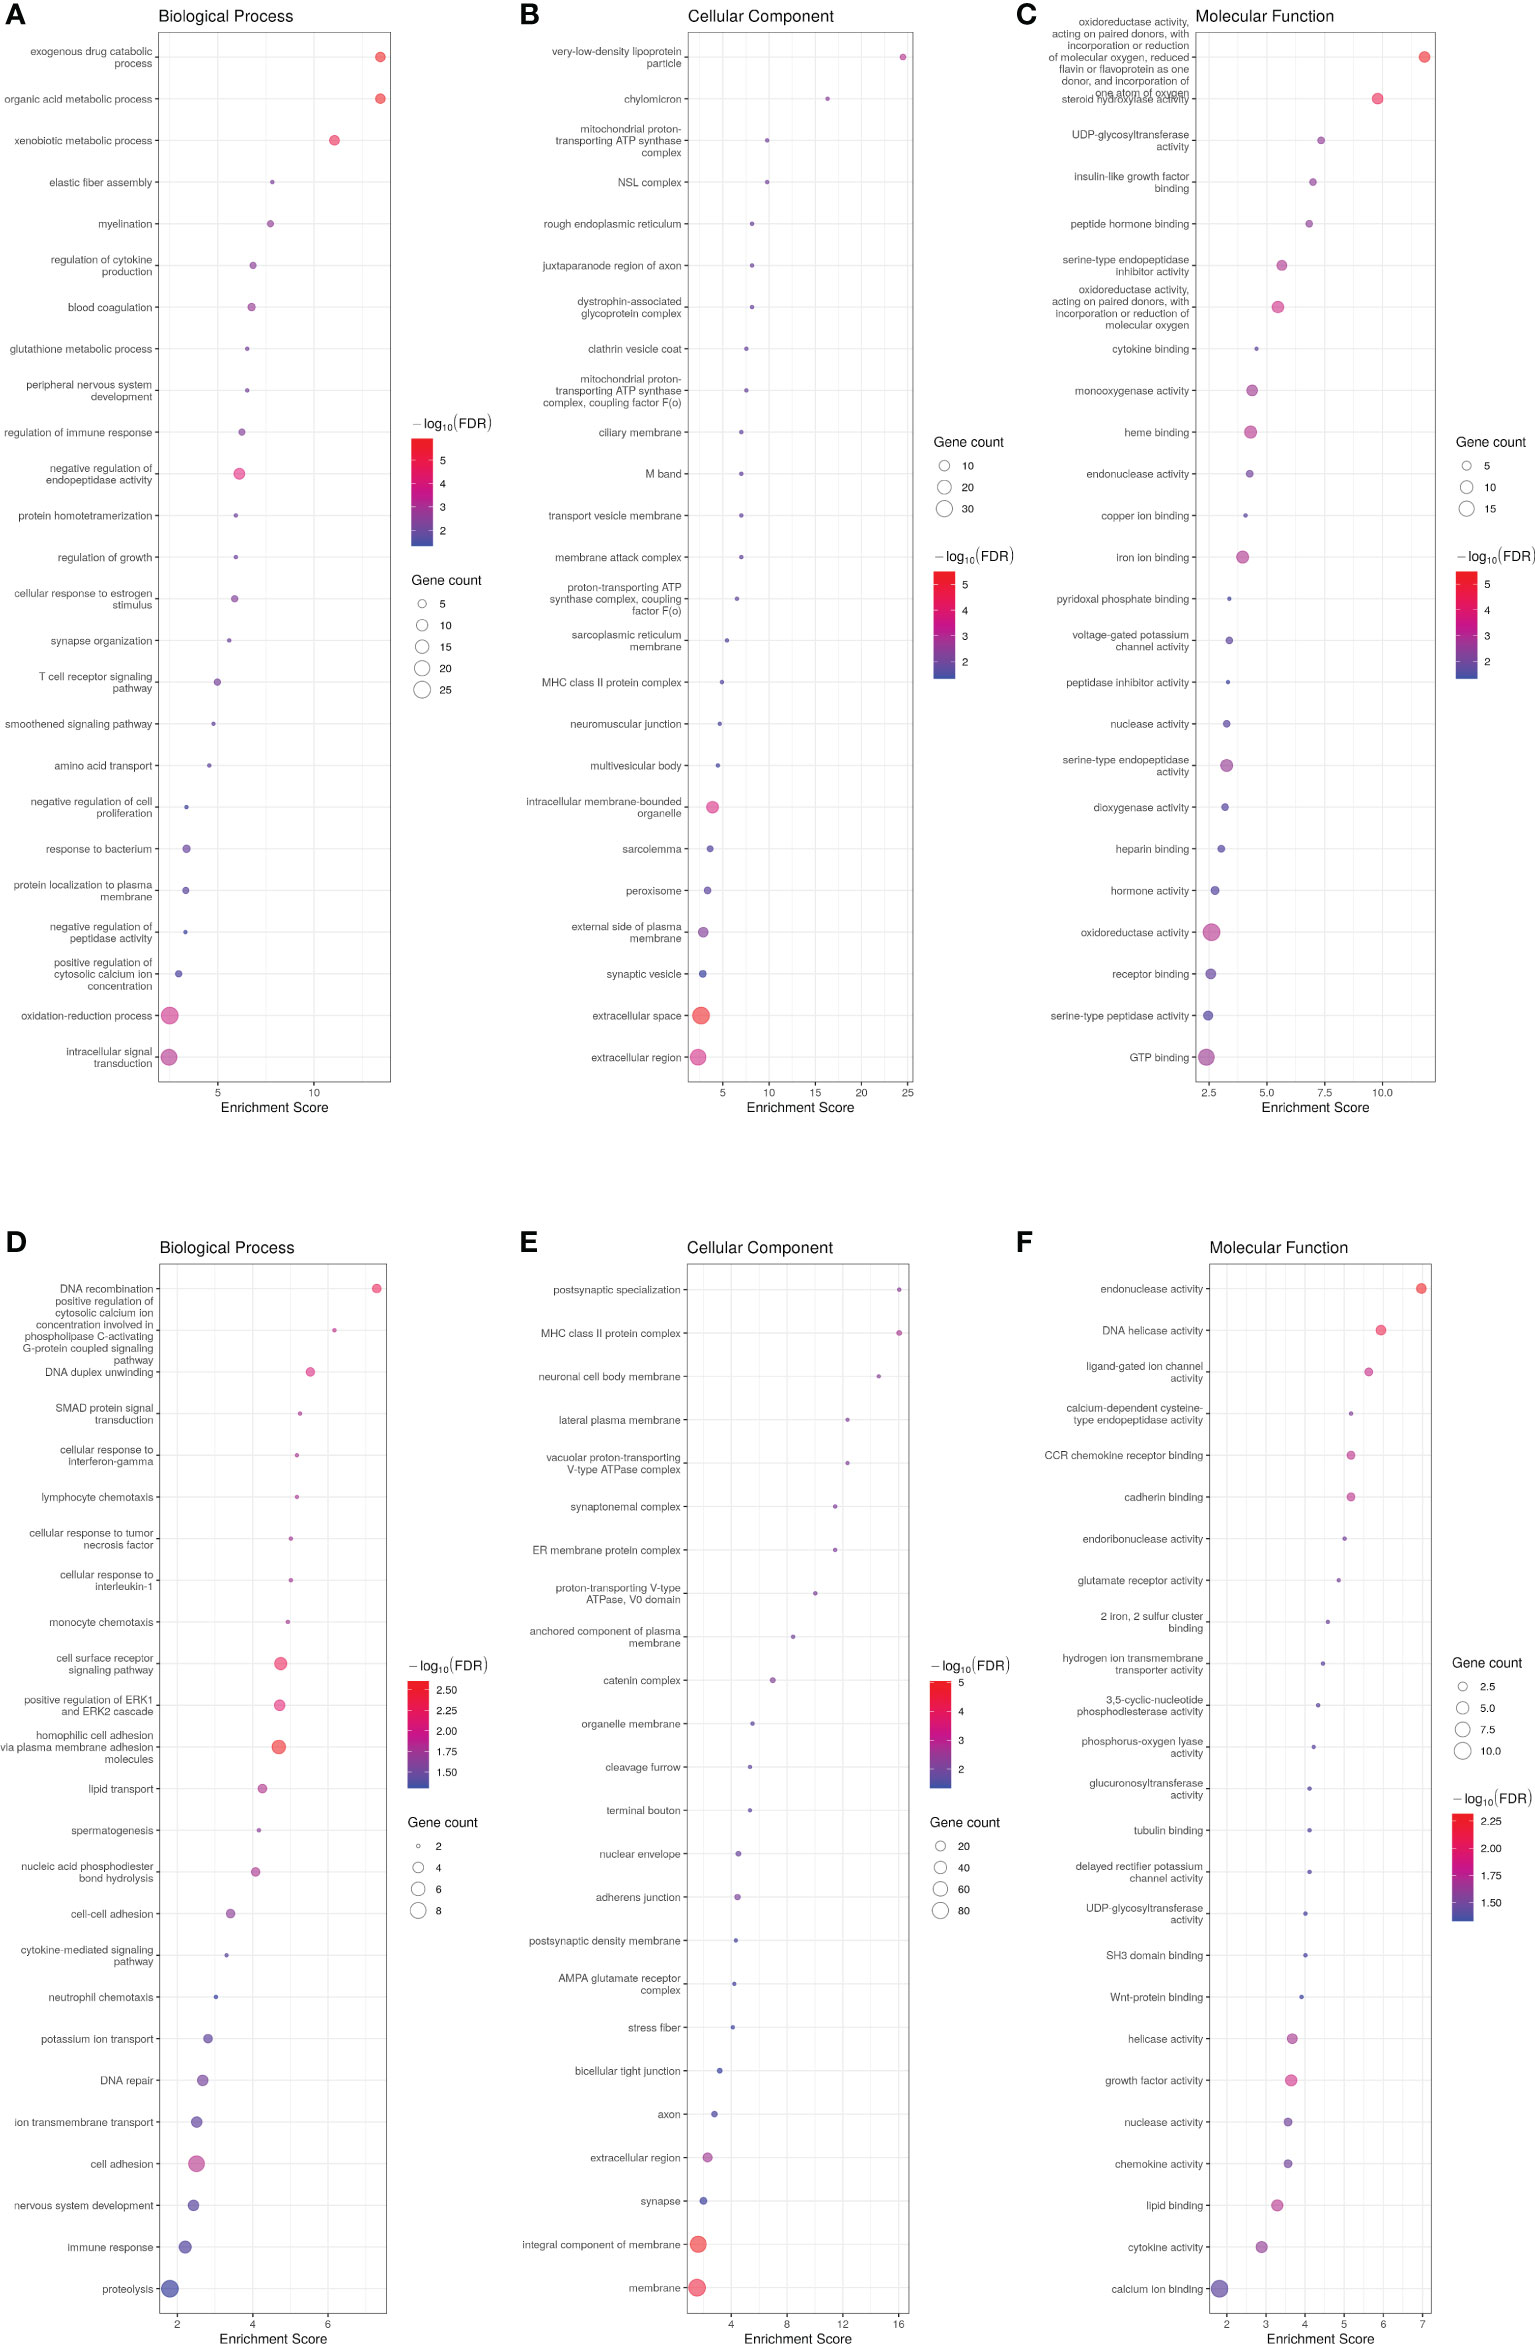
Figure 3 Bubble plot for gene ontology (GO) pathway enrichment analysis of up-(A-C) and down-regulated (D-F) genes in ASIP1 zebrafish females, grouped according to different Gene Ontology levels (A, D Biological Process, B, E Cellular Component and C, F Molecular Function). See Figure 1 for details.
No KEGG pathways were significantly down-regulated, yet 24 pathways were up-regulated (Figure 4). Similar to males’ transcriptome, KEGG pathways related to amino acid metabolism were up-regulated including tyrosine, tryptophan, taurine, phenylalanine, alanine/aspartate/glutamate, glycine/serine/threonine and histidine metabolism (Supplementary Figure 2). In addition, and once again similar to the differential analysis of the transcriptome in males, fatty acid metabolism was up-regulated by asip1 overexpression in females (Supplementary Figure 2; Supplementary Table 10).
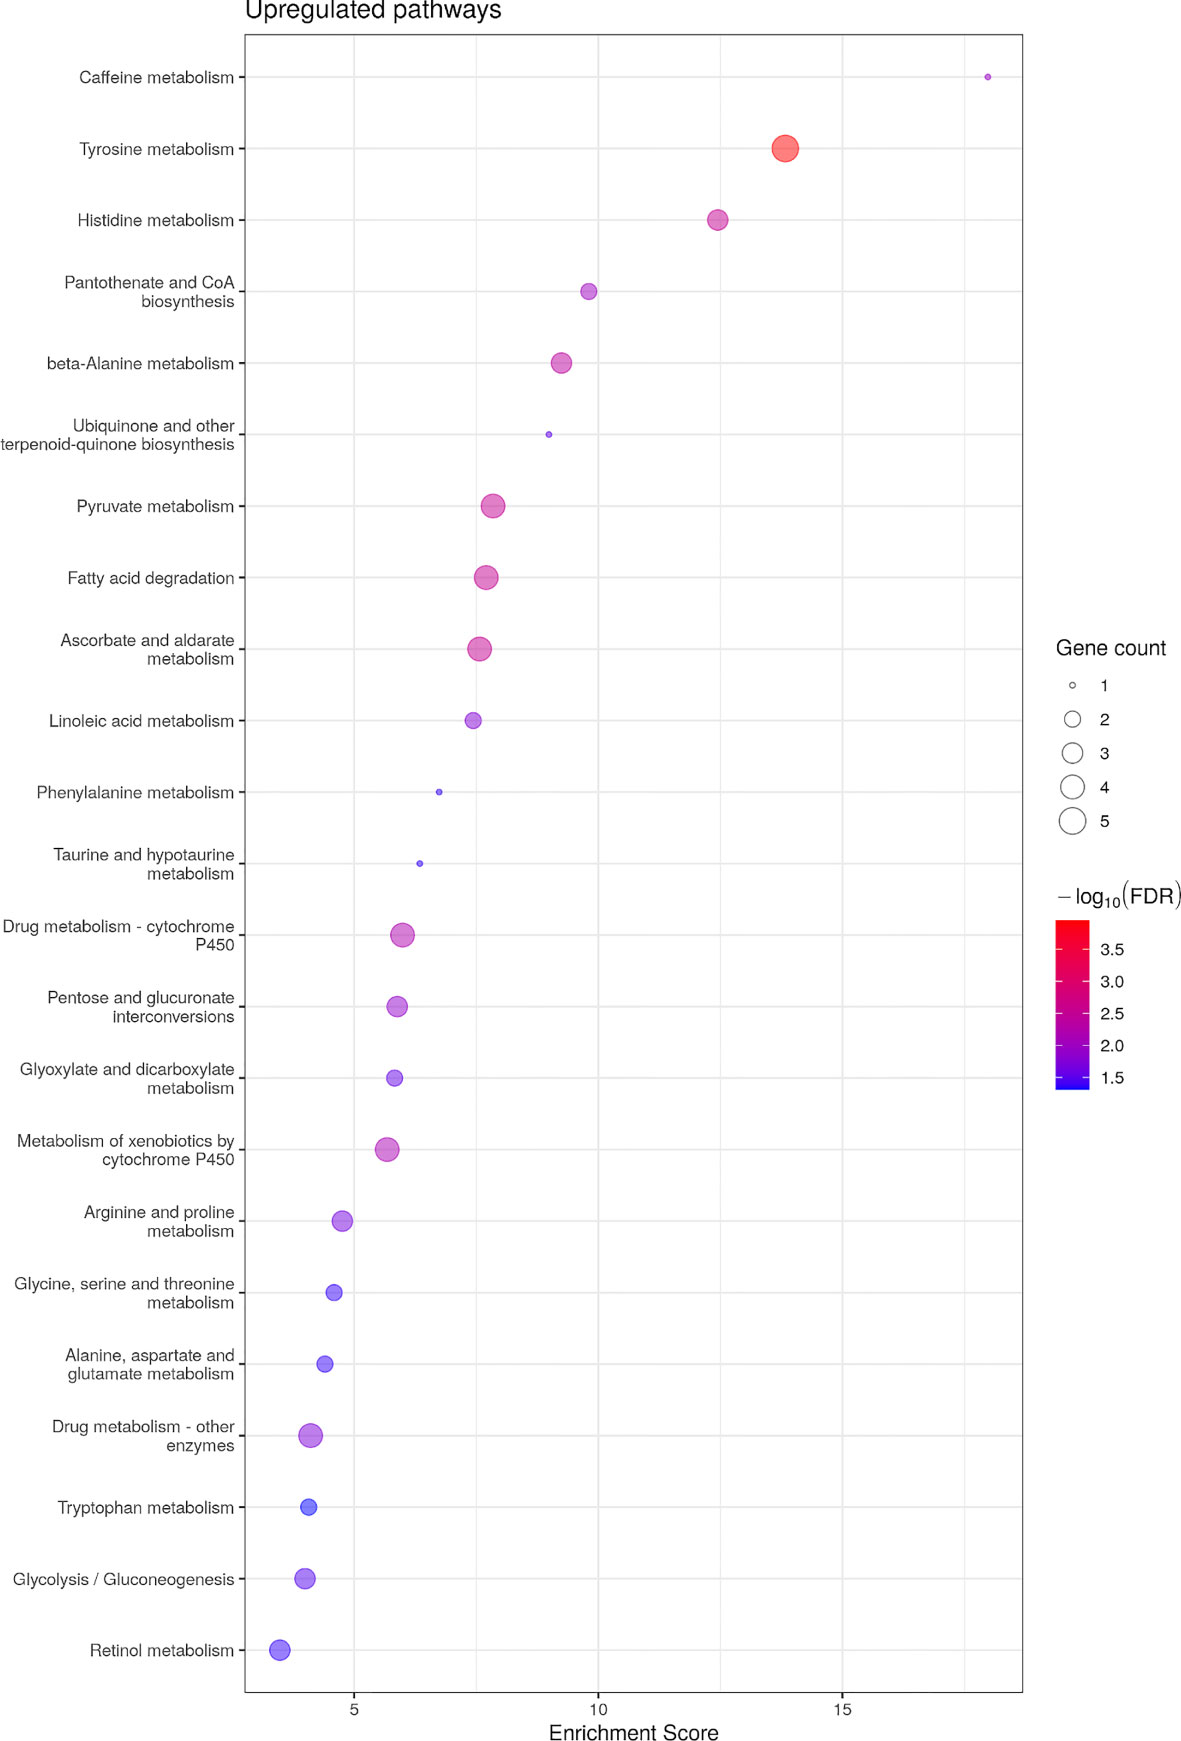
Figure 4 Bubble plot for KEGG pathway enrichment of up-regualted genes in ASIP1 zebrafish. See Figure 1 for details.
3.3 Melanocortin receptor expression in the zebrafish intestine
Transcriptomic results failed to detect relevant expression levels of the MCRs in the zebrafish intestine as previously reported (Ringholm et al., 2002). Thus, the more sensitive real-time quantitative (qPCR) technique was exploited to gain potential evidence for gene expression of the entire signalling repertoire of MCRs, using the same RNAs isolated from the transcriptomic experiments as templates for the cDNA synthesis. Only MC5Ra was overexpressed in ASIP1 transgenic fish after t-test (p<0.05) (Figure 5). However, no effects of gender or genotype on MCR expression after two-way ANOVA analysis were found, except for MC5Ra, where overexpression of asip1 induced an increase in receptor mRNA in the ASIP1 animals, regardless of gender (Supplementary Figure 3). However, a significant interaction was found between both variables (gender x genotype) for the remaining receptors (MC1R, MC2R, MC3R, MC4R and MC5Rb). In all cases, except for MC2R and MC5Rb, ASIP1 females express higher levels of MCRs than the remaining genotypes.
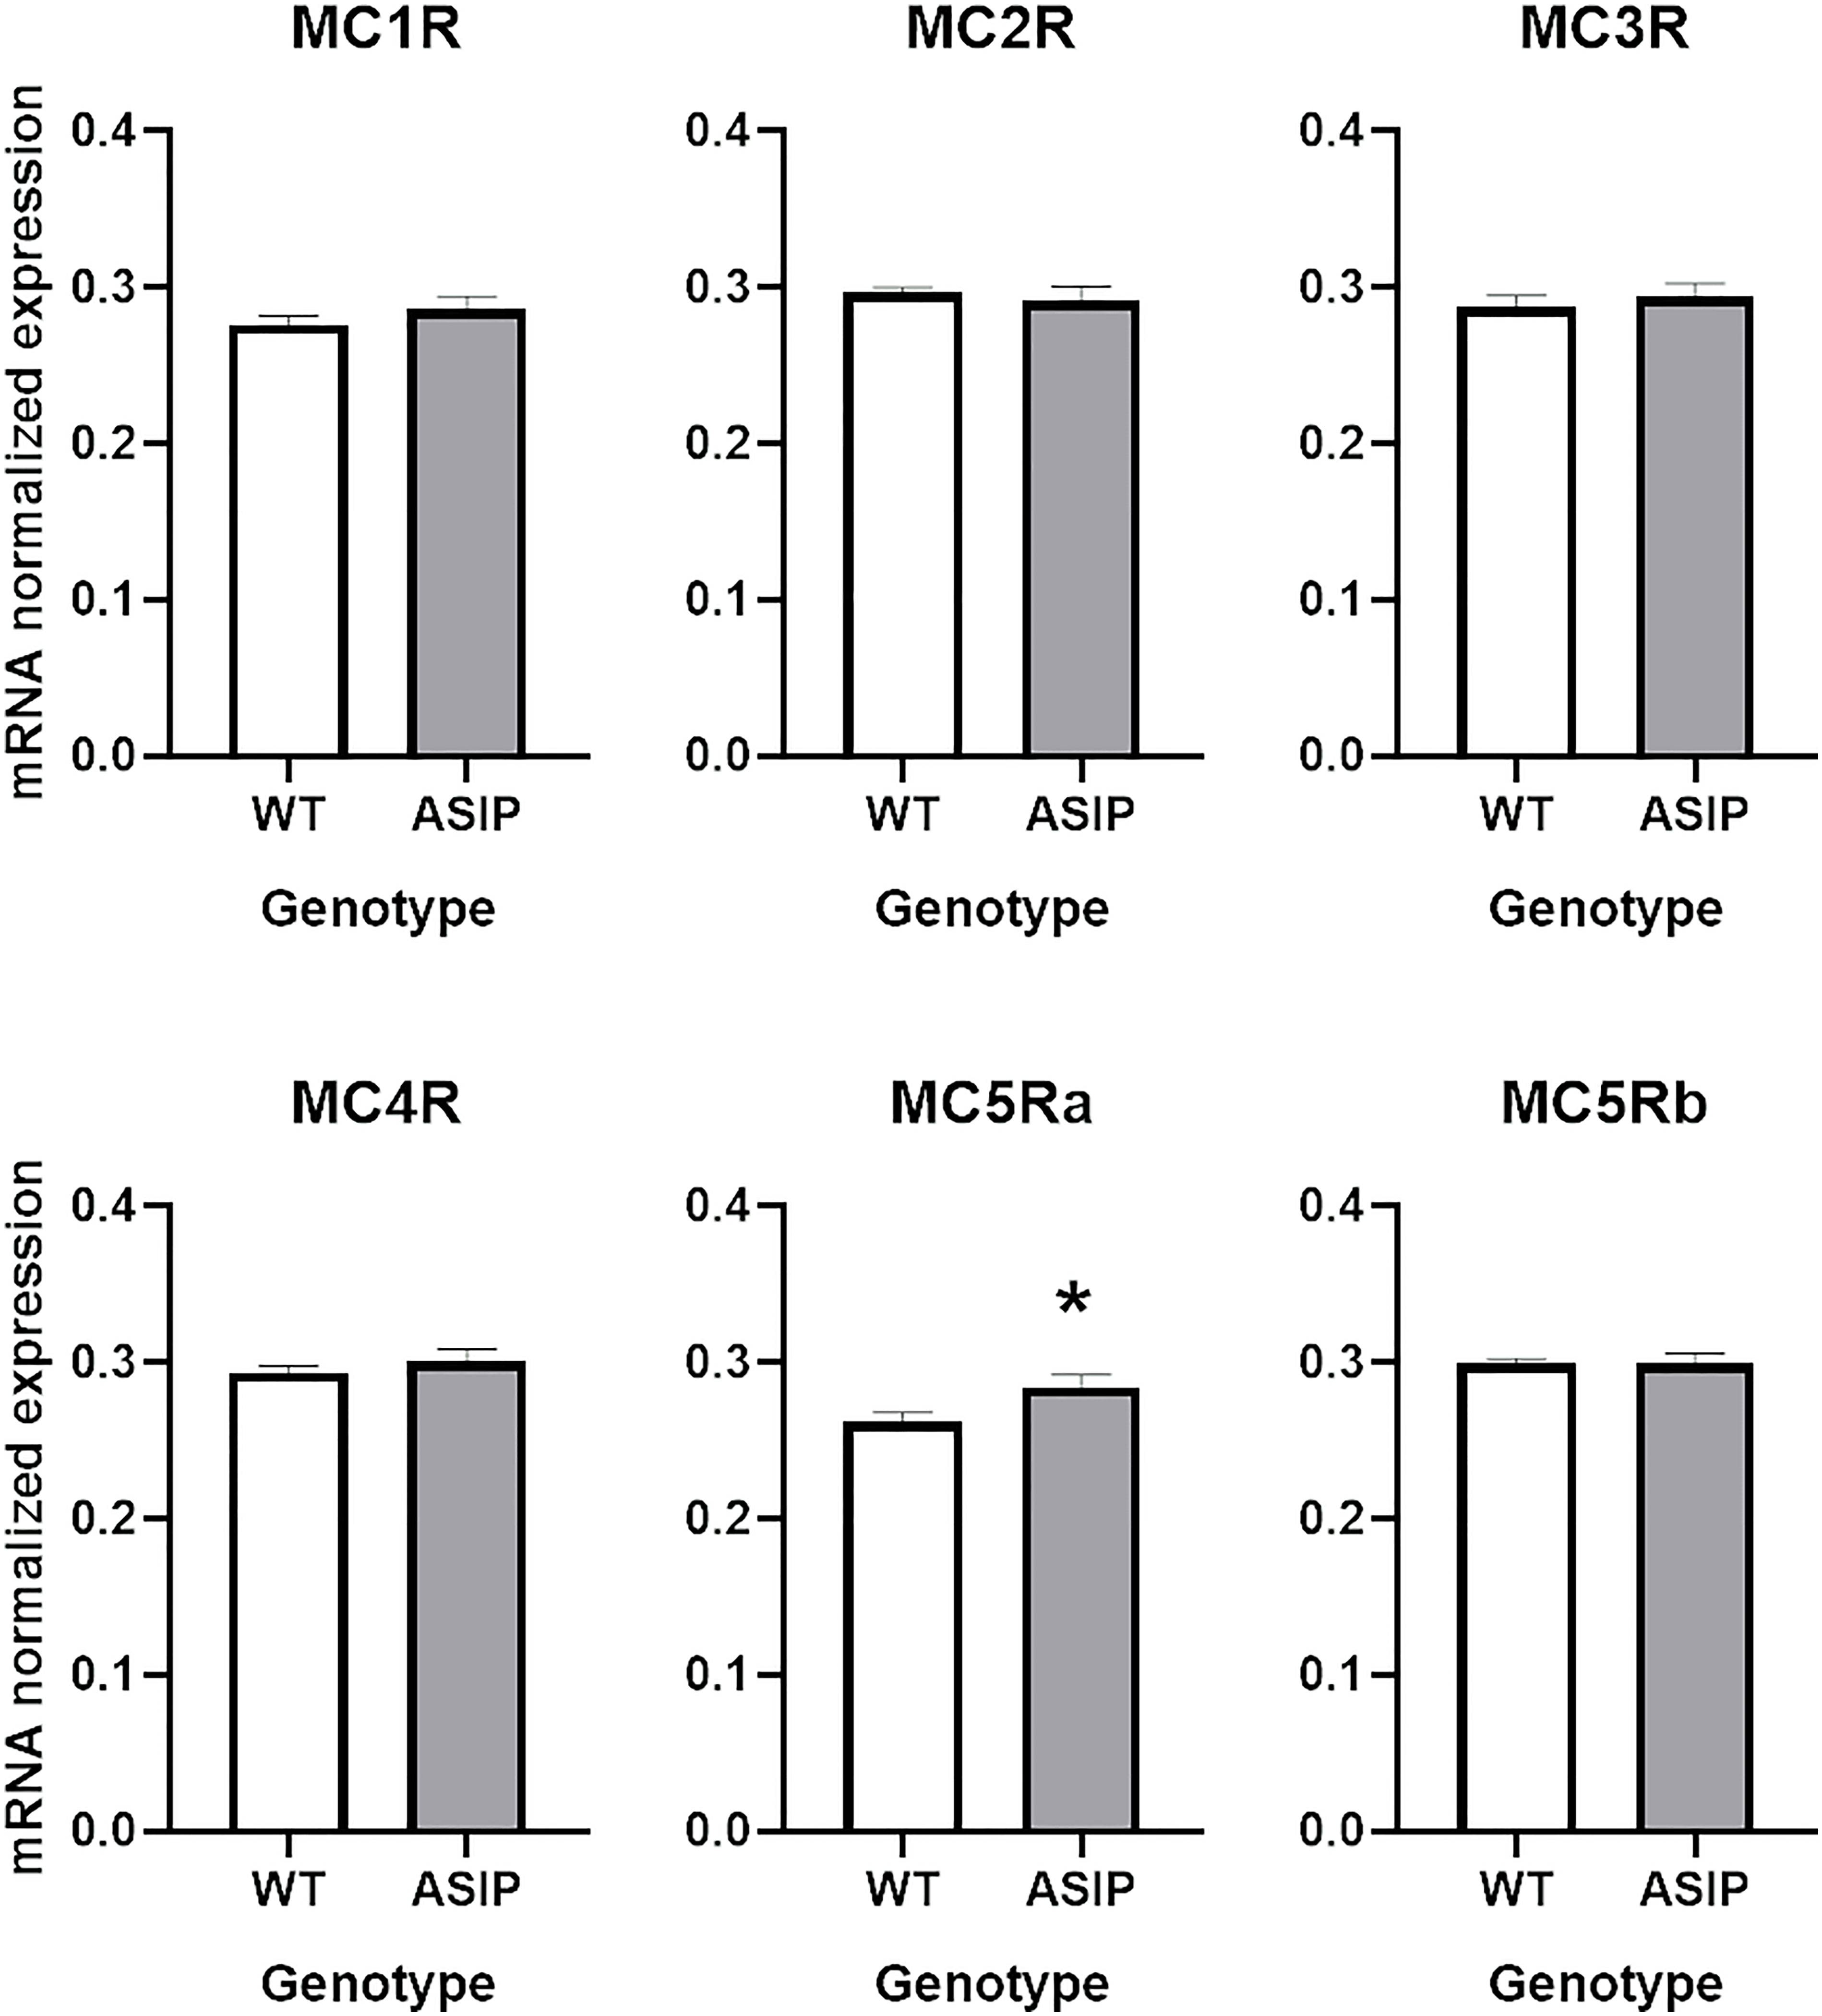
Figure 5 Intestinal melanocortin receptor as measured by RT-qPCR. See Material and Methods for details. Asterisk indicates significant differences after t-test (P<0.05).
3.4 Electrophysiological studies
3.4.1 Plasma analysis
Ion and osmolality analysis in wild-type fish was performed to compose a Ringer solution that match the zebrafish plasma. Supplementary Table 11 shows plasma measurements, while Supplementary Table 12 shows the resulting saline formula.
3.4.2 Intestine permeability
Rt values for each genotype are shown in Figure 6. Overexpression of asip1 induced a reduction in epithelial resistance suggesting a decrease in tissue integrity in the transgenic genotype. In addition, short-circuit current (Isc, μA/cm2) was also recorded for each epithelial preparation (Figure 7). The intestine of asip1-overexpressing fish mounted in Ussing chambers exhibited, under voltage clamp to 0mV and symmetric conditions, an absorptive short-circuit current (Isc, μAmp cm−2) of -9.36 ± 3.108 μAmp cm−2, whereas WT fish showed significantly lower Isc absorptive values (-0.503± 1.771 μAmp cm−2) (Figure 7).
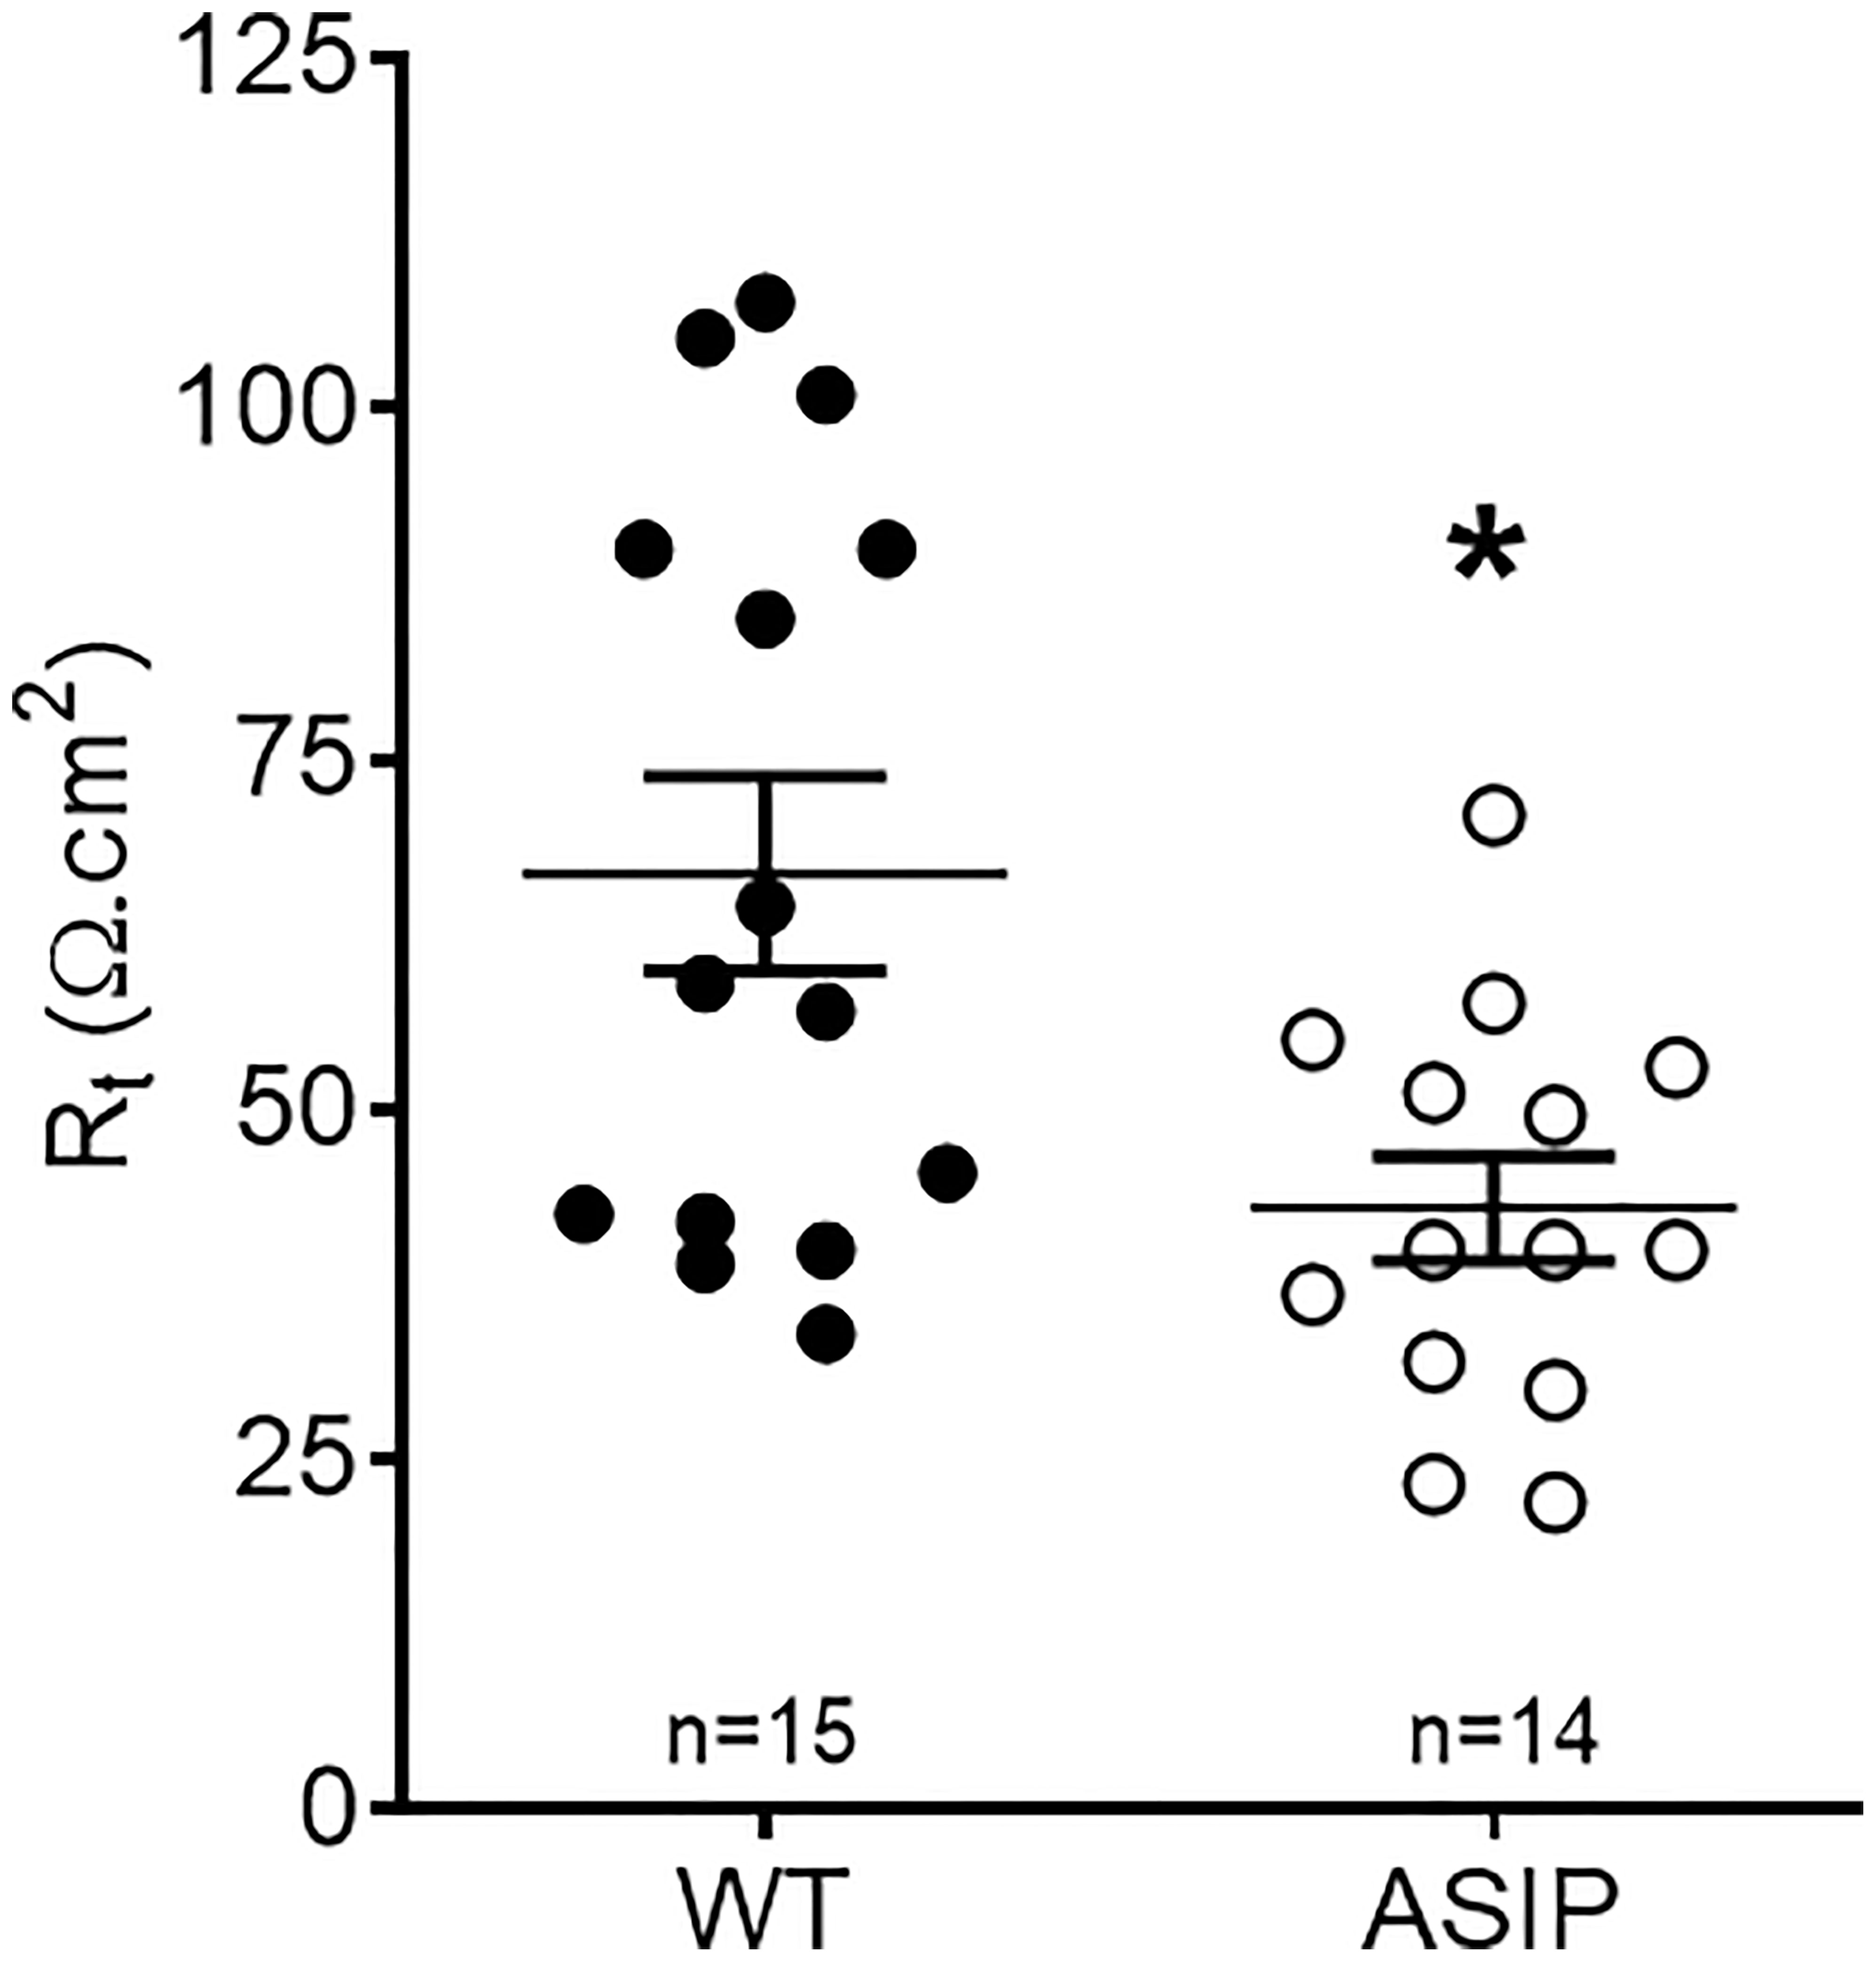
Figure 6 Trans-epithelial electrical resistance (Rt, Ω cm2) in the intestine of zebrafish recorded in vitro during experimental testing of 90 min. Values were averaged for whole in vitro measurements. Dot plot shows individual values for each group. Each column represents the average + SEM of the number of measurements given in the columns. Asterisks represent significant treatments (p< 0.05, Sudent's t-test).
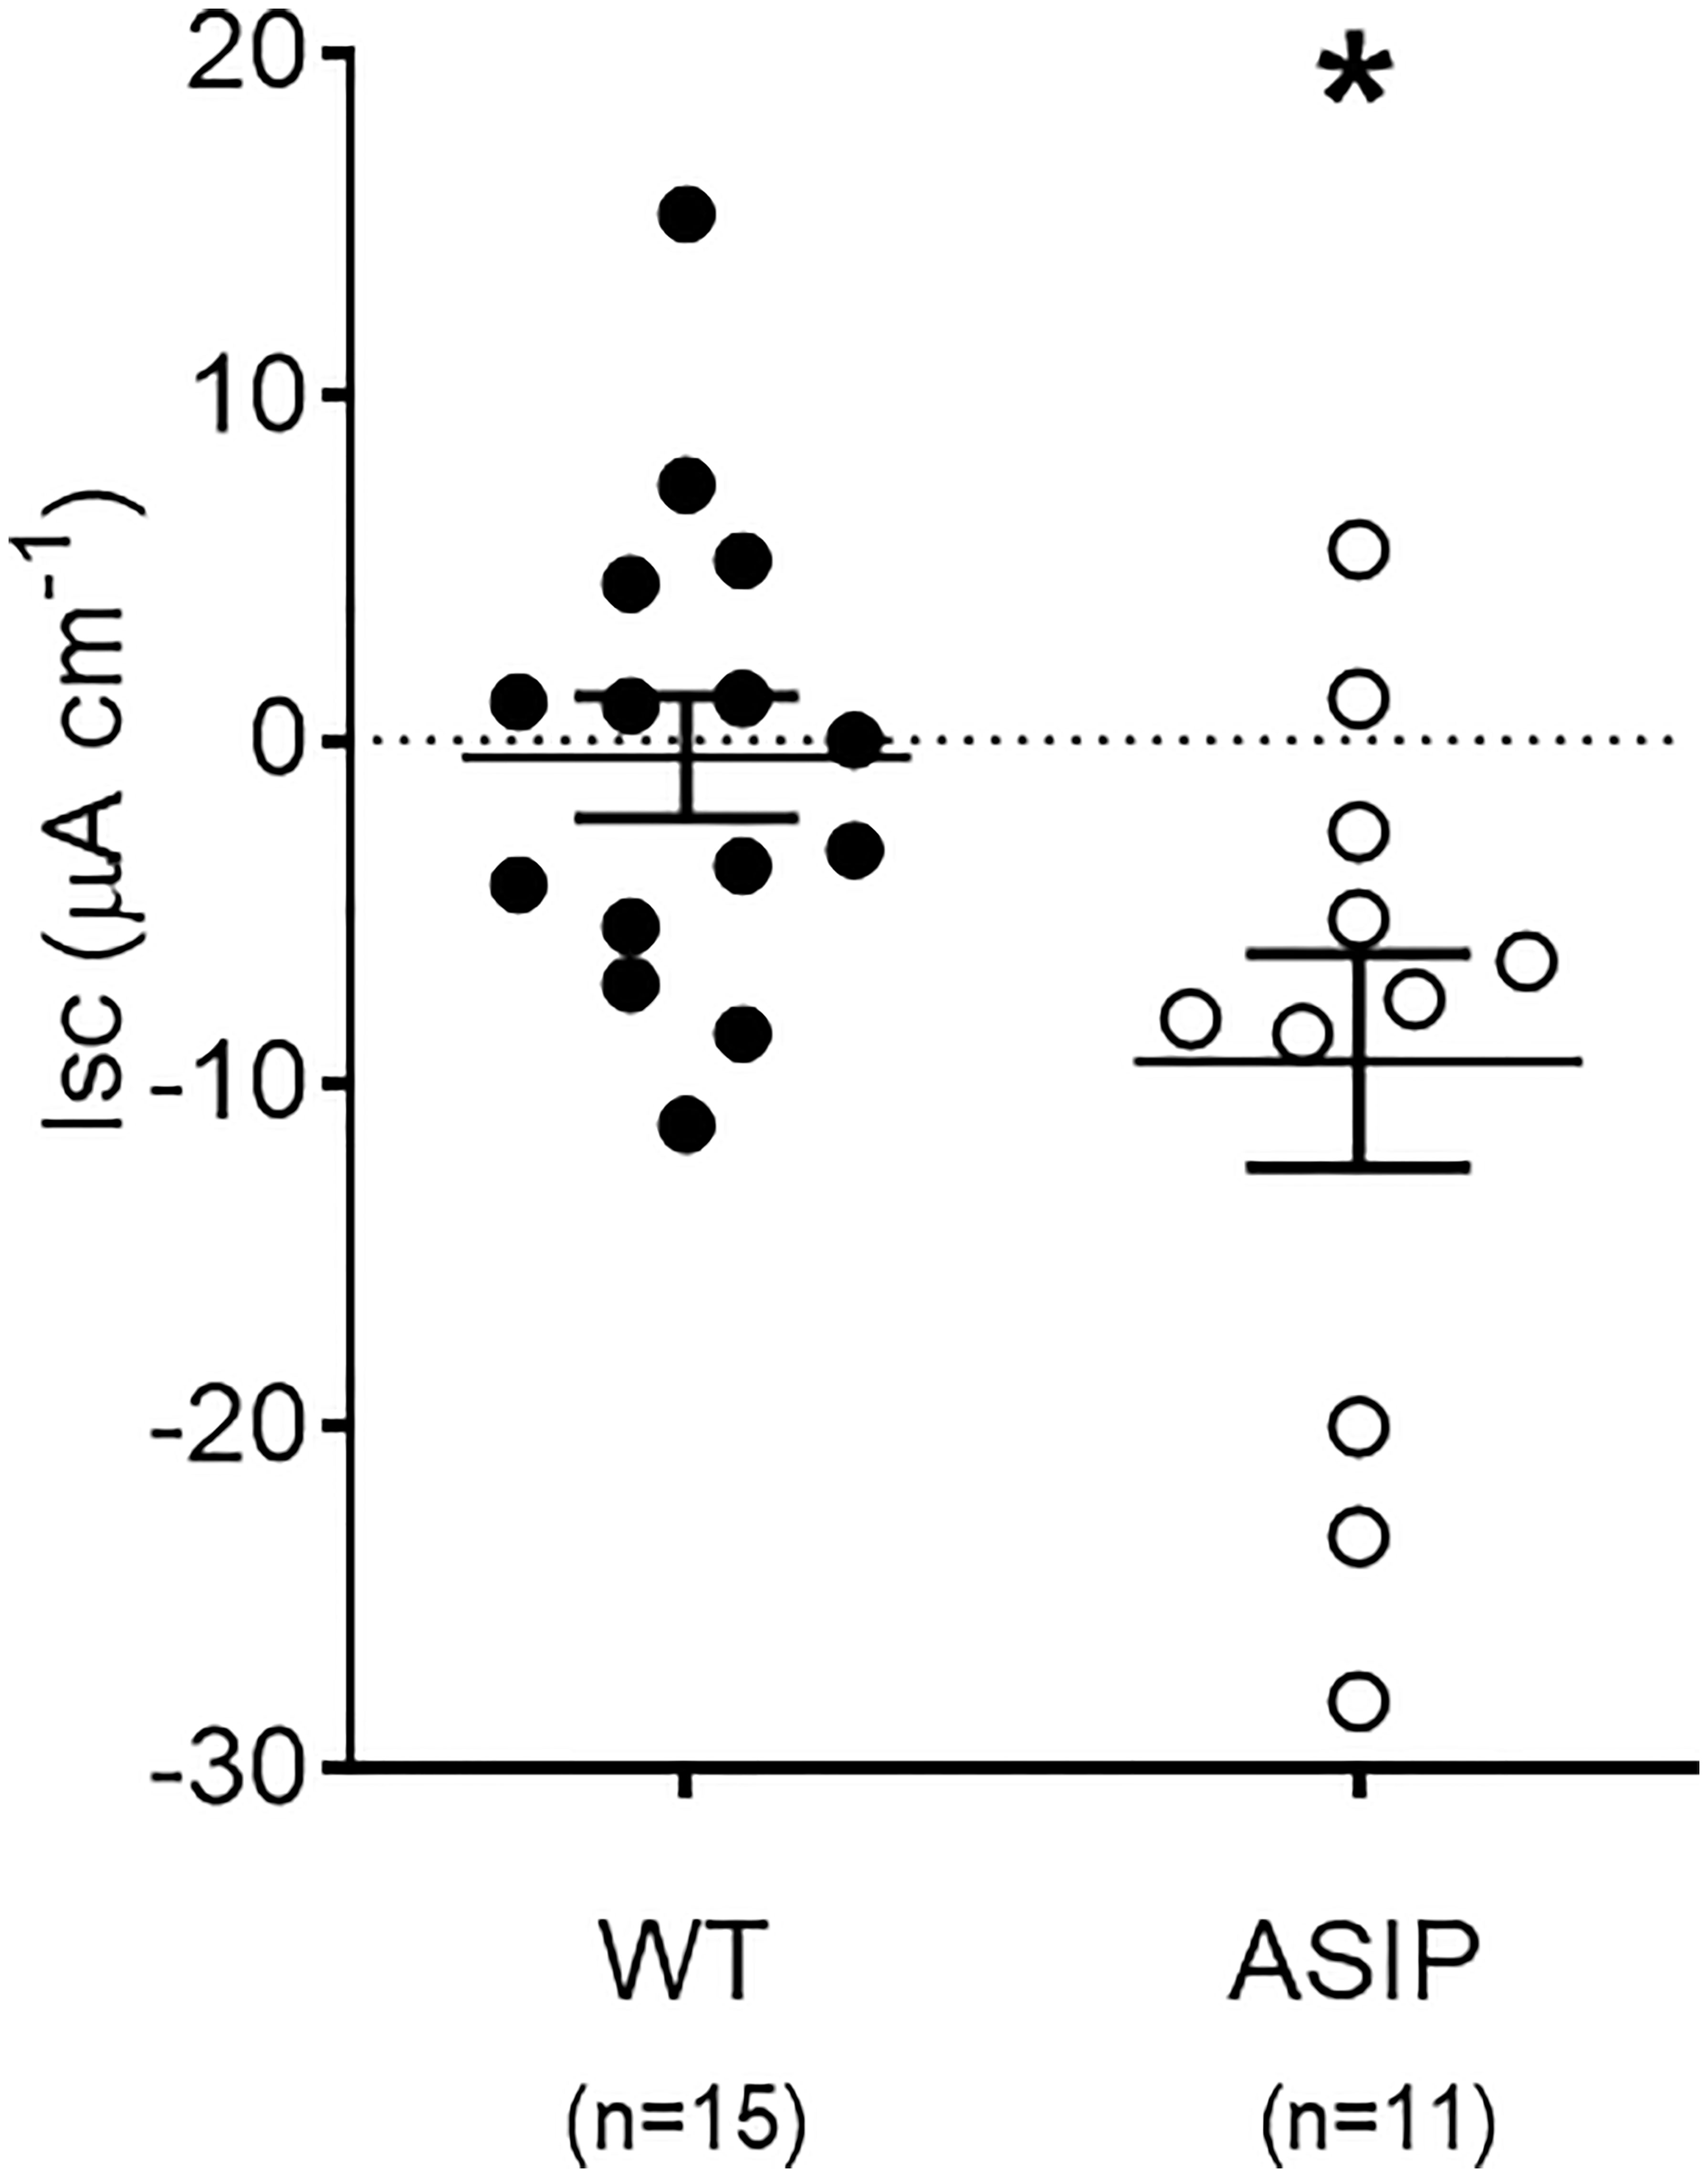
Figure 7 Short-circuit current (Isc, μAmp.cm-2) in the intestine of zebrafish recorded in vitro during experimental testing of 90 min. Values were averaged for whole in vitro measurements. Dot plot shows individual values for each group. Each column represents the average + SEM of the number of measurements given in the columns. Asterisks represent significant treatments (p< 0.05, Sudent's t-test).
Paracellular transport of small macromolecules across the intestinal epithelium was assessed by 4 kDa FITC-dextran translocation. The results show that paracellular permeability of the intestinal epithelia is significantly higher in ASIP1 genotype, once more, suggesting enhanced paracellular transport and lower tissue integrity of the intestinal wall (Figure 8).
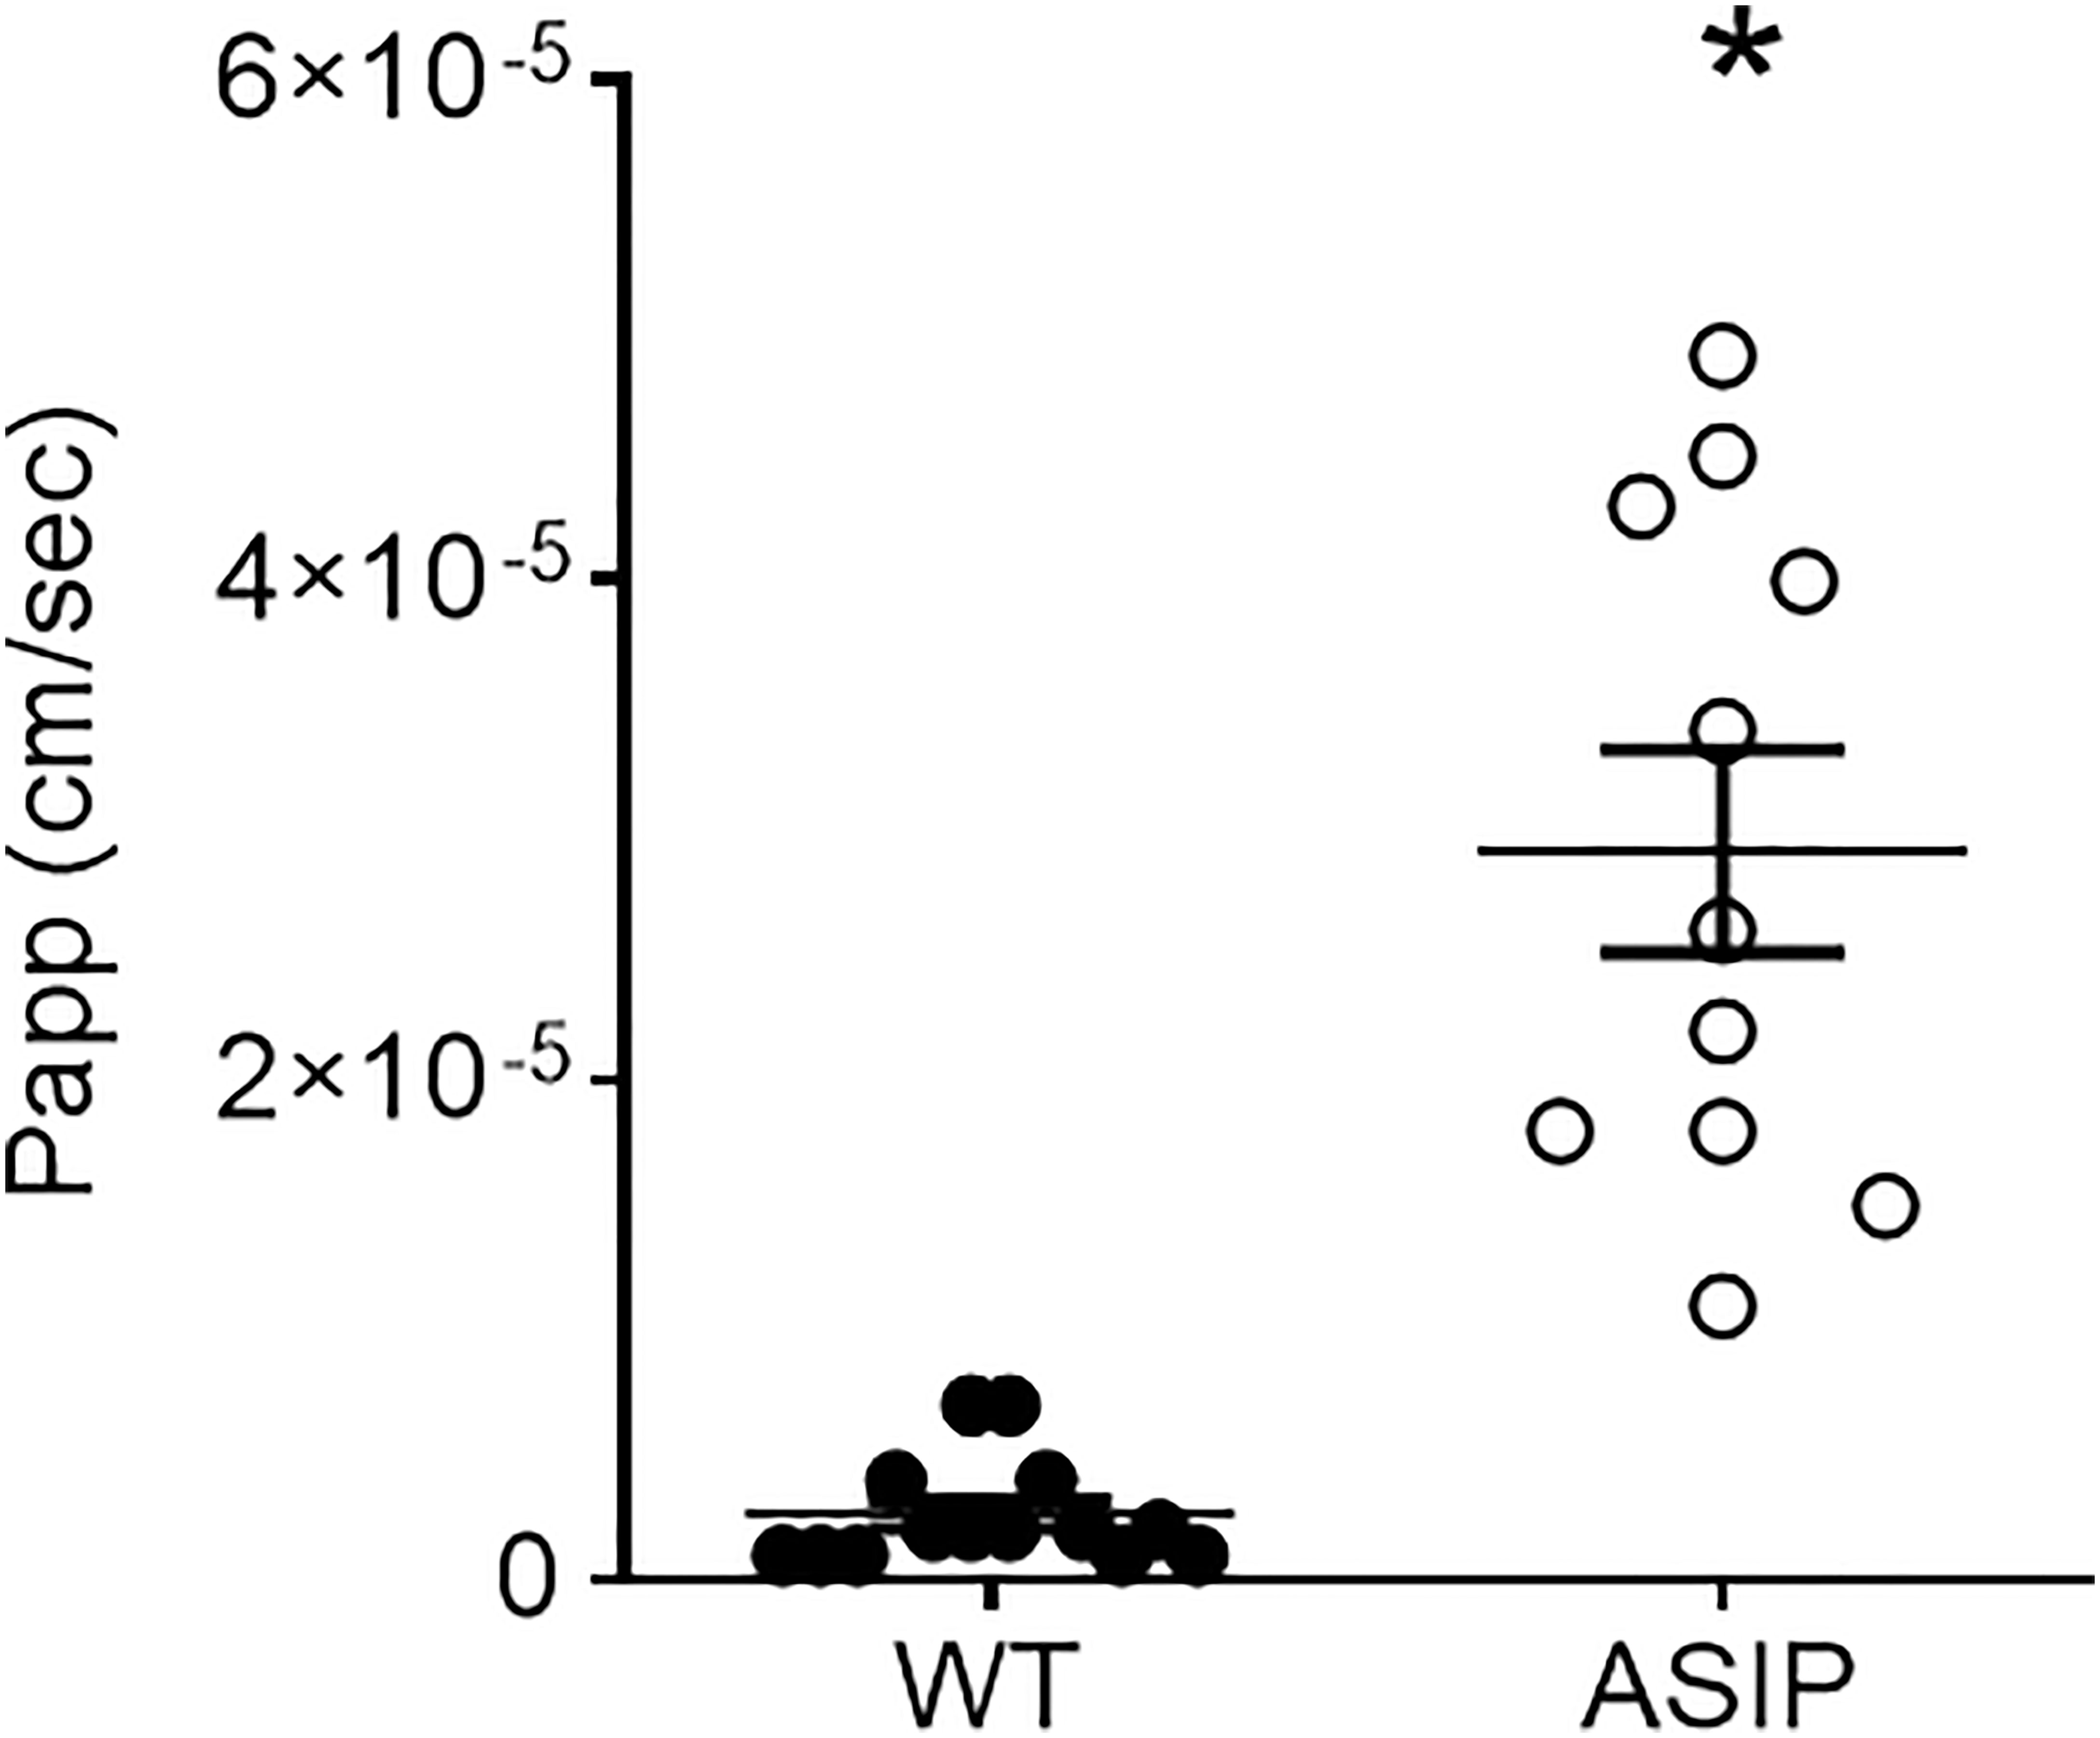
Figure 8 Permeability (Papp, cm/sec) to FITC dextran (4kD) in the intestine of zebrafish. Dot plot shows individual values for each group. Each column represents the average + SEM of the number of measurements given in the columns. Asterisks represent significant treatments (p< 0.05, Sudent's t-test).
3.4.3 Intestinal transport
Electrogenic intestinal amino acid transport was assessed by incubating intestinal epithelium in Ussing chambers with increasing concentrations of essential amino acids. Short-circuit currents showed that the intestinal epithelia of WT and ASIP1 fish exhibit a dose-dependent response in Delta Isc values at increased concentrations (Figure 9). However, these absorptive parameters in ASIP1 fish were significantly higher than those in WT fish, suggesting that ASIP1 fish can incorporate luminal amino acids more efficiently than WT animals.
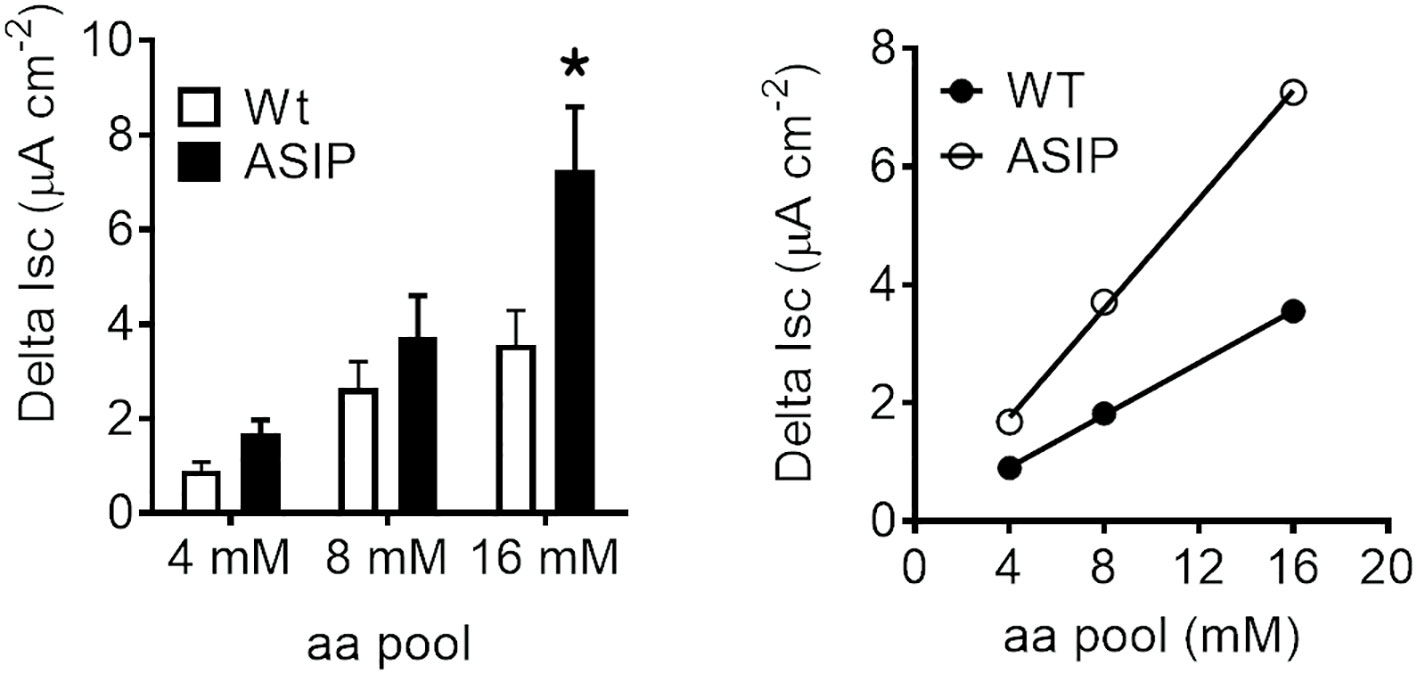
Figure 9 Short-circuit current (Isc, µAmp.cm-2) in the intestine of zebrafish recorded in vitro during experimental testing of 90 min. Values were averaged for whole in vitro measurements. Dot plot shows individual values for each group. Each column represents the average + SEM of the number of measurements given in the columns. Asterisks represent significant treatments (p< 0.05, Student’s t-test).
4 Discussion
Previous studies demonstrated that the inhibition of melanocortin signalling mediated by asip1 overexpression results in enhanced growth in zebrafish (Guillot et al., 2016). It was also determined that ASIP1 transgenic fish are able to eat more due to reduced sensitivity of the central satiety system (Guillot et al., 2016). However, subsequent experiments revealed that a higher intake of food was not necessary in ASIP1 zebrafish to enable larger growth, as it was observed that pair-fed ASIP1 fish grew larger than WT animals (Godino-Gimeno et al., 2020). A plausible explanation for this result may rely on the enhanced feeding efficiency mediated by improved nutrient absorption in transgenic animals. To test the hypothesis, wide scope transcriptomic techniques were used to pipe the potential pathways involved in the enhanced nutrient absorption. Transcriptomic comparisons between animals of the same sex were considered as previous studies showed that ASIP1 can induce extensive sex-dependent differences in the brain transcriptome (Guillot et al., 2016). Gene expression divergences in male zebrafish between both genotypes showed that transmembrane transport was substantially modified in transgenic males. In particular, increased gene expression of amino acid, monocarboxylates, ionic and vitamin transporters was recorded, suggesting an improved efficiency in intestinal active transport that could lead to the enhanced anabolism and, therefore, improved growth of ASIP1 zebrafish (Li et al., 2021). Furthermore, enrichment analysis revealed an inhibition of intestinal lipid metabolism, mainly affecting sterol/cholesterol synthesis. Sterols, like cholesterol, are key components of the plasma membrane known to decrease fluidity and increase tight packaging and impermeability of the plasma membrane (Harayama and Riezman, 2018; de Mendoza and Pilon, 2019). Therefore, low expression levels of sterol-synthesis related genes in ASIP1 intestines could have impaired membrane fluidity resulting in increased membrane permeability (Subczynysk et al., 2017). Consistently, KEGG pathways related to membrane integrity, cellular cohesion and interaction with the extracellular matrix, i.e., focal adhesion and ECM-receptor interaction, were also down-regulated in ASIP1 males. This suggests that intestinal epithelium of ASIP1 males may show an augmented laxity resulting in an enhanced paracellular transport. Both the integrin and laminin systems were down-regulated in the transcriptome of ASIP1 zebrafish males. The integrins are transmembrane receptors that are essential for the formation of focal adhesions linking the actin cytoskeleton to the extracellular matrix (ECM) (Orre et al., 2019; Legerstee and Houtsmuller, 2021), thereby regulating cell adhesion and migration, ECM assembly, and mechanotransduction (Shattil et al., 2010). Integrins work as specific receptors for fibronectin and laminins, both glycoproteins of the ECM are required for the formation and function of the basement membranes (Hohenester, 2019). In summary, intestinal transcriptome enrichment analysis identifies differential gene expression programs of key cellular pathways underlying the structure and function of the intestinal epithelium that may result in increased membrane fluidity and permeability, but also in enhanced metabolite transport and absorption.
Transcriptome differential analysis in females yielded contrasting results, as the regulated GO terms and KEGG pathways were different from those observed in males, although some biological processes were coincident. Similar to males, vitamin transport was also up-regulated, as well as some processes related to the ion transport, i.e., sodium, calcium and potassium ion homeostasis. Although amino acid transport was not up-regulated, as in males, both GO and KEGG pathways revealed an enhanced intestinal amino acid metabolism that could resemble an enriched usage of protein metabolites derived from digestive processes. Regarding membrane integrity, enrichment analysis revealed the up-regulation of genes involved in the regulation of membrane permeability, but also some processes related to cell adhesion, once more, suggesting that membrane integrity in ASIP1 females is modified. Consistently, glycerophospholipid and glycerol metabolic processes are down-regulated in ASIP1 females. Glycerophospholipid are key elements of the lipid bilayer in the plasma membrane which are also involved in the lipid emulsion (Yang et al., 2018). Although data in females are not as conclusive in males, it appears that amino acid and ion transport is enhanced in ASIP1 animals, as well as the membrane structure.
Epithelia (including the intestine) display two distinctive features: polarity and tightness. Asymmetric distribution of transporters to the apical or basolateral membrane of the intestinal cell generates epithelial polarity, whereas tight junctions regulate tissue tightness (i.e., selectivity). Several epithelial transporters and some epithelial function-related changes were identified by a transcriptomic approach. Therefore, the following step was aimed at understanding whether these changes in gene expression translate into functional changes in the intestine. Our tool of choice was the Ussing chamber, which provides a robust experimental setup for functional analysis of the intestine (at the epithelial level). Although experimental setup is challenging in zebrafish due to the size of the tissue, when the tissue is opened flat and mounted between the two compartments of the Ussing chamber, transport, and epithelial properties can be studied using epithelial electrophysiology. No such previous studies exist in zebrafish. Therefore, in order to address this lack of knowledge, plasma measurements of the primary ion species and osmolality were carried out to formulate a zebrafish-specific Ringer’s solution that mimics plasma ion levels. The experiments were run using species-specific Ringer’s solution. Applying these conditions, significant changes in basal short-circuit current in ASIP1 animals were identified, reflecting changes in the transport capacity of the epithelium. Pharmacological experiments were not performed so the mechanisms responsible for this increase in the absorptive pathway remain unidentified. However, the transcriptomic approach provides a solid indication of the ample changes in transport mechanisms.
Measurement of tissue resistance (Rt) is the gold standard to show tissue integrity and selectivity changes. Unfortunately, no other studies are available in zebrafish to enable a comparison of our results. Yet, values of intestinal Rt ~75 Ω cm2 in wild-type zebrafish are consistent with the anterior or mid intestine of other freshwater teleost such as tilapia, eel, or goldfish (Albus et al., 1979: Ruiz-Jarabo et al., 2017). However, intestinal Rt in zebrafish was much higher than those reported in medaka, a fish of similar size and equally challenging, between 3-12 Ω cm2 (Madsen et al., 2014). In ASIP1 transgenic fish, tissue resistance showed a significant decrease to values ~40 Ω cm2. This decrease shows a modification of the intestinal barrier function in ASIP1 transgenics, which could be explained, to a certain extent, by the molecular down-regulation of important tight junction components (Zihni et al., 2016) such as claudin (cldg, logFC=-1.59, p=0,048) or protocadherin (protocadherin 1 gamma 3, logFC=-2.74, FDR=0,0048). To further consolidate the results on functional modification of barrier function, paracellular permeability was measured using standard methods with 4kD FITC-dextran (Balda et al., 1996) and a complementary effect was observed. Paracellular permeability was higher in ASIP1 transgenic zebrafish. Both the decrease in Rt and the increase in permeability, which measure the same aspects of tight junction functionality, are in solid agreement and point to an ASIP-dependent decrease in tissue selectivity in the intestine of ASIP1 transgenic fish.
Amino acids and small peptides (di-/tripeptides) resulting from digestion are mainly transported into the enterocytes by several members of the group of families of solute carrier (SLC) membrane transport proteins (Broer, 2008; Broer and Fairweather, 2018). Previous studies in ASIP1 transgenic zebrafish (Godino-Gimeno et al., 2020) show improved growth in fish, which may be related to a better feed absorption. In addition, the list of up-regulated epithelial amino acid transport-related genes gleaned from transcriptomic effects provides several examples linked to proton and sodium movements. Therefore, a new set of experiments was devised to test the electrogenic amino acid transport in the zebrafish intestine. The aim of the test is to verify whether the presence of amino acids stimulates the epithelium, thus generating a change in the current due to the cotransport of amino acids with ions (Bröer, 2008). A standard mixture of essential amino acids (MEM x50 essential amino acids) was used as the stimulus for wild-type and ASIP1 transgenic zebrafish which led to the observation of concentration-dependent effects and response plateaus within 30 minutes of stimulation. Therefore, dose-response curves were constructed with the sequential addition of increased concentrations of stimulus (4, 8 and 16 mM) in each ex-vivo preparation. Responses fitted a linear regression in both cases yet with much steeper slopes in the case of ASIP1 transgenic zebrafish. Our assay shows evidence of the essential amino acid transport linked to ion movements specially sodium and protons. However, there is a strong up-regulation of several sodium and proton independent amino acid transporters such as slc7a7, slc16a10, slc43a2a, to mention but a few, in the ASIP1 transgenic zebrafish. Such observations when translated into a functional perspective provide strong indication that ASIP1 transgenic zebrafish can extract more amino acids from their diet at similar feeding levels.
The following step was to find out whether such effects on intestinal tissue are directly mediated by melanocortin receptors. Transcriptome analysis revealed modest MCR expression in the zebrafish intestine. However, using the same RNA as those isolated for RNAseq studies, the amplifying PCR technique showed that all six receptors are expressed in the intestine, as previously demonstrated (Ringholm et al., 2002). Earlier studies demonstrated that ASIP1 functions as a competitive antagonist and inverse agonist of MCR in several fish species including zebrafish (Cerdá-Reverter et al., 2005; Sánchez et al., 2010; Guillot et al., 2016). MCR expression in the zebrafish intestine suggests that ASIP1 could block MCR signalling, even in the absence of the cognate agonist, by decreasing constitutive activity of the receptor (Sánchez et al., 2010; Guillot et al., 2016). However, a possible indirect action of the melanocortin peptides on intestinal function cannot be ruled out.
In summary, it has been demonstrated that overexpression of asip1 in zebrafish directly or indirectly regulates the intestinal barrier function by increasing the epithelium permeability and promoting enhanced electrogenic amino acid transport. Combined, such observations suggest that asip1-overexpressing zebrafish display an improved nutrient absorption and therefore, a higher feed efficiency which explains the enhanced growth in the absence of augmented food intake. Fish aquaculture sustainability is compromised not only by the availability of raw materials for commercial diets but also by food efficiency of reared fish (Naylor et al., 2000). Recently, the trading of GH overexpressing salmon for human consumption has been approved by U.S. Food and Drug Association. The enhanced growth of ASIP1 zebrafish potentially mediated by improved nutrient absorption and feed efficiency, suggests that the melanocortin system, specifically asip1 overexpression, is a potential target to enable the development of genetically engineered fish displaying enhanced growth with better feed conversion ratios and no differential lipid accumulation (Godino-Gimeno et al., 2020). A major issue for transgenic aquaculture involves engineered organism escapes and the displacement of the WT fish population of the same and/or related species in ecosystems. Our preliminary data suggest that ASIP1 fish are much less aggressive when competing with WT animals in dyadic fights, but further studies are required in order to evaluate fish behaviour, including feeding competition. Similar behavioural effects using exogenous Asip administration were reported before (Dijkstra et al., 2017). Furthermore, due to the effects of asip1 overexpression on dorsal-ventral pigment pattern (Ceinos et al., 2015), these animals are easily identifiable in the wild after potential escapes. Commercial rejection or adverse effects on markets by morphological aspects are unforeseen as pigment alterations only involve the dorsal region and never the flank of the fish. However, more studies in aquaculture species are required to translate the applicability of these results.
Data availability statement
The transcriptomic data presented in the study are deposited in the GEO repository under the accession number GSE206810.
Ethics statement
The animal study was reviewed and approved by Superior Council of Scientific Investigations” (CSIC) ethics committee (project number PID2019-103969RB-C33) and the “General Directorate of Agriculture, Livestock and Fishing of Valencia”, registration number: nGVRTE/2021/217198.
Author contributions
Conceptualization, JC-R; methodology, EL, SG, JR, AS-V, JF, and JC-R; formal analysis, AS-V, EL, JF, and JC-R; investigation, EL AA, AG-G, SG, and JC-R; data curation, EL, AS-V, JF, and JC-R; writing - original draft preparation, JC-R; writing - review and editing, EL, AA, AG-G, SG, JR, AS-V, JF, and JC-R; supervision JC-R; project administration, JC-R; funding acquisition, JC-R. All authors have read and agreed to the published version of the manuscript.
Funding
This study was financed by funds from MCIN/AEI/10.13039/501100011033 (PID2019-103969RB-C33 to JC-R and AGL2017-89648P to JR) and, as appropriate, by “ERDF A way of making Europe”, by the “European Union” or by the “European Union Next Generation EU/PRTR”. AG-G was recipient of a FPI predoctoral fellow (BES-2017-082424) from the Spanish State Agency of Research (AEI). CCMar receives Portuguese national funds from FCT - Foundation for Science and Technology through projects UIDB/04326/2020, UIDP/04326/2020 and LA/P/0101/2020.
Conflict of interest
Author AS-V is employed by Sequentia Biotech.
The remaining authors declare that the research was conducted in the absence of any commercial or financial relationships that could be construed as a potential conflict of interest.
Publisher’s note
All claims expressed in this article are solely those of the authors and do not necessarily represent those of their affiliated organizations, or those of the publisher, the editors and the reviewers. Any product that may be evaluated in this article, or claim that may be made by its manufacturer, is not guaranteed or endorsed by the publisher.
Supplementary material
The Supplementary Material for this article can be found online at: https://www.frontiersin.org/articles/10.3389/fmars.2022.1011702/full#supplementary-material
Supplementary Figure 1 | Network for Gene Ontology enrichment analysis of up-regulated genes in zebrafish ASIP1 males. Nodes represent Gene Ontologies while the edge thickness is proportional to the number of common genes between the linked nodes. Node size is proportional to the number of genes assigned to Gene Ontology; Colour represents enrichment significance (minus log10 transformed FDR), red indicates a greater significance level.
Supplementary Figure 2 | Network for KEGG enrichment analysis of up-regulated genes in zebrafish ASIP1 females. See Supplementary Figure 1 for details
Supplementary Figure 3 | Sex differences in the intestinal melanocortin receptor are measured by RT-qPCR. Significant differences after two-way ANOVA are indicated in the table below each graph.
References
Agulleiro M. J., Cortés R., Leal E., Ríos D., Sánchez E., Cerdá-Reverter J. M. (2014). Characterization, tissue distribution and regulation by fasting of the agouti family of peptides in the sea bass (Dicentrarchus labrax). Gen. Comp. Endocrinol. 205, 251–259. doi: 10.1016/j.ygcen.2014.02.009
Albus H., Groot J. A., Siegenbeek van Heukelom J. (1979). Effects of glucose and ouabain on transepithelial electrical resistance and cell volume in stripped and unstripped goldfish intestine. Pflugers Arch. 383, 55–66. doi: 10.1007/BF00584475
Arnold Y. E., Thorens J., Bernard S., Kalia Y. N., Rotllant J. (2019). Drug transport across porcine intestine using an ussing chamber system: Regional differences and the effect of P-glycoprotein and CYP3A4 activity on drug absorption. Pharmaceutics 11, 123.
Balda M. S., Whitney J. A., Flores C., González S., Cereijido M., Matter K. (1996). Functional dissociation of paracellular permeability and transepithelial electrical resistance and disruption of the apical-basolateral intramembrane diffusion barrier by expression of a mutant tight junction membrane protein. J. Cell Biol. 134, 1031–1049. doi: 10.1083/jcb.134.4.1031
Benjamini Y., Hochberg Y. (1995). Controlling the false discovery rate: a practical and powerful approach to multiple testing. J. R Stat. Soc. Ser. B. 57, 289–300. doi: 10.1111/j.2517-6161.1995.tb02031.x
Broer S. (2008). Amino acid transport across mammalian intestinal and renal epithelia. Physiol. Rev. 88, 249–286. doi: 10.1152/physrev.00018.2006
Broer S., Fairweather S. J. (2018). Amino acid transport across the mammalian intestine. Comp. Physiol. 9, 343–373. doi: 10.1002/cphy.c170041
Cal L., Braasch I., Kelsh R. N., Cerdá-Reverter J. M., Rotllant J. (2017). Fish pigmentation and melanocortin system. Comp. Biochem. Physiol. A Mol. Integr. Physiol. 211, 26–33. doi: 10.1016/j.cbpa.2017.06.001
Ceinos R. M., Guillot R., Kelsh R. N., Cerdá-Reverter J. M., Rotllant J. (2015). Pigment patterns in adult fish result from superimposition of two largely independent pigmentation mechanisms. Pigment Cell Melanoma Res. 28, 196–209. doi: 10.1111/pcmr.12335
Cerdá-Reverter J. M., Agulleiro M. J., Cortés R., Sánchez E., Guillot R., Leal E., et al. (2013). Involvement of MRAPs in the function of melanocortin receptors (MCRs). Gen. Comp. Endocrinol. 188, 133–136. doi: 10.1016/j.ygcen.2013.01.017
Cerdá-Reverter J. M., Agulleiro M. J., Sánchez E., Guillot R., Ceinos R., Rotllant J. (2011). Fish melanocortin system. Eur. J. Pharmcol. 660, 53–60. doi: 10.1016/j.ejphar.2010.10.108
Cerdá-Reverter J. M., Ling M., Schiöth H. B., Peter R. E. (2003b). Molecular cloning, pharmacological characterization and brain mapping of the melanocortin 5 receptor in the goldfish. J. Neurochem. 87, 1354–1367. doi: 10.1046/j.1471-4159.2003.02107.x
Cerdá-Reverter J. M., Schiöth H. B., Peter R. E. (2005). Gene structure of the goldfish agouti-signaling protein: a putative role in the dorsal-ventral pigment pattern of fish. Endocrinology 146, 1597–1610. doi: 10.1210/en.2004-1346
Cerdá-Reverter J. M., Peter R. E. (2003). Endogenous melanocortin antagonist in fish. structure, brain mapping and regulation by fasting of the goldfish agouti-related protein gene. Endocrinology 144, 4552–4561. doi: 10.1210/en.2003-0453
Cerdá-Reverter J. M., Ringholm A., Schiöth H. B., Peter R. E. (2003a). Molecular cloning, pharmacological characterization and brain mapping of the melanocortin 4 receptor in the goldfish: Involvement in the control of food intake. Endocrinology 144, 2336–2349. doi: 10.1210/en.2002-0213
Cortés R., Navarro S., Agullerio M. J., Guillot R., García-Herranz V., Sánchez E., et al. (2014). The evolution of the melanocortin system. Gen. Comp. Endocrinol. 209C, 3–10. doi: 10.1016/j.ygcen.2014.04.005
De Mendoza D., Pilon M. (2019). Control of membrane lipid homeostasis by lipid-bilayer associated sensors: A mechanism conserved from bacteria to humans. Prog. Lipid Res. 76, 100996. doi: 10.1016/j.plipres.2019.100996
Dijkstra P. D., Maguire S. M., Harris R. M., Rodriguez A. A., DeAngelis R. S., Flores S. A., et al. (2017). The melanocortin system regulates body pigmentation and social behaviour in a colour polymorphic cichlid fish. Proc. R. Soc. B: Biol. Sci. 284, 20162839. doi: 10.1098/rspb.2016.2838
Dobin A., Davis C. A., Schlesinger F., Drenkow J., Zaleski C., Jha S., et al. (2013). STAR: ultrafast universal RNA-seq aligner. Bioinformatics 29, 15–21. doi: 10.1093/bioinformatics/bts635
Fan W., Boston B. A., Kesterson R. A., Hruby V. J., Cone R. D. (1997). Role of melanocortinergic neurons in feeding and the agouti obesity syndrome. Nature 385, 165–168. doi: 10.1038/385165a0
Fuentes J., Power D. M., Canário A. V. (2010). Parathyroid hormone-related protein-stanniocalcin antagonism in regulation of bicarbonate secretion and calcium precipitation in a marine fish intestine. Am. J. Physiol. 299, R150–R158. doi: 10.1152/ajpregu.00378.2009
Godino-Gimeno A., Sánchez E., Guillot R., Rocha A., Angotzi A. R., Leal E., et al. (2020). Growth performance after agouti-signaling protein 1 (asip1) overexpression in transgenic zebrafish. Zebrafish 17, 373–381. doi: 10.1089/zeb.2020.1932
Gregório S. F., Carvalho E. S., Encarnação S., Wilson J. M., Power D. M., Canário A. V., et al. (2013). Adaptation to different salinities exposes functional specialization in the intestine of the sea bream (Sparus aurata l.). J. Exp. Biol. 216, 470–479. doi: 10.1242/jeb.073742
Guillot R., Cortés R., Navarro S., Mischitelli M., García-Herranz V., Sánchez E., et al. (2016). Behind melanocortin antagonist overexpression in the zebrafish brain: A transcriptomic and behavioral approach. Horm. Behav. 82, 87–100. doi: 10.1016/j.yhbeh.2016.04.011
Harayama T., Riezman H. (2018). Understanding the diversity of membrane lipid composition. Nat. Rev. Mol. Cell Biol. 19, 281–296. doi: 10.1038/nrm.2017.138
Hohenester E. (2019). Structural biology of laminin. Essays Biochem. 63, 285–295. doi: 10.1042/EBC20180075
Huszar D., Lynch C. A., Fairchild-Huntress V., Dunmore J. H., Fang Q., Berkemeier L. R., et al. (1997). Targeted disruption of melanocortin-4 receptor results in obesity in mice. Cell 88, 131–141. doi: 10.1016/s0092-8674(00)81865-6
Johnson N. L., Kotz S., Kemp A. W. (1992). Univariate discrete distributions. 2nd ed. (New York: Wiley).
Legerstee K., Houtsmuller A. B. (2021). A layered view on focal adhesions. Biology 10, 1189. doi: 10.3390/biology10111189
Liao Y., Smyth G. K., Shi W. (2014). Feature counts: an efficient general-purpose program for assigning sequence reads to genomic features. Bioinformatics 30, 923–930. doi: 10.1093/bioinformatics/btt656
Livak K. J., Schmittgen T. D. (2001). Analysis of relative gene expression data using real-time quantitative PCR and the 2(-delta delta C(T)) method. Methods 25, 402–408. doi: 10.1006/meth.2001.1262
Li X., Zheng S., Wu G. (2021). Nutrition and functions of amino acids in fish. Adv. Exp. Med. Biol. 1285, 133–168. doi: 10.1007/978-3-030-54462-1_8
Löhr H., Hess S., Pereira M. M. A., Reinoß P., Leibold S., Schenkel C. (2018). Diet-induced growth is regulated via acquired leptin resistance and engages a pomc-somatostatin-growth hormone circuit. Cell Rep. 23, 1728–1741. doi: 10.1016/j.celrep.2018.04.018
Luo W., Brouwer C. (2013). Pathview: An R/Bioconductor package for pathway-based data integration and visualization. Bioinformatics 29, 1830–1831. doi: 10.1093/bioinformatics/btt285
Lu D., Willard D., Patel I. R., Kadwell S., Overton L., Kost T., et al. (1994). Agouti protein is an antagonist of the melanocyte-stimulating-hormone receptor. Nature 371, 799–802. doi: 10.1038/371799a0
Madsen S. S., Bujak J., Tipsmark C. K. (2014). Aquaporin expression in the Japanese medaka (Oryziaslatipes) in freshwater and seawater: challenging the paradigm of intestinal water transport? J. Exp. Biol. 217, 3108–3121. doi: 10.1242/jeb.105098
Naylor R. L., Goldburg R. J., Primavera J. H., Kautsky N., Beveridge M. C., Clay J., et al. (2000). Effect of aquaculture on world fish supplies. Nature 405, 1017–1024. doi: 10.1038/35016500
Ollmann M. M., Wilson B. D., Yang Y. K., Kerns J. A., Chen I., Gantz I., et al. (1997). Antagonism of central melanocortin receptors in vitro and in vivo by agouti-related protein. Science 278, 135–138. doi: 10.1126/science.278.5335.135
Orré T., Rossier O., Giannone G. (2019). The inner life of integrin adhesion sites: From single molecules to functional macromolecular complexes. Exp. Cell Res. 379, 235–244. doi: 10.1016/j.yexcr.2019.03.036
Rau A., Gallopin M., Celeux G., Jaffrezic F. (2013). Data-based filtering for replicated high-throughput transcriptome sequencing experiments. Bioinformatics 29, 2146–2152. doi: 10.1093/bioinformatics/btt350
R Core Team (2020). “R: A language and environment for statistical computing,” (Vienna, Austria: R Foundation for Statistical Computing). Available at: https://www.R-project.org/.
Ringholm A., Fredriksson R., Poliakova N., Yan Y. L., Postlethwait J. H., Larhammar D., et al. (2002). One melanocortin 4 and two melanocortin 5 receptors from zebrafish show remarkable conservation in structure and pharmacology. J. Neurochem. 82, 6–18. doi: 10.1046/j.1471-4159.2002.00934.x
Robinson M. D., McCarthy D. J., Smyth G. K. (2010). R: A bioconductor package for differential expression analysis of digital gene expression data. Bioinformatics 26, 139–140. doi: 10.1093/bioinformatics/btp616
Rossi M., Kim M. S., Morgan D. G. A., Small C. J., Edwards C. M. B., Sunter D., et al. (1998). A c-terminal fragment of agouti-related protein increases feeding and antagonizes the effect of alpha-melanocyte stimulating hormone in vivo. Endocrinology 139, 4428–4431. doi: 10.1210/endo.139.10.6332
Ruiz-Jarabo I., Gregório S. F., Gaetano P., Trischitta F., Fuentes J. (2017). High rates of intestinal bicarbonate secretion in seawater tilapia (Oreochromis mossambicus). Com Biochem. Physiol. A. 207, 57–64. doi: 10.1016/j.cbpa.2017.02.022
Sánchez E., Rubio V. C., Cerdá-Reverter J. M. (2010). Molecular and pharmacological characterization of the melanocortin receptor subtype 1 in the Sea bass. Gen. Comp. Endocrinol. 65, 163–169. doi: 10.1016/j.ygcen.2009.06.008
Sánchez E., Rubio V. C., Thompson D., Metz J., Flik G., Millhauser G. L., et al. (2009). Phosphodiesterase inhibitor-dependent inverse agonism of agouti-related protein (AGRP) on melanocortin 4 receptor in sea bass (Dicentrarchus labrax). A J. Physiol. 296, R1293–R1306. doi: 10.1152/ajpregu.90948.2008
Schiöth H. B., Haitina T., Ling M. K., Ringholm A., Fredriksson R., Cerdá-Reverter J. M., et al. (2005). Evolutionary conservation of the structural, pharmacological and genomic characteristics of the melanocortin receptors subtypes. Peptides 26, 1886–1900. doi: 10.1016/j.peptides.2004.11.034
Shattil S. J., Kim C., Ginsberg M. H. (2010). The final steps of integrin activation: the end game. Nat. Rev. Mol. Cell Biol. 11, 288–300. doi: 10.1038/nrm2871
Subczynski W. K., Pasenkiewicz-Gierula M., Widomska J., Mainali L., Raguz M. (2017). High cholesterol/low cholesterol: Effects in biological membranes. Cell Biochem. Biophys. 75, 369–385. doi: 10.1007/s12013-017-0792-7
Tao Y. X. (2014). Constitutive activity in melanocortin-4 receptor: biased signaling of inverse agonists. Adv. Pharmacol. 70, 135–154. doi: 10.1016/B978-0-12-417197-8.00005-5
Yang Y., Lee M., Fairn G. D. (2018). Phospholipid subcellular localization and dynamics. J. Biol. Chem. 293, 6230–6240. doi: 10.1074/jbc.R117.000582
Keywords: amino acid transport, feed efficiency, growth performance, gut, melanocortin, nutrient absorption
Citation: Leal E, Angotzi AR, Godino-Gimeno A, Gregório SF, Rotllant J, Saera-Vila A, Fuentes J and Cerdá-Reverter JM (2022) Agouti overexpression in a transgenic model regulates integrity, permeability and electrogenic amino acid transport in zebrafish intestine. Front. Mar. Sci. 9:1011702. doi: 10.3389/fmars.2022.1011702
Received: 04 August 2022; Accepted: 28 October 2022;
Published: 23 November 2022.
Edited by:
Manuel Gesto, Technical University of Denmark, DenmarkReviewed by:
Peter Dijkstra, Central Michigan University, United StatesJose Luis Muñoz, University of Los Lagos, Chile
Copyright © 2022 Leal, Angotzi, Godino-Gimeno, Gregório, Rotllant, Saera-Vila, Fuentes and Cerdá-Reverter. This is an open-access article distributed under the terms of the Creative Commons Attribution License (CC BY). The use, distribution or reproduction in other forums is permitted, provided the original author(s) and the copyright owner(s) are credited and that the original publication in this journal is cited, in accordance with accepted academic practice. No use, distribution or reproduction is permitted which does not comply with these terms.
*Correspondence: José Miguel Cerdá-Reverter, jm.cerda.reverter@csic.es