Pathway-Centric Analysis of Microbial Metabolic Potential and Expression Along Nutrient and Energy Gradients in the Western Atlantic Ocean
 Maria A. Cavaco1*
  Maya P. Bhatia1*
  Alyse K. Hawley2
  Monica Torres-Beltrán3
  Winifred M. Johnson4
  Krista Longnecker5 Kishori Konwar6
  Elizabeth B. Kujawinski5
  Steven J. Hallam7,8,9,10,11
- 1Department of Earth and Atmospheric Sciences, University of Alberta, Edmonton, AB, Canada
- 2School of Engineering, University of British Columbia, Kelowna, BC, Canada
- 3Department of Microbiology and Immunology, Life Sciences Centre, University of British Columbia, Vancouver, BC, Canada
- 4Department of Chemistry and Biochemistry, University of North Carolina Wilmington, Wilmington, NC, United States
- 5Department of Marine Chemistry and Geochemistry, Woods Hole Oceanographic Institution, Woods Hole, MA, United States
- 6Broad Institute of Massachusetts Institute of Technology (MIT) and Harvard University, Cambridge, MA, United States
- 7Department of Microbiology and Immunology, University of British Columbia, Vancouver, BC, Canada
- 8Graduate Program in Bioinformatics, University of British Columbia, Vancouver, BC, Canada
- 9Genome Science and Technology Program, University of British Columbia, Vancouver, BC, Canada
- 10Life Sciences Institute, University of British Columbia, Vancouver, BC, Canada
- 11Ecosystem Services, Commercialization Platforms & Entrepreneurship (ECOSCOPE) Training Program, University of British Columbia, Vancouver, BC, Canada
Microbial communities play integral roles in driving nutrient and energy transformations in the ocean, collectively contributing to fundamental biogeochemical cycles. Although it is well known that these communities are stratified within the water column, there remains limited knowledge of how metabolic pathways are distributed and expressed. Here, we investigate pathway distribution and expression patterns from surface (5 m) to deep dark ocean (4000 m) at three stations along a 2765 km transect in the western South Atlantic Ocean. This study is based on new data, consisting of 43 samples for 16S rRNA gene sequencing, 20 samples for metagenomics and 19 samples for metatranscriptomics. Consistent with previous observations, we observed vertical zonation of microbial community structure largely partitioned between light and dark ocean waters. The metabolic pathways inferred from genomic sequence information and gene expression stratified with depth. For example, expression of photosynthetic pathways increased in sunlit waters. Conversely, expression of pathways related to carbon conversion processes, particularly those involving recalcitrant and organic carbon degradation pathways (i.e., oxidation of formaldehyde) increased in dark ocean waters. We also observed correlations between indicator taxa for specific depths with the selective expression of metabolic pathways. For example, SAR202, prevalent in deep waters, was strongly correlated with expression of the methanol oxidation pathway. From a biogeographic perspective, microbial communities along the transect encoded similar metabolic potential with some latitudinal stratification in gene expression. For example, at a station influenced by input from the Amazon River, expression of pathways related to oxidative stress was increased. Finally, when pairing distinct correlations between specific particulate metabolites (e.g., DMSP, AMP and MTA) and both the taxonomic microbial community and metatranscriptomic pathways across depth and space, we were able to observe how changes in the marine metabolite pool may be influenced by microbial function and vice versa. Taken together, these results indicate that marine microbial communities encode a core repertoire of widely distributed metabolic pathways that are differentially regulated along nutrient and energy gradients. Such pathway distribution patterns are consistent with robustness in microbial food webs and indicate a high degree of functional redundancy.
Introduction
Interacting microorganisms are the engines that drive Earth’s biogeochemical cycles (Falkowski et al., 2008). In the ocean, microbial interactions contribute to food web organization (Zehr et al., 2011; Hutchins & Fu, 2017), climate active trace gas cycling (Freing et al., 2012; Robinson, 2019), and conversion and transport of organic carbon (Moran et al., 2016) among many other roles. Microbial metabolic functions manifest at the individual, population and community levels of biological organization, linking different trophic levels together into a living network. This microbial network serves to fix carbon and nitrogen in the photic zone, and in doing so, releases bioavailable metabolites and/or nutrients that can be transferred to higher trophic levels (Voss et al., 2013; Aylward et al., 2015) via re-mineralization by heterotrophic microorganisms, with some of the carbon exported to the deep ocean on sinking particles (Durkin et al., 2016). Within these sinking particles, localized nutrient and energy gradients serve to support anaerobic processes such as nitrate or sulfate reduction in the mesopelagic and deep ocean (Dang and Lovell, 2016). When heterotrophic remineralization activities exceed oxygen supply in poorly ventilated waters, marine oxygen-deficient zones are formed, impacting larger-scale nutrient and energy flow patterns across the water column (Wright et al., 2012). The extent to which microbial community structure and functions vary across environmental gradients is an important consideration in developing a more consilient perspective of ocean ecosystem functions and services in a time of climate change.
Over the past four decades, advances in DNA sequencing technologies have enhanced our understanding of the ocean microbiome, its functional capabilities, and its biogeography across the globe (DeLong et al., 2006; Zhang & Ning, 2015; Mende et al., 2017; Mende et al., 2019; Poff et al., 2021). Key studies have established the paradigm that water column differences in light, temperature, pressure, and nutrient availability create environmental gradients resulting in vertical stratification of microbial community structure and function (Delong et al., 2006; Bouman et al., 2011; Mende et al., 2017). For example, strains of omnipresent photo-synthesizers, Prochlorococcus and Synechococcus, and clades of heterotrophic bacterioplankton SAR11, dominate the surface ocean (DeLong et al., 2006; Sunagawa et al., 2015; Milici et al., 2016a; Giovanonni, 2017; Mende et al., 2019), followed by a succession of microbial members with depth (e.g., the Gammaproteobacteria clade SAR86, Marinimicrobia, Thaumarchaeota, Nitrospinae) adapted for survival in dark waters containing less labile carbon compounds (Hawley et al., 2017a; Sunagawa et al., 2015; Mende et al., 2019; Acinas et al., 2021; Poff et al., 2021).
Though cell abundance and growth rates generally decline with diminishing sunlight, taxonomic diversity tends to increase with depth (Ferreira et al., 2014; Hawley et al., 2014; Sunagawa et al., 2015; Acinas et al., 2021). Despite this trend, functional diversity does not increase to the same spatial extent due to the presence of a relatively stable, common group of genes encoding core metabolic processes (Furhman, 2009; Ferreira et al., 2014; Hanson et al., 2014; Sunagawa et al., 2015). These processes, including DNA synthesis, cell membrane synthesis, etc., are universally required for cellular metabolic function, regardless of external environmental conditions (Ferreira et al., 2014; Hanson et al., 2014; Aylward et al., 2015). However, despite the presence of a large, common metabolic core, environment-specific adaptations are encoded by so-called accessory genes for specialized genetic traits and are present in a fraction (~30%) of the metagenome (Sunagawa et al., 2015). It is the functions encoded within the accessory genome that determines the metabolic niche that a microbe can flourish in. The high degree of functional redundancy observed even within specialised metabolic niches across diverse marine microbial taxa may be indicative of selective pressure for resilience within marine microbial food webs (Sunagawa et al., 2015, Moran et al., 2016). Together, core and accessory gene-encoded functions determine microbial metabolic potential at different levels of biological organization. Metabolic responses to transient environmental conditions result in expression of select core and accessory genes, constituting the microbial metatranscriptome (Ferreira et al., 2014; Hawley et al., 2017; Salazar et al., 2019). Different microbial communities with distinct metabolic activities are associated with major physicochemical transitions in the water column (Hewson et al., 2014; Salazar et al., 2019). Collectively, expressed functions from these distinct communities reflect active metabolic states contributing to biogeochemical cycles at local, basin and global scales (Chen et al., 2017; Grossart et al., 2019).
Traditionally, temperature, light availability, and nutrient limitation are invoked as primary drivers in the evolution and prevalence of core and accessory functions in the global ocean microbiome (DeLong et al., 2006; Sunagawa et al., 2015; Mende et al., 2017). However, recent studies additionally point to organic matter as playing a role in shaping microbial functional diversity and expression (Poff et al., 2021). Generally, a gradient of carbon bioavailability exists down the water column as organic compounds transition from labile organic matter in the surface waters to more recalcitrant aromatic-containing molecules at depth (Gifford et al., 2013). Carbon transport to lower depths can also occur via polysaccharide matrices coalesced together as marine snow (Poff et al., 2021) and/or via particulate organic matter in currents and deep-water masses (Reinthaler et al., 2013; Catala et al., 2015). These variable carbon sources and compositions generate diverse metabolic niches occupied by varied microbial community members as free-living and/or particle-associated organisms (Dang and Lovell, 2016; Bergaur et al., 2017; Kieft et al., 2021). In the dark, bathypelagic ocean, recent global surveys reveal widespread occurrences of mixotrophic lifestyles, where microbial community members grow both autotrophically and heterotrophically, supporting wide use of various carbon compounds (Acinas et al., 2021). However, linking these transformations in the organic matter pool to specific taxa or microbiome functions remains elusive (Moran et al., 2016).
A fundamental goal of marine microbial ecology is to understand the drivers of taxonomic and functional distribution and connectedness throughout the global ocean. Surface planktonic marine microbial communities have been shown to exhibit a latitudinal gradient in diversity, driven by temperature, with maximal diversity occurring at intermediate latitudinal ranges (Furhman, 2009; Sunagawa et al., 2015). More recently, community lifestyle (i.e., free-living versus particle-associated) has also been implicated in structuring microbial communities (Zorz et al., 2019; Acinas et al., 2021). Despite extensive global reach, recent large-scale sampling expeditions, like the TARA Oceans project (Sunagawa et al., 2015) and the Malaspina global circumnavigation (Acinas et al., 2021), left large regions under-sampled, particularly for metaomic analyses, including only a limited number of stations from the western South Atlantic Ocean (the regional focus of this current study). Thus, despite these global sampling efforts and recent progress in elucidating controls on contemporary biogeographic patterns of the marine microbiome, vast regions of the ocean remained under-studied.
The western South Atlantic Ocean is an expansive marine region influenced by significant riverine input (e.g. from the Amazon River Plume) and also exchanges with neighbouring ocean basins (i.e., the Southern Ocean and North Atlantic Ocean), resulting in the incorporation of multiple deep-water masses, including northward-flowing Antarctic Intermediate Water (AAIW) and Antarctic Bottom Water (AABW), and southward-flowing North Atlantic Deep Water (NADW) (Liu and Tanhua, 2019). Numerous studies have documented microbial community structure in the Atlantic Ocean water column from the surface to sediments (Milici et al., 2016a; Medina-Silva et al., 2018; Varliero et al., 2019; Willis et al., 2019), and recent large scale metagenomic studies have also provided insight into the functional potential of microorganisms (Biller et al., 2018; Coutinho et al., 2021). Coutinho et al. (2021) showed that as microbial communities in the South Atlantic broadly transition from surface to deep waters, there is an increasing abundance of metabolic processes related to degradation of aromatic compounds and alternate carbon fixation pathways (i.e., rTCA). Other studies have observed microbial community responses to more localized events like regional oil spills (Campeao et al., 2017; Appolinario et al., 2019). Coupled genomic and transcriptomic sequencing has been used to profile the distribution and expression of genes mediating carbon, nitrogen, phosphorus and sulfur transformations along a salinity gradient in the Amazon River Plume (Satinsky et al., 2017). This work showed that as freshwater river discharge mixes into the ocean, there is a peak in expression in microbial pathways related to carbon, nutrient and phosphorus uptake, demonstrating the impact of terrestrial derived nutrients on downstream marine microbial community functional profiles.
The exploration of functional potential and expression of microbial community metabolisms can be approached in different ways, including gene-centric, genome-resolved, or pathway-centric methodologies (Reed et al., 2014; Salazar et al., 2019; Acinas et al., 2021; Wang et al., 2021). All of these methods provide a functional context towards the metabolic capacity of microbial communities, with each having their own advantages and disadvantages. Gene-centric approaches are focused on abundances of individual functional genes which are implicated in a metabolic process (Tringe & Rubin, 2005; Tas et al., 2021), and have been used to group microbial populations into functional groups that can be represented in biogeochemical models (Reed et al., 2014). However, these methods have limited ability to differentiate a gene’s contribution towards a particular metabolic pathway as different pathways often share the same genes (Heidelberg et al., 2010). In contrast, genome-resolved approaches are focused on assembly and binning to recover metagenome resolved genomes. These are then used to uncover the functional roles of closely related donor genotypes that collectively describe community metabolism (Mende et al., 2017; Alneberg et al., 2018). While gene-centric approaches can provide information for a narrow set of functions and genome-resolved approaches can identify the metabolic repertoires encoded within a subset of the community, pathway-centric approaches provide insight into the metabolic networks driving nutrient and energy conversion processes at the community level of biological organization (Raes et al., 2011; De Filippo et al., 2012; Konwar et al., 2013; Hanson et al., 2014; Liu and Tanhua, 2019).
Here we expand on previous surveys of marine microbial community structure and function by combining small subunit ribosomal RNA (SSU or 16S rRNA) gene sequencing with a pathway-centric exploration of metabolic potential and expression in sunlit (5 m) to dark ocean (4000 m) waters at three locations (stations) in the western South Atlantic Ocean spanning a total of 2765 km. In this study, we analyze 43 samples for 16S rRNA gene sequencing, 20 samples for metagenomics and 19 samples for metatranscriptomics. We use functional annotations from environmental sequence information to reconstruct metabolic interaction networks, in the form of environmental Pathway/Genome Databases (ePGDBs), using MetaCyc – a highly curated, non-redundant, experimentally validated database of small-molecule metabolic pathways from all domains of life (Caspi et al., 2013; Konwar et al., 2013). Combined with measured parameters such as particulate and dissolved metabolites, and paired samples describing the physical and chemical oceanography (i.e., temperature, salinity, water mass, nutrients, carbon, etc.), we determined the structure and distribution of microbial communities (based on the 16S rRNA gene), their metabolic potential (based on pathways resolved in the metagenome), and metabolic expression (based on pathways resolved in the metatranscriptome) across the water column compartments in an understudied marine region. By concurrently analyzing all three forms of sequence information along-side environmental measurements, we gain novel, integrated insight into microbial community structure and function at specific depths and latitudes.
Materials and Methods
Sampling and Dataset Description
The ‘DeepDOM’ cruise (KN210-04) took place on the R/V Knorr from March 25 to May 9, 2013, beginning in Montevideo, Uruguay and ending in Bridgetown, Barbados. In total, twenty-three stations were sampled, with water column samples retrieved from the surface (5 m) to bottom waters (4000 m) along an 8482 km cruise track in the South Atlantic Ocean (Figure 1). We particularly focus on a 2765 km stretch of this cruise track, represented by Stations 7, 15 and 23, because these were the stations where taxonomic, metagenomic and metatranscriptomic samples were concurrently collected. Samples span both the South Atlantic Subtropical Gyre (Station 7) and the equatorial region, represented by Station 15 (Figure 1). All samples were collected in the open ocean, a minimum of 300 km off the coast of South America, with Station 23 exhibiting influence from the Amazon River plume. Down the water column, samples were collected at the surface (5 m), deep chlorophyll maximum (50-130 m), transition zone (250 m), oxygen minimum zone (~500 m), Antarctic Intermediate Water (AAIW, typically sampled at ~750-850 m), and North Atlantic Deep Water (NADW, typically sampled at ~2500 m) masses. The latitude and longitude for all sites and depths sampled, and the availability of taxonomic, metagenomic and metatranscriptomic data is summarized in Supplementary Table 1.
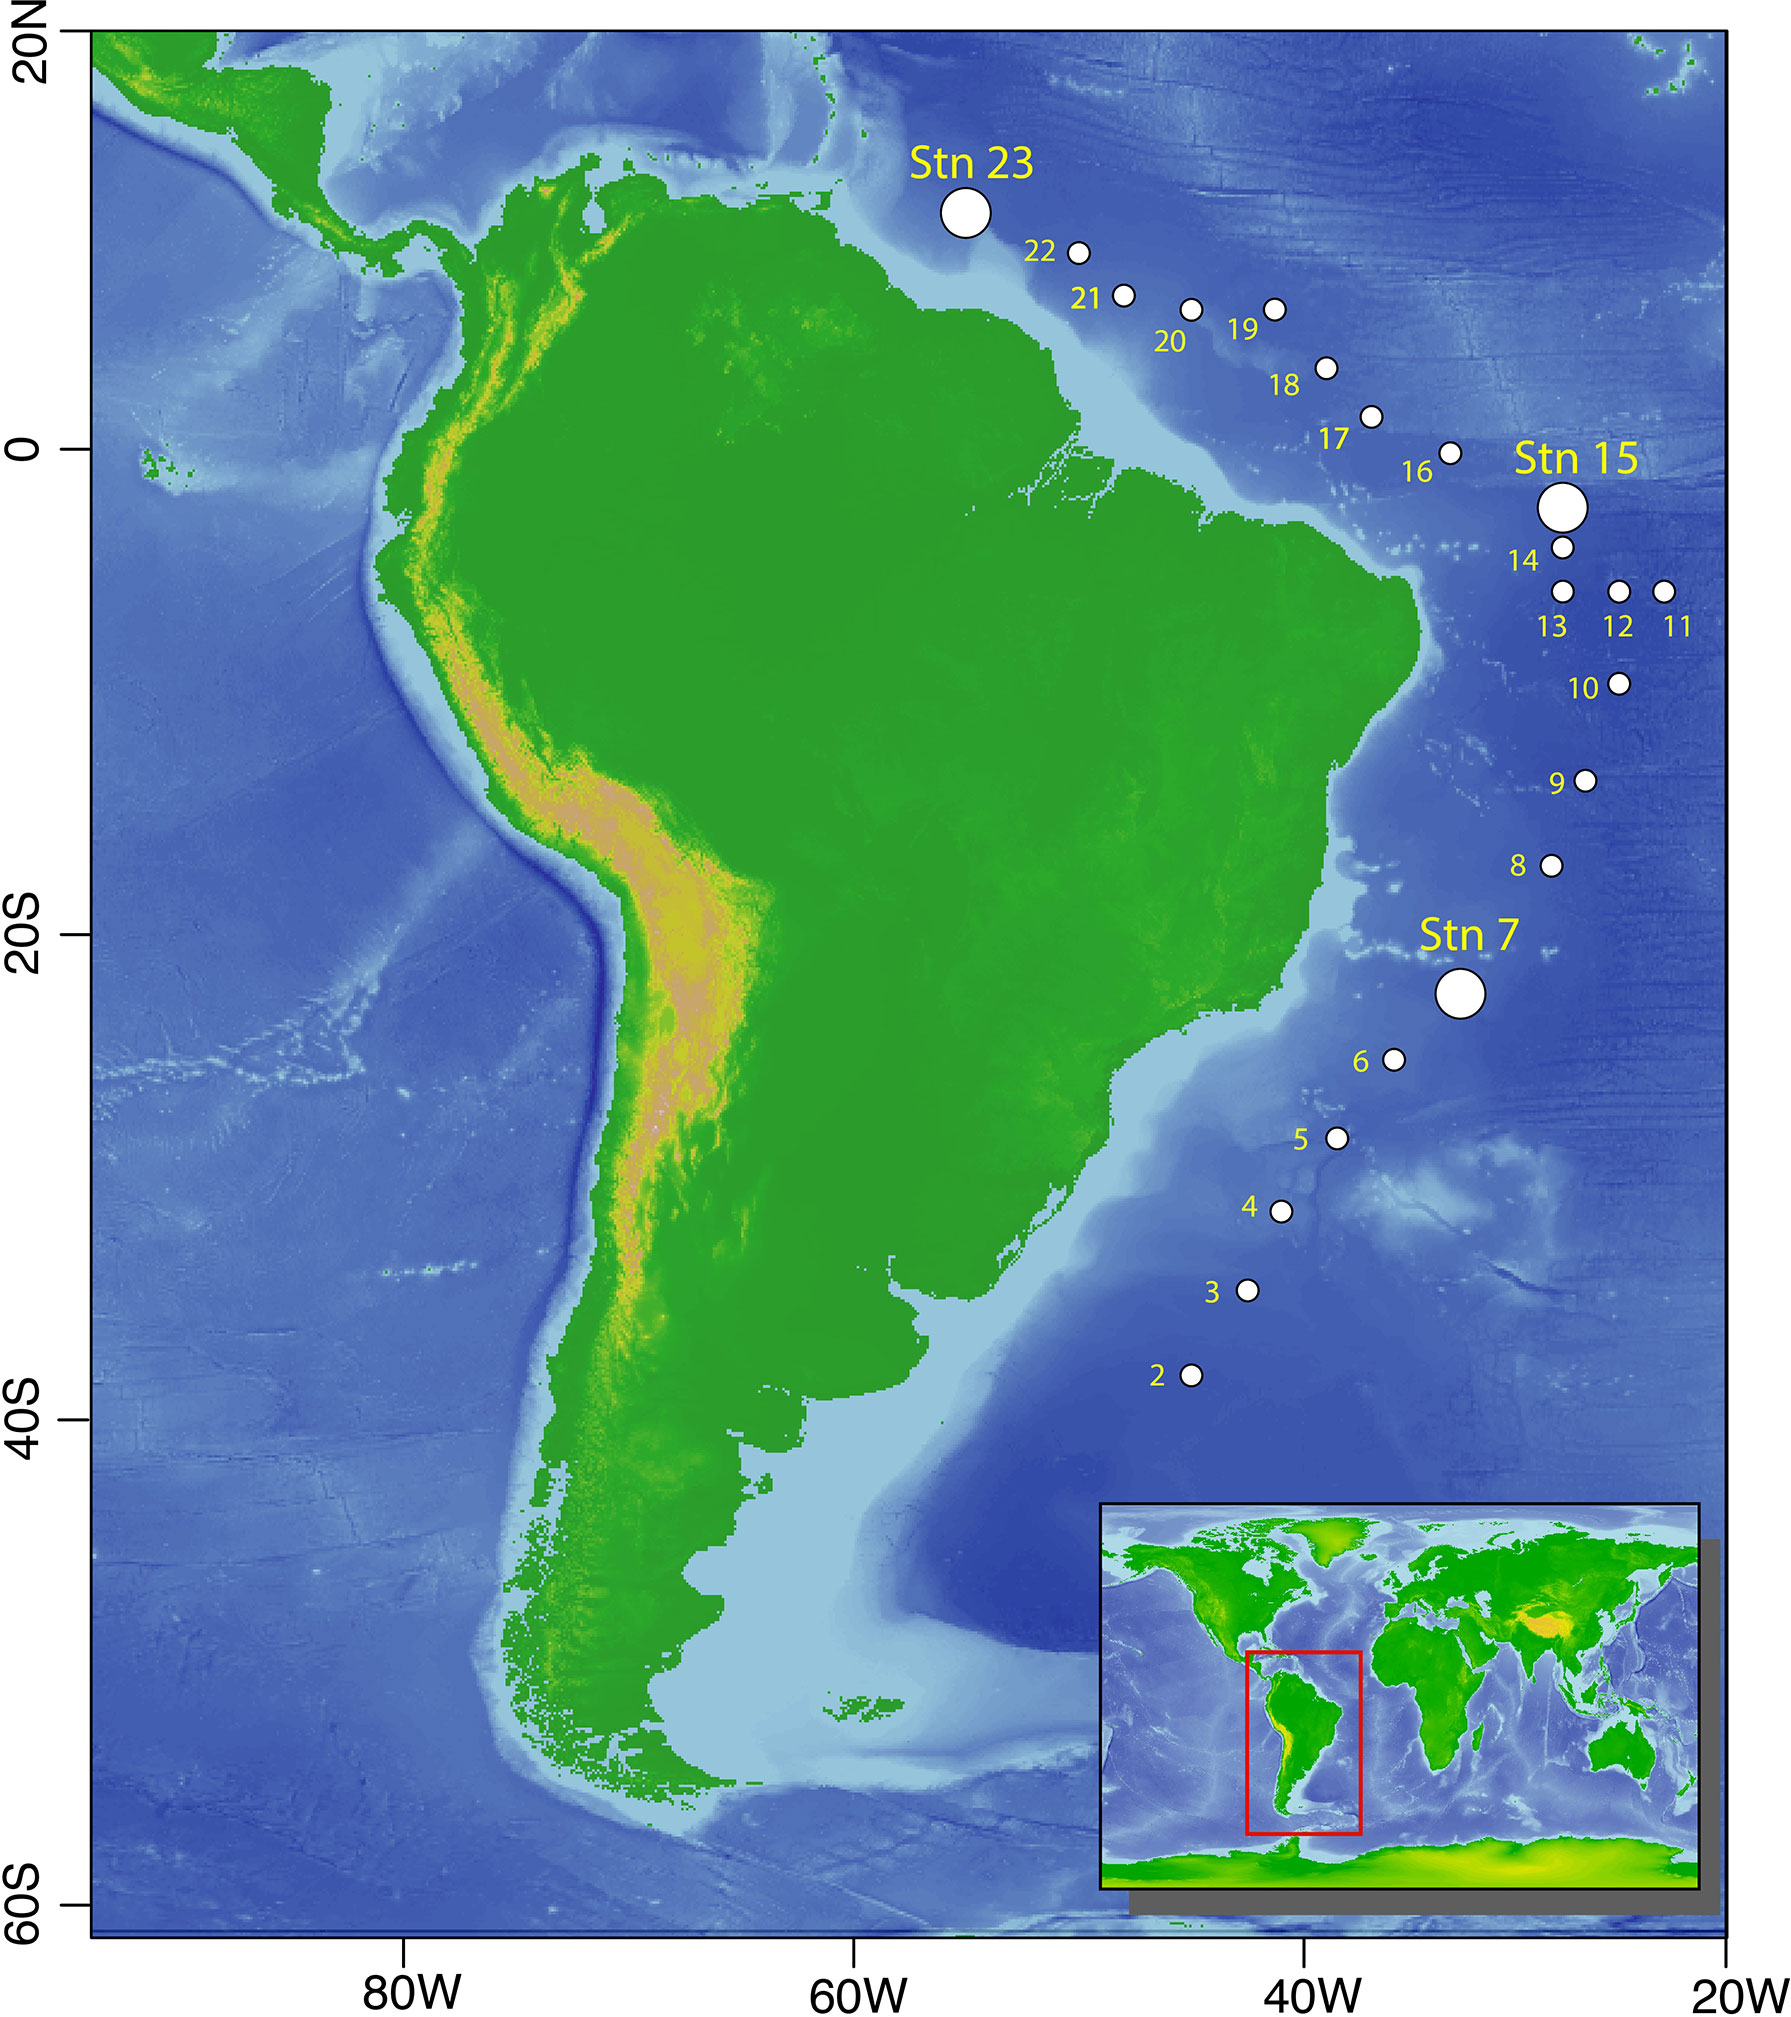
Figure 1 Map of sampled stations. Larger circles indicate the three stations (7, 15 and 23) along the cruise track where taxonomic metagenomic and metatranscriptomic data were collected in tandem, with smaller dots representing stations where water column chemical data and microbial taxonomic data were obtained. Base maps with bathymetry were obtained from the General Bathymetric Chart of the Oceans (GEBCO), 2020 version.
Measurement and Collection of Water Column Parameters
In situ water column measurements of conductivity, temperature and depth were collected with a CTD rosette using a SPE 9+ CTD system with a depth limit of 6000 m, and equipped with sensors for oxygen, fluorescence, turbidity, and photosynthetically available radiation (PAR). The in situ water column profiles plotted in this study were from the casts used to generate taxonomic profiles. Samples for major nutrients, including nitrate , nitrite ammonium , phosphate , silicate , total nitrogen (TN), and total organic carbon (TOC) were taken directly from 10L Niskin bottles. Samples for nutrient analysis were generally taken at the same depths where taxonomic data was obtained (Supplementary Table 1) using polycarbonate bottles, and frozen at -20°C until analysis could be completed at Oregon State University. , and were all analyzed on a hybrid Technicon AutoAnalyzer and Alpkem RFA300 system, following protocols modified from Gordon et al. (1994). The estimated precision for each element was as follows: , ± 0.008 µM; ; , ± 0.01 µM; . To measure the concentration of TN and TOC, 40mL seawater was preserved via acidification to pH 3 with concentrated trace-metal grade hydrochloric acid (HCl). These were then stored in combusted glass vials at 4°C until analysis on a Shimadzu TOC-VCSH total organic carbon analyzer coupled to a TNM-1 analyzer at the Woods Hole Oceanographic Institution. Blanks consisting of MilliQ water, and standard curves made with potassium hydrogen phthalate and potassium nitrate were interspersed into sample runs. The coefficient of variability between replicate injections was < 1%.
Collection, Processing and Data Analysis for Metabolites
Collection and processing of dissolved (< 0.2 um) and particulate (> 0.2 um) metabolites was done as per the methods outlined in Johnson et al. (in revision). Briefly, water (4 L) was directly collected from Niskin bottles into polytetrafluoroethylene (PTFE) or polycarbonate (PC) bottles, and then filtered through a previously combusted 0.7 µm GF/F filter (Whatman) and 0.2 µm filter (Omnipore, EMD Millipore) using a peristaltic pump. The resulting filtrate was then acidified with 4 mL of 12 M HCl (~pH 2-3). Dissolved organic molecules (< 0.2 um) were extracted from the filtrate using solid phase extraction (SPE) modified styrene-divinylbenzene polymer (Agilent Bond Elut PPL) (Dittmar et al., 2008; Longnecker, 2015). Extracts were stored at -20°C until analysis. Process blanks were created using shipboard and laboratory Milli-Q water. GF/F Filter (0.7 um) and Omnipore filter (0.2 um) membranes, collectively representing the particulate metabolite fraction, were extracted within 48 h prior to mass spectrometry analysis and processing occurred as per Johnson et al. (in revision). In brief, samples were run on a Phenomenex C18 column for LC-MS/MS analysis (Synergi Fusion, 2.1 x 150 mm, 4 µm) coupled via heated electrospray ionization (ESI) to a triple quadrupole mass spectrometer (Thermo Scientific TSQ Vantage) operated under selected reaction monitoring mode (SRM) (Kido Soule et al., 2015). Quantification and confirmation SRM transitions were monitored for each analyte. Before each batch of samples was run, the column was conditioned with 5 injections of the pooled samples. A pooled QC sample was then run after every ten samples. XCalibur RAW files generated by the mass spectrometer were converted to mzML files using msConvert (Chambers et al., 2012). MAVEN (Melamud et al., 2010; Clasquin et al., 2012) was used to select and integrate peaks and quality assessed as per Johnson et al. (in revision). Both particulate and dissolved metabolite concentrations (in pM) were normalized to sample volume.
Nucleic Acid Collection and Extraction
At each sampling depth, 2 L of seawater was collected directly from Niskin bottles into polycarbonate bottles for 16S rRNA gene sequencing. These samples were then filtered through a 0.2 µm PVDF Sterivex filter (EMD Millipore) without a pre-filter. Larger volume samples (20 L and 8 L) were collected for metagenomic and metatranscriptomic analyses, respectively, into polycarbonate carboys. These larger volume water samples were filtered through a 2.7 µm GF/D pre-filter followed by filtration through a 0.2 µm PVDF Sterivex filter (EMD Millipore). Sample filtration was done using a peristaltic pump (Masterflex), equipped with Tygon tubing, set to < 50 mL/min to avoid rupturing cells during filtration. Duplicate Sterivex filters were collected per depth for metagenomic and metatranscriptomic analyses. Filtration of samples for metatranscriptomic analyses was done as soon as possible after collection at room temperature benchtop aboard the R/V Knorr, taking approximately 20-25 minutes per sample. Residual seawater was removed by extrusion and 1.8 mL of sucrose lysis buffer or RNAlater were added to samples destined for genomic DNA and total RNA extraction, respectively. All filters were then frozen at -80°C until extraction. All plasticware and tubing was acid washed (using 2% HCl) and MilliQ water rinsed prior to use and in between different samples. In addition to the seawater, three additional samples from a sediment net trap were collected as described in Durkin et al. (2016) from Stations 7 and 23. Briefly, these sediment traps consisted of a large, vertically hanging 2 m diameter conical net with a cod end which were deployed at ~150 m depth, below the surface mixed layer. This net trap served to capture fresh sinking particulate material, and was deployed for 23 h at Station 7 and ~29 h at Station 23. From the trap, a total of 160 mL of seawater was filtered at Station 7, and between 210-220 mL at Station 23.
Genomic DNA was extracted from Sterivex filters using a chemical lysis method, as described in Zaikova et al. (2010). Briefly, filters were first thawed on ice and cells were lysed with lysozyme and then incubated with rotation at 37°C. Afterward, proteinase K, 10% SDS and RnaseA were added to the filters, with rotating incubation at 55°C. The lysate was then extracted with phenol: chloroform:isoamyl alcohol (IAA) (25:24:1), followed by chloroform: IAA (24:1). The subsequent aqueous layer was then concentrated with an Amicon Ultra (10 Kda, Millipore Sigma, MA, USA) filter cartridge in a final volume of 200 µL of TE buffer. The quality and size of the extracted genomic DNA was verified by gel electrophoresis on a 0.8% agarose run overnight at 16 V. DNA concentration was quantified using PicoGreen (Thermofisher) following the vendor’s protocol. As an additional step to validate the ability to build amplicon libraries, PCR was carried out using primers 515F-Y and 926R encompassing the bacterial and archaeal V4-V5 hypervariable region (Parada et al., 2015).
Total RNA was extracted from Sterivex filters, in duplicate, beginning with the extrusion of the RNAlater, followed by rinsing with Ringer’s solution (Sigma). Samples were then placed in a rotisserie, allowing rotating incubation to take place at 37°C for 20 min. Following a modified mirVana kit extraction protocol, which includes a phenol:chloroform:IAA (25:24:1) extraction, the rest of the manufacturer’s protocol was performed as described in Hawley et al. (2017). Samples were concentrated to a final volume of 150-400 µL by centrifugation. DNA was subsequently removed using the TURBO DNA-free kit and total RNA was purified using the Rneasy MiniELute Cleanup Kit. The quality of purified RNA was verified on the Bioanalyzer using an RNA nano Analysis Kit (Agilent Technologies) to validate RNA integrity and sample quantification before cDNA library production and sequencing (see below). For both genomic DNA and total RNA, those samples demonstrating amplification at the expected band size and also passing amplification quality control were stored at -80°C until sequencing could occur.
Environmental DNA and RNA Sequencing and Metabolic Pathway Prediction
Libraries for 16S rRNA gene amplicon, metagenomic and metatranscriptomic sequencing were constructed at the DOE Joint Genome Institute (JGI) (Berkeley, CA) and paired ends were sequenced on an Illumina Miseq (for 16S rRNA gene) and HiSeq (for the metagenomic and metatranscriptomic sequencing) platforms.
16S rRNA gene amplicon sequences were processed using JGI’s iTagger pipeline v2.0 (Tremblay et al., 2015) and annotated using the SILVA database (Pruesse et al., 2007). The metagenomic and metatranscriptomic datasets underwent quality control at JGI as described in Hawley et al. (2017), prior to assembly using Velvet. Metapathways v3.0, a modular open-source bioinformatics pipeline (Konwar et al., 2013) integrating automated gene finding and pathway prediction with Pathway Tools (Karp et al., 2002) and MetaCyc v21.5 (Caspi et al., 2013), was used for identification of open reading frames (ORFs), functional annotations and reconstruction of metabolic pathways present in both the metagenome and metatranscriptome datasets. Metapathways uses the Pathologic algorithm in Pathway Tools (Karp et al., 2002) to map functional annotations on the MetaCyc database of highly curated pathways and enzymes representing all domains of life (Caspi et al., 2013). MetaCyc emphasizes core microbial metabolism including biogeochemically relevant pathways. For both the metagenome and metatranscriptome datasets, we used metacount to create the unit of Reads Per Kilobase mapped per Million (RPKM), which takes into account gene length and total reads in a sample as a proxy for gene abundance (Konwar et al., 2015). In our analyses below we use both the MetaCyc assignments of individual pathways (hereafter base pathways) predicted in our metagenomic and metatranscriptomic datasets, and the grouping of these assignments into broader functional classes based on their biological functions and on the metabolites produced or consumed as denoted by the MetaCyc classification hierarchy (Caspi et al., 2013).
Statistical Analyses
Principal Component Analyses (PCA) was performed on the physical and chemical water column parameters, with the data scaled centered on the mean. Abundance values for 16S rRNA gene amplicon sequences were generated using the USEARCH I clustering algorithm, at the 97% identity level. 16S rRNA gene abundance values and pathway abundances in RPKM were Hellinger transformed prior to multivariate statistics (i.e., hierarchical cluster analysis, non-metric multi-dimensional scaling analysis (NMDS)), and correlation analyses to enhance inter-sample comparisons. Indicator Species Analysis (ISA) were performed on the raw, non-transformed datasets. We provide the raw, non-transformed data tables for all of the molecular data as Supplementary Data sets (16S rRNA gene sequence data: Supplementary Dataset 1, metagenomic RPKM table: Supplementary Dataset 2, metatranscriptomic RPM table: Supplementary Dataset 3). All analyses were conducted in R (version 1.1.456) using the vegan (Oksanen et al., 2019), factoextra (Kassambara & Mundt, 2017), indicspecies (De Caceres & Legendre, 2009), labsdv (Roberts, 2019), cooccur (Griffith et al., 2016) and ggplot2 (Wickham, 2016) packages.
For multivariate analyses (NMDS, PCA) analyses, samples from each station were pooled according to specific depth zones in the water column: “surface” (5 - 150 m) versus “deep” water (250 - 4000 m). Classifications are based on 0.1% of surface PAR, where PAR was generally equal to 0.1% of surface levels at 150 m. This division is sensible because besides light, oxygen and nutrient availability, which both exhibit strong photic zone patterms, are the strongest selectors for the structuring of microbial diversity down the water column (DeLong et al., 2006). Analyses beyond the multivariate ordinations were conducted using classifications at particular depths (surface (5 m), DCM, 250 m, 500 m, bottom (4000 m- 5000 m) and water mass (NADW & AAIW) for greater resolution into how potential and expressed pathways changed through the water column. Visual groupings observed in multivariate ordinations were assessed for significance using the vegan ANOSIM function, on Bray Curtis dissimilarity matrices for biological data and Euclidean matrices for water column parameters, at 999 permutations. To determine key pathways driving the observed NMDS ordination patterns, indicator species analysis was used to identify indicator metatranscriptomic pathways, which were defined as those that were unique and abundant at a particular station/depth, by having an indicator value > 85 and a p value < 0.05 (Dufrêne and Legendre, 1997).
The top 20 microorganisms (defined as those with raw counts of ≥ 27,500 summed across the entire dataset, or those representing 8% of the entire dataset) used in the heatmaps were aggregated at the order level. The MetaCyc v21.5 Level 2 functional classes of the top 20 metagenomic (defined as those with RPKM values ≥ 3,600 summed across the entire dataset) and top 20 metatranscriptomic (defined as those with RPKM values ≥ 29,000 summed across the entire dataset) pathways were used for both heatmaps and cluster heatmaps, as they provided a broad overview of both potential and expressed metabolic pathways involved at specific depths. We show that aggregating our pathways into the Level 2 classes illustrates consistent patterns as those found by examining individually the top 20 most abundant base pathways in both the metagenomic (Supplemental Figure 1A) and metatranscriptomic (Supplemental Figure 2A) datasets. We acknowledge that in the Metapathways approach, which works within the Pathways Tools framework (Karp et al., 2010), when an ortholog and its associated RPKM is identified as belonging to a particular pathway, then that pathway, including any variants which the ortholog also belongs to, is retained (Konwar et al., 2015). Given the high number of pathway variants associated with the TCA cycle, we show the distribution of each TCA variant in each sample for both the metagenomic (Supplementary Figure 1B) and metatranscriptomic datasets (Supplementary Figure 2B). To show the relationships between microbial orders, metagenomic and metatranscriptomic pathways in our heatmaps, these orders and pathways were respectively clustered using the “complete” algorithm. To identify specific pathways that changed at depth, and those associated with indicator microorganisms, heatmaps were constructed using individual (base) pathways as identified in MetaCyc v21.5.
Indicator organisms, which are microorganisms that are unique and abundant at a particular site (Dufrêne & Legendre, 1997) were defined herein as those OTUs associated with an indicator value > 95 and a p value < 0.05. Correlations between microbial indicators and metatranscriptomic pathways were computed using Spearman’s rho. Spearman’s rank correlation was used here because it does not require linear relationships between parameters. Both the x (metatranscriptomic pathways) and y axes (indicator microorganisms) of bubble plots demonstrating correlations between indicator organisms and select metatranscriptomic pathways, were also clustered using the “complete” algorithm to demonstrate their inter-relatedness. To validate the associations between indicator taxa and metatranscriptomic pathways, we explored taxonomic assignments provided by the least common ancestor algorithm in MetaPathways for ORFs resolved in the metatranscriptomic dataset (Konwar et al., 2015). Here, we identified each open reading frame (ORF) belonging to metatranscriptomic pathways having a positive correlation of 0.5 or greater with indicator taxa, limiting our analysis to those ORFs present at an abundance > 10 RPKM. We then searched these taxonomic assignments to see if any indicator taxa were identified as being associated with these ORFs. This process allowed us to link the metatranscriptomic pathways identified by the correlational analysis more directly to indicator taxa.
We also used co-occurrence networks based on a probabilistic model (Veech, 2013) to determine pairwise occurrence patterns between abundance of particulate metabolite AMP (adenosine monophosphate) and specific metatranscriptomic pathways related to respiration at Station 23, as the abundance of AMP was found to be elevated at this station (Johnson et al., in revision). Finally, the Mantel test was used to assess the correlation between the 16S rRNA gene, metagenomic and metatranscriptomic datasets, respectively, with water column and metabolite data, using Kendall’s tau. Kendall’s tau was selected because it is a non-parametric test based on ranked data and is known to be more statistically robust than the Spearman correlation (Croux and Dehon, 2010). All reported p values were computed using 999 permutations. To validate Mantel associations between 16S rRNA gene amplicon sequences and particulate metabolites, we ran a Spearman correlation between indicator microorganisms, defined above, and metabolite data. Since indicator organisms are defined as driving the differentiation in community structuring, specific associations between metabolites and indicator organisms can explain the overall influence metabolites may have on the total microbial community structure.
Results
Water Column Parameters Form Distinct Environments at Depth
Profiles of water column parameters (temperature, salinity, dissolved oxygen, macronutrients and select particulate metabolites (adenosine monophosphate (AMP), dimethylsulfoniopropionate (DMSP) and methylthioadenosine (MTA)) are shown in Figure 2A. We chose to highlight these metabolites because they were most strongly and significantly correlated (r ≥ 0.45, p <0.05) with the taxonomic dataset (Supplementary Table 2), out of the full suite of targeted metabolites (Johnson et al., in revision). Of note, the temperature and salinity at Station 15 was generally lower in comparison to Stations 7 and 23. However, at the surface of Station 23, the salinity was markedly lower than at any other point on the cruise track, likely influenced by input from the Amazon River plume (Johnson et al., in revision). Dissolved oxygen concentrations remained >85 µmol/kg throughout the water column and followed expected open water column profiles, being high at the surface, decreasing (from 250 µmol/kg to 150 µmol/kg) at 500 m depth, and increasing beyond ~1500 m to ≥ 250 µmol/kg. Concentrations of macronutrients and total organic carbon (TOC) also followed expected water column profiles. Macronutrients were low at the surface, and generally increased with depth. TOC concentrations were higher (70-90 μM) at the surface, and decreased with depth, with the lowest concentration being 45 μM, at Station 15 at 5000 m. Silicate concentrations were similar across all stations; however, lower concentrations (~40 μM) were observed below 500 m at Station 23, compared to stations 7 and 15 (> 100 μM). The concentrations of particulate metabolites (i.e., AMP, DMSP and MTA) were highest in the surface waters and generally decreased with depth. Concentrations of AMP and MTA were particularly high (45 pM and 1 pM, respectively) in the surface waters of Station 23, with both being most concentrated at the DCM of Station 15. In comparison, the highest concentration of DMSP (4000 pM) was observed in the surface waters of Station 7.
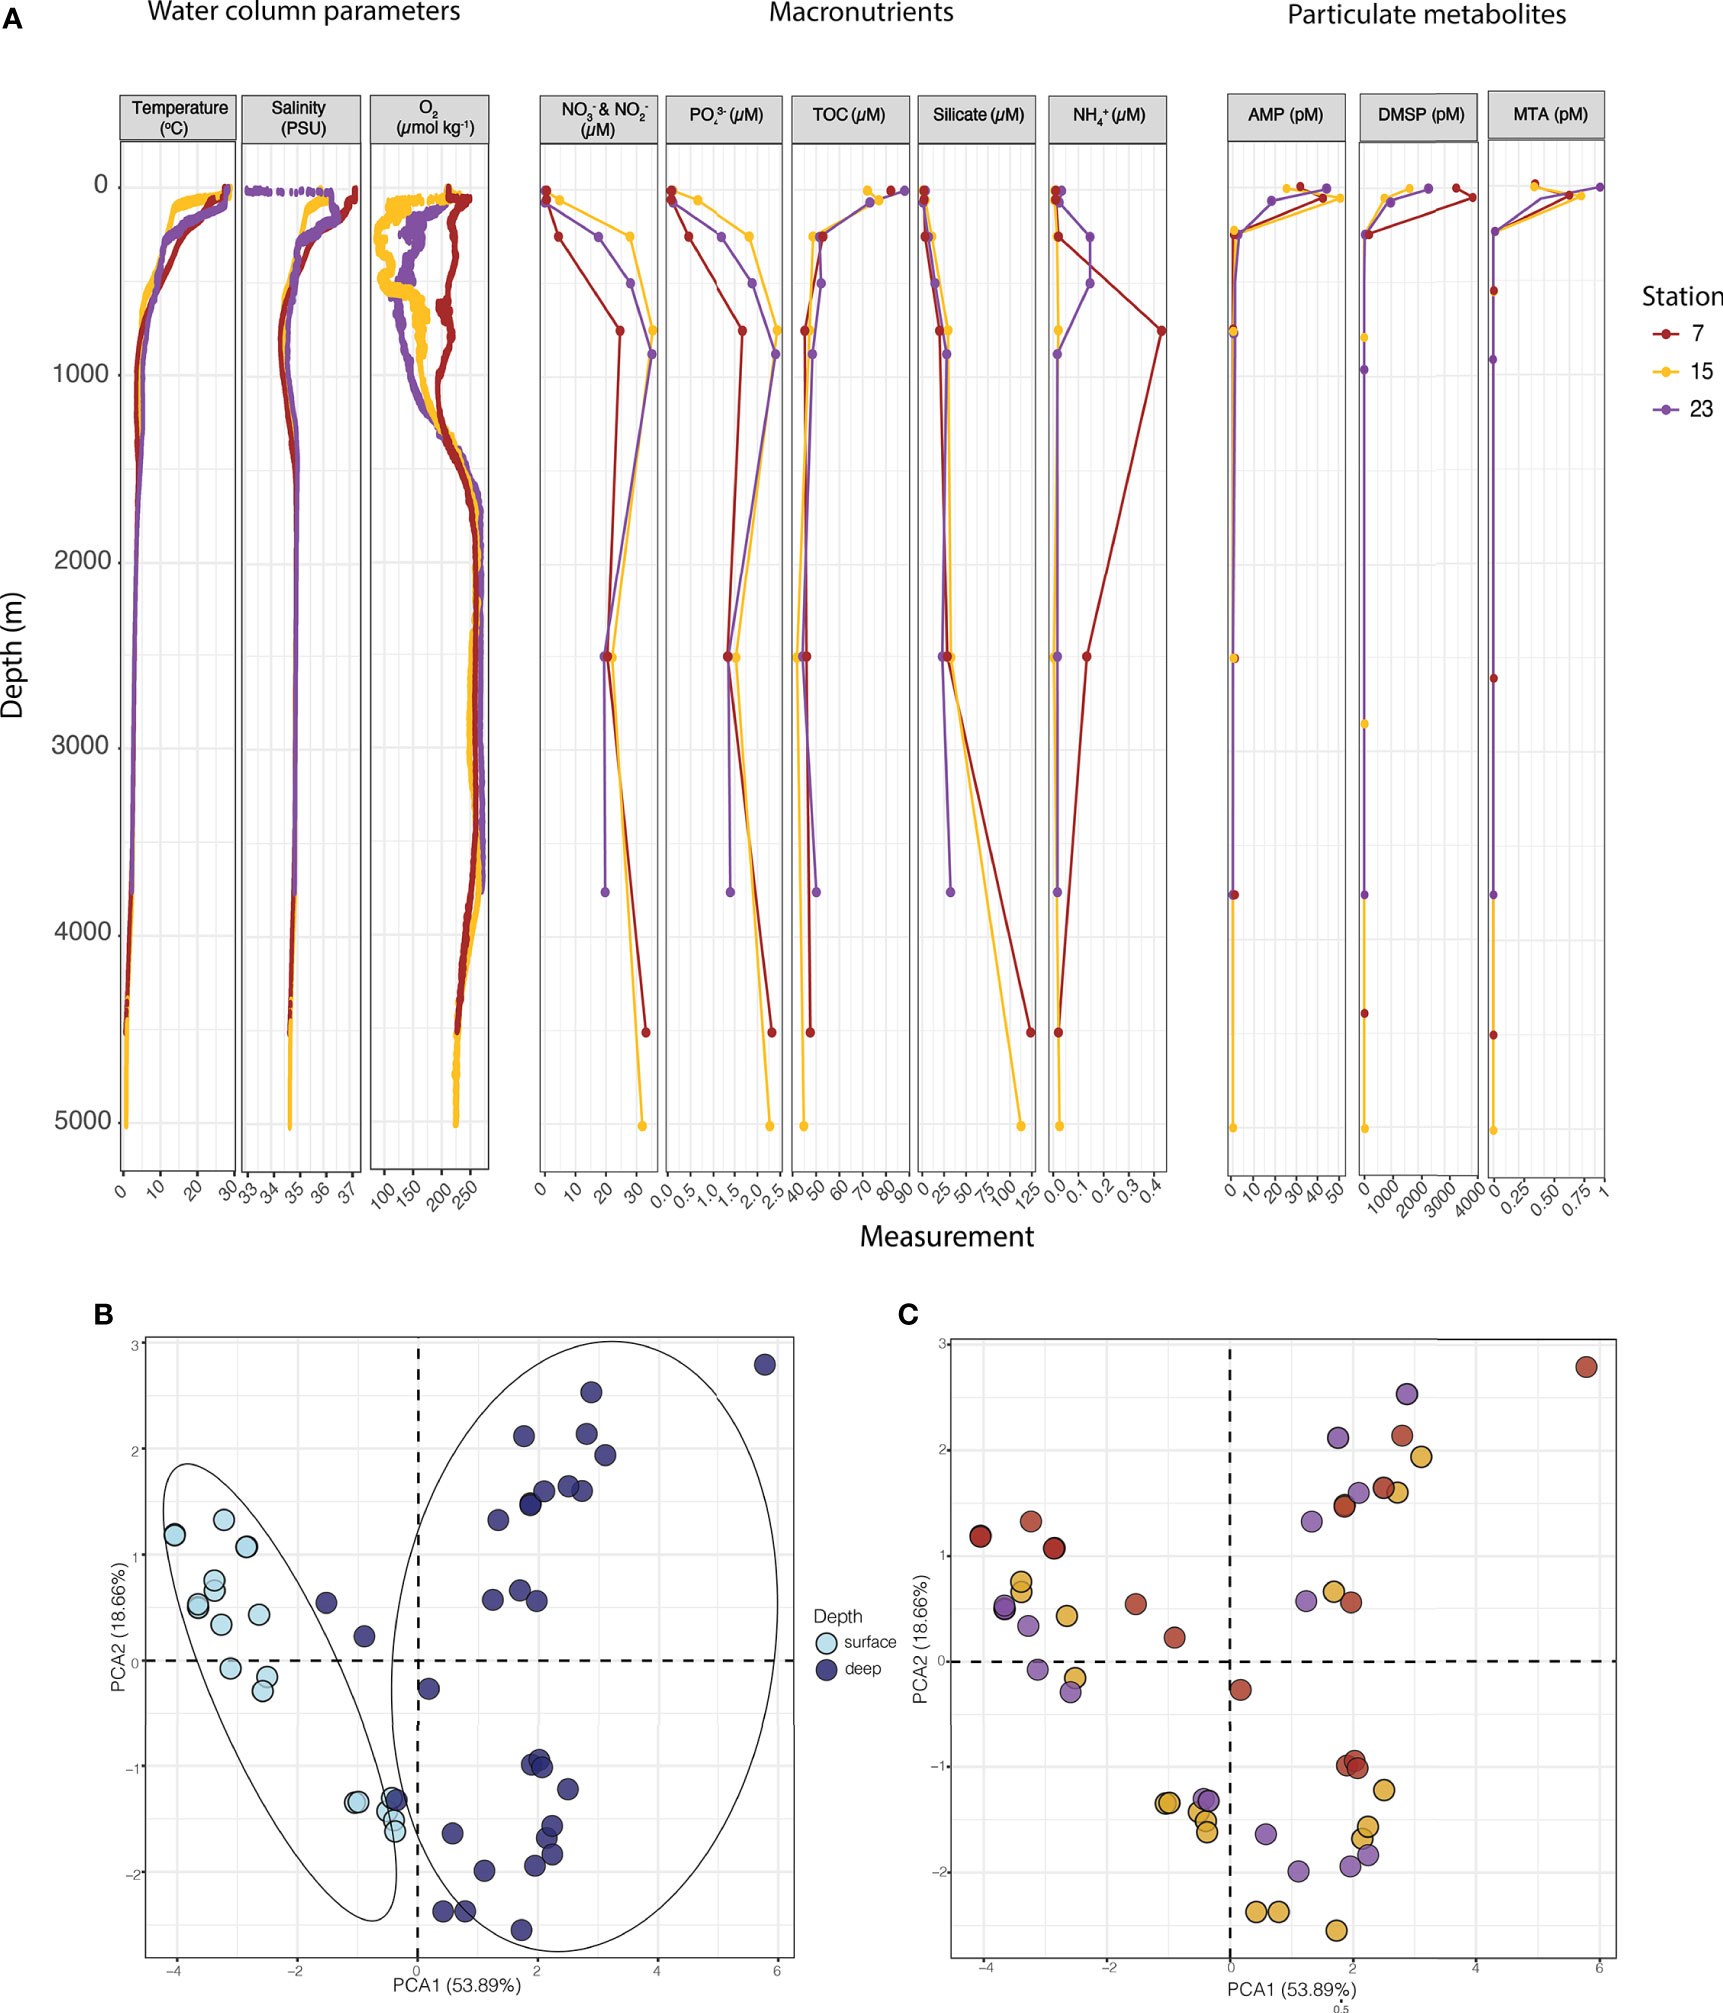
Figure 2 Water column parameters and ordination patterns across station and depth. (A) Water column profiles of physical and chemical measurements collected at Stations 7, 15 and 23. (B) PCA ordination of water column parameters and nutrient concentrations, shown in (A), coloured by depth. Significantly distinct environmental conditions pertain to surface (0-150 m) and deep zones (250-4000 m), shown encircled, based on an ANOSIM test (p < 0.05, R = 590). (C) the same PCA ordination as shown in (B), with samples coloured according to station (Stations 7, 15 and 23), show non-significant groupings (ANOSIM P = 0.092, R = 0.133). Data variance explained by each PCA axis is shown in parentheses.
A PCA ordination of all the physical parameters and chemical concentrations (Figure 2A) revealed that the water column delineated into two significantly distinct environments (ANOSIM, p < 0.05, R = 0.590) separating into the “surface” (5-150 m) and “deep” (250-4000 m) zones (Figure 2B). Hereafter, we use these surface and deep zones as well as finer scale separation down the water column defining different water masses/types (i.e., surface, DCM, 250 m, the oxygen minimum layer, the AAIW layer, the NADW layer, and the bottom waters) to describe our results. No spatial differentiation between the three stations (7, 15, and 23) was observed in this analysis (ANOSIM, P=0.100, R= 0.0966; Figure 2C). Thus, based on this limited spatial resolution, it appears that our resolved physical parameters and chemical concentrations did not form distinct environmental conditions across latitude.
Microbial Communities, Metagenomic Pathways and Metatranscriptomic Pathways Segregate According to Depth
Microbial communities separated according to water column depth (surface and deep zones, as well as finer scale depth separation), forming significantly distinct ANOSIM, p < 0.05, R=0.810 communities across a wide range of oceanic geography, spanning all 23 stations of the cruise track (Figure 3). A stacked bar plot showing the relative abundance of all phyla across depth and station in Supplementary Figure 9. For the three stations (7, 15, and 23) where taxonomic, metagenomic and metatranscriptomic data were concurrently collected, the metagenomic (potential) pathways significantly separated ANOSIM, p < 0.05, R= 0.790 down the water column (Figure 4A), and significantly distinct metatranscriptomic (expressed) pathways (ANOSIM, p < 0.05, R=440) were also observed (Figure 4B) to be associated with the surface (0-150 m) and deeper zones (250-4000 m) of the water column.
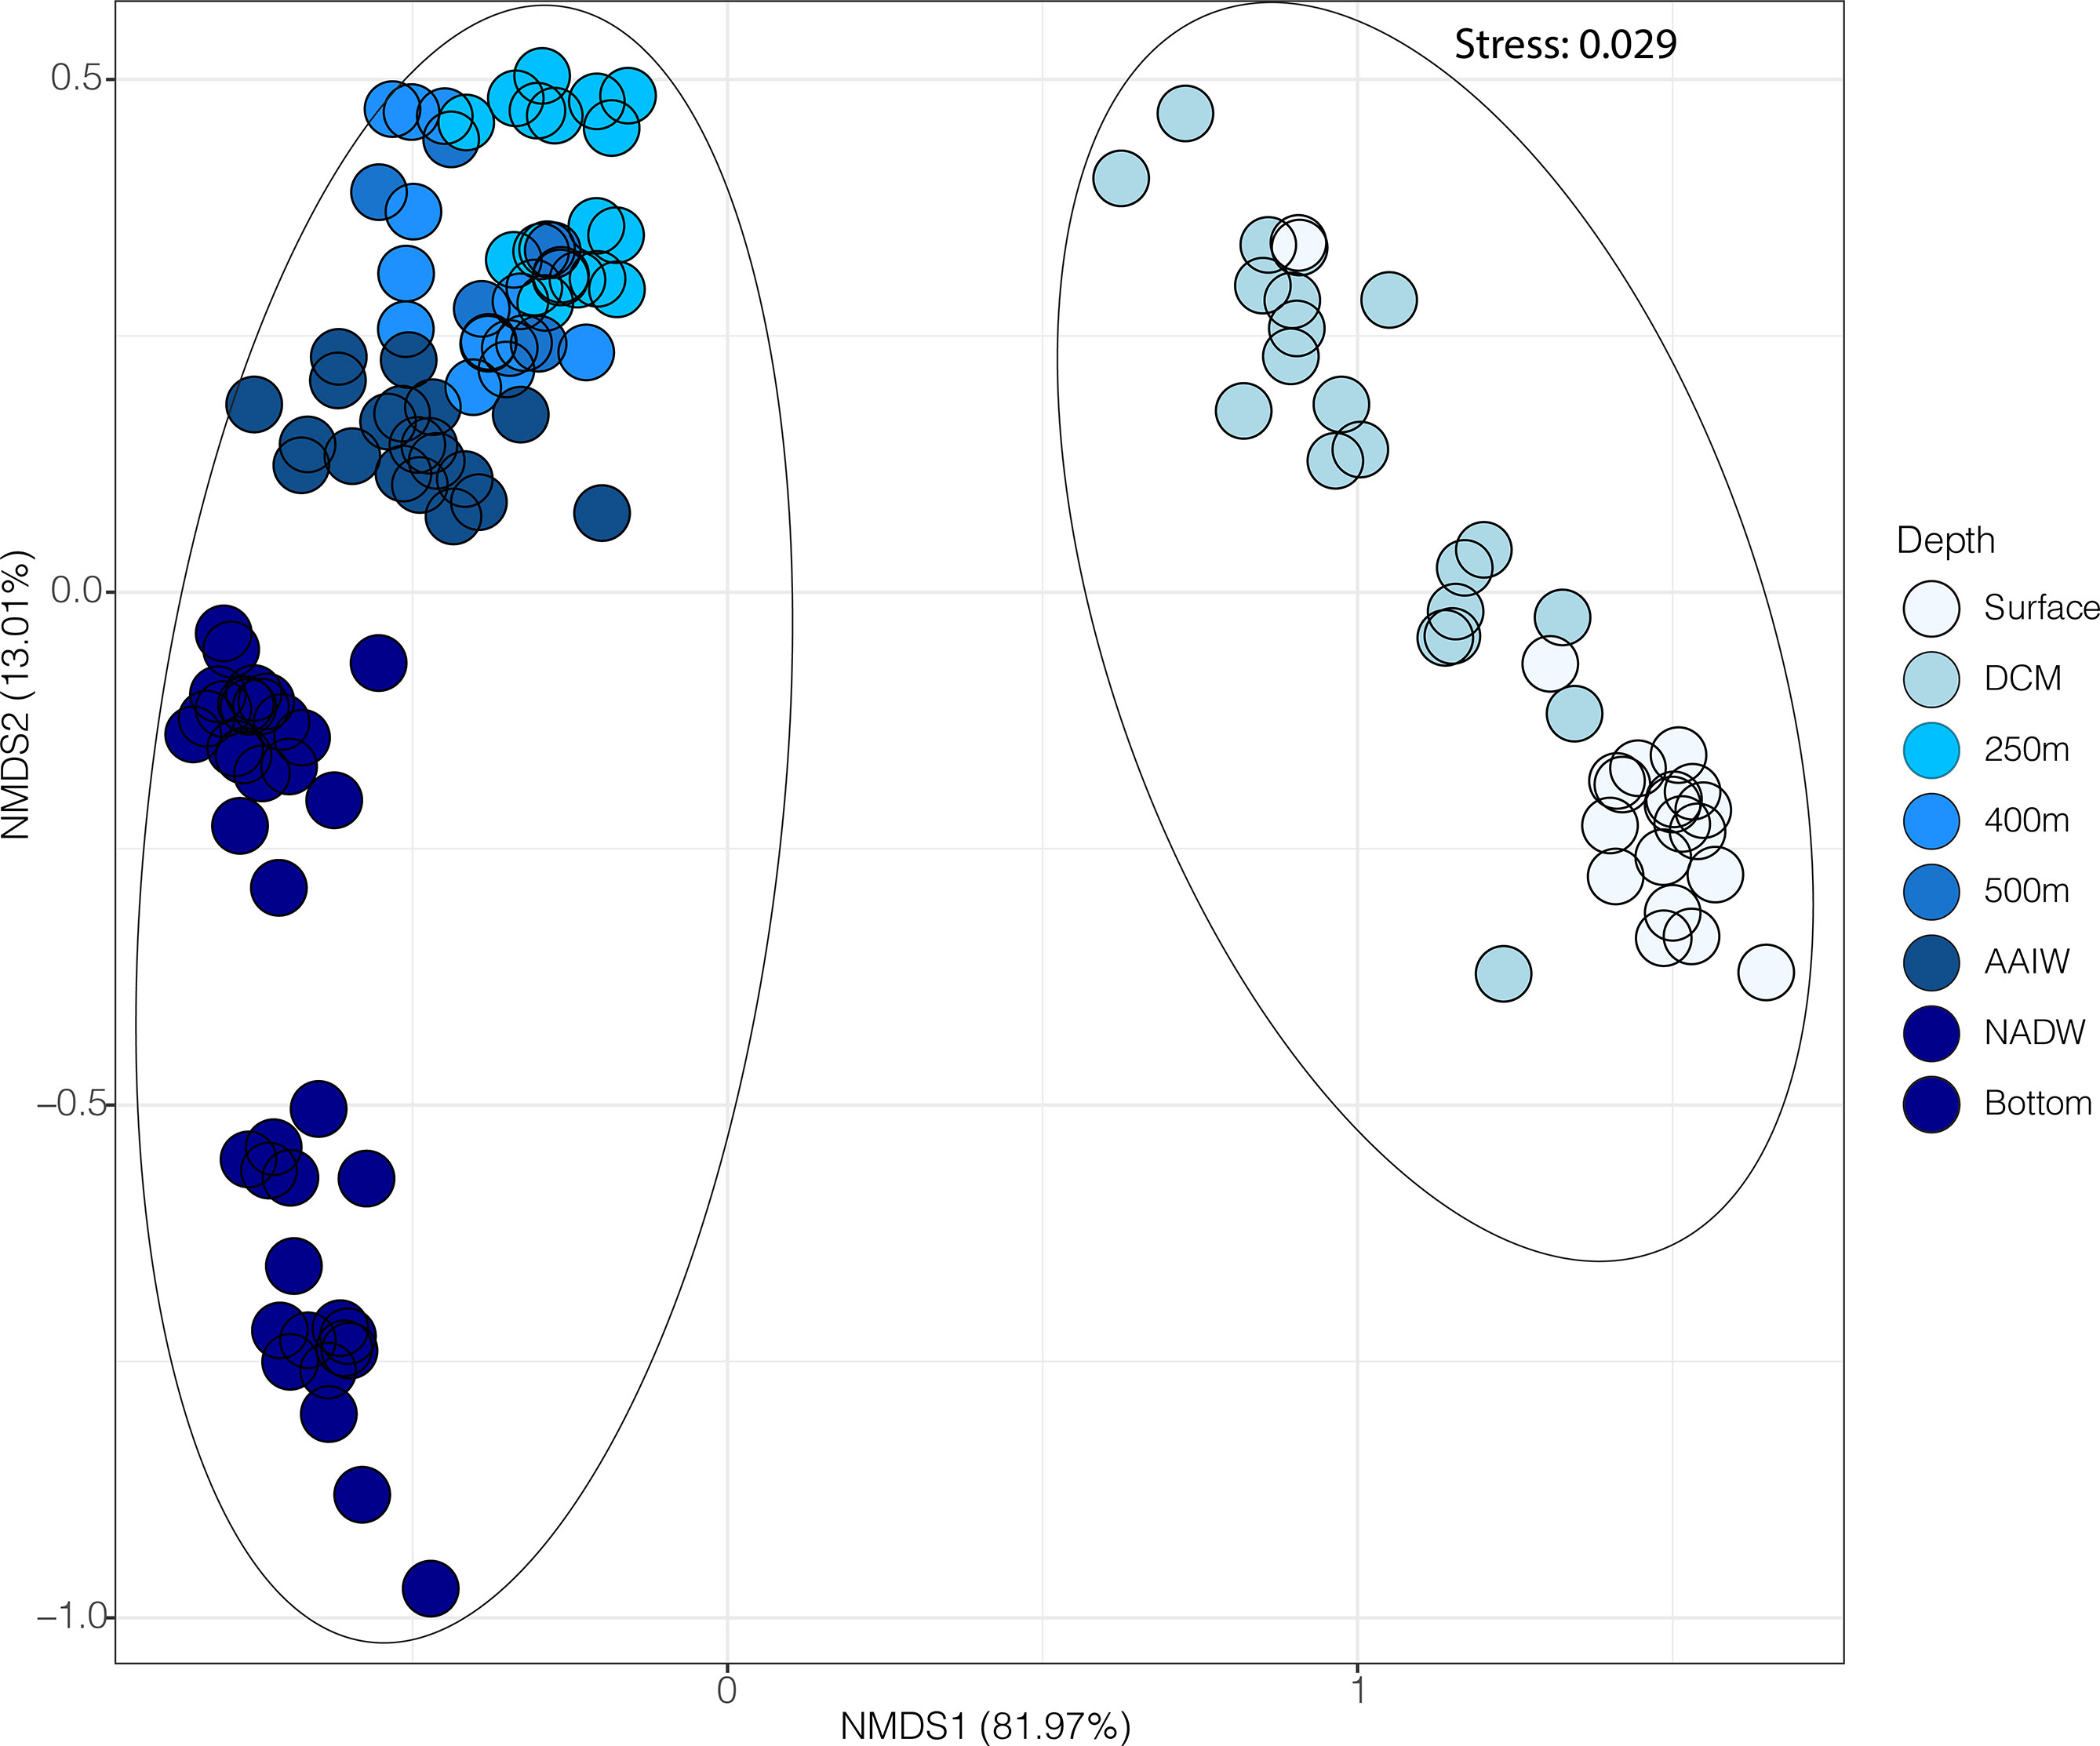
Figure 3 Microbial distribution patterns according to surface (5-150 m) and deep (250-4000 m) across all 23 stations sampled along the full cruise track. NMDS ordinations are based on OTUs resolved from 16S rRNA gene amplicon data, where colour indicates depth sampled, with circled areas reflecting significant ANOSIM results p<0.05, R=0.810, showing distinct microbial communities occurring between two major oceanic depth zones: surface (0-150 m) and deep (250 - 4000 m) waters. The amount of variation explained by each of the NMDS axes are shown in parentheses.
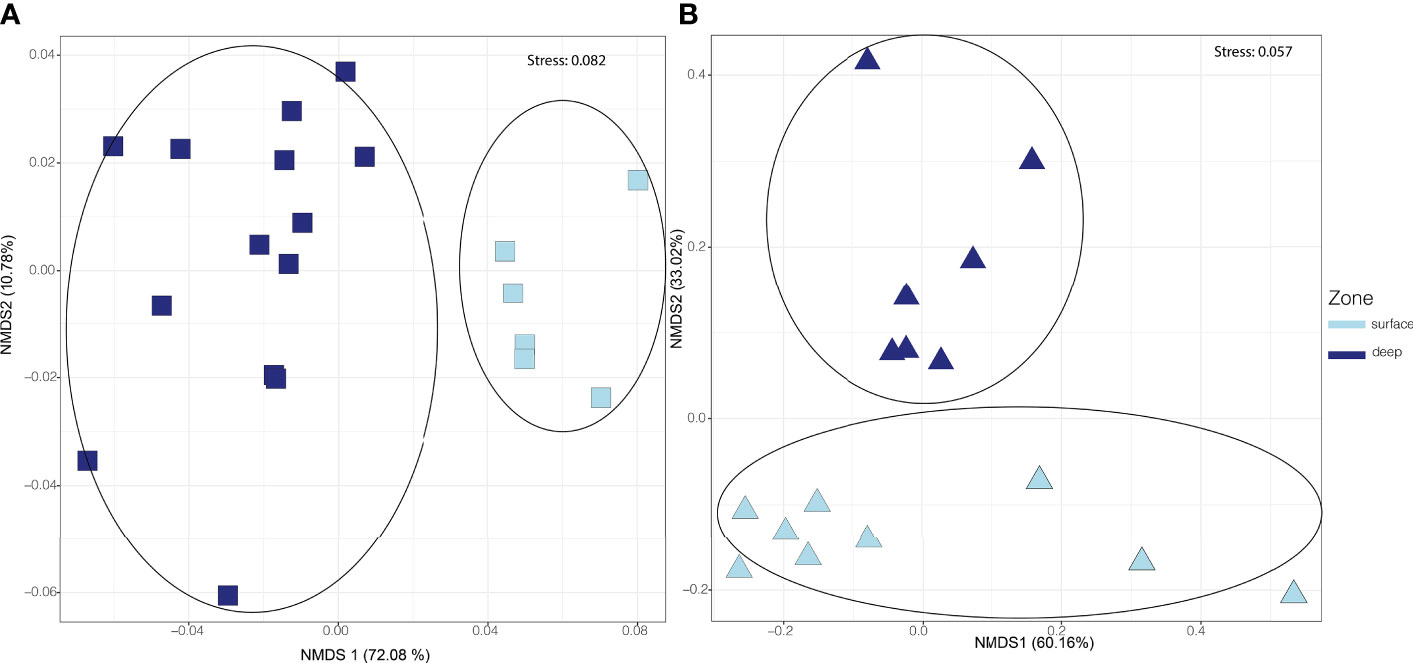
Figure 4 Distribution of microbial potential and expressed pathways in the surface waters (0-150 m) versus deep waters (250-4000 m). NMDS ordinations are based on RPKM abundances of metagenomic pathways and metatranscriptomic pathways. In all panels, depth “zone” is indicated by colour, and shape represents dataset type (metagenomic pathways in squares & metatranscriptomic pathways in triangles). (A) NMDS ordination of metagenomic pathway abundances, with a significant distribution of metagenomic pathways according to depth (ANOSIM, p< 0.05, R=0.79). More depths were sampled for metagenomic data than for metatranscriptomic data, thus resulting in more data points shown here. (B) NMDS ordination of metatranscriptomic pathway abundances showing significantly distinct metatranscriptomic pathway groupings according to an ANOSIM test (p < 0.05, R=0.44), demonstrated by the encircled areas.
The total number of pathways recovered for the metagenomic dataset was 881 versus the 724 pathways resolved for the metatranscriptomic dataset (Supplementary Table 3). The metagenomic and metatranscriptomic surface samples both generally contained the largest number of pathways as well as the highest percentage of unique pathways. However, a large proportion (87%) of the metagenomic pathways were shared amongst the two zones (surface and deep) whereas a slightly smaller, but still large, fraction (79%) of overall metatranscriptomic pathways were shared between these regions. Indicator analysis revealed that the metatranscriptomic pathways responsible for the observed differentiation between the surface and deep ocean were those related to photosynthetic processes (i.e., seleno-amino acid synthesis & the Calvin-Benson-Bassham cycle, Figure 5) in the surface ocean, and recalcitrant carbon cycling (i.e., ethylbenzene degradation, Figure 5) in deeper waters.
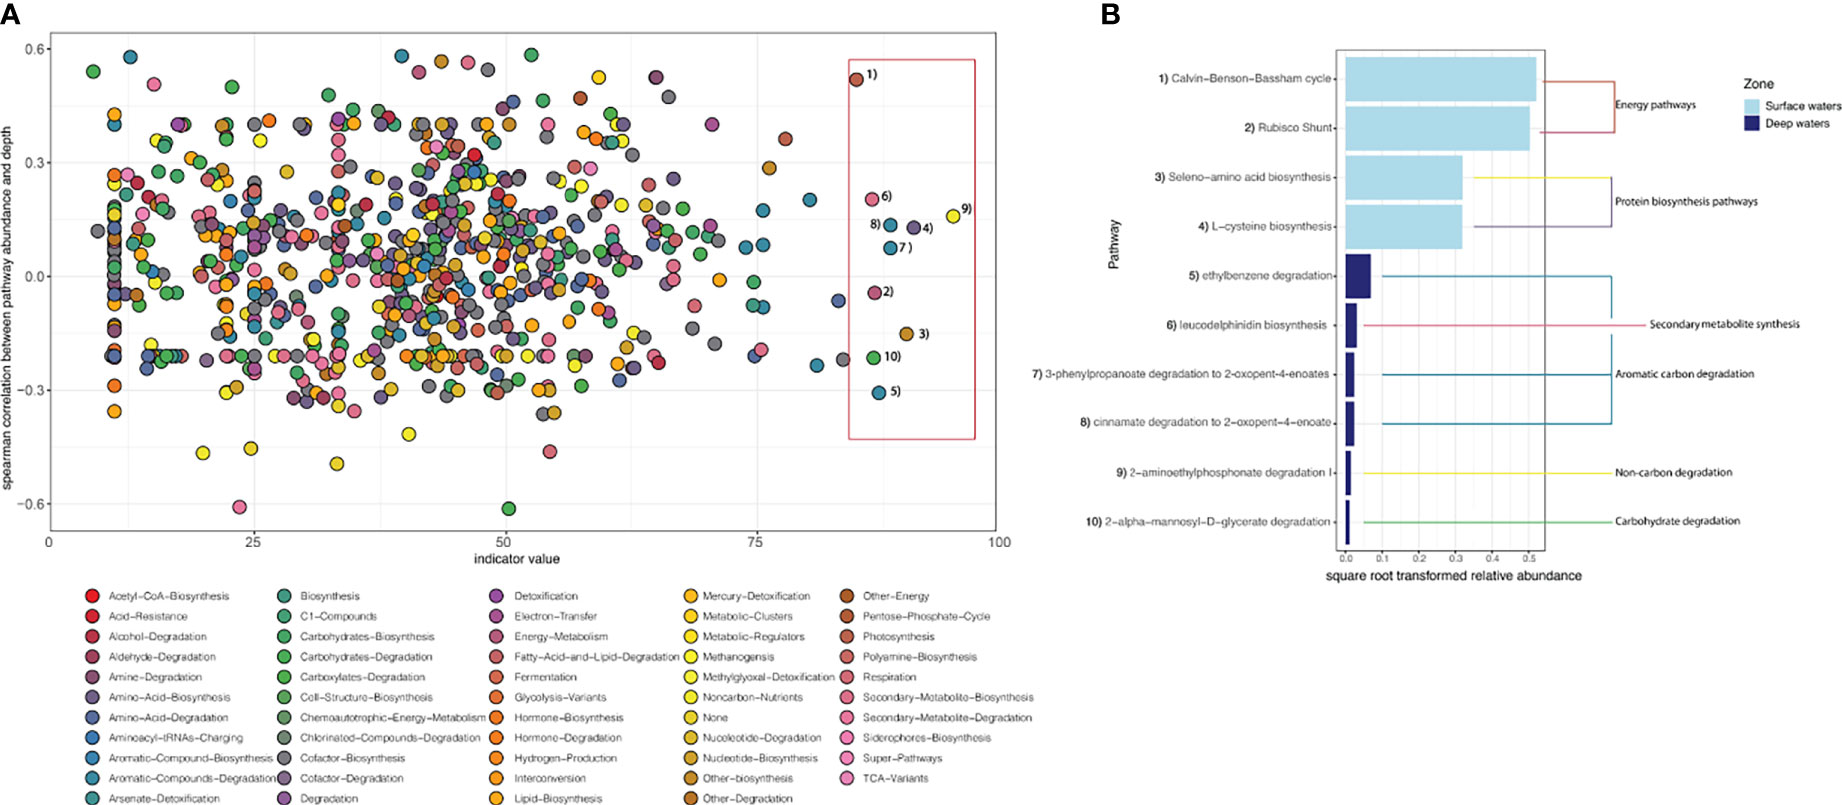
Figure 5 Indicator metatranscriptomic pathways for surface and deep zones. (A) scatterplot of the Spearman correlation coefficient for metatranscriptomic pathways and depth zones vs indicator value, coloured by metabolic pathway type, shown at the bottom of the figure. Dots labelled with numbers and outlined by the pink rectangle are those that have a significant (p <0.05) indicator value of > 85 and correspond with the indicator metatranscriptomic pathways shown in (B), demonstrating each pathway’s relative abundance and whether they are indicators for the surface or deep ocean. Relative abundance was square root transformed to aid visualization. The broader functional MetaCyc classes to which each pathway belongs are shown by the coloured lines.
The most abundant taxonomic orders (i.e., representing the top 20 microorganisms), resolved by 16S rRNA gene amplicon sequencing, varied according to major depth zones/water mass down the water column (Figure 6A). Cyanobacteria (comprising ~ 40% of all orders found in the photic zone) and SAR11 (comprising ~ 25% of all orders found in the photic zone), were the most prevalent groups in the surface and DCM regions of the ocean. Members of SAR324, comprising ~ 8% of all orders found at depths below the DCM, and Marinimicrobia, a microbial dark matter phylum formerly known as Marine Group A and SAR406 (Allers et al., 2013; Wright et al., 2014; Hawley et al., 2017), comprising~12% of all phyla found at depths below ~ 150 m, were more prevalent immediately below the DCM and in the deeper ocean. Thaumarchaeota Marine group 1 (Swan et al., 2014) were most prevalent in the AAIW, and Alteromonadales was predominant in the bottom waters of the western Atlantic Ocean (Figure 6A).
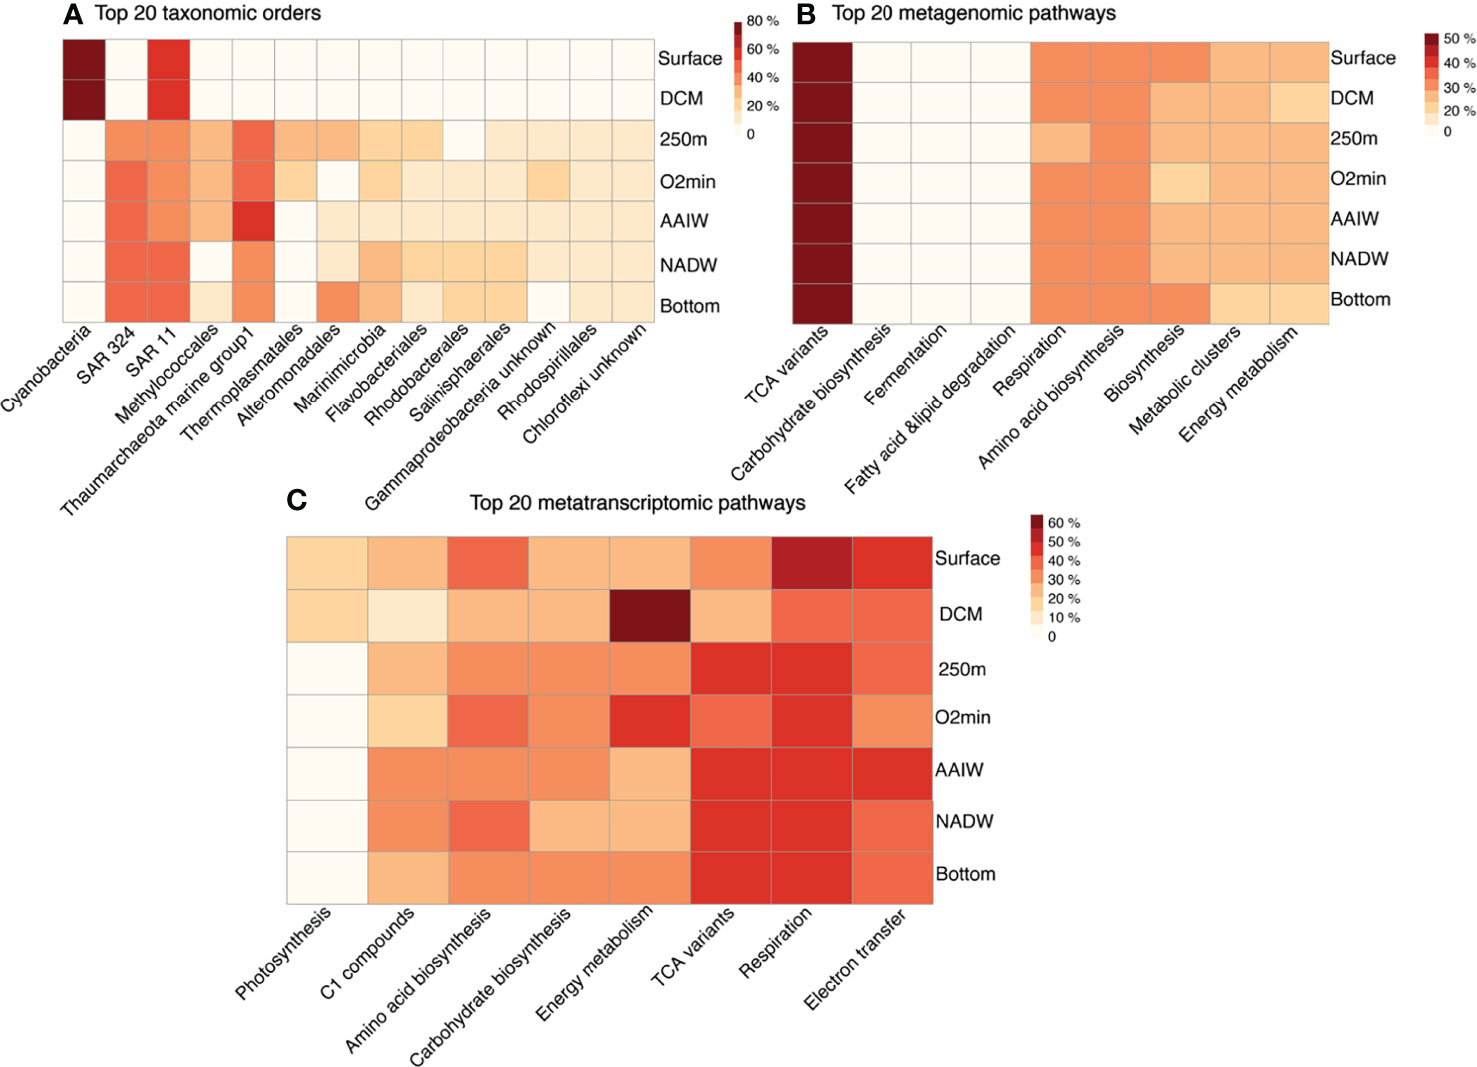
Figure 6 Heatmaps of the top 20 microorganisms, metagenomic, and metatranscriptomic pathways, where darker red colours depict a stronger presence and lighter yellow colours depict a lesser presence at a particular depth. Heatmap depicting abundance of (A) top 20 microorganisms, resolved at the order level and top 20 pathways (resolved to broader functional classes) for (B) metagenomic and (C) metatranscriptomic data in the surface (~5 m), DCM (Deep chlorophyll maximum ~75 m), 250 m, oxygen minimum zone (~500 m), AAIW (Antarctic intermediate water ~750 m), NADW (North Atlantic deep water~2500 m) and bottom (~4000 m) waters.
The most abundant metagenomic pathways corresponded to specific core functional processes related to cellular housekeeping (i.e., biosynthesis including nucleic acid production and amino acid production (i.e., arginine & methionine synthesis), and cellular metabolism (i.e., tRNA charging, TCA cycle pathways, biosynthesis) and remained highly abundant throughout the water column (Figure 6B and Supplementary Figure 1).
The majority of the top 20 metatranscriptomic pathways were also generally present in low proportion (< 50%) at all depths; and also exhibited differential expression across the water column (Figure 6C). Pathways related to photosynthesis and electron transfer (Figure 6C and Supplementary Figure 2), were found to be most prevalent (> 50%) in the surface, DCM, and surface/AAIW respectively. Specifically, amino acid synthesis and pathways related to energy metabolism involving NAD/NADH phosphorylation and dephosphorylation processes were prevalent in the surface ocean (Figure 6C and Supplementary Figure 2). Degradation pathways, such as degradation of C1 compounds (i.e., methanol oxidation) and pathways related to the TCA cycle dominated in the bottom regions (AAIW, NADW, bottom) of the water column (Figure 6C and Supplementary Figure 2).
Correlation Between Indicator Taxa and Pathways
To determine the relationships between metatranscriptomic pathways and the microbial taxa found at depth, we calculated Spearman correlations between taxonomic indicator OTUs in specific compartments of the water column and all metatranscriptomic pathways. We resolved the differences in microbial community expression at particular depths (surface, DCM, 250 m, oxygen minimum zone, & bottom waters) and between water masses (i.e., the AAIW and NADW). Top microbial indicator OTUs (i.e., those having been assigned a significant indicator value ≥ 95) were associated with the DCM, NADW and bottom waters (Figure 7 and Supplementary Figure 3).
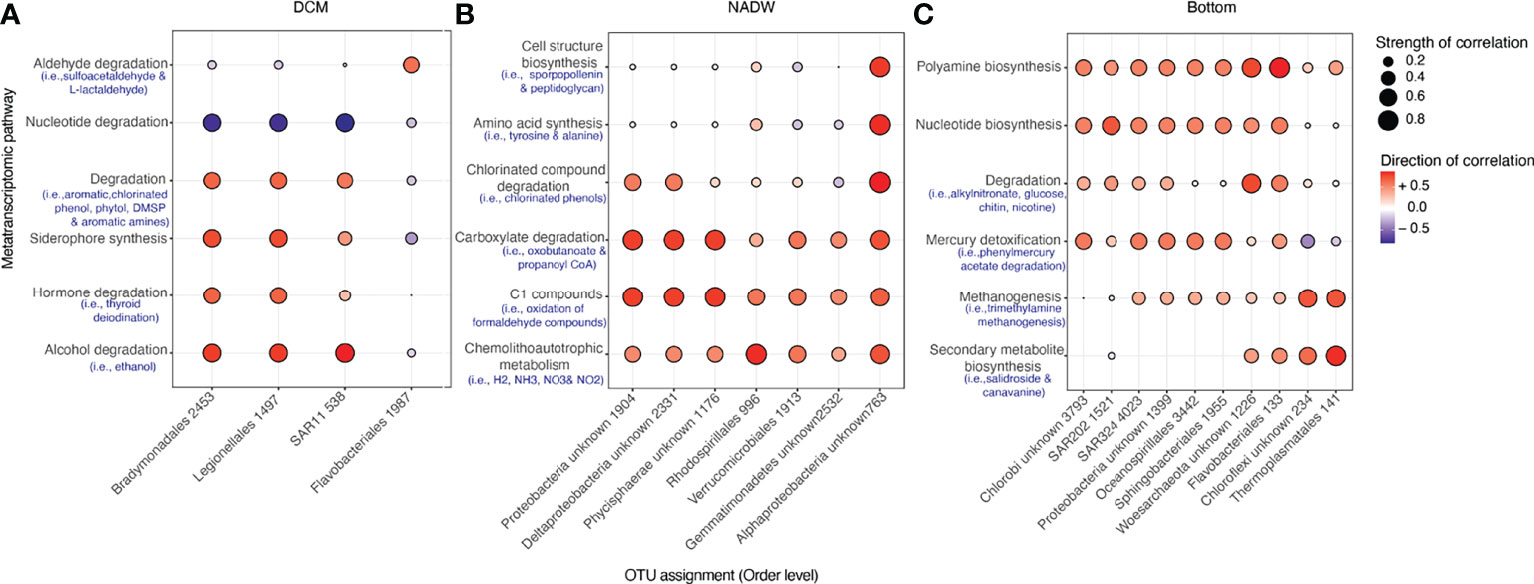
Figure 7 Bubble plots delineating relationships between indicator microorganisms (IV > 95) and select metatranscriptomic pathways in the (A) DCM, (B) NADW, and (C) Bottom waters, where a darker red colour depicts a stronger positive correlation and lighter blue colours depict a stronger negative correlation between an indicator organism and a particular pathway class, and the size of the bubble depicts strength of this correlation. Blue text beneath broader functional MetaCyc groupings highlight examples of specific pathways belonging to these pathway classes. All indicators are labelled according to their Order taxonomic designation along with their unique OTU ID. A cluster diagram depicting the relationships between indicator microorganisms and all metatranscriptomic pathways is shown in Supplementary Figure 3.
Indicators for the DCM included microorganisms related to Flavobacteriales, SAR11, Bradymonadales and Legionalles orders (Figure 7A), where Flavobacteriales was most strongly and positively correlated with pathways relating to aldehyde degradation, specifically with pathways related to sulfoacetaldehyde catabolism (Spearman correlation > 0.8) and was negatively correlated with both carboxylate and carbohydrate degradation (Supplementary Figure 3A). Within the DCM, SAR11, Bradymonadales and Legionalles were most positively correlated with siderophore synthesis, alcohol degradation, hormone and aromatic compound degradation, and most negatively correlated with amino acid and nucleotide degradation (Figure 7A). Specific pathways positively correlating with Bradymonadales and Legionalles included ethanol, chlorinated phenol compounds and aromatic amine degradation. SAR11 was positively correlated with similar degradation pathways, in addition to those associated with degrading phytoplankton-related by-products such as DMSP and phytol (Figure 7A). We note that Cyanobacteria are also key members of both the DCM and surface waters and are indicators for these zones at an indicator value of 90, but are not shown on Figure 7, which is limited to a higher IV value (IV > 95) to aid data visualization.
Indicators for the NADW included members related to phylum Proteobacteria & Phycisphaerae, along with orders belonging to Rhodospirillales and Verrucomicrobiales (Figure 7B). Pathways most strongly correlated with these microorganisms included those related to C1 compounds (most notably, the oxidation of formaldehyde compounds), chlorinated compound degradation and chemoautotrophic energy metabolisms (specifically pathways relating to hydrogen, ammonia, nitrate and nitrite oxidation), and carboxylate degradation (Figure 7B). Alphaproteobacterial indicators were most positively correlated with pathways related to amino acid biosynthesis (especially tyrosine and alanine production), and cell structure biosynthesis, particularly with regards to sporopollenin and peptidoglycan production (Figure 7B and Supplementary Figure 3B).
Taxonomic indicators for the bottom waters of the western Atlantic Ocean were related to members of SAR324, SAR202, Flavobacteriales, Oceanospirillales, Sphingobacteriales, and to phyla Chloroflexi and Proteobacteria, along with Archaea related to Thermoplasmatales and phylum Woesarchaeota (Figure 7C). Amongst these, organisms related to Chlorobi, Sphingobacteriales, SAR324, Oceanospirillales and Proteobacteria shared similar correlations to various pathways, such as a strong positive correlation to pathways related to mercury detoxification, nucleotide, and polyamine biosynthesis and general degradation pathways related to akylnitronate, glucose, chitin and nicotine break down (Figure 7C). These microorganisms also had a strong negative correlation with pathways involved in fatty acid & lipid degradation, such as with oleolate oxidation and triacylglycerol degradation (Supplementary Figure 3C). Other notable pathway relationships with bottom water indicator organisms included the strong positive correlation between Thermoplasmatales and secondary metabolite biosynthesis, such as salidroside and canavanine biosynthesis (Figure 7C). The indicator related to phylum Chloroflexi was also found to strongly and positively correlate with similar pathways that also correlated with Thermoplasmatales, for example, secondary metabolite biosynthesis and methanogenesis using trimethylamine substrates (Figure 7C).
Strong positive associations (Spearman correlation > 0.5) between indicator taxa and metatranscriptomic pathways were further verified by determining the taxa assigned using the Metapathways least common ancestor algorithm with the functional ORFs resolved in the predicted metatranscriptomic pathways (Supplementary Table 4). In most instances, we were only able to resolve microbial taxonomy for abundant groups from the metatranscriptomic dataset for a particular water column compartment (i.e., SAR11 in the DCM; Rhodospirillales in the NADW and Gammaproteobacteria in bottom waters). However, these microbial taxa mirrored some of the associations observed in our correlational analysis. For example, in the DCM, a functionally annotated ORF coding for an aldehyde dehydrogenase (Supplementary Table 4) was determined to be taxonomically related to SAR11. Given that the DCM indicator SAR11 positively correlated with alcohol degradation (Figure 7A), the aldehyde dehydrogenase, an ORF resolved from this pathway, may be a component of its alcohol degradation capabilities. Thus, this analysis was useful in corroborating the relationship determined using our correlational approach. Similarly, in the NADW, a functionally annotated ORF coding for methanol dehydrogenase subunit 1 (Supplementary Table 4), which is a component of C1 compound (methanol) degradation, was associated with Rhodospirillales sp. and Alphaproteobacteria (Figure 7B). In our correlational analysis, C1 compound metabolism was a pathway class with which both Alphaproteobacterial and Rhodospirillales indicators positively correlated (Figure 7B). Lastly, in the bottom waters, an ORF encoding a nucleoside diphosphate kinase (Supplementary Table 4), was found to be associated with Gammaproteobacteria, and thus may validate the correlation between the indicator Gammaproteobacteria Oceanospirillales with nucleotide biosynthesis (Figure 7C). Taken together, metatranscriptomic pathway analysis with associated indicator taxa reinforce the utility of using a pathway-centric approach for identifying potential key biogeochemical processes driving matter transformation within specific water column compartments and geographies.
Metatranscriptomic Pathways May Segregate According to Latitude
We used a Venn diagram to visually assess the distribution of metabolic pathways by latitude (Figure 8A). In total, 62% of metatranscriptomic pathways were shared across all three stations, while Station 7 contained the highest number of pathways (802) and Station 23 the lowest (595) (Supplementary Table 5). Station 7 also contained the most unique pathways (11%) compared to Station 15 (3.8%) and Station 23 (1.9%), respectively (Figure 8A). In contrast to the metatranscriptome, the abundance of metagenomic pathways was relatively consistent between stations. There was an average number of 896 pathways present and 80% of the pathways were shared across all three stations (Supplementary Table 5). Normalizing the RPKM values, by dividing total RPKM counts with the overall number of resolved pathways, reveals the same trend as the unnormalized datasets (Supplementary Table 5).
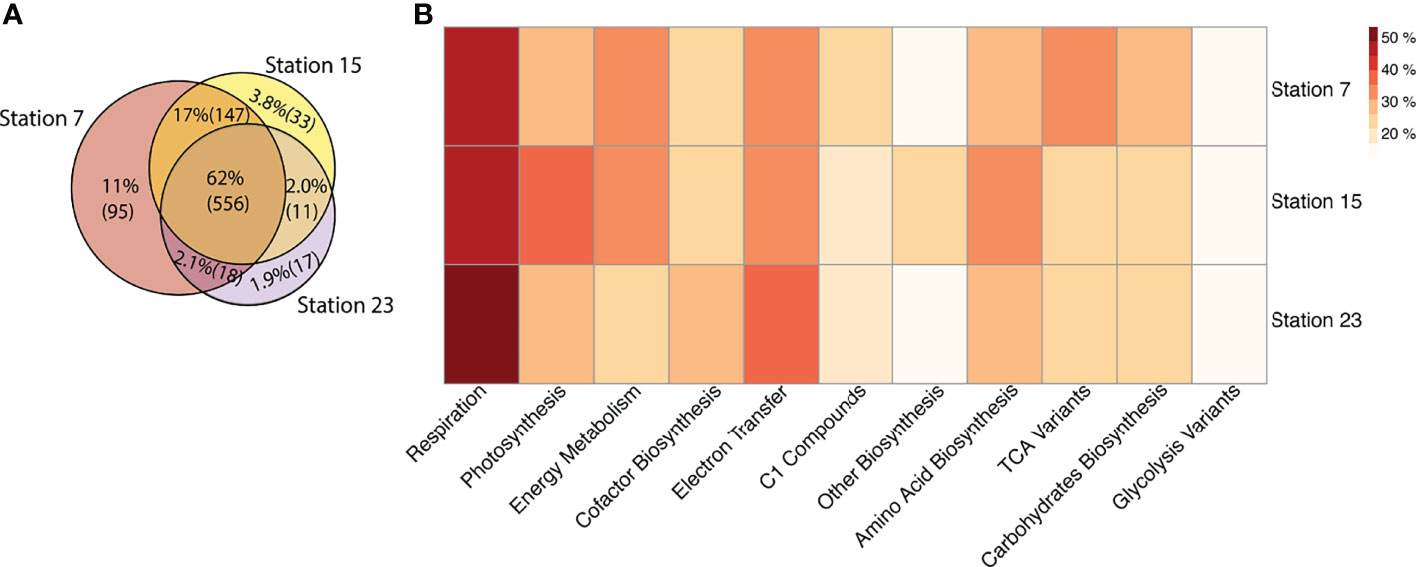
Figure 8 Metatranscriptomic pathway distribution patterns at Stations 7, 15, and 23 along the cruise transect. (A) Venn diagram, demonstrating percent (and number) of metatranscriptomic pathways shared amongst the stations. (B) Heatmap of the broader functional classes to which the top 20 metatranscriptomic pathways belong to, with darker red colours depicting a stronger presence, and lighter yellow colours depicting a weaker presence of a pathway at a particular station.
The top 20 base metatranscriptomic pathways (MetaCyc assignments of individual pathways) appeared to be differentially expressed across all three stations though all pathways occurred in low proportion (< 50%, Figure 8B). Station 23 appeared to contain greater expression of pathways related to respiration (particularly aerobic respiration, (Supplementary Figures 4, 5), some of which were unique pathways not observed at the other stations, such as pathways related to oxidative stress (i.e., ectoine synthesis and thioredoxin biosynthesis). Station 15 contained 6% more pathways related to photosynthesis compared to Stations 7 and 23. Station 15 also contained 8.5% more biosynthesis pathways (including specifically amino acid biosynthesis, for example, cysteine and seleno amino acid biosynthesis), compared to other stations, whereas Station 7 contained a greater number (8% more) of pathways related to the TCA cycle (specifically, TCA cycle via the oxoglutarate ferrodoxin oxidation pathway), and energy metabolism (i.e., the methylaspartate cycle, Figure 8B and Supplementary Figure 5).
Environmental Relationships and Drivers of Microbial Community, Metagenomic and Metatranscriptomic Composition
To evaluate possible drivers of microbial community and metabolic pathway composition, we conducted Mantel tests between our physical, chemical, and metabolite (dissolved and particulate) measurements with each of the high throughput sequencing datasets (16S rRNA gene amplicon, metagenomic and metatranscriptomic data). This analysis revealed that microbial community taxonomic structure is strongly and significantly (r >0.5, p <0.05) influenced by physical water column properties like temperature, density (i.e., related to water mass) and concentrations of TOC and major nutrients (, TN, and ) (Figure 9). Taxonomic structure was also strongly and significantly influenced by concentrations of particulate (combined 0.7 µm + 0.2 µm filter membranes) metabolites such as adenosine monophosphate (AMP), dimethylsulfoniopropionate (DMSP) as well as methylthioadenosine (MTA) (Figure 9). In contrast, the structure of pathways resolved in the metagenome were not strongly and/or significantly influenced by any of the metabolite parameters and many of the environmental parameters (excepting , and TN), except for (Figure 9). Metatranscriptomic pathway structure, however, was significantly driven by the same metabolites driving microbial taxonomic structure, although not as strongly (0.2 ≤ r ≤ 0.5, Figure 9). In terms of other oceanographic properties, expressed pathways were weakly, but significantly (r < 0.25, p <0.05) influenced by temperature and nutrient concentrations (Figure 9). Both metatranscriptomic pathways and taxonomic community structure were also significantly influenced, albeit weakly (r ≤ 0.40), by other particulate metabolites, including certain amino acids (phenylalanine, tryptophan, glutamic acid), and nucleosides (adenosine and guanine, Supplementary Table 2). However, none of the high throughput sequencing datasets were significantly impacted by any of the dissolved (<0.2 µm filtrate) metabolites measured (Supplementary Table 2).
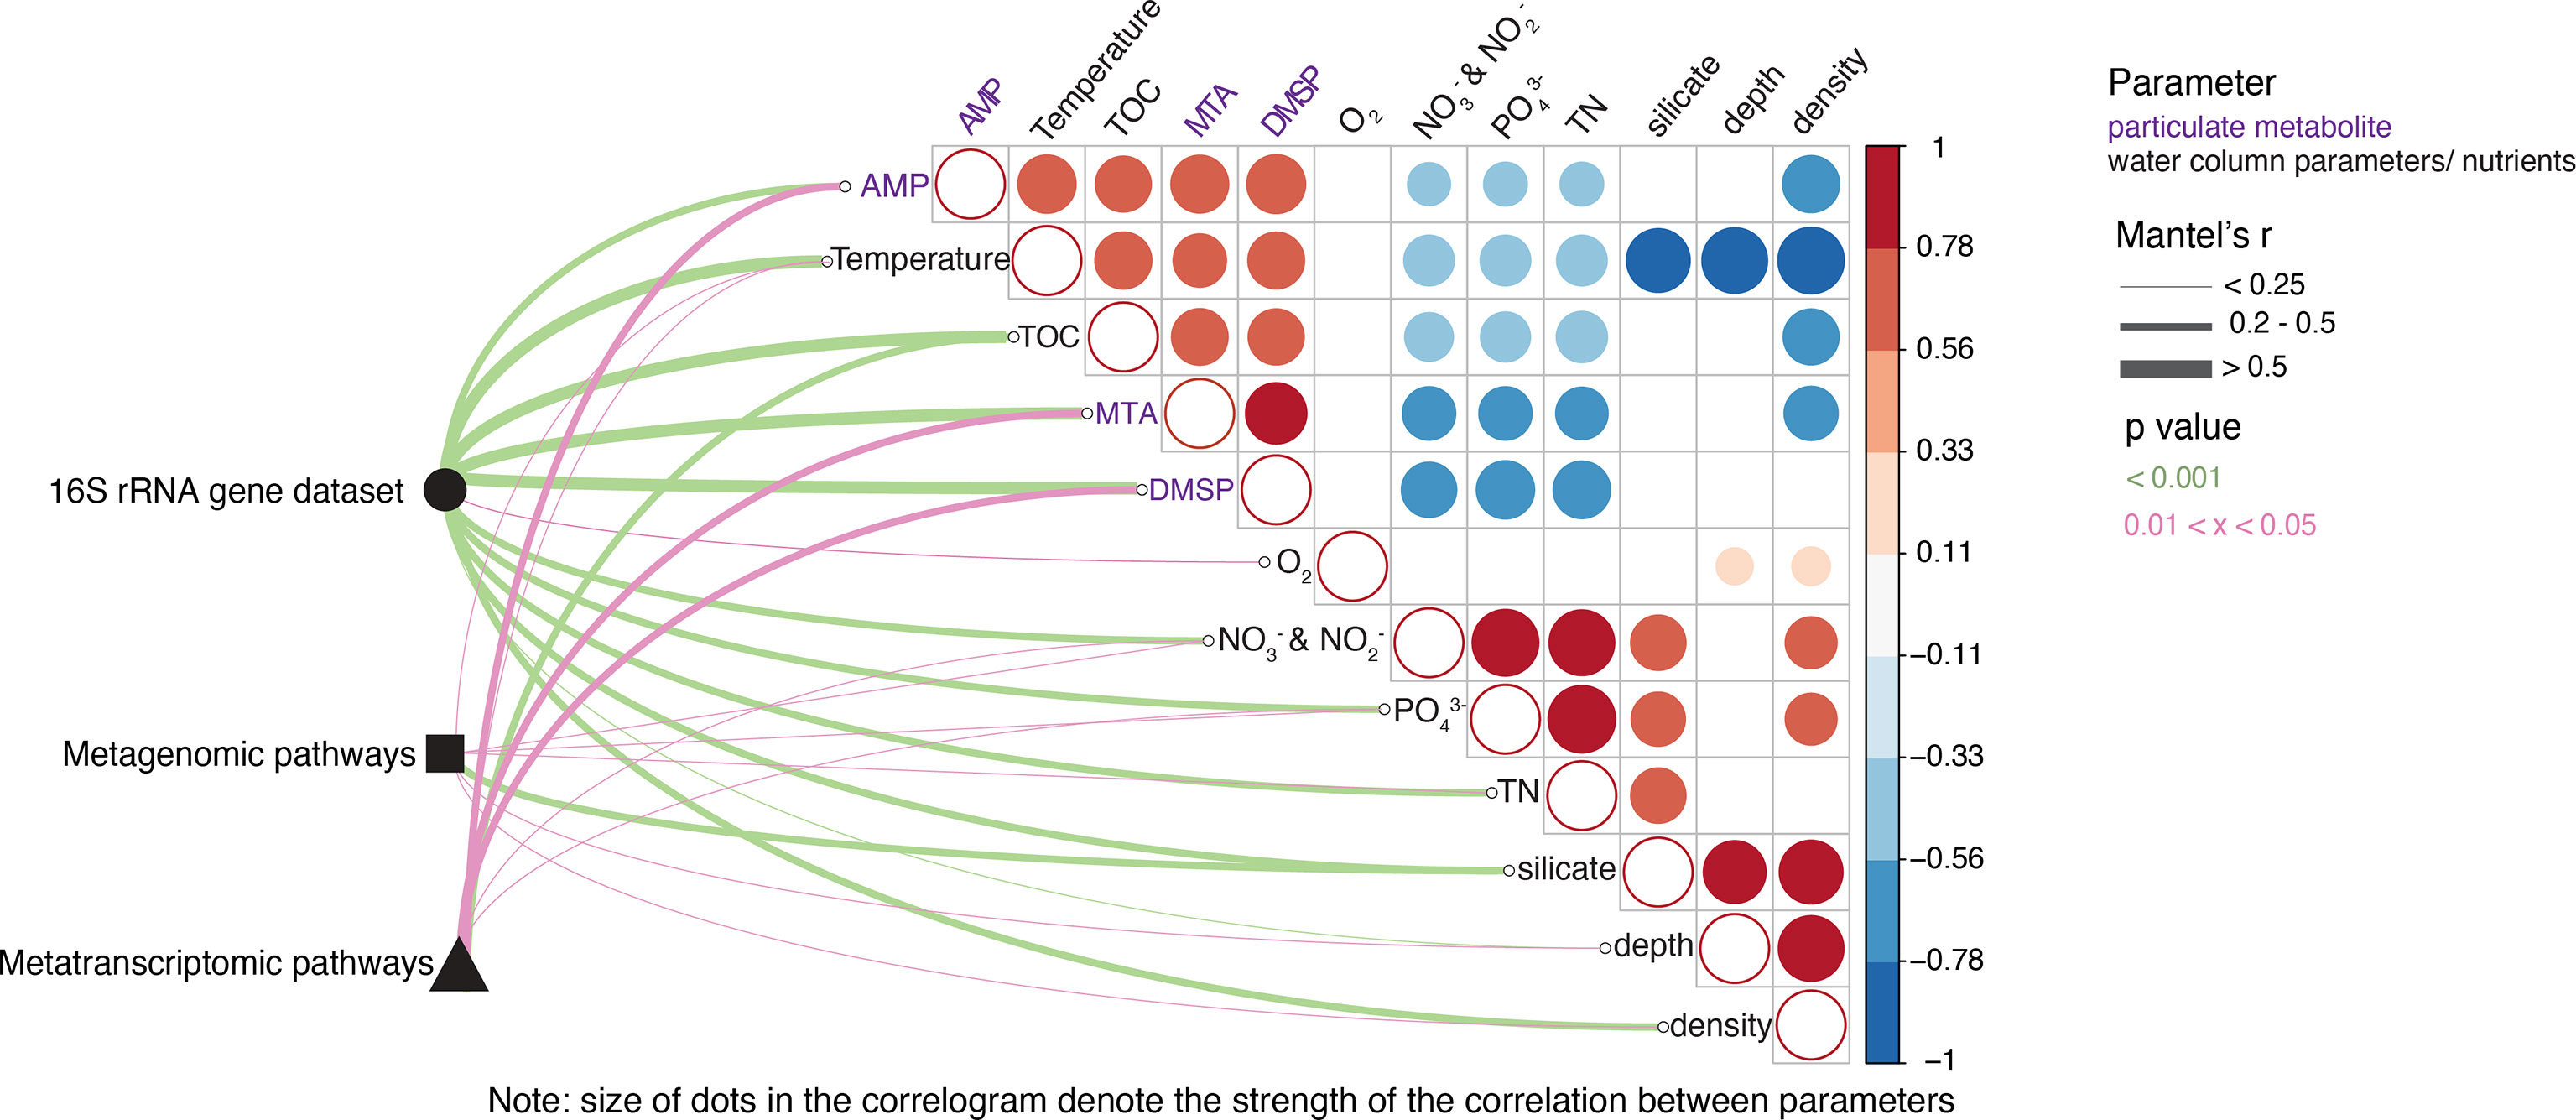
Figure 9 Metabolic and environmental drivers of microbial community and metagenomic/metatranscriptomic pathways across depth and latitude. Pairwise comparisons of environmental factors (black font) and particulate metabolites (purple font) are shown as a correlogram with the color gradient denoting the strength and direction of correlation using Kendall’s tau. The variables shown are those that had at least one significant association with a biological dataset (16S rDNA microbial taxonomy, metagenomic or metatranscriptomic pathways) and only correlations for those water column parameter/metabolite data having significant correlations between each other are shown. Taxonomic community composition (16S rRNA gene sequenced data) and functional community compositions (metagenomic and metatranscriptomic pathways) were related to each environmental parameter/metabolite using Mantel tests between dissimilarity matrices. Line width corresponds to Mantel’s r statistic and line color denotes the statistical significance based on 999 permutations. Note that only significant associations are shown, and that correlations between the same parameters (i.e., density vs density) are not shown to emphasize the correlations between other parameters.
Discussion
Comparative studies evaluating the functional coding potential of marine metagenomes indicate that a core set of metabolic pathways (i.e., DNA synthesis, cell membrane synthesis...) are widely distributed throughout the global ocean (Hanson et al., 2014; Aylward et al., 2015; Sunagawa et al., 2015; Acinas et al., 2021). This core repertoire is conserved across diverse taxonomic lineages (Hanson et al., 2014; Aylward et al., 2015). Accessory or niche-defining functions are also widely distributed but more variable in abundance (Furhman, 2009). Thus, while both core and accessory genes are widespread, the expression of specific functions is determined by environmental conditions and metabolic interactions (Hanson et al., 2014; Louca et al., 2016). Hanson and colleagues previously identified widespread distribution of photosynthesis pathways in metagenomic datasets from the Hawaii Ocean Time Series spanning sunlit and dark ocean waters (Hanson et al., 2014). However, expression of these pathways was primarily in sunlit waters. Conversely, in the dark ocean, it has been demonstrated that with increasing depth, there are a larger number of uniquely expressed pathways corresponding to deep water niche-specialization (Hanson et al., 2014), involving the oxidation of recalcitrant organic compounds (Saw et al., 2020). On ocean basin scales, temporal dynamics of gene expression are often conserved in sunlit waters despite differences in microbial community composition (Aylward et al., 2015).
In this study, we detect demonstrated patterns in microbial community composition and as well as potential and expressed metabolic pathways down a depth gradient along a 2765 km transect of the western South Atlantic Ocean. We additionally find evidence of latitudinal stratification in gene expression in response to environmental fluctuations specific to particular geographic locations along our cruise transect, such as the Amazon River Plume and wind-driven upwelling in equatorial regions. Finally, we also show that the presence of specific microbial community members and expressed metabolic pathways is regulated through complex feedback loops resulting from responses to environmental conditions, including variations in the marine organic matter pool.
Depth Partitioning: Microbial Communities, Metagenomic Pathways and Metatranscriptomic Pathways Separate With Depth
Overall, microbial communities appear to cluster into significantly distinct assemblages that can be divided into two broad marine regions: the surface (5 - 150 m) and deep (250 - 4000 m) ocean (Figure 3), as shown by others previously (DeLong et al., 2006; Zinger et al., 2011; Friedline et al., 2012; Milici et al., 2016a; Fu et al., 2019). Here, we observe that different microbial taxa flourish as a result of the unique conditions defining the surface, DCM, oxygen minimum and deep waters. For example, microbial orders related to Cyanobacteria and SAR11 were most prevalent in the photic zones of the ocean (Figure 6A), consistent with many previous findings in tropical and mid-latitude oceans (i.e., Zubkov et al., 1998; Jing et al., 2013). In contrast, members of Thaumarchaeota, SAR324 and sinking particle associated Alteromonadales (Boeuf et al., 2019) dominated the bathypelagic ocean (> 1000 m: Figure 6A). Thaumarchaeota are among the most abundant microbial groups in the global mesopelagic and deep ocean (Swan et al., 2014), and are known ammonia oxidizers (Pester et al., 2011). They generally increase in abundance at greater depths (Amano-Sato et al., 2013), possess both shallow and deep-water ecotypes (Hatzenpichler, 2012; Santoro et al., 2017) and are especially prevalent in the open ocean where low fluxes prevail (Santoro et al., 2010). Many clades associated with the deep ocean have potential to contribute to dark ocean carbon cycling since they are flexible chemolithotrophs capable of degrading a range of substrates, including a variety of C1 and sulfur-containing compounds (Wright et al., 1997; Swan et al., 2011; Sheik et al., 2013). The Deltaproteobacteria SAR324 are also often found at depth and may be associated with sinking particles (Swan et al., 2011). Heterotrophic bacteria, such as the Gammaproteobacteria Alteromonadales, are abundant in the open ocean and have also been found to remain active on sinking particles as they transition down the water column (Boeuf et al., 2019). Alteromonadales are also believed to be central conduits for nutrient and DOC cycling, contributing to organic matter turnover at depth (Pedler et al., 2014).
Many of the microbial metabolic pathways recovered in the metagenome were found ubiquitously throughout the water column (Figure 6B). The larger proportion (87%) of shared metagenomic pathways between the surface and deep ocean is consistent with the presence of a persistent core of functional pathways used for cellular housekeeping and central metabolic processes that are found in nearly all microorganisms, regardless of in situ environmental conditions (Furhman, 2009; Ferreira et al., 2014; Hanson et al., 2014). For example, the most abundant pathway observed in the metagenomic dataset was the TCA cycle, or variants thereof, which are central to energy metabolism and carbon processing for a variety of aerobes and anaerobes (Huynen et al., 1999; Makarova & Koonin, 2003). Yet, even within the metagenome, it is still possible for a unique set of pathways to define the surface and deep ocean (Ferreira et al., 2014), such as photosynthetic pathways observed in the photic zone, and energy metabolism pathways (methylaspartate cycles) in the deeper zones of the ocean (Figure 6B and Supplementary Figure 1). These specific differentiations drive the observed clustering patterns in our NMDS ordination (Figure 4A) beyond broad compartments like the “surface” and “deep” ocean. Functional redundancy refers to the fact that multiple, co-existing, yet taxonomically distinct, organisms are able to carry out the same metabolic function (Louca et al., 2018). Ultimately, this leads to the observation of a stable functional composition within a metagenome and/or a metatranscriptome despite a highly variable taxonomic composition (Louca et al., 2018). Here, such redundancy is manifested in the fact that diverse taxonomic groups can perform photosynthesis in the surface ocean as well as similar metabolisms to generate energy throughout the water column (Figure 6 and Supplementary Figure 8). In the metatranscriptome, we observe this functional redundancy, for example, in the DCM, where photosynthetic pathways were positively correlated to the same degree for SAR11, Legionellales and Bradymonadales, likely as a consequence of these organisms feeding off of photosynthetic byproducts (Supplementary Figure 3A). Similarly, in the deeper regions of the ocean, diverse bottom-dwelling microbial indicator groups (Thermoplasmatales, SAR202 and Flavobacteriales) were all positively correlated with carboxylate degradation (Supplementary Figure 3B).
The greater variation in metatranscriptomic pathways down the water column (Figure 6C) emphasizes the diverse metabolic responses found at depth extremes (i.e., surface, deep waters, DeLong et al., 2006; Friedline et al., 2012). For example, photosynthetic pathways (i.e., light reactions and the Calvin-Benson-Bassham cycle, Supplementary Figure 2) and pathways corresponding with energy metabolism and electron transfer were, unsurprisingly, most prevalent in the photic zones, although electron transfer was notably less prevalent at the oxygen minimum zone (Figure 6C and Supplementary Figure 2). Further, the presence of surface indicator pathways related to seleno-amino acid production (Figure 7) is likely due to the uptake of dissolved selenium by phytoplankton (Cutter and Bruland, 1984), which is used in the production of proteins required for cell viability in many algal species (Araie & Shiraiwa, 2009). In contrast, metatranscriptomic pathways related to the degradation of recalcitrant carbon and C1 compounds and to the TCA cycle (or variants thereof) were more abundant in the deep ocean (Figure 6C and Supplementary Figure 2). This may suggest that either there are fresh sources of detritus at lower depths replete with low molecular weight carbon (Kirchman, 2018) or a prevalence of microbially produced methane by deep sea sedimentary archaea (Colwell et al., 2008). Additionally, these recalcitrant carbon and C1 degradation pathways may also be linked to methylotrophic breakdown of both particulate and dissolved organic matter at depth (McCarren et al., 2010; Fang et al., 2014).
Probing the metatranscriptomic dataset more deeply, we observe different correlational relationships between taxonomic indicators for distinct water column compartments and expressed pathways (Figure 7). In the DCM, SAR11 and Bradymonadales, a novel Deltaproteobacteria group (Mu et al., 2020) with versatile predation strategies, were strongly and positively correlated with alcohol and aromatic compound degradation pathways (Figure 7A and Supplementary Figure 3A), consistent with photic marine waters being richer in phytoplankton and cyanobacterial derived carbohydrate by-products (Mühlenbruch et al., 2018). This is exemplified by the strong positive correlation of SAR11 with DMSP and phytol degradation (Figure 7A), by-products of marine phytoplankton osmoprotectant production and a chlorophyll a component, respectively (Yoch, 2002; Salih and Celikbicak, 2012; Archer et al., 2018). Additionally, strong positive correlations between DCM indicators and pathways related to chlorinated phenol, aromatic amine and ethanol compound degradation suggest that the metabolic capacity to cope with organic pollutants is potentially present in the western Atlantic Ocean (Ghosal et al., 2016; Ghattas et al., 2017).
In the deep ocean, we observed that different indicator taxa and expressed pathways were present in the NADW compared to the bottom waters (Figures 7B, 7C and Supplementary Figures 3B, C), suggesting that these water masses have distinct microbial communities with specific metabolic processes (Shi et al., 2011; Lekunberri et al., 2013; Guerrero-Feijoo et al., 2016; Fu et al., 2019). SAR202, SAR324, and certain orders of Archaea have been found in the deep ocean below 1500 m (Vetriani et al., 1999; Morris et al., 2004; Sheik et al., 2013; Wu et al., 2013), whereas Rhodospirillales are especially common at intermediate depths (~500 m) and below 1500 m in the North Atlantic (Guerrero-Feijoo et al., 2016). In particular, the positive correlation between the Bottom indicator group SAR202 (an abundant aphotic zone heterotroph from the phylum Chloroflexi; Mehrshad et al., 2018) and pathways related to the oxidation of recalcitrant carboxylate compounds (i.e., oxobutanoate compounds; Figure 7C and Supplementary Figure 3C) is consistent with the presence of multiple genes encoding carboxylic acid degradation previously found in abundance in the deep ocean (Landry et al., 2017). Recent work analyzing the SAR202 genome and its DOM degrading capacity has suggested a role in the breakdown of refractory DOM persistent in the deep ocean (Landry et al., 2017; Saw et al., 2020). Overall, recalcitrant DOM degrading capabilities appear more prevalent in deep-dwelling marine microorganisms (Sheik et al., 2013), likely supporting their growth in the bathypelagic ocean (Landry et al., 2017; Kirchman, 2018). Like SAR202, SAR324 is ubiquitously present in the global dark ocean, with previous work illustrating that its metabolic versatility likely plays a role in its widespread distribution (Sheik et al., 2013). Here, we observe a strong positive correlation between SAR324 and lipid and alcohol degradation pathways, such as oleate beta oxidation and ethylene glycol and acetone degradation (Supplementary Figure 3C). This correlation may be indicative of specific metabolic versatility in SAR324 with regards to fatty acid metabolism, as oleate and beta oxidation involve the degradation of unsaturated fatty acids, producing two acetyl CoA molecules (Nie et al., 2008), which SAR324 may funnel into the TCA cycle for energy production (Sheik et al., 2013).
In contrast, we observed that though bottom-dwelling microbial indicator groups like Thermoplasmatales and Chloroflexi did not demonstrate similar patterns in terms of recalcitrant carbon degradation and/or fatty acid degradation (Figure 7) as the NADW indicator groups, the bottom-dwelling indicators did show a strong positive correlation (r>0.5) with a specific methanogenesis pathway (methylotrophic methanogenesis from trimethylamine, Figure 7C). Thermoplasmatales, as a member of the phylum Euryarchaeota are likely capable of methylotrophic methanogenesis, and members of the phylum Chloroflexi, such as Anaerolineaceae, have been previously shown to contain genes involved in methanogenesis (Paul et al., 2012; Liang et al., 2015). Given the higher oxygen concentrations found in the bathypelagic layers of the ocean (Figure 2A), methanogenesis may be occurring within the lower oxygen micro-environments of marine snow particles (Steiner et al., 2020). Branching of Thermoplasmatales and Chloroflexi away from other indicator taxa in Supplementary Figure 3C indicates that they may occupy a different metabolic niche compared to other indicator taxa for the bottom waters and may reflect different metabolisms required for particle-associated vs planktonic lifestyles (Zhang et al., 2015; Milici et al., 2017).
Spatial Partitioning: The Microbial Metatranscriptome Differs Across Marine Geography
Examining taxonomic and functional patterns latitudinally across our transect revealed divergent patterns where microbial community composition showed no variation (data not shown) but predicted metabolic pathways partitioned across latitude. This geographical homogeneity in microbial community composition is similar to that observed elsewhere (Zinger et al., 2013; Salazar et al., 2016; Djurhuus et al., 2017; Ibarbalz et al., 2019), and is likely a result of our cruise track spanning the South Atlantic subtropical gyre and spatially expansive deep-water masses (i.e., AAIW, NADW). Gyres have been shown to facilitate the transport and mixing of microbial communities (Milici et al., 2016b), contributing to the relative uniformity observed latitudinally in microbial community distribution (Fu et al., 2019). Different deep-water masses have been shown to have characteristic temperature and salinity signatures and may serve to transport microbial communities across oceanic basins, contributing to homogenization of latitudinal differences in microbial community composition (Galand et al., 2010; Friedline et al., 2012; Pernice et al., 2016; Djurhuus et al., 2017).
In contrast, the predicted expressed pathways from the metatranscriptome did differ between latitudinally distinct stations (7, 15, and 23) (Figure 8), which we hypothesize is driven by different nutrient conditions as a result of riverine input or upwelling. Station 23 is close to the Amazon River plume, which spans thousands of kilometers due to freshwater input from the world’s largest river (Araujo et al., 2017; Varona et al., 2019). This riverine input delivers large amounts of terrestrial carbon and nutrients to the surrounding ocean, altering metabolic activities of impacted marine microbial communities (Satinsky et al., 2017). The high expression and relative abundance of aerobic respiration pathways at Station 23 (Supplementary Figure 4 and Supplementary Figure 5C) is consistent with increased metabolic activity associated with a plentiful flux of organic carbon and nutrients (Satinsky et al., 2017). Additionally, the presence of ectoine synthesis pathways at Station 23, absent in the other stations (Supplementary Figure 5), suggests a response to osmotic stress. The presence of both aerobic metabolic pathways and ectoine synthesis may allow microorganisms to better respond to chemical fluctuations and/or take advantage of the carbon influx from the Amazon River at shallower depths (Richter et al., 2019). To a lesser extent, compared to the Amazon River plume, equatorial upwelling at other locations along our cruise track (i.e., Station 15), can also mix the water column and lead to elevated concentrations of nutrients and metabolites at the ocean surface (Wang et al., 2017; Johnson et al., in revision). Indeed, the high relative abundance of pathways associated with aerobic respiration at Station 15 (Supplementary Figure 5B) is consistent with an expected higher metabolic activity associated with sources of organic carbon and nutrients from below the nutricline. Further, an increased relative abundance of predicted pathways related to photosynthesis at Station 15 (i.e., seleno amino acid biosynthesis) compared to Stations 23 and 7 (Figure 8B and Supplementary Figure 4) may also indicate a nutritive environment conducive to enhanced photosynthetic activity in the surface ocean (Richardson & Bendsten, 2017).
The differences in the metatranscriptome between stations is also evident in the distribution of particulate (combined 0.7 µm and 0.2 µm fractions) metabolites generally indicative of greater microbial abundances and metabolic activity (Johnson et al., in revision). Metabolites, the small molecule intermediary products of metabolic reactions catalyzed by cellular enzymes, can provide a snapshot of the microbial community’s metabolic response to fluctuations in environmental conditions across geography (Johnson et al., in revision). Here we observed that the elevated presence of certain metabolites (i.e., AMP and MTA) are closely correlated with increased microbial abundance at more nutrient rich sites (Johnson et al., in revision). AMP is a major contributor to the marine phosphorous pool and other ubiquitous cellular processes, such as RNA synthesis, regulation of purine breakdown (Liechti and Goldberg, 2011), nucleotide synthesis and interconversion between the energy-carrying molecules ADP and ATP (Hardie, 2018). Its universal presence in many cellular processes thus makes it a general indicator for enhanced metabolic activity. At Station 23, elevated AMP (Johnson et al., in revision) coincides with an increased presence of broad classes of metatranscriptomic pathways related to respiration (Figure 8B). However, we note that no statistically significant pairwise co-occurrence patterns between specific metatranscriptomic pathways related to respiration (i.e., alternative oxidase pathways, oxoisovalerate decarboxylation, chlorate reduction) and AMP were found, likely due to the ubiquity of AMP across cellular processes. An increase in the abundance of particulate MTA was also observed at Station 15 but not at Station 7, located in the oligotrophic South Atlantic subtropical gyre (Johnson et al., in revision). In distinct oceanic regions, levels of MTA and riboflavin, as well as 4-aminobenzoic acid (PABA) and pantothenic acid (vitamin B5), have been shown to closely correlate with abundant microbial community members, and by extension, microbial metatranscriptomic pathways (Johnson et al., in revision). For example, pico/nanoeukaryotes in the North Atlantic Ocean have been found to be linked to an elevated concentration of MTA and riboflavin as these organisms contribute significantly to the overall organic sulfur and nitrogen pool in this region (Johnson et al., in revision). Conversely, pantothenic acid and PABA have been found to be more prevalent in the surface ocean at the equator (in this study represented by Station 15) and further south in the Atlantic (here, represented by Station 7) (Jonhson et al., in revision). The elevated concentrations of these metabolites are likely due to the abundance of Cyanobacteria at these stations (Johnson et al., in revision). Cyanobacteria have been found to frequently release organic carbon in the form of carboxylic acids, such as PABA (Fiore et al., 2015), which heterotrophic organisms found in the surface ocean can then utilize. Previously, Becker et al. (2019) noted that the cyanobacteria Procholorococcus are able to support SAR11’s organic carbon requirement by virtue of the DOM exudates they produce. Similarly, in this study we observed a strong correlation between the DCM indicator organism SAR11 and degradation pathways (Figure 7A). Finally, levels of guanine, an essential constituent of DNA often correlated with cell abundance, were found to be elevated in the particulate fraction at the surface waters of Station 7, Station 15 and Station 23 (Johnson et al., in revision). Correspondingly, metatranscriptomic pathways related to guanine metabolism (guanine salvage) were also elevated in the same surface waters of Stations 7, and 23 (Supplementary Figure 7).
Drivers of Observed Microbial Community Composition and Expressed Pathway Patterns
Understanding how the environment selects for and impacts microbial community structure and function is integral to the study of marine microbial ecology. Such integrated analyses shed light on how the unique conditions in water column structure shape microbial community structure. Our correlated dissimilarities of total taxonomic and functional composition with our water column physical, chemical, and particulate metabolic parameters (Figure 9) aims to broadly identify the environmental and metabolic drivers influencing the community structure and functional gene expression captured by our datasets. We also use targeted metabolites, including vitamins, amino acids and other biosynthetic intermediaries to bridge the microbial metatranscriptome and, hopefully, the dynamic microbial community response, to environmental conditions down the water column.
The cycling of nutrients is most dynamic in the photic zone, where cyanobacteria, phytoplankton and zooplankton continuously produce and break-down a variety of marine metabolites (both dissolved and particulate, acting as intermediaries for metabolic reactions), polysaccharides and inorganic molecules (Meyer et al., 2016). Particulate break-down products amalgamate and sink, thus transported to lower depths, where the more recalcitrant particles may eventually settle. In this way, recalcitrant metabolites may influence the diversity of deep-water microorganisms, by selecting for those able to metabolize these particular energy sources (Meyer et al., 2016). Due to the continual release and sinking of particulate break-down products in the water column, the particulate metabolite profile can also vary directly in association with changes in abundant microbial taxa, particularly in waters above 200 m (Johnson et al., in revision). Taxonomic profiles observed in this study were consistent with previous reports in other oceanic locales (DeLong et al., 2006, Furhman et al., 2015; Sunagawa et al., 2015), with microbial community composition being strongly and significantly influenced by physical water column properties (e.g., temperature, depth), and also concentrations of chemical species, like TOC, major nutrients and particulate metabolites such as DMSP, AMP and MTA (Figure 9). Similar to the microbial community, the overall diversity in the functional (metatranscriptomic) dataset was impacted by the availability of nutrients, as found by other studies (McCarren et al., 2010; Gifford et al., 2016; Salazar et al., 2019), though with weaker correlation (Figure 9). The metabolome represents the functional activity of cells which are produced in response to a variety of environmental cues ranging from nutrient availability (Kujawinski et al., 2017) and oxidative stress (Jones et al., 2019) to temperature changes (Johnson et al., in revision). Like the taxonomic community composition, the metabolic pathways resolved in this dataset representing these activities also showed a significant correlation with particulate metabolites (DMSP, MTA and AMP) (Figure 9), thus illustrating the power of metatranscriptomic data to provide a snapshot of microbial activity under specific environmental conditions (Aguiar-Pulido et al., 2016).
The strong and significant correlation between particulate metabolites and both the taxonomic and functional datasets (Figure 9) is likely because marine metabolites are produced as specific microorganisms respond to changes in their surrounding environment (de Carvalho and Fernandes, 2010). For example, DMSP, a by-product of marine phytoplankton osmoprotectant production (Yoch, 2002; Archer et al., 2018), is used as an energy source by microbial communities in the photic zone once it is released into the dissolved organic matter pool (Kiene et al., 2000). A Spearman correlation of this metabolite with indicator taxa showed that particulate DMSP is strongly associated with our indicator microbial organisms for the DCM, like Bradymonadales, SAR11 and Legionellales (Supplementary Figure 6). DMSP assimilation and degradation, through both biotic and abiotic processes, fuels a variety of diverse carbon and sulfur pathways (i.e., oxidation of sulfur for energy or incorporation of sulfur into select amino acids, Moran et al., 2012). This metabolite has been found to support ~13% of microbial carbon degradation processes as it is a readily available substrate in surface waters (Kiene et al., 2000). DMSP is also an important source of reduced sulfur for SAR11 strains (Liu et al., 2018), with its degradation by-products, dimethyl sulfide and methanethiol, having been implicated in elevated greenhouse gas contributions to the atmosphere (Liu et al., 2018). DMSP’s ability to feed into multiple carbon and sulfur pathways may therefore explain why there is a strong and significant association between this metabolite, microbial community structure and, also, the metabolic pathways expressed in the microbial metatranscriptome (Figure 9). Similarly, since MTA is a toxic by-product originating from sulfur salvage and/or polyamine synthesis, which is then expelled into the extracellular environment (North et al., 2017), we expect that this metabolite will follow similar trends as DMSP (Figure 9). Finally, we observed a strong significant association between AMP, microbial community composition and the microbial metatranscriptome (Figure 9). As noted above, AMP’s ubiquity across cellular processes makes it a broad indicator for higher metabolic activity. Here, we see this fact reflected by AMP correlating with abundant surface microbial community members (i.e., Cyanobacteria, Figure 6A) at different stations (i.e., DCM of Station 15 and the surface waters of Station 23, Johnson et al., in revision).
Other particulate metabolites, such as amino acids and purines (Supplementary Table 2), were also found to have some correlation with the composition of microbial communities and metatranscriptomic pathways, although the strength of the correlation was less than that for AMP, DMSP, and MTA (Supplementary Table 2). All of these metabolites (Supplementary Table 2) form an important part of the marine organic carbon pool and are often rapidly cycled as they are ubiquitously required components of life (Moran et al., 2016, Johnson et al., in revision). Some of these metabolites (i.e., guanine, AMP, and most amino acids targeted in the study) demonstrate an almost universal presence across the ocean, in terms of both depth and latitude, and tend to associate with areas characterized by higher microbial biomass, like surface waters (Johnson et al., in revision). However, the low strength of correlation between each of these individual metabolites and both the microbial community composition and expressed functional pathways points to the fact that often specific metabolites cannot fully explain the variation present in taxonomic and functional datasets. This may be the result of the presence of an underlying core of omnipresent metabolic pathways, similar to observed in the metagenomic dataset, whose consistent distribution across the water column is ultimately driving the distribution metabolites targeted in this study. Amino acids, such as tryptophan, phenylalanine, isoleucine and leucine, along with purines such as guanine and adenosine, are often associated with deeper marine waters. These molecules can travel down the water column as a component of marine snow (Johnson et al., 2020). Some, like in the case of phenylalanine and tryptophan, are also likely produced at depth by endogenous microbial communities (Dauwe et al., 1999). Indeed, in this study, we observed a strong correlation between guanine, phenylalanine, and tryptophan with bottom-dwelling indicator microorganisms (Supplementary Figure 7). However, this correlation may be influenced by the fact that these specific metabolites were some of the only deep-water metabolites identified above the detection limit (Johnson et al., in revision).
In contrast to the taxonomic community composition and metatranscriptomic datasets, the metagenomic pathways correlated strongly and significantly with only one water column property, concentrations (Figure 9). This correlation may be due to a diatom bloom occurring at the time of sampling at Station 23 (Howard et al., 2017) or to increased Si export from the Amazon River (Gomes et al., 2018). The finding that most of the microbial metagenome is shared across the water column emphasizes that the metagenome of marine microorganisms, based on metabolic pathways predicted here, has a high degree of homogeneity with “all functions are everywhere, but the environment selects” which genes are expressed (Raes et al., 2011). As found elsewhere, the microbial metagenome is primarily composed of pathways such as housekeeping genes (Furhman, 2009; Ferreira et al., 2014) that are present irrespective of the environmental conditions outside of the cell. In the future, however, further sampling should be undertaken in order to validate the associations shown here between the marine environment and the microbial metagenome.
Finally, our analysis did not identify any significant associations between dissolved metabolites, which include an array of vitamins, nucleic acids, osmolytes, amino acids and metabolic intermediates (i.e., biotin, caffeine, 4-aminobenzoic acid (PABA), p-hydroxybenzoic acid (PHBA), pantothenic acid, phenylalanine, tryptophan), and taxonomic community composition, metagenomic pathways or metatranscriptomic pathways. This finding is consistent with prior conclusions that these dissolved metabolites are likely rapidly consumed and cycled as they are released into the ocean (Moran et al., 2016). Thus, their generally low and/or sporadic concentrations make it challenging to tie their distribution to the observed variation in the microbial taxonomic community or the total potential and functional gene pools. One exception to this trend was with regards to dissolved riboflavin, which was significantly correlated with the metatranscriptomic dataset (Supplementary Table 2). Recent studies have found that dissolved distributions of this metabolite can be controlled by abundant levels of photosynthetic microorganisms, like Procholorococcus and Synechococcus (Johnson et al., in revision). Patterns of abundance in these organisms at different oceanic depths across the transect (Figure 6) may thus drive the significant correlation between dissolved riboflavin and expressed functional pathways.
Conclusion
In this study, we provide insight into the taxonomic structure and microbial community metabolic potential and expression that occur across depth (from the surface to the deep ocean) and space along a transect of the western Atlantic Ocean. The pathway-centric approach used here highlights metabolism at the biological scale of community, supporting the identification of the differences in marine biogeochemical processes driving matter transformations over both depth and space. Collectively, our results are consistent with vertical stratification and biogeographic patterns previously observed in other parts of the global ocean and the eastern Atlantic Ocean (Friedline et al., 2012; Sunagawa et al., 2015). Using a pathway-centric approach, we found an abundance of euphotic zone-adapted microorganisms, thus confirming large-scale patterns in the replacement of phototrophic microbial community members (i.e., cyanobacteria and SAR11) with heterotrophic microbes (i.e., SAR202 and SAR324) sequentially down the water column along the transect. We also observed a large number of shared metabolic pathways encoded in water column metagenomes, shining a spotlight on functional redundancy and the prevalence of core pathways irrespective of depth (Louca et al., 2016). Yet within the metatranscriptome, we saw distinct correlations between indicator taxa for specific water column compartments in relation to metabolic pathway expression. These pathways appeared to be selectively expressed in response to environmental conditions. For example, the NADW indicator SAR202 strongly and positively correlated with metatranscriptomic pathways related to the oxidation of recalcitrant carboxylate compounds in the deep ocean. Finally, we also observed distinct correlations between specific components of the particulate metabolite pool (i.e., DMSP, AMP and MTA) and both microbial community structure and metatranscriptomic pathways. Because this DOM fraction represents the molecules produced by microbial taxa as a consequence of direct metabolic response to changes in the surrounding environment, pairing patterns in particulate metabolite concentrations with microbial community and pathway abundance helps to elucidate how expressed functional metabolic processes can reflect and/or influence net microbial community processes. Collectively our results are consistent with the prevailing paradigm of stratified microbial community structure and function in the ocean and provide new insights into indicator taxa and expressed metabolism in the dark ocean. The extent to which observed and expressed pathways are distributed between interacting taxonomic units remains to be determined with implications for genome-resolved modeling of trophic interactions linked to biogeochemical cycling and the resilience of marine food webs.
Data Availability Statement
The datasets presented in this study can be found in online repositories. Water column data has been archived with BCO-DMO (Project 2204, Dissolved Organic Matter Composition in the Deep Atlantic Ocean (Kujawinski & Longnecker, 2014; https://www.bco-dmo.org/project/2204). The metabolomics data have been archived with MetaboLights (study # MTBLS1752; https://www.ebi.ac.uk/metabolights/MTBLS1752). The 16S rRNA gene data, metagenomic and metatranscriptomic libraries are accessible via umbrella bioproject ID PRJNA805279 on NCBI.
Author Contributions
MB, MT-B, AH, WJ, KL, EK, and SH designed the study. MB and MT-B collected and processed the meta-omics samples at sea and in the laboratory. WJ conducted the metabolite measurements and analyses. MC, MB, MT-B, AH, KK, WJ, and KL processed the data, and MC made the figures. All authors contributed to the article and approved the submitted version.
Funding
This work was funded by the NSF Division of Ocean Sciences (Grant no. OCE-1154320 to EK and KL) and a small (“Microbial controls on marine organic carbon cycling”) and large (“Marine microbial communities from the Southern Atlantic Ocean transect to study dissolved organic matter and carbon cycling”) community sequencing grants from the Joint Genome Institute (US Department of Energy, Walnut Creek, CA) to SH and MB. MB was supported by an NSERC post-doctoral fellowship and a CIFAR Global Scholars fellowship. MC was supported by a Campus Alberta Innovates Program (CAIP) chair to MB.
Conflict of Interest
SH is a co-founder of Koonkie Inc., a bioinformatics consulting company that designs and provides scalable algorithmic and data analytics solutions in the cloud.
The remaining authors declare that the research was conducted in the absence of any commercial or financial relationships that could be construed as a potential conflict of interest.
Publisher’s Note
All claims expressed in this article are solely those of the authors and do not necessarily represent those of their affiliated organizations, or those of the publisher, the editors and the reviewers. Any product that may be evaluated in this article, or claim that may be made by its manufacturer, is not guaranteed or endorsed by the publisher.
Acknowledgments
We thank the captains and crew of the R/V Knorr, Catherine Carmichael, Joe Jennings, Gretchen Swarr, Melissa Kido Soule, Andreas Mueller, Melanie Scofield, Ashley Arnold, and Colleen Kellogg for assistance during this project.
Supplementary Material
The Supplementary Material for this article can be found online at: https://www.frontiersin.org/articles/10.3389/fmars.2022.867310/full#supplementary-material
References
Acinas S. G., Sanchez P., Gasol J. M. (2021). Deep Ocean Metagenomes Provide Insight Into the Metabolic Architecture of Bathypelagic Microbial Communities. Commun. Biol. 4, 1–15. doi: 10.1038/s42003-021-02112-2
Aguiar-Pulido V., Huang W., Suarez-Ulloa V., Cickovski T., Mathee K., Narasimhan G. (2016). Metagenomics, Metatranscriptomics, and Metabolomics Approaches for Microbiome Abalysis. Evol. Bioinform. Online 12, 5–16. doi: 10.4137/EBO.S36436
Allers E., Wright J.J., Konwar K., Howes C.G., Beneze E., Hallam S. J., et al. (2013). Diversity and Population Structure of Marine Group A Bacteria in the Northeastern Subarctic Pacific Ocean. ISME J. 7, 256–268. doi: 10.1038/ismej.2012.108
Alneberg J., Karlsson C. M. G., Divne A. M., Bergin C., Homa F., Lindh M. V., et al. (2018). Genomes From Uncultivated Prokaryotes: A Comparison of Metagenome-Assembled and Single-Amplified Genomes. Microbiome, 1–14 6. doi: 10.1186/s40168-018-0550-0
Amano-Sato C., Akiyama S., Uchida M., Shimada K., Utsumi M. (2013). Archaeal Distribution and Abundance in Water Masses of the Arctic Ocean., Pacific Sector. Aquat. Microb. Ecol. 69, 101–112. doi: 10.3354/ame01624
Appolinario L. R., Tschoeke D., Paixao R. V. S., Venas T., Calegario G., Leomil L., et al. (2019). Metagenomics Sheds Light on the Metabolic Repertoire of Oil-Biodegrading Microbes of the South Atlantic Ocean. Environ. Pollut. 249, 295–304. doi: 10.1016/j.envpol.2019.03.007
Araie H., Shiraiwa Y. (2009). Selenium Utilization Strategy by Microalgae. Molecules 14, 4880–4891. doi: 10.3390/molecules14124880
Araujo M., Noriega C., Hounsou-Gbo G. A., Veleda D., Araujo A., Bruto L., et al. (2017). A Synoptic Assessment of the Amazon River-Ocean Continuum During Boreal Autumn: From Physics to Plankton Communities and Carbon Flux. Front. Microbiol. 8, 1358. doi: 10.3389/fmicb.2017.01358
Archer S. D., Suffrian K., Posman K. M., Bach L. T., Matrai P. A., Cuntway P. D., et al. (2018). Processes That Contribute to Decreased Dimethyl Sulfide Production in Response to Ocean Acidification in Subtropical Waters. Front. Mar. Sci. 5, 1–19. doi: 10.3389/fmars.2018.00245
Aylward F. O., Eppley J. M., Smith J. M., Chavez F. P., Scholin C. A., De1 E. F. (2015). Microbial Community Transcriptional Networks Are Conserved in Three Domains at Ocean Basic Scales. Proc. Natl. Acad. Sci. U. S. A. 112, 5443–5448. doi: 10.1073/pnas.1502883112
Becker J. W., Hogle S. L., Rosendo K., Chisholm S. W. (2019). Co-Culture and Biogeography of Prochlorococcus and SAR11. ISME J. 13, 1506–1519. doi: 10.1038/s41396-019-0365-4
Bergaur K., Fernandez-Guerra A., Garcia J. A. L., Sprenger R. R., Stepanuskas R., Pachiadaki M. G., et al. (2017). Organic Matter Processing by Microbial Communities Throughout the Atlantic Water Column as Revealed by Metaproteomics. Proc. Natl. Acad. Sci. U. S. A. 67, 498–510. doi: 10.1073/pnas.1708779115
Biller S. J., Berube P. M., Dooley K., Williams M., Satinsky B. M., Hacl T., et al. (2018). Marine Microbial Metagenomes Sampled Across Space and Time. Sci. Data 5, 1–7. doi: 10.1038/sdata.2018.176
Boeuf D., Edwards B. R., Eppley J. M., Hu S. K., Poff K. E., Romano A. E., et al. (2019). Biological Composition and Microbial Dynamics of Sinking Particulate Organic Matter at Abyssal Depths in the Oligotrophic Open Ocean. Proc. Natl. Acad. Sci. U. S. A. 116, 11824–11832. doi: 10.1073/pnas.1903080116
Bouman H., Ulloa O., Barlow R., Li K. W. W. (2011). Water-Column Stratification Governs the Community Structure of Subtropical Marine Picophytoplankton. Environ. Microbiol. Rep. 3, 473–482. doi: 10.1111/j.1758-2229.2011.00241.x
Campeao M. E., Reis L., Leomil L., de Oliveira L., Otsuki K., Gardinali P., et al. (2017). The Deep-Sea Microbial Community From the Amazonian Basin Associated With Oil Degradation. Front. Microbiol. 8, 1–13. doi: 10.3389/fmicb.2017.01019
Caspi R., Altman T., Billington R., Dreher K., Foerster H., Fulcher A. C., et al. (2013). The MetaCyc Database of Metabolic Pathways and Enzymes and the BioCyc Collection of Pathway/Genome Databases. Nucleic Acids Res. 42, D459–D471. doi: 10.1093/nar/gkt1103
Catala T. S., Reche I., Fuentes-Lima A., Romera-Castillos C., Nieto-Cid M., Ortega-Retuerta E., et al. (2015). Turnover Time of Fluorescent Dissolved Organic Matter in the Dark Ocean. Nat. Commun. 6, 1–8. doi: 10.1038/ncomms6986
Chambers M. C., Maclean B., Burke E., Amodei D., Ruderman D. L. (2012). A Cross-Platform Toolkit for Mass Spectrometry and Proteomics. Nat. Biotechnol. 30, 918–920. doi: 10.1038/nbt.2377
Chen Z., Chen L., Zhang W. (2017). Tools for Genomic and Transcriptomic Analysis of Microbes at Single-Cell Level. Front. Microbiol. 8, 1831. doi: 10.3389/fmicb.2017.01831
Clasquin M. F., Melamud E., Rabinowitz J. D. (2012). LC-MS Data Processing With MAVEN: A Metabolomic Analysis and Visualization Engine. Curr. Protoc. Bioinformatics 37, 1–23. doi: 10.1002/0471250953.bi1411s37
Colwell F. S., Boyd S., Delwiche M. E., Reed D. W., Phelps T. J., Newby D. T. (2008). Estimates of Biogenic Methane Production Rates in Deep Marine Sediments at Hydrate Ridge, Cascadia Margin. Appl. Environ. Microbiol. 74, 3444–3452. doi: 10.1128/AEM.02114-07
Coutinho F. H., von Meijenfeldt F. A. B., Walter J. M., Haro-Moreno J. M., Thompson C. C., Cosenza C. A. N., et al. (2021). Ecogenomics and Metabolic Potential of the South Atlantic Ocean Microbiome. Sci. Total Environ. 765, 1–20. doi: 10.1016/j.scitotenv.2020.142758
Croux C., Dehon C. (2010). Influence Functions of the Spearman and Kendall Correlation Measures. Stat. Methods Appl. 19, 497–515. doi: 10.1007/s10260-010-0142-z
Cutter G. A., Bruland K. W. (1984). The Marine Biochemistry of Selenium: A Re-Evaluation. Limnol. Oceanogr. 29, 1179–1192. doi: 10.4319/lo.1984.29.6.1179
Dang H., Lovell C. R. (2016). Microbial Surface Colonization and Biofilm Development in Marine Environments. Microbiol. Mol. Biol. Rev. 80, 91–138. doi: 10.1128/MMBR.00037-15
Dauwe B., Middelburg J. J., Herman P. M. J., Heip C. H. R. (1999). Linking Diagenetic Alteration of Amino Acids and Bulk Organic Matter Reactivity. Limnol. Oceanogr. 44, 1809–1814. doi: 10.4319/lo.1999.44.7.1809
De Caceres M., Legendre P. (2009). Associations Between Species and Groups of Sites: Indices and Statistical Inference. Ecology 90, 3566–3574. doi: 10.1890/08-1823.1
de Carvalho C. C. R. C., Fernandes P (2010). Production of Metabolites as Bacterial Responses to the Marine Environment. Mar. Drugs 8, 705–727. doi: 10.3390/md8030705
De Filippo C., Ramazzotti M., Fontana P., Cavalieri D. (2012). Bioinformatic Approaches for Functional Annotation and Pathway Inference in Metagenomic Data. Brief Bioinform. 13, 696–710. doi: 10.1093/bib/bbs070
DeLong E. F., Preston C. M., Mincer T., Rich V., Hallam S. J., Frigaard N. U., et al. (2006). Community Genomics Among Stratified Microbial Assemblages in the Ocean’s Interior. Science 311, 496–503. doi: 10.1126/science.1120250
Dittmar T., Koc B., Hertkorn N., Kattner G. (2008). A Simple and Efficient Method for the Solid-Phase Ectraction of Dissolved Organic Matter (SPE-DOM) From Seawater. Limnol. Oceanogr. Methods 6, 230–235. doi: 10.4319/lom.2008.6.230
Djurhuus A., Boersch-Supan P. H., Mikalsen S. O., Rogers A. D. (2017). Microbe Biogeography Tracks Water Masses in a Dynamic Oceanic Frontal System. R. Soc Open Sci. 4, 1–4. doi: 10.1098/rsos.170033
Dufrêne M., Legendre P. (1997). Species Assemblages and Indicator Species: The Need for a Flexible Assymetrical Approach. Ecol. Monogr. 67, 345–366. doi: 10.1890/0012-9615(1997)067[0345:SAAIST]2.0.CO;2
Durkin C.A., Buesseler K.O., Cetinic I., Estapa M.L., Kelly R.P., Omand M., et al. (2016). A Visual Tour of Carbon Export by Sinking Particles. Global Biogeochem. Cy. 35, 1–14. doi: 10.1029/2021GB006985
Falkowski P. G., Fnechel T., Delong E. F. (2008). The Microbial Engines That Drive Earth’s Biogeochemical Cycles. Science 23, 1034–1039. doi: 10.1126/science.1153213
Fang J., Zhang L., Li J., Kato C. (2014). The POM-DOM Piezophilic Microorganism Continuum (PDPMC)-The Rile of Piezophilic Microorganisms in the Global Ocean Carbon Cycle. Sci. China Mater. 58, 106–115. doi: 10.1007/s11430-014-4985-2
Ferreira A. J. S., Siam R., Setubal J. C., Moustafa A., Sayed A., Chambergom F. S., et al. (2014). Core Microbial Functional Activities in Ocean Environments Revealed by Global Metagenomic Profiling Analyses. PloS One 9, 1—11. doi: 10.1371/journal.pone.0097338
Fiore C. L., Longnecker K., Kido Soule M. C., Kujawinski E. B. (2015). Release of Ecologically Relevant Metabolites by the Cyanobacterium Synechococcus Elongatus CCMP 1631. Environ. Microbiol. 17, 3949–3963. doi: 10.1111/1462-2920.12899
Freing A., Wallace D. W. R., Bange H. W. (2012). Global Oceanic Production of Nitrous Oxide. Philos. Trans. R. Soc Lond. B Biol. Sci. 367, 1245–1255. doi: 10.1098/rstb.2011.0360
Friedline C. J., Franklin R., McCallister S. L., Rivera M. C. (2012). Microbial Community Diversity of the Eastern Atlantic Ocean Reveals Geographic Differences. Biogeosci. Discuss. 9, 109–150. doi: 10.5194/bgd-9-109-2012
Furhman J. A. (2009). Microbial Community Structure and Its Functional Implications. Nature 459, 193–199. doi: 10.1038/nature08058
Furhman J. A., Cram J. A., Needham D. M. (2015). Marine Microbial Community Dynamics and Their Ecological Interpretation. Nat. Rev. Microbiol. 13, 133–146. doi: 10.1038/nrmicro3417
Fu Y., Rivkin R. B., Lang A. S. (2019). Effects of Vertical Water Mass Segregation on Bacterial Community Structure in the Beaufort Sea. Microorganisms 7. doi: 10.3390/microorganisms7100385
Galand P. E., Potvin M., Casamayor E. O., Lovejoy C. (2010). Hydrography Shapes Bacterial Biogeography of the Deep Arctic Ocean. ISME J. 4, 564–576. doi: 10.1038/ismej.2009.134
Ghattas A. K., Fischer F., Wick A., Ternes T. A. (2017). Anaerobic Biodegradation of (Emerging) Organic Contaminants in the Aquatic Environment. Water Res. 116, 268–295. doi: 10.1016/j.watres.2017.02.001
Ghosal D., Ghosh S., Dutta T. K., Anh Y. (2016). Current State of Knowledge in Microbial Degradation of Polycyclic Aromatic Hydrocarbons (PAHs): A Review. Front. Microbiol. 7, 1369. doi: 10.3389/fmicb.2016.01369
Gifford S. M., Becker J. W., Sosa O. A., Repeta D. J., DeLong E. F. (2016). Quantitative Transcriptomics Reveals the Growth and Nutrient Dependent Response of a Streamlined Marine Methylotroph to Methanol and Naturally Occurring Dissolved Organic Matter. mBio 7, e01279-16. doi: 10.1128/mBio.01279-16
Gifford S. M., Sharma S., Booth M., Moran M. A. (2013). Expression Patterns Reveal Niche Diversification in a Marine Microbial Assemblage. Nature 425, 741–744. doi: 10.1038/ismej.2012.96
Giovanonni S. J. (2017). SAR11 Bacteria: The Most Abundant Plankton in the Oceans. Annu. Rev. Mar. Sci. 9, 231–255. doi: 10.1146/annurev-marine-010814-015934
Gomes H. R., Xu Q., Ishizaka J., Carpenter E. J., Yager P. L., Goes J. I. (2018). The Influence of Riverine Nutrients in Niche Partitioning of Phytoplankton Communities- A Contrast Between the Amazon Rive Rplume and the Changjiang (Yantze) River Dilute Water of the East China Sea. Front. Mar. Sci. 5, 343. doi: 10.3389/fmars.2018.00343
Gordon L. I., Jennings J. C. Jr., Ross A. A., Krest J. M., Woods Hole Oceanographic Institution (1994). “A Suggested Protocol for Continuous Flow Automated Analysis of Seawater Nutrients (Phosphate, Nitrate, Nitrite and Silicic Acid) in the WOCE Hydrographic Program and the Joint Global Ocean Fluxes Study,” in WOCE Operations Manual. WOCE Report No. 68/91, Revision 1. WHP Office Report WHPO91-1 (Woods Hole, Mass: OSU Coll. of . IC. Descriptive. Chem. OC. Grp. Tech. Rpt. 93–101).
Griffith D., Veech J. A., Marsh C. (2016). Coocur:probabilistic Species Co-Occurrence Analysis in R. J. Stat. Software 69, 1–17. doi: 10.18637/jss.v069.c02
Grossart H. P., Massana R., McMahon K. D., Walsh D. A. (2019). Linking Metagenomics to Aquatic Microbial Ecology and Biogeochemical Cycles. Limnol. Oceanogr. 65. doi: 10.1002/lno.11382
Guerrero-Feijoo E., Nieto-Cid M., Sintes E., Dobal-Amador V., Hernando-Morales V., Alvarez M., et al. (2016). Optical Properties of Dissolved Organic Matter Relate to Different Depth-Specific Patterns of Archaeal and Bacterial Community Structure in the North Atlantic Ocean. FEMS Microbiol. Ecol. 93. doi: 10.1093/femsec/fiw224
Hanson N. W., Knowar K. M., Hawley A. K., Altman T., Karp P. D., Hallam S. J. (2014). Metabolic Pathways for the Whole Community. BMC Genomics 15, 1–14. doi: 10.1186/1471-2164-15-619
Hardie D.G. (2018). Keeping the Home Fires Burning: AMP-Activated Protein Kinase. J. R. Soc. Interf. 15, 1–23. doi: 10.1098/rsif.2017.0774
Hatzenpichler R. (2012). Diversity, Physiology, and Niche Differentiation of Ammonia-Oxidizing Archaea. Appl. Environ. Microbiol. 78, 1–10. doi: 10.1128/AEM.01960-12
Hawley A. K., Brewer H. M., Norbeck A. D., Pasa-Tolic L., Hallam S. J. (2014). Metaproteomics Reveals Differential Modes of Metabolic Coupling Among Ubiquitous Oxygen Minimum Zone Microbes. Proc. Natl. Acad. Sci. U. S. A. 111, 11395–11400. doi: 10.1073/pnas.1322132111
Hawley A. K., Nobu M. K., Wright J. J., Durno E., Morgan-Lang C., Sage B., et al. (2017a). Diverse Marinimicrobia Bacteria May Mediate Coupled Biogeochemical Cycles Along Eco-Thermodynamic Gradients. Nat. Commun. 8, 1–10. doi: 10.1038/s41467-017-01376-9
Hawley A. K., Torres-Beltran M., Zaikova E., Walsh A. D., Mueller A., Scofield M., et al. (2017). A Compendium of Multi-Omic Sequence Information From the Saanich Inlet Water Column. Sci. Data 4, 1–11. doi: 10.1038/sdata.2017.160
Heidelberg K. B., Gilbert J. A., Joint I. (2010). Marine Genomics: at the Interface of Marine Microbial Ecology and Biodiversity. Microb. Biotechnol. 3, 531–543. doi: 10.1111/j.1751-7915.2010.00193.x
Hewson I., Eggleston E. M., Doherty M., Lee D. Y., Owens M., Shapleigh J. P., et al. (2014). Metatranscriptomic Analysis of Plankton Communities Inhabiting Surface and Subpycnocline Waters of the Chesapeake Bay During Oxic-Anoxi-Oxic Transitions. Appl. Environ. Microb. 80, 328–338. doi: 10.1128/AEM.02680-13
Howard E. M., Durkin C. A., Hennon G. M. M., Ribalet R., Stanley R. H. R. (2017). Biological Production, Export Efficientcy, and Phytoplankton Communities Across 8000 Km of the South Atlantic. Global Biogeochem. Cycles 31, 1066–1088. doi: 10.1002/2016GB005488
Hutchins D. A., Fu F. (2017). Microorganisms and Ocean Global Change. Nat. Microbiol. 2, 1–11. doi: 10.1038/nmicrobiol.2017.58
Huynen M. A., Dandekar T., Bork P. (1999). Variation and Evolution of the Citric-Acid Cycle: A Genomic Perspective. Trends Microbiol. 7, 281–291. doi: 10.1016/S0966-842X(99)01539-5
Ibarbalz F. M., Henry N., Brandao M. C., Martini S., Busseni G. (2019). Global Trends in Marine Plankton Diversity Across Kingdoms of Life. Cell 179, 1084–1097. doi: 10.1016/j.cell.2019.10.008
Jing H., Xia X., Suzuki K., Liu H. (2013). Vertical Profiles of Bacteria in the Tropical and Subarctic Oceans Revealed by Pyrosequencing. PloS One 8, 1–10. doi: 10.1371/journal.pone.0079423
Johnson W. M., Longnecker K., Kido Soule M. C., Arnold W. A., Bhatia M. P., Hallam S. J., et al. (2020). Metabolite Composition of Sinking Particles Differs From Surface Suspended Particles Across a Latidunial Transect in the South Atlantic. Limnol. Oceanogr. 65, 111–127. doi: 10.1002/lno.11255
Jones H. J., Krober E., Stephenson J., Mausz M. A., Jameson E., Milard A., et al. (2019). A New Family of Uncultivated Bacteria Involved in Methanogenesis From the Ubiquitous Osmolyte Glycine Betaine in Cpastal Saltmarsh Sediments. Microbiome 7, 1–11. doi: 10.1186/s40168-019-0732-4
Karp P. D., Latendresse M., Caspi R. 2010. The Pathway Tools Pathway Prediction Algorithm. Stand. Genomic. Sci. 31, 424–429. doi: 10.4056/sigs.1794338
Karp P. D., Riley M., Paley S. M., Pellegrini-Toole A. (2002). The Metacyc Database. Nucleic Acids Res. 30, 59–61. doi: 10.1093/nar/30.1.59
Kassambara A., Mundt F. (2017). Factoextra: Extract and Visualize the Results of Multivariate Data Analyses. R Package Version 1.0.5. Available at: https://CRAN.R-project.org/package=factoextra.
Kido Soule M. C., Longnecker K., Johnson W. M., Kujawinski E. B. (2015). Environmental Metabolomics: Analytical Strategies. Mar. Chem. 177, 374–387. doi: 10.1016/j.marchem.2015.06.029
Kieft B., Li Z., Bryson S., Hettich R. L., Pan C., Mayali X., et al. (2021). Phytoplankton Exudates and Lysates Support Distinct Microbial Consortia With Specialized Metabolic and Ecophysiological Traits. Proc. Natl. Acad. Sci. U. S. A. 118, 1–12. doi: 10.1073/pnas.2101178118
Kiene R. P., Linn L. J., Bruton J. A. (2000). New and Important Roles for DMSP in Marine Microbial Communities. J. Sea. Res. 43, 209–224. doi: 10.1016/S1385-1101(00)00023-X
Kirchman D. L. (2018). Microbial Proteins for Organic Matter Degradation in the Deep Ocean. Proc. Natl. Acad. Sci. U. S. A. 3, 445–447. doi: 10.1073/pnas.1720765115
Konwar K. M., Hanson N. W., Bhatia M. P., Kim D., Wu S. J., Hahn A. S., et al. (2015). MetaPathways V2.5: Quantitative Functional. Taxonomic and Usability Improvements. Bioinformatics 31, 3345–3347. doi: 10.1093/bioinformatics/btv361
Konwar K. M., Hanson N. W., Page A. P., Hallam S. J. (2013). MetaPathways: A Modular Pipeline for Constructing Pathway/Genome Databases From Environmental Sequence Information. BMC Bioinform. 14, 202. doi: 10.1186/1471-2105-14-202
Kujawinski E. B., Longnecker K., Alexander H., Dyhrman S. T., Fiore C. L., Haley S. T., et al. (2017). Phosphorus Availability Regulates Intracellular Nucleotides in Marine Eukaryotic Phytoplankton. Limnol. Oceanogr. Lett. 2, 119–129. doi: 10.1002/lol2.10043
Landry Z., Swan B. K., Herndl G. J., Stepanauskas R., Giovannoni S. J. (2017). SAR202 Genomes From the Dark Ocean Predict Pathways for the Oxidation of Recalcitrant Dissolved Organic Matter. Am. Soc. Microbiol. 8, 1–19. doi: 10.1128/mBio.00413-17
Lekunberri I., Sintes E., De Corte D., Yokokawa T., Herndl G. J. (2013). Spatial Patterns of Bacterial and Archaeal Communities Along the Romanche Fracture Zone (Tropical Atlantic). FEMS Microbiol. 85, 537–552. doi: 10.1111/1574-6941.12142
Liang B., Wang L. Y., Mbadinga S. M., Liu J. F., Yang S. Z., Gu J. D., et al. (2015). Anaerolineaceae and Methanosaeta Turned to be the Dominant Microorganisms in Alkanes-Dependent Methanogenic Culture After Long Term of Incubation. AMB Express 5 , 1–13. doi: 10.1186/s13568-015-0117-410.1186/s13568-015-0117-4
Liechti G., Goldberg J. B. (2011). Helicobacter Pylori Relies Primarily on the Purine Salvage Purine Nucleotide Biosynthesis. J. Bacteriol. Res. 194, 839–854. doi: 10.1128/JB.05757-11
Liu J., Liu J., Zhang S. H., Lin H., Song D., Yang G. P., et al. (2018). Novel Insights Into Bacterial Dimethylsulfoniopropionate Catabolism in the East China Sea. Front. Microbiol. 9. doi: 10.3389/fmicb.2018.032069:doi.org/10.3389/fmicb.2018.03206
Liu M., Tanhua T. (2019). Characteristics of Water Masses in the Atlantic Ocean Based on GLODAPv2 Data. Ocean Sci. Discuss. 17, 463–486. doi: 10.5194/os-2018-139
Longnecker K. (2015). Dissolved Organic Matter in Newly Formed Sea Ice and Surface Seawater. Geochim. Cosmochim. Acta 171, 39–49. doi: 10.1016/j.gca.2015.08.014
Louca S., Polz M. F., Mazel F., Albright M. B.N., Huber J. A., O'Connor M. I., et al (2018). Function and Functional Redundancy in Microbial Systems. Nat. Evol. Ecol. 2, 936–943.
Louca S., Parfrey L. W., Doebelo M. (2016). Decoupling Function and Taxonomy in the Global Ocean Microbiome. Science 353, 1272–1277. doi: 10.1126/science.aaf4507
Louca S., Polz M. F., Mazel F., Albright M. B. N., Huber J. A., O'Connor M. I., et al. (2018). Function and Functional Redundancy in Microbial Systems. Nat. Evol. Ecol. 2, 936–943. doi: 10.1038/s41559-018-0519-1
Makarova K. S., Koonin E. V. (2003). Filling a Gap in the Central Metabolism of Archaea: Prediction of a Novel Aconitase by Comparative Genomic Analysis. FEMS Microbiol. Lett. 227, 17–23. doi: 10.1016/S0378-1097(03)00596-2
McCarren J., Becker J. W., Repeta D. J., Shi Y., Ypung C. R., Malmstrom R. R., et al. (2010). Microbial Community Transcriptomes Reveal Microbes and Metabolic Pathways Associated With Dissolved Organic Matter Turnover in the Sea. Proc. Natl. Acad. Sci. U. S. A. 107, 16420–16427. doi: 10.1073/pnas.1010732107
Medina-Silva R., de Oliveira R. R., Pivel M. A. G., Borges L. G. A., Simao T. L. L., Pereira L. M., et al. (2018). Microbial Diversity From Chlorophyll Maximum, Oxygen Minimum and Bottom Zones in the South Western Atlantic Ocean. J. Mar. Syst. 178, 52–61. doi: 10.1016/j.jmarsys.2017.10.008
Mehrshad M., Rodriguez-Valera F., Amoozegar M. A., Lopez-Garcia P., Ghai R. (2018). The Enigmatic SAR202 Cluster Up Close: Shedding Light on a Globally Distributed Dark Ocean Lineage Involved With Sulfur Cycling. ISME J. 12, 655–668. doi: 10.1038/s41396-017-0009-5
Melamud E., Vastag L., Rabinowitz J. D. (2010). Metabolomic Analysis and Visualization Engine for LC-MS Data. Anal. Chem. 82, 9818–9826. doi: 10.1021/ac1021166
Mende D. R., Boeuf D., DeLong E. F. (2019). Persistent Core Populations Shape the Microbiome Throughout the Water Column in the North Pacific Subtropical Gyre. Front. Microbiol. 10, 1–12. doi: 10.3389/fmicb.2019.02273
Mende D. R., Bryant J. A., Aylward F. O., Eppley J. M., Nielsen T., Karl D. M., et al. (2017). Environmental Drivers of a Microbial Genomic Transition Zone in the Ocean’s Interior. Nat. Microbiol. 2, 1367–1373. doi: 10.1038/s41564-017-0008-3
Meyer K. M., Ridgewell A., Payne J. L. (2016). The Influence of the Biological Pump on Ocean Chemistry: Implications for Long-Term Trends in Marine Redox Chemistry, the Global Carbon Cycle and Marine Animal Ecosystems. Geobiology 14, 207–219. doi: 10.1111/gbi.12176
Milici M., Deng Z. L., Tomasch J., Decelle J., Wos-Oxley M. L., Wang H., et al. (2016a). Co-Occurrence Analysis of Microbial Taxa in the Atlantic Ocean Reveals High Connectivity in the Free Living Bacterioplankton. Front. Microbiol. 7, 1*20. doi: 10.3389/fmicb.2016.00649
Milici M., Tomasch J., Wos-Oxley M. L., Decelle J., Jauregui R., Wang H., et al. (2016b). Bacterioplankton Biogeography of the Atlantic Ocean: A Case Study of the Distance-Decay Relationship. Front. Microbiol. 7, 1–15. doi: 10.3389/fmicb.2016.00590
Milici M., Vital M., Tomasch J., Badewein T. H., Giebel H. A., Plumeier I., et al. (2017). Diversity and Community Composition of Particle-Associated and Free-Living Bacteria in Mesopelagic and Bathypelagic Southern Ocean Water Masses: Evidence of Dispersal Limitation in the Bransfield Strait. Limnol. Oceanogr. 62, 1080–1095. doi: 10.1002/lno.10487
Moran M. A., Kujawinski E. B., Stubbins A., Fatland R., Lihini I., Buchan A., et al. (2016). Deciphering Ocean Carbon in a Changing World. Proc. Natl. Acad. Sci. U. S. A. 113, 3143–3151. doi: 10.1073/pnas.1514645113
Moran M. A., Reisch C. R., Kiene R. P., Whitman W. B. (2012). Genomic Insights Into Bacterial DMSP Transformations. Ann. Rev. Mar. Sci. 4, 523–542. doi: 10.1146/annurev-marine-120710-100827
Morris R. M., Rappé M. S., Urbach E., Connon S. A., Giovannoni S. J. (2004). Prevalence of the Chloroflexi-Related SAR202 Bacterioplankton Cluster Throughout the Mesopelagic Zone and Deep Ocean. Appl. Environ. Microbiol. 70, 2836–2842. doi: 10.1128/AEM.70.5.2836-2842.2004
Mu D. S., Wang S., Liang Q. Y., Du Z. Z., Tian R., Ouyang Y., et al (2020). Bradymonabacteria, a Novel Bacterial Predator Group With Versatile Survival Strategies in Saline Environments. Microbiome 8, 1–15. doi: 10.1186/s40168-020-00902-0
Mühlenbruch M., Grossart H. P., Eigemann F., Voss M. (2018). Mini-Review: Phytoplankton-Derived Polysaccharides in the Marine Environment and Their Interactions With Heterotrophic Bacteria. Environ. Microbiol. 20, 2671–2685. doi: 10.1111/1462-2920.14302
Nie L., Ren Y., Schultz H. (2008). Identification and Characterization of Escherichia Coli Thioesterase III That Functions in Fatty Acid Beta-Oxidation. Biochemistry 47, 7744–7751. doi: 10.1021/bi800595f
North J. A., Miller A. R., Wildenthal J. A., Young S. J., Tabita F. R. (2017). Microbial Pathway for Anaerobic 5’-Methylthioadenosine Metabolism Coupled to Ethylene Formation. Proc. Natl. Acad. Sci. U. S. A. 114, E10455–E10464. doi: 10.1073/pnas.1711625114PNASdoi.org/10.1073/pnas.1711625114
Oksanen J., Guillaume F. B., Friendly M., Kindt R., Legendre P., McGlinn D., et al. (2019). Vegan: Community Ecology Package. R Package Version 2.5-5. Available at: https://CRAN.R-project.org/package=veganhttps://CRAN.R-project.org/package=vegan.
Parada A., Needham D. M., Furhman J. A. (2015). Every Base Matters: Assessing Small Subunit rRNA Primers for Marine Microbiomes With Mock Communities, Time-Series and Global Field Samples. Environ. Microbiol. 18, 1403–1414. doi: 10.1111/1462-2920.13023
Paul K., Nonoh J. O., Mikulski L., Brune A. (2012). “Methanoplasmatales”, Thermoplasmatales-Related Archaea in Termite Guts and Other Environments, are the Seventh Order of Methanogens. Am. Soc. Microbiol. 78, 8245–8253. doi: 10.1128/AEM.02193-12
Pedler B. E., Aluwihare L. I., Azam F. (2014). Single Bacterial Strain Capable of Significant Contribution to Carbon Cycling in the Surface Ocean. Proc. Natl. Acad. Sci. U. S. A. 20, 7202–7207. doi: 10.1073/pnas.1401887111
Pernice M. C., Giner C. R., Logares R., Perera-Bel J., Acinas S. G., Duarte C. M., et al. (2016). Large Variability of Bathypelagic Microbial Eukaryotic Communities Across the World’s Oceans. ISME J. 10, 945–958. doi: 10.1038/ismej.2015.170
Pester M., Schleper C., Wagner M. (2011). The Thaumarchaeota: An Emerging View of Their Phylogeny and Ecophysiology. Curr. Open in. Microbiol. 14, 300–306. doi: 10.1016/j.mib.2011.04.007
Poff K. E., Leu A. O., Eppley J. M., Karl D. M., DeLong E. F. (2021). Microbial Dynamics of Elevated Carbon Flux in the Open Ocean’s Abyss. Proc. Natl. Acad. Sci. U. S. A. 118, 1–11. doi: 10.1073/pnas.2018269118
Pruesse E., Quast C., Knittel K., Fuchs B. M., Ludwig W., Peplies J., et al. (2007). SILVA: A Comprehensive Online Resource for Quality Checked and Aligned Ribosomal RNA Sequence Data Compatible With ARB. Nucleic Acids Res. 35, 7188–7196. doi: 10.1093/nar/gkm864
Raes J., Letunic I., Yamada T., Jensen L. J., Bork P. (2011). Toward Molecular Trait-Based Ecology Through Integration of Biogeochemical, Geographical and Metagenomic Data. Mol. Syst. Biol. 7, 473–482. doi: 10.1038/msb.2011.6
Reed D. C., Algar C. K., Huber J. A., Dick G. J. (2014). Gene-Centric Approach to Integrating Environmental Genomics and Biogeochemical Models. Proc. Natl. Acad. Sci. U. S. A. 111, 1879–1884. doi: 10.1073/pnas.1313713111
Reinthaler T., Salgadom X. A. A., Alvarez M., van Aken H. M., Herndl G. J. (2013). Impact of Water Mass Mixing on the Biogeochemistry and Microbiology of the Northeast Atlantic Deep Water. Global Biogeochem. Cycles 27, 1151–1162. doi: 10.1002/2013GB004634
Richardson K., Bendtsen J. (2017). Photosynthetic Oxygen Production in a Warmer Ocean: The Sargasso Sea as a Case Study. Philos. Trans. R. Soc. A. 375, 1–22. doi: 10.1098/rsta.2016.0329
Richter A. A., Mais C. N., Czech L., Geyer K., Hoeppner A., Smits S. H. J., et al. (2019). Biosynthesis of the Stress-Protectant and Chemical Chaperon Ectoine: Biochemistry of the Transaminase EctB. Front. Microbiol. 10, 2811. doi: 10.3389/fmicb.2019.02811
Roberts D. W. (2019). Labdsv: Ordination and Multivariate Analysis for Ecology. R Package Version 2.0-1. Available at: https://CRAN.R-project.org/package=labdsv.
Robinson C. (2019). Microbial Respiration, the Engine of Ocean Deoxygenation. Front. Mar. Sci. 5. doi: 10.3389/fmars.2018.00533
Salazar G., Cornejo-Castillo F. M., Barrios-Benitez V., Fraile-Nuez E., Alvarez-Salgado X. A., Duarte C. M., et al. (2016). Global Diversity and Biogeography of Deep-Sea Pelagic Prokaryotes. ISME J. 10, 596–608. doi: 10.1038/ismej.2015.137
Salazar G., Paoli L., Alberti A., Huerta-Cepas J., Ruscheweyh H. J., Cuenca M., et al. (2019). Gene Expression Changes and Community Turnover Differentially Shape the Global Ocean Metatranscriptome. Cell 179, 1068–1083. doi: 10.1016/j.cell.2019.10.014
Salih B., Celikbicak O. (2012). “Chapter Five: Application of Gas Chromatography in a Study of Marine Biogeochemistry,” in Gas Chromatography: Biochemicals, Narcotics and Essential Oils (InTechOpen Book Series). doi: 10.5772/32318
Santoro A. E., Casciotti K. L., Francis C. A. (2010). Activity, Abundance, and Diversity of Nitrifying Archaea and Bacteria in the Central California Current. Environ. Microbiol. 12, 1989–2006. doi: 10.1111/j.1462-2920.2010.02205.x
Santoro A. E., Saito M. A., Goepfert T. J., Lamborg C. H., Dupont C. L., DiTullio G. R. (2017). Thaumarchaeal Ecotype Distributions Across the Equatorial Pacific Ocean and Their Potential Roles in Nitrification and Sinking Flux Attenuation. Limnol. Oceanogr. 62, 1984–2003. doi: 10.1002/lno.10547
Satinsky B. M., Smith C. B., Sharma S., Landa M., Medeiros P. M., COles V. J., et al. (2017). Expression Patterns of Elemental Cycling Genes in the Amazon River Plume. ISME J. 11, 1852–1864. doi: 10.1038/ismej.2017.46
Saw J. H. W., Nunoura T., Hirai M., Takaki Y., Parsons R., Michelsen M., et al. (2020). Pangenomics Analysis Reveals Diversification of Enzyme Families and Niche Specialization in Globally Abundant SAR202 Bacteria. mBio. 11, 1–18. doi: 10.1128/mBio.02975-19
Sheik C. S., Jain S., Dick G. J. (2013). Metabolic Flexibility of Enigmatic SAR324 Revealed Through Metagenomics and Metatranscriptomics. Environ. Microbiol. 16, 304–317. doi: 10.1111/1462-2920.12165
Shi Y., Tyson G. W., Eppley J. M., DeLong E. F. (2011). Integrated Metatranscriptomic and Metagenomic Analyses of Stratified Microbial Communities in the Open Ocean. ISME J. 5, 999–1013. doi: 10.1038/ismej.2010.189
Steiner P. A., Javier G., Fadeev E., Obiol A., Sintes E., Rattei T., et al. (2020). Functional Seasonality of Free-Living and Particle-Associated Prokaryotic Communities in the Coastal Adriatic Sea. Front. Microbiol., 11, 1–18. doi: 10.3389/fmicb.2020.584222
Sunagawa S., Coelho L. P., Chaffron S., Kultima J. R., Labadie K., Salazar G., et al. (2015). Structure and Function of the Global Ocean Microbiome. Science 348, 1261359–1261359. doi: 10.1126/science.1261359
Swan B. K., Chaffin M. D., Martinez-Garcia M., Morrison H. G., Field E. K., Poulton N. J., et al. (2014). Genomic and Metabolic Diversity of Marine Group I and Taumarchaeota in the Mesopelagic of Two Suptropical Gyres. PloS One 9, e95380. doi: 10.1371/journal.pone.0095380
Swan B. K., Martinez-Garcia M., Preston C. M., Sczyrba A., Woyke T., Lamy D., et al. (2011). Potential for Chemolithoautotrophy Among Ubiquitous Bacteria Lineages in the Dark Ocean. Science 333, 1296–1299. doi: 10.1126/science.1203690
Tas N., de Jong A. E. E., Li Y., Trubl G., Xue Y., Dove N. C. (2021). Metagenomic Tools in Microbial Ecology Research. Curr. Opin. 67, 184–191. doi: 10.1016/j.copbio.2021.01.019
Tremblay J., Singh K., Fern A., Kirton E. S., He S., Woyke T., et al. (2015). Primer and Platform Effects on 16S rRNA Tag Sequencing. Front. Microbiol. 6, 771. doi: 10.3389/fmicb.2015.00771
Tringe E. M., Rubin E. M. (2005). Metagenomics: DNA Sequencing of Environmental Samples. Nat. Rev. Genet. 6, 805–814. doi: 10.1038/nrg1709
Varliero G., Bienhold C., Schmid F., Boetius A., Molari M. (2019). Microbial Diversity and Connectivity in Deep-Sea Sediments of the South Atlantic Polar Front. Front. Microbiol. 10, 665. doi: 10.3389/fmicb.2019.00665
Varona H. L., Veleda D., Silva M., Cintra M., Araujo M. (2019). Amazon River Plume Influence on Western Tropical Atlantic Dynamic Variability. Dyn. Atmos. Oceans 85, 1–15. doi: 10.1016/j.dynatmoce.2018.10.002
Veech J. A. (2013). A Probalistic Model for Analysing Species Co-Occurrence. Global Ecol. Biogeogr. 22, 252–260. doi: 10.1111/j.1466-8238.2012.00789.x
Vetriani C., Jannasch H. W., MacGregor B. J., Stahl D. A., Reysenbach A. L. (1999). Population Structure and Phylogenetic Characterization of Marine Benthic Archaea in Deep Sea Sediments. Am. Soc. Microbiol. 65, 4375–4384. doi: 10.1128/AEM.65.10.4375-4384.1999
Voss M., Bange H. W., Dippner J. W., Middelburg J. J., Montoya J. P., Ward B. (2013). The Marine Nitrogen Cycle: Recent Discoveries, Uncertainties and the Potential Relevance of Climate Change. Philos. Trans. R. Soc Lond. B, Biol. Sci. 368, 1–11. doi: 10.1098/rstb.2013.0121
Wang L. C., Jin F. F., Wu C. R., Hsu H. H. (2017). Dynamics of Upwelling Annual Cycle in the Equatorial Atlantic Ocean. Geophys. Res. Lett. 44, 3736–3743. doi: 10.1002/2017GL072588
Wang Y., Liao S., Gai Y., Liu G., Jin T., Gram L., et al. (2021). Metagenomic Analysis Reveals Microbial Community Structure and Metabolic Potential for Nitrogen Acquisition in the Oligotrophic Surface Water of the Indian Ocean. Front. Microbiol. 12, 1–13. doi: 10.3389/fmicb.2021.518865
Wickham H. (2016). Ggplot2: Elegant Graphics for Data Analysis (Germany: Springer International Publishing).
Willis C., Desai D., LaRoche J. (2019). Influence of 16srRNA Variable Region on Perceived Diversity of Marine Micorbial Communities of the Northern North Atlantic. FEMS Microbiol. Lett. 366, 1–19. doi: 10.1093/femsle/fnz152
Wright J. J., Konwar K. M., Hallam S. J. (2012). Microbial Ecology of Expanding Oxygen Minimum Zones. Nat. Rev. Microbiol. 10, 381–394. doi: 10.1038/nrmicro2778
Wright J. J., Mewis K., Hanson N. W., Konwar K., Maas K. R., Hallam S. J., et al (2014). Genomic Properties of Marine Group A Bacteria Indicate a Role in the Marine Sulfur Cycle. ISME J. 8, 455–468. doi: 10.1038/ismej.2013.152
Wright T. D., Vergin K. L., Boyd P. W., Giovannoni S. J. (1997). A Novel Delta-Subdivision Proteobacterial Lineage From the Lower Ocean Surface Layer. Appl. Environ. Microbiol. 63, 1441–1448. doi: 10.1128/aem.63.4.1441-1448.1997
Wu J., Gao W., Johnson R. H., Zhang W., Meldrum D. R. (2013). Integrated Metagenomic and Metatranscriptomic Analyses of Microbial Communities in the Meso and Bathypelagic Realm of North Pacific Ocean. Mar. Drugs 11, 3777–3801. doi: 10.3390/md11103777
Yoch D. C. (2002). Dimethylsulfoniopropionate: Its Sources, Role in the Marine Food Web, and Biologicla Degradation to Dimethylsulfide. Appl. Environ. Microbiol. 68, 5804–5815. doi: 10.1128/AEM.68.12.5804-5815.2002
Zaikova E., Walsh D. A., Stilwell C. P., Mohn W. W., Tortell P. D., Hallam S. J. (2010). Microbial Community Dynamics in a Seasonally Anoxic Fjord: Saanich Inlet, British Columbia. Environ. Microbiol. 12, 172–191. doi: 10.1111/j.1462-2920.2009.02058.x
Zehr J. P., Robidart J., Scholin C. (2011). Marine Microorganisms, Biogeochemical Cycles, and Global Climate Change. Microbe Mag. 6, 169–175. doi: 10.1128/microbe.6.169.1
Zhang H., Ning K. (2015). The Tara Oceans Project: New Opportunities and Greater Challenges Ahead. Genomics Proteomics Bioinformatics 13, 275–277. doi: 10.1016/j.gpb.2015.08.003
Zhang C. L., Xie W., Martin-Cuadrado A. B., Rodriguez-Valera F. (2015). Marine Group II Archaea, Potentially Important Players in the Global Ocean Carbon Cycle. Front. Microbiol. 6, 1108. doi: 10.3389/fmickb.2015.01108
Zinger L., Amaral-Zettler L. A., Furhman J. A., Horner-Devine C., Huse S. M., Welch D. B. M., et al. (2011). Global Patterns of Bacterial Beta-Diversity in Seafloor and Seawater Ecosystems. PloS One 6, 1–11. doi: 10.1371/journal.pone.0024570
Zinger L., Boetius A., Ramette A. (2013). Bacterial Taxa-Area and Distance-Decay Relationships in Marine Environments. Mol. Ecol. 23, 954–964. doi: 10.1111/mec.12640
Zorz J., Willis C., Comeau A. M., Langille M. G., Johnson C. L., Li W. K. W., et al. (2019). Drivers of Regional Bacterial Community Structure and Diversity in the Northwest Atlantic Ocean. Front. Microbiol. 10, 281. doi: 10.3389/fmicb.2019.00281
Keywords: marine microbiology, metagenomics, metatranscriptomics, metabolites, Atlantic Ocean, biogeochemistry, metabolic pathways, functional redundancy
Citation: Cavaco MA, Bhatia MP, Hawley AK, Torres-Beltrán M, Johnson WM, Longnecker K, Konwar K, Kujawinski EB and Hallam SJ (2022) Pathway-Centric Analysis of Microbial Metabolic Potential and Expression Along Nutrient and Energy Gradients in the Western Atlantic Ocean. Front. Mar. Sci. 9:867310. doi: 10.3389/fmars.2022.867310
Received: 31 January 2022; Accepted: 28 March 2022;
Published: 19 May 2022.
Edited by:
Hao Chen, Institute of Oceanology (CAS), ChinaReviewed by:
Luke R. Thompson, Atlantic Oceanographic and Meteorological Laboratory (NOAA), United StatesShunichi Ishii, Japan Agency for Marine-Earth Science and Technology (JAMSTEC), Japan
Mingyang Niu, Shanghai Jiao Tong University, China
Copyright © 2022 Cavaco, Bhatia, Hawley, Torres-Beltrán, Johnson, Longnecker, Konwar, Kujawinski and Hallam. This is an open-access article distributed under the terms of the Creative Commons Attribution License (CC BY). The use, distribution or reproduction in other forums is permitted, provided the original author(s) and the copyright owner(s) are credited and that the original publication in this journal is cited, in accordance with accepted academic practice. No use, distribution or reproduction is permitted which does not comply with these terms.
*Correspondence: Maria A. Cavaco, cavaco@ualberta.ca; Maya P. Bhatia, mbhatia@ualberta.ca