A novel multi-dimensional reliability approach for floating wind turbines under power production conditions
 Xiaosen Xu1
  Yihan Xing2*
  Oleg Gaidai3*
  Kelin Wang3 Karan Sandipkumar Patel2 Peng Dou4 Zhongyu Zhang1
- 1Marine Equipment and Technology Institute, Jiangsu University of Science and Technology, Zhenjiang, China
- 2Department of Mechanical and Structutral Engineering and Materials Science, University of Stavanger, Stavanger, Norway
- 3Shanghai Engineering Research Center of Marine Renewable Energy, College of Engineering Science and Technology, Shanghai Ocean University, Shanghai, China
- 4Department of Naval Architecture and Ocean Engineering, Jiangsu University of Science and Technology, Zhenjiang, China
Floating offshore wind turbines (FOWT) generate green renewable energy and are a vital part of the modern offshore wind energy industry. Robust predicting extreme offshore loads during FOWT operations is an important safety concern. Excessive structural bending moments may occur during certain sea conditions, posing an operational risk of structural damage. This paper uses the FAST code to analyze offshore wind turbine structural loads due to environmental loads acting on a specific FOWT under actual local environmental conditions. The work proposes a unique Gaidai-Fu-Xing structural reliability approach that is probably best suited for multi-dimensional structural responses that have been simulated or measured over a long period to produce relatively large ergodic time series. In the context of numerical simulation, unlike existing reliability approaches, the novel methodology does not need to re-start simulation again each time the system fails. As shown in this work, an accurate forecast of the probability of system failure can be made using measured structural response. Furthermore, traditional reliability techniques cannot effectively deal with large dimensionality systems and cross-correction across multiple dimensions. The paper aims to establish a state-of-the-art method for extracting essential information concerning extreme responses of the FOWT through simulated time-history data. Three key components of structural loads are analyzed, including the blade-root out-of-plane bending moment, tower fore-aft bending moment, and mooring line tension. The approach suggested in this study allows predicting failure probability efficiently for a non-linear multi-dimensional dynamic system as a whole.
Introduction
The wind is a free and environmentally friendly energy source with the ability to meet the world’s growing energy demand. Offshore wind turbines are driving a global revolution in renewable energy generation, with more and more offshore wind farms being developed on the continental shelf in recent years. The wind speeds are often high in an offshore region as compared to onshore, so the offshore wind energy contribution in terms of electricity supplied is of substantial industrial importance. Higher wind speeds are usually associated with lower ocean surface roughness. Offshore wind turbine design has undoubtedly been vital for effective wind energy generation. FOWTs are continuously exposed to stochastic wind and wave loads; therefore, extreme load characteristics are crucial for FOWT operation and design in such conditions (Graf et al., 2018; Li et al., 2018; Xu et al., 2018; Xu et al., 2020; Chen et al., 2021; Xu et al., 2021).
The reliability analysis of the offshore wind turbine obtained from the dynamic analysis is significant. Generally, the majority of the research work focuses on simulating turbine responses and extrapolating the loads by fitting a probability distribution to a given return period extremes, which is recommended by IEC recommendations (Jonkman and Buhl, 2006; International Electrotechnical Commission, 2009; Numerical Algorithms Group, 2010; Hall, 2015; Dimitrov, 2016; International Electrotechnical Commission, 2019; Xu et al., 2021; Cheng et al., 2022; Zhao and Dong, 2022). The limitation of the aforementioned methods only considers univariate or bivariate responses of the FOWT wind turbine. However, a thorough understanding of the multi-dimensional responses of the FOWT is fundamental to minimizing the fault rate, enhancing the service life, and reducing the cost of energy (COE).
Several studies have been performed recently to analyze the reliability of offshore wind turbines. Yang et al. (2021) investigated the dynamic responses of a 10 MW multi-object FOWT subjected to tendon failures, and they found that the influence of tendon breakages was only important on the local pitch and coupled-pitch modes of the platform. Kang et al. (2019) applied the fault tree analysis method to qualitatively and quantitatively evaluate the failure characteristics of a semi-submersible FOWT. Li et al. (2020a) determined the failure probability of the FOWT by Bayesian Network, and the results showed more conformity compared with the fault tree analysis. A two-stage Failure Mode and Effect Analysis (FMEA) was proposed by Li et al. (2020b) to reduce the uncertainty of FMEA results. Rostam-Alilou et al. (2022) also applied the Bayesian Network to predict the relationships and interactions among the dynamic responses of FOWT, which could be used to improve the structural stability of the FOWT. Zhao and Dong (2021) investigated the long-term system reliability for semi-submersible platform mooring structures, and the proposed method was shown to be effective compared with traditional environmental contour methods. Sheng and Hong (2021) accessed the fragility and reliability of FOWTs subjected to tropical cyclone hazards. It showed that the tower buckling dominates the component failure probability. Zhang et al. (2022) investigated the effects of mooring line failure of a semi-submersible FOWT, including gearbox analysis, and the results revealed relatively small changes in the internal gear forces. Ghane et al. (2018) used statistical fault diagnosis to evaluate the condition of the bearing by the main bearing and nacelle axial acceleration. Li et al. (2019) investigated the effects of the wind shear, the turbulence intensity, and the coherence structure on the global responses of the FOWT, and the result showed that FOWT was quite sensitive to the turbulence intensity. Moan et al. (2020) reviewed recent improvements in integrated response analysis of FOWTs. Perdrizet and Averbuch (2011) exemplified an efficient way to assess the short and long-term extreme reliability of the FOWT. Li et al. (2019) presented a modified environmental counter method and applied it to predict the extreme responses of the FOWT.
The advantage of the proposed method is that it takes the multi-dimensional dynamics of the system as a whole to evaluate the reliability of the FOWT, which the aforementioned studies cannot handle. The aero-hydro-servo-elastic simulation tool, OpenFAST, was utilised to analyze the dynamic responses of a site-specific FOWT. In particular, three critical loads were analyzed for the system reliability analysis, including the blade-root out-of-plane bending moments, tower base fore-aft bending moments, and mooring line tensions. Figure 1 presents the general schematic view of the target 5MW semi-submersible FOWT.
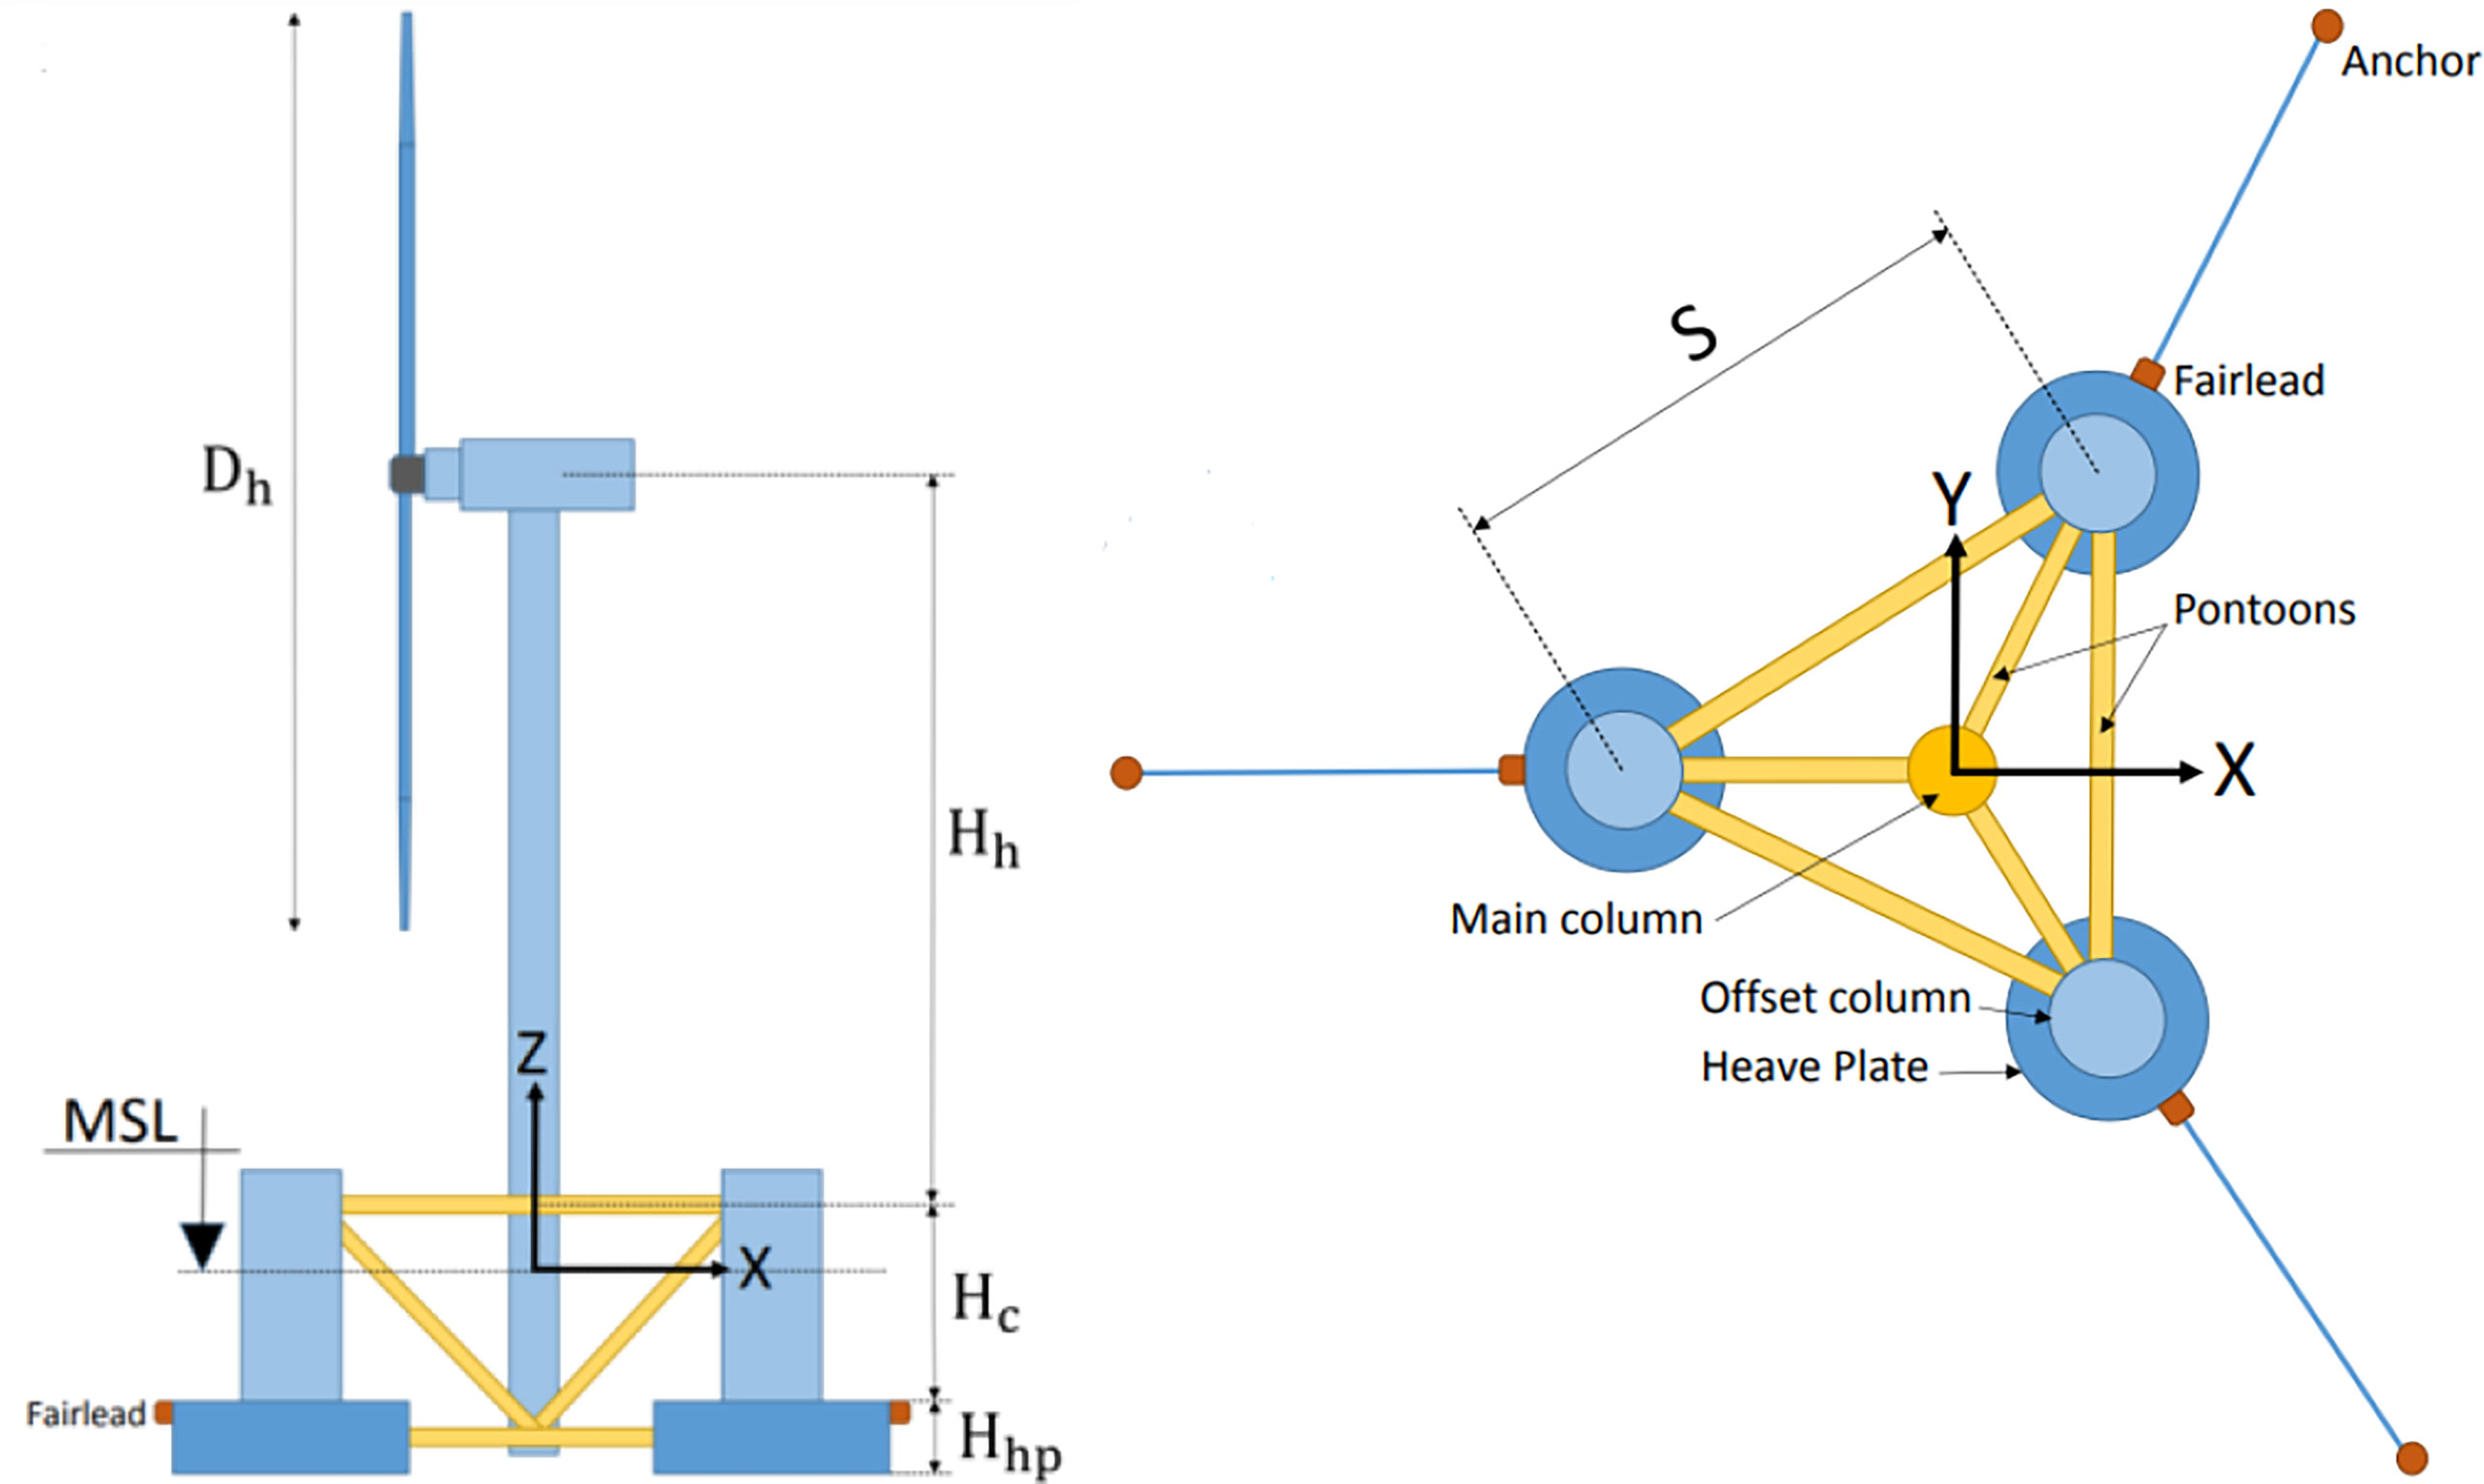
Figure 1 General schematic view of the DeepCwind semi-submersible FOWT. Left: Side view; Right: Top view (Head et al., 2016).
This study aims to enhance the efficiency of any simulated or measured data. The novel reliability method (referred to as the Gaidai-Fu-Xing method in the following sections) was adopted for that purpose. The available structural load statistics are combined with a suitable class of parametric functions for describing the tail behavior of the extreme value distribution. Next, a comprehensive procedure for estimating extreme values is obtained, not based on purely asymptotic distribution assumptions; the latter is a distinctive feature in classically used methods like Gumbel, Pareto, Weibull, and Peak over threshold.
This paper applies the proposed novel multi-dimensional reliability method to consider three critical responses of a semi-submersible FOWT: blade-root out-of-plane bending moment, tower fore-aft bending moment, and mooring line tension. These three loads are the most dominating loads and can be considered the most significant and critical loads in a floating wind turbine. For analyzing the reliability of the system, the previous methods generally have to re-start the simulation when the system fails, which is computationally expensive. However, the proposed new method is able to evaluate the reliability of the system without extra simulation by considering the multi-dimensional variables simultaneously. The proposed method may assist in evaluating potential structural dynamic situations before deciding during the design stage. The flow chart of the proposed multi-dimensional reliability approach is shown in Figure 2. Details of each step are described in the following sections.
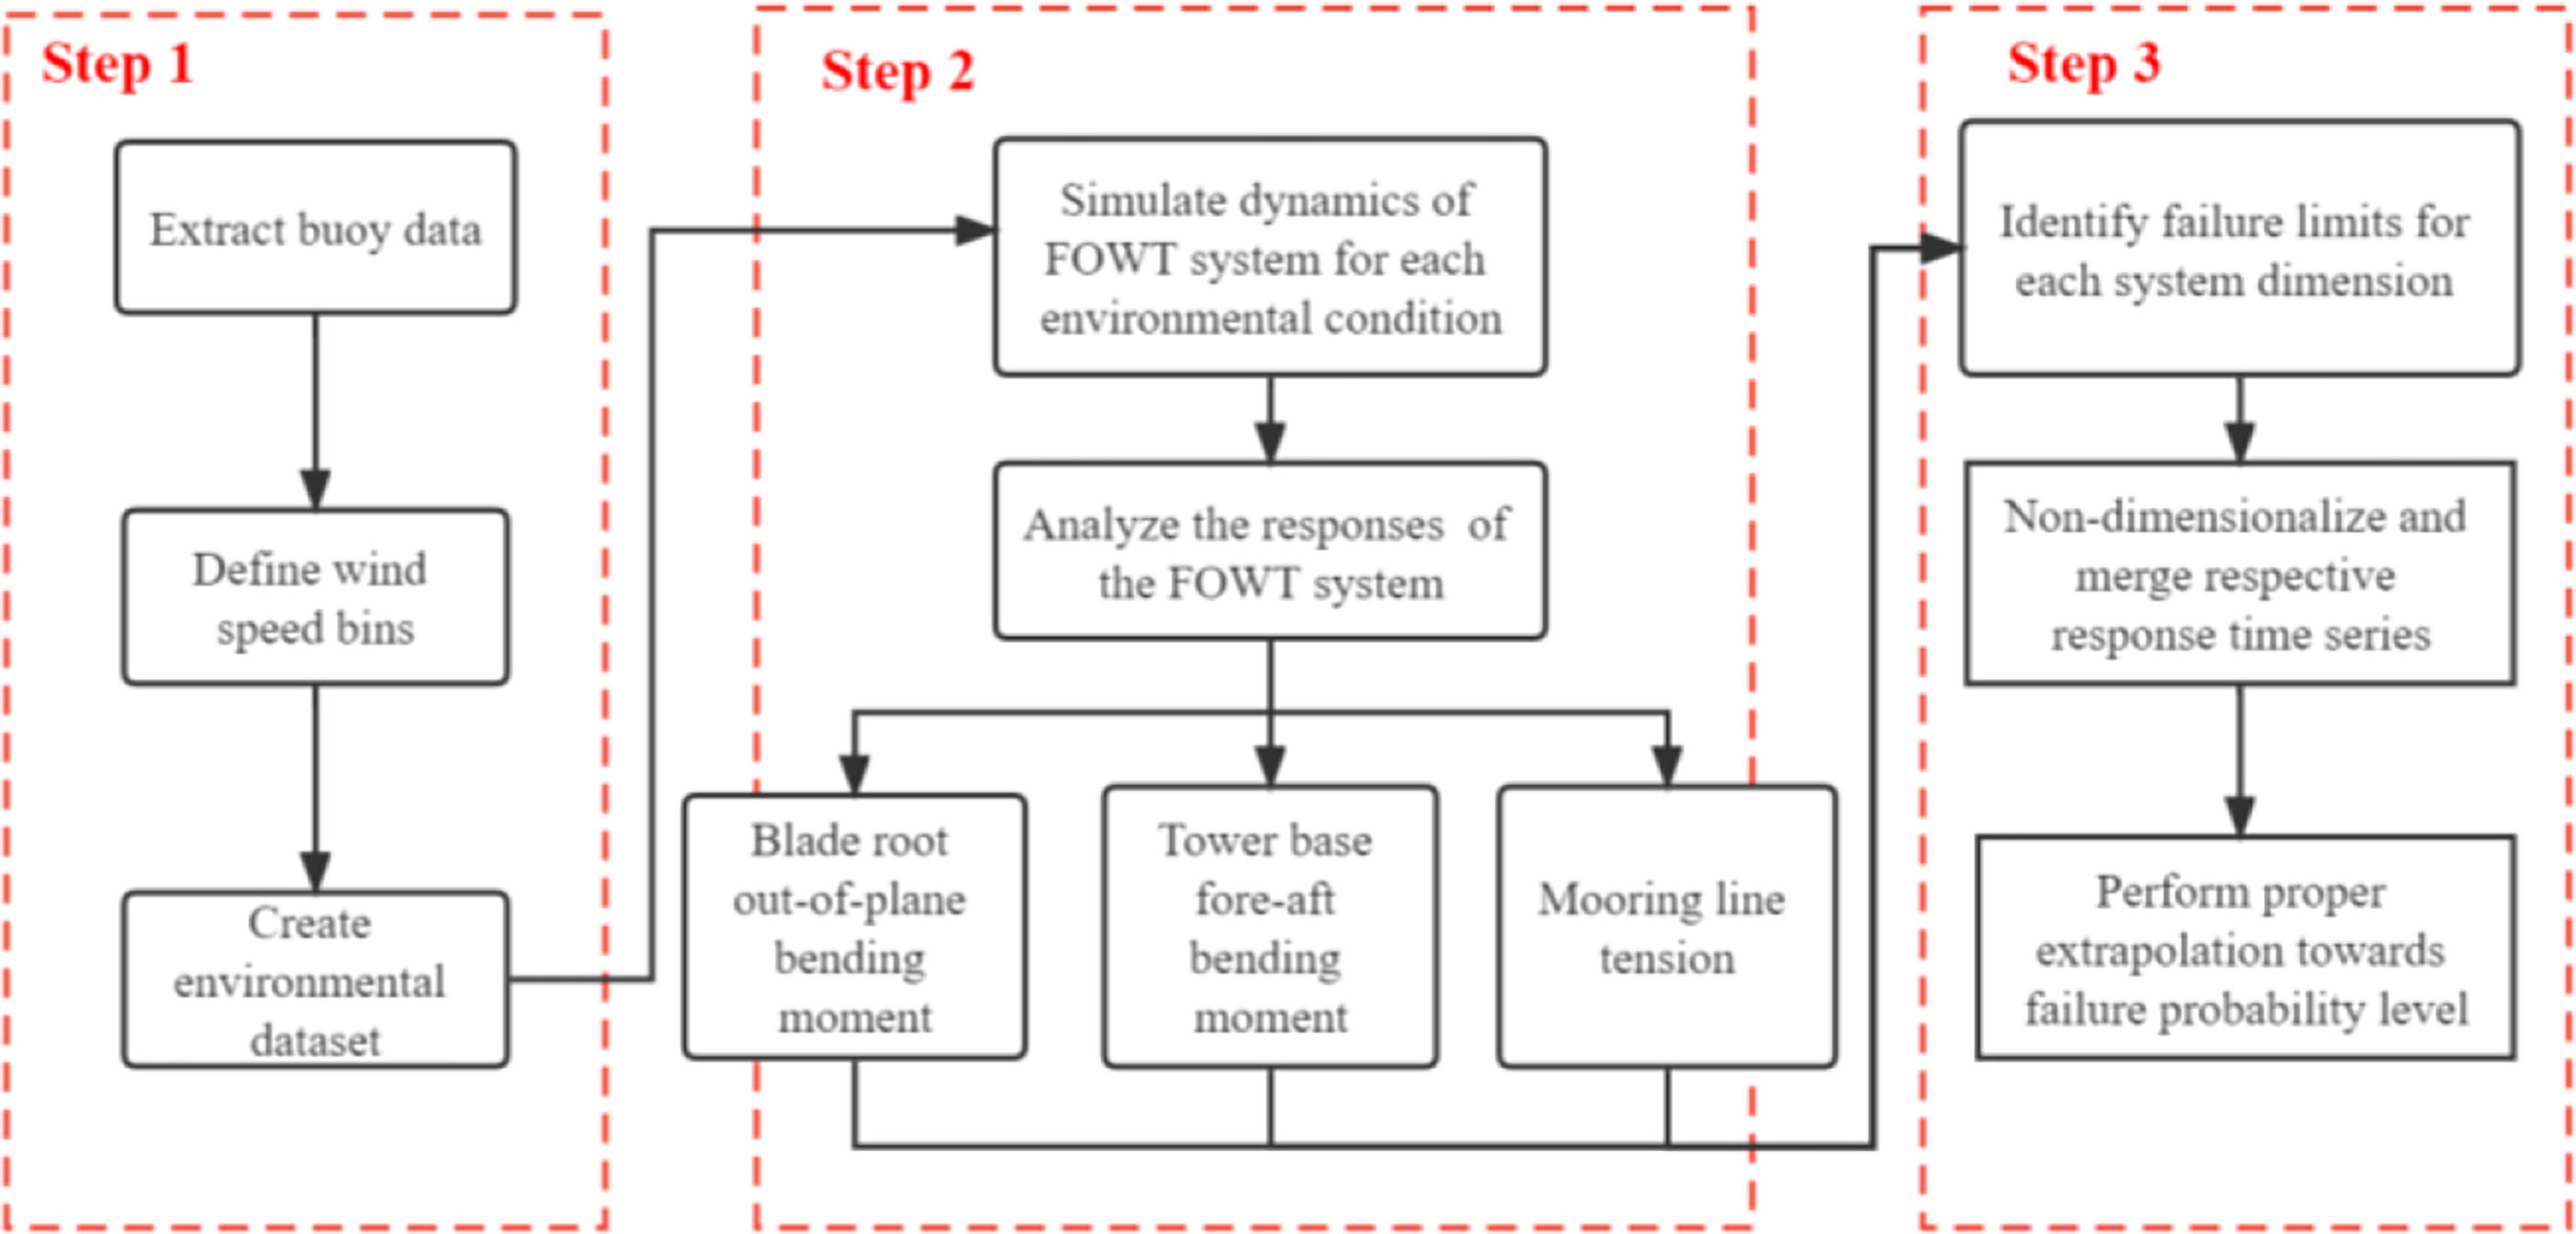
Figure 2 Flow chart of the multi-dimensional reliability method.
Buoy data analysis
It can be challenging to find good-quality metocean data with high temporal resolution. The National Oceanic and Atmospheric Administration (NOAA) owns and maintains large networks of floating data collection buoys throughout the USA and international waters. The data required for this study was obtained from NOAA. The metocean data measured by those buoys can be found at the National Data Buoy Center (https://www.ndbc.noaa.gov/).
Data on wind speed was averaged over 8 minutes and reported every hour. The average wave direction during the same 8-minutes averaging period was used. The significant wave height and spectral peak period were measured over a 20-minute period and also reported every hour. The direction from which the wave with the dominant peak period arrived was reported as the wave direction.
The National Data Buoy Center station Cape Elizabeth, which is located 45 nautical miles northwest of Aberdeen Washington, was selected for this study. The measurement buoy is located at 125 m of water depth. The combined wind-wave statistics for the selected site were estimated using on-site metocean data from 2010-2017. Figure 3 shows the buoy Cape Elizabeth.
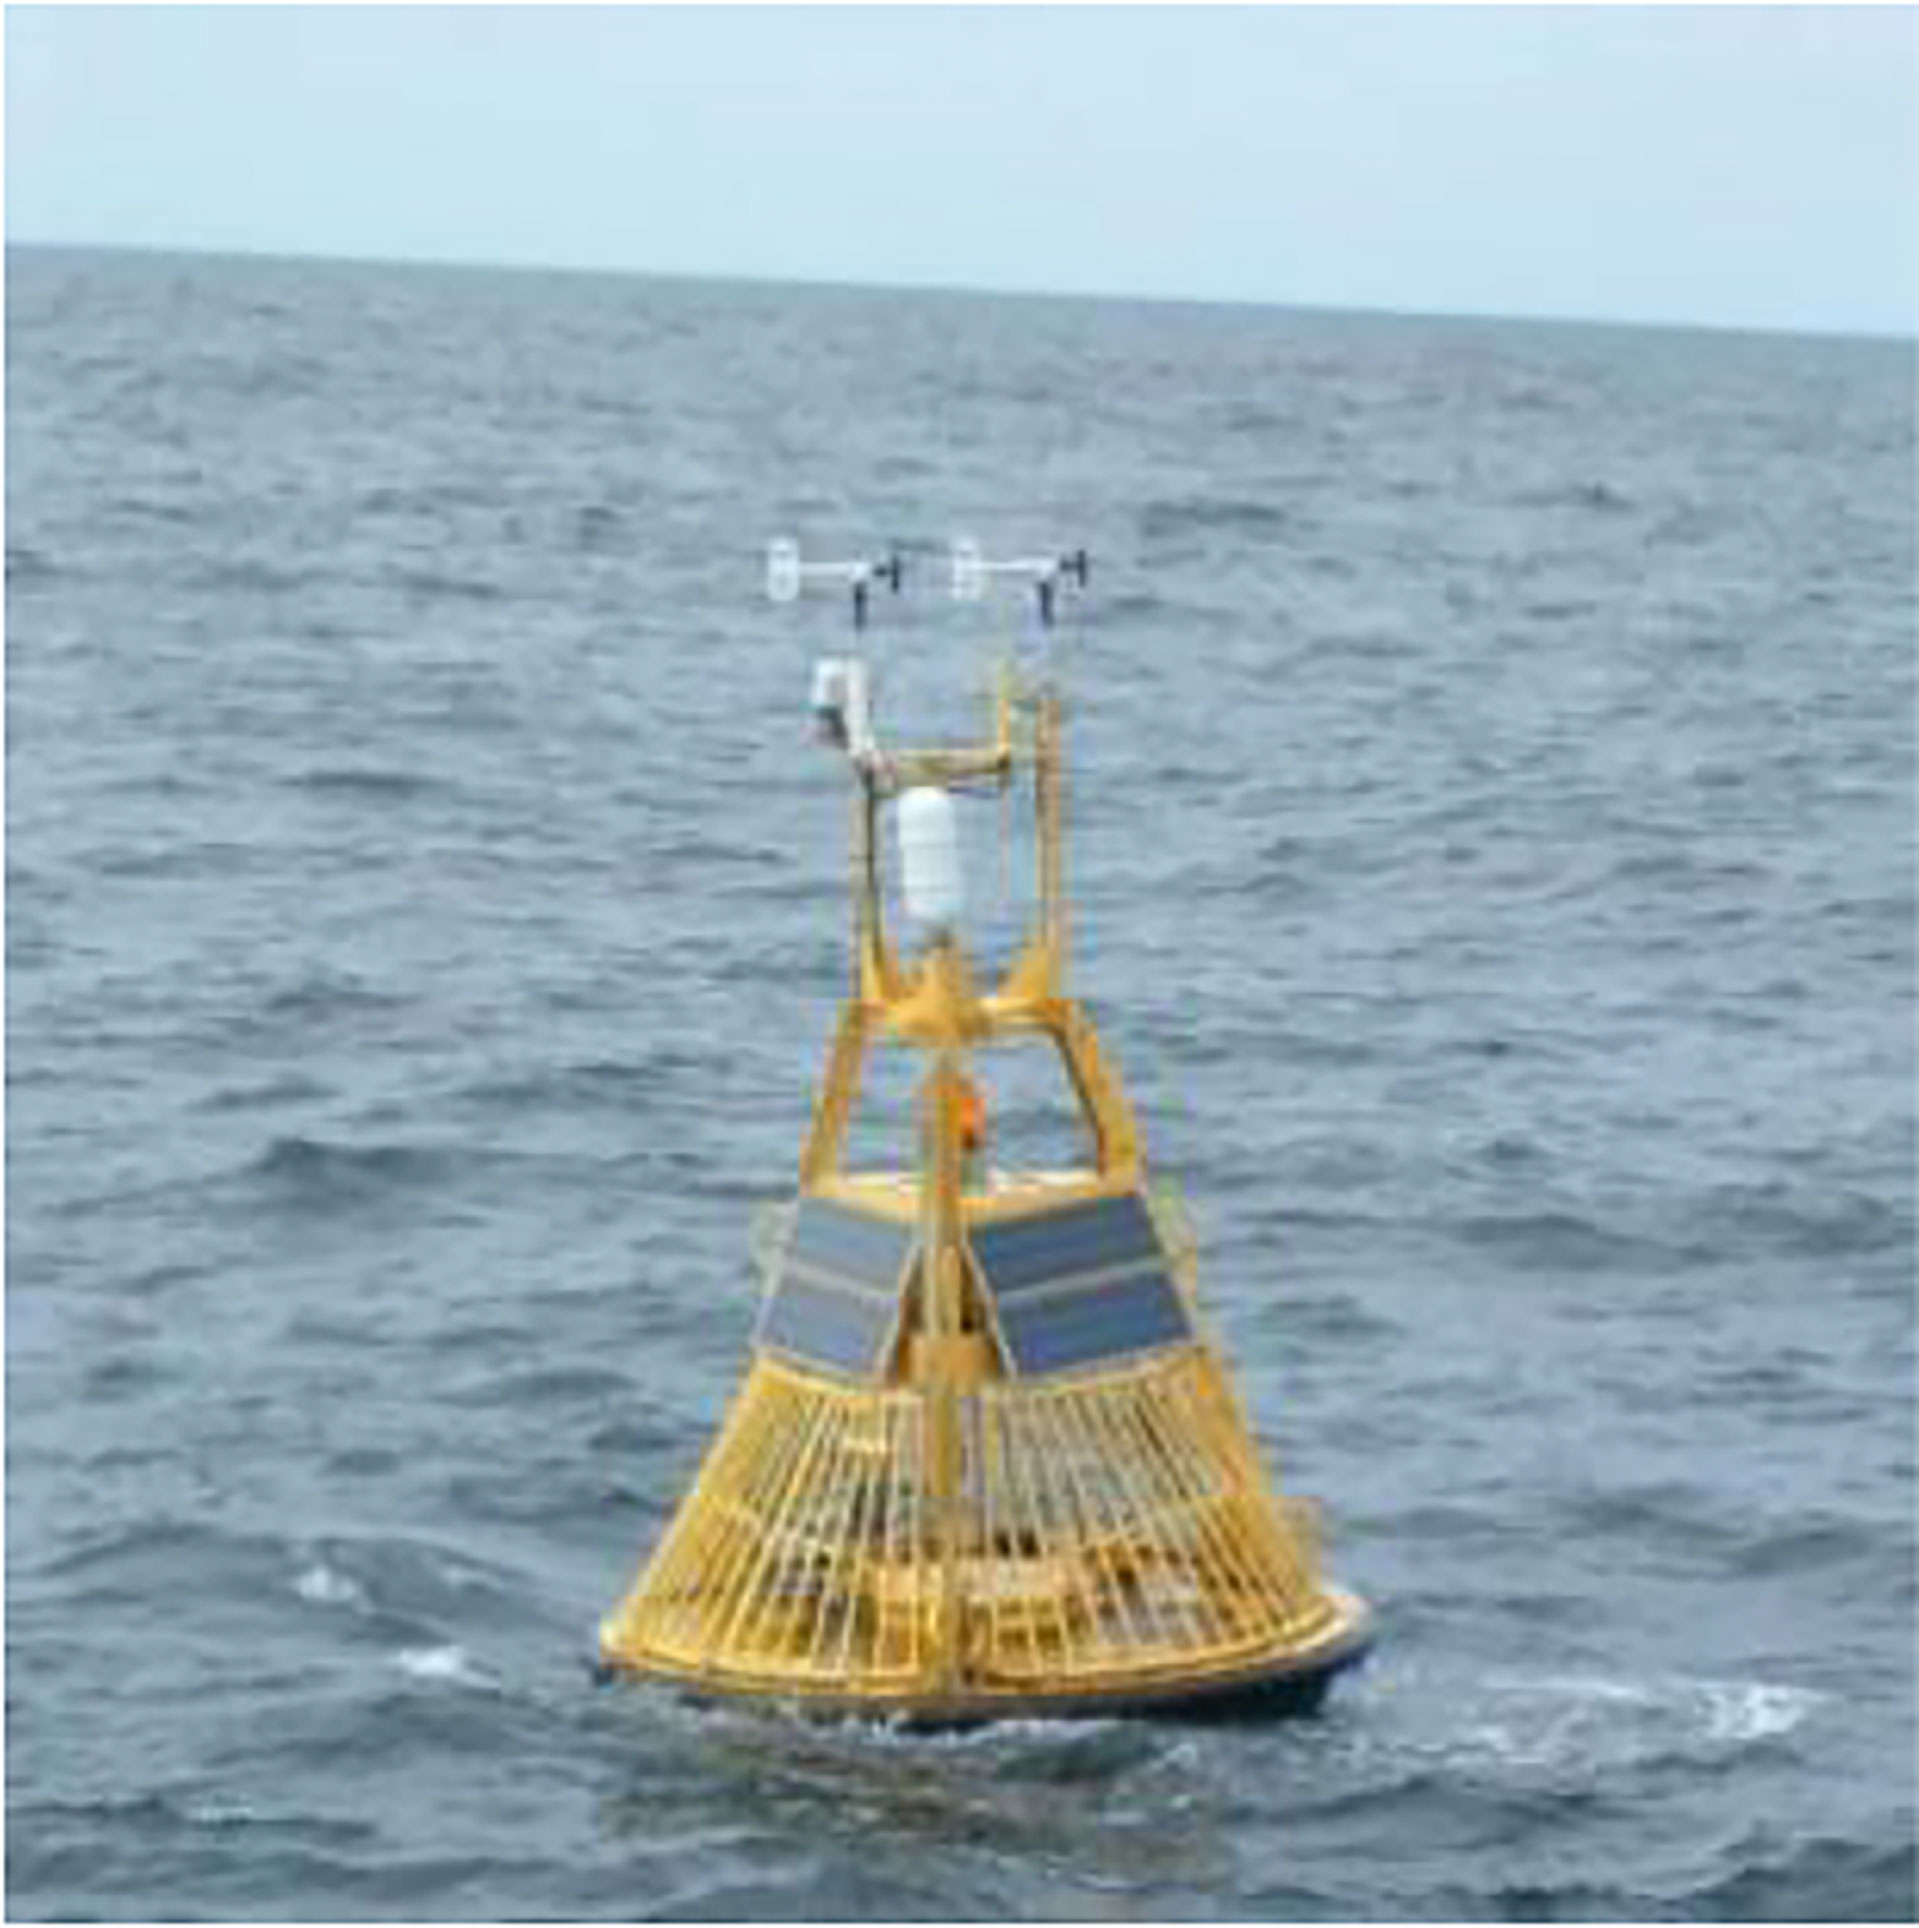
Figure 3 Buoy Cape Elizabeth (https://www.pmel.noaa.gov/co2/story/Cape+Elizabeth).
Post-processing of the data then continued with the wind speed extrapolation to a typical FOWT hub height of 90 m. The anemometers of Cape Elizabeth are placed at 5 m above sea level. Most engineering approaches use either log law or power-law wind shear equations for extrapolation. This paper uses the power-law method with the wind shear exponent α=0.14 (IEC 61400-3, 2009) to extrapolate the wind speeds from the buoy to the hub height, as shown in Equation (1).
This paper does not use simplifications or assumptions for the measured buoy data. The metocean data has been post-processed into an empirical multi-dimensional joint distribution that probability density function (PDF) p (U, Hs Tp) has been estimated directly from the available metocean data, resulting in a three-dimensional scattered diagram. Figure 4 presents in situ the 3D scatter diagram of the wind speed, significant wave height, and peak period on the left, and a 2D interpolated (Hs, Tp) contour plot on the right. Figure 4 shows a clear correlation between wind speed and significant wave height. Therefore, this paper advocates a direct non-simplified Monte Carlo-based approach.
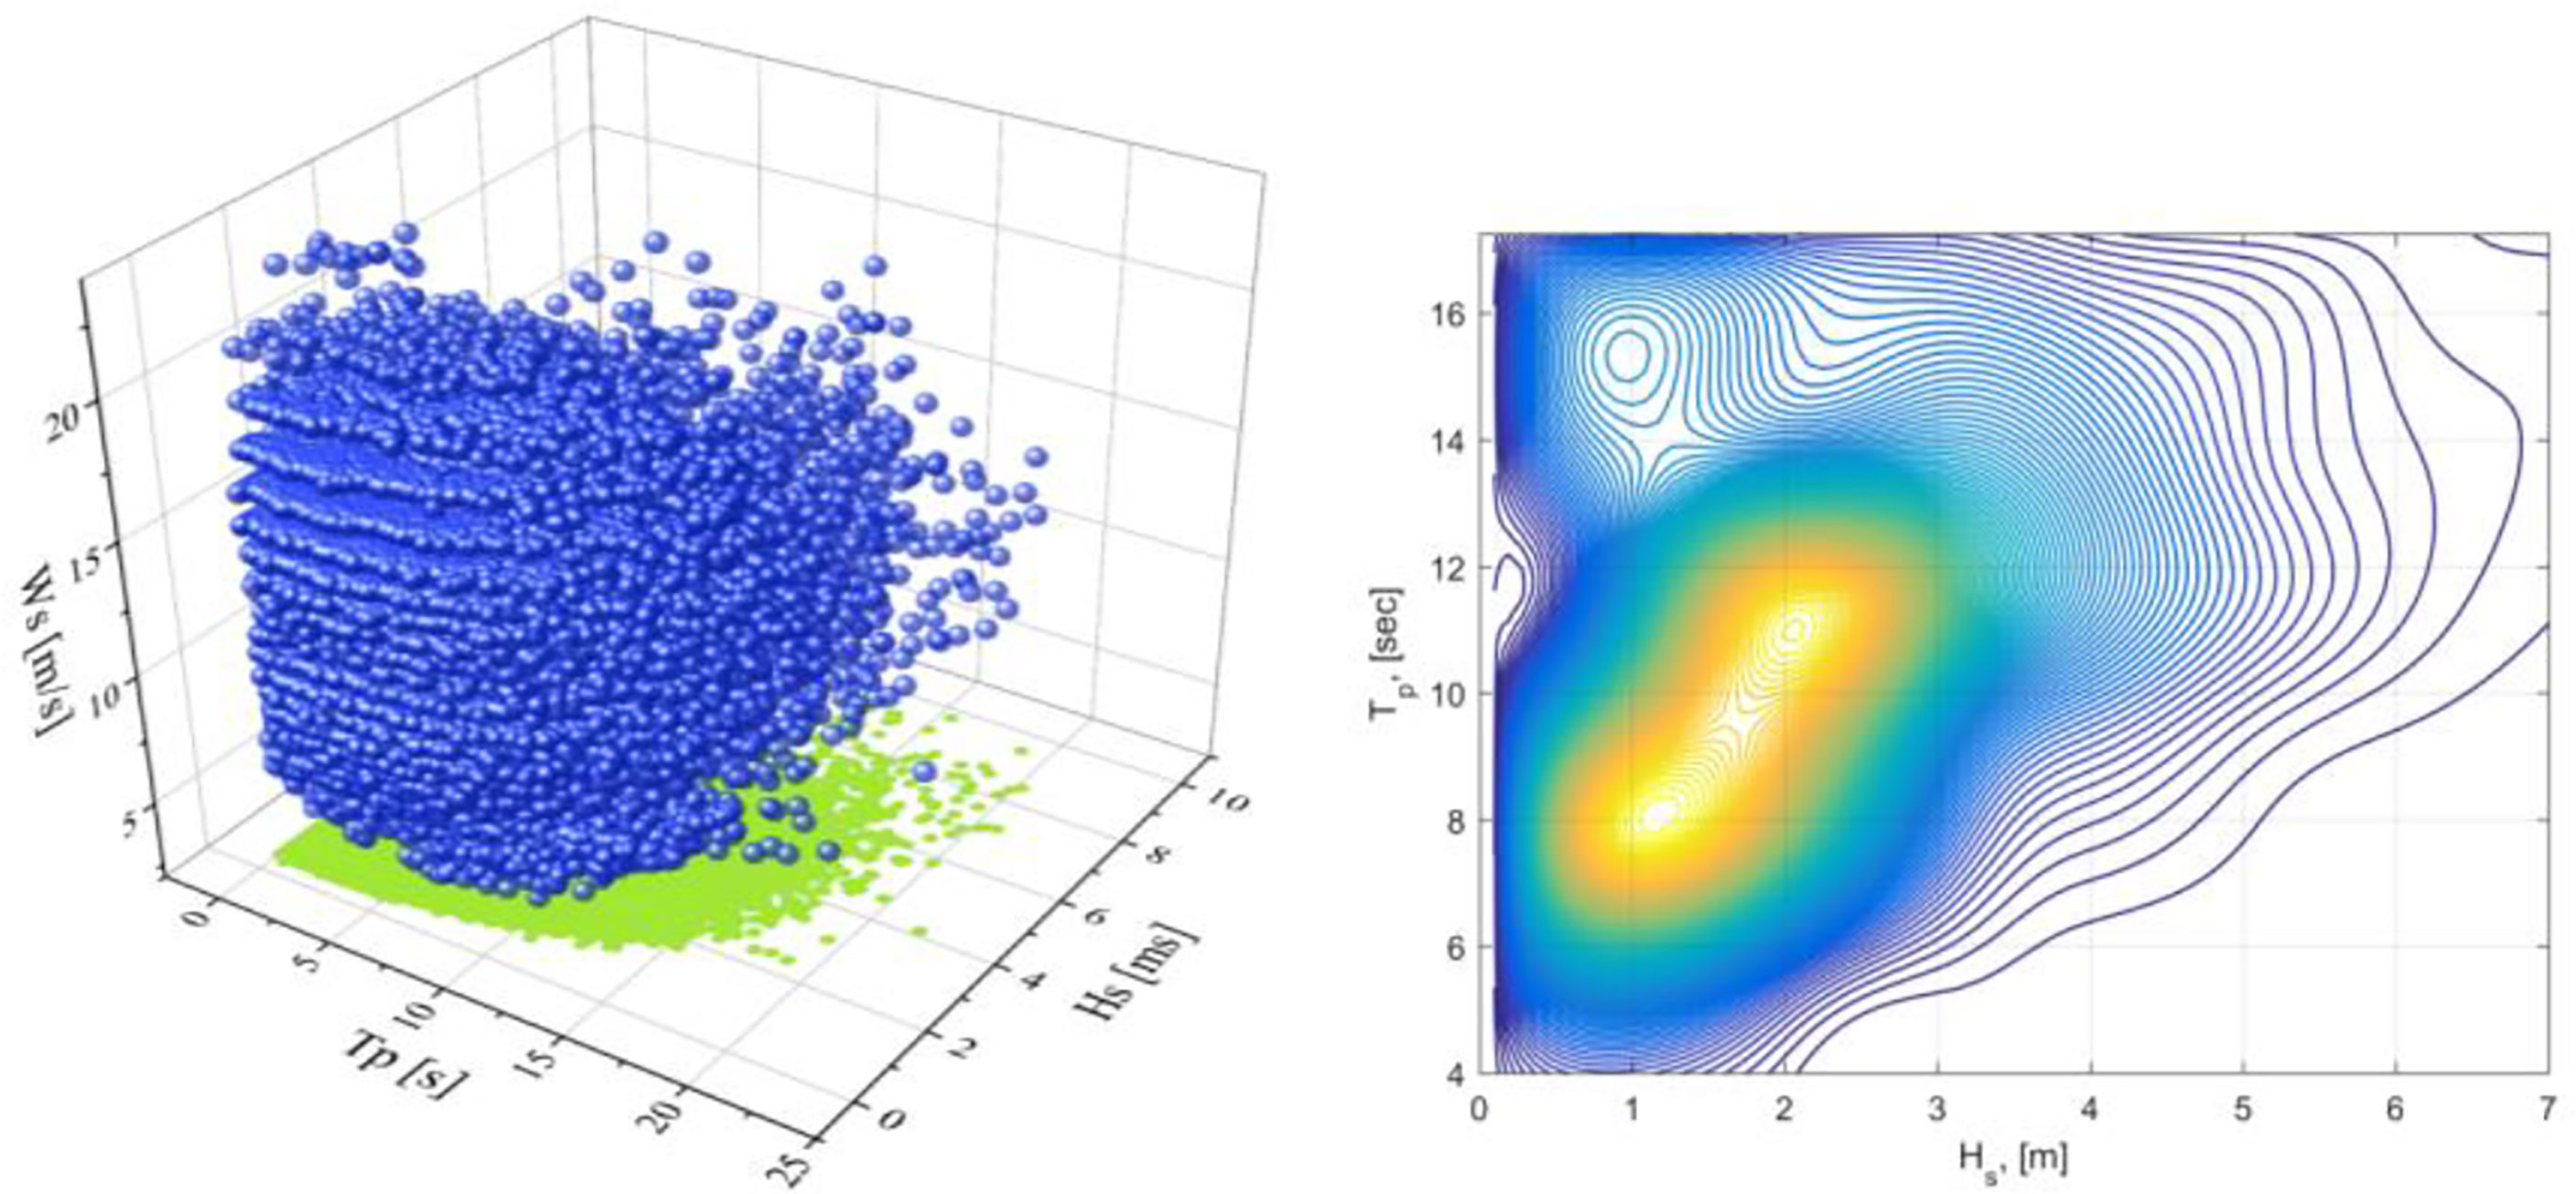
Figure 4 Left: 3D scatter of wind speed (Ws), significant wave height (Hs) and peak periods(Tp); Right:(Hs, Tp) contour plot, p(HsTp)= dU.
This study focuses on investigating the reliability of the target FOWT under normal power production conditions. Therefore, the wind speeds from the cut-in to cut-out wind speeds (3m/s to 25m/s) are divided into 12 bins with a 2m/s bin width. Each wind speed bin chooses approximately 30-40 corresponding sea states with varying probabilities. Six random seeds were performed for each environmental condition. IEC recommends at least fifteen short 10-minute simulations are necessary for the load extrapolation. Therefore, a total of 2550 (425 × 2550) times 10-minute simulations are calculated in this paper.
Description of the target FOWT
This paper selects the NREL (National Renewable Energy Laboratory) 5MW reference wind turbine as the target model for the following simulations and reliability analysis. The diameter of the three-bladed rotor is 126 m, and the hub height of the cylindrical tower is 90 m above the still water line (SWL). Table 1 shows the summary properties of the 5-MW baseline wind turbine.
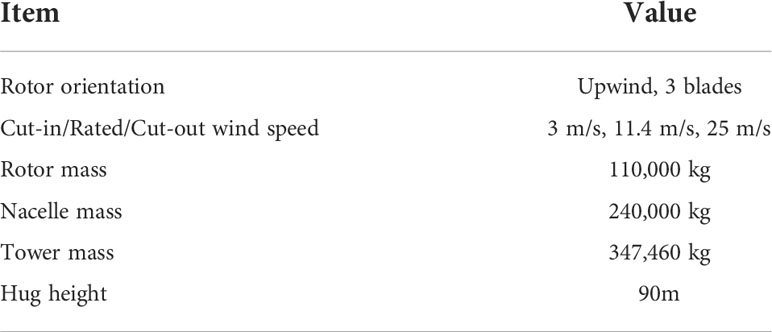
Table 1 Summary properties of 5-MW baseline wind turbines.
The reference 5MW wind turbine is mounted on the DeepCwind semi-submersible platform (Robertson et al., 2016a). Figure 5 shows the model of the semi-submersible platform, consisting of three outer offset columns with a larger diameter, one central support column for the turbine, and a series of horizontal and diagonal cross bracing. Heave plates are (base columns) attached to the bottom to reduce large heave motions. Table 2 shows the main dimensions of the semi-submersible platform.
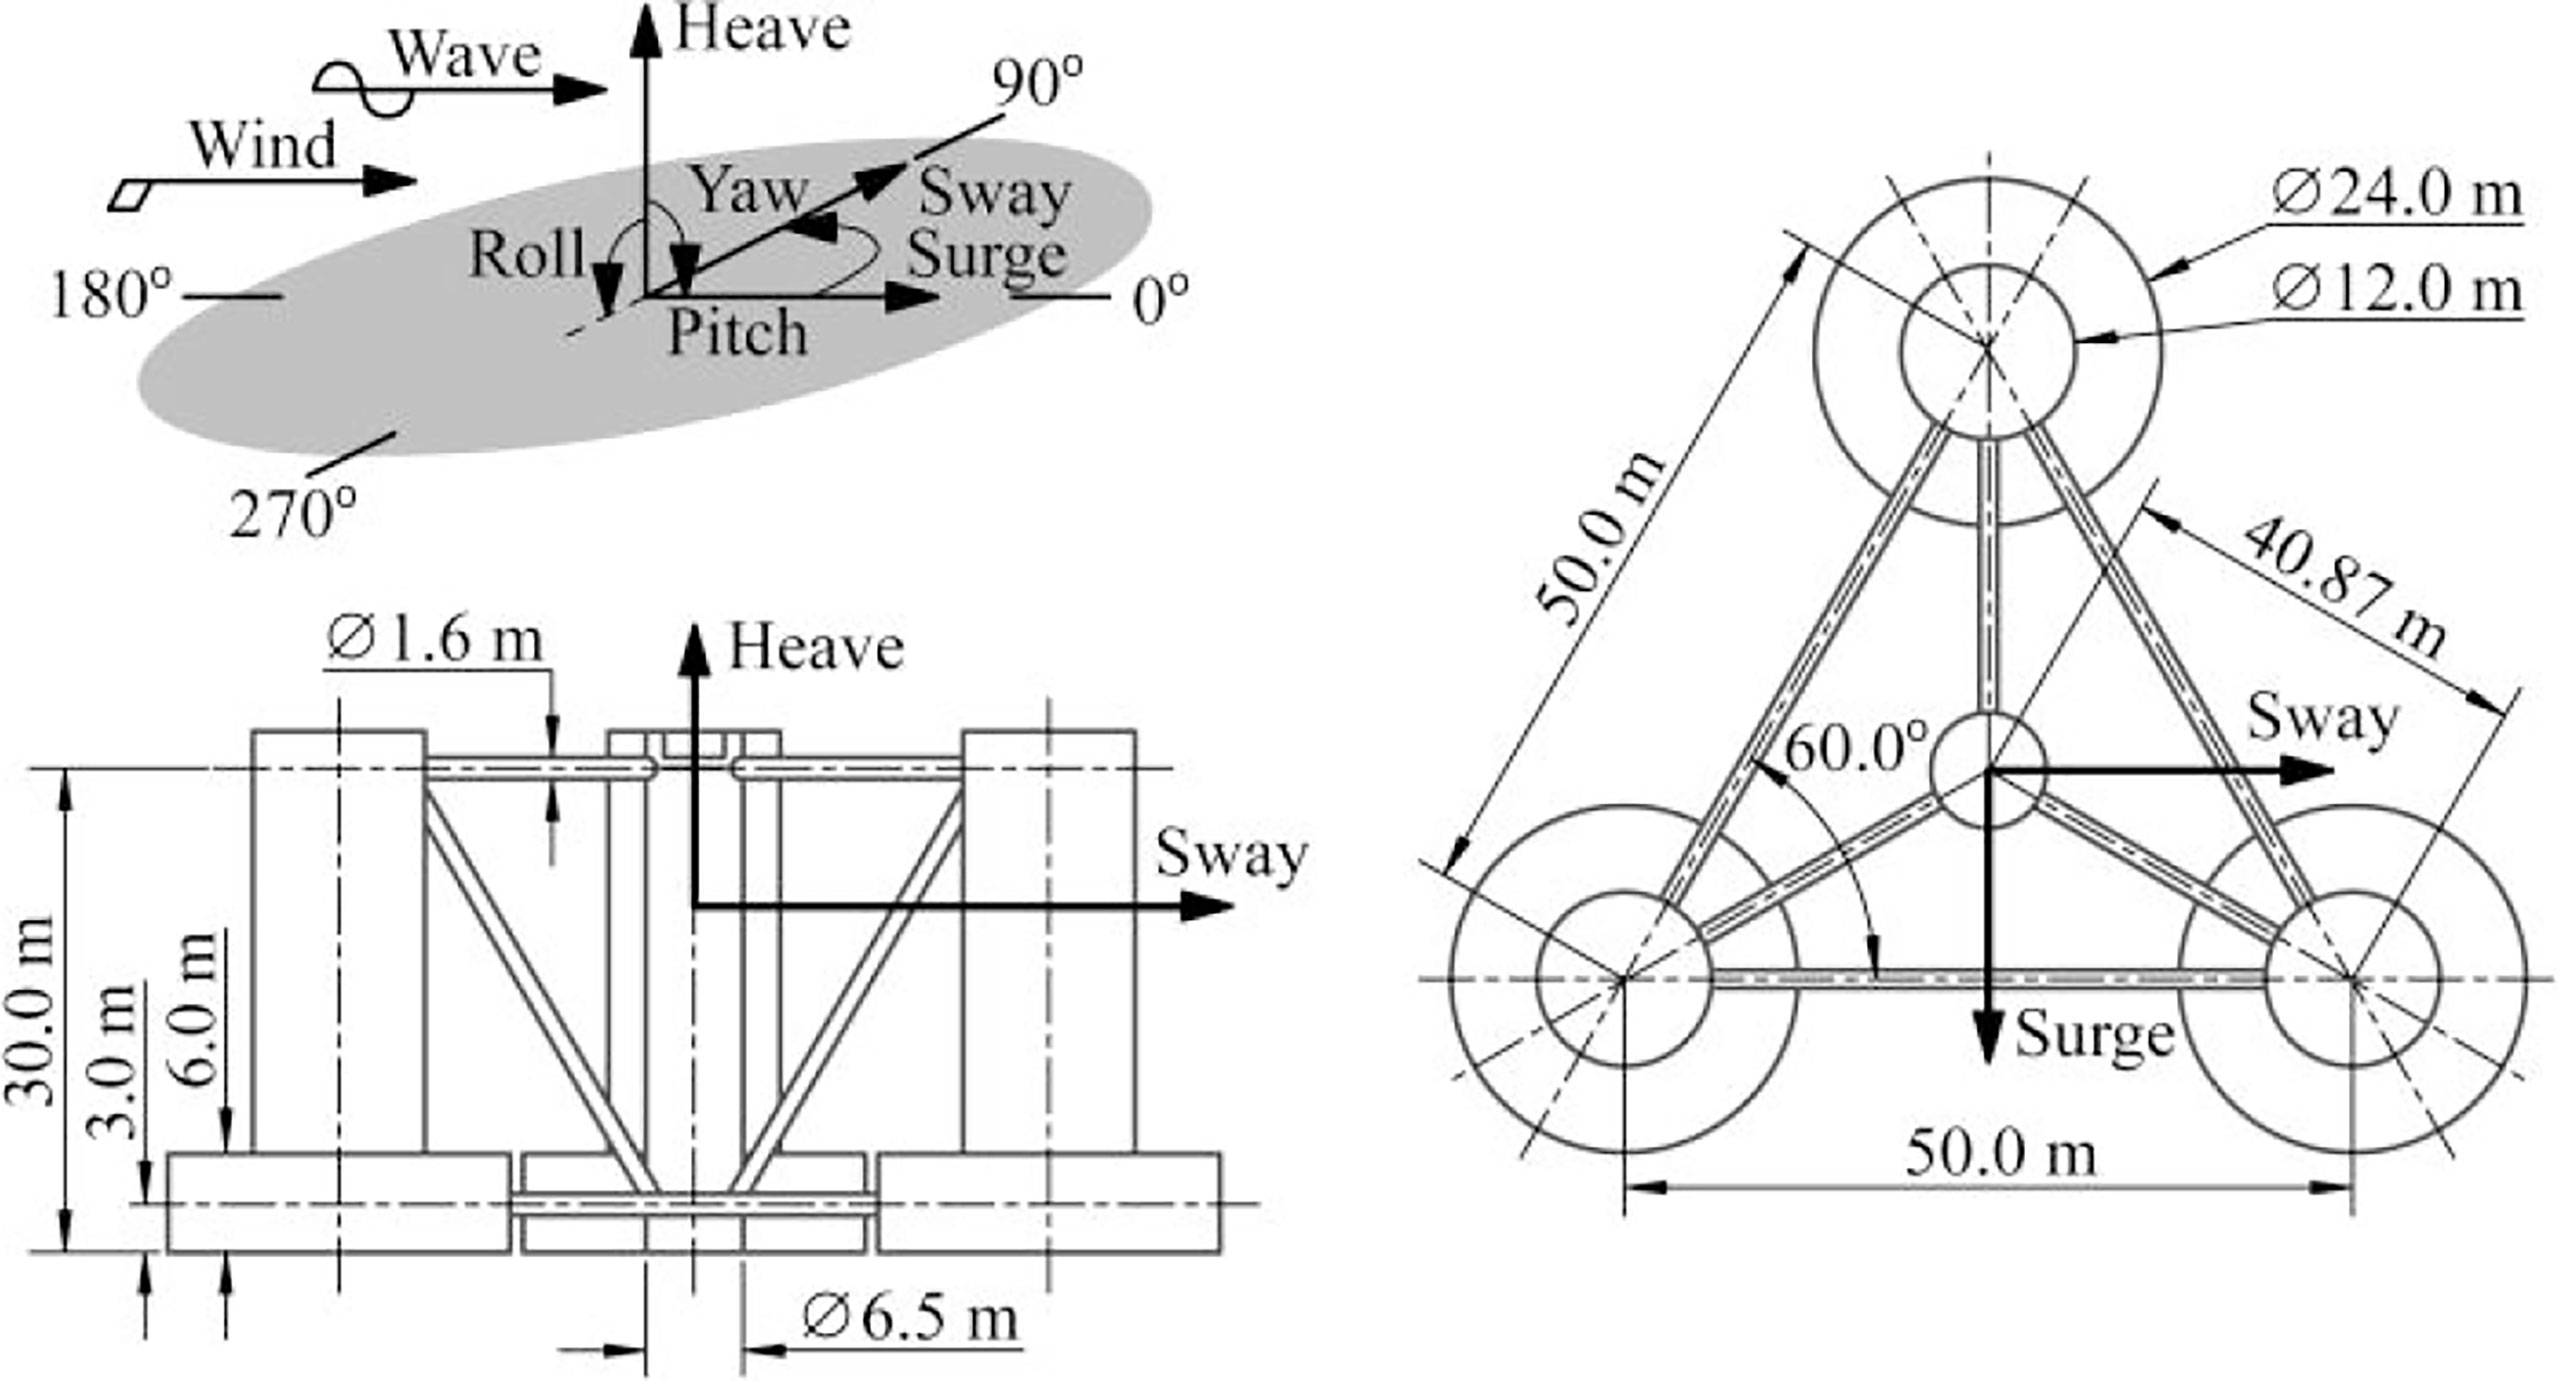
Figure 5 Dimensions and coordinate system of the DeepCwind semi-submersible support platform (Coulling et al., 2013).
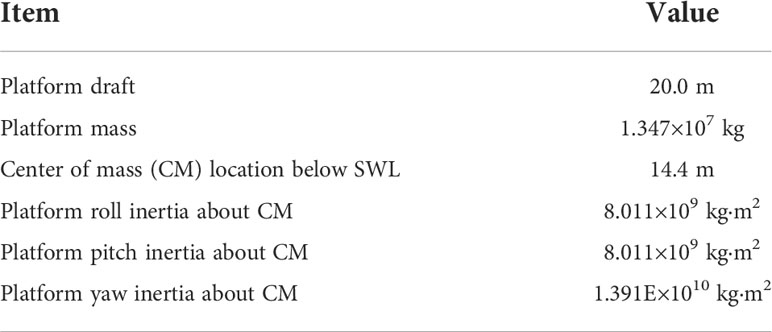
Table 2 Main dimensions of the semi-submersible platform.
The mooring system of the DeepCwind semi-submersible support platform consists of three slack, catenary mooring lines, which could provide global restoring forces/moments for DOFs in surge, sway and yaw. Table 3 presents the properties of the mooring system. Figure 6 presents the mooring layout of the target FOWT in this study, and Table 3 shows the properties of the mooring system for the support platform. Mooring line #2 has the largest load compared with the other two mooring lines due to the combined wind and wave forces. Therefore, mooring line #2 is selected as one of the critical loads in the following reliability analysis.
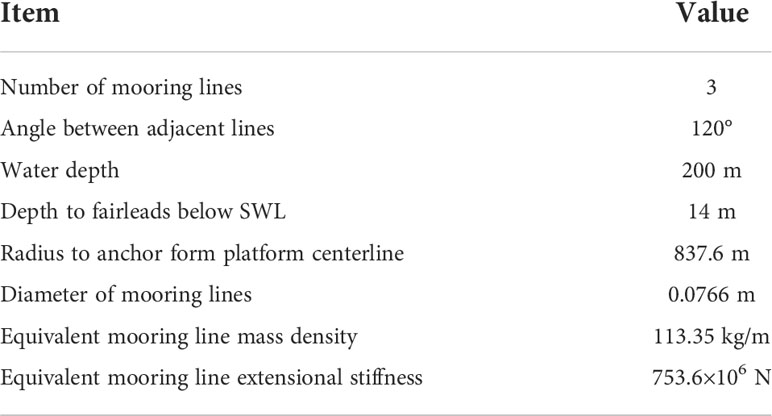
Table 3 Properties of the mooring system.
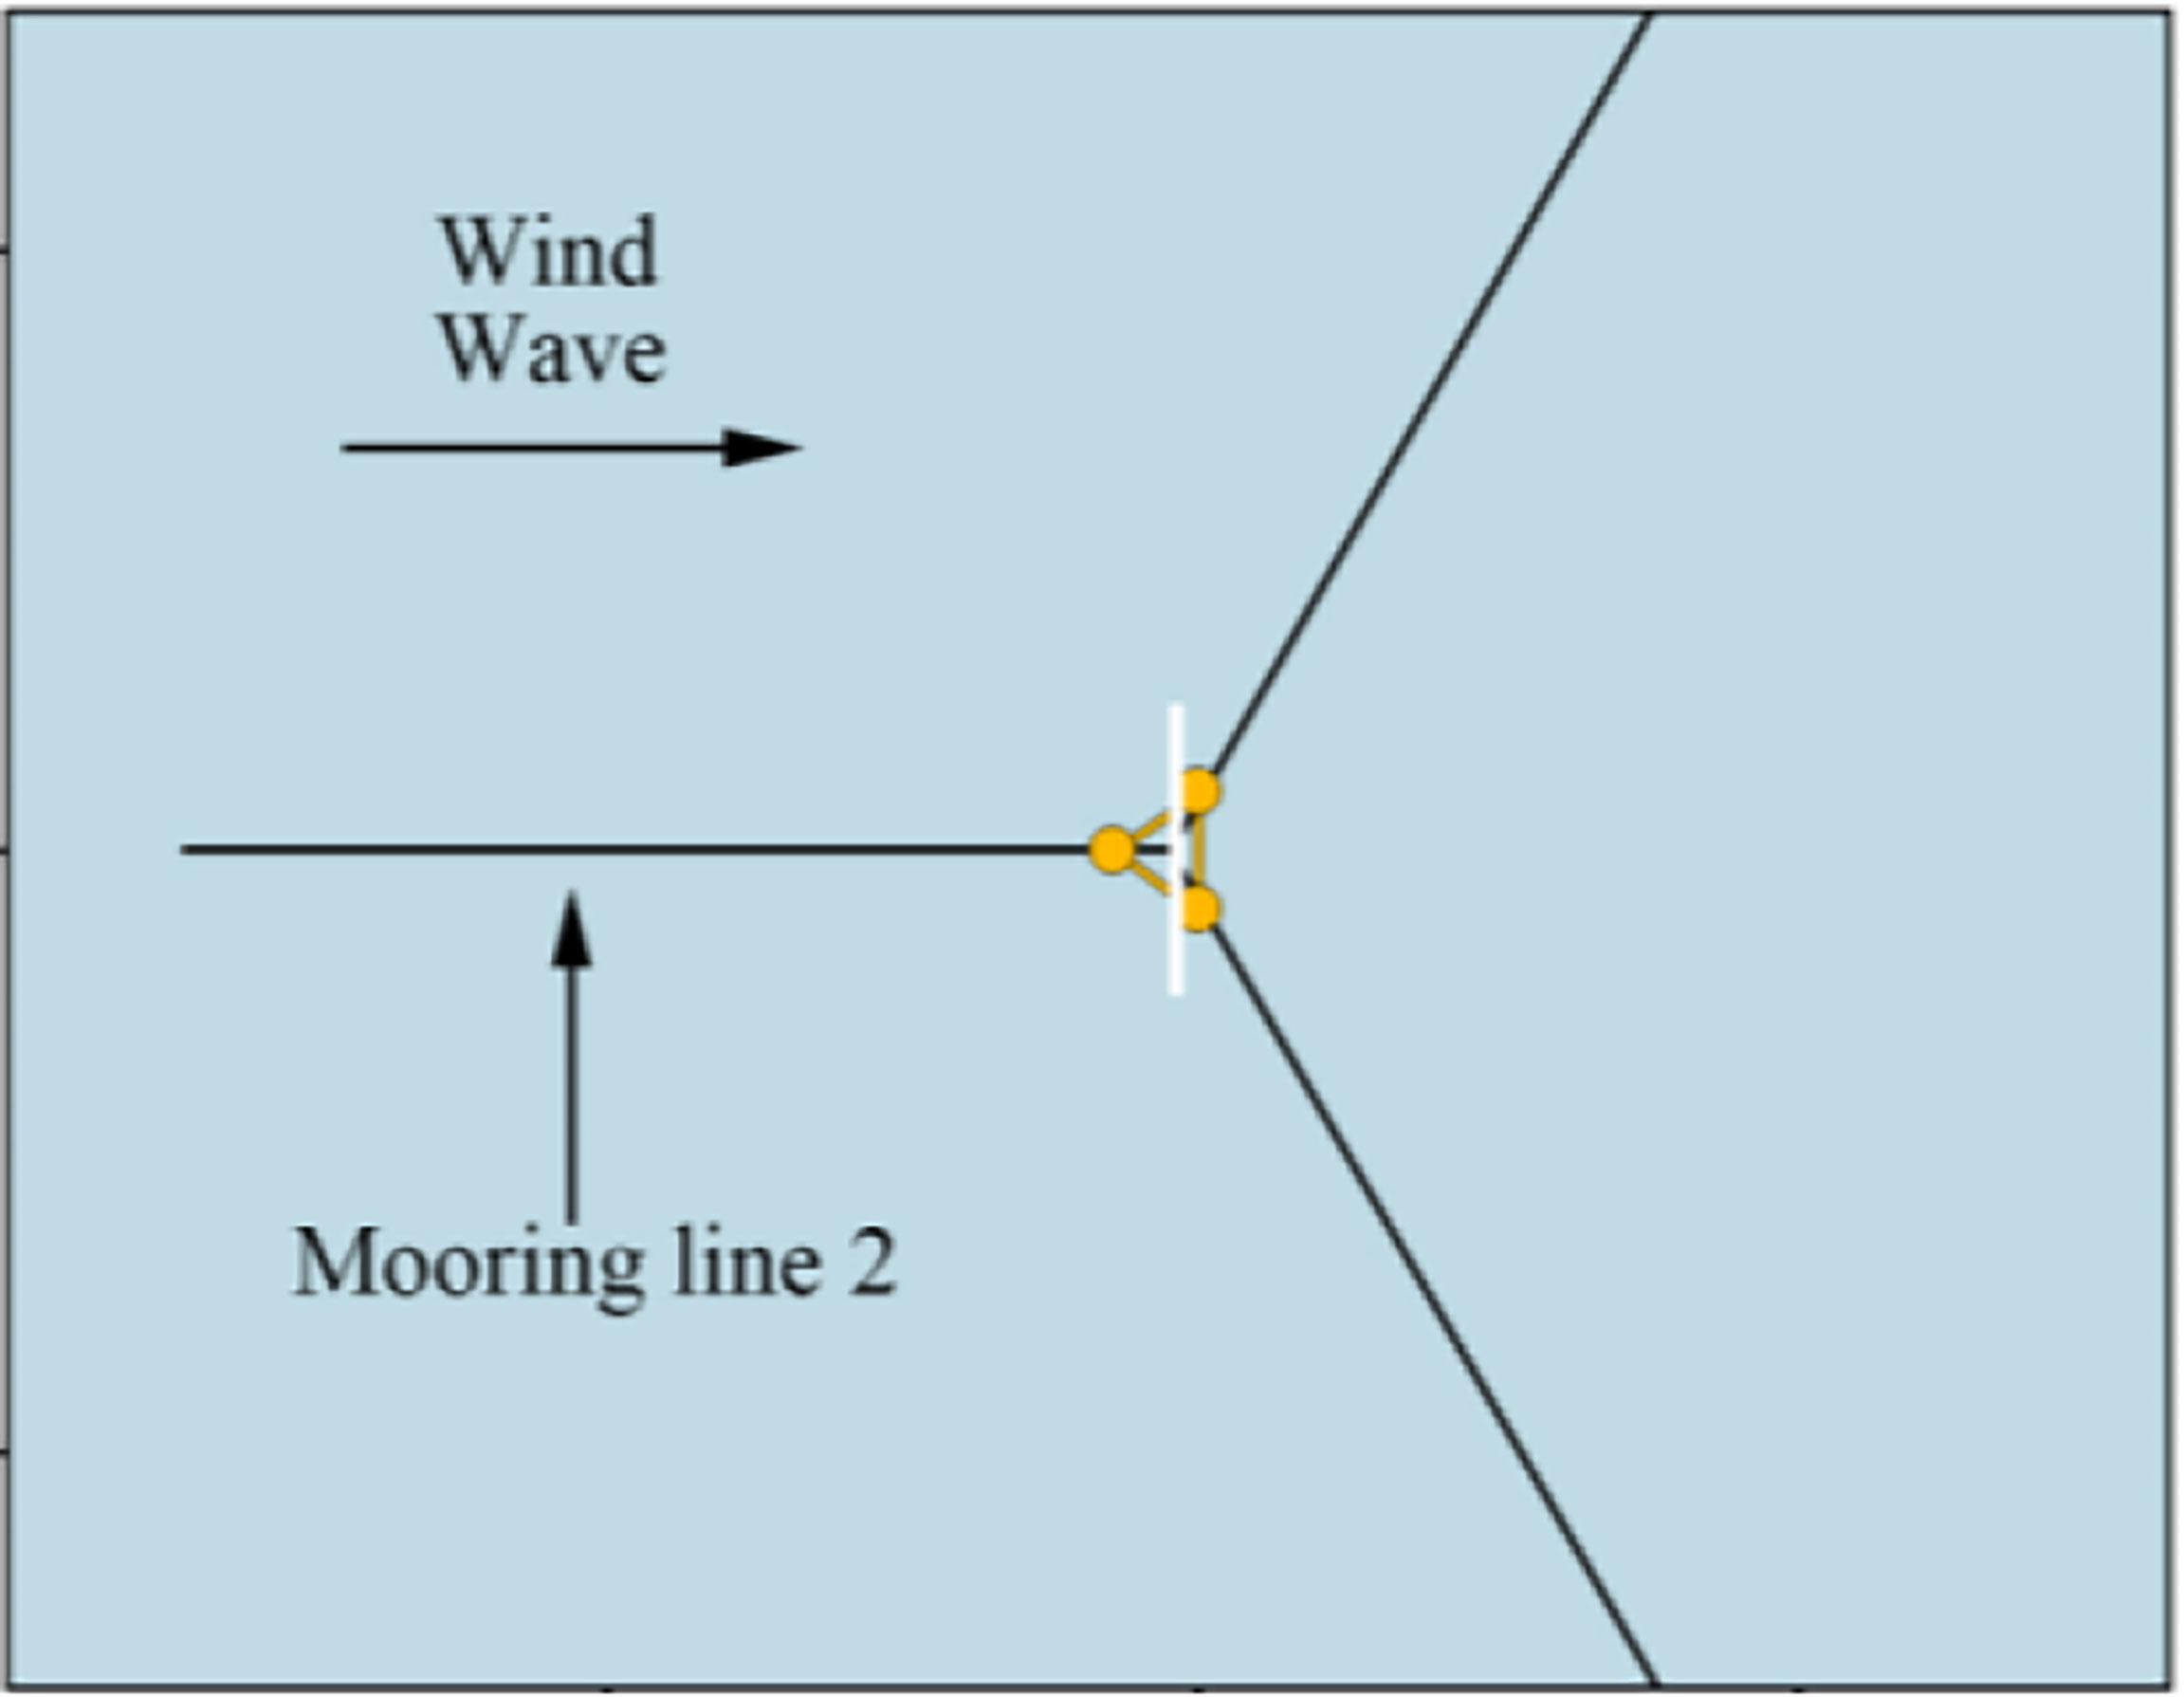
Figure 6 Mooring layout for the 5MW semi-submersible FOWT.
Numerical simulation of FOWTs under operational conditions
The aero-hydro-servo-elastic fully coupled time-domain simulation tool OpenFAST is applied for the dynamic analysis of the target semi-submersible FOWT in this paper. NREL developed OpenFAST for the design of horizontal axis wind turbines (HAWT). OpenFAST is based on Kane’s kinematic equation to solve coupled multi-body dynamics of the FOWT, considering aerodynamic loads, hydrodynamic loads, elastodynamic loads and mooring loads (Li et al., 2022). The preprocessing tool Turbsim (Jonkman and Buhl, 2006) is used to generate the three-dimensional synthetic turbulent wind field on a 31×31 square grid with a 145 m width based on the Kaimal spectral and exponential coherence model. The mean wind speeds of 5, 11, and 21 m/s are used as representative load cases in this paper; they represent the below-rated, rated and above-rated operating regions, respectively.
The module for calculating aerodynamic loads on the rotor blades is called AeroDyn, based on the blade element momentum (BEM) theory. It divides the rotor blade into independent elements in the span direction and considers rotor-wake effects and dynamic stall. The HydroDyn (Jonkman et al., 2014) module, which incorporates Morison’s equation and potential flow theory for large-diameter structures, is used to model hydrodynamic loads. In the frequency domain, potential flow theory is utilized to estimate hydrodynamic coefficients such as added mass and potential damping coefficients. Morison’s equation includes a drag force component to account for viscous drag forces acting on FOWT. The second-order wave forces are also taken into consideration in OpenFAST (Bayati et al., 2014). The MoorDyn mooring module is used to model three catenary mooring lines of the NERL 5MW semi-submersible FOWT, and it is based on the lumped mass theory to discretize the mooring dynamics over the length of the mooring line. The Open Source Controller (ROSCO) (NREL, 2022) was developed to communicate with OpenFAST using the Bladed-style control interface. The controller of the target FOWT includes the variable-speed generator torque controller and the collective blade pitch controller (Yang et al., 2020).
There are numerous published references regarding the validation of using OpenFAST to simulate the dynamics of the FOWT. A series of Offshore Code Comparison, Collaboration, Continued, with Correlation research projects has been conducted to validate the tools used to design offshore wind systems. The OC3 (Jonkman and Musial, 2010), OC4 (Popko et al., 2012), OC5 (Robertson et al., 2016b), and OC6 (Robertson et al., 2020) projects have shown that although the numerical results are 20% under-predicted compared with the experimental results, the results of OpenFAST represent the behavior of the FOWT system well, which authenticates the modelling capability of OpenFAST. Therefore, OpenFAST was chosen as the simulation tool to numerically calculate the dynamic responses of the target semi-submersible FOWT under operational conditions. The duration of the OpenFAST simulation under each environmental condition is set to 800 sec, and an initial 200 sec is excluded from the analysis due to the start-up effect. The time step of the simulation is set to 0.025 sec in order to capture the transient responses of the FOWT.
Due to the large number of the simulation data sets, typical work conditions are selected to plot the time history data of the blade root out-of-plane bending moment (RootMyc), tower base fore-aft bending moment (TwrBsMyt), and tension of the mooring line #2 which is shown in Figure 6. Figure 7 presents the power spectral densities (PSDs) of the RootMyc, TwrBsMyt, and tension of the mooring line #2. Peaks in the green and red regions represent the 1P frequency corresponding to the rotor rotation rate at these three wind speeds, respectively, and peaks are also observed at multiples of the 1P frequency (subsequent harmonics, 2P, 3P, etc.). It also indicates that peaks of the RootMyc are excited at the platform pitch frequency above the rated wind speed, and the peak is the largest at the rated wind speed. For the PSDs of the TwrBsMyt, the largest amplitudes are observed at the platform pitch frequency at 11 m/s and 21 m/s cases, but this phenomenon was not observed in the 5 m/s case. The first PSDs of the mooring line tension locate at the platform surge frequency, indicating a clear correlation between the platform surge motion and the mooring line tension. The above PSDs analysis shows the complexity of the multi-dimensional FOWT system and the difficulty of quantitatively evaluating the reliability of the FOWT as a whole. Therefore, it is necessary to develop a state-of-art multi-dimensional reliability methodology.
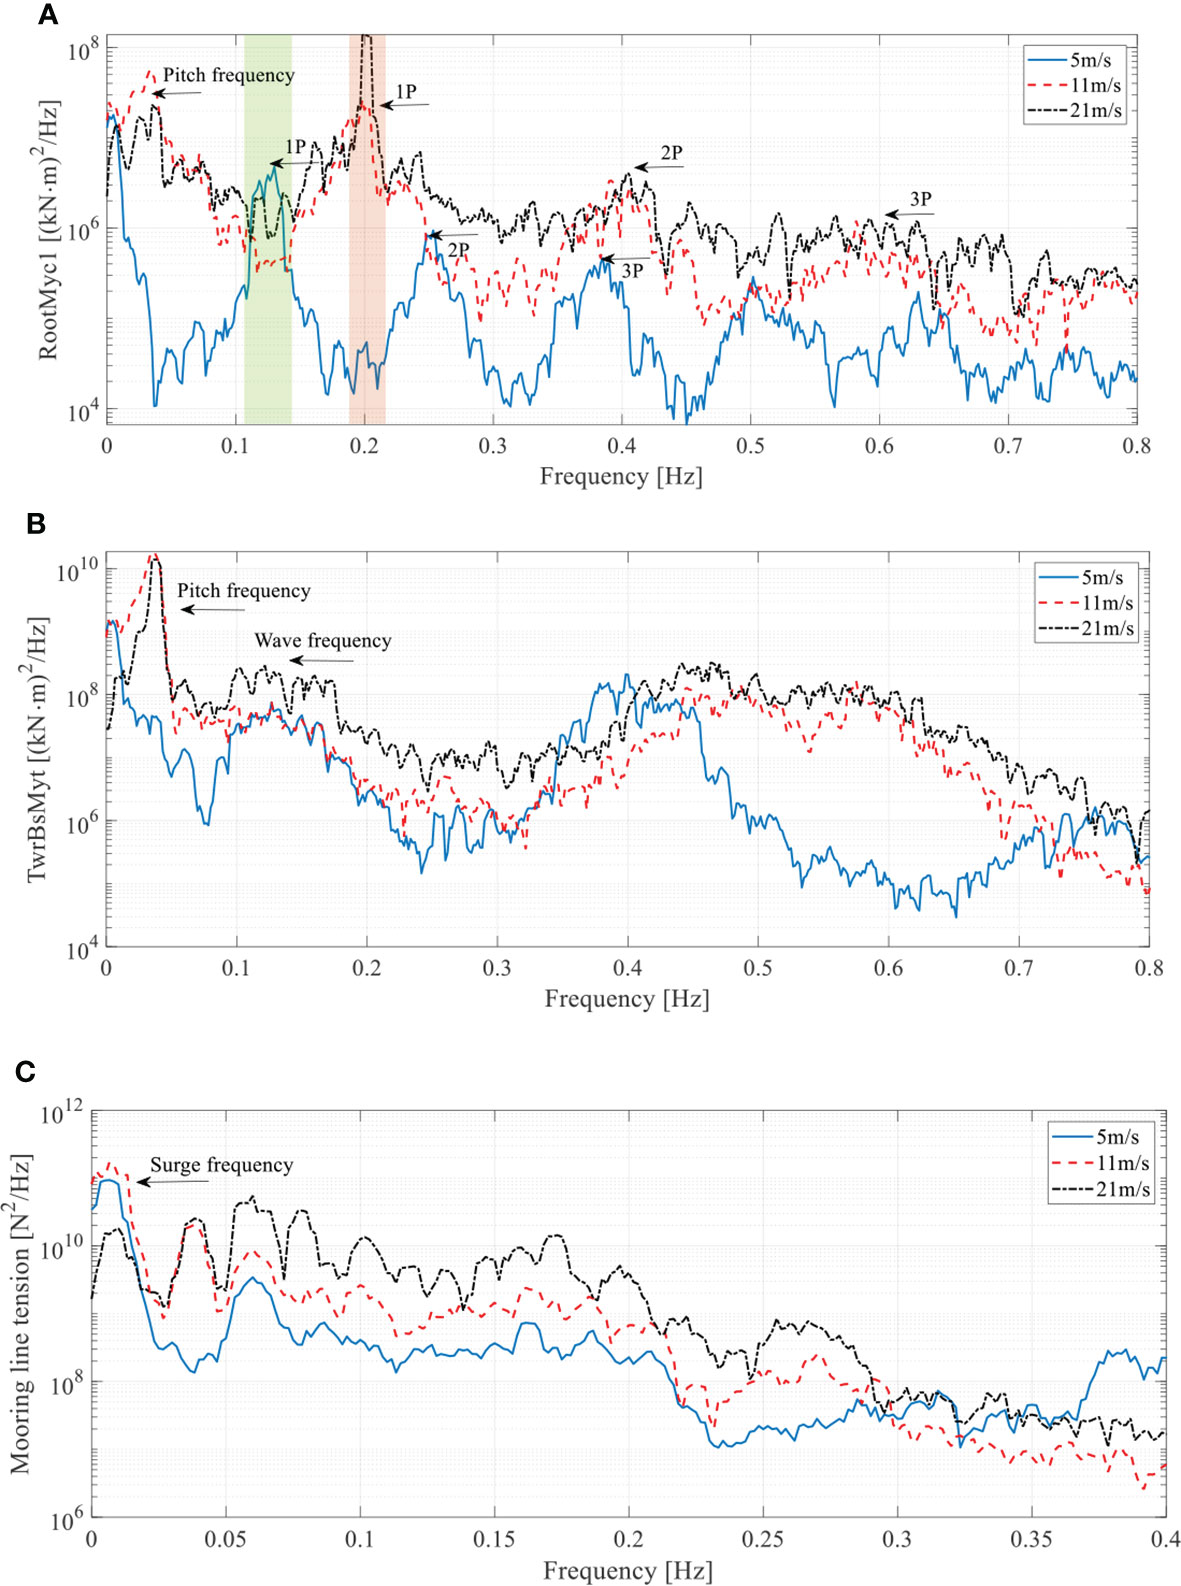
Figure 7 PSDs of the blade root out-of-plane bending moment (A), tower base fore-aft bending moment (B), and mooring line tension (C).
System reliability approach
In general, due to the random variables governing the dynamic system and the high degree of freedom, existing theoretical reliability methodologies make it difficult to determine realistic structural system reliability (Ditlevsen and Bjerager, 1986; Ditlevsen and Madsen, 1996; Melchers and Beck, 2018). In theory, either direct Monte Carlo simulation or sufficient measurements are used to accurately estimate the reliability of complex structures (Naess and Gaidai, 2008; Naess and Gaidai, 2009; Naess and Moan, 2013; Gaidai et al., 2018; Xu et al., 2019; Gaidai et al., 2020; Gaidai et al., 2021). However, the computational or experimental cost may be prohibitive for many complicated dynamic systems. Therefore, the current study’s authors have developed a novel structural system reliability method that aims to reduce either computational or measurement costs.
The multi-degree of freedom (MDOF) offshore structures are subjected to stochastic wind and wave loading. Typically, ocean waves are thought to be a random ergodic process. The other option is to consider the process as being reliant on specific environmental parameters, the fluctuation of which in time may be described as an ergodic process on its own.
The response vector process R(t) = (X(t), Y(t), Z(t), … ) has been simulated/measured for a long period (0, T) for MDOF offshore structure. Over the entire time duration (0, T), one-dimensional global maxima are indicated as
When one speaks of a sufficiently long period T, one is referring to a large value of T in proportion to the dynamic system auto-correlation time. At distinct time instants that is monotonically rising, let X1,…,XNX be consequent in time local maxima of the process X(t). Other MDOF response components Y (t), Z(t), … with Y1, … ,YNY;Z1, … ,ZNZ and so on have a similar definition. All R (t) components and their maxima are considered to be non-negative for simplicity.
The goal is to accurately determine the probability of exceedance:
where
is a non-exceedance probability of response component’s critical values ηX,ηY,ηZ,…; U denotes ‘or’ logic operator; and is a joint probability distribution of global maxima across the full period (0,T). However, due to its large dimensionality and limited data set, it is not possible to estimate the joint probability distribution directly in practice.
More specifically, the system is considered to have failed instantly when either X(t) exceeds ηX, or Y(t) exceeds ηY, or Z(t) exceeds ηZ, and so on. There are of course unique fixed failure levels ηX,ηY,ηZ,… for each unidimensional response component of R(t). , ,, and so on.
Now, local maxima time instant in monotonously non-decreasing order are arranged into one single merge time vector t1≤…≤tN. Note that ,N=NX+NY+ NZ+ …. The local maxima of structural response components either X(t) or Y(t), or Z(t) and so on is represented by tj. That is, using R(t) time record, all that is required is to constantly and concurrently check for local maxima in unidimensional response components and monitor MDOF limit vector (ηX,ηY,ηZ,…), exceedance in any of its components X, Y, Z, … Local maxima in unidimensional response components are combined into one temporal non-decreasing vector following merged time vector t1≤…≤tN. That is to say each local maxima Rj are actual encountered local maxima corresponding to either X(t) or Y(t), or Z(t) and so on. Finally, the unified limit vector (η1,…,ηN), with each component ηj is either ηX, ηY or ηZ and so on is introduced, depending on which of X(t) or Y(t), or Z(t) etc., will be in agreement with the current local maxima with the running index j.
To artificially decrease the response component’s limit values, a new MDOF limit vector with ,… is introduced where parameter λ(0<λ≤1) is a scaling parameter. With each component is either , or and so on. The unified limit vector is introduced. The probability P(λ) is automatically defined as the function of λ, and it is noted from Equation (2) that P≡P(1). The probability of non-exceedance P(λ) can be determined as follows
The next section explains the theory behind a cascade of approximations based on conditioning. The first approximation is a one-step memory approximation, similar to a Markov chain approximation in some measures. The first approximation, however, is not relevant to such an approximation.
The one-step memory approximation (will be referred to the conditioning level k =1) is introduced because of the reliance on neighbouring Rj is not insignificant in practice.
for 2≤j≤N (will be referred to as conditioning level k =2). Equation (4) introduces an approximation that can be further formulated as:
where 3≤j≤N (will be referred to as conditioning level k = 3), and so on. Figure 8 illustrates uncorrelated stochastic process local maxima utilized solely for demonstration purposes. To put it another way, the goal is to prevent cascade local inter-correlated exceedance by keeping track of each independent failure that occurs locally first in time.
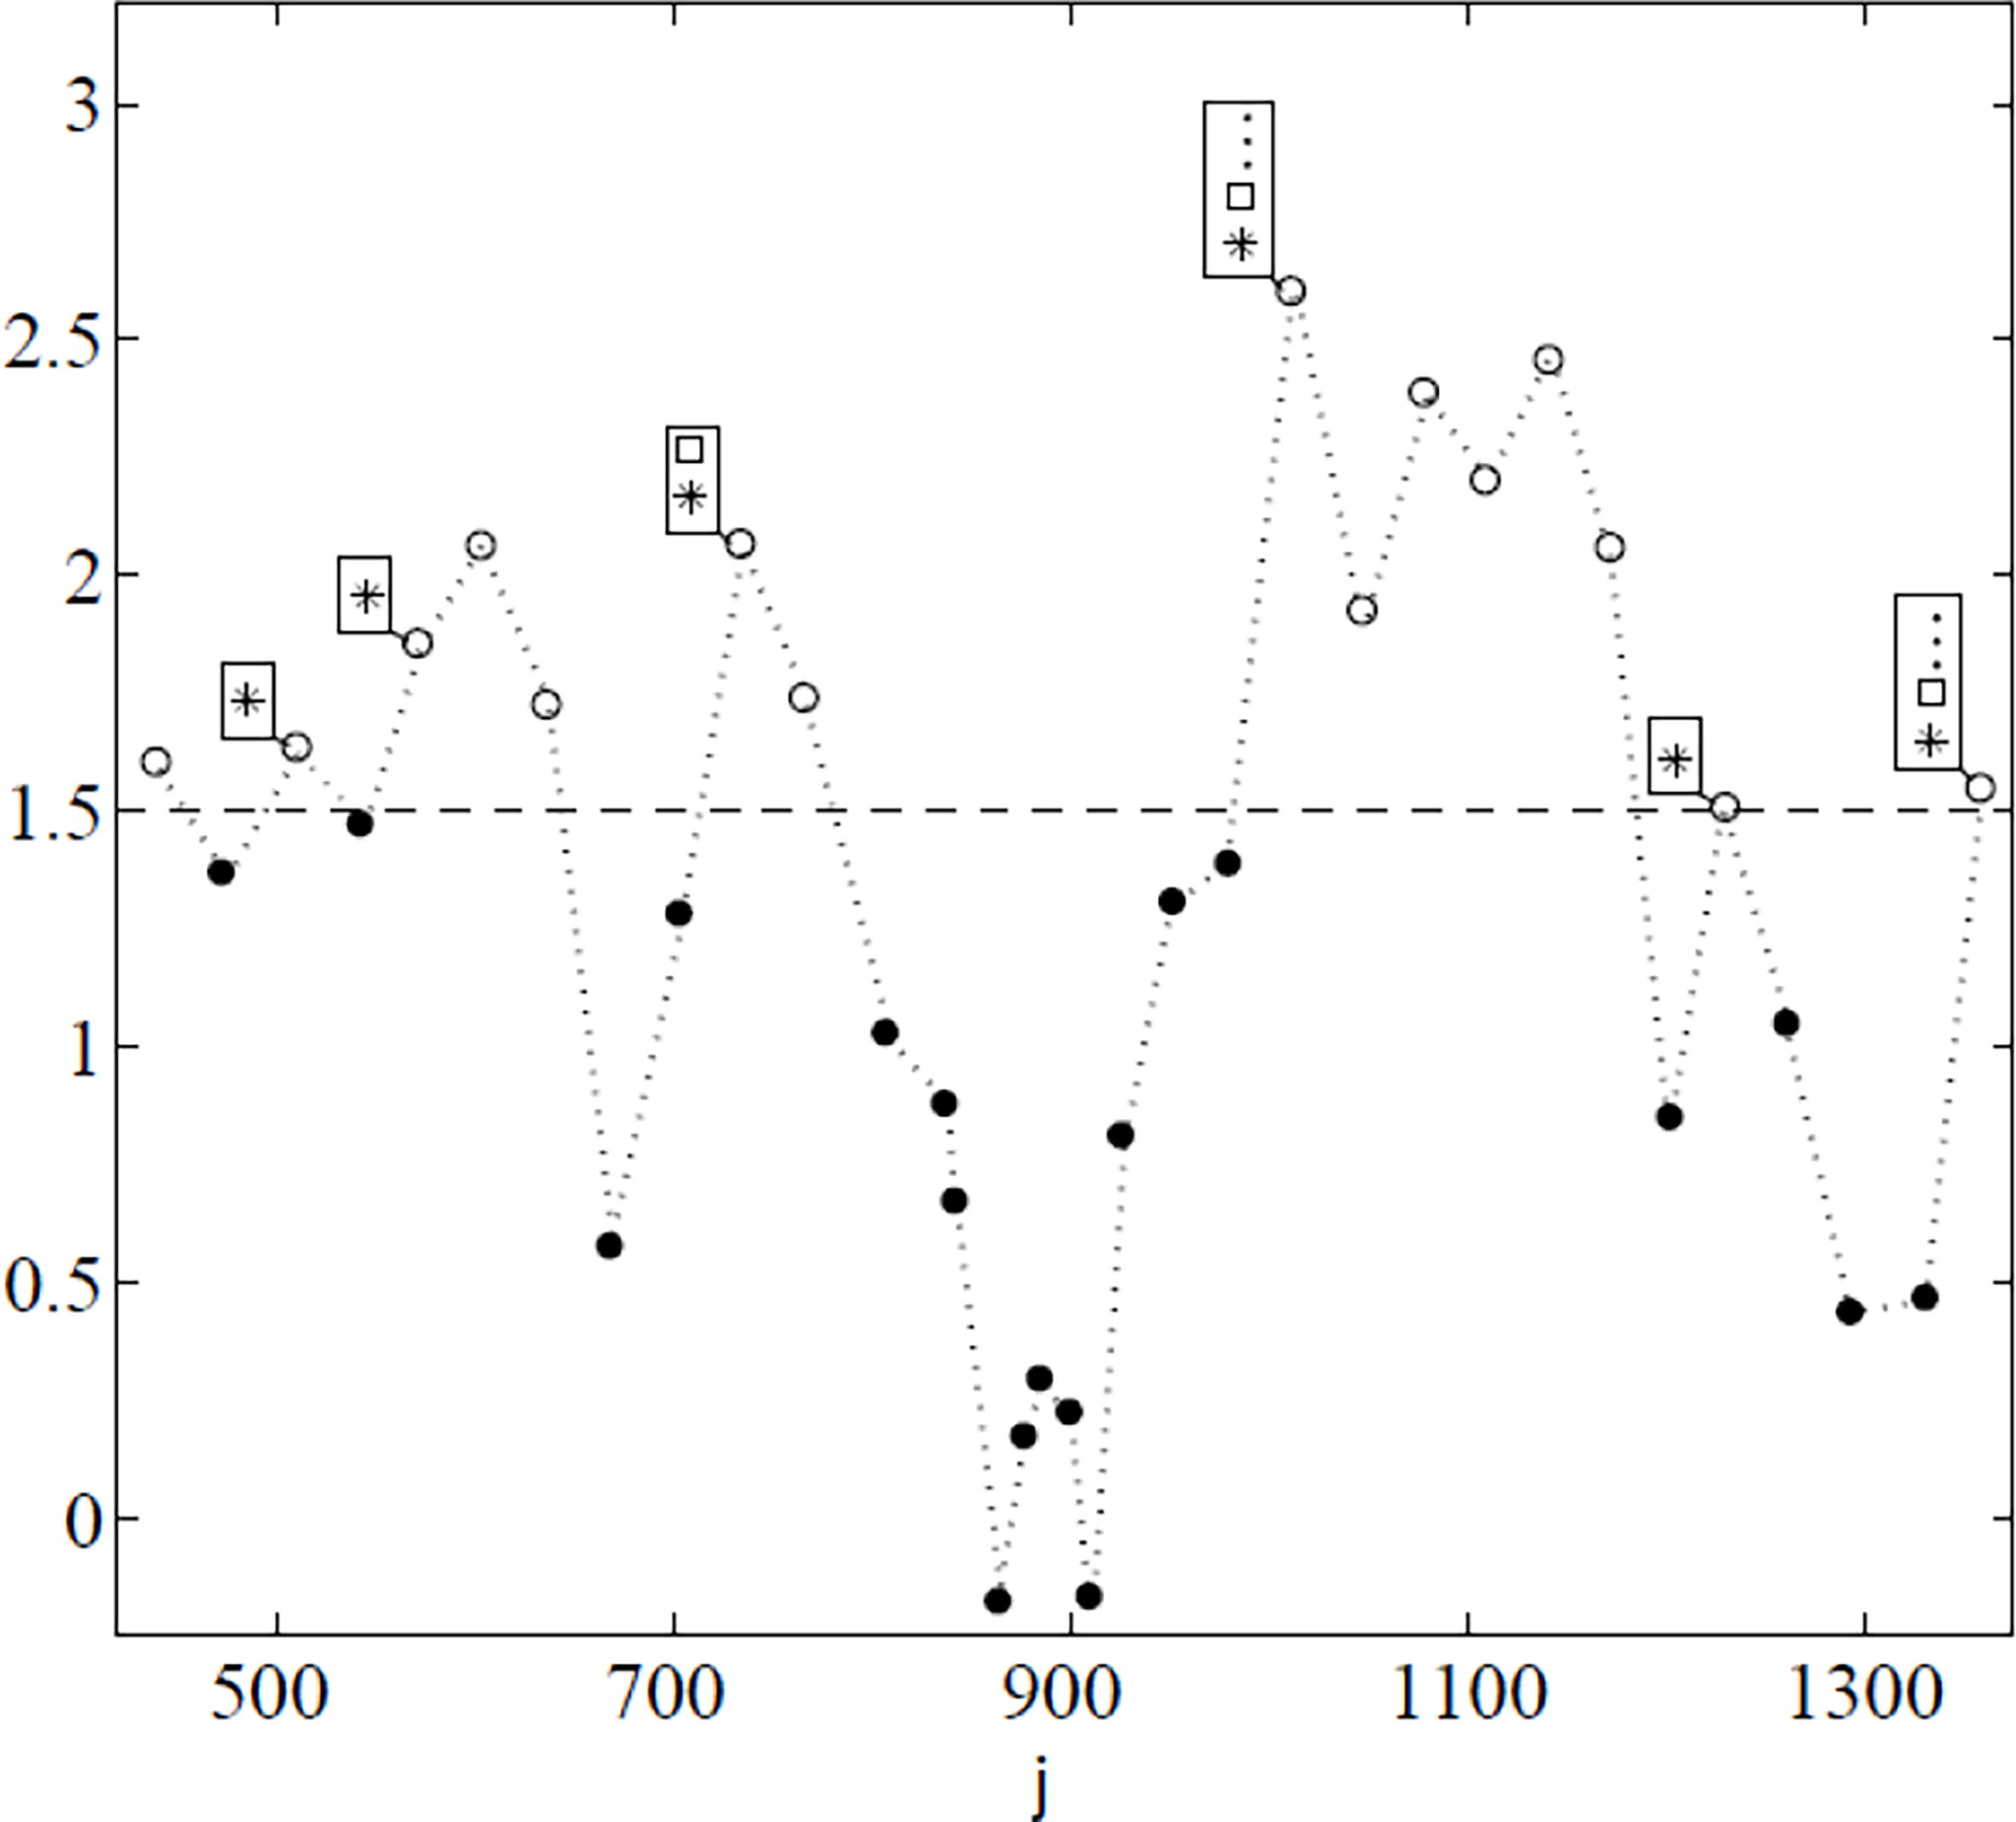
Figure 8 Counting of the exceedance for sampled time series with conditioning levels k = 1,…,3: ● -non-exceedances; ⁰ unconditional exceedances k = 1; * -conditional exceedances with k = 2; □ - with k = 3. Exceedances considered for k > 3 are indicated by three dots (…) within rectangles. λ = 1.5 was arbitrarily picked as the threshold level.
The statistical independence assumption is further refined in Equation (5). The last-mentioned approximation enables a more precise capture of the statistical dependency effect between neighbouring maxima. The probability for j≥k will only be dependent on conditioning level k but independent of j because the initial MDOF process R(t) was considered to be ergodic and therefore stationary. As a result, the probability of non-exceedance can be approximately determined using the average conditional exceedance rate technique, as described in (Naess et al., 2012; Gaidai et al., 2016).
It should be noted that Equation (6) is derived from Equation (2) by omitting , as the probability of design failure must be extremely low. It is also assumed N”k. The probability can be estimated using the average conditional exceedance rate technique as Equation (6) is similar to the mean up-crossing rate equation for exceedance probability. With regards to conditioning parameter k, there is a clear convergence.
It should be noted that for k = 1, Equation (6) yields the well-known probability of non-exceedance relationship with a mean up-crossing rate function.
For the above non-dimensional vector R(t) formed from the scaled MDOF system response represents the mean up-crossing rate of the response level λ. Rice formula in Equation (8) gives the mean up-crossing rate where pRR is joint probability density for and being time derivative R′(t) (Rice, 1944). Equation (8) is based on Poisson’s assumption, which states that high λ level up-crossing events can be considered to be independent (in this work λ≥1 is used). This may not be the case for high-level dynamical systems and narrowband responses that display cascade failures in multiple dimensions, following in time, caused by inherent inter-dependency among extreme events, manifested as highly correlated clusters of local maxima inside assembled vector .
The stationarity assumption has been used in the preceding. The proposed novel methodology, however, can also handle non-stationary cases. The depiction of the non-stationary cases will be done for naval architecture and offshore engineering areas of applications. For the given scattered diagram of sea states m = 1,…,M, the probability of each short-term sea state is qm, so that . Now, let’s introduce the long-term equation.
where pk (λ, m) is the same function as in Equation (7), but for the particular short-term sea state with the number m.
It should be noted that the accuracy of the proposed methodology for a wide range of one-dimensional systems has been successfully validated by authors in past years (Naess and Gaidai, 2008; Naess and Gaidai, 2009; Naess and Moan, 2013; Gaidai et al., 2018; Gaidai et al., 2020; Xu et al., 2022). Probability can be estimated approximately as in the average conditional exceedance rate method.
Following that, Naess-Gaidai (NG, also referred to as the Average Conditional Exceedance Rate) methodology (Naess and Gaidai, is briefly described since it will be utilized as the foundation for failure probability distribution tail extrapolation, asymptotically being the Gumbel distribution type. The last-mentioned approach is based on the idea that the class of parametric functions required for distribution tail extrapolation can be modelled similar to the general extreme value (GEV) distribution and Gumbel distribution relationship.
Unfortunately, the extreme values obtained from the sampled time series do not always form the asymptotic distribution or proving that they are asymptotic can be difficult. This suggests that we should broaden our scope of study to include sub-asymptotic levels. As a result, the asymptotic Gumbel functional class is extended to the Naess-Gaidai (NG) class of sub-asymptotic distributions.
pk (λ) which is introduced as a function in Equation (9) are often regular in the tail, particularly for λ approaching and exceeding 1. The distribution tail behaves similar to exp {- (aλ + b)c + d} for λ≥λ0, where a,b,c,d are the suitably fitted constant for an appropriate tail cut-on value λ0. Therefore, one can write:
Close to perfectly linear tail behavior is frequently observed when ln {ln(pk(λ))-dk} and ln (akλ + bk) are plotted against each other.
It is an advantage to do the logarithmic level optimization by lowering the following error function F with regards to four parameters ak, bk, ck, pk, qk.
with λ1 is an appropriate distribution tail cut-off value, where confidence interval width is still acceptable for maximum wave height. The sequential quadratic programming (SQP) technique incorporated in the NAG numerical library is used to determine the optimal values of the parameters ak, bk, ck, pk, qk (Numerical Algorithms Group, 2010).
Weight function ω can be given as ω (λ) = {lnCl+(λ) – lnCl-(λ)}-2 where confidence interval (CI) (Cl-(λ) and Cl+(λ)) can be determined empirically from measured or simulated data sets and can be approximated as in the average exceedance rate technique. The distribution is closed to the Gumbel distribution when the parameter is equal to or close to 1.
The series of conditional exceedance above a threshold λ for any general ergodic wind speed and wave height process can be considered to be a Poisson process, albeit a non-homogeneous one. The approximate limits of a p-% confidence interval (CI) of pk(λ) for levels of λ approaching 1 can be given as follows:
where f(p) is determined from the inverse normal distribution; for example, f(90%) = 1.65, f(95%) = 1.96 and N is the total number of local maxima in the analyzed vector .
Results and discussions
It is always difficult and challenging to analyze the dynamics of FOWT due to its cross-correlated and highly non-linear multi-dimensional dynamic system. Furthermore, a system reliability study is critical for FOWTs that are constantly exposed to real and sometimes harsh surrounding conditions. This section aims to demonstrate the effectiveness and efficiency of the method mentioned above by employing it in the three real FOWT responses: tower fore-aft bending moment, blade root out-of-plane bending moment, and anchor tension.
The real-life application of the above-mentioned methodology is described in this section. The FOWT components X, Y, Z provide an example of three dimensional (3-D) dynamic system. The simulated maximum value of each dimension (channel) was doubled and then us as an example of the failure value of interest.
The scaling was performed to unify all three measured time series and make them non-dimensional, which is shown in Equation (13).
The failure limit of all three responses is equal to 1. Following that, all local maxima from three measure time series were combined to form a single time series by keeping them in time non-decreasing order: with each set {Xj, Yj, Zj} in are arranged according to non-decreasing times of occurrence of these local maxima.
The three non-dimensional components of the 3D vector . Each component consists of one of the critical FOWT responses illustrated in Figure 9.
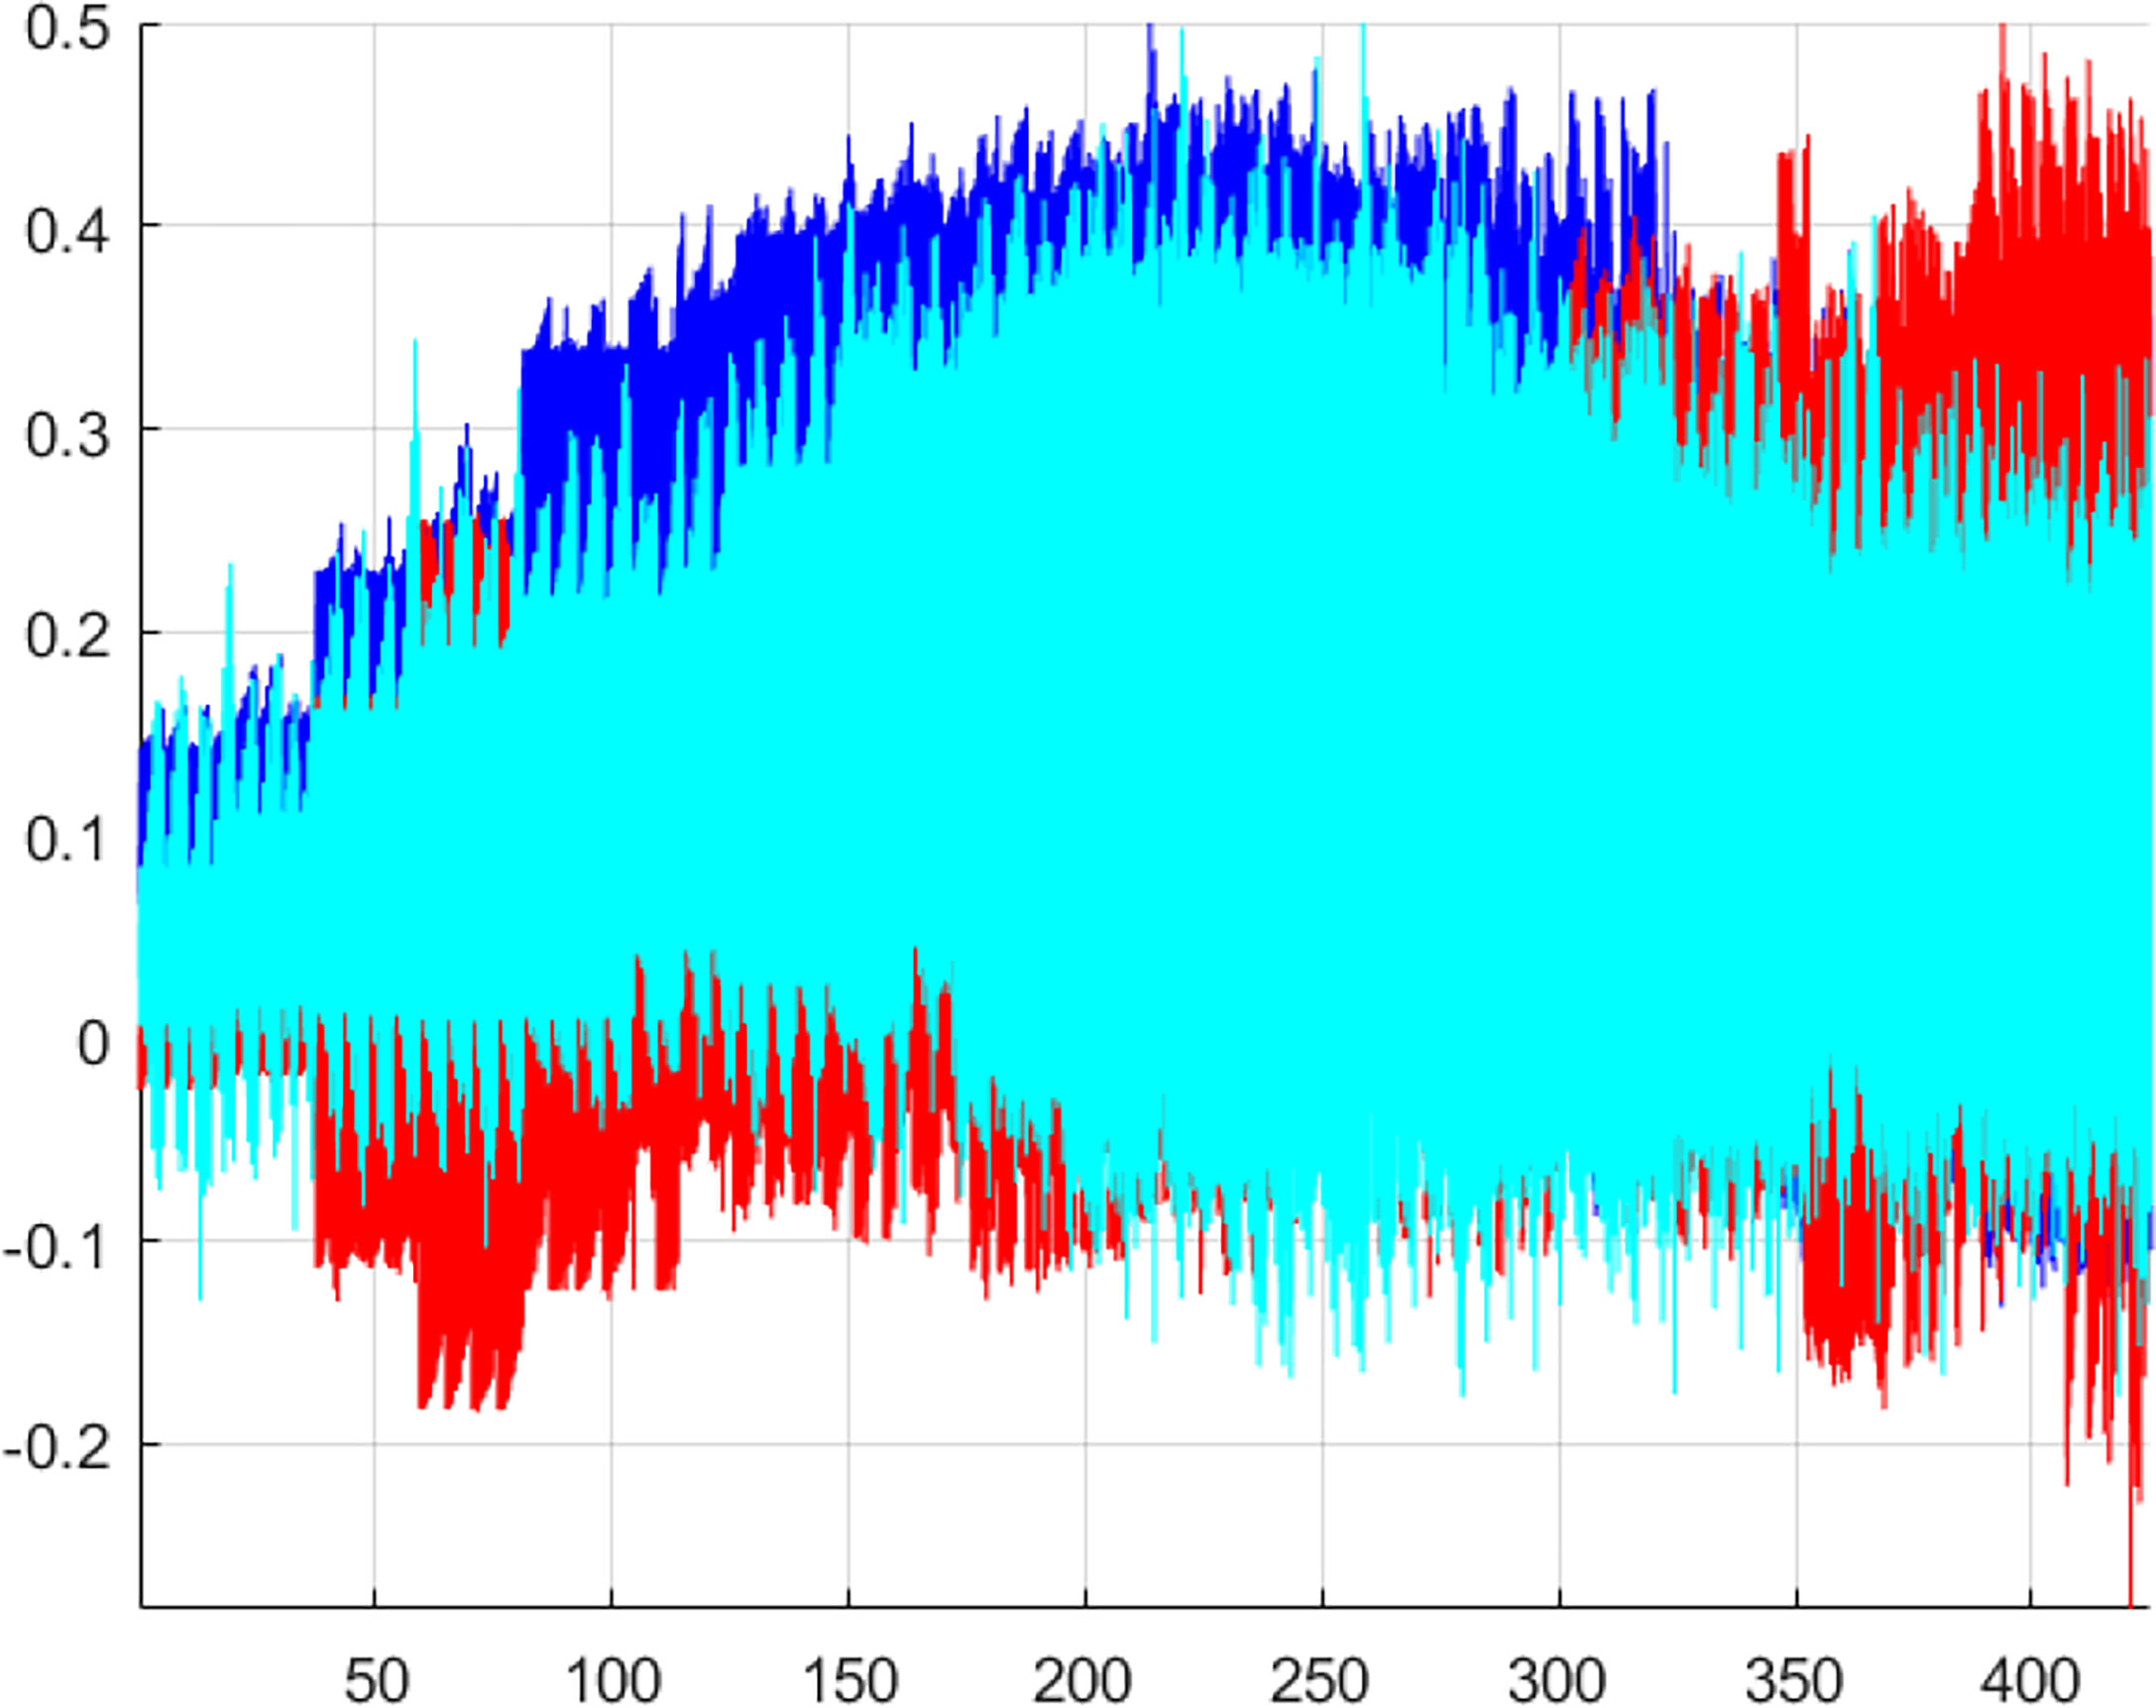
Figure 9 Non-dimensional X, Y, Z components of the 3D vector .
Figure 10 illustrates the extrapolation according to Equation (10) toward a critical state with a return period of 1 year. The cut-on value λ = 0.35 was selected, and lower values λ≥0 were not important for failure probability tail extrapolation towards the target λ = 1. The 1 year return period was chosen as the target system failure probability level. It should be noted that a vector is created from entirely different response components with different measurement units, so it has no physical significance on its own. Index j is just a running index of non-decreasing time sequence local maxima.
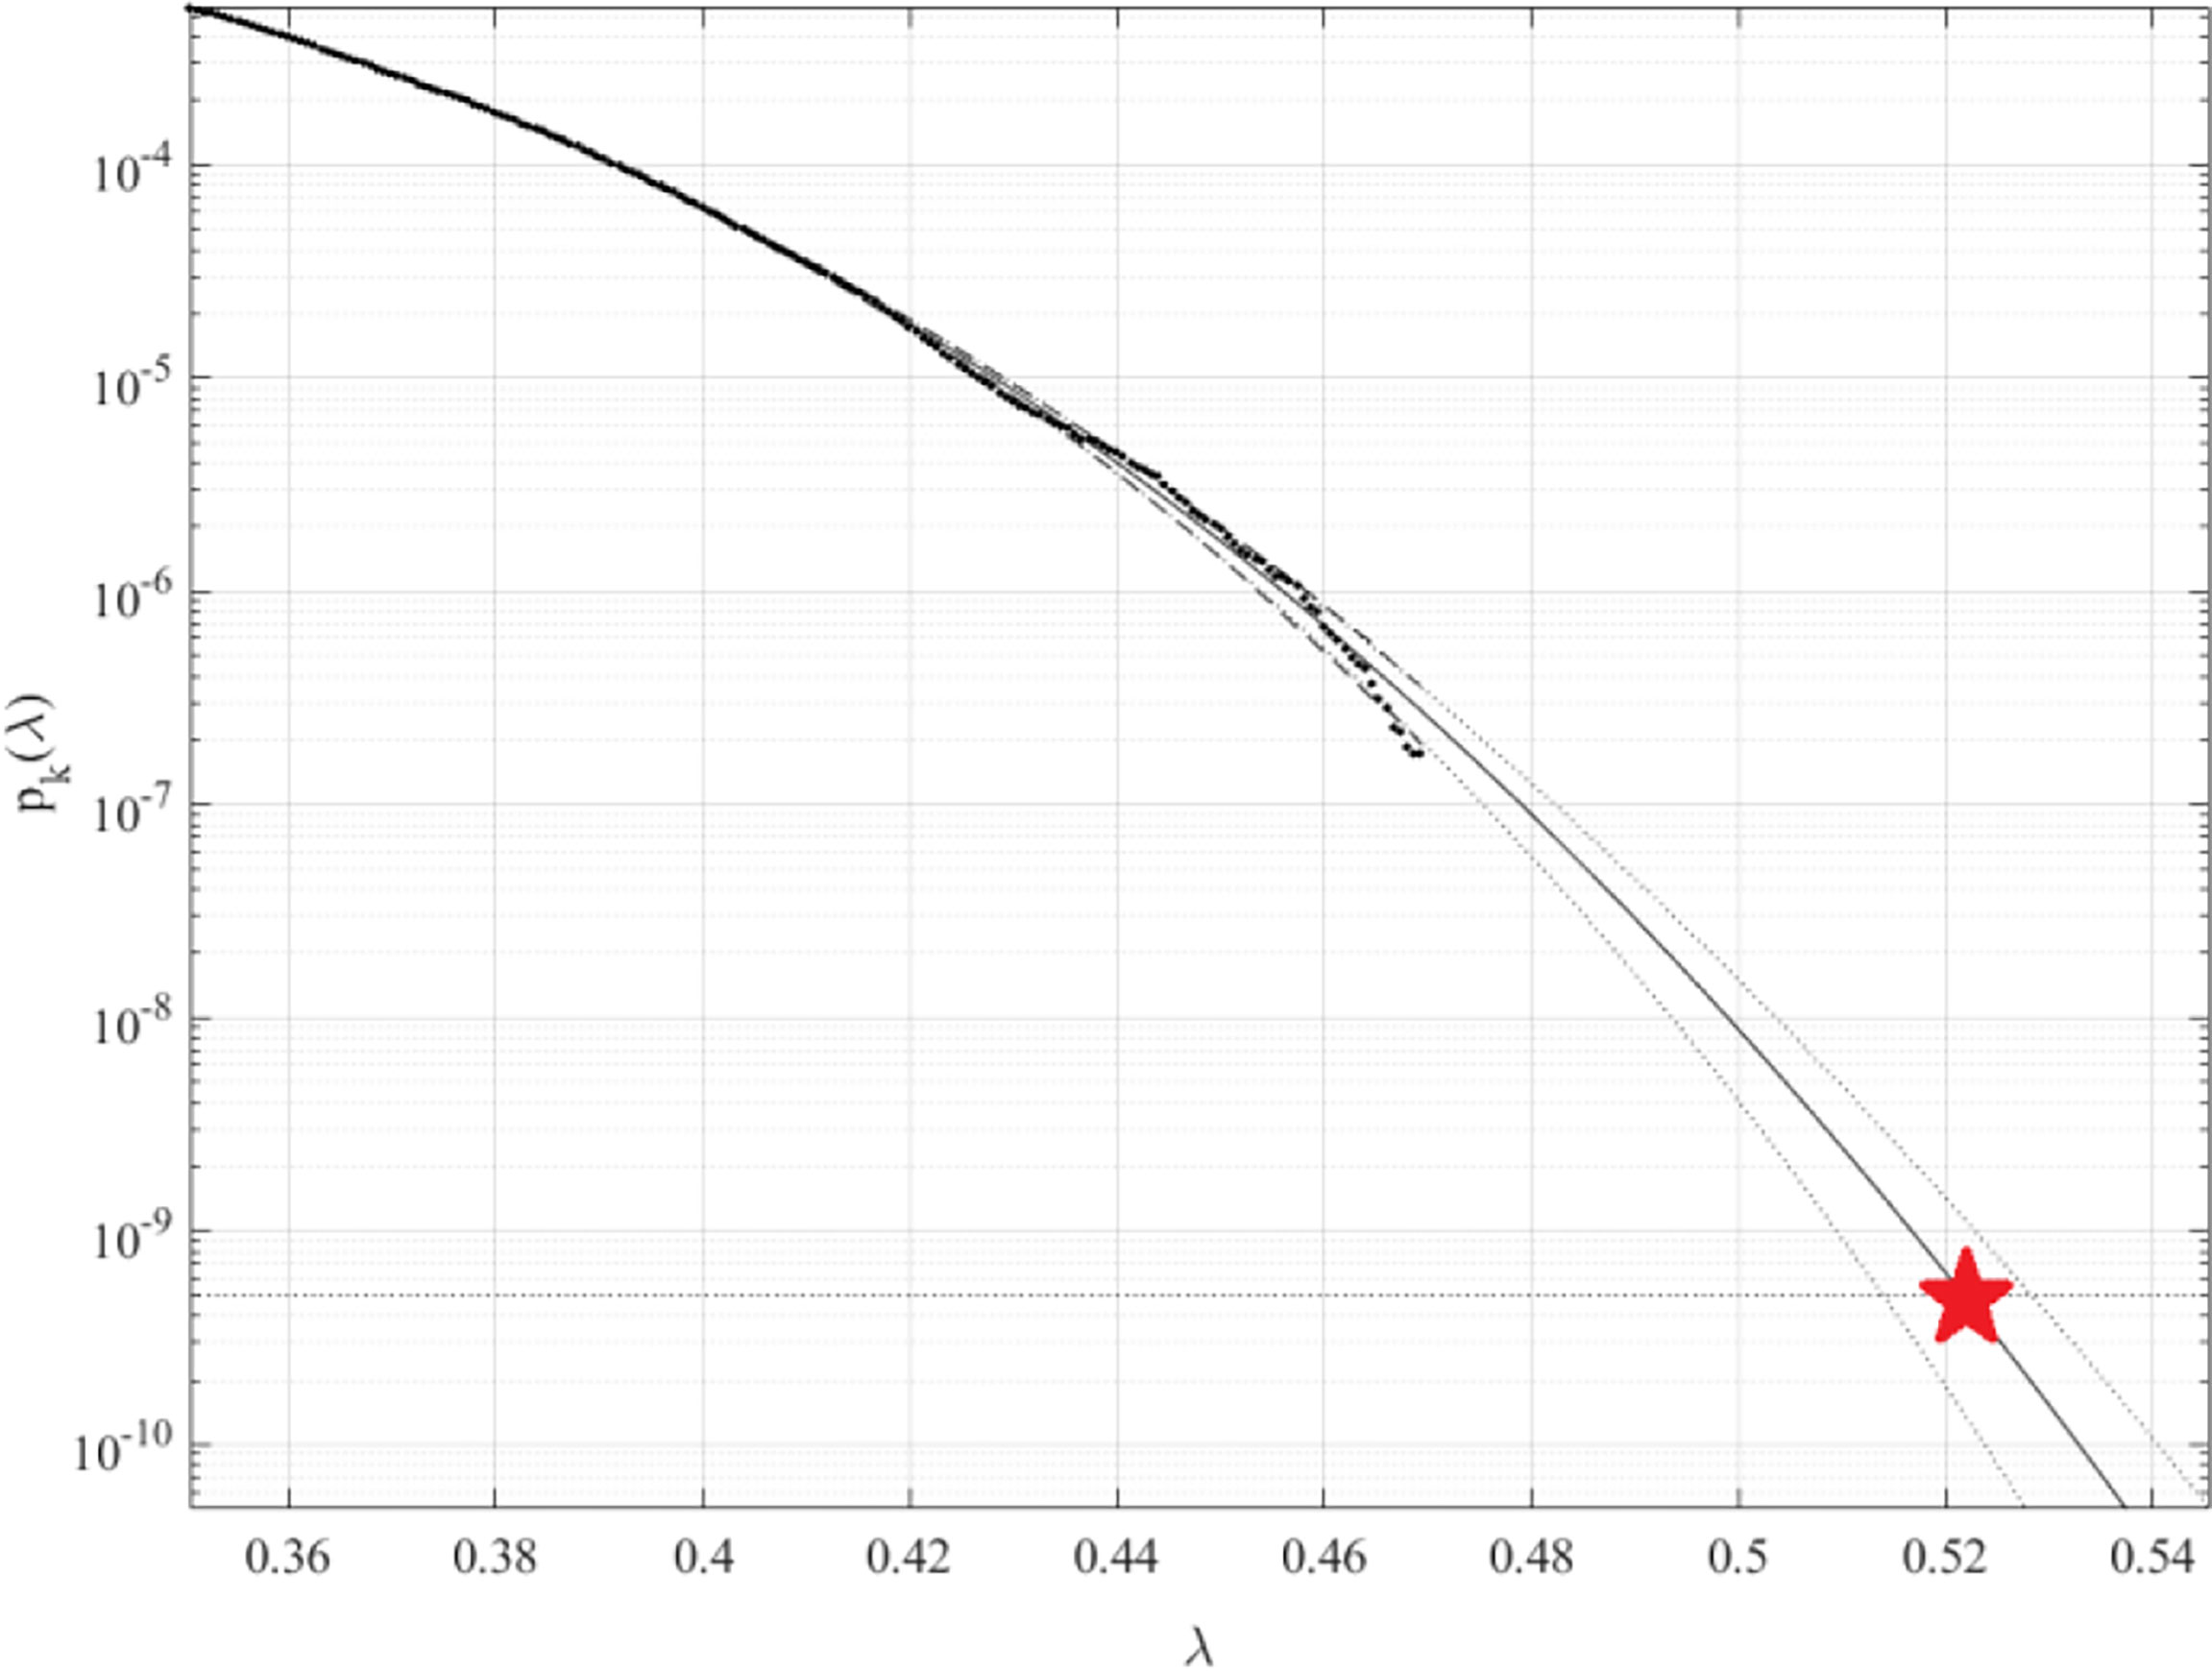
Figure 10 pk(λ) extrapolated to critical level (displayed by a star) and beyond,k = 6. Dotted lines shows the extrapolated 95% confidence interval.
According to Equation (11), the dotted line represents extrapolated the 95% confidence interval. Equation (6) shows that p(λ) is directly linked to the target probability of failure 1 - P from Equation (2). As a result, system failure probability 1−P≈1−Pk(1) can be estimated in agreement with Equation (6). The total number of local maxima in the unified response vector corresponds to N in Equation (6). Due to the occurrence of convergence with regards to k, the conditioning parameter k = 6 was found to be adequate, see Equation (7). Figure 10 illustrates a relatively narrow confidence interval of 95% due to the large quantity of data used in this study.
Because of its ability to tackle the system multi-dimensionality and conduct effective extrapolation based on a minimal data set, the above-mentioned novel methodology has the evident benefit of being able to utilize the available measured/simulated data sets rather effectively.
Conclusions
The key advantage of the introduced reliability methodology is its ability to study the reliability of high-dimensional non-linear dynamic systems. Classic reliability methods dealing with time series do not have the advantage of dealing efficiently with systems possessing high dimensionality and cross-correlation between different system responses. Early identification of stochastic and unexpected failures owing to dynamic responses of FOWTs during the design stage contributes to reducing the operation and maintenance expenses.
This paper analyzed the dynamic responses of a site-specific semi-submersible FOWT under normal production conditions. Three critical loads were analyzed, including blade root out-of-plane bending moment, tower base fore-aft bending moment, and mooring line tension. The proposed novel reliability method was applied to FOWT reliability as a multi-dimensional system using OpenFAST to simulate loads of the target FOWT. Theoretical reasons behind the proposed method were given in detail. It should be noted that direct measurement or Monte Carlo simulation for dynamic system reliability analysis is attractive. However, dynamic system complexity and its high dimensionality require the development of novel robust and accurate techniques that are able to deal with a limited data set at hand, utilizing available data as efficiently as possible.
The target system failure probability level was chosen to correspond to a 1 year return period. The predicted reliability parameter λ was found to be almost twice less than 1, therefore indicating a safe structural design. The method introduced in this paper has been previously validated by the application to a wide range of simulation models, but for only one-dimensional system responses, and, in general, very accurate predictions were obtained. This paper aims to further develop a general purpose yet robust and simple multi-dimensional reliability method. It is shown that the proposed method generated a reasonable confidence interval. Thus, the suggested methodology may become an appropriate tool for the reliability of the FOWT system.
Unlike other reliability methods, the new method does not require re-starting numerical simulation each time the system of the FOWT fails, as in the case of Monte Carlo type numerical simulation. In the case of measured structural response, as illustrated in this paper, an accurate prediction of system failure probability is also possible, which is beneficial for quantitatively analyzing the structural reliability of the FOWT considering multi-dimensionality in the design stage.
Data availability statement
The raw data supporting the conclusions of this article will be made available by the authors, without undue reservation.
Author contributions
All authors contributed to conception and design of the study. XX and OG developed the models necessary for the study. KW and PKS performed the analyzes and made the results. XX, YX, OG and KS wrote the first draft of the manuscript. OG, YX, and ZZ supervised the work. All authors reviewed and edited the manuscript. All authors contributed to manuscript revision, read, and approved the submitted version.
Acknowledgments
The authors acknowledge funding support from the National Natural Science Foundation of China [Grant No. 52101314; Grant No. 51909109] and the Natural Science Foundation of Jiangsu Province [Grant No. BK20190967].
Conflict of interest
The authors declare that the research was conducted in the absence of any commercial or financial relationships that could be construed as a potential conflict of interest.
Publisher’s note
All claims expressed in this article are solely those of the authors and do not necessarily represent those of their affiliated organizations, or those of the publisher, the editors and the reviewers. Any product that may be evaluated in this article, or claim that may be made by its manufacturer, is not guaranteed or endorsed by the publisher.
References
Bayati I., Jonkman J., Robertson A., Platt A. (2014). The effects of second-order hydrodynamics on a semisubmersible floating offshore wind turbine. In Journal of Physics: Conference Series 524 (1), 012094. IOP Publishing.
Benitz M. A., Schmidt D. P., Lackner M. A., Stewart G. M., Jonkman J., Robertson A. (2015)"Validation of hydrodynamic load models using CFD for the OC4-DeepCwind semi-submersible." (Accessed National Renewable Energy Lab.(NREL)).
Chen P., Chen J., Hu Z. (2021). Software-in-the-Loop combined reinforcement learning method for dynamic response analysis of FOWTs. Front. Mar. Sci. 7, 1242. doi: 10.3389/fmars.2020.628225
Cheng Y., Dai S., Dai S., Ji C., Collu M., Yuan Z., et al. (2022). Energy conversion and hydrodynamic analysis of multi-degree-of-freedom wave energy converters integrated into a semi-submersible platform. Energy Conver. Manage. 252, 115075. doi: 10.1016/j.enconman.2021.115075
Coulling A. J., Goupee A. J., Robertson A. N., Jonkman J. M., Dagher H. J. (2013). Validation of a FAST semi-submersible floating wind turbine numerical model with DeepCwind test data. J. Renewable Sustain. Energy 5 (2), 023116. doi: 10.1063/1.4796197
Dimitrov N. (2016). Comparative analysis of methods for modelling the short-term probability distribution of extreme wind turbine loads. Wind. Energy 19 (4), 717–737. doi: 10.1002/we.1861
Ditlevsen O., Bjerager P. (1986). Methods of structural systems reliability. Struct. Saf. 3 (3-4), 195–229. doi: 10.1016/0167-4730(86)90004-4
Gaidai O., Cheng Y., Xu X., Su Y. (2018). Long-term offshore bohai bay jacket strength assessment based on satellite wave data. Ship. Offshor. Struct. 13 (6), 657–665. doi: 10.1080/17445302.2018.1444346
Gaidai O., Storhaug G., Naess A. (2016). Extreme large cargo ship panel stresses by bivariate ACER method. Ocean. Eng. 123, 432–439. doi: 10.1016/j.oceaneng.2016.06.048
Gaidai O., Xu X., Sahoo P., Ye R., Cheng Y. (2021). Extreme hawser tension assessment for FPSO vessel during offloading operation in bohai bay. Mar. Struct. 76, 102917. doi: 10.1016/j.marstruc.2020.102917
Gaidai O., Xu X., Wang J., Ye R., Cheng Y., Karpa O. (2020). SEM-REV offshore energy site wind-wave bivariate statistics by hindcast. Renewable Energy 156, 689–695. doi: 10.1016/j.renene.2020.04.113
Ghane M., Rasekhi Nejad A., Blanke M., Gao Z., Moan T. (2018). Condition monitoring of spar-type floating wind turbine drivetrain using statistical fault diagnosis. Wind. Energy 21 (7), 575–589. doi: 10.1002/we.2179
Graf P., Dykes K., Damiani R., Jonkman J., Veers P. (2018). Adaptive stratified importance sampling: hybridisation of extrapolation and importance sampling Monte Carlo methods for estimation of wind turbine extreme loads. Wind. Energy Sci. 3 (2), 475–487. doi: 10.5194/wes-3-475-2018
Hall M. (2015). MoorDyn user's guide Vol. 15 (Orono, ME, USA: Department of Mechanical Engineering, University of Maine).
Head M., Shokouhian M., Schaffer W. (2016) Foundation anchorages for offshore wind turbines in deep water using composite materials. Available at: https://www.pmel.noaa.gov/co2/story/Cape+Elizabeth.
International Electrotechnical Commission (2009). “IEC 61400-3 wind turbines Part3,” in Design requirements for offshore wind turbines. international electrotechnical commission (Geneva, Switzerland: Proceedings of the IEC).
International Electrotechnical Commission (2019). Wind energy generation system–part, 12019. (Geneva, Switzerland: Proceedings of the IEC).
Jonkman B. J., Buhl J. M.L. (2006). TurbSim user's guide (No. NREL/TP-500-39797) (CO (United States: National Renewable Energy Lab.(NREL), Golden).
Jonkman J., Musial W. (2010). Offshore code comparison collaboration (OC3) for IEA wind task 23 offshore wind technology and deployment (No. NREL/TP-5000-48191) (CO (United States: National Renewable Energy Lab.(NREL), Golden).
Jonkman J. M., Robertson A., Hayman G. J. (2014). HydroDyn user's guide and theory manual. United States: National Renewable Energy Lab.(NREL), Golden.
Kang J., Sun L., Soares C. G. (2019). Fault tree analysis of floating offshore wind turbines. Renewable Energy 133, 1455–1467. doi: 10.1016/j.renene.2018.08.097
Li J., Bian J., Chuang Z., Jiang Y., Leng S. (2022). Impact of pitch actuator fault on 10-MW semi-submersible floating wind turbine. Ocean. Eng. 254, 111375. doi: 10.1016/j.oceaneng.2022.111375
Li H., Hu Z., Wang J., Meng X. (2018). Short-term fatigue analysis for tower base of a spar-type wind turbine under stochastic wind-wave loads. Int. J. Naval. Architec. Ocean. Eng. 10 (1), 9–20. doi: 10.1016/j.ijnaoe.2017.05.003
Li L., Liu Y., Yuan Z., Gao Y. (2019). Dynamic and structural performances of offshore floating wind turbines in turbulent wind flow. Ocean. Eng. 179, 92–103. doi: 10.1016/j.oceaneng.2019.03.028
Li H., Soares C. G., Huang H. Z. (2020a). Reliability analysis of a floating offshore wind turbine using Bayesian networks. Ocean. Eng. 217, 107827. doi: 10.1016/j.oceaneng.2020.107827
Li H., Teixeira A. P., Soares C. G. (2020b). A two-stage failure mode and effect analysis of offshore wind turbines. Renewable Energy 162, 1438–1461. doi: 10.1016/j.renene.2020.08.001
Melchers R. E., Beck A. T. (2018). Structural reliability analysis and prediction (John wiley & sons).
Moan T., Gao Z., Bachynski E. E., Nejad A. R. (2020). Recent advances in integrated response analysis of floating wind turbines in a reliability perspective. J. Offshor. Mechanic. Arctic. Eng. 142 (5), 052002. doi: 10.1115/1.4046196
Naess A., Gaidai O. (2008). Monte Carlo Methods for estimating the extreme response of dynamical systems. J. Eng. Mechanic. 134 (8), 628–636. doi: 10.1061/(ASCE)0733-9399(2008)134:8(628)
Næss A., Gaidai O. (2009). Estimation of extreme values from sampled time series. Struct. Saf. 31 (4), 325–334. doi: 10.1016/j.strusafe.2008.06.021
Naess A., Leira B. J., Batsevych O. (2012). Reliability analysis of large structural systems. Probabilist. Eng. Mechanic. 28, 164–168. doi: 10.1016/j.probengmech.2011.08.024
NREL (2022). Available at: https://github.com/OpenFAST/openfast2022.
Perdrizet T., Averbuch D. (2011). Short and Long Term Extreme Reliability AnalysisApplied to Floating Wind Turbine Design. 30th International Conference on OffshoreMechanics and Arctic Engineering, Rotterdam, Netherlands, OMAE2011-50264. doi: 10.1115/OMAE2011-50264
Popko W., Vorpahl F., Zuga A., Kohlmeier M., Jonkman J., Robertson A., et al. (2012). “Offshore code comparison collaboration continuation (OC4), phase 1-results of coupled simulations of an offshore wind turbine with jacket support structure”, in The twenty-second international offshore and polar engineering conference. OnePetro. United States: National Renewable Energy Lab.(NREL), Golden.
Rice S. O. (1944). Mathematical analysis of random noise. Bell. Syst. Tech. J. 23 (3), 282–332. doi: 10.1002/j.1538-7305.1944.tb00874.x
Robertson A. N., Gueydon S., Bachynski E., Wang L., Jonkman J., Alarcón D., et al. (2020). OC6 phase I: Investigating the underprediction of low-frequency hydrodynamic loads and responses of a floating wind turbine. J. Phys.: Conf. Ser. 1618, 032033. doi: 10.1088/1742-6596/1618/3/032033
Robertson A., Jonkman J., Wendt F., Goupee A., Dagher H. (2016a). Definition of the OC5 DeepCwind semi-submersible floating system. technical report. United States: National Renewable Energy Lab.(NREL), Golden.
Robertson A. N., Wendt F., Jonkman J. M., Popko W., Borg M., Bredmose H., et al. (2016b). OC5 project phase ib: Validation of hydrodynamic loading on a fixed, flexible cylinder for offshore wind applications. Energy Proc. 94, 82–101. doi: 10.1016/j.egypro.2016.09.201
Rostam-Alilou A. A., Zhang C., Salboukh F., Gunes O. (2022). Potential use of Bayesian networks for estimating relationship among rotational dynamics of floating offshore wind turbine tower in extreme environmental conditions. Ocean. Eng. 244, 110230. doi: 10.1016/j.oceaneng.2021.110230
Sheng C., Hong H. P. (2021). Reliability and fragility assessment of offshore floating wind turbine subjected to tropical cyclone hazard. Struct. Saf. 93, 102138. doi: 10.1016/j.strusafe.2021.102138
Xu X., Gaidai O., Karpa O., Wang J., Ye R., Cheng Y. (2021). Wind farm support vessel extreme roll assessment while docking in the bohai Sea. China Ocean. Eng. 35 (2), 308–316. doi: 10.1007/s13344-021-0028-x
Xu X., Gaidai O., Naess A., Sahoo P. (2019). Improving the prediction of extreme FPSO hawser tension, using another highly correlated hawser tension with a longer time record. Appl. Ocean. Res. 88, 89–98. doi: 10.1016/j.apor.2019.04.015
Xu X., Gaidai O., Naess A., Sahoo P. (2020). Extreme loads analysis of a site-specific semi-submersible type wind turbine. Ship. Offshor. Struct. 15 (sup1), S46–S54. doi: 10.1080/17445302.2020.1733315
Xu S., Ji C. Y., Soares C. G. (2018). Experimental and numerical investigation a semi-submersible moored by hybrid mooring systems. Ocean. Eng. 163, 641–678. doi: 10.1016/j.oceaneng.2018.05.006
Xu S., Ji C. Y., Soares C. G. (2021). Short-term extreme mooring tension and uncertainty analysis by a modified ACER method with adaptive Markov chain Monte Carlo simulations. Ocean. Eng. 236, 109445. doi: 10.1016/j.oceaneng.2021.109445
Xu X., Wang F., Gadai O., Naess A., Xing Y., Wang J. (2022). Bivariate statistics of floating offshore wind turbine dynamic response under operational conditions. Ocean. Eng. 257, 11657. doi: 10.1016/j.oceaneng.2022.111657
Yang Y., Bashir M., Michailides C., Mei X., Wang J., Li C. (2021). Coupled analysis of a 10 MW multi-body floating offshore wind turbine subjected to tendon failures. Renewable Energy 176, 89–105. doi: 10.1016/j.renene.2021.05.079
Yang Y., Bashir M., Wang J., Michailides C., Loughney S., Armin M., et al. (2020). Wind-wave coupling effects on the fatigue damage of tendons for a 10 MW multi-body floating wind turbine. Ocean. Eng. 217, 107909. doi: 10.1016/j.oceaneng.2020.107909
Zhang C., Wang S., Xie S., He J., Gao J., Tian C. (2022). Effects of mooring line failure on the dynamic responses of a semi-submersible floating offshore wind turbine including gearbox dynamics analysis. Ocean. Eng. 245, 110478. doi: 10.1016/j.oceaneng.2021.110478
Zhao Y., Dong S. (2021). Long-term extreme response analysis for semi-submersible platform mooring systems. proceedings of the institution of mechanical engineers, part m. J. Eng. Marit. Environ. 235 (2), 463–479. doi: 10.1177/1475090220976515
Keywords: floating offshore wind turbine (FOWT), failure probability, dynamic system, multi-dimensional reliability, environmental loads, renewable energy, Gaidai-Fu-Xing method
Citation: Xu X, Xing Y, Gaidai O, Wang K, Patel KS, Dou P and Zhang Z (2022) A novel multi-dimensional reliability approach for floating wind turbines under power production conditions. Front. Mar. Sci. 9:970081. doi: 10.3389/fmars.2022.970081
Received: 15 June 2022; Accepted: 08 July 2022;
Published: 03 August 2022.
Edited by:
Zhiming Yuan, University of Strathclyde, United KingdomReviewed by:
Renwei Ji, Harbin Engineering University, ChinaZhiyang Zhang, Jiangsu Ocean University, China
Copyright © 2022 Xu, Xing, Gaidai, Wang, Patel, Dou and Zhang. This is an open-access article distributed under the terms of the Creative Commons Attribution License (CC BY). The use, distribution or reproduction in other forums is permitted, provided the original author(s) and the copyright owner(s) are credited and that the original publication in this journal is cited, in accordance with accepted academic practice. No use, distribution or reproduction is permitted which does not comply with these terms.
*Correspondence: Yihan Xing, yihan.xing@uis.no; Oleg Gaidai, gaidai@shou.edu.cn