Use of valvometry as an alert tool to signal the presence of toxic algae Alexandrium catenella by Mytilus edulis
 Guillaume Durier1*
  Jean-Bruno Nadalini1
  Luc A. Comeau2
  Michel Starr3 Sonia Michaud3 Damien Tran4 Richard St-Louis5
  José M. F. Babarro6
  Jeff C. Clements2
  Réjean Tremblay1
- 1Institut des Sciences de la Mer, Université du Québec à Rimouski, Rimouski, QC, Canada
- 2Fisheries and Oceans Canada, Gulf Region Center, Moncton, NB, Canada
- 3Fisheries and Oceans Canada, Quebec Region, Institut Maurice Lamontagne, Mont-Joli, QC, Canada
- 4University of Bordeaux, and CNRS, EPOC, UMR 5805, Arcachon, France
- 5Département de biologie, chimie et géographie, Université du Québec à Rimouski, Rimouski, QC, Canada
- 6Instituto de Investigaciones Marinas-CSIC, Vigo, Spain
Valvometry is a non-invasive technique used to continuously monitor gaping behaviour of bivalves at high frequency. In previous laboratory studies, valvometry has revealed a behavioural sensitivity of bivalves to the presence of toxic microalgae in seawater. However, the application of valvometry as an early-warning system for detecting natural occurrences of toxic microalgae and their resulting toxicity in bivalves remains largely unexplored. In this study, valvometry was used to characterise changes in blue mussels (Mytilus edulis) gaping behaviour during gradual exposure to the toxic dinoflagellate, Alexandrium catenella, which produces paralytic shellfish toxins (PST). Laboratory experiments were first performed to identify specific gaping behaviour changes and these responses were subsequently validated in natural seawater conditions in a second experiment. Under both laboratory and natural seawater conditions, mussels exposed to A. catenella tended to remain open (yawning) longer than non-exposed mussels. This change in gaping behaviour was observed at PST concentration as low as 30 μg STXeq 100 g–1 of mussel tissue. We suggest that increased opening is likely related to temporary muscular paralysis induced by toxic algae, as this mechanism has been previously reported in other bivalve species. Furthermore, we observed that biological rhythms of valve behaviour related to tidal and daily rhythms were modified when mussels were intoxicated by PSP (Paralytic Shellfish Poisoning). In conclusion, the effects of toxic algae on mussel gaping behaviour reveals that valvometry could be used as an early-warning tool for the presence of toxic Alexandrium sp. in the environment prior to mussels reaching the regulatory threshold (80 μg STXeq 100 g–1) for harvest interdiction.
1 Introduction
Toxic algae are present in most aquatic ecosystems (Roelke, 2007), and represent around 300 species among the 5,000 species of marine phytoplankton known (Hallegraeff, 1993; Bates et al., 2020; McKenzie et al., 2021). Under certain environmental conditions, these algae can proliferate, causing toxic algae blooms known as “Harmful Algal Blooms” (HABs) (Anderson et al., 2011) that can negatively impact aquaculture activities through mass mortalities and/or harvest interruption to avoid human intoxication (Granéli, 2006). For example, in Nova Scotia, Canada, mass mortalities have been observed in salmon farming during an Alexandrium catenella bloom (Cembella et al., 2002). The dinoflagellate A. catenella can also be consumed by filter-feeding organisms such as bivalves before being bioaccumulated in higher trophic levels (Starr et al., 2017). In contrast to finfish, many bivalve species can safely ingest toxic algae, leading to toxin bioaccumulation in associated food webs. Harvesting bivalves for human consumption is interrupted during HABs when the toxin concentration reaches the 80 µg SAXeq 100g-1 until the concentration of toxins in bivalve tissues is reduced to levels safe for human consumption (Gouvernement du Canada, 2018). Given the continual growth of bivalve aquaculture worldwide (FAO, 2016), ways of detecting HABs prior to bivalve intoxication could aid in mitigating impacts to shellfish aquaculture industry.
One tool that has the potential to serve as an early-warning system for environmental stressors, including HABs, is bivalve valvometry (Andrade et al., 2016; Clements and Comeau, 2019). Valvometry is a non-invasive, high-frequency monitoring systems of the opening and closing behaviour of bivalves (Andrade et al., 2016). Herein, individual’s valve movements are measured with a small electrode sticked on one valve and a magnet on the other one. These electrodes are connected to a dynamic strain recorder, which translates the magnetic flux between the sensor and magnet into a voltage value proportional to the length of this opening. Thus, as bivalves open and close their valves, these movements can be empirically measured through changes in voltage readings produced by valvometry systems. Since bivalves typically respond to stressful events by modifying their gaping behaviour to avoid stressful conditions, behavioural indicators can be identified using high frequency valvometry and related to the presence and intensity of specific environmental stressors. As such, monitoring gaping behaviour through valvometry can be used to both detect and characterise the impact of environmental perturbations (Tran et al., 2003; Tran et al., 2010; Tran et al., 2015; Comeau et al., 2019).
Among bivalve species cultured worldwide, mussels are some of the most economically important. Mussel culture has continuously increased through time, with global Mytilus edulis production more than doubling from ≈100 KT in 1960 to >200 KT in 2000 (FAO, 2016). The main producers for the North American market are located on the east coast of Canada and exclusively culture blue mussels, Mytilus edulis (FAO, 2016). Naturally, these mussels form dense populations in temperate and boreal regions, generally residing on hard substrates of exposed or unexposed shores (Bayne, 1976). This species is located in the intertidal and subtidal zones and can be dominant, particularly in subarctic regions (Mathiesen et al., 2017). To feed, blue mussels filter and consume phytoplankton including diatoms and dinoflagellates, as well as some heterotrophic flagellates and bacteria (Trottet et al., 2008). From a valvometry research perspective, blue mussels (as well as other mussel species) are among the most well studied and can thus serve as a model species for contemporary valvometry research (e.g., Riisgård et al., 2006; Robson et al., 2007; Robson et al., 2010; Clements et al., 2021). Furthermore, related mussel species are known to respond to toxic algae by exhibiting increased “microclosures” (Comeau et al., 2019). The microclosures were defined by 3% of Valve Opening Amplitude decreasing (VOA) in 0.1 second. Moreover, M. edulis has the capacity to accumulate more toxins than other sensitive species (Bricelj et al., 1990; Lassus et al., 1999). As such, blue mussels are a prime candidate for exploring the use of valvometry as an early-warning tool for detecting HABs before they become problematic, and notably to aquaculture and shellfish farming industries.
In eastern Canada where blue mussels are cultured, the dinoflagellate A. catenella is known to be involved in some HAB events, particularly in the St. Lawrence Estuary (Therriault et al., 1985; Larocque and Cembella, 1990). Globally, A. catenella is present in Atlantic and Pacific America, Northern Europe, South-East Asia and South-West Africa coasts (Lilly et al., 2007). The St. Lawrence Estuary strain of A. catenella who served in this study has a size between 25 to 50 µm length and 26 to 48 µm wide (Bérard-Therriault et al., 1999) and produces a potent mixture of toxins like saxitoxin and numerous derivatives, called Paralytic Shellfish Toxins (PST), which are associated with Paralytic Shellfish Poisoning (PSP) syndrome in humans (Hégaret et al., 2007). These toxins attach specifically but reversibly to the voltage-dependant sodium channels of animals, stopping the action potential production in the nervous system and muscles (Hégaret et al., 2007; James et al., 2010). In the case of bivalves, adductor muscle paralysis can be observed along with digestive system damage and reduced hemocytes following exposure (Galimany et al., 2008).
Given the importance of blue mussels to the regional economy of eastern Canada, coupled with the importance of developing early-warning tools for HABs, the aim of this study was to explore the potential for M. edulis valve gaping to serve as an early-warning biomonitoring tool for HABs using high frequency valvometry. Herein, we sought to identify gaping behaviours and rhythmicity characteristic of A. catenella presence, and to determine the ability of valvometry to detect the presence A. catenella before blooms occur, in both laboratory and natural seawater settings. We hypothesized that specific gaping behaviour changes would be detected in the presence of PST using high frequency valvometry monitoring systems.
2 Materials and methods
2.1 Experiment 1: Laboratory experiment
In November 2018, two-year-old cultured M. edulis (average shell length, 65.65 ± 2.33 mm n = 24) were collected from a mussel lease in St. Peter’s Bay, Prince Edward Island, Canada (46° 26’ 30.7” N, 62° 44’ 51.3” W), characterised by a pure M. edulis population (Tremblay et al., 2011). The animals were immediately transported on ice to the Station Aquicole de Pointe-au-Père (Institut des Sciences de la Mer, Rimouski, Canada) and acclimated to laboratory conditions for 30 days in two 300 L maintenance tanks with 1 µm filtered seawater (continuously aerated with a salinity ≈ 28, and a natural photoperiod). During acclimation, the temperature was increased by 1°C day-1 until the desired experimental temperature was reached (described below). Mussels were continuously fed with live non-toxic algae of Tisochrysis lutea CCMP 1324, Chaetoceros muelleri CCMP 1316, and Pavlova lutheri CCMP 1325 (ratio 1:1:1 respectively) at a rate of 60,000 cells L-1 per 50 mussels repartited in the two 300 L tanks. Algae were batch-cultured in f/2 medium (with Si for the diatom C. muelleri) (Guillard, 1975) at 18°C, under continuous illumination, in 20 L carbons supplied continuously with CO2 to maintain a pH of ≈ 8 and a photosynthetic active radiation of 100 µmol quanta m–2 s–1. Cell counts were determined with a Multisizer 4e Beckman Coulter counter with a 50-μm pore orifice.
For the laboratory experiment, the strain of A. catenella ‘AT6’ from the St. Lawrence Estuary isolated at the Maurice Lamontagne Institute (Department of Fisheries and Oceans; DFO) during a 2008 severe red tide event was used (Starr et al., 2017). Cells of A. catenella were cultured as already described for other species and harvested in late exponential growth and distributed in the mussel tanks during the experiment, according to the necessary concentrations detailed in 2.2. to obtain target toxicity. Previous cultures of A. catenella showed toxin cell quotas ranging between 3 and 60 pg STXeq cell–1 (Nadalini, J.-B. and Tremblay, R., unpublished data). Assuming the lowest toxin content, production was set to exceed the regulatory threshold for shellfish harvesting closure of 80 μg STXeq 100 g–1.
The experiment was conducted over three days at 18°C, an intermediate temperature between the optima for mussels (20°C; Almada-Villela et al., 1982) and 14°C for A. catenella (Boivin-Rioux et al., 2021). Following the 30-day acclimatation period (as described above), 24 mussels were connected to valvometry monitoring systems described in Nagai et al. (2006) and Comeau (2014) (see Section 2.5 below for details). During the experiment, mussels were equally distributed in six tanks (4 mussels tank-1) containing 100-L of 1 µm filtered seawater (Figure 1A). Each mussel was analysed individually for behaviour and PST concentration accumulated in tissues.
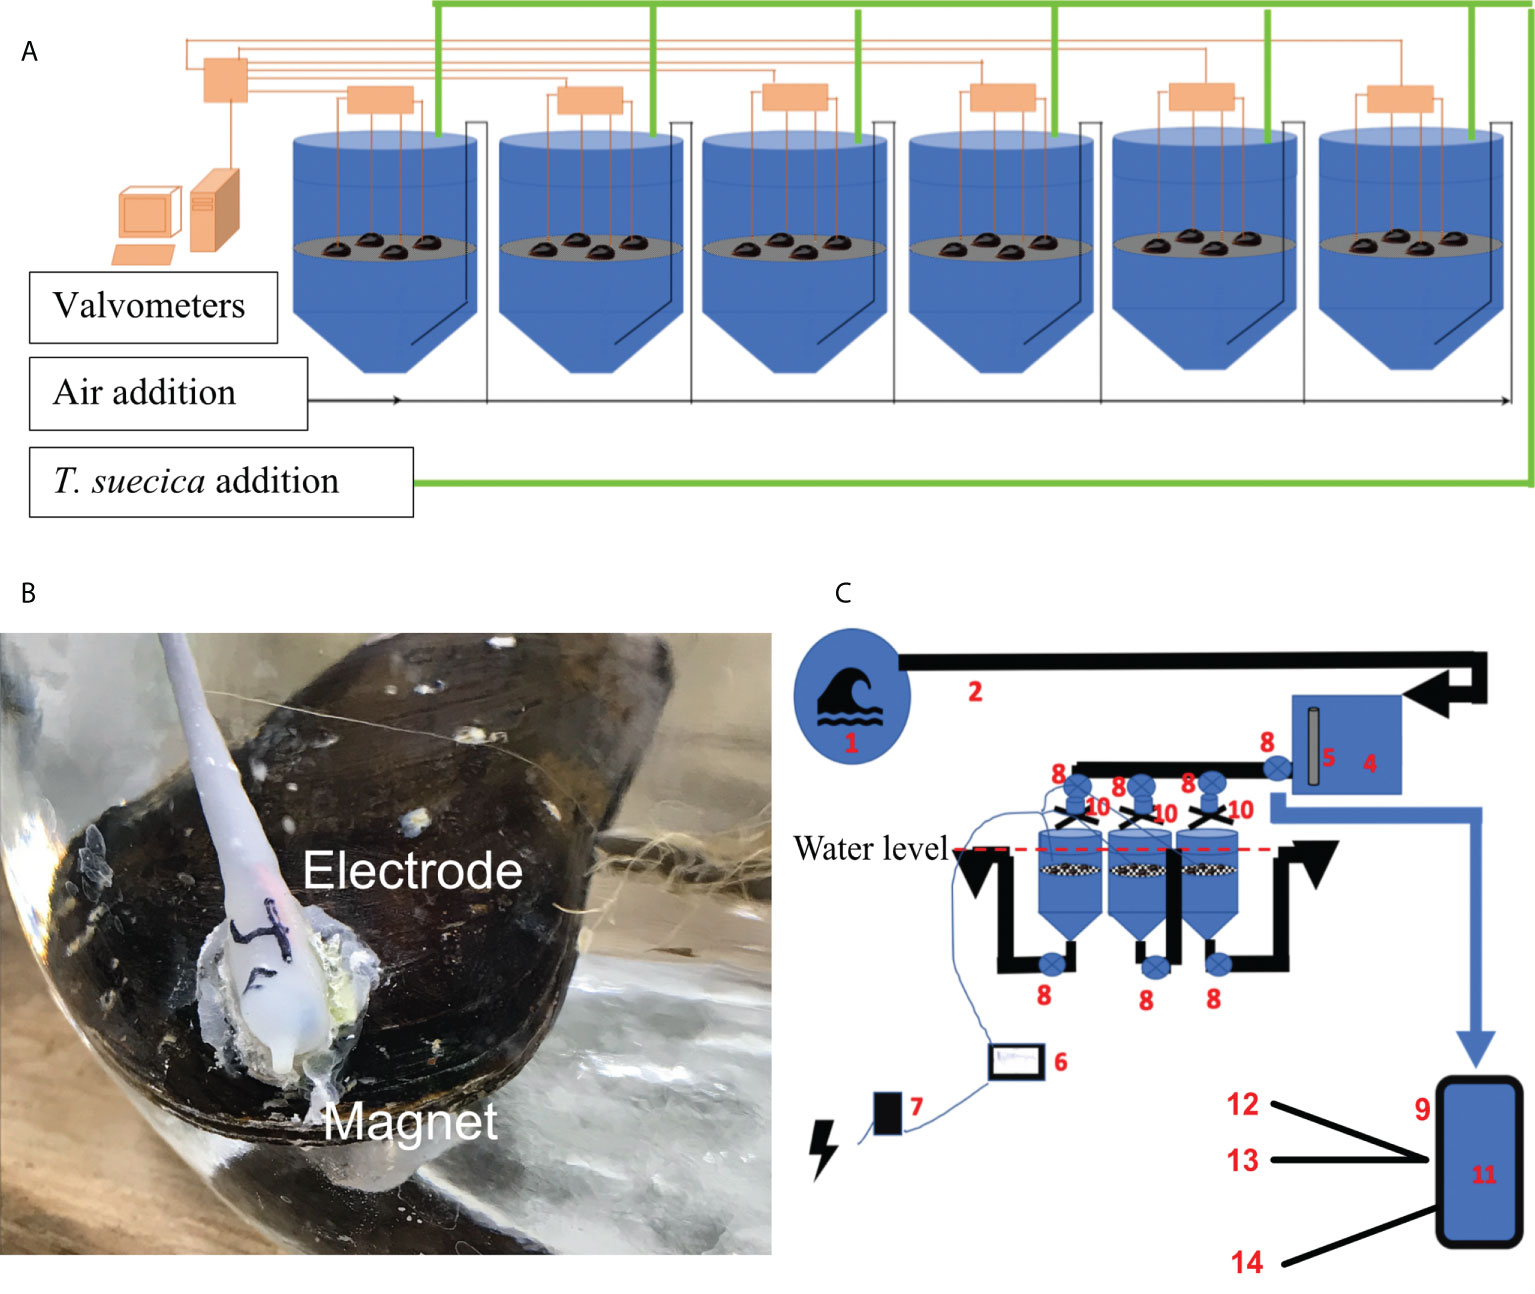
Figure 1 Experimental design of the lab experiment, 4 mussel per tanks, T. suecica added after 48h (A), picture of mussel with electrode (B) and of the natural seawater experiment (C), 1: seawater, 2: water intake, 3: water pump, 4: head tank, 5: CTD, 6: valvometers, 7: battery, 8: Tap, 9: sample, 10: flowmeter, 11: water sampled, 12: Elisa test, 13: cell count, 14: Jellet test.
Gaping behaviour of the mussels was continuously monitored using valvometry (see Section 2.5 below) for 24-hours prior to exposure to toxic algae to obtain baseline data. After this reference period, cells of A. catenella were supplied to each tank at the following concentrations: 0 (control), 1,330, 2,670, 4,000, 5,330 and 10,666 cell L-1. Twenty-four hours later, a second pulse of non-toxic microalgae naturally consumed by the mussels, (Tetraselmis suecica), was added in the tanks (5,000 cells mL-1) after a water change and maintained for one day with a peristaltic pump to eliminate potential gaping behaviour changes induced by food supply variation. Gaping behaviour was continuously measured during the exposure of both A. catenella and T. suecica.
2.2 Experiment 2: Natural seawater experiment
In addition to the controlled laboratory experiment, a 90-day in situ experiment was conducted with unfiltered natural seawater at the Maurice- Lamontagne Institute (DFO, Mont-Joli, Québec, Canada) from June to September 2019 – a period in which A. catenella blooms are known to occur in the St. Lawrence Estuary (Parkhill and Cembella, 1999; Boivin-Rioux et al., 2021). The natural seawater experiment was performed with M. edulis collected in a mussel lease in St Peter’s Bay, Prince Edward Island in 2019. To expose mussels to natural seawater and meteorological conditions, this natural seawater experiment was carried out in outdoor tanks supplied with unfiltered raw seawater from the adjacent St. Lawrence Estuary. The raw seawater pumped at the surface (1-10m, depending of the tide) was directed in a 150 L header tank and distributed by gravity to three experimental conical 100 L tanks containing mussels at the top of each tank (Figure 1B). The seawater was supplied with a flow rate of 15 L min-1, replacing the total volume of the header tank every 3 minutes (Figure 1C). Homogenous seawater mixing in the experimental tanks was achieved by using a grid at the surface of each tank. Mixing was validated by dispersion of food colourants and use of GoPro cameras in each tank (GoPro HERO4 Silver +LCD), demonstrating uniform repartition and eventual elimination of coloured water. A calibrated CTD probe was installed in the header tank to monitor temperature, salinity and turbidity every 15 minutes. A total of 36 mussels were equipped for valvometry and distributed equally among the experimental tanks at the same depth (n = 12 mussels experimental per tank), where they were allowed to acclimate to the natural seawater conditions for one week prior to experimentation; valvometry was not recorded during this acclimation period. The vertical flow of water and consistent depth of the mussels ensured that secondary assimilation through the absorption of pseudofeces and feces (Sonier et al., 2020) was negligible.
The presence and concentration of A. catenella in the header tank were monitored daily during low tide via detection tests and microscope identification. Two detection tests (1. Jellet from Scotia Rapid Testing, NS, Canada; and 2. Algal Toxin Enzyme-Linked Immunosorbent Assay ELISA Plate Kits from Eurofins Abraxis, PA, USA) were used to detect A. catenella in 48 L seawater samples filtered to retain the 20-100 µm fraction, which was concentrated in a 200 mL solution. The qualitative Scotia Rapid Testing LTD test (SRT test) was use dayly and indirectly detects A. catenella via the presence of saxitoxin and neosaxitoxin antibodies (Jellett et al., 2002), with a manufacturer indicated saxitoxin detection limit between 0.02 and 0.1 µg mL-1. For the first 50 days, a 50 mL subsample obtained from the 200 mL sample mentioned above was concentrated and re-suspended in 5 mL of 1 µm filtered seawater and a subsample of 500 µL was used for the test. The following day 50, however, we adjusted the protocol to ensure that we were not losing sensitivity because of the re-suspension by recuperating the material filtered directly with a spatula to avoid dilution and thus increasing the detection limit of the SRT test. The rest of the protocol remained unchanged, and the toxin extraction was realised with acetic acid before being buffered and the test applied. Another subsample from the 200 mL fraction described above was used for the ELISA assay and was filtered on 11 µm nylon filter (Millipore Sigma) and subsequently frozen. The saxitoxins and the analogues potentially present on the nylon filter was extracted with a known volume of 5 or 10 mL of 0.1 M acetic acid (Dell’Aversano et al., 2005) depending of the difficulty of resuspending the material. Extracts were submitted to ultrasonic treatment for 5 minutes to favour cell disruption followed by centrifugation and the filtrate submitted to ELISA assay following the manufacturer protocol. Briefly, the saxitoxin present in the sample, and a saxitoxin-enzyme conjugate, each compete for rabbit saxitoxin antibodies in solution. The saxitoxin antibodies are then bound by an anti-rabbit antibody immobilised on a microtiter plate (Abraxis LLC, Warminster, PA, USA). In contrast to the SRT test, the detection limit of the ELISA assay is much lower at 0.015 ng mL-1. This assay recognises saxitoxin and its derivatives with varying degrees; the cross reactivities are 100% for Saxitoxin (STX), 29% for Decarbamoyl STX, 23% for GTX 2 & 3 and GTX-5B, 13% for Lyngbyatoxin, but drop to 2.0% for Sulfo GTX 1 & 2, 1.4% for Decarbamoyl GTX 2 & 3, 0.6% Decarbamoyl Neo STX, and for the powerful Neosaxitoxin and GTX 1 & 4, this decreases to less than 1.3 and 0.2% respectively.
In addition to seawater samples for detecting PST, separate samples of unfiltered seawater (200 mL) coming from the header tank were also preserved daily in acidic Lugol’s solution for microscope cell counts to quantify the concentration of A. catenella. The daily microscopic count of potential toxic algae (cells L-1 of A. catenella, Dinophysis acuminata and Pseudo-nitzschia spp.) were estimated using the standard Utermöhl method (Andersen and Throndsen, 2004).
2.3 PST detection in mussel tissues
The concentration of PST in the tissues of experimental mussels, as well as in wild mussels, sampled from the shore of the St. Lawrence Estuary (adjacent to our natural seawater setup to estimate natural contamination levels) was determined using the Algal Toxin ELISA Plate Kits as described above. The test was conducted on each mussel individually, by crushing and homogenizing whole mussel tissues in acetic acid with a ratio of 1 mL of acid acetic for 1 g of mussel’s tissue. In addition, PST content was regularly measured in PST concentrations in the two mussel populations (estuarine shoreline three times every week and experimental tanks at the end of the experience) sampled the same day showed no significant difference (Student test: df = 24,94, T-value = 0.055, p-value = 0.956). Same PST level was measured in wild mussels tissue than monitored.
2.4 Valvometry
To measure gaping behaviour in each experiment, mussels were equipped with a Hall element sensor (HW-300a, Asahi Kasei, Japan; 0.5 g) and a magnet (4.8 mm diameter × 0.8 mm height; 0.2 g) glued with Solarez® UV epoxy resin (Wahoo International, CA, USA), which polymerizes rapidly under UV light. Electrodes were connected to 4-channel dynamic strain recorders (DC-204 R, Tokyo Sokki Kenkyujo Co., Japan) equipped with memory cards for data storage, which converts the magnetic flux between the sensor and magnet into a voltage value. To avoid pseudo replication, each of the four mussels linked to the same valvometer were placed in different tanks, except for the natural seawater experiment in which two mussels from the same valvometer needed to be placed in the same tank (i.e., there were only three experimental tanks). Electrodes and magnets were fixed on mussels’ valves with an initial target reading of ≈-80,000 µV when the bivalves were closed. Recording was set to a frequency of 10 measurements sec-1 to obtain high resolution behavioural data. Data were retrieved from the memory cards at the end of the experiments as.csv files and were subsequently processed using R statistical software version 1.3.1073 (R Core Team, 2020). Herein, VOA was computed for each individual after conversion of µV data to mm by the use of calibration curves estimated with known size spacers. VOA was calculated as:
where VOA is the valve opening amplitude in %, opening is the measured valve opening in mm at a given period in time, and max and min are, respectively, the maximum and minimum opening (gaping of the valves in mm) values observed over the entire observation period. VOA was then used to compute various behavioural indicators, including 1. the number of closures; 2. total closure duration; 3. average closure duration; 4. the average VOA and 5. the number of microclosures (as defined by Comeau et al., 2019). A mussel was considered closed when VOA was<10% of max. A microclosure was counted when a 3% reduction of VOA within 0.1 sec was observed. In the laboratory experiment, the behavioural indicators were calculated for 3 periods: before and after the A. catenella exposure, and during the following exposure of T. suecica. In the natural seawater experiment, the behavioural indicators were calculated for each day. All raw data were handled and processed (i.e., µV values converted to mm values, and computations of behavioural indicators) in R (R Core Team, 2020).
2.5 Statistical analysis
2.5.1 Experiment 1. Laboratory experiment
Statistical analyses were performed using R (R Core Team, 2020) with a significance threshold of p< 0.05. The impact of mussel tissue PST concentration on gaping behaviour indicators (number of closures, total duration of closures, average closures duration and number of microclosures; n = 18 mussels) was evaluated with non-parametric Pearson correlations (base package), as Shapiro-Wilk test indicated non-normal distribution of the data. Correlations were applied for the period of A. catenella exposure (T1) and food addition (T2) with the PST concentration to avoid tank effect and use the real PST quantity affecting the mussel behaviour. Principal Component Analysis (PCA; package ade4; Dray and Dufour, 2007) was also used to determine whether the T1 gaping behaviour indicators were influenced by PST concentration in mussels. Then, the mean of each gaping behaviour indicator measured at different PST concentration ranges (C0:<10 µg STXeq 100g-1, n = 3, C1: 20 to 50 µg STXeq 100g-1, n = 4, C2: 50 to 80 µg STXeq 100g-1, n = 4, C3: >80 µg STXeq 100g-1, n = 7) were compared with a univariate one-way permutation analyses of variance (PERMANOVA – package vegan; (Oksanen et al., 2019)), using A. catenella concentration as factor (n=2). With the non-normal distribution of the databases, this approach is more accurate than parametric analysis. The similarity matrices were calculated based on Euclidean distances as recommended by Anderson et al. (2008) for univariate analyses. A posteriori PERMANOVA pairwise tests (Martinez Arbizu, 2019) were applied to determine the concentration at which gaping behaviour changes were induced. Finally, a cluster analysis with permutations (SIMPROF) was applied to validate A. catanella concentrations showing a similar effect on gaping behaviour.
2.5.2 Experiment 2: Natural seawater experiment
For the natural seawater experiment, Pearson correlations were applied between the four gaping behaviours and the daily measures of PST and the cell abundance of toxic algae (A. catenella, Pseudo-nitzschia spp. and Dinophysis acuminata) in the header tank. In parallel, the gaping behaviour indicators were also correlated with a daily mean (90 days) of physicochemical parameters obtained by the CTD probe (temperature, salinity, fluorescence, and turbidity). With the same data set, a PCA was used to determine which gaping behaviour indicators were most linked to PST concentration in seawater (PSTw). These gaping behaviour indicators were selected for PERMANOVA analyses. Based on the daily estimations of PST concentration in field mussels (PSTm), behavioural data were grouped into four PSTm concentrations (C0:<10 µg STXeq 100g-1, C1: 30 to 50 µg STXeq 100g-1, C2: 50 to 80 µg STXeq 100g-1, C3: >80 µg STXeq 100g-1) and compared by univariate one-way PERMANOVA (n = 6-15 mussels for each concentration group), followed by a posteriori pairwise test (Martinez Arbizu, 2019) when significant. Finally, a cluster analysis with permutations (SIMPROF) was applied to validate PSTm groups with similar effects on gaping behaviour.
2.6 Chronobiological analysis
The mussel gaping behaviour was represented with actogram (Figures 2B, C). Each column of the actogram represents 2 days of VOA. The second day of a column correspond at the first day of the next column. The colours correspond to 10 VOA range detailed in the Figure 2, indicating the mussel opening
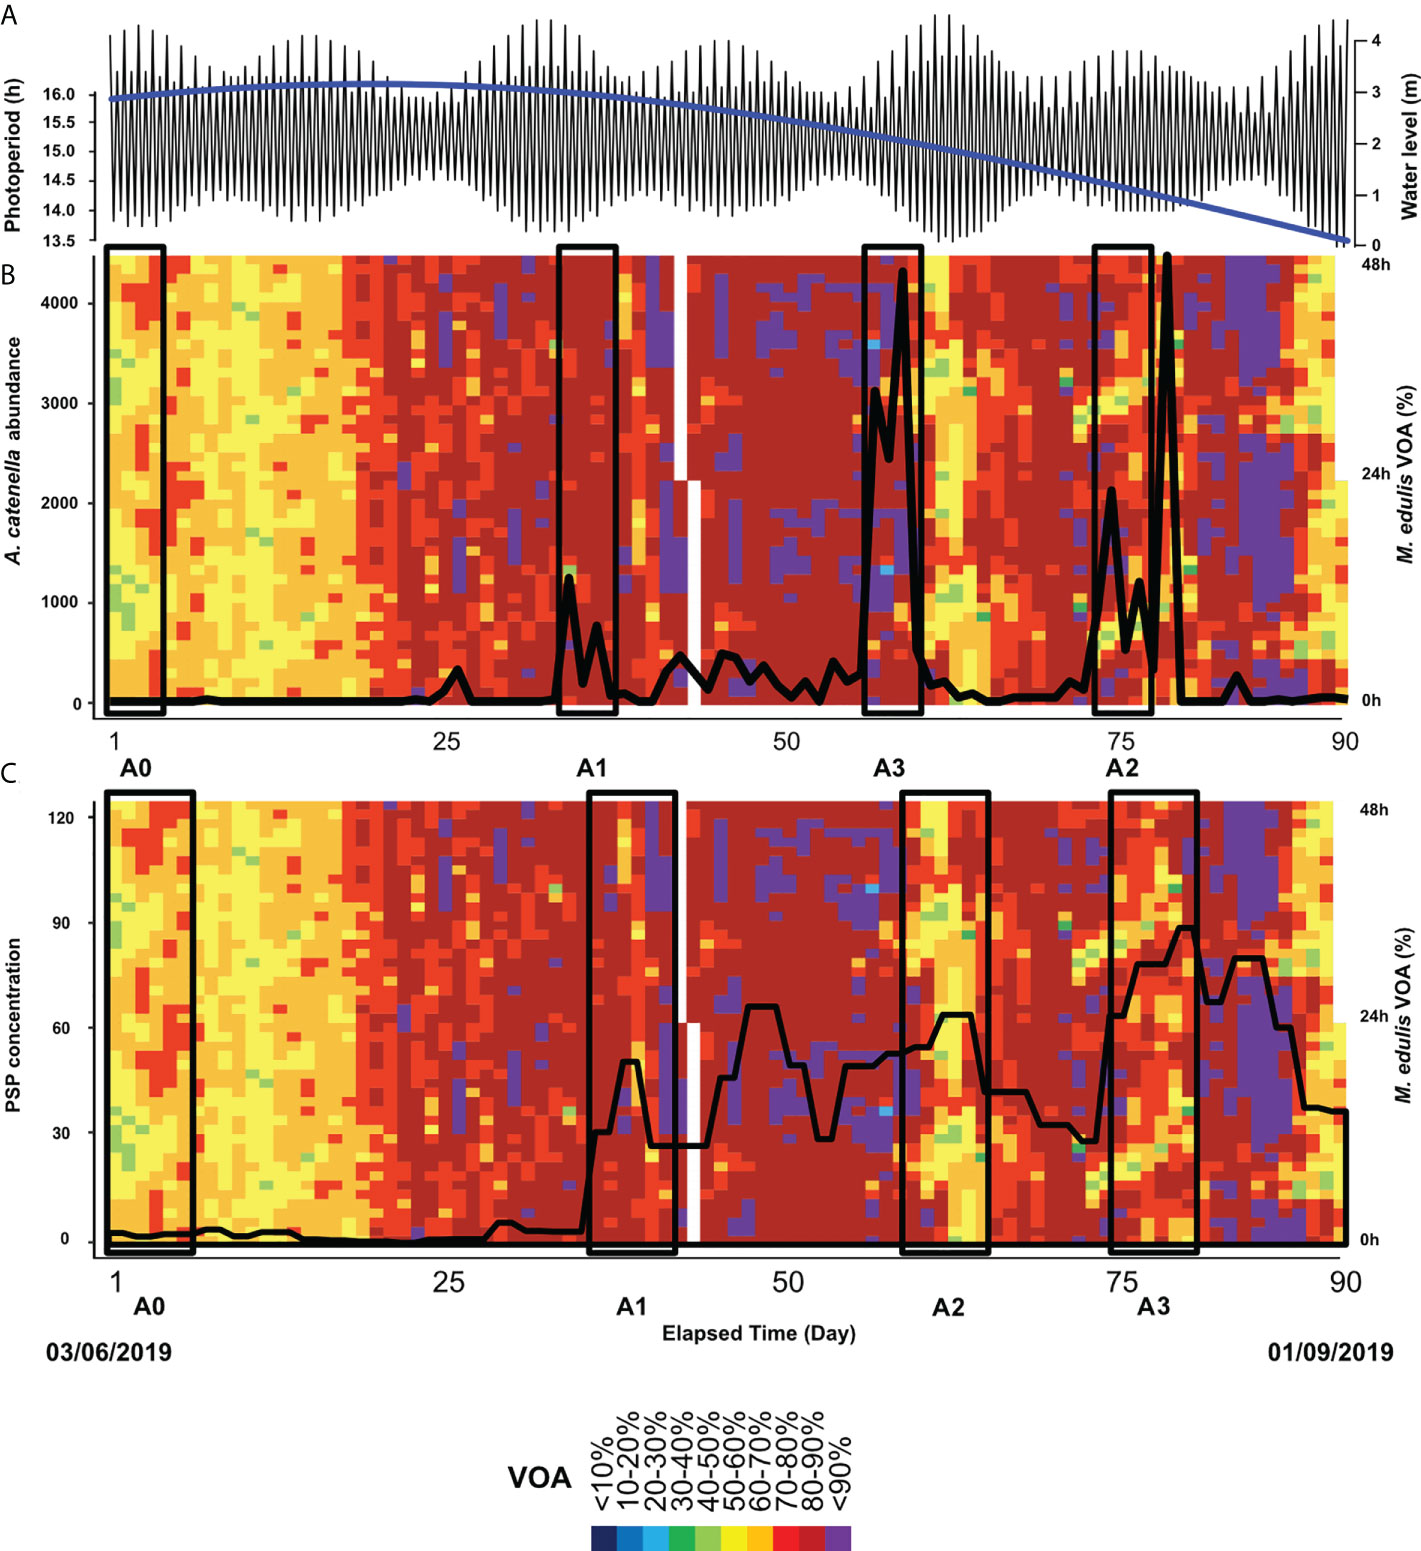
Figure 2 Physical and biological observations over the course of the 90-day natural seawater experiment. In panel a, the blue and black lines represent photoperiod and water level, respectively. The actograms depict the mean hourly VOA (%) of the group (n = 27 mussels) in relation to (A). catenella abundance (panel B, black line) and PST concentration in the mussel tissue (panel C, black line). The black rectangles represent the times windows studies, with a duration of 4 days for panel b and 6 days for panel (C).
To detect potential differences in the rhythmicity (tidal and daily) of mussels gaping behaviour in relation to PST concentration (Between 0 and 118.21 µg STXeq 100g-1), the gaping behaviour recording was divided in hours and the population (n = 27 mussels) average VOA was calculated for each hour. Chronobiological analyses were performed using TSA Serial Cosinor 6.3 software (http://www.euruestech.net/mainnuk.php) on time windows presented in the Figure 2 with a duration selected to have enough of cycle occurrence to detect them but with a duration adapted to follow the speed of the abundance or PSP concentrations variations. Several steps were required to validate a significant rhythm (Gouthiere et al., 2005; Payton et al., 2017). First, the quality of the data set was assessed by controlling for the absence of randomness using the autocorrelation diagram. Second, the absence of a stationary phenomenon was assessed by using a partial autocorrelation function (PACF) calculation. Third, the recorded data were tested for periodicities in the tidal (12.4 ± 3.1 h) and daily range (24 ± 4 h) by the spectral method of the Lomb and Scargle periodogram (Lomb, 1976; Scargle, 1982). Fourth, the rhythmicity was then validated and modeled with the cosinor model. For a given period, the model is written as Y (t) = Acos (πt/τ + ϕ) +M + ϵ (t) where Y (t) is an observation of the mean VOA at time t, A is the amplitude, ϕ is the acrophase, τ is the period, M is the mesor and ϵ is the relative error. Two key tests validated the calculated model and the existence of a rhythm: the elliptic test had to be rejected, and the probability for the null amplitude hypothesis had to be< 0.05. A chronobiometric parameter was calculated; the percent rhythm (PR, %) is the percentage of cyclic behaviour explained by the model. For a set of data, several significant periodicities could occur. To identify significant secondary periodicities, we reinjected the previously calculated residues of the Cosinor model to remove the trend related to the first statistical period and then repeated the entire procedure.
3 Results
3.1 Experiment 1: Laboratory experiment
The variations of the behavioural indicators during the controlled laboratory experiment are presented in the Figure 3. A decrease in the total closure duration was observed, indicating increasing of the mussel opening with the increasing PST concentration. The same tendency was found for the average closure duration. In the same way, increasing mussel opening was revealed by the increasing of the average VOA and the decreasing of the number of closures. Significant negative correlations between gaping behaviour indicators and PST concentration during the A. catenella exposure period were evident for total closure duration and the average closure duration with an increasing of the opening (Table 1). For the period following A. catenella exposure, no significant correlations were detected (Table 1). Principal component analysis confirmed that PST concentration was negatively correlated with total closure duration and average closure duration (Figure 4A). Herein, a weak correlation between microclosures and PST concentration was also evident. As such, total closure duration, average closure duration, and microclosures were selected as behavioural indicators for the univariate PERMANOVA analyses. In the univariate PERMANOVA, significant differences between the PST concentrations were observed for total closure duration (DF= 3 and 14, Pseudo-F= 10.18, P(MC)= 0.0027) and average closure duration (DF= 3 and 14, Pseudo-F= 4.16, P(MC)= 0.0242), but not Microclosures [DF= 3 and 14, Pseudo-F= 2.09, P(MC)= 0.1082)]. Significant differences between PST concentrations were also present when the three behavioural indicators were analysed together with a multivariate PERMANOVA (DF= 3 and 14, Pseudo-F= 10.119, P(MC)= 0.003). PERMANOVA pairwise tests showed significant differences between the higher concentration (C3) of PST accumulated in mussels and the other lower concentrations: C0, C1, C2. SIMPROF did not detect any sufficient difference in Euclidean distance to establish clusters between PST accumulation for the valve gaping indicators. As such, clusters were established without using SIMPROF but with the selection of the longest distance between two knots. Valve gaping indicators showed different clustering patterns in relation to PST accumulation (Figure 4B). Thus, mussel behaviour was impacted only when PST accumulation was over values measured in C1.
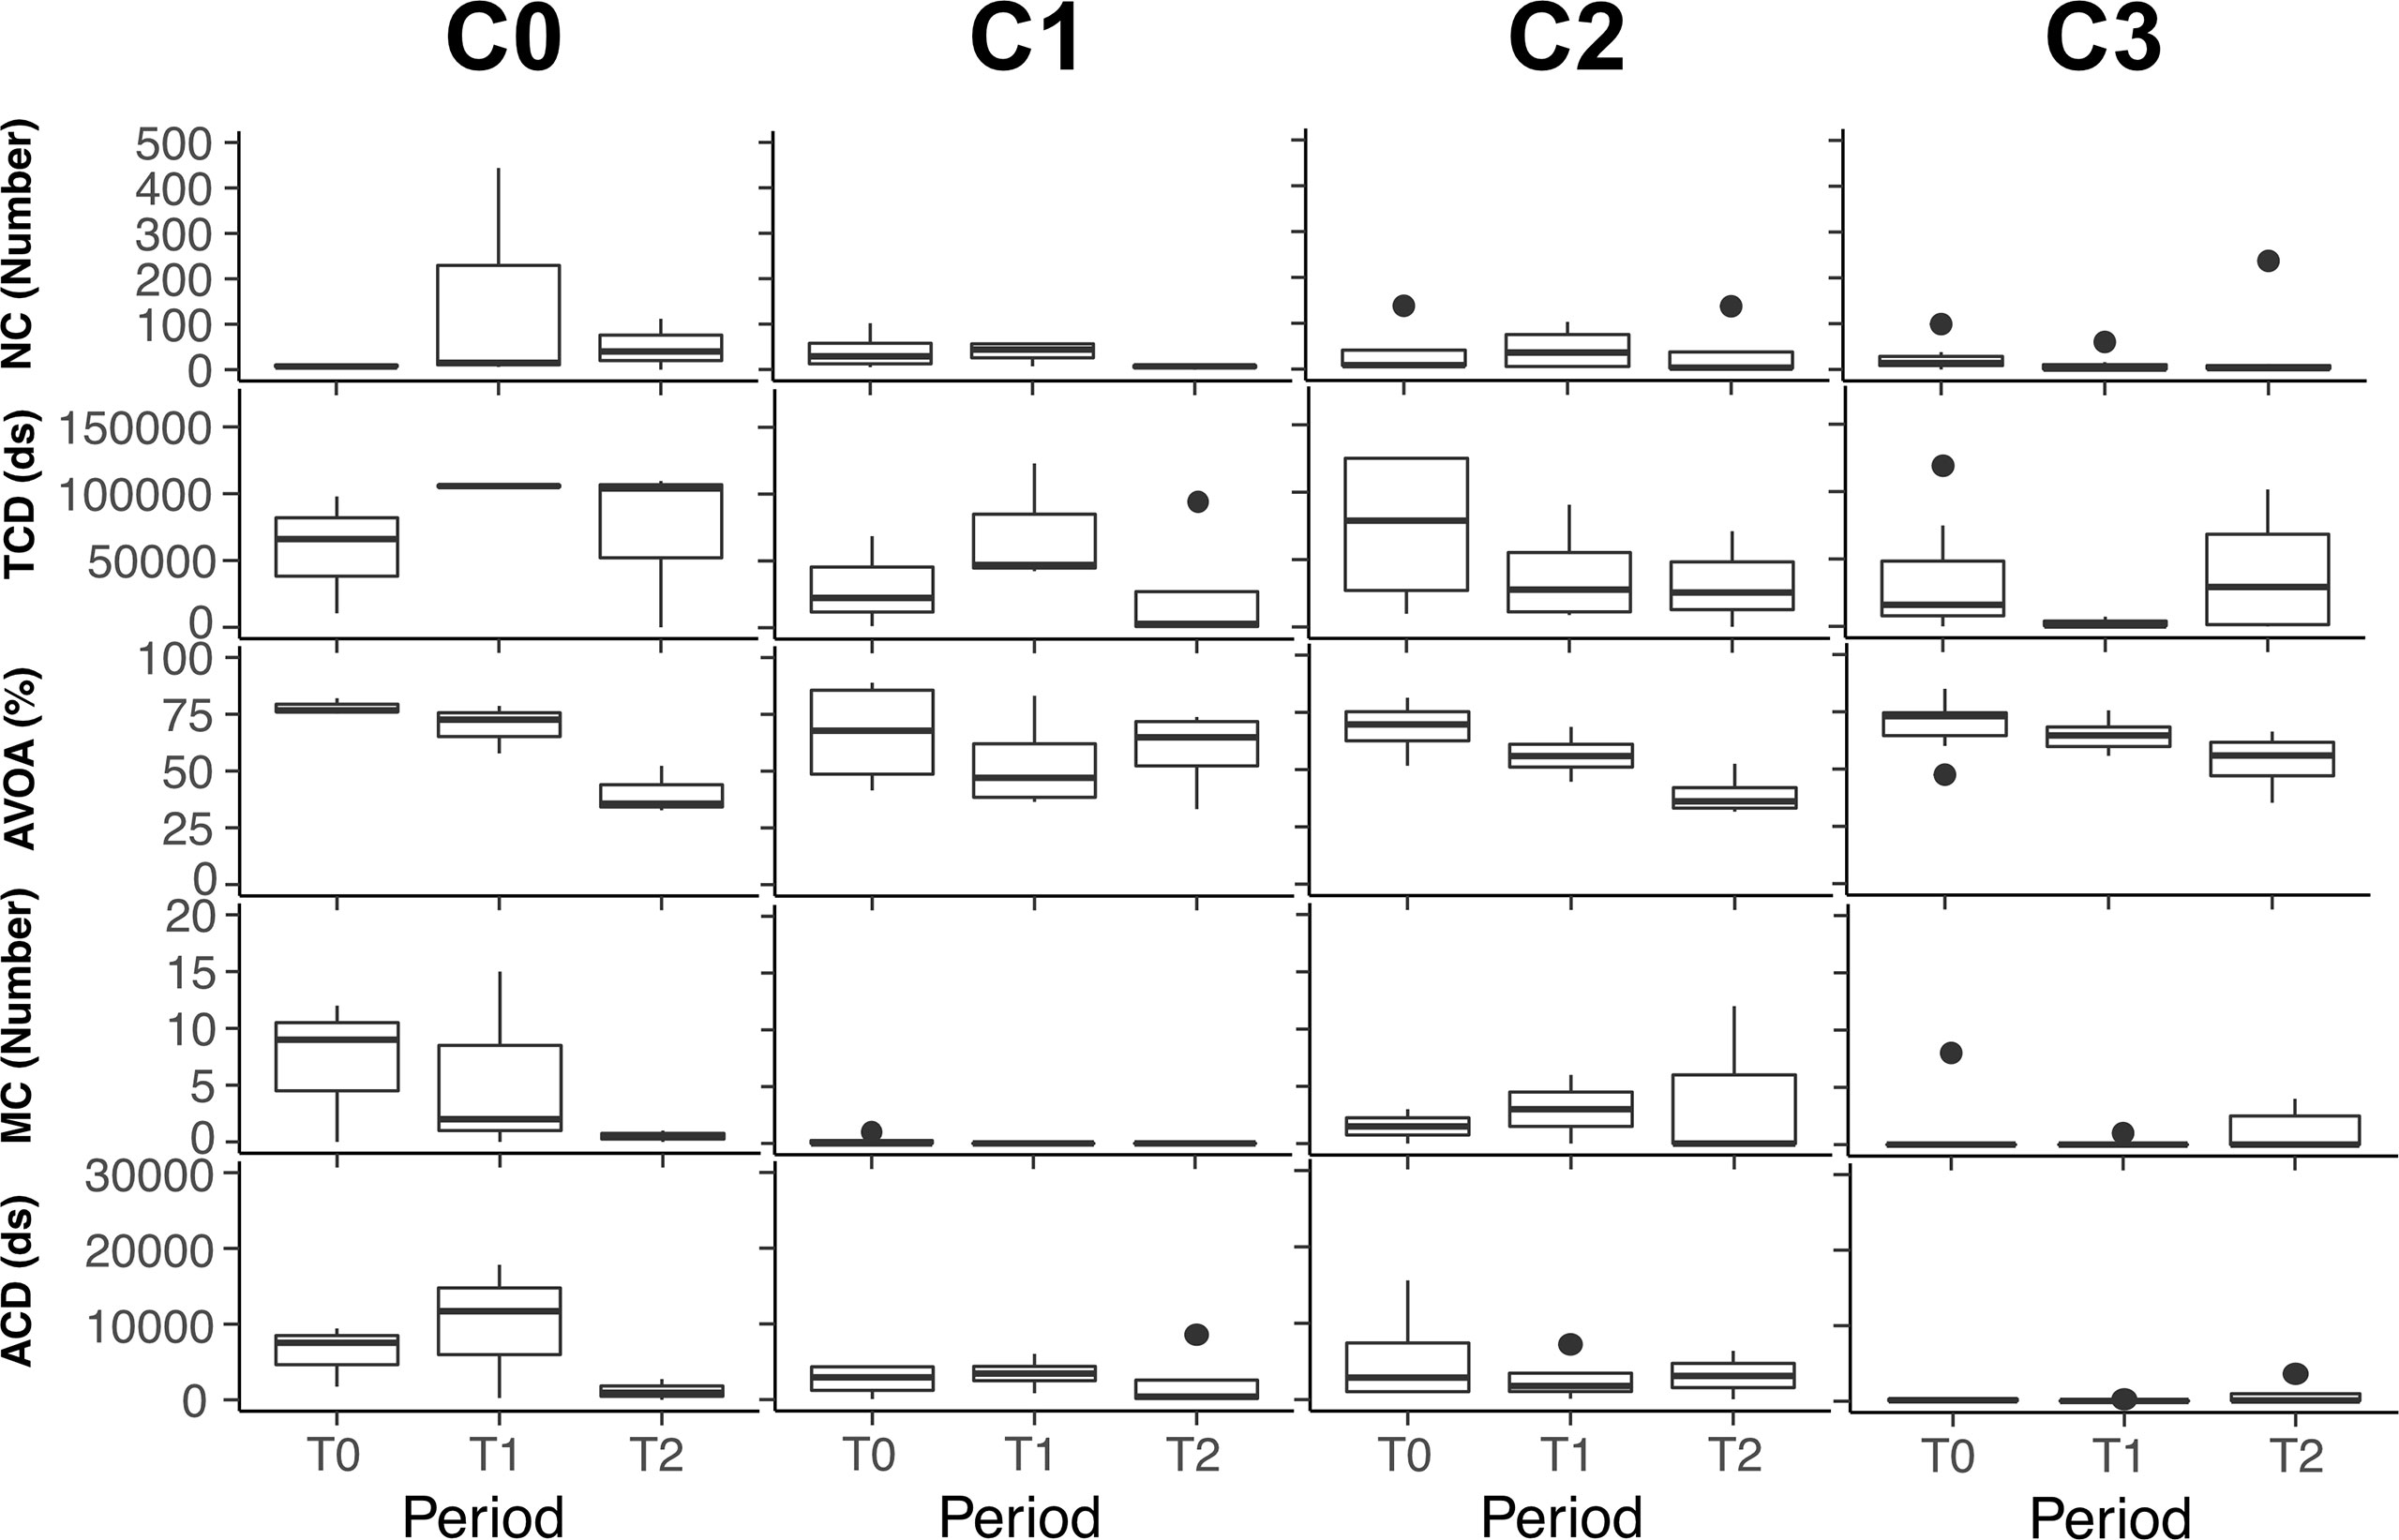
Figure 3 Variation of the mussel’s behavioural indicators for PST concentration for laboratory experiment. NC, Number of closures; TCD, Total Closure Duration; AVOA, Average VOA; MC, Microclosure; ACD, Average Closure Duration. C0:<20 μg STXeq 100g-1, C1: 20 to 50 μg STXeq 100g-1, C2: 50 to 80 μg STXeq 100g-1, C3: >80 μg STXeq 100g-1, T0: Acclimation and reference behaviour, T1: A. catenella exposition, T2: food addition.
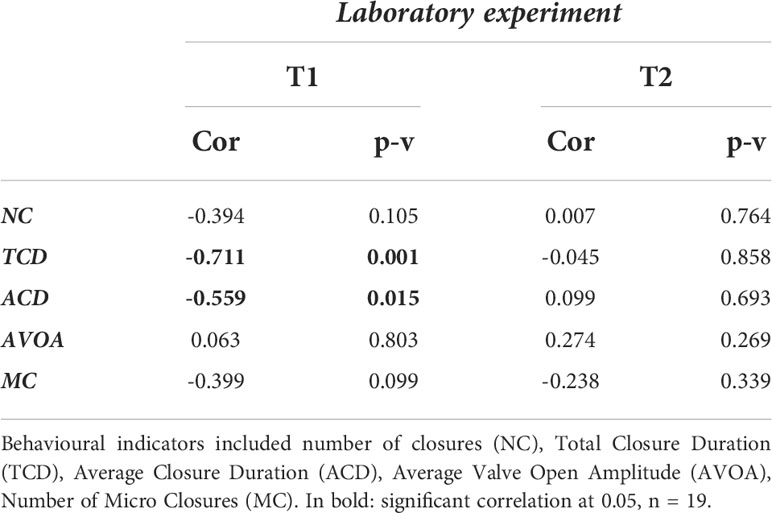
Table 1 Correlation between PSTm content in mussel tissues at the end of the controlled laboratory experiment and the behavioural indicators measured in the controlled laboratory experiment before (T0) and during A. catenella exposition (T1), then and food addition (T2).
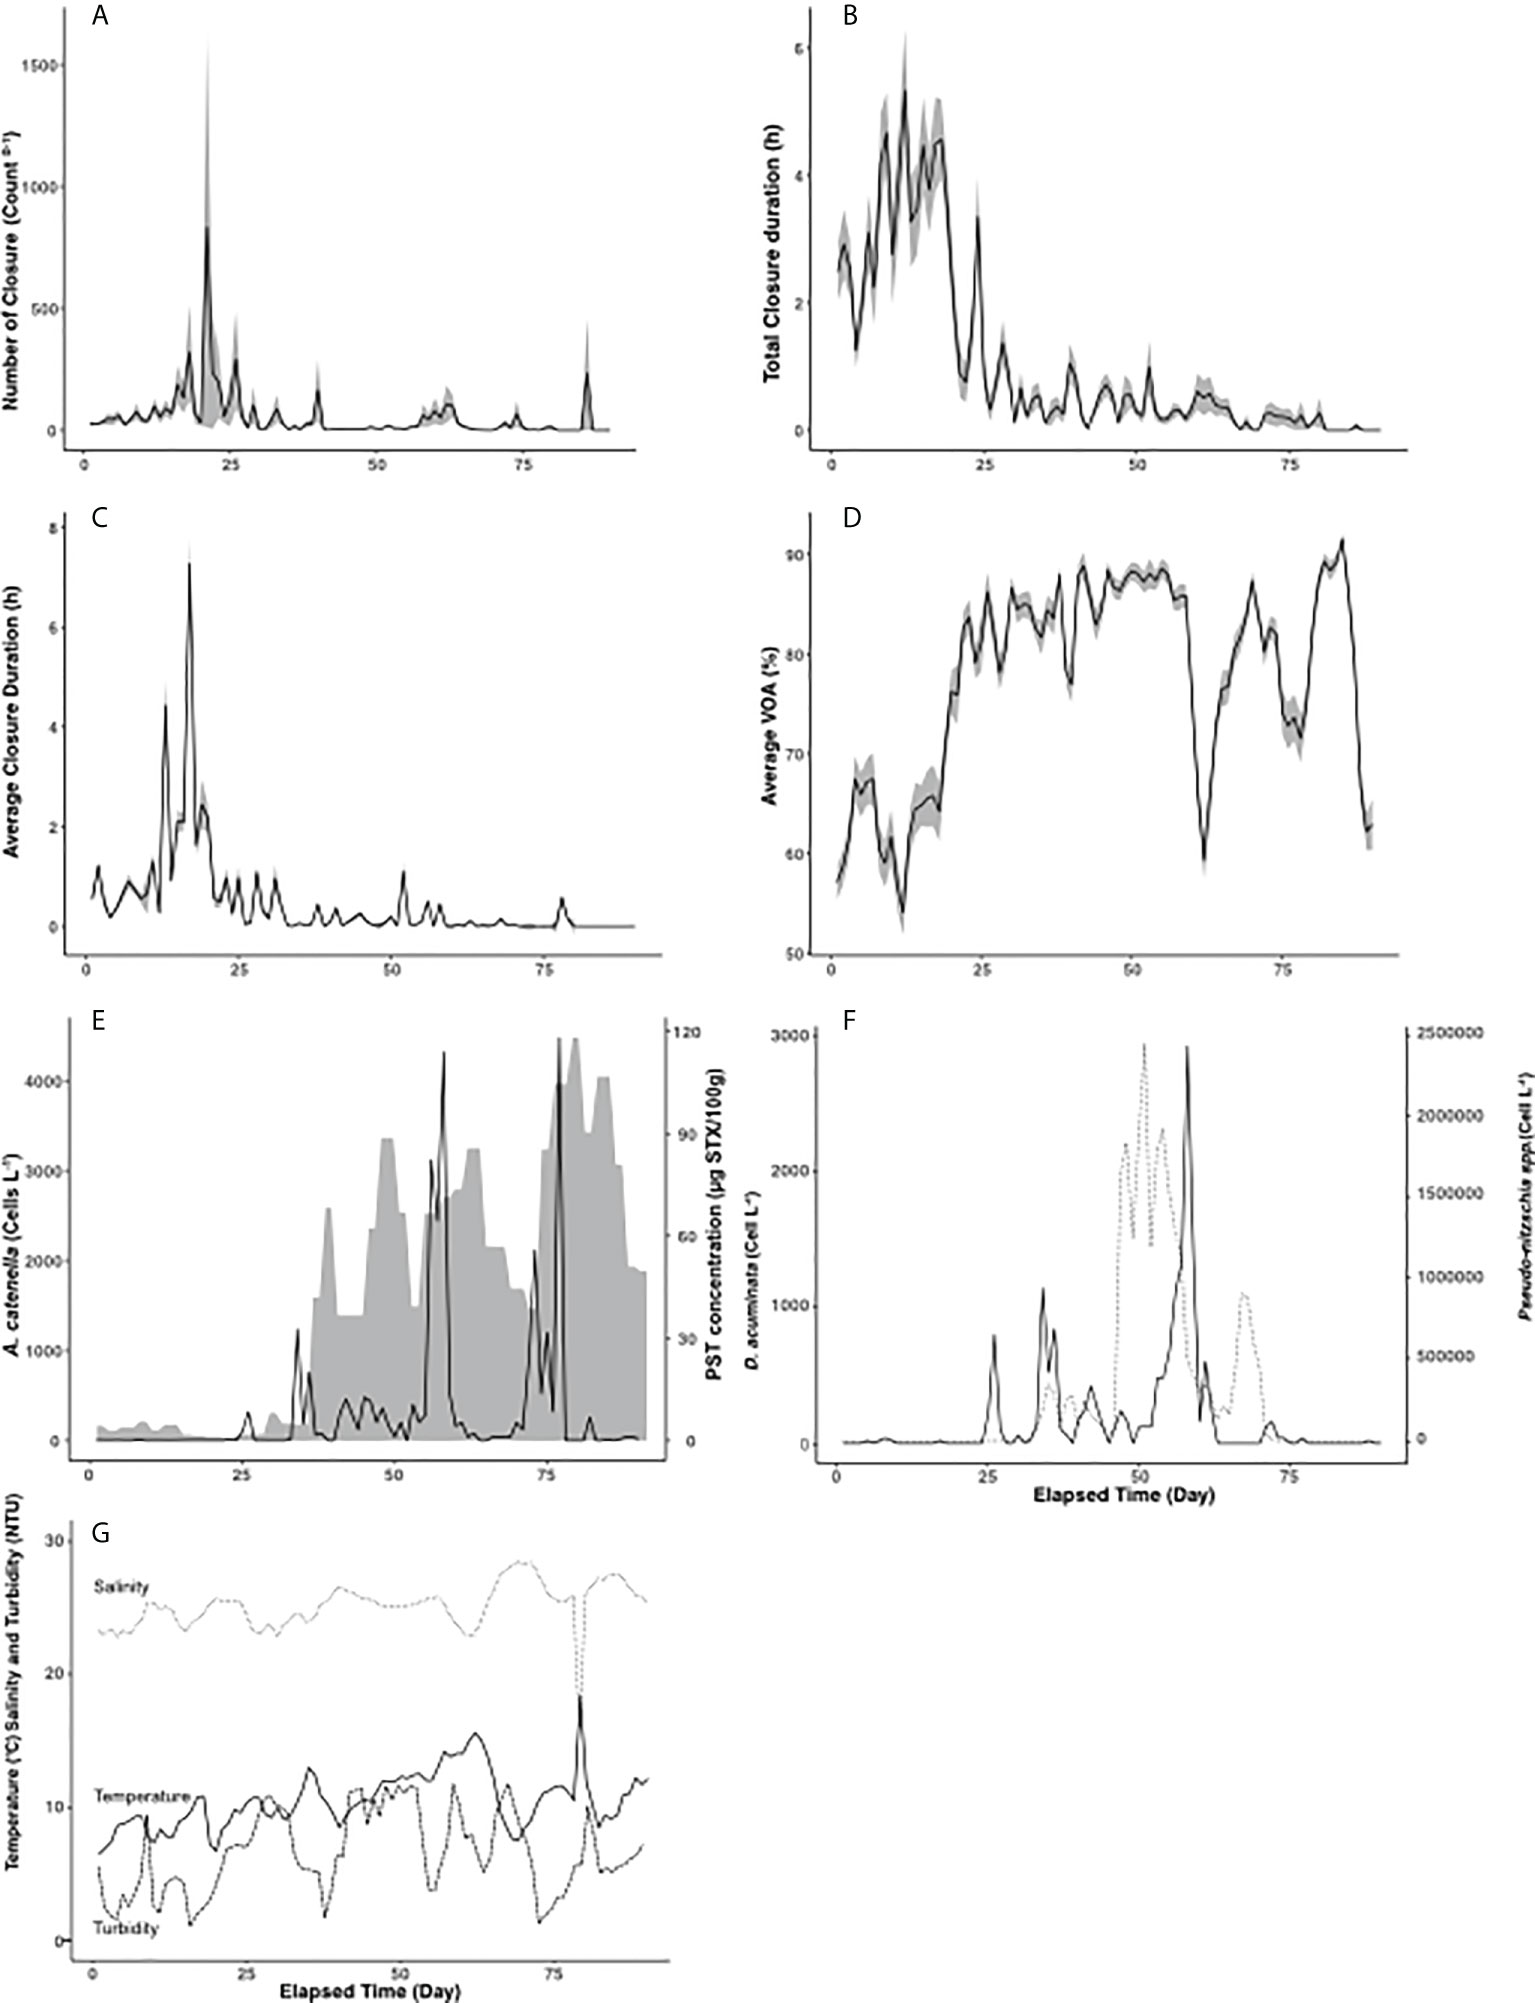
Figure 4 Mussel gaping metrics and corresponding standard errors associated to running daily means (shaded areas) over the course of the 90-d experiment in natural seawater for (A): NC - Number of Closures (Count day-1), (B): TCD - Total Closure Duration (hour), (C): ACD - Average Closure Duration (hour), and (D): AVOA - Average Valve Open Amplitude (%). (E): A. catenella abundance (cells litre-1; solid line) in seawater and PST concentration in mussels from the shore (µg STXeq. 100g-1; shaded area). (F): D. acuminate (cells litre-1; solid line) and Pseudo-nitzschia spp. (cells litre-1; dotted line) abundances in seawater. (G): Temperature (°C; solid line), Salinity (dotted line) and Turbidity (broken line).
3.2 Experiment 2: Natural seawater experiment
For the natural seawater experiment, all data (i.e., valve gaping indicators, A. catenella concentrations, and seawater PST [PSTw]) are presented daily in Figure 5. The most important valve gaping changes were observed when A. catenella was initially detected in the seawater (Figures 5A–D), which corresponds to the onset of PSTm accumulation in the tissues of field mussels. Prior to day 25, PSTm concentration and A. catenella abundance were negligible (Figure 5E).
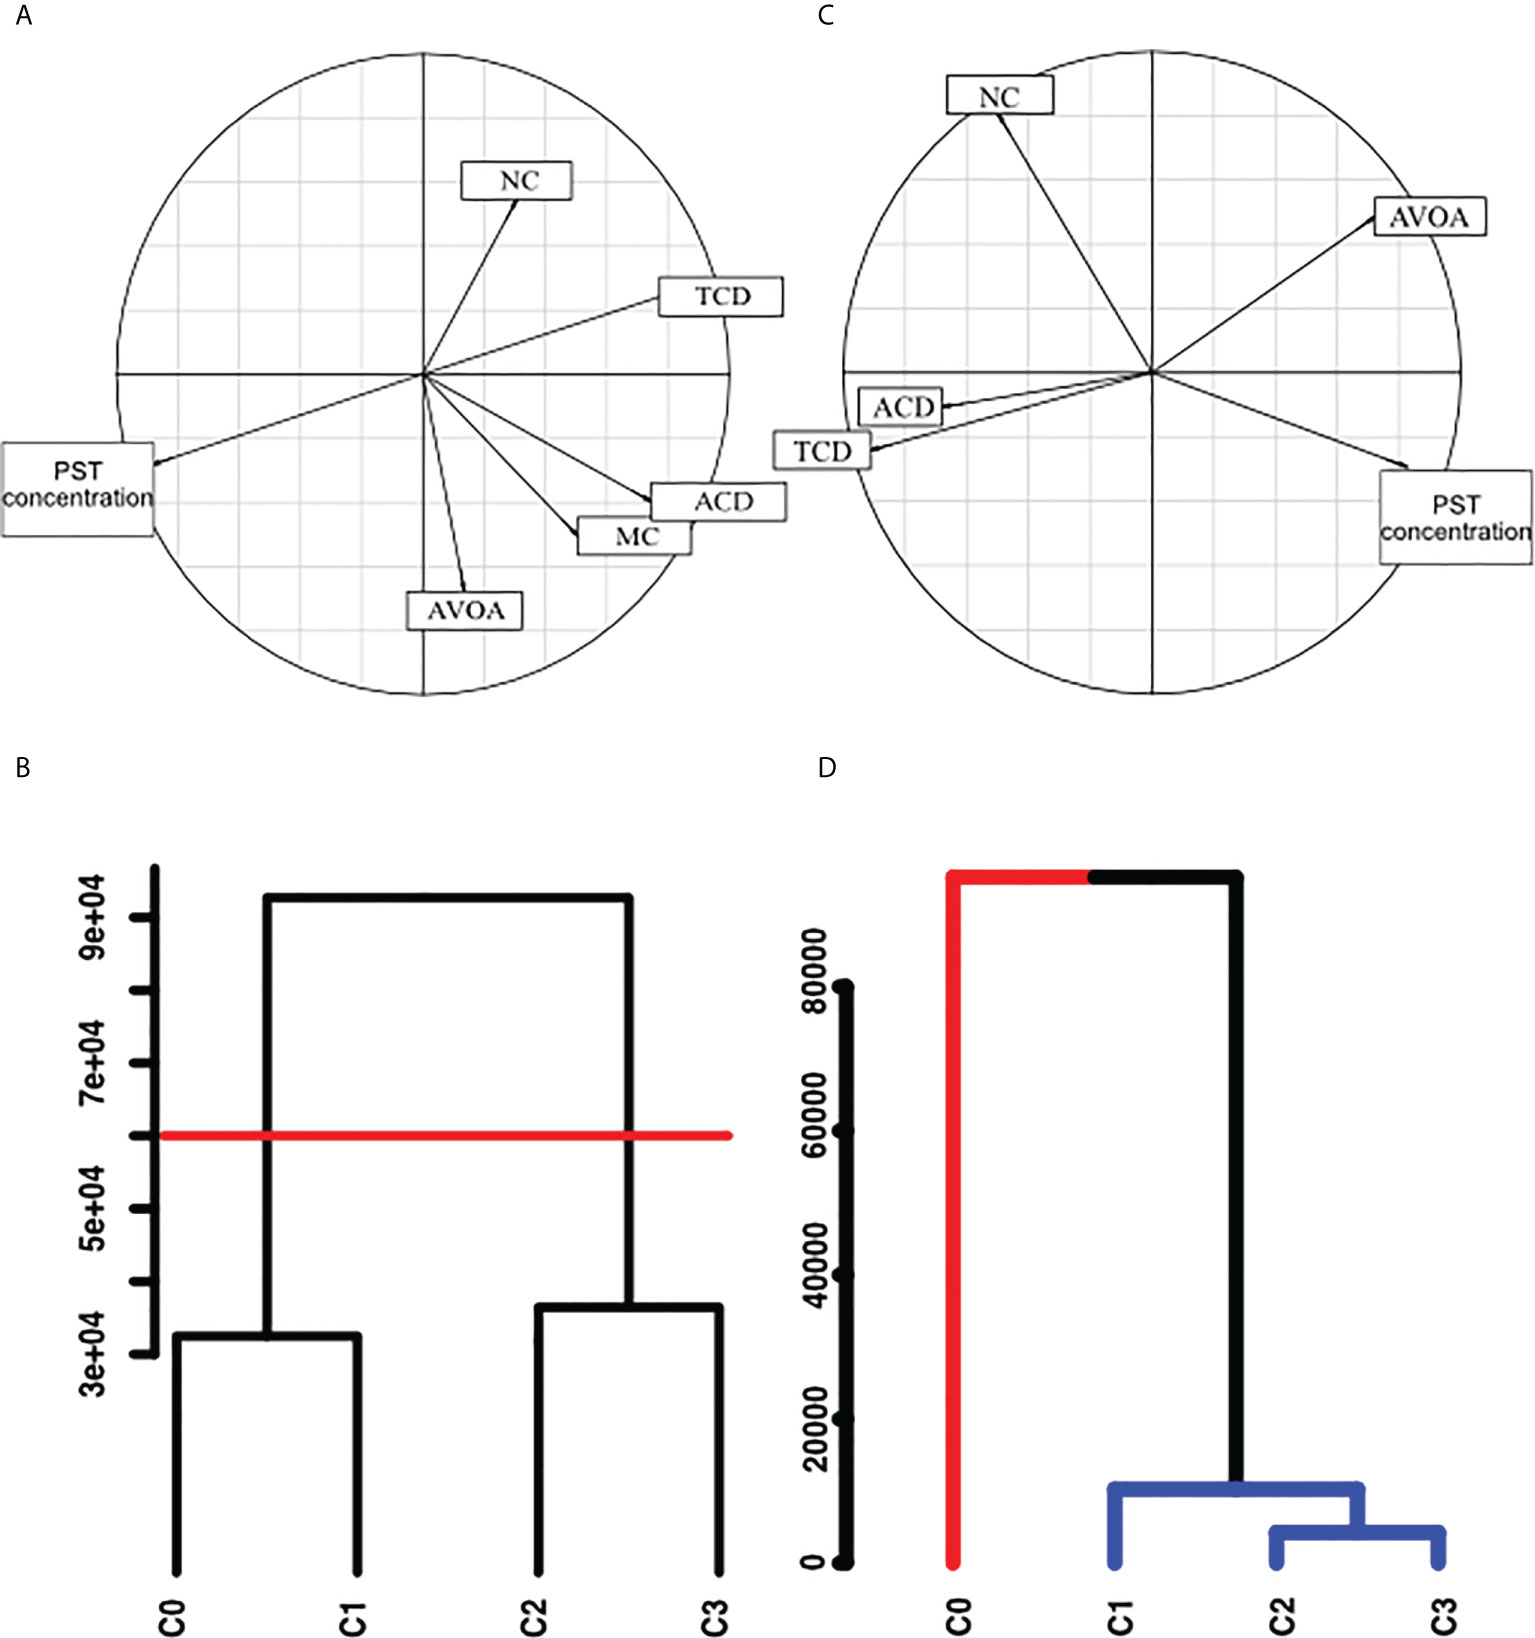
Figure 5 (A) Correlation circle of Principal Component Analysis for the behavioural indicators (NC, Number of closures. TCD, Total Closure Duration; ACD, Average Closure Duration; AVOA, Average VOA; MC, Microclosure) in the laboratory experiment during the period T1 (addition of A. catenella), in relation to PST concentration in mussel. (B) Cluster analysis of behavioural indicators in relation to PST concentration in mussels during laboratory experiment. C0:<20 μg STXeq 100g-1, C1: 20 to 50 μg STXeq 100g-1, C2: 50 to 80 μg STXeq 100g-1, C3: >80 μg STXeq 100g-1; The red line represents a separation between the concentration groups established from these two clusters. This line was traced at the higher distance between two knots of the cluster representing a group with the concentration C0 and C1 and a second group with the concentrations C2 and C3, (C) Correlation circle of Principal Component Analysis for the behavioural indicators in the natural seawater experiment and PST in mussels, (D) Cluster analysis for groupings of PST concentrations with behavioural indicators in natural seawater experiment by SIMPROF method, C0:<10 μg STXeq 100g-1, C1: 30 to 50 μg STXeq 100g-1, C2: 50 to 80 μg STXeq 100g-1, C3: >80 μg STXeq 100g-1. Red line: group 1, blue line, group 2.
The correlation between the behavioural indicators and the physico-chemical parameters (Figure 4G) measured in the head tank are presented in Table 2. No microclosures were detected over the entire experiment. Average closure duration was not correlated with any of the three physicochemical parameters tested, while the number of closures was negatively correlated with turbidity. Salinity and temperature were negatively correlated with total closure duration and positively correlated with average valve open Amplitude, indicating that mussels opened more when temperature and salinity were high. Of the physicochemical parameters measured, salinity and the temperature were most strongly correlated with mussel gaping behaviour. The correlation test between the PST concentration in seawater and the physicochemical parameters show a positive correlation for the temperature (Rho = 0.397, p-v = 0.014) but not for the salinity and the turbidity (respectively Rho = -0.197, p-v = 0.241 and Rho = 0.035, p-v = 0.834) indicating a link between the A. catenella presence and the seawater temperature.
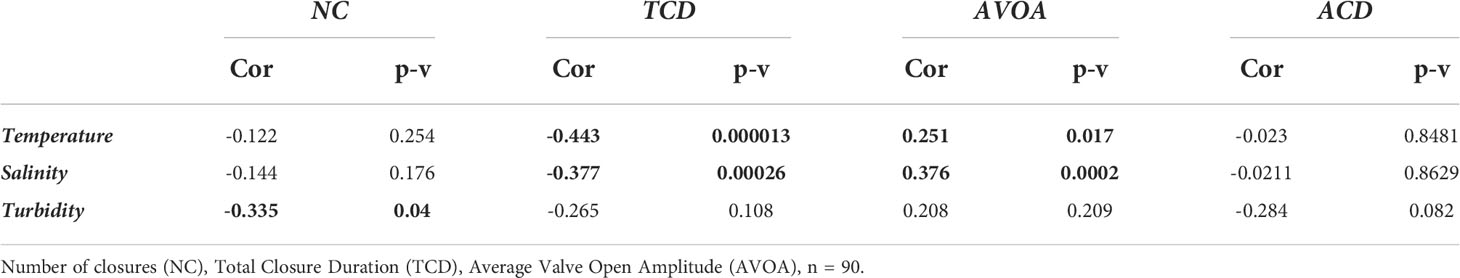
Table 2 Correlations between the M. edulis gaping behaviour and the variability of physical and chemical parameters measured in the natural seawater from the head tank.
PST concentration measured in the field (PSTm) mussels was strongly correlated with all behavioural indicators. Herein, PSTm was negatively correlated with the number of closures and total closure duration, and positively correlated with average valve open amplitude and average closure duration. These correlations were stronger than those obtained with algae abundances (Table 3). The correlation between experimental mussel gaping indicators with A. catenella, Dinophysis acuminata, Pseudo-nitzschia spp., and the PST measured from the field mussels are presented in the Table 3. In the case of D. acuminata, a weak negative correlation was observed with total closure duration and a weak positive correlation with the average valve open amplitude (Figure 5F), suggesting that mussels react little in presence of D. acuminata. The abundance of Pseudo-nitzschia spp. was positively correlated with average valve open amplitude and negatively correlated with total closure duration. Only total closure duration was negatively correlated with A. catenella abundance. The correlation between A. catenella and the behavioural indicators was lower than the correlation observed with Pseudo-nitzschia spp., suggesting a stronger reaction to Pseudo-nitzschia compared to A. catenella abundance. A similar trend was observed for D. acuminata and Pseudo-nitzschia, but the correlation was lower (respectively Rho = -0.218 and -0.218 for total closure duration and Rho = 0.195 and 0.282 for average VOA) than the correlations between the behavioural indicators and A. catenella. No correlation between the behavioural indicators and the PST measured in the seawater with the ELISA test were noted.
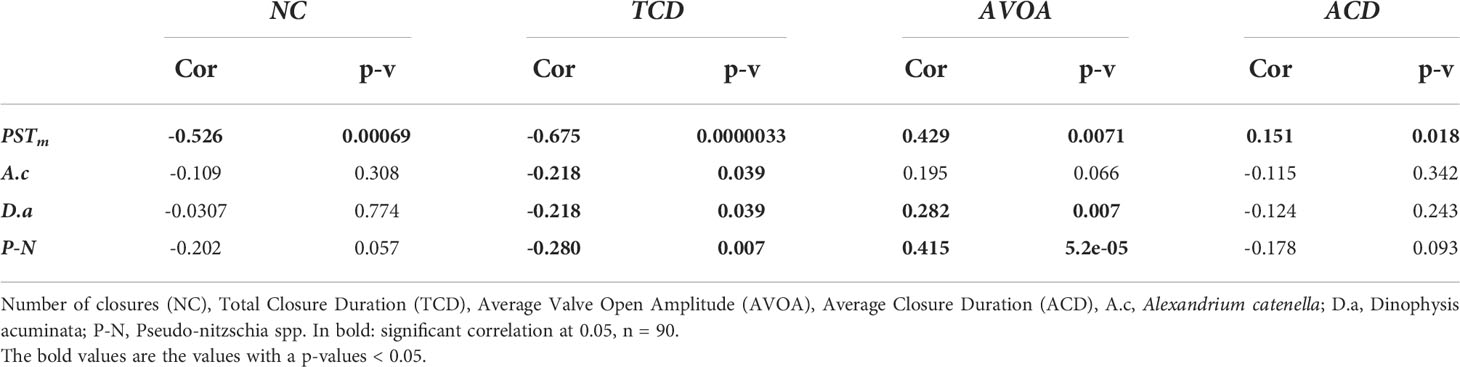
Table 3 Pearson correlation between the M. edulis gaping behaviour and the cells abundance (cells L-1) of toxic algae in natural seawater measured in the head tank and PST concentration measured in field mussels (PSTm).
The boxplot of the Figure 6 shows the average VOA, the total closure duration, and the number of closures in function of the A. catenella abundance during the time windows shown on Figure 6B. Average VOA and total closure duration varied among the different A. catenella concentration. PERMANOVA analysis (respectively DF= 3 and 380, Pseudo-F= 166,39, P(MC)= 1e-04 and DF= 3 and 380, Pseudo-F= 226,29, P(MC)= 1e-04) and pairwise tests indicated A0 (mean = 60.45 ± 0.79 for average VOA and mean = 4921.01 ± 227.75 for total closure duration) was effectively lower than A1 (mean = 82.94 ± 0.56 for average VOA and mean = 493.52 ± 101.17 for total closure duration) and A2 (mean = 79.62 ± 1.22 for average VOA and mean = 373.21 ± 73.21 for total closure duration) for the two indicators and A3 (mean = 85.94 ± 0.85 for average VOA and mean = 1079.49 ± 121.96 for total closure duration) was significantly higher A1 and A2 also for the two indicators. No significant difference was observed for the number of closures.
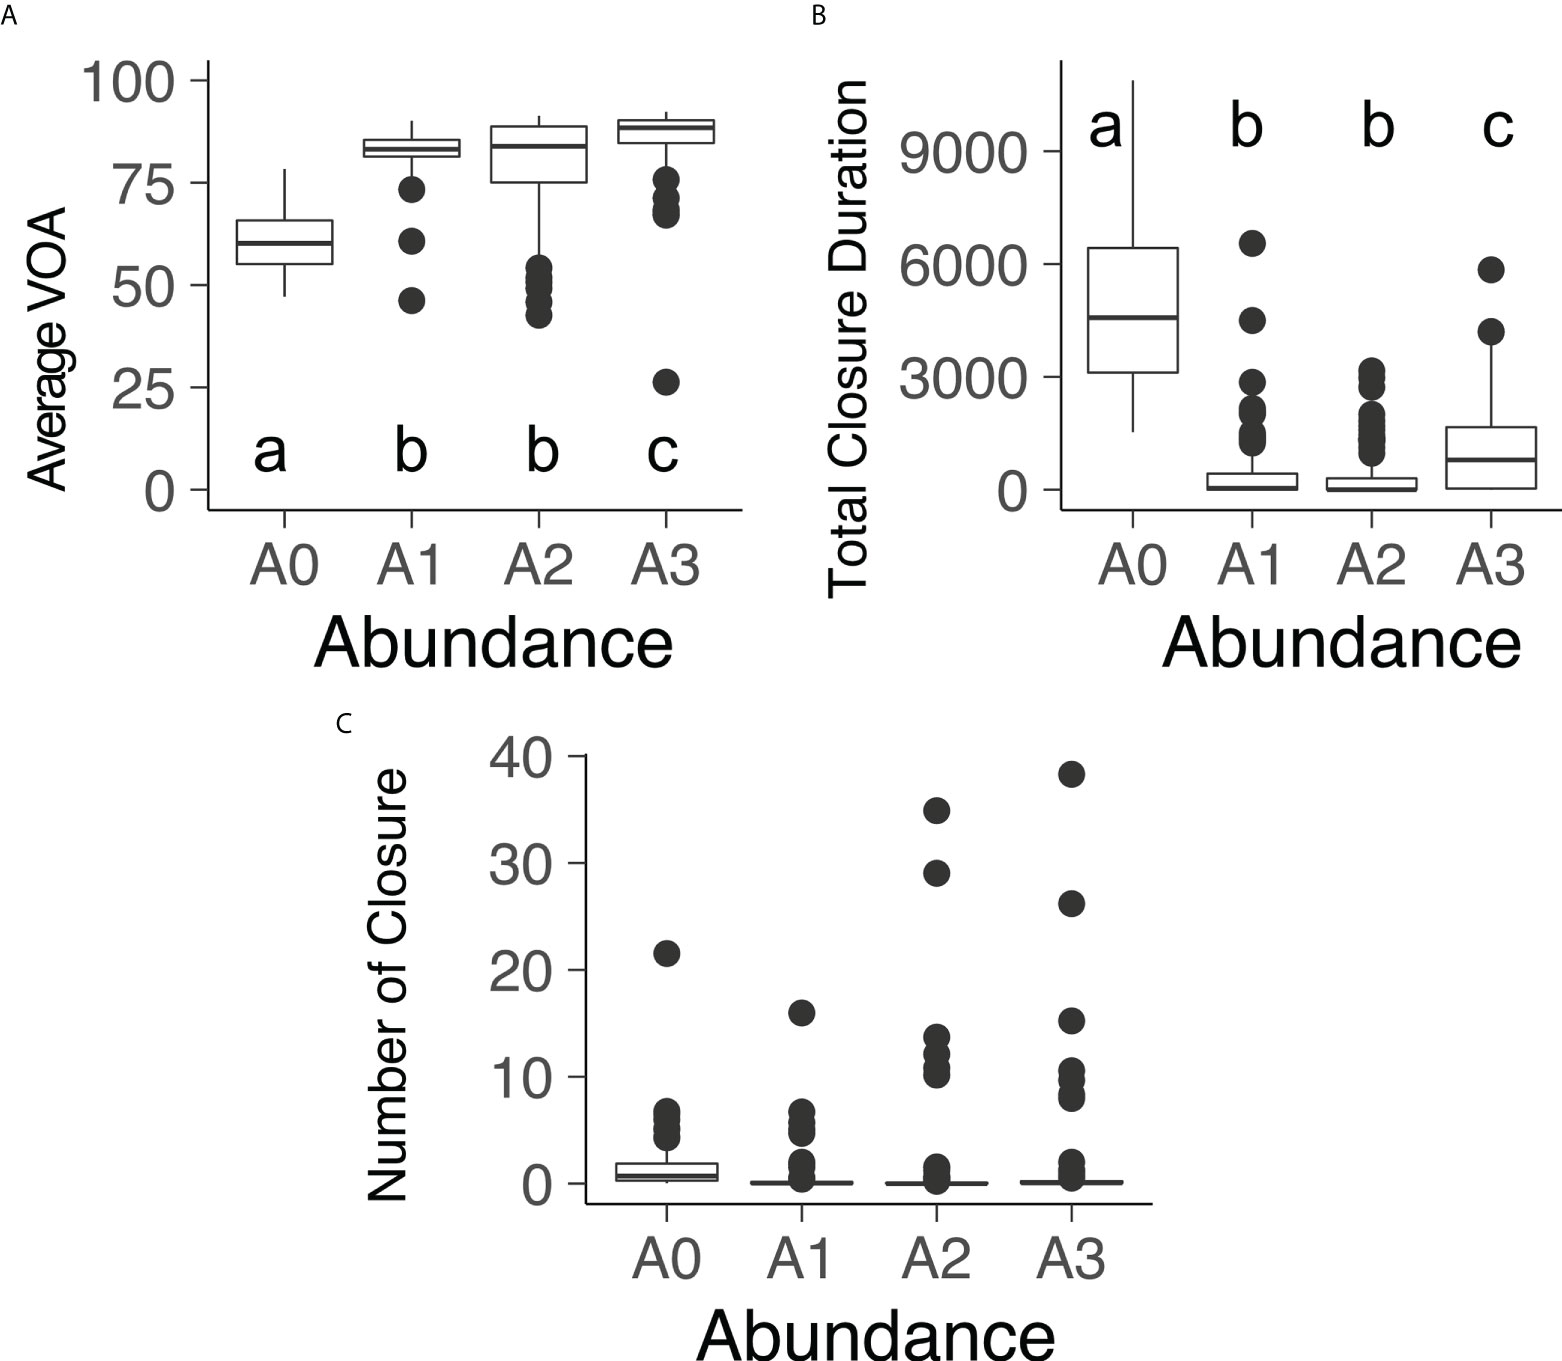
Figure 6 Boxplot of the (A) Average VOA, (B) total closure duration and (C) number of closures in function of the A. catenella abundance during the tested period of the time window of the fig 5b. A0: 0 cell L-1, A1: 560 cell L-1 (SE = 23.38), A2: 1190 cell L-1 (SE = 39.87), A3: 1680 cell L-1 (SE = 26.07).
In the natural sea water experiment, total closure duration and number of closures were negatively correlated with PST concentration in the littoral mussels (Figure 4C). Average closure duration and average valve open amplitude were not enough strongly correlated with mussel PST concentration, as closure duration was too distant from the correlation circle, and valve amplitude was in a different direction (Figure 4C). Thus, only the total closure duration and the number of Closure were selected to be tested with the univariate PERMANOVA analysis.
PERMANOVA revealed the presence of significant differences between the different PST concentrations for the number of closures (DF= 3 and 34, Pseudo-F=4.634, P(MC)=0.0086) and total closure duration (DF= 3 and 34, Pseudo-F= 13.67, P(MC)= 1e-04). The pairwise test for number of closures indicated very significant effects of PST, with an increasing of closure, in the C2 (50 to 80 µg STXeq 100g-1, n = 9) and C3 (>80 µg STXeq 100g-1, n = 8) concentration range, with significant results for C1 (30 to 50 µg STXeq 100g-1, n = 6), relative to C0. For total closure duration, no significant difference was observed between C0 (<10 µg STXeq 100g-1, n = 15) and C1 or between C1 and C2; however, all other contrasts were significant. Additionally, multivariate PERMANOVA revealed a significant effect of mussel PST accumulation when these two behavioural indicators were treated simultaneously (DF=3 and 4, pseudo-F=13.67; P(MC)=0.0004). A pairwise test of this analysis indicated an effect of PST in concentration ranges >C1.
Contrary to the laboratory experiment, a SIMPROF test was possible for natural seawater experiment and showed two distinct groups (Figure 4D). One group included only the C0 mussels, while the other group included C1, C2, and C3 mussels. Herein, C2 and C3 concentration ranges had the most similar effects on gaping behaviour, with C1 showing a slightly lower similarity to C2 and C3.
In Figure 2, the actograms show the population-scale VOA time series alongside the water-level and photoperiod (Figure 2A), A. catenella abundance (Figure 2B) and PST concentration in mussel tissue (Figure 2C). Firstly, the presence of tidal and daily rhythms of VOA was not detected by chronobiological analysis with the use of 4-days windows chosen to analyse rhythmicity of mussel gaping behaviour in relation to A. catenella abundance. However, for the PSP concentration, the 6-day windows used to compare the rhythmicity of mussels with the Lomb and Scargle periodogram showed a significant daily period of 23.8 h (Figure 7) for the concentration A0 (3.72 µg STXeq 100g-1), and the rhythm was validated by the Cosinor model (p = 0.001) with a percent rhythm of 63.53%. After residues injection, the Lomb and Scargle periodogram showed a second significant period in the tidal range equal to 12.9 h, and the rhythm was validated by the Cosinor model (p = 0.028) with a percent rhythm of 45.6%. For mussels contaminated with the PSP concentration A1 (49 µg STXeq 100g-1 SE = 4.1), no significant period was detected with the Lomb and Scargle periodogram. For the concentrations A2 (72.16 µg STXeq 100g-1 SE =3.8) and A3 (104.46 µg STXeq 100g-1 SE = 3.72), the Lomb and Scargle detected respectively a 12.3 h and 12.5 h period. However, no rhythms were detected by the Cosinor model for the mussels intoxicated by A. catenella.
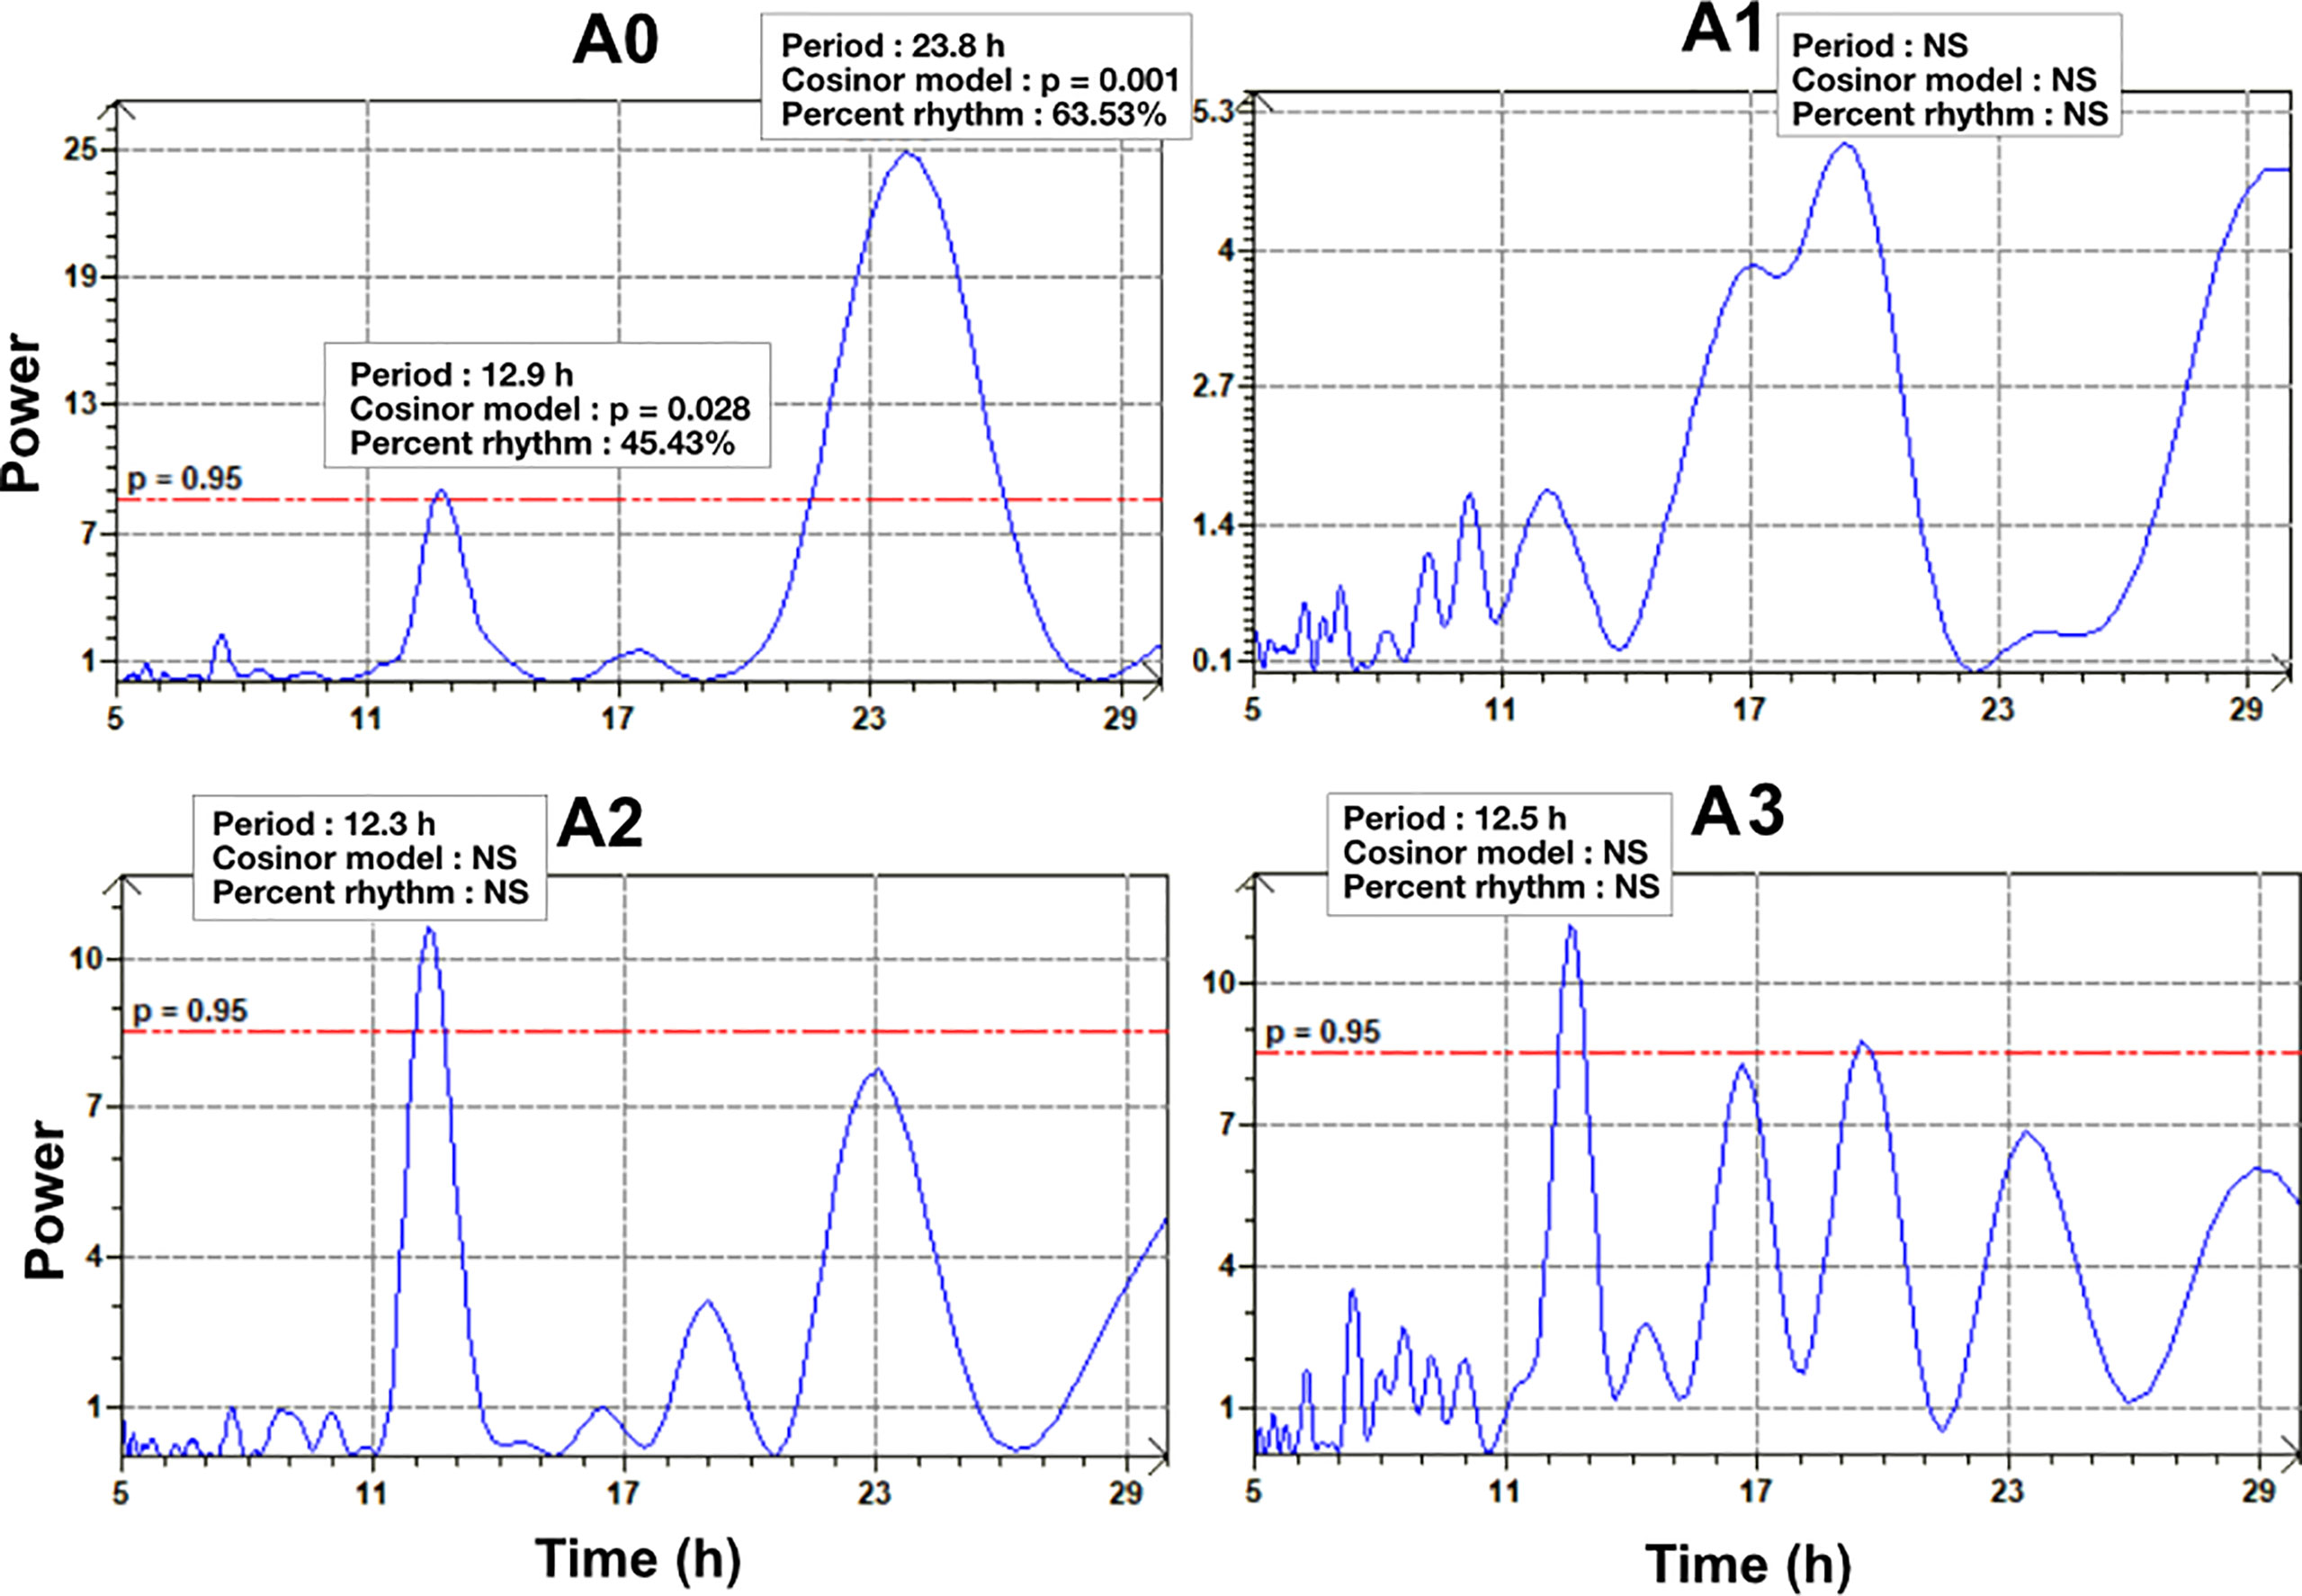
Figure 7 Lomb and Scargle periodograms done on VOA data during the time windows of the fig 5c. A0: 3.72 µg STXeq 100g-1, A1: 49 µg STXeq 100g-1 (SE = 4.1), A2: 72.16 µg STXeq 100g-1 (SE = 3.8), A3: 104.48 µg STXeq 100g-1 (SE = 3.72). The red line represents the significancy threshold (p = 0.95).
4 Discussion
In both the laboratory and natural seawater experiments, behaviour indicators could be used to indicate the presence of toxic algae, like A. catenella. Particularly, the number of closures, total closure duration and average valve open amplitude were adequate indicators of toxic algae presence indicating an increasing of opening. Results of the laboratory experiment indicated that total closure duration and average closure duration were negatively correlated with PST accumulated in mussels, indicating that mussels remained open longer as A. catenella accumulation increased. Likewise, a similar trend was observed in the natural seawater experiment, as the number of closures and total closure duration decreased, and as average valve open amplitude increased, with increasing PST accumulation in mussels (Table 3). These results confirm a longer period of valve opening when PSP concentration in mussel tissue is higher, and when PST concentration in mussels increases as compared to when A. catenella is absent.
Changes in mussels’ gaping behaviour indicates a real impact of the algae A. catenella that is observable by monitoring valvometry. In the context of stressful conditions as chemical toxin or predator presence, mussels close their valves to be isolated from the external environment (Rajagopal et al., 1997; Clements et al., 2021; Durier et al., 2021). As such, a decrease in average valve opening amplitude and an increase in total closure duration and the number of closures, should be anticipated under stressful conditions. However, the results of our study reveal the inverse phenomenon when these animals are exposed to A. catenella. This response has been observed in other bivalve species exposed to toxic algae as well. For example, Tran et al. (2010) and Haberkorn et al. (2011) reported similar results for the oyster, Crassostrea (Magallana) gigas, exposed to PST-producing dinoflagellate, Alexandrium minutum. Bricelj et al. (2005) also observed increased in valve opening of soft-shell clams, Mya arenaria, exposed to PST from toxic dinoflagellates, Alexandrium spp. The increased opening under the stress of toxic algae could be explained by a paralysis of the adductor muscle induced by PSP toxins, as demonstrated for multiple species of bivalves including M. edulis (Galimany et al., 2008), C. virginica and C. gigas exposed to A. catenella and/or A. fundyense (Hégaret et al., 2007; Tran et al., 2010). Since mussels accumulate PSP toxins in the muscle, mantle, foot, and gills (Bricelj and Shumway, 1998), the mechanism previously mentioned seems probable. Mechanistically, voltage-gated sodium channels can be blocked by the toxin, thus limiting action potential in the muscle and the nervous system (Hégaret et al., 2007).
The correlations between behavioural indicators and physico-chemical seawater parameters suggest that mussels may be sensitive to these parameters. Indeed, both temperature (Clements et al., 2018; Clements et al., 2021) and salinity are reported to affect valve gaping behaviour in bivalves but with more of closures contrary to our results who shown less of closure. However, A. catenella development in the Lower St. Lawrence Estuary is also associated with these physico-chemical parameters, in particular salinity and water temperature (Fauchot et al., 2005; Navarro et al., 2006; Aguilera-Belmonte et al., 2013; Starr et al., 2017; Boivin-Rioux et al., 2021). The optimal temperature for the development of this algae is ≈14°C (Boivin-Rioux et al., 2021), a temperature only present during summer in the St. Lawrence Estuary. Salinity also regulates A. catenella development, with growth increasing at higher salinity (Aguilera-Belmonte et al., 2013). In the St. Lawrence Estuary, salinity increases after the spring when snow melt stops, and precipitation decreases. Thus, the correlation between these physico-chemical parameters and the variation of the behavioural indicators could be, at least partly, explained by the ecological link between temperature, salinity, and A. catenella development in the Lower St-Lawrence Estuary. This idea is further supported by the correlation between seawater temperature and A. catenella abundance observed in the study, as well as correlations between behavioural indicators and PST accumulation in the laboratory experiment when temperature and salinity were stable.
Correlations between behavioural indicators and the abundance of the multiple algae species (A. catenella, D. acuminata and Pseudo-nitzschia spp., the two last don’t producing PST) were evident in this study. Correlations were the strongest for Pseudo-nitzschia spp., suggesting that mussel gaping behaviour may be more strongly linked to Pseudo-nitzschia spp. than A. catenella. Despite the low correlations detected with the comparison of the mussel gaping behaviour with the A. catenella abundance during the 90 days of the experience, it was possible do identify differences between the gaping behaviour with the use of time windows corresponding at the different A. catenella abundances. The bioaccumulation of the toxins produced by A. catenella in mussels (Starr et al., 2017) and their subsequent detoxification have a half-life time between 5 days (Nielsen et al., 2016) and 20 days (Marcaillou et al., 2010), corresponding to the increased period of A. catenella influence on mussel gaping behaviour observed in this study. This could explain the higher correlation coefficient for the relationship between gaping behaviour and PSP concentration in the mussels’ tissue, as compared to the relationship between gaping behaviour and A. catenella in the seawater. This result was also observed with seawater PST concentration measured with the ELISA test. Thus, using PSP toxin concentration in mussel tissues makes it possible to determine the period where mussels and their gaping behaviour were affected. The domoic acid presence were not tested in this study, however, in St Lawrence Estuary the domoic acid is below the regulatory action level (20 μg g-1 shellfish tissue; Bates et al., 2020). This indicating the Pseudo-nitzschia specie detected could be a non-toxic specie considering the abundance measured.
In the laboratory experiment, correlations between the behavioural indicators and the toxin concentration were weaker after A. catenella exposure (T2) than during A. catenella exposure (T1). This difference could be explained by the mussel detoxification process, and by mussels feeding on non-toxic alga (T. suecica) during T2. Previous studies indicate that mussel detoxification rates are high during the first days following intoxication (Blanco et al., 1997) and increase in mussels fed non-toxic algae (Marcaillou et al., 2010).
Based on the analysis of behavioural indicators selected from PCA, is it possible to identify the PST concentration in mussel tissues whereby gaping behaviour is affected. Identifying this PST concentration allows for the suggestion of a detection threshold for the use of valvometry as an early warning system in detecting toxic algae in the environment. In the laboratory experiment, behavioural change was detected above a PST tissue concentration exceeding the regulatory harvest closure limit (>80 µg STXeq 100g-1). In the natural seawater experiment, behavioural change was detected with a lower PST concentration (>30 µg STXeq 100g-1). The difference between these detection thresholds could be explained by the duration of exposure to A. catenella, being longer in the natural seawater experiment (1 day in laboratory conditions and between 3 to 21 days in natural environment conditions). The SIMPROF test revealed gradual change in mussel gaping behaviour in relation to PST accumulated in mussels until C2 concentration, as effects at C2 and C3 were similar. Given the detection of the threshold >30 µg STXeq 100g-1 under field conditions, valvometry may be considered as an early-warning system against toxic blooms. Under the field conditions of 2019, it provided a warning signal 10 days prior to PST levels reaching the regulatory harvest closure limit. The use of actogram could also early indicate the presence of A. catenella. Indeed, on the actogram of the Figure 2, it was possible to visually observe a behavioural change in mussels before their contamination at the detection threshold.
In this study, two techniques were used to detect PST in mussel tissues – valvometry and ELISA assays. Likewise, two techniques were used to detect PST in seawater (SRT test and ELISA assays). The use of these three techniques (valvometry, SRT and ELISA) allowed us to compare these methods as early-warning systems for toxic A. catenella presence. Considering a detection threshold of >30 µg STXeq 100g-1 in mussel tissues as observed in the natural seawater experiment (estimated with ELISA), valvometry is less sensitive than the SRT (0.2 µg STXeq 100g-1) and ELISA assay (0.0015 µg STXeq 100g-1). However, valvometry offered other advantages that the other two methods did not. Firstly, valvometry and ELISA are applied directly to mussels and consequently are sensitive to the depuration period, during which time a SRT test may not detect any toxic algae in seawater. Secondly, the use of valvometry is easier than both other tests, as once the mussels are equipped with the valvometer, no additional manipulations are required. The automation of data collection and signal processing should ultimately allow the detection of PST without much human intervention. Finally, the frequency of measurements provided by valvometry far exceeds that of both SRT and ELISA, increasing the temporal resolution at which toxic algae can be detected. The valvometry have a good sensibility to detect PST with the paralysis induced. However, the valvometry can detect others stress like synthetic substances occasioning valves closures (Durier et al., 2021).
Generally, mussel species follow a tidal rhythm synchronised by the tides cycle and a daily rhythm linked to the day-night succession (Gnyubkin, 2010). Without A. catenella, the mussels monitored during this study followed these rhythms. However, when the mussels were intoxicated by A. catenella and accumulated PSP, these two rhythms became non-significant. These results were in agreement with the previous studies on oysters Crassostrea gigas in the case of intoxication by A. minutum for the daily rhythm (Tran et al., 2015) and for the tidal rhythm (Mat et al., 2016). Thus, A. catenella impacted the biological rhythms of the mussels during a PSP intoxication, probably by the paralysis observed indicating that mussel becomes unable to follow the rhythm. This effect on rhythms could impact the metabolism and the physiology (Tran et al., 2015; Mat et al., 2016).
5 Conclusion
We evaluated the potential use of the valvometry to detect changes in M. edulis gaping behaviour during an exposure to the toxic dinoflagellate A. catenella to determine the efficacy of valvometry to serve as an early warning system. Our results suggest that valvometry is adequate for detecting paralysis induced by PSP toxins produced by A. catenella, as the reduction of valve closure duration (i.e., increased valve opening) were indicative of toxic A. catenella presence. Herein, mussel gaping behaviour was rapidly impacted at the onset of PST accumulation. The fast reactivity of the mussels in presence of PST and the capacity of valvometry to detect these changes suggests that this technology can be used on this bivalve species to alert the presence of A. catenella blooms before they become problematic. As such, valvometry systems such as the HFNI valvometry biosensor linked to the GPRS (General Packet Radio Service; Andrade et al., 2016), which wirelessly transmit real-time data, could be used as early warning systems by shellfish growers to quickly detect the presence of PST producing algae and take appropriate measures to minimise negative impacts to their operations.
Data availability statement
The raw data supporting the conclusions of this article will be made available by the authors, without undue reservation.
Author contributions
As first author, my contribution was the experiment realisation, the analyses and the data treatment, the interpretation and the article rédaction. J-BN and SM also have participated at the experimentations, LC, MS, JB, DT, JC, and RT participated at the data interpretation. All authors contributed to the article and approved the submitted version.
Funding
This project was undertaken with the financial support of the Government of Canada, specifically by a research grant from Environment and Climate Change Canada provided to RT’s (FDE-CA-2017i002) and by the Ressources Aquatiques Québec research network (Fonds de Recherche du Québec – Nature et Technologies, no. 2014-RS-171172). Fisheries and Oceans Canada provided in-kind assistance that was motivated by the Galway Statement on Atlantic Ocean Cooperation.
Acknowledgments
The authors thank the scientific group Ressources Aquatiques du Québec for their implication in this study and the help offered by the IML technicians. For their constructive comments on a previous version of this manuscript, the authors thank Fanny Noisette and David Drolet.
Conflict of interest
The authors declare that the research was conducted in the absence of any commercial or financial relationships that could be construed as a potential conflict of interest.
Publisher’s note
All claims expressed in this article are solely those of the authors and do not necessarily represent those of their affiliated organizations, or those of the publisher, the editors and the reviewers. Any product that may be evaluated in this article, or claim that may be made by its manufacturer, is not guaranteed or endorsed by the publisher.
References
Aguilera-Belmonte A., Inostroza I., Carrillo K. S., Franco J. M., Riobó P., Gómez P. I. (2013). The combined effect of salinity and temperature on the growth and toxin content of four Chilean strains of Alexandrium catenella (Whedon and kofoid) balech 1985 (Dinophyceae) isolated from an outbreak occurring in southern Chile in 2009. Harmful Algae 23, 55–59. doi: 10.1016/j.hal.2012.12.006
Almada-Villela P. C., Davenport J., Gruffydd L. D. (1982). The effects of temperature on the shell growth of young Mytilus edulis l. J. Experiment. Marine Biol. Ecol. 59, 275–288. doi: 10.1016/0022-0981(82)90121-6
Andersen P., Throndsen J. (2004). “Estimating cell numbers,” in Manual on harmful marine microalgae. Eds. Hallegraeff G. M., Anderson, Cembella A. D. (Paris: UNESCO Publishing), 99–129
Anderson D. M., Cembella A. D., Hallegraeff G. M. (2011). Progress in understanding harmful algal blooms: paradigm shifts and new technologies for research, monitoring, and management. Annu. Rev. Mar. Sci. 4, 143–176. doi: 10.1146/annurev-marine-120308-081121
Anderson M., Gorley R. N., Clarke K. R. (2008). PERMANOVA + for PRIMER user manual 1. Guide Software Statistical Methods 1, 218.
Andrade H., Massabuau J.-C., Cochrane S., Ciret P., Tran D., Sow M., et al. (2016). High frequency non-invasive (HFNI) bio-sensors as a potential tool for marine monitoring and assessments. Front. Mar. Sci. 3. doi: 10.3389/fmars.2016.00187
Bates S. S., Beach D. G., Comeau L. A., Haigh N., Lewis N. I., Locke A., et al. (2020). Marine harmful algal blooms and phycotoxins of concern to Canada. Can. Tech. Rep. Fish. Aquat. Sci. 3384, 322. doi: 10.1016/j.jmarsys.2014.12.002
Bayne B. L. (1976). Marine mussels: their ecology and physiology (Cambridge: Cambridge University Press), 506p.
Bérard-Therriault L., Poulin M., Bossé L. (1999). Guide d'identification du phytoplancton marin de l'estuaire et du golfe du saint-Laurent: incluant également certains protozoaires Vol. 128 (Ottawa: Canadian Speial Publication of Fisheries and Aquatic Science), 387p.
Blanco J., Morono A., Franco J., Reyero M. I. (1997). PSP detoxification kinetics in the mussel Mytilus galloprovincialis. one- and two-compartment models and the effect of some environmental variables. Marine Ecol. Progress Series 158, 165–175. doi: 10.3354/meps158165
Boivin-Rioux A., Starr M., Chassé J., Scarratt M., Perrie W., Long Z. (2021). Predicting the effects of climate change on the occurrence of the toxic dinoflagellate Alexandrium catenella along canada’s east coast. Front. Mar. Sci. 7. doi: 10.3389/fmars.2020.608021
Bricelj V. M., Connell L., Konoki K., MacQuarrie S. P., Scheuer T., Catterall W. A., et al. (2005). Sodium channel mutation leading to saxitoxin resistance in clams increases risk of PSP. Nature 434, 763–767. doi: 10.1038/nature03415
Bricelj V. M., Lee J. H., Cembella A. D., Anderson D. M. (1990). Uptake kinetics of paralytic shellfish toxins from the dinoflagellate Alexandrium fundyense in the mussel Mytilus edulis. Mar. Ecol. Prog. Series 63, 177–188. doi: 10.3354/meps063177
Bricelj V. M., Shumway S. E. (1998). Paralytic shellfish toxins in bivalve molluscs: occurrence, transfer kinetics, and biotransformation. Rev. Fish. Sci. 6 (4), 315–383. doi: 10.1080/10641269891314294
Cembella A. D., Quilliam M. A., Lewis N. I., Bauder A. G., Aversano C. D., Thomas K., et al. (2002). The toxigenic marine dinoflagellate Alexandrium tamarense as the probable cause of mortality of caged salmon in Nova Scotia. Harmful Algae 1, 313–325. doi: 10.1016/S1568-9883(02)00048-3
Clements J. C., Comeau L. A. (2019). Use of high-frequency noninvasive electromagnetic biosensors to detect ocean acidification effects on shellfish behavior. J. Shellfish Res. 38, 811–818. doi: 10.2983/035.038.0330
Clements J. C., Hicks C., Tremblay R., Comeau L. A. (2018). Elevated seawater temperature, not pCO2, negatively affects post-spawning adult mussels (Mytilus edulis) under food limitation. Conserv. Physiol. 6, 1–14. doi: 10.1093/conphys/cox078
Clements J. C., Ramesh K., Nysveen J., Dupont S., Jutfelt F. (2021). Animal size and sea water temperature, but not pH, influence a repeatable startle response behaviour in a wide-ranging marine mollusc. Anim. Behav. 173, 191–205. doi: 10.1016/j.anbehav.2020.12.008
Comeau L. A. (2014). Spring awakening temperature and survival of sediment-covered eastern oysters Crassostrea virginica. Aquaculture 430, 188–194. doi: 10.1016/j.aquaculture.2014.04.009
Comeau L. A., Babarro J. M. F., Riobó P., Scarratt M., Starr M., Tremblay R. (2019). PSP-producing dinoflagellate Alexandrium minutum induces valve microclosures in the mussel mytilus galloprovincialis. Aquaculture 500, 407–413. doi: 10.1016/j.aquaculture.2018.10.025
Dell’Aversano C., Hess P., Quilliam M. A. (2005). Hydrophilic interaction liquid chromatography-mass spectrometry for the analysis of paralytic shellfish poisoning (PSP) toxins. J. Chromatogr. A. 1081, 190–201. doi: 10.1016/j.chroma.2005.05.056
Dray S., Dufour A. B. (2007). The ade4 package: Implementing the duality diagram for ecologists. J. Stat. Software 22, 1–20. doi: 10.18637/jss.v022.i04
Durier G., Nadalini J. B., Saint-Louis R., Genard B., Comeau L. A., Tremblay R. (2021). Sensitivity to oil dispersants: Effects on the valve movements of the blue mussel Mytilus edulis and the giant scallop Placopecten magellanicus, in sub-arctic conditions. Aquat. Toxicol. 234, 105797. doi: 10.1016/j.aquatox.2021.105797
FAO (2016). La situation pêches et de l’aquaculture 2016., contribuer à la sécurité alimentaire et à la nutrition de tous (Rome: FAO), 224p. doi: 10.1136/qshc.2005.015107
Fauchot J., Levasseur M., Roy S., Gagnon R., Weise A. M. (2005). Environmental factors controlling Alexandrium tamarense (dinophyceae) growth rate during a red tide event in the st. Lawrence estuary (Canada). J. Phycol. 41, 263–272. doi: 10.1111/j.1529-8817.2005.03092.x
Galimany E., Sunila I., Hégaret H., Ramón M., Wikfors G. H. (2008). Experimental exposure of the blue mussel (Mytilus edulis, l.) to the toxic dinoflagellate Alexandrium fundyense: Histopathology, immune responses, and recovery. Harmful Algae 7, 702–711. doi: 10.1016/j.hal.2008.02.006
Gnyubkin V. F. (2010). The circadian rhythms of valve movements in the mussel Mytilus galloprovincialis. Russian J. Mar. Biol. 36, 419–428. doi: 10.1134/S1063074010060039
Gouthiere L., Mauvieux B., Davenne D., Waterhouse J. (2005). Complementary methodology in the analysis of rhythmic data, using examples from a complex situation, the rhythmicity of temperature in night shift workers. Biol. Rhythm. Res. 36, 177–193. doi: 10.1080/09291010400026298
Gouvernement du Canada, A. canadienne d’inspection des aliments (2018) Manuel Du programme canadien de contrôle de la salubrité des mollusques. Available at: https://inspection.canada.ca/exigences-et-documents-d-orientation-relatives-a-c/poisson/programme-canadien-de-controle-de-la-salubrite-des/fra/1527251566006/1527251566942?chap=0s4c3 (Accessed 6.15.22).
Granéli E. (2006). Ecology of harmful algae Vol. Vol. 189. Ed. Turner J. T. (Berlin: Springer), 406.
Guillard R. R. (1975). “Culture of phytoplankton for feeding marine invertebrates,” in Culture of marine invertebrate animals. Eds. Smith W. L., Chanley. M. H. (Plenum Press New York: Ottawa), 29–60.
Haberkorn H., Tran D., Massabuau J. C., Ciret P., Savar V., Soudant P. (2011). Relationship between valve activity, microalgae concentration in the water and toxin accumulation in the digestive gland of the pacific oyster Crassostrea gigas exposed to Alexandrium minutum. Mar. Pollut. Bull. 62, 1191–1197. doi: 10.1016/j.marpolbul.2011.03.034
Hallegraeff G. M. (1993). A review of harmful algal blooms and their apparent global increase. Physiol. Rev. 32, 79–99. doi: 10.2216/i0031-8884-32-2-79.1
Hégaret H., Wikfors G. H., Soudant P., Lambert C., Shumway S. E., Bérard J. B., et al. (2007). Toxic dinoflagellates (Alexandrium fundyense and a. catenella) have minimal apparent effects on oyster hemocytes. Mar. Biol. 152, 441–447. doi: 10.1007/s00227-007-0703-3
James K. J., Carey B., O’Halloran J., Van Pelt F. N. A. M., Škrabáková Z. (2010). Shellfish toxicity: Human health implications of marine algal toxins. Epidemiol. Infect. 138, 927–940. doi: 10.1017/S0950268810000853
Jellett J. F., Roberts R. L., Laycock M. V., Quilliam M. A., Barrett R. E. (2002). Detection of paralytic shellfish poisoning (PSP) toxins in shellfish tissue using MIST AlertTM, a new rapid test, in parallel with the regulatory AOAC® mouse bioassay. Toxicon 40, 1407–1425. doi: 10.1016/S0041-0101(02)00153-8
Larocque R., Cembella A. D. (1990). “Ecological parameters associated with the seasonal occurrence of alexandrium spp. and consequent shellfish toxicity in the lower st. Lawrence estuary(eastern Canada),” in Toxic marine phytoplankton. Eds. Granéli E. P., Sundstöm B., Edler L., Anderson; D. M. (Ney York: Elsevier), 368–373.
Lassus P., Bardouil M., Beliaeff B., Masselin P., Naviner M., Truquet P. (1999). Effect of a continuous supply of the toxic dinoflagellate Alexandrium minutum balim on the feeding behavior of the pacific oyster (Crassostrea gigas thunberg). J. Shellfish Res. 18, 211_216.
Lilly E. L., Halanych K. M., Anderson D. M. (2007). Species boundaries and global biogeography of the Alexandrium tamarense complex (Dinophyceae). J. Phycol. 43, 1329–1338. doi: 10.1111/j.1529-8817.2007.00420.x
Lomb N. R. (1976). Least-squares frequency analysis of unequally spaced data. Astrophysics Space Sci. 39 (2), 447–462. doi: 10.1007/BF00648343
Marcaillou C., Haure J., Mondeguer F., Courcoux A., Dupuy B., Pénisson C. (2010). Effect of food supply on the detoxification in the blue mussel, Mytilus edulis, contaminated by diarrhetic shellfish toxins. Aquatic. Living Resources 23, 255–266. doi: 10.1051/alr/2010026
Martinez Arbizu P. (2019). “Pairwiseadonis: Pairwise multilevel comparison using adonis,” in R packag. version 0.3. Available at: https://github.com/pmartinezarbizu/pairwiseAdonis
Mathiesen S. S., Thyrring J., Hemmer-Hansen J., Berge J., Sukhotin A., Leopold P., et al. (2017). Genetic diversity and connectivity within mytilus spp. in the subarctic and Arctic. Evol. Appl. 10 (1), 39–55. doi: 10.1111/eva.12415
Mat A. M., Perrigault M., Massabuau J.-C., Tran D. (2016). Role and expression of cry1 in the adductor muscle of the oyster Crassostrea gigas during daily and tidal valve activity rhythms. Chronobiology Int. 33, 949–963. doi: 10.1080/07420528.2016.1181645
McKenzie C. H., Bates S. S., Martin J. L., Haigh N., Howland K. L., Lewis N. I., et al. (2021). Three decades of Canadian marine harmful algal events: Phytoplankton and phycotoxins of concern to human and ecosystem health. Harmful Algae 102, 1–18. doi: 10.1016/j.hal.2020.101852
Nagai K., Honjo T., Go J., Yamashita H., Seok J. O. (2006). Detecting the shellfish killer Heterocapsa circularisquama (Dinophyceae) by measuring bivalve valve activity with a hall element sensor. Aquaculture 255, 395–401. doi: 10.1016/j.aquaculture.2005.12.018
Navarro J. M., Muñoz M. G., Contreras A. M. (2006). Temperature as a factor regulating growth and toxin content in the dinoflagellate Alexandrium catenella. Harmful Algae 5, 762–769. doi: 10.1016/j.hal.2006.04.001
Nielsen L. T., Hansen P. J., Krock B., Vismann B. (2016). Accumulation, transformation and breakdown of DSP toxins from the toxic dinoflagellate Dinophysis acuta in blue mussels, Mytilus edulis. Toxicon 117, 84–93. doi: 10.1016/j.toxicon.2016.03.021
Oksanen J., Blanchet F. G., Friendly M., Kindt R., Legendre P., Mcglinn D., et al. (2019). Community ecology package: ordination, diversity and dissimilarities. Vegan Community Ecol. Package 2, 1–297.
Parkhill J. P., Cembella A. D. (1999). Effects of salinity, light and inorganic nitrogen on growth and toxigenicity of the marine dinoflagellate Alexandrium tamarense from northeastern Canada. J. Plankton Res. 21, 939–955. doi: 10.1093/plankt/21.5.939
Payton L., Sow M., Massabuau J.-C., Ciret P., Tran D. (2017). How annual course of photoperiod shapes seasonal behavior of diploid and triploid oysters, Crassostrea gigas. PloS One 12, e0185918. doi: 10.1371/journal.pone.0185918
Rajagopal S., van der Velde G., Jenner H. A. (1997). Shell valve movement response of dark false mussel, Mytilopsis leucophaeta, to chlorination. Water Res. 31, 3187–3190. doi: 10.1016/S0043-1354(97)00163-2
Riisgård H. U., Lassen J., Kittner C. (2006). Valve-gape response times in mussels (Mytilus edulis) - effects of laboratory preceding-feeding conditions and in situ tidally induced variation in phytoplankton biomass. J. Shellfish Res. 25, 901–911. doi: 10.2983/0730-8000(2006)25[901:VRTIMM]2.0.CO;2
Robson A. A., Garcia De Leaniz C., Wilson R. P., Halsey L. G. (2010). Behavioural adaptations of mussels to varying levels of food availability and predation risk. J. Molluscan Stud. 76 (4), 348–353. doi: 10.1093/mollus/eyq025
Robson A., Wilson R., De Leaniz C. G. (2007). Mussels flexing their muscles: A new method for quantifying bivalve behaviour. Mar. Biol. 151, 1195–1204. doi: 10.1007/s00227-006-0566-z
Roelke D. L. (2007). Ecology of harmful algae, eos, transactions American geophysical union. EOS 88 (30), 304. doi: 10.1029/2007eo300006
Scargle J. D. (1982). Studies in astronomical time series analysis. II-statistical aspects of spectral analysis of unevenly spaced data. Astrophysical J. 263, 835–853. doi: 10.1086/160554
Sonier R., Comeau L. A., Tremblay R., Olivier F., Meziane T., Genard B. (2020). Mytilus edulis and Styela clava assimilate picophytoplankton carbon through feces and pseudofeces ingestion. Aquaculture 531, 735868. doi: 10.1016/.aquaculture.2020.735868
Starr M., Lair S., Michaud S., Scarratt M., Quilliam M., Lefaivre D., et al. (2017). Multispecies mass mortality of marine fauna linked to a toxic dinoflagellate bloom. PloS One 12, 1–18. doi: 10.1371/journal.pone.0176299
Therriault J. C., Painchaud J., Levasseur M. (1985). Factors controlling the occurrence of protogonyaulax tamarensis and shellfish toxicity in the st. Lawrence estuary: freshwater runoff and the stability of the water column. toxic dinoflagate (New York: Elsevier), 41–51.
Tran D., Ciret P., Ciutat A., Durrieu G., Massabuau J. C. (2003). Estimation of potential and limits of bivalve closure response to detect contaminants: Application to cadmium. Environ. Toxicol. Chem. 22, 914–920. doi: 10.1897/1551-5028(2003)022<0914:EOPALO>2.0.CO;2
Tran D., Ciutat A., Mat A., Massabuau J. C., Hégaret H., Lambert C., et al. (2015). The toxic dinoflagellate alexandrium minutum disrupts daily rhythmic activities at gene transcription, physiological and behavioral levels in the oyster Crassostrea gigas. Aquat. Toxicol. 158, 41–49. doi: 10.1016/j.aquatox.2014.10.023
Tran D., Haberkorn H., Soudant P., Ciret P., Massabuau J. C. (2010). Behavioral responses of Crassostrea gigas exposed to the harmful algae minutum. Aquaculture 298, 338–345. doi: 10.1016/j.aquaculture.2009.10.030
Tremblay R., Landry T., Leblanc N., Pernet F., Barkhouse C., Sévigny J. (2011). Physiological and biochemical indicators of mussel seed quality in relation to temperatures. Aquat. Living Resources 282, 273–282. doi: 10.1051/alr/2011113
Keywords: behavioural ecology, biomonitoring, environmental stress, Harmful Algal Blooms (HABs), Paralytic Shellfish Poisoning (PSP)
Citation: Durier G, Nadalini J-B, Comeau LA, Starr M, Michaud S, Tran D, St-Louis R, Babarro JMF, Clements JC and Tremblay R (2022) Use of valvometry as an alert tool to signal the presence of toxic algae Alexandrium catenella by Mytilus edulis. Front. Mar. Sci. 9:987872. doi: 10.3389/fmars.2022.987872
Received: 06 July 2022; Accepted: 12 September 2022;
Published: 23 September 2022.
Edited by:
Jose Luis Iriarte, Austral University of Chile, ChileReviewed by:
Yasunari Kiryu, Florida Fish and Wildlife Research Institute, United StatesIgor Bakhmet, Karelian Research Centre, (RAS), Russia
Copyright © 2022 Durier, Nadalini, Comeau, Starr, Michaud, Tran, St-Louis, Babarro, Clements and Tremblay. This is an open-access article distributed under the terms of the Creative Commons Attribution License (CC BY). The use, distribution or reproduction in other forums is permitted, provided the original author(s) and the copyright owner(s) are credited and that the original publication in this journal is cited, in accordance with accepted academic practice. No use, distribution or reproduction is permitted which does not comply with these terms.
*Correspondence: Guillaume Durier, guillaume.durier@uqar.ca