Population genetic structure and mixed stock analysis of the green sea turtle, Chelonia mydas, reveal reproductive isolation in French Polynesia
 Violaine Dolfo
 Cécile Gaspar2
  Jérôme Bourjea
 Serge Planes
- 1Centre de Recherches Insulaires et Observatoire de l'Environnement (CRIOBE) UAR3278, PSL Research University: EPHE – UPVD – CNRS, Perpignan, France
- 2Te Mana O Te Moana Foundation, Moorea, French Polynesia
- 3UMR Marine Biodiversity, Exploitation, and Conservation (MARBEC), Univ. Montpellier, CNRS, Ifremer, IRD, Sète, France
- 4Direction de l’Environnement de la Polynésie Française, Papeete, Tahiti, French Polynesia
- 5Laboratoire d’Excellence « CORAIL », Perpignan, France
The green turtle, Chelonia mydas, is a migratory marine species with a circumglobal distribution in tropical and temperate waters. Its natal homing behavior leads to a complex genetic structure with genetically differentiated populations that breed separately and mix within the same foraging grounds. Delineating the boundaries of these populations and their connectivity to feeding grounds is important for the management of this species, classified as endangered on the IUCN red list. Here, we examined the genetic structure and the origin of the green turtle in French Polynesia with 239 samples collected during nesting or hatchling events and 204 samples collected outside of nesting events, across 21 islands. Amplification of the 770pb mtDNA control region fragment, the standard base used to characterize haplotype diversity in this species, revealed 23 haplotypes including three novel ones, belonging to 6 different lineages. Haplotype diversity in the rookeries was 0.615, and nucleotide diversity was 0.019, values similar to those in the North West Pacific and Western Indian Oceans, two regions recognized as genetic diversity hotspots for C. mydas. The genetic structure between the Leeward and Windward Islands of the Society archipelago was found to be significant with pairwise Fst index and φst distance. Island groups (Windward Islands, Leeward Islands, Tuamotu) were genetically different from all other identified Pacific management units, with a weak differentiation between American Samoa and Leeward Islands. A mixed-stock analysis for the French Polynesian mixture revealed an exclusive contribution from the French Polynesian rookeries, with negligible input from the other Pacific populations. This study provides the first assessment of the genetic structure of green turtle populations within French Polynesia and fills an essential data gap regarding the genetic diversity of the species and its connectivity to other feeding grounds in the Pacific Ocean. The French Polynesian populations appear to be important contributors to the overall genetic diversity of the species, isolated from other Pacific populations, thus making them essential within the Pacific region. These results have important implications for the conservation of the species at both local and regional scales.
1 Introduction
The green turtle, Chelonia mydas, is a migratory marine reptile with a global distribution in both tropical and temperate waters. The species arose about 34 million years ago, and its populations have declined over the past century. The green turtle is now listed as globally Endangered (EN) by the International Union for the Conservation of Nature (Seminoff, 2004). Consumption of meat and eggs and commercial use of its shell are the principal threats to its populations worldwide. Indirect threats such as incidental takes in fisheries, habitat degradation, and pollution also contribute to population decline (Seminoff et al., 2015).
Green turtle post-hatchlings spend the first years of their life in the epipelagic habitat where they are thought to disperse with the currents (Bolten, 2003). After 5 to 10 years (known as the “lost years”, Hughes (1970)) as they become larger, they recruit into neritic habitats that serve as foraging grounds (Bolten, 2003). When juveniles first recruit to foraging grounds in the Pacific Ocean, their curved carapace length (CCL) is between 35-40 cm (Limpus et al., 2005). Next, they may shift through a succession of developmental habitats (Musick and Limpus, 1997; Hamabata et al., 2016) or stay in the same foraging ground upon reaching sexual maturity (Limpus, 2008). Once chosen based on drivers that are currently unknown, they exhibit strong fidelity to foraging grounds (Read et al., 2014). Sexual maturity is reached after about 20 years, at a size of approximately 85 cm CCL (Bjorndal et al., 2013; Phillips et al., 2021). Reproduction may occur near foraging grounds or close to natal beaches, and females then periodically migrate back to their natal rookeries to nest (FitzSimmons et al., 1997; López-Castro et al., 2010; Wyneken et al., 2013). The natal homing behavior of females leads to a complex genetic structure worldwide and has been used to determine a population’s boundaries (i.e. genetic units) based on the differences in the mitochondrial DNA (mtDNA) control region fragment (Bowen and Karl, 2007; Jensen et al., 2013). Associated with other biological and ecological characteristics, populations are grouped for conservation purposes into Regional Management Units (RMUs) at a global scale, which contain populations that are phylogeographically related to each other (Wallace et al., 2010). These RMUs are composed of several distinct Management Units (MUs), which are groups of rookeries that are demographically and genetically independent with little immigration, at least by reproductive females from other rookeries (Dutton et al., 2014a). Delineating the boundaries of MUs and identifying those in need of protection is thus important to adapt management scales to preserve the genetic diversity of the species. It also serves as a reference dataset to determine the natal origin of turtles sampled outside nesting events (Jensen et al., 2013). Several populations usually mix on the foraging grounds where they are exposed to high threats (Bowen et al., 1992; Bjorndal and Bolten, 2008). Identifying the connectivity between MUs and foraging grounds is thus important to better assess the threats to green turtle populations in their different habitats and to improve the conservation and management of the species.
In the Pacific Ocean, efforts to describe MUs and their relative contribution to mixed stocks on foraging grounds have intensified in recent years. For green turtles, 35 distinct MUs have been identified including 29 in the Indo-Pacific (Jensen et al., 2016; Nishizawa et al., 2018), 5 in the Central North and Eastern Pacific (Dutton et al., 2014a; Chaves et al., 2017), and 1 in Japan (Hamabata et al., 2014). The contribution of these MUs to several foraging grounds was studied, including in Australia (Jensen et al., 2016), Malaysia (Nishizawa et al., 2018), New Caledonia (Read et al., 2015), Fiji (Piovano et al., 2019), North and South America (Dutton et al., 2014b; Chaves et al., 2017; Álvarez-Varas et al., 2022), Palmyra Atoll (Naro-Maciel et al., 2014), and Japan (Nishizawa et al., 2013). However, some regions remain largely understudied. To date, French Polynesia, a large complex of islands isolated in the middle of the Pacific Ocean, has been represented in Pacific stock structure and mixed stock analyses by only 9 individuals from a single island, accounting for 2 haplotypes (e.g. Dutton et al., 2014b; Jensen et al., 2016; Piovano et al., 2019). Nonetheless, this limited sampling allowed French Polynesia and the neighboring islands of American Samoa to be considered distinct MUs (Dutton et al., 2014b). French Polynesia is composed of 118 islands distributed over an exclusive economic zone of 5 million sq. km, a surface as wide as Europe. The green turtle population was first estimated at 1000 annually breeding females, although an updated assessment is needed (Groombridge and Luxmoore, 1989; Seminoff et al., 2015). Nesting is known to occur on several islands, mainly Tetiaroa, Mopelia, and Scilly (Balazs et al., 1995; Touron et al., 2018), which are hundreds of kilometers apart, and there have been more recent reports of nesting in other Polynesian islands. A population decline was documented between the 1950s and the 1970s (Maison et al., 2010), and although the species is now protected under the Environment Code of French Polynesia, it still suffers from poaching. The genetic structure and the origin of individuals encountered in water have yet to be assessed for the territory. Boissin et al. (2019) started filling this huge data gap by analyzing the mtDNA control region of 97 individuals from 4 islands, but their sampling was too limited for an accurate description of genetic structure.
In this study, we describe the genetic structure and diversity of green turtles in French Polynesia based on 443 samples collected throughout the territory. We investigate the structure between French Polynesia and the other MUs in the Pacific Ocean and analyse their contribution to the French Polynesian mixture of in-water sampled individuals. This constitutes the most complete genetic assessment of green turtles in French Polynesia to date and provides an important contribution to our understanding of its genetic structure and its connection at the scale of the Pacific Ocean.
2 Material and methods
2.1 Study area and data collection
Skin and muscle tissues were collected from Chelonia mydas specimens across 21 islands and atolls of French Polynesia between 2005 and 2021 (Figure 1). Tissues were sampled from nesting females and hatchlings (known maternal origin), as well as free-swimming turtles, and from individuals seized from poaching (origin to be determined). In total, 443 specimens including 136 adults, 103 hatchlings, 85 juveniles, and 119 of unknown maturity stage were used for this study. Animals were classified as “adults” when their curved carapace length was larger than 85cm (Bjorndal et al., 2013; Phillips et al., 2021), “hatchlings” when sampled from nests, “juveniles” otherwise, and “unknown” when no information about the size was available. Juvenile size ranged from 7.8 to 78 cm, and adult size ranged from 85 to 115 cm. Samples collected and processed by Boissin et al. (2019) are included in this study (n=97). For structure and mixed stock analyses, the samples were divided into two datasets. The first included only individuals from known origin, i.e. nesting females and hatchlings (n=239). Nesting females were assumed to have originated from the island where they were sampled (Bowen and Karl, 2007). This dataset is referred to as the baseline population. As offspring share the same mtDNA as their mother, and to avoid double counting, the DNA from only one hatchling per identified nest was considered and sequenced, unless the mother was identified (in which case only her DNA was sequenced). When hatchlings were from different nests with the same identified mother, only the mother was sequenced. When two hatchlings were sampled on the same date and location with no nest information reported, they were considered potential siblings, and only one was kept in the dataset. We recognize that hatchlings from different dates may still be siblings, as turtles can nest several times in one season. Although, the probability of such an occurrence is low in our dataset due to the limited sampling size in most of the islands (Table 1). On Tetiaroa and Mopelia, islands with the largest sample, most often females were sampled. On these islands, nesting females were marked with flipper tags on the first encounter to avoid resampling within and across seasons. The second dataset included juveniles and individuals of unknown maturity stages (n=204). This dataset is referred to as the mixture. These individuals were occasionally found in the lagoons and barrier reefs around 21 islands across the Society and Tuamotu archipelagos and were sometimes injured or poached. Individuals from unknown maturity stages were mostly found on islands with little recorded nesting activity. However, few of them may correspond to breeding adults. For this reason, the origin of the mixture was determined both with and without individuals from unknown maturity stages.
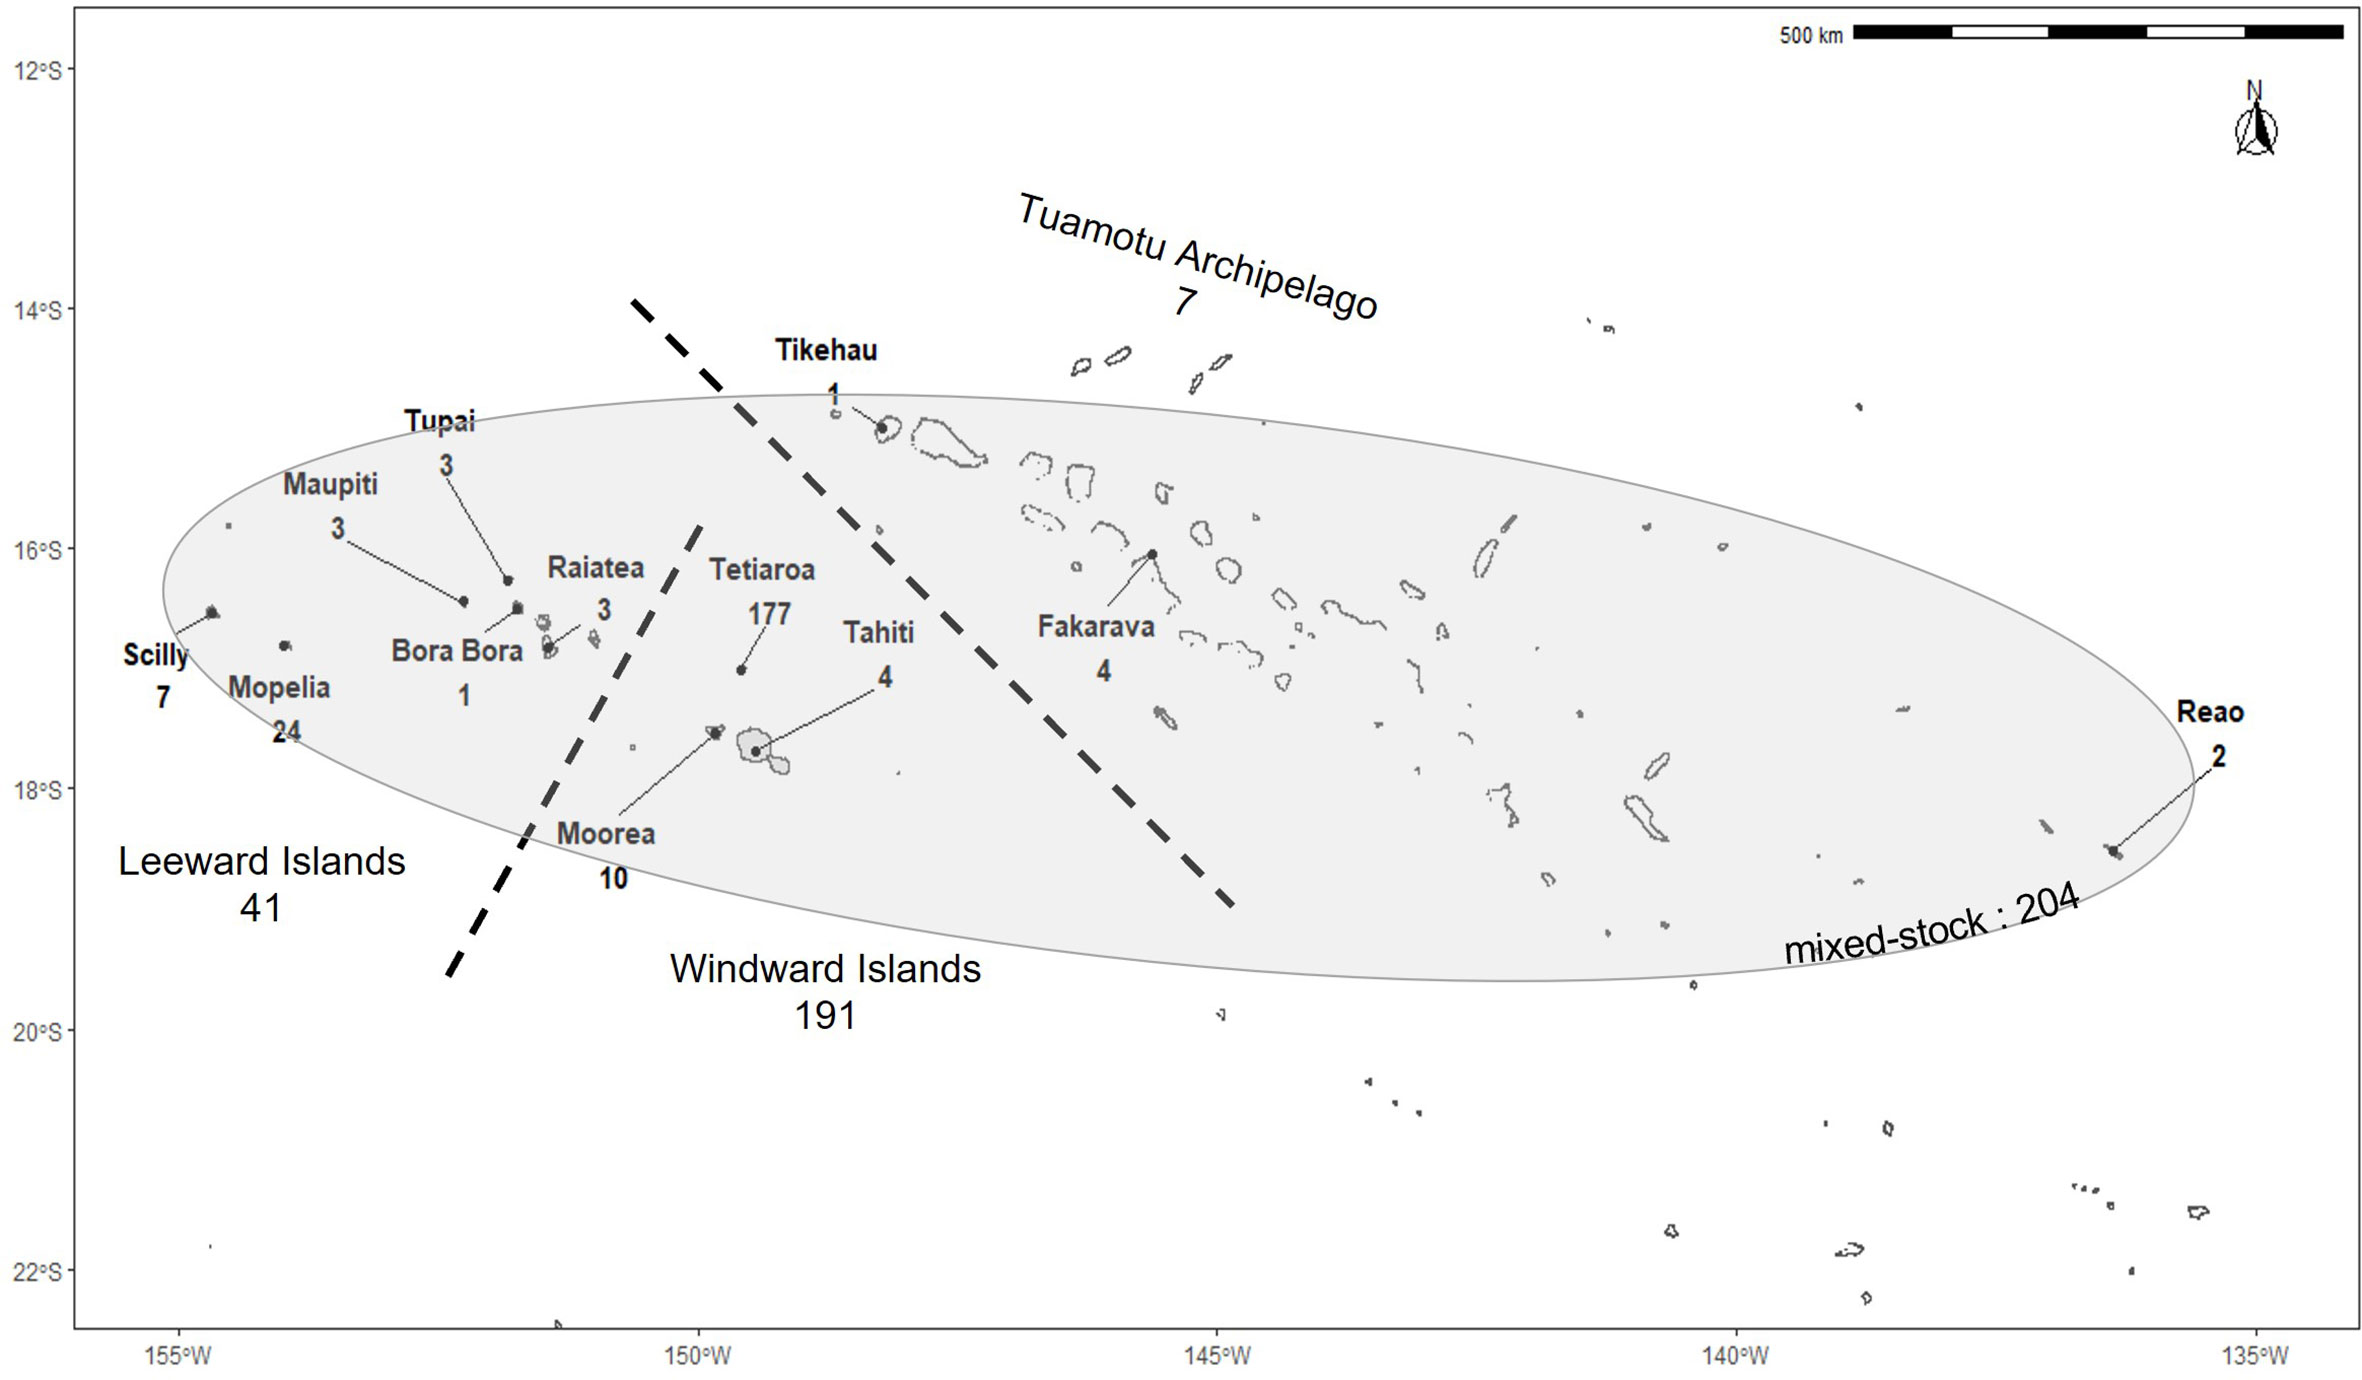
Figure 1 Sampling locations of green turtles in French Polynesia. Numbers indicate the number of samples from each island. Dashed lines separate the three main island groups. The shaded area represents the extent of the mixture sampling locations.
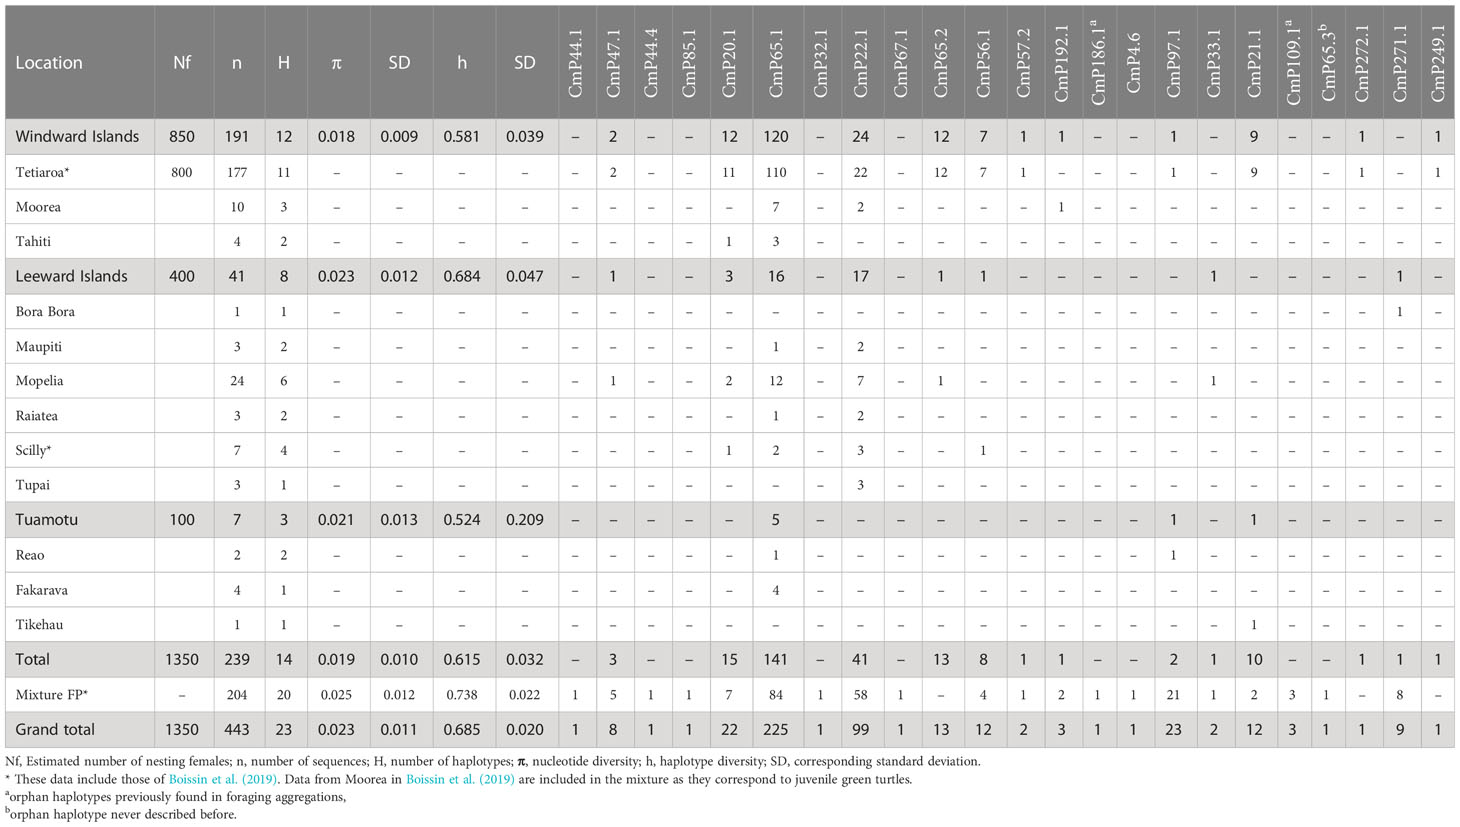
Table 1 Genetic diversity parameters and haplotype frequencies for green turtle rookeries and mixture of French Polynesia (FP).
2.2 Molecular analyses
Total genomic DNA was extracted using the QIAamp 96 DNA QIAcube HT kit and the QIAcube HT DNA extraction robot (QIAGEN GmbH, Hilden, Germany) following the manufacturer’s protocol. The first step was modified as follows: 1 mm2 of tissue was digested in 200 µL of digestion buffer with 20% Proteinase K (QIAGEN) and left at 56°C overnight. DNA samples were amplified by PCR on an 800bp fragment of the mitochondrial DNA (mtDNA) control region using the primer pair LCM15382 (5’-GCTTAACCCTAAAGCATTGG-3’) and H950 (5’-GTCTCGGATTTAGGGGTTT-3’) (Abreu-Grobois et al., 2006). The PCR reaction was performed in a final volume of 29µL containing 2.5µL of Buffer 10X, 1.25µL of MgCl2 (25mM), and 0.5µL of Taq polymerase (5U/µL) from the Taq PCR Core Kit (QIAGEN), 3µL of dNTP mix (100mM), 0.4µL of each primer (10µM), 17.3µL of ultrapure water (SIGMA), and 4µL of template DNA (10-30µM). The PCR parameters included an initial denaturing step at 94°C for 5 min and then 35 cycles at 94°C for 45 s, 52°C for 45 s, 72°C for 45 s and then a final extension step at 72°C for 5 min. PCR amplicons were sequenced using the external service provider GenoScreen (Lille, France). Sequences were aligned using the ClusterW algorithm implemented in MEGA v7.0 (Kumar et al., 2016). Haplotypes were identified using BLAST against the GenBank database (https://blast.ncbi.nlm.nih.gov/Blast.cgi).
2.3 Genetic diversity and spatial genetic structure within French Polynesia
Haplotype frequency, haplotype and nucleotide diversities were calculated using Arlequin v3.5.2.2 (Excoffier and Lischer, 2010). To investigate spatial genetic structure in French Polynesia, conventional haplotype-based fixation index Fst and φst distances based on pairwise difference distance matrix were calculated between the three most sampled islands (Tetiaroa, n=177; Mopelia, n=24; Moorea, n=13). To extend the analytical power, the sequences from the other islands were then included in Fst and φst calculations. The sequences were grouped into the three main island groups belonging to 2 different archipelagos separated by more than 200km (Windward Islands, n= 191; Leeward Islands, n=41, in the Society Archipelago; Tuamotu Archipelago, n=7). The calculations were performed on the baseline dataset using Arlequin v3.5.2.2 with 1000 permutations. To decrease the genetic variance due to the difference in sampling size between Tetiaroa and the other islands, 3 random sub-samplings of Tetiaroa were created and Fst and φst were also calculated between these, Mopelia, and Moorea. Bonferroni correction for multiple tests was applied on p_values.
2.4 Mixed stock analysis (MSA)
To determine the origin of the French Polynesian mixture, all of the management units (MUs) from the Pacific Ocean were considered, and their haplotype frequencies were retrieved from Chaves et al. (2017), Dutton et al (Dutton et al., 2014a; Dutton et al., 2014b; Dutton et al., 2018), Hamabata et al. (2014); Jensen et al. (2016); Nishizawa et al. (2018) (Figure 2; Supplementary Material S1). In French Polynesia, two scenarios were explored. First, based on the genetic structure revealed in this study, 3 source populations with one in each main island group were considered (Leeward Islands, Windward Islands, and Tuamotu). Next, as Tetiaroa was the largest and most sampled source rookery in French Polynesia, 2 source populations, one in Tetiaroa and one which included the rest of the islands, were investigated to explore the relative contribution of Tetiaroa and the other islands to the mixture. Fst was calculated between the source populations of French Polynesia and the MUs in the rest of the Pacific Ocean to ensure that the genetic structure is significant and to avoid any bias in the MSA. The R package rubias (Moran and Anderson, 2019) was used to perform the MSA. First, simulations were run to evaluate the accuracy of mixing proportion estimates for the mixture. For each baseline scenario, several sets of 40 simulations with 200 individuals in the mixture were performed with the leave-one-out cross-validation method, which improves accuracy estimates (Anderson et al., 2008). The method draws 200 individuals from the baseline to constitute a mixture in which the contribution of each MU is known. These contributions are then calculated with Conditional Bayesian MSA based on the haplotype frequency of each MU. Known contributions were plotted against calculated contributions to assess the accuracy of MSA calculations. Each set of simulations was run with a different prior parameter that assigned different weights to the MUs from which the 200 individuals were sampled according to i) MU size (i.e. estimated number of nesters), ii) MU distance from the mixture, and iii) both the size and the distance. The size prior was defined to be ps = s/smax, with s being the size of the MU and smax the size of the largest MU of the dataset. Population sizes were those defined in Balazs et al. (2015) (Hawaii), Seminoff et al. (2015) (East Pacific MUs), and Hamabata et al. (2014) (Japan), and those used in Jensen et al. (2016) and Nishizawa et al. (2018) for the other rookeries. In French Polynesia, a population size of 1350 breeding females over the sampling period was adopted based on estimates provided in the available literature, and distributed as follows: 850 individuals in the Windward Islands including 800 in Tetiaroa, 400 in the Leeward Islands, and 100 in the Tuamotu archipelago (Craig et al., 2004; Seminoff et al., 2015; Touron et al., 2018; Laloë et al., 2020). The Windward Islands are thought to host the majority of French Polynesia’s nesters. The distance prior was set as pd = dmax/d, with d as the MU distance to the mixture and dmax as the distance of the furthest MU to the mixture. The southernmost tip of Fakarava atoll was arbitrarily considered as the center of the mixture and distances to the centers of source populations and MUs were calculated from that point. The last prior was a combination of these two, psd = ps x pd, and one set was run without prior (i.e. equal weight was assigned to all MUs). Conditional Bayesian MSA was then performed on the real mixture with these different priors. First, it was performed on juveniles only (n=85), then on the total mixture (n=204). For each prior, five Markov chain Monte Carlo (MCMC) chains of 150’000 iterations and burn-in of 50’000 were run starting at different values of proportions such that 90% of the mixture came from either a Polynesian source population or the American Samoan MU, and the remaining 10% was equally distributed among the other MUs. Chain convergence was tested with the Gelman-Rubin diagnostic implemented in the diag function of the R package coda (Plummer et al., 2006). All of the values were below 1.2, which indicates convergence to a single posterior distribution (Gelman and Rubin, 1992).
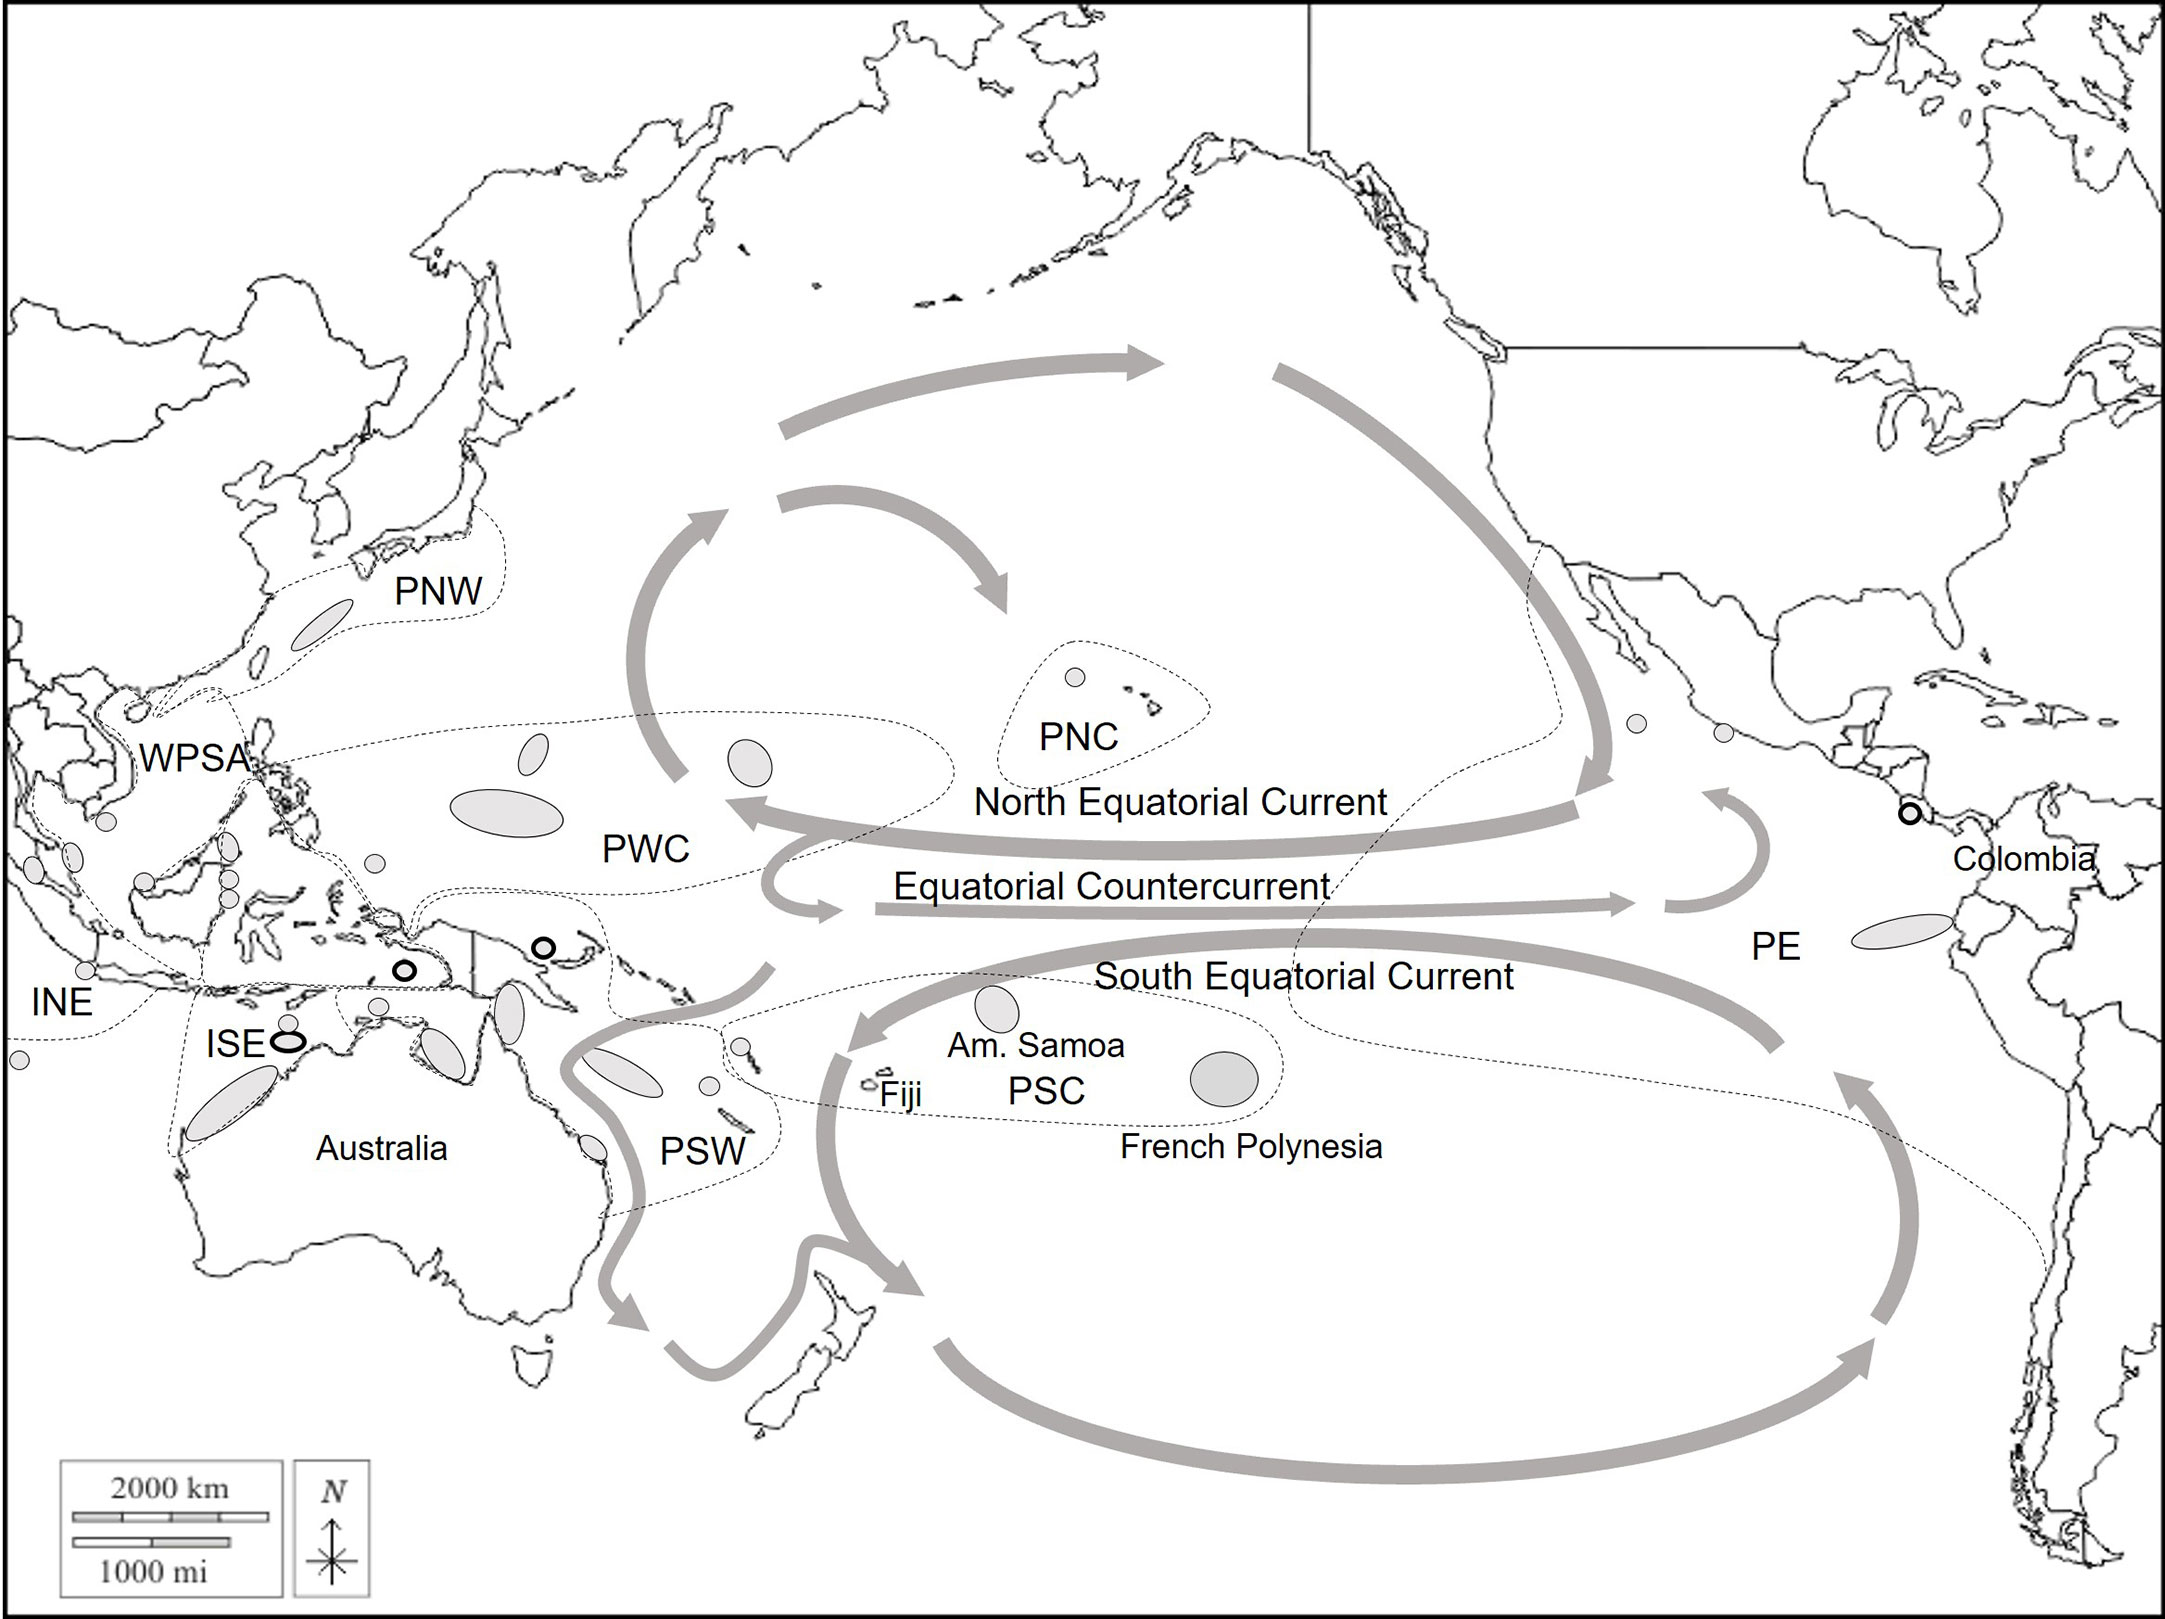
Figure 2 Regional map of the green turtle management units in the Pacific Ocean. Grey areas represent the management units used for the baseline of the mixed-stock analysis. The main current flows are represented with grey arrows. Dashed lines represent the regional management units (RMU) (Wallace et al., 2010). INE, Indian Northeast; ISE, Indian Southeast; WPSA, West Pacific South Asia; PNW, Pacific Northwest; PWC, Pacific West Central; PSW, Pacific Southwest; PNC, Pacific North Central; PSC, Pacific South Central; PE, Pacific East.
3 Results
3.1 Haplotype diversity in French Polynesia
A total of 23 haplotypes were identified with the 770pb mtDNA control region fragment from 443 green turtle individuals (Table 1). In the nesting population (baseline population), 14 haplotypes were identified from 239 samples. In the mixture, 204 samples corresponded to 20 haplotypes. In both groups, CmP65.1 was the most abundant haplotype, representing 58.9% of all sequences in the baseline population and 41.1% in the mixture. The second haplotype, CmP22.1, represented 17.1% and 28.4% of all sequences in the baseline population and mixture respectively. CmP97.1 counted for 10.3% of the sequences in the mixture and only 0.8% in the baseline population. CmP65.1 was previously found at low frequency in the Marshall Islands and American Samoa rookeries, CmP65.1 belongs to clade VI (Supplementary Figure 1), which is mostly restricted to the Central South Pacific (Jensen et al., 2019). Haplotypes CmP56.1, CmP85.1, and CmP65.2 also belong to clade VI, which represented 59% of our total sample. CmP22.1 was dominant in American Samoa, moderate in the Marshall Islands, and found at low frequency in Micronesia (Jensen et al., 2016). This haplotype belongs to clade III, which represented an additional 31% of our total sample. CmP97.1 was an orphan haplotype (never linked with any rookery) (Naro-Maciel et al., 2014; Chaves et al., 2017; Álvarez-Varas et al., 2022). The other 20 haplotypes each accounted for less than 5% of the sequences in both the baseline and the mixture populations. Three haplotypes, CmP65.3, CmP271.1, and CmP272.1 are described here for the first time (GenBank accession numbers: OQ683229-OQ683231). All of the haplotypes were closely related to CmP65.1 (Supplementary Figure 1). CmP271.1 is characterized by a 4bp indel and was found in 9 individuals, and CmP65.3 and CmP272.1 are characterized by one transition and were found in one individual.
Haplotype diversity was moderate (h = 0.615) and nucleotide diversity was high (pi = 0.019) in the nesting populations indicating the abundance of genetically distinct haplotypes (Table 1). Haplotype and nucleotide diversity were lower in the Windward Islands than in the two other groups, and the mixture had a higher haplotype and nucleotide diversity than the rookeries (h = 0.7383, pi = 0.0248). The mixture also had a higher number of haplotypes, 9 of which were not found in the rookeries. Eight were found on a single individual, and one was found on 3 individuals, indicating the presence of rare haplotypes in French Polynesia. Among these, CmP44.1, CmP44.4, and CmP85.1 are abundant in the northern Great Barrier Reef and western New Caledonia rookeries (Jensen et al., 2016), CmP32.1 and CmP67.1 have so far been found exclusively in the Marshall Islands and Micronesia rookeries (Jensen et al., 2016), and CmP4.6 is from the Central and Eastern Pacific lineage and found in Eastern Pacific rookeries (Dutton et al., 2014a; Chaves et al., 2017). Three haplotypes were orphan (i.e. never found in any rookery): CmP65.3 is described here for the first time, CmP186.1 was previously found in low frequency in Australian foraging grounds (Jensen et al., 2016), and CmP109.1 was found on 1 individual in Palmyra Atoll (Naro-Maciel et al., 2014) and 1 individual in the Easter Island foraging aggregation (Álvarez-Varas et al., 2022).
3.2 Spatial genetic structure within French Polynesia
Genetic differentiation indices Fst and φst were first calculated between the islands of Tetiaroa, Moorea, and Mopelia, as these sites included enough samples to conduct the analysis (n > 10). Fst and φst were low and not significant after Bonferroni correction for multiple tests (Table 2) (φst was significant between Mopelia and Tetiaroa before the correction). When using random sub-sampling on Tetiaroa, Fst and φst were again non-significant between the islands (Table 2). The other islands were then included (n < 10 for each island), and pooled together according to the main island groups. Both Fst and φst were significant between the Leeward Islands and Windward islands indicating a genetic differentiation between the two island groups of the Society archipelago (Fst = 0.097 and φst = 0.141, p_value < 0.001). No significant differentiation was found with the Tuamotu archipelago, which had a low number of samples (n=7) (Table 2). Thus, at least two genetically distinct populations are present in French Polynesia, one nesting in the Leeward Islands and one nesting in the Windward Islands of the Society archipelago. The small sample size in the Tuamotu archipelago did not allow for the detection of a distinct population in this archipelago.
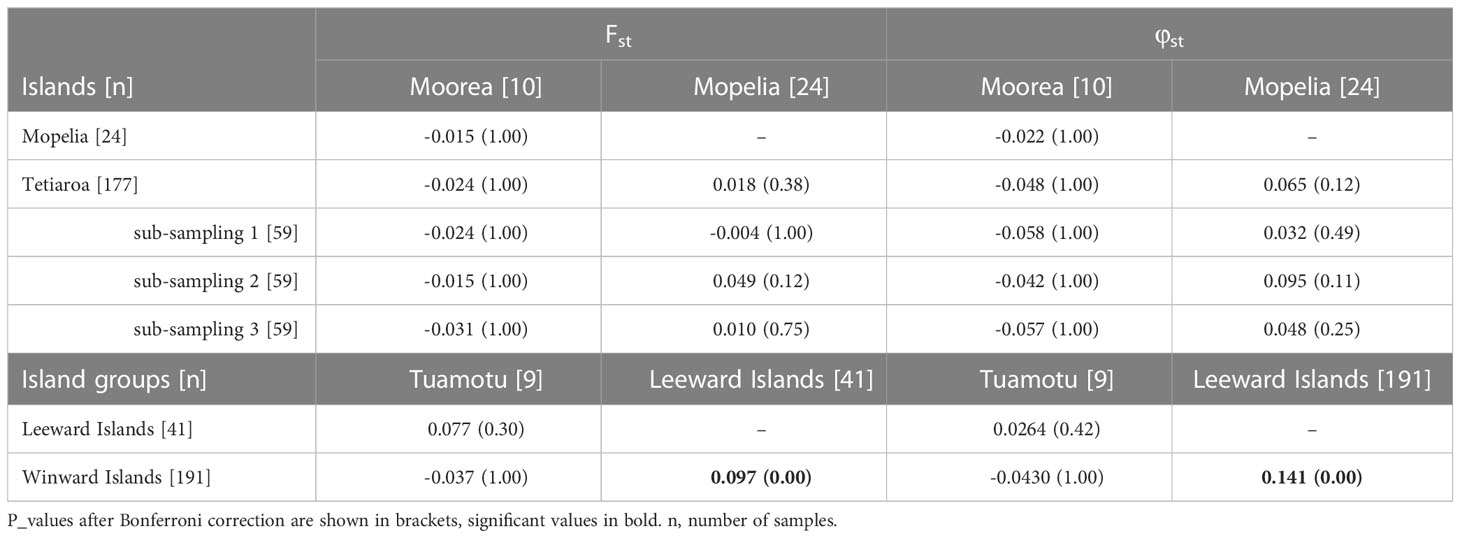
Table 2 Fst and φst among the three most sampled islands Tetiaroa, Mopelia, Moorea, and among the three main island groups Leeward Islands, Windward Islands, and Tuamotu.
3.3 Mixed-stock analysis
As significant genetic differentiation was observed between island groups in French Polynesia, MSA was first run considering 3 source populations for the following areas: Leeward Islands, Windward Islands, and Tuamotu. Although Tuamotu was not significantly different from the other French Polynesian source populations, it was kept as a separate source population considering its geographical distance and geological differences. The Leeward Islands and American Samoa had a low genetic difference at the significance threshold limit (Fst = 0.063, p_value = 0.064, Table 3), and were also kept as different source populations. The Leeward Islands, the Windward Islands, and the Tuamotu archipelago were genetically different from all of the other Pacific management units (MUs), with most of the p_values lower than 0.001, indicating strong significance (Table 3).
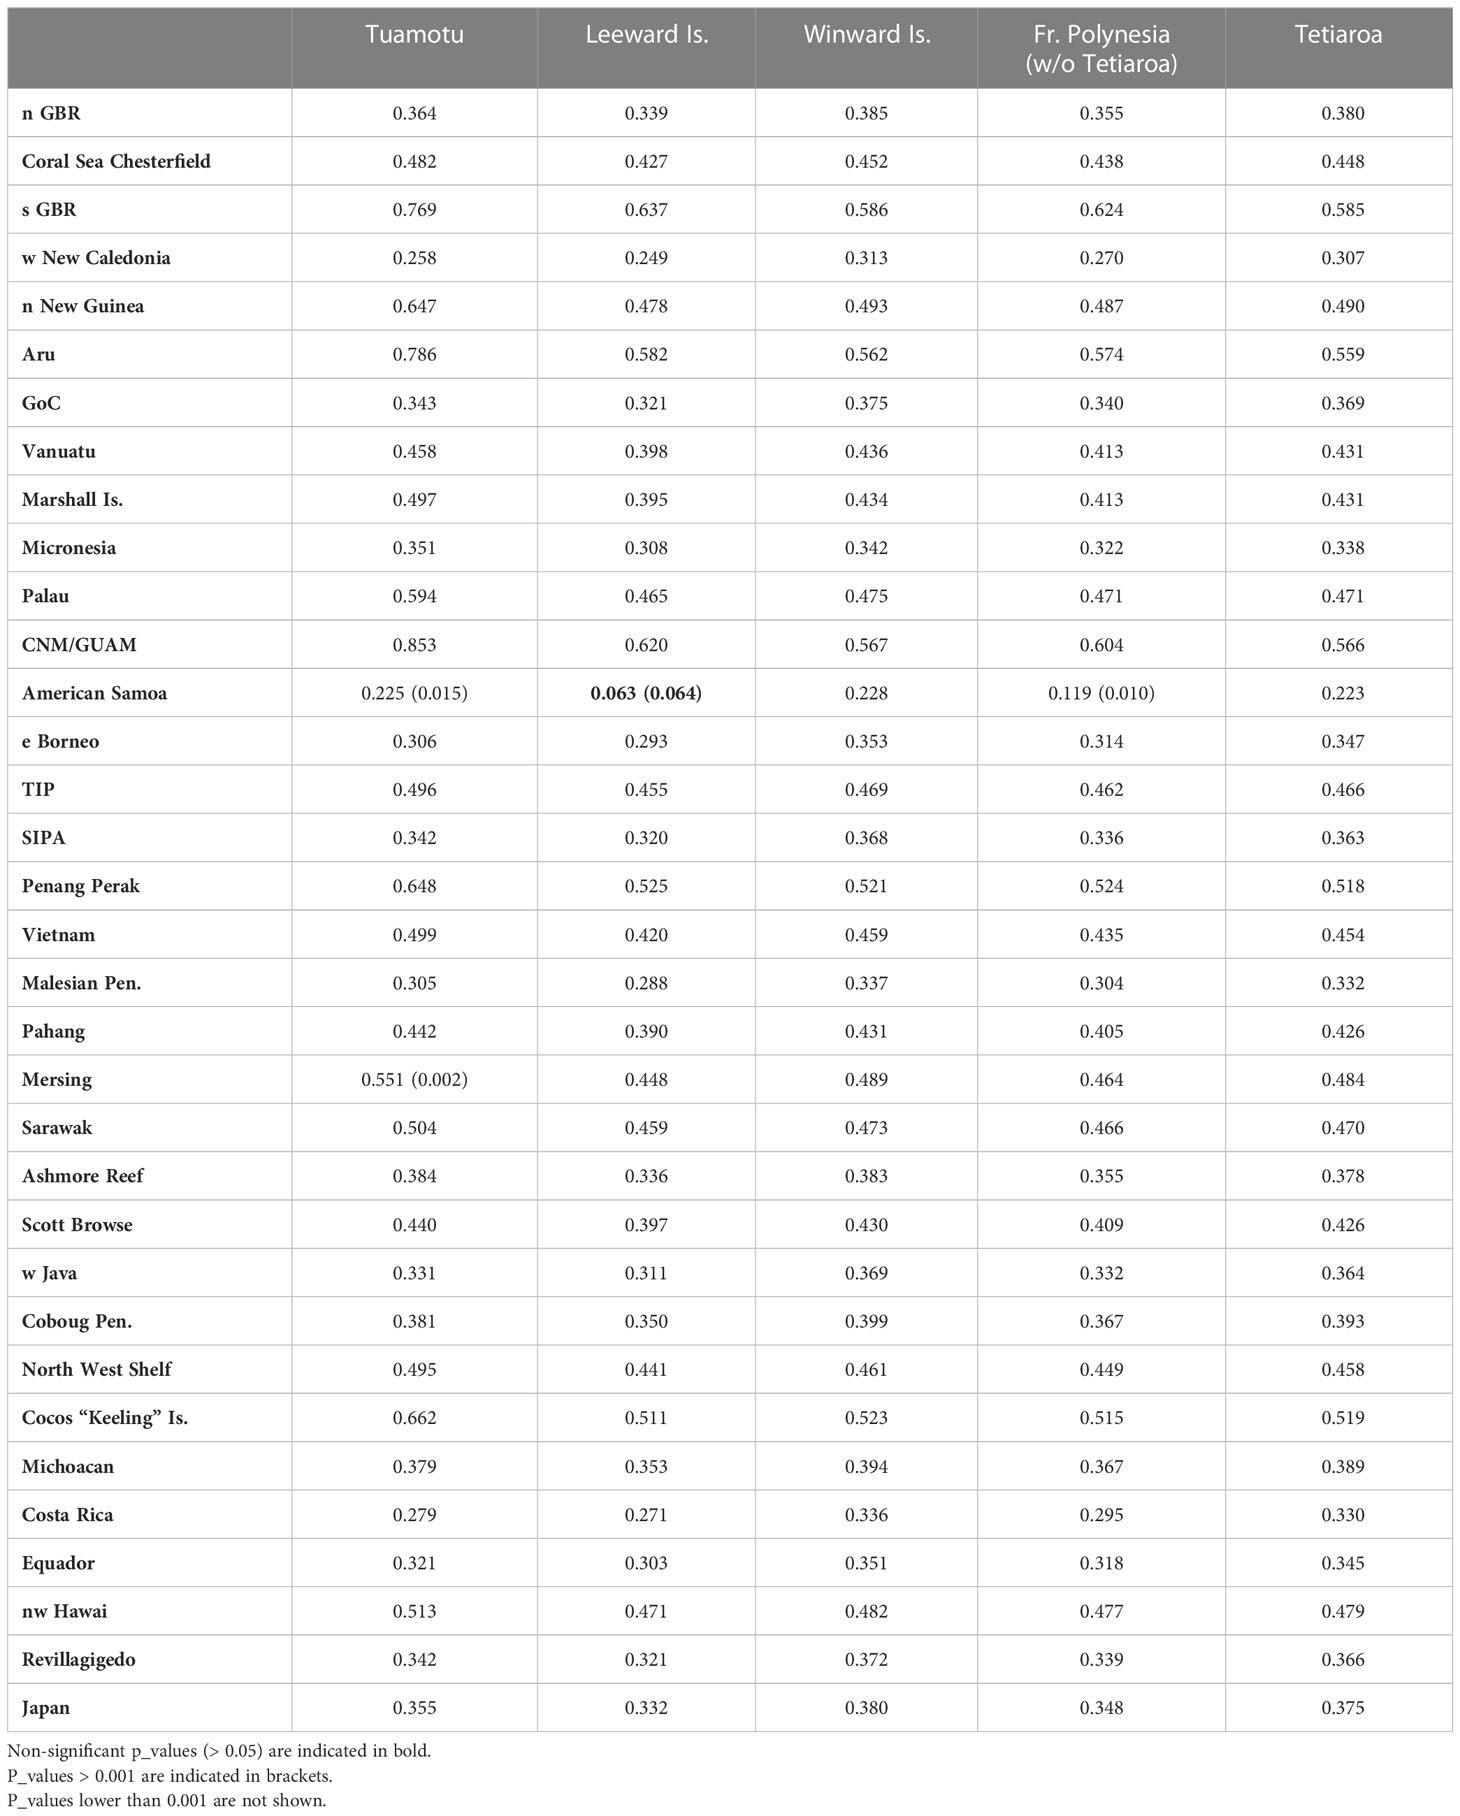
Table 3 Fst values between the French Polynesian source populations and the other management units in the Pacific Ocean.
Furthermore, the simulations showed that regardless of which prior was used, the contributions of the Tuamotu and Leeward Islands to the French Polynesian mixture were underestimated, likely due to limited sampling (Figure 3A, Supplementary Material S2). The contribution from the Windward Islands was more accurately estimated with the population size prior and the combined prior (size x distance), and overestimated with the distance and flat priors. The results of the MSA showed that only French Polynesian source populations contributed significantly to the mixture in French Polynesia. Overall, the contribution of the Windward Islands ranged from 90.8% to 93.5% (confidence interval from 82.0% to 99.1%) with flat, population, size, and combined priors (Figure 4A). All of the other contributions were negligible, with a confidence interval including 0% (See Supplementary Material S3 for details). The distance prior was the only prior to detect a significant contribution of the Tuamotu (15.5%, conf. int. 11.0% to 20.7%) and the Leeward Islands (13.5%, conf. int. 8.2% to 19.7%), in addition to the Windward Islands (39.6%, conf. int. 32.0% to 47.2%). Mixtures that included juveniles only (Supplementary Material S3) or juveniles and individuals from an unknown maturity stage (Figure 4A) showed similar results.
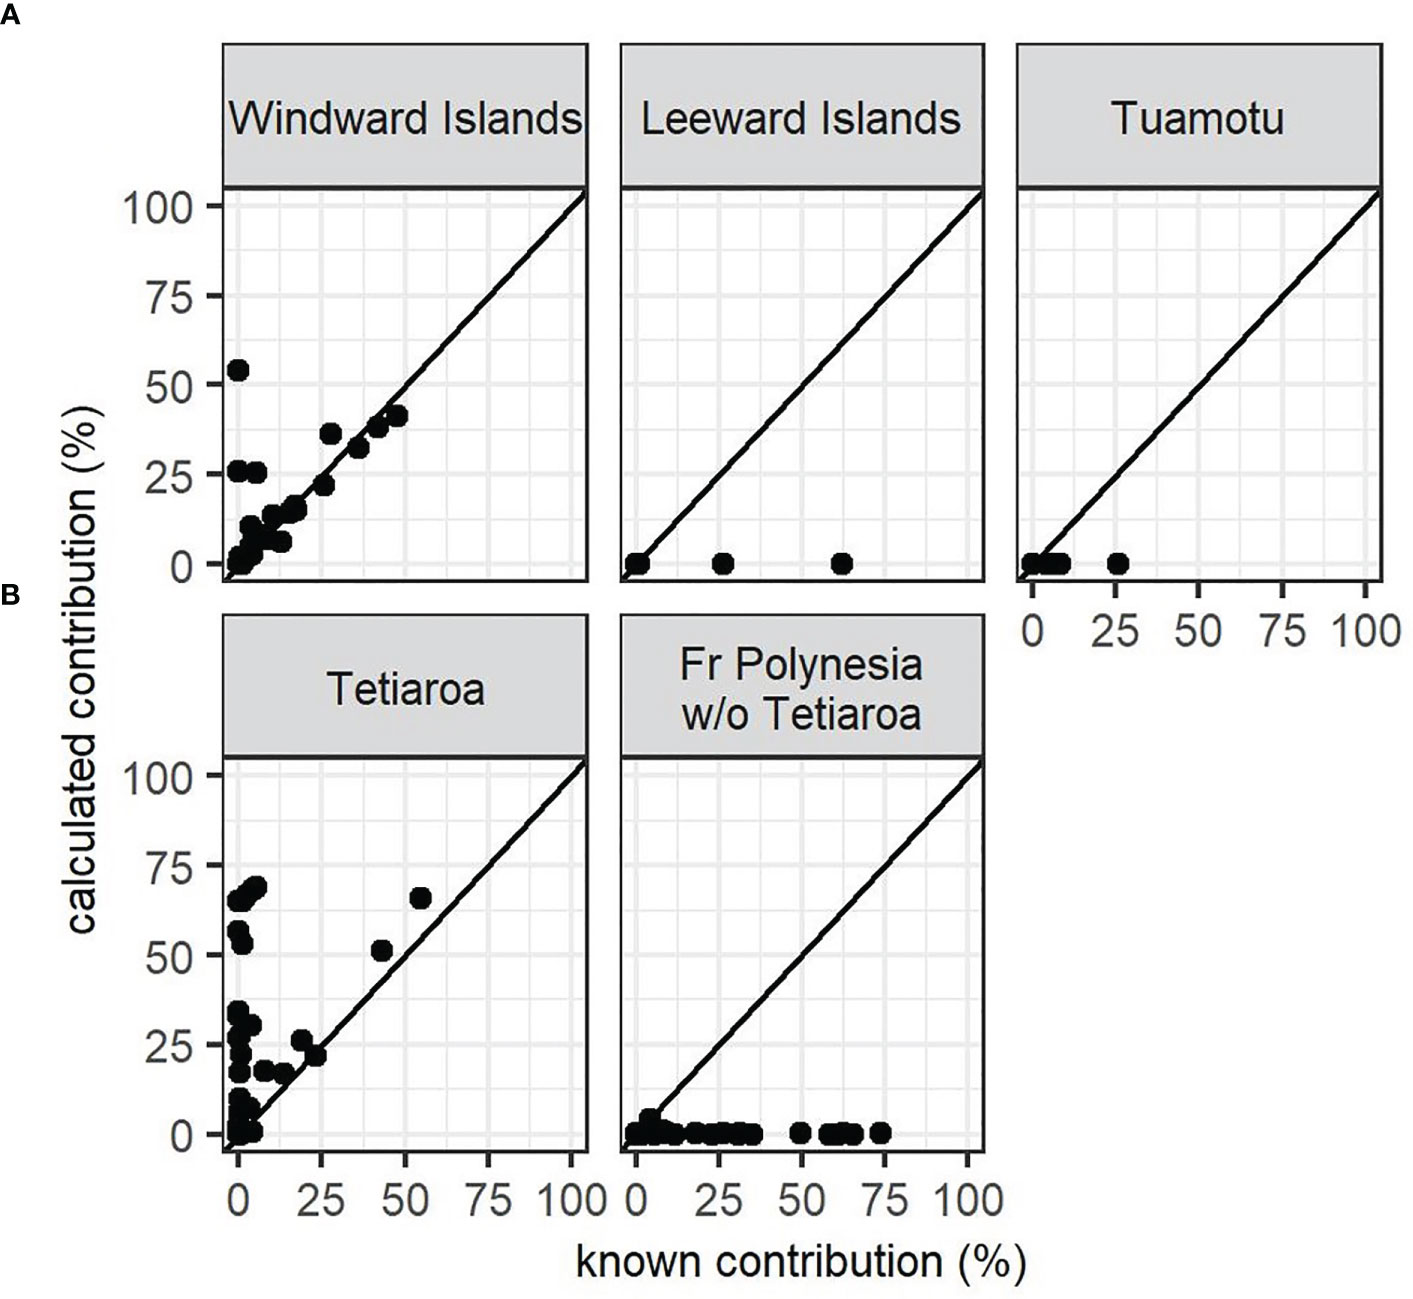
Figure 3 Simulations from the MSA baseline accuracy assessment with the size and distance combined prior for the French Polynesian source populations, representing known versus calculated contribution on 40 simulations. (A) scenario 1 with three source populations in French Polynesia, (B) scenario 2 with two source populations in French Polynesia. All the simulations are available in Supplementary Figure 2.
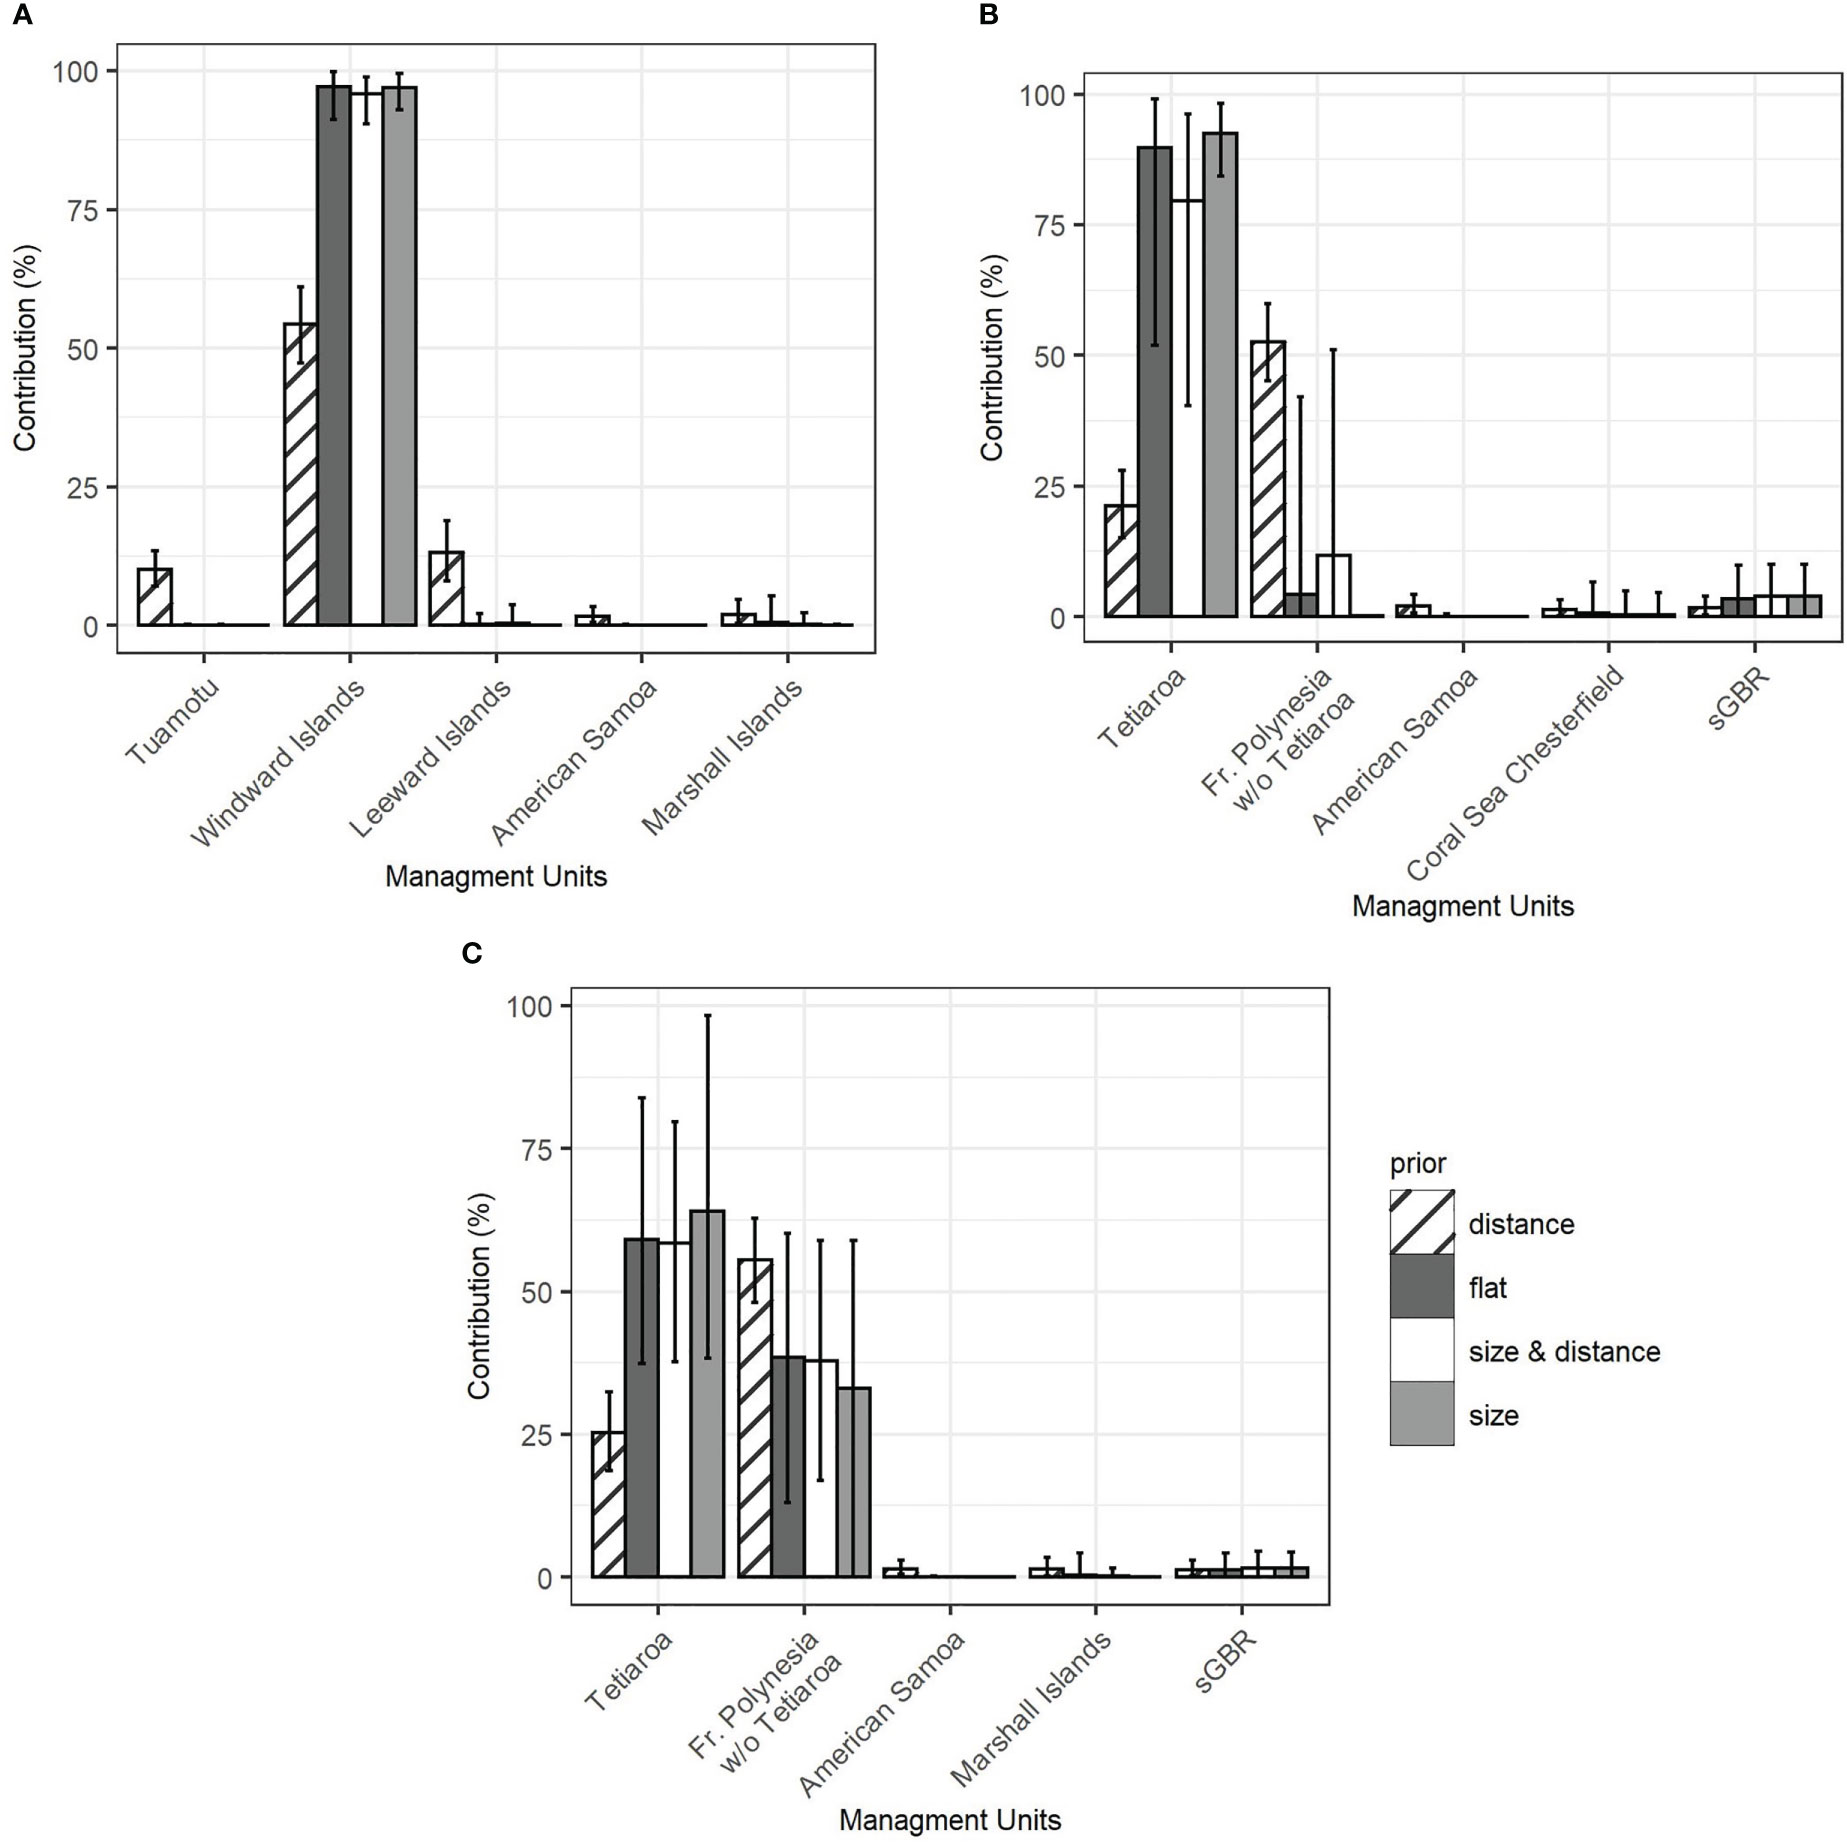
Figure 4 Contribution of the 5 most contributing MUs in the Pacific Ocean to the mixture of green turtles of French Polynesia calculated with the mixed-stock analysis using different priors. (A) scenario 1 with three source populations in French Polynesia (Windward Islands, Leeward Island, Tuamotu) on the total mixture. (B) scenario 2 with two source populations in French Polynesia (Tetiaroa, FP other islands) on juveniles only. (C) scenario 2 on the total mixture (juveniles and individuals of unknown maturity stage).
The role of Tetiaroa in this dominance by the Windward Islands was further explored. Tetiaroa was found to be genetically different from all other Pacific MUs, as was the group formed by the other Polynesian islands (Table 3). Although simulations indicated an overestimation for Tetiaroa with respect to the distance and flat priors, and an underestimation of other Polynesian islands for all priors (Figure 3B, Supplementary Material S2), a contribution from these islands was detected. Their contribution was smaller on the mixture with juveniles only (Figure 4B) than on juveniles and unknown individuals (Figure 4C). It ranged from 33.1% to 55.5% (C.I. 0% to 62.8%) depending on the prior, with the distance prior providing the greatest contribution from these islands, and the size prior providing the least. The contribution of Tetiaroa ranged from 21.3% to 64.1% (C.I. 15.2% to 98.3%), with the distance prior providing the lowest contribution, and the size prior the highest. The percentages from all of the other MUs from the Pacific Ocean were once again negligible, confirming the exclusive contribution of Polynesian Islands to the French Polynesian mixture (See Supplementary Material S3 for details).
4 Discussion
From the 443 specimens analysed, a total of 23 haplotypes were recovered in French Polynesia. This constitutes the first comprehensive structural assessment of green turtle populations on this vast and isolated Central South Pacific Ocean territory and broadens our understanding of population connectivity at the Pacific scale. We found that nesting turtles are structured in at least two genetically different populations, which are i) isolated from the other Pacific MUs, and ii) the only contributors to the mixture of juveniles sampled on the territory.
4.1 Haplotype diversity in French Polynesia
With 23 haplotypes found in the territory, this study fills an important gap in the knowledge about green turtle genetic diversity in the Pacific Ocean. Previously, only 2 haplotypes retrieved from 9 individuals in Mopelia atoll were described (Dutton et al., 2014a) and used in genetic structure and mixed stock analysis studies at the Pacific Ocean scale (ex. Read et al., 2015; Jensen et al., 2016; Piovano et al., 2019). Boissin et al. (2019) found a total of 9 haplotypes in 97 sequences (included here), and the present study builds on previous efforts with 346 new sequences, and 14 additional haplotypes. Thanks to coordinated efforts on several islands spread across a vast area, many of which are remote and not easily accessible, this constitutes the largest sampling effort in French Polynesia so far, making it one of the most comprehensively sampled locations in the Pacific Ocean. Unsurprisingly, and because of a significant increase in the number of samples analysed, the haplotype and nucleotide diversity are also higher than previously reported in Dutton et al. (2014a) (π=0.0003). With a haplotype diversity of 0.615 and a nucleotide diversity of 0.019 in the rookeries, French Polynesia demonstrates similar levels of diversity to that of the North West Pacific and Western Indian Ocean MUs, two areas identified as nucleotide diversity hotspots (Jensen et al., 2019). This work also confirms the dominance of haplotypes CmP65.1 and CmP22.1 on the territory, belonging to the clades VI and III respectively. This aligns with the conclusion made by Boissin et al. (2019) that considered French Polynesia as the center of the range for the lineage VI and one of the genetic diversity hotspots for C. mydas, suggesting a potential past glacial refuge for the green turtle in French Polynesia. The three new haplotypes were all closely related to the dominant haplotype CmP65.1 and belong to clade VI (Supplementary Figure 1). As they were found at low frequency and are derivatives of the dominant haplotype, they may indicate the presence of either newly appearing lineages deriving from CmP65.1 or ancient and declining lineages in the populations. They may also be present in the populations at a higher frequency, which would indicate that populations dominated by CmP65.1 were under-sampled.
4.2 Spatial genetic structure in French Polynesia and the Pacific Ocean
Within French Polynesia, no clear genetic structure between the most sampled islands, Tetiaroa and Mopelia, appeared after Bonferroni correction (Table 2). These two islands are 460km apart, and genetic differentiation among sites 500km apart was previously detected in the Pacific (Dutton et al., 2014a) and Indian Oceans (Bourjea et al., 2007). When nearby islands are included in the analysis, a genetic difference between the two island groups, Leeward Islands and Winward Islands, is detected. This indicates the presence of at least two genetic groups in French Polynesia and constitutes the first description of spatial genetic structure within French Polynesia. Additionally, French Polynesian source populations were genetically different from the other Pacific MUs which indicates some degree of reproductive isolation. This emphasizes the uniqueness of French Polynesian populations in terms of genetic diversity. While the genetic difference between the Leeward Islands and American Samoa was very weak and at the limit of significance (p-value = 0.064), Dutton et al. (2014b) found a significant difference between rookeries in American Samoa and Mopelia. This structure should be investigated with additional samples from American Samoa (currently 17 sequences).
Despite this unprecedented sampling effort in French Polynesia, the present genetic assessment suffers from bias. The majority of the samples (74%) comes from one island, Tetiaroa, while the other 26% are distributed among 11 islands. This sampling bias may hinder the detection of the complete genetic structure on the territory. The natal homing spatial scale is variable among locations, and islands as close as 60km from one another have shown genetic structuring such as in the Yaeyama Islands of Japan (Nishizawa et al., 2011). French Polynesia is characterized by more than one hundred islands distributed across 2000km, and a more even sampling effort would allow for the detection of a finer genetic structure. In particular, all of the islands in the Tuamotu, grouped into one population, accounted for only 7 sequences and thus could not reveal any structure, neither within the archipelago nor with the other island groups, Leeward Islands and Windward Islands. With respect to the size of the archipelago (approx. 1300km) and its distance from the other island groups (200 to 2000km), we cannot exclude the possibility that a structure exists and would be detected with more samples from the Tuamotu islands. For this reason, it was conservatively kept as a distinct population in MSA analyses, but this should be confirmed with further sampling. However, fewer females are expected to nest in this archipelago, which could make sampling even more challenging (Seminoff et al., 2015). Fine-scale structure assessment among rookeries that share haplotypes presents significant challenges globally, and precision can be gained with more variable markers. Particularly, the green turtle mitochondrial repeats described by Tikochinski et al. (2012) have proven invaluable for identifying fine-scale structures in the Atlantic (70-150km) (Shamblin et al., 2015; Shamblin et al., 2020) and Mediterranean (Bradshaw et al., 2018; Tikochinski et al., 2018), where the 770pb control region fragment failed to detect any structure. Using this marker to tease out the structure between the archipelagos within French Polynesia should be considered in further analyses and may also require less sampling effort.
4.3 MSA and connectivity with other foraging grounds
The results of the MSA showed an exclusive contribution of French Polynesian source populations to the French Polynesian mixture. This suggests that all juveniles in French Polynesia may come from local rookeries. Significant contributions from the Leeward islands and the Tuamotu archipelago were found only when using the distance prior. These populations have a small number of breeders and are close to the center of the mixture. Thus, the distance prior gives greater relative weight to these populations compared to the size prior, which may explain the significant contribution. With all priors, the Windward Islands are the principal contributors, and Tetiaroa, which is by far the most sampled rookery, contributes significantly but not exclusively to the mixture. The contribution of other islands was slightly higher when including individuals from unknown maturity stages. Some of them might correspond to adults poached on nesting beaches, however the difference was small when looking at the confidence intervals. This result provides critical information with respect to early life history traits of the green turtle in French Polynesia. Post-hatchlings are usually thought to recruit in neritic habitats at a CCL of 35-40 cm in the Pacific (Limpus et al., 2005) after an epipelagic phase of several years. During this phase, they are thought to disperse widely depending on the currents (Bolten, 2003). The Southern Equatorial Current which flows westward to Fiji and the Australian coast facilitates long-distance dispersion of post-hatchlings from French Polynesia to foraging grounds in the Western Pacific Ocean, as was reported by Jones et al. (2018) on the Great Barrier Reef, and by Piovano et al. (2019) in Fiji (Figure 2). However, the presence of several individuals smaller than 35cm CCL in the French Polynesian mixture (Supplementary Table 4) suggests that post-hatchling dispersion may be limited for some individuals. Information about green turtles’ “lost years” is very scarce, but Hamabata et al. (2016) also observed unexpectedly limited migrations of post-hatchlings restricted to Japanese waters. Most importantly, dispersion seems to occur unidirectionally from French Polynesian rookeries, and the territory does not seem to host juveniles originating from other Pacific rockeries. Such isolation in terms of recruitment from the other regional MUs makes the French Polynesia green turtle population highly vulnerable to local threats.
Additionally, migrations of nesting females from French Polynesia to American Samoa, Tonga, New Caledonia, and Fiji have been documented with satellite tracking (Craig et al., 2004; DIREN, personal com.). Fijian foraging grounds offer seagrass beds for adult green turtle foraging, which are absent in French Polynesia (Craig et al., 2004). Juveniles have also been found to forage in Fiji, and MSA on Fijian foraging grounds indicates that French Polynesian rookeries contribute 7% to this mixture (Piovano et al., 2019). However, this contribution was considered underestimated because it was based on only 9 individuals (accounting for 2 haplotypes) from Mopelia’s rookery, which does not reflect the diversity of the French Polynesian population (Piovano et al., 2019). Therefore, the contribution to Fijian foraging aggregations can likely be revised with the more complete baseline presented here. Similarly, this baseline resolves several haplotypes previously considered orphan haplotypes that can now be linked to French Polynesian rookeries. Haplotype CmP33.1 was found on one juvenile in foraging aggregations in Fiji (Piovano et al., 2019), haplotype CmP192.1 was found both in Fiji (n=5) and on the Gear Barrier Reef (n=1) (Jensen et al., 2016), and haplotype CmP97.1 was found in Ecuador (n=10) (Chaves et al., 2017), Easter Island (n=10) (Álvarez-Varas et al., 2022), and Palmyra atoll foraging aggregations (n=6) (Naro-Maciel et al., 2014). However, these three haplotypes were found at very low frequencies in French Polynesian rookeries (1 individual for CmP33.1 and CmP192.1, 2 for CmP97.1), and might also be present in other source populations that have yet to be sampled. Also, the presence of three orphan haplotypes in our mixture, even though they were found at low frequencies, is a sign of incomplete sampling of existent rookeries, or unsampled rookeries. The baseline used here includes an incomplete sampling of Samoan and Fijian rookeries, in addition to French Polynesia. Extending sampling efforts in these areas could improve our understanding of the connection between these three territories that are used by French Polynesian green turtles during their lifetime. Additionally, the presence of French Polynesian haplotypes in Eastern and Central North Pacific foraging grounds may indicate rare Northward and Eastward migration events. French Polynesian rookeries were also found to contribute 7% to Gorgona Island foraging ground in Colombia (Correa-Cárdenas et al., 2012). This low contribution seems realistic as post-hatchlings may swim northward through the South Equatorial Current and reach the Pacific Equatorial Countercurrent that follows the Equator line and flows eastward towards South America (Figure 2). These migrations and the connectivity between Central South and East Pacific Oceans are still poorly understood, and further investigations should be considered.
4.4 Conclusion and implication for conservation
This work is the most comprehensive assessment of genetic diversity, structure and connectivity of green turtle populations in French Polynesia to date. Here, French Polynesia’s green turtle populations are shown to be genetically isolated from other populations and can thus be considered as a separate management unit from nearby islands, and highlights the population’s vulnerability to local threats. This finding is in accordance with the regional MUs defined for green turtles in the South Pacific region (Seminoff et al., 2015). It confirms the role of French Polynesia as a genetic diversity hotspot, emphasizing the importance of preserving this endemic diversity at the species scale. Given the genetic structure within the territory, further division into two genetic groups is needed, one in the Leeward Islands and one in the Windward Islands. Interestingly, the Leeward Islands hosted a greater genetic diversity than the Windward islands despite a smaller sampling effort. Conservation efforts should thus not be overlooked in this island group that plays an important role in the overall genetic diversity of the species. Despite genetic isolation, French Polynesian rookeries are source populations for several feeding grounds, both in the Eastern and Western Pacific and are thus connected with several islands through adult and juvenile migrations. This highlights the need for coordinated regional conservation efforts at the Pacific scale to preserve green turtles throughout their entire lifetime.
Data availability statement
The datasets presented in this study can be found in online repositories. The names of the repository/repositories and accession number(s) can be found in the article/Supplementary Material.
Ethics statement
Ethical review and approval was not required for the animal study because biopsies were performed with non-lethal methods with authorizations from the Direction of Environment of French Polynesia.
Author contributions
Sample collection of Chelonia mydas was coordinated by MT and by CG on Tetiaroa. Sample processing and analysis were performed by VD, reviewed by EB, and supervised by EB and SP. Sample analysis was also reviewed by JB. The first draft of the manuscript was written by VD, and all authors commented on previous versions of the manuscript. All authors read and approved the final manuscript.
Funding
This work was supported by the Direction of the Environment of French Polynesia.
Acknowledgments
We would like to thank the volunteers of the NGO Te mana o te moana for providing Chelonia mydas samples from Tetiaroa and Moorea for this study. We also thank the volunteers of the Bora Bora Turtle Center for samples from the Leeward Islands, as well as the Direction of Environment for coordinating the sampling across French Polynesia and providing them to the CRIOBE for the analyses. Thank you to Jeanine Almany for the English corrections.
Conflict of interest
The authors declare that the research was conducted in the absence of any commercial or financial relationships that could be construed as a potential conflict of interest.
Publisher’s note
All claims expressed in this article are solely those of the authors and do not necessarily represent those of their affiliated organizations, or those of the publisher, the editors and the reviewers. Any product that may be evaluated in this article, or claim that may be made by its manufacturer, is not guaranteed or endorsed by the publisher.
Supplementary material
The Supplementary Material for this article can be found online at: https://www.frontiersin.org/articles/10.3389/fmars.2023.1201384/full#supplementary-material
References
Abreu-Grobois F. A., Horrocks J. A., Krueger B., Formia A., Beggs J. (2006). New mtDNA dloop primers which work for a variety of marine turtle species may increase the resolution of mixed stock analyses., in: book of abstracts from the 26th annual symposium on Sea turtle biology and conservation. Int. Sea Turtle Soc. Crete Greece 179.
Álvarez-Varas R., Medrano C., Benítez H. A., Guerrero F., León Miranda F., Vianna J. A., et al. (2022). Genetics, morphometrics and health characterization of green turtle foraging grounds in mainland and insular Chile. Anim. Open Access J. MDPI 12, 1473. doi: 10.3390/ani12121473
Anderson E. C., Waples R. S., Kalinowski S. T. (2008). An improved method for predicting the accuracy of genetic stock identification. Can. J. Fish. Aquat. Sci. 65, 1475–1486. doi: 10.1139/F08-049
Balazs G. H., Siu P., Landret J. P. (1995). Ecological aspects of green turtles nesting at Scilly atoll in French Polynesia, in: proceedings of the 12th annual workshop on Sea turtle biology and conservation. NOAA Tech. Memo. pp, 7–10.
Balazs G. H., Van Houtan K. S., Hargrove S. A., Brunson S. M., Murakawa S. K. K. (2015). A review of the demographic features of Hawaiian green turtles (Chelonia mydas). Chelonian Conserv. Biol. 14, 119–129. doi: 10.2744/CCB-1172.1
Bjorndal K. A., Bolten A. B. (2008). Annual variation in source contributions to a mixed stock: implications for quantifying connectivity. Mol. Ecol. 17, 2185–2193. doi: 10.1111/j.1365-294X.2008.03752.x
Bjorndal K. A., Parsons J., Mustin W., Bolten A. B. (2013). Threshold to maturity in a long-lived reptile: interactions of age, size, and growth. Mar. Biol. 160, 607–616. doi: 10.1007/s00227-012-2116-1
Boissin E., Neglia V., Tatarata M., Planes S. (2019). Evolutionary history of green turtle populations, Chelonia mydas, from French Polynesia highlights the putative existence of a glacial refugium. Mar. Biodivers. 49, 2725–2733. doi: 10.1007/s12526-019-01001-6
Bolten A. B. (2003). “Variation in sea turtle life history patterns: neritic vs. oceanic developmental stages,” in The biology of Sea turtles (Boca Raton, Florida: CRC Press), 455.
Bourjea J., Lapègue S., Gagnevin L., Broderick D., Mortimer J. A., Ciccione S., et al. (2007). Phylogeography of the green turtle, Chelonia mydas, in the southwest Indian ocean. Mol. Ecol. 16, 175–186. doi: 10.1111/j.1365-294X.2006.03122.x
Bowen B. W., Karl S. A. (2007). Population genetics and phylogeography of sea turtles. Mol. Ecol. 16, 4886–4907. doi: 10.1111/j.1365-294X.2007.03542.x
Bowen B. W., Meylan A. B., Ross J. P., Limpus C. J., Balazs G. H., Avise J. C. (1992). Global population structure and natural history of the green turtle (Chelonia mydas) in terms of matriarchal phylogeny. Evol. Int. J. Org. Evol. 46, 865–881. doi: 10.1111/j.1558-5646.1992.tb00605.x
Bradshaw P. J., Broderick A. C., Carreras C., Fuller W., Snape R. T. E., Wright L. I., et al. (2018). Defining conservation units with enhanced molecular tools to reveal fine scale structuring among Mediterranean green turtle rookeries. Biol. Conserv. 222, 253–260. doi: 10.1016/j.biocon.2017.12.014
Chaves J., Peña M., Valdés-Uribe J., Muñoz-Pérez J., Vallejo F., Heidemeyer M., et al. (2017). Connectivity, population structure, and conservation of Ecuadorian green sea turtles. Endanger. Species Res. 32, 251–264. doi: 10.3354/esr00809
Correa-Cárdenas C., Amorocho D., Caballero S. (2012). Spatial-temporal analyses of Eastern pacific green turtles (Chelonia mydas/Chelonia agassizzii) foraging as mixed stock in gorgona NNP (Colombia: Universidad de los Andes), 71.
Craig P., Parker D., Brainard R., Rice M., Balazs G. (2004). Migrations of green turtles in the central south pacific. Biol. Conserv. 116, 433–438. doi: 10.1016/S0006-3207(03)00217-9
Dutton P. H., Jensen M. P., Frey A., LaCasella E., Balazs G. H., Zárate P., et al. (2014a). Population structure and phylogeography reveal pathways of colonization by a migratory marine reptile (Chelonia mydas) in the central and eastern pacific. Ecol. Evol. 4, 4317–4331. doi: 10.1002/ece3.1269
Dutton P. H., Jensen M. P., Frutchey K., Frey A., LaCasella E., Balazs G. H., et al. (2014b). Genetic stock structure of green turtle (Chelonia mydas) nesting populations across the pacific islands. Pac. Sci. 68, 451–464. doi: 10.2984/68.4.1
Dutton P. H., LeRoux R. A., LaCasella E. L., Seminoff J. A., Eguchi T., Dutton D. L. (2018). Genetic analysis and satellite tracking reveal origin of the green turtles in San Diego bay. Mar. Biol. 166, 3. doi: 10.1007/s00227-018-3446-4
Excoffier L., Lischer H. E. L. (2010). Arlequin suite ver 3.5: a new series of programs to perform population genetics analyses under Linux and windows. Mol. Ecol. Resour. 10, 564–567. doi: 10.1111/j.1755-0998.2010.02847.x
FitzSimmons N. N., Limpus C. J., Norman J. A., Goldizen A. R., Miller J. D., Moritz C. (1997). Philopatry of male marine turtles inferred from mitochondrial DNA markers. Proc. Natl. Acad. Sci. 94, 8912–8917. doi: 10.1073/pnas.94.16.8912
Gelman A., Rubin D. B. (1992). Inference from iterative simulation using multiple sequences. Stat. Sci. 7, 457–472. doi: 10.1214/ss/1177011136
Groombridge B., Luxmoore R. A. (1989). The green turtle and hawksbill (Reptilia: Cheloniidae) : world status, exploitation and trade (Lausane: CITES).
Hamabata T., Hikida T., Ishihara T., Kawazu I., Nashiki Y., Oki K., et al. (2016). MtDNA analysis suggests local origin of pelagic-stage juvenile green turtles collected in Japanese coastal waters 1. Pac. Sci. 70, 45–54. doi: 10.2984/70.1.4
Hamabata T., Kamezaki N., Hikida T. (2014). Genetic structure of green turtle (Chelonia mydas) peripheral populations nesting in the northwestern pacific rookeries: evidence for northern refugia and postglacial colonization. Mar. Biol. 161, 495–507. doi: 10.1007/s00227-013-2352-z
Hughes G. (1970). MARINE TURTLES: an introduction to the sea turtles of south East Africa.4. South Afr. J. Sci. 66, 239–246. doi: 10.10520/AJA00382353_3951
Jensen M. P., Bell I., Limpus C. J., Hamann M., Ambar S., Whap T., et al. (2016). Spatial and temporal genetic variation among size classes of green turtles (Chelonia mydas) provides information on oceanic dispersal and population dynamics. Mar. Ecol. Prog. Ser. 543, 241–256. doi: 10.3354/meps11521
Jensen M. P., FitzSimmons N. N., Bourjea J., Hamabata T., Reece J., Dutton P. H. (2019). The evolutionary history and global phylogeography of the green turtle (Chelonia mydas). J. Biogeogr. 46, 860–870. doi: 10.1111/jbi.13483
Jensen M. P., FitzSimmons N. N., Dutton P. H. (2013). Molecular genetics of sea turtles, in: the biology of Sea turtles. CRC Press Boca Raton Florida pp, 135–162.
Jones K., Jensen M., Burgess G., Leonhardt J., Herwerden L., Hazel J., et al. (2018). Closing the gap: mixed stock analysis of three foraging populations of green turtles (Chelonia mydas) on the great barrier reef. PeerJ 6, e5651. doi: 10.7717/peerj.5651
Kumar S., Stecher G., Tamura K. (2016). MEGA7: molecular evolutionary genetics analysis version 7.0 for bigger datasets. Mol. Biol. Evol. 33, 1870–1874. doi: 10.1093/molbev/msw054
Laloë J.-O., Monsinjon J., Gaspar C., Touron M., Genet Q., Stubbs J., et al. (2020). Production of male hatchlings at a remote south pacific green sea turtle rookery: conservation implications in a female-dominated world. Mar. Biol. 167, 70. doi: 10.1007/s00227-020-03686-x
Limpus C. (2008). A biological review of Australian marine turtles. 2. green turtle Chelonia mydas (Linnaeus). Rep. Qld. Environ. Prot. Agency 96.
Limpus C. J., Limpus D. J., Arthur K. E., Parmenter C. J. (2005). Monitoring green turtle population dynamics in shoalwater bay 2000-2004 (Report). Great Barrier Reef Mar. Park Author 60.
López-Castro M., Koch V., Mariscal-Loza A., Nichols W. (2010). Long-term monitoring of black turtles Chelonia mydas at coastal foraging areas off the Baja California peninsula. Endanger. Species Res. 11, 35–45. doi: 10.3354/esr00264
Maison K., Kinan-Kelly I., Frutchey K. (2010). Green turtle nesting sites and Sea turtle legislation throughout Oceania (Technical memorandum no (Honolulu, Hawaii 96822, USA: NOAA).
Moran B. M., Anderson E. C. (2019). Bayesian Inference from the conditional genetic stock identification model. Can. J. Fish. Aquat. Sci. 76, 551–560. doi: 10.1139/cjfas-2018-0016
Musick J. A., Limpus C. J. (1997). Habitat utilization and migration in juvenile sea turtles, in: the biology of Sea turtles. CRC Press Boca Raton Florida pp, 137–163.
Naro-Maciel E., Gaughran S. J., Putman N. F., Amato G., Arengo F., Dutton P. H., et al. (2014). Predicting connectivity of green turtles at Palmyra atoll, central pacific: a focus on mtDNA and dispersal modelling. J. R. Soc Interface 11. doi: 10.1098/rsif.2013.0888
Nishizawa H., Abe O., Okuyama J., Kobayashi M., Arai N. (2011). Population genetic structure and implications for natal philopatry of nesting green turtles Chelonia mydas in the yaeyama islands, Japan. Endanger. Species Res. 14, 141–148. doi: 10.3354/esr00355
Nishizawa H., Joseph J., Chong Y. K., Syed Kadir S. A., Isnain I., Ganyai T. A., et al. (2018). Comparison of the rookery connectivity and migratory connectivity: insight into movement and colonization of the green turtle (Chelonia mydas) in pacific–southeast Asia. Mar. Biol. 165, 77. doi: 10.1007/s00227-018-3328-9
Nishizawa H., Naito Y., Suganuma H., Abe O., Okuyama J., Hirate K., et al. (2013). Composition of green turtle feeding aggregations along the Japanese archipelago: implications for changes in composition with current flow. Mar. Biol. 160, 2671–2685. doi: 10.1007/s00227-013-2261-1
Phillips K. F., Stahelin G. D., Chabot R. M., Mansfield K. L. (2021). Long-term trends in marine turtle size at maturity at an important Atlantic rookery. Ecosphere 12, e03631. doi: 10.1002/ecs2.3631
Piovano S., Batibasaga A., Ciriyawa A., LaCasella E. L., Dutton P. H. (2019). Mixed stock analysis of juvenile green turtles aggregating at two foraging grounds in Fiji reveals major contribution from the American Samoa management unit. Sci. Rep. 9, 3150. doi: 10.1038/s41598-019-39475-w
Plummer M., Best N., Cowles K., Vines K. (2006). CODA: convergence diagnosis and output analysis for MCMC. R News 6, 7–11.
Read T. C., FitzSimmons N. N., Wantiez L., Jensen M. P., Keller F., Chateau O., et al. (2015). Mixed stock analysis of a resident green turtle, Chelonia mydas, population in new Caledonia links rookeries in the south pacific. Wildl. Res. 42, 488–499. doi: 10.1071/WR15064
Read T. C., Wantiez L., Werry J. M., Farman R., Petro G., Limpus C. J. (2014). Migrations of green turtles (Chelonia mydas) between nesting and foraging grounds across the coral Sea. PloS One 9, e100083. doi: 10.1371/journal.pone.0100083
Seminoff J. A., Balazs G. H., Dutton P. H., Eguchi T., Haas H. L., Hargrove S. A., et al. (2015). Status review of the green turtle (Chelonia mydas) under the U.S. endangered species act (United States).
Shamblin B. M., Dutton P. H., Bjorndal K. A., Bolten A. B., Naro-Maciel E., Santos A. J. B., et al. (2015). Deeper mitochondrial sequencing reveals cryptic diversity and structure in Brazilian green turtle rookeries. Chelonian Conserv. Biol. 14, 167–172. doi: 10.2744/CCB-1152.1
Shamblin B. M., Hart K. M., Martin K. J., Ceriani S. A., Bagley D. A., Mansfield K. L., et al. (2020). Green turtle mitochondrial microsatellites indicate finer-scale natal homing to isolated islands than to continental nesting sites. Mar. Ecol. Prog. Ser. 643, 159–171. doi: 10.3354/meps13348
Tikochinski Y., Bendelac R., Barash A., Daya A., Levy Y., Friedmann A. (2012). Mitochondrial DNA STR analysis as a tool for studying the green sea turtle (Chelonia mydas) populations: the Mediterranean Sea case study. Mar. Genomics 6, 17–24. doi: 10.1016/j.margen.2012.01.002
Tikochinski Y., Bradshaw P., Mastrogiacomo A., Broderick A., Daya A., Demetropoulos A., et al. (2018). Mitochondrial DNA short tandem repeats unveil hidden population structuring and migration routes of an endangered marine turtle. Aquat. Conserv. Mar. Freshw. Ecosyst. 28, 788–797. doi: 10.1002/aqc.2908
Touron M., Genet Q., Gaspar C. (2018). Final report on the green sea turtle egg-laying season of 2017-2018 (Chelonia mydas) on the atoll of tetiaroa. Assoc. Te Mana O Te Moana 54.
Wallace B. P., DiMatteo A. D., Hurley B. J., Finkbeiner E. M., Bolten A. B., Chaloupka M. Y., et al. (2010). Regional management units for marine turtles: a novel framework for prioritizing conservation and research across multiple scales. PloS One 5, e15465. doi: 10.1371/journal.pone.0015465
Keywords: Chelonia mydas, population structure, genetic diversity, MSA, conservation, stock, connectivity, haplotype
Citation: Dolfo V, Gaspar C, Bourjea J, Tatarata M, Planes S and Boissin E (2023) Population genetic structure and mixed stock analysis of the green sea turtle, Chelonia mydas, reveal reproductive isolation in French Polynesia. Front. Mar. Sci. 10:1201384. doi: 10.3389/fmars.2023.1201384
Received: 06 April 2023; Accepted: 14 June 2023;
Published: 02 August 2023.
Edited by:
Donna Jill Shaver, United States Department of the Interior, United StatesReviewed by:
Brian Michael Shamblin, University of Georgia, United StatesTomoko Hamabata, Tohoku University, Japan
Hideaki Nishizawa, Kyoto University, Japan
Copyright © 2023 Dolfo, Gaspar, Bourjea, Tatarata, Planes and Boissin. This is an open-access article distributed under the terms of the Creative Commons Attribution License (CC BY). The use, distribution or reproduction in other forums is permitted, provided the original author(s) and the copyright owner(s) are credited and that the original publication in this journal is cited, in accordance with accepted academic practice. No use, distribution or reproduction is permitted which does not comply with these terms.
*Correspondence: Violaine Dolfo, violaine.dolfo@univ-perp.fr
†These authors have contributed equally to this work and share last authorship