Loggerhead turtle oceanic-neritic habitat shift reveals key foraging areas in the Western Indian Ocean
 Jonathan R. Monsinjon1*
  Antoine Laforge2,3
  Philippe Gaspar2 Anne Barat3
  Olivier Bousquet3,4 Stéphane Ciccione5 Claire Jean5 Katia Ballorain6
  Mayeul Dalleau6
  Rui Coelho7
  Sylvain Bonhommeau1
  Jérôme Bourjea8
- 1Institut Français de Recherche pour l'Exploitation de la Mer (IFREMER), Délégation Océan Indien (DOI), Le Port, La Réunion, France
- 2Mercator Ocean International, Toulouse, France
- 3Laboratoire de l'Atmosphère et des Cyclones (LACy Laboratory), University of La Réunion, Saint-Denis, La Réunion, France
- 4Institute for Coastal and Marine Research, Nelson Mandela University, Port Elizabeth, South Africa
- 5Kelonia, Marine Turtle Observatory and Rescue Center, Saint-Leu, La Réunion, France
- 6Centre d’Etude et de Découverte des Tortues Marines (CEDTM), Piton Saint-Leu, La Réunion, France
- 7Portuguese Institute for the Ocean and Atmosphere, I.P. (IPMA), Olhão, Portugal
- 8Unité Mixte de Recherche (UMR), Marine Biodiversity Exploitation and Conservation (MARBEC), Institut Français de Recherche pour l'Exploitation de la Mer (IFREMER), Centre National de la Recherche Scientifique (CNRS), Institut de Recherche pour le Développement (IRD), University of Montpellier, Sète, France
Loggerhead sea turtles (Caretta caretta) use both oceanic and neritic habitats depending on their life stage, eventually undertaking an ontogenetic shift. Juveniles likely start foraging in a purely opportunistic manner and later seek resources more actively. In the Indian Ocean, it is still unclear where oceanic-stage individuals go, what they do, and importantly where they forage. Yet, such information is crucial to protect this endangered species from anthropogenic threats such as bycatch in fisheries. To address this, 67 individuals (66 late juveniles and one adult) bycaught in the open ocean were equipped with satellite tags and released in the Southwestern Indian Ocean between 2008 and 2021. Most individuals traveled to the Northwestern Indian Ocean where they used neritic habitats of the continental shelf (i.e., largely between 0 and 200-m depth). Using hidden Markov models, we identified three types of movements likely associated with traveling, wandering, and foraging behaviors. We found that the movement characteristics of these behaviors differ depending on turtles’ target destination and habitat (oceanic vs neritic), highlighting different strategies of habitat use among individuals of presumably the same life stage (late juveniles). The turtles that traveled to the Northwestern Indian Ocean encountered warmer waters (mean = 27.6°C, min. = 20.6°C, max. = 33.1°C) than their counterparts remaining in the Southern Hemisphere (mean = 22.5°C, min. = 14.6°C, max. = 29.7°C) but were found foraging at locations with comparable biomass of potential prey (mean = 2.5 g C m-2, min. = 0.5 g C m-2, max. = 10.4 g C m-2) once in the Northern Hemisphere. It remains obscure why these individuals undertook a trans-equatorial migration. Once in neritic habitats, the proportion of time spent traveling was considerably reduced (from 33% to 19%) and allocated to foraging instead. In light of this, it is very likely that the individuals migrated to the Northwestern Indian Ocean to undergo an oceanic-to-neritic ontogenetic shift. Our study sheds light on the behavioral ecology of loggerhead turtles and identifies important foraging areas in the Western Indian Ocean, with the top-three most densely used ones being the Gulf of Oman, the Central Somali Coast, and the Western Arabian Sea.
1 Introduction
Understanding how marine megafauna species respond to their environment is crucial to design effective conservation strategies and reduce anthropogenic threats such as fisheries bycatch (Hazen et al., 2018). In recent years, advances in satellite telemetry have considerably enhanced our knowledge of sea turtle ecology (Hays and Hawkes, 2018) and, more generally, of marine megafauna’s movements, habitats, and connectivity (Hussey et al., 2015; Sequeira et al., 2018; Kot et al., 2022). This has important implications in behavioral ecology (e.g., Guzman et al., 2019; Chimienti et al., 2020) and oceanography (Bousquet et al., 2020; McMahon et al., 2021) but also in the context of dynamic ocean management (Maxwell et al., 2015; Sequeira et al., 2019). Sea turtle tracking data provide valuable information to design, refine or evaluate marine protected areas and, as such, become a key component in marine spatial planning strategies (e.g., Dawson et al., 2017; Roberts et al., 2021; Conners et al., 2022).
The spatial, behavioral, and foraging ecology of loggerhead turtle (Caretta caretta) populations remains poorly known in the Indian Ocean due to the relative paucity of tracking data compared to other oceanic basins. Studies in the Atlantic and Pacific Oceans revealed that juveniles can spend decades in the open ocean (Carr, 1986; Bjorndal et al., 2003) where they forage epipelagically (Polovina et al., 2006; Gaube et al., 2017; Chambault et al., 2019). When approaching adulthood, they start using coastal waters more frequently and feed on benthic preys (Bolten, 2003; Marshall et al., 2012). Nevertheless, such a shift in foraging habitat (i.e., ontogenetic shift) can be facultative (Ramirez et al., 2015), as suggested by studies in the Atlantic (Hawkes et al., 2006) and Pacific oceans (Hatase et al., 2013) that found the co-existence of both oceanic and neritic foraging strategies in adult female loggerhead turtles.
Based on 18 late-juvenile loggerhead turtles bycaught in the Southwestern Indian Ocean, Dalleau et al. (2014) found that the majority of the animals directed their movements toward the Arabian Peninsula, which hosts one of the largest nesting site of loggerhead turtles worldwide, specifically in Masirah Island, Sultanate of Oman (Willson et al., 2020). Given that loggerhead turtles typically return to their natal area to breed (Bowen et al., 2004), it is possible that these individuals undertook a trans-equatorial migration for this purpose. However, this remains purely speculative given the low number of tracked individuals. Thanks to additional observations from tagged loggerhead turtles in the Western Indian Ocean (collected as part of the research programs described in Dalleau et al., 2016; Bousquet et al., 2020) it is now possible to gain more detailed information about the spatial ecology of this species. In the present study, movement behaviors (e.g., traveling vs foraging) are inferred along the tracks of 67 loggerhead turtles to better understand how this species use oceanic and neritic habitats. More specifically, this study addresses the following questions:
1. Do loggerhead turtles exhibit different movement characteristics depending on their target destination and habitat?
2. What oceanic and neritic regions are explored and does their use depend on turtles’ behavior?
3. Do turtles experience different environmental conditions depending on their target destination, habitat, and behavior?
4. Do turtles allocate similar proportions of time to each behavior depending on their target destination and habitat?
Individuals were first grouped based on their target destination and encountered habitats (hereinafter referred to as ‘turtle-habitat’ group). Second, Hidden Markov Models (HMMs) were applied to tracking data to infer three behavioral states (traveling, wandering, and foraging). Third, environmental parameters (temperature and proxies of potential resources) were extracted at turtle locations and respective oceanic or neritic regions (The Nature Conservancy, 2012) were identified. Finally, the proportion of time allocated to each behavioral state within turtle-habitat groups was determined to further analyze potential behavioral differences.
2 Materials and methods
2.1 Turtle tagging
The study relied on satellite tracking data collected from 67 loggerhead turtles between 2008 and 2021 (Figure 1; Supplementary Table S1). Among these individuals, 63 were released from the sea turtle observatory and care center of Reunion Island, Kelonia, where they received hook extraction surgery after being accidentally caught in longline fisheries operating around Reunion Island. All injured turtles remained at Kelonia care center until full recovery before being equipped with Argos Platform Terminal Transmitters (see Dalleau et al., 2014 for protocols details) and released in the ocean near Reunion Island. Four additional individuals that had no severe injuries were released in the open ocean right after their accidental capture. All individuals were considered to be late juveniles (Curved Carapace Length, CCL between 54 and 85 cm and no external sign of sexual maturity), except for one adult male of 91.5-cm CCL (Supplementary Table S1). Tagging data were collected as part of the following research projects: 20 animals from a PhD thesis (Dalleau, 2013), 22 from the COCA LOCA (COnnectivité des populations de tortues CAouannes dans l’ouest de l’océan Indien: mise en place de mesures de gestion LOCAles et régionales) research project (Dalleau et al., 2016), 21 from the STORM (Sea Turtles for Ocean Research and Monitoring) research project (Bousquet et al., 2020), and four from a collaboration with the Portuguese Institute for the Ocean and Atmosphere (IPMA-Portugal). The animals were handled and equipped by qualified personnel with official accreditation and no extra animal discomfort was caused.
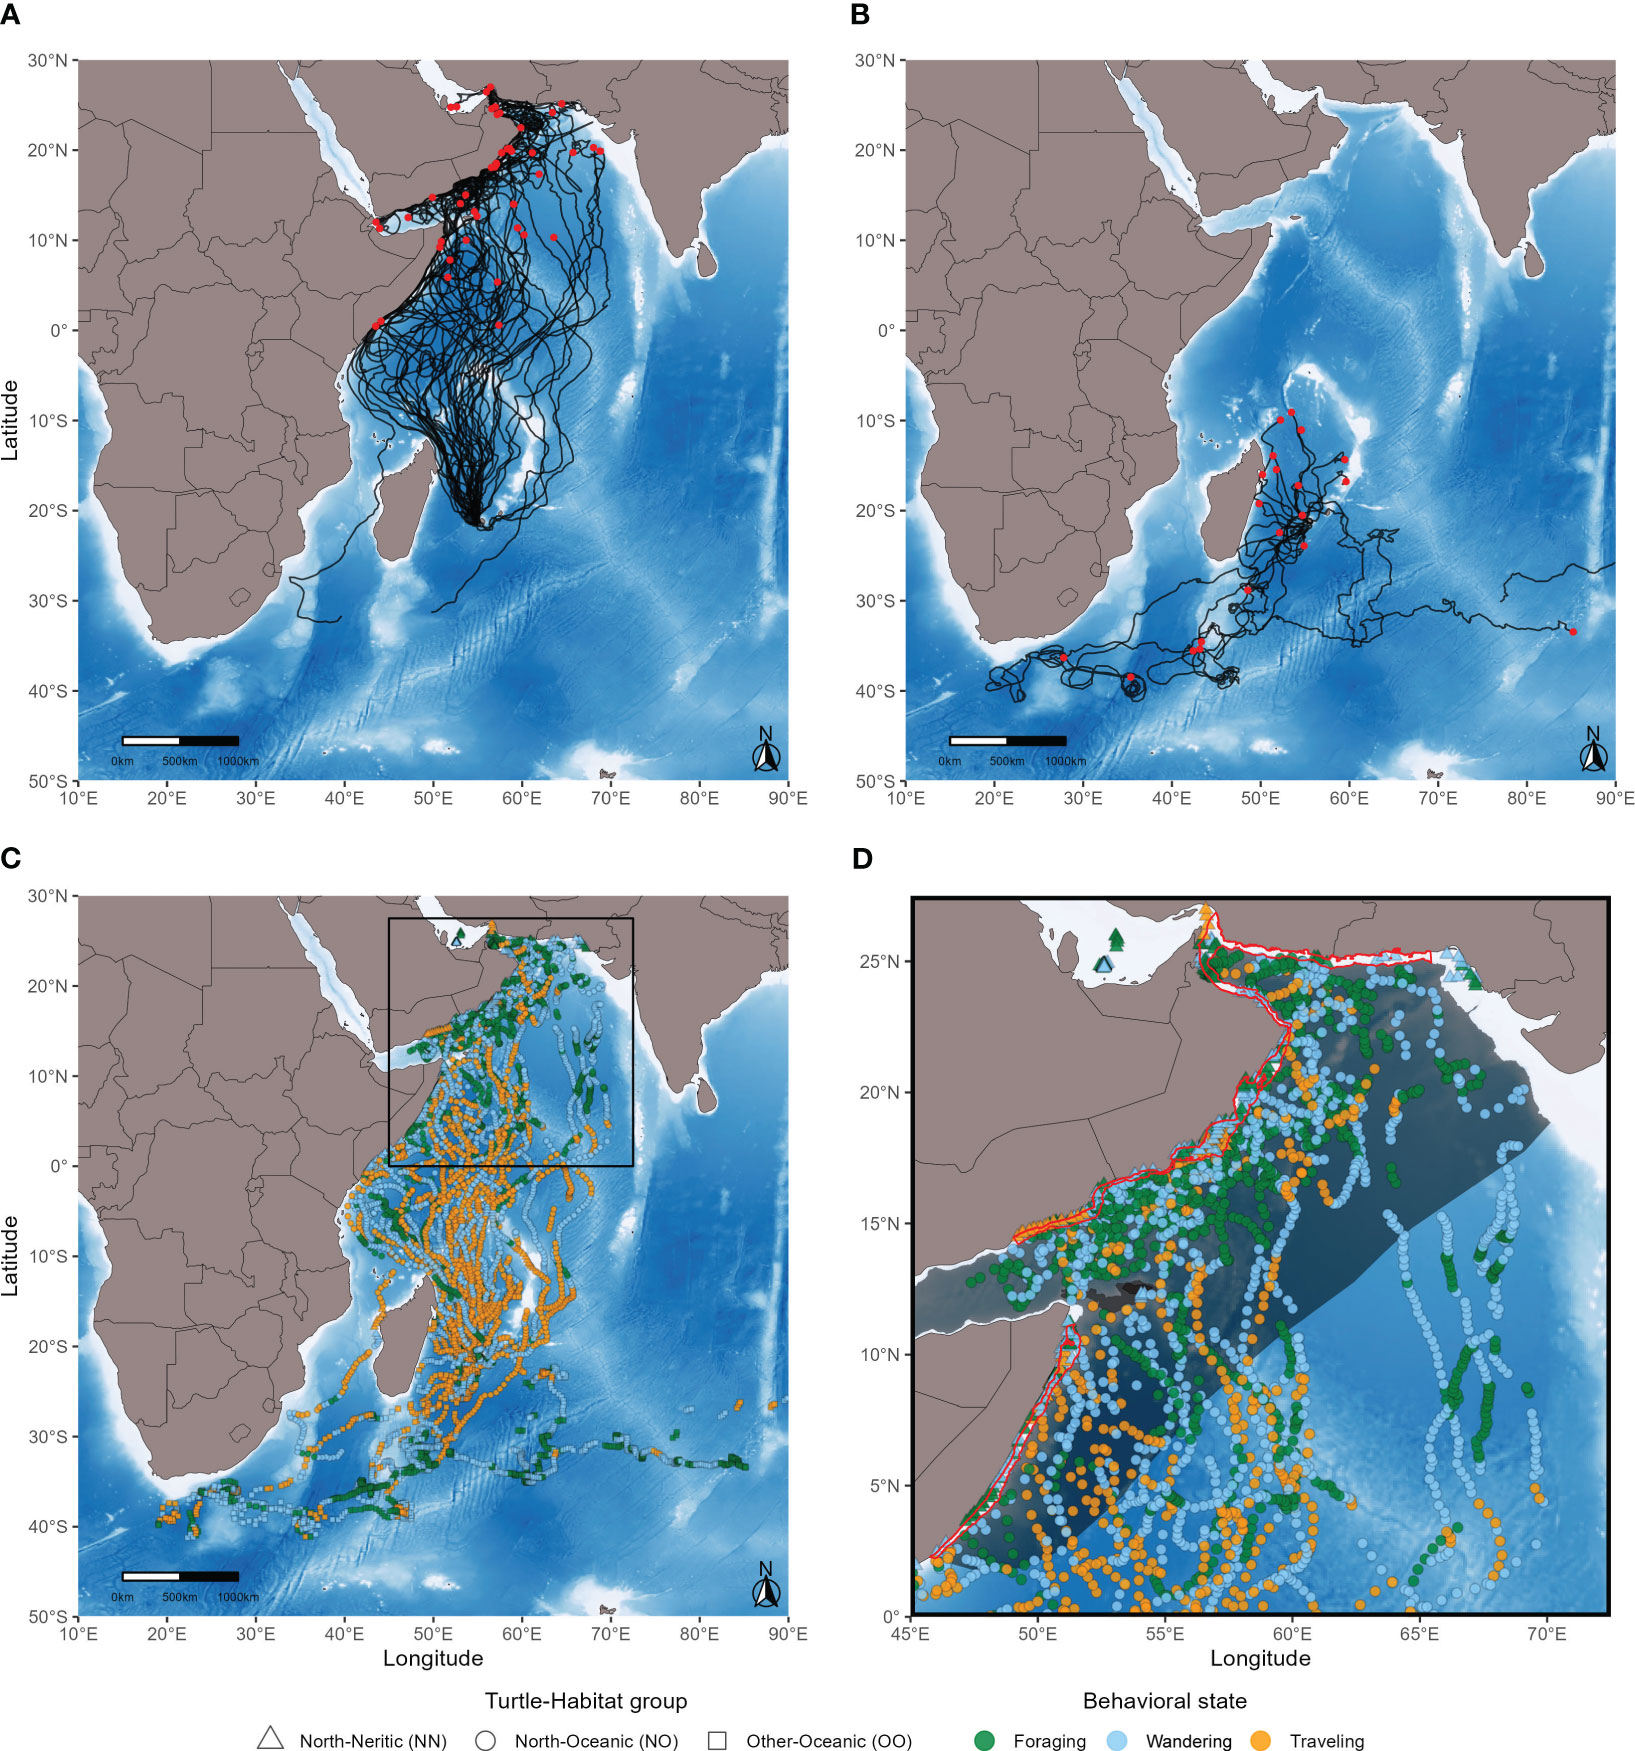
Figure 1 Interpolated tracks (A, B) and behavioral states (C, D) of 67 loggerhead turtles. Red points indicate the end locations of turtles of the North group (A) and the Other group (B). Note that one turtle of the Other group (B) that was released in the open ocean went straight east and stopped transmitting outside the study area in the vicinity of Sumba Island, Indonesia. The region delimited by a black square (C) is expanded in the last panel (D). Areas delimited in red are the top-three marine ecoregions (MEOWs) with the highest density of foraging locations: the Gulf of Oman, the Central Somali Coast, and the Western Arabian Sea. The grey shaded area shows the pelagic province (PPOW) that contains the highest number of foraging locations: the Somali Current.
2.2 Statistical analysis of trajectories
To infer behavioral states along the tracks using discrete-time Hidden Markov Models (HMMs), animal movements (e.g., step length and turning angle) must be obtained at regular time steps (McClintock & Michelot, 2018). Therefore, tracking data were interpolated at regular 12-h time steps using the state-space model available in the R package ‘aniMotum’ (Jonsen et al., 2021; Jonsen et al., 2023) after Class Z Argos locations, duplicates, and those falling on land were removed. To approximate daily ground velocity and match tracking data with model-derived environmental data (Table 1), turtle positions were centered at 12:00 UTC considering the distance between positions at t-12 hours and t+12 hours divided by 24 hours. Given that observed turtle movements are also driven by ocean currents, active swimming velocity, which is the difference between velocities of observed displacements and surrounding currents, was estimated following Gaspar et al. (2006) using surface currents (see next section and Table 1). The velocity of surface currents was estimated using daily zonal (Ucurrent) and meridional (Vcurrent) current components. We used an inverse-distance weighted interpolation to compute velocities from data between turtle locations at noon and the four adjacent spatial cells. Based on estimated turtle swimming components (Uswim and Vswim), hypothetical trajectories, hereinafter referred to as ‘current-corrected tracks’, were reconstructed. These can be viewed as the trajectories that each individual would have followed in a motionless ocean (Gaspar et al., 2006). To assess whether turtle movements are mainly due to oriented active swimming, we downloaded passive drifters released around Reunion Island (125 km2 centered square) between 2008 and 2021 (https://www.aoml.noaa.gov/phod/gdp). Tracks are sorted into four categories according to whether their first transmitted position belonged to periods: December to February (winter), March to May (spring), June to August (summer), and September to November (autumn).
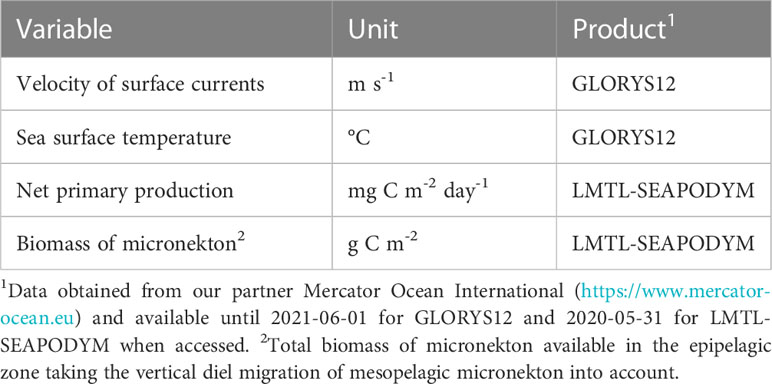
Table 1 Oceanographic variables extracted at turtle interpolated locations (daily at 1/12° spatial resolution).
HMMs were fitted via the R package ‘momentuHMM’ (McClintock and Michelot, 2018; McClintock and Michelot, 2022) using daily step length (i.e., virtual swimming distance) and turning angle obtained from current-corrected tracks. The probability distribution for step lengths was estimated assuming a gamma distribution and for turning angles assuming a von Mises distribution (Table 2). According to time series, Q-Q plots and autocorrelation functions of pseudo-residuals (McClintock & Michelot, 2018) no issue was found with model fitting (i.e., normality and reasonably low autocorrelation).
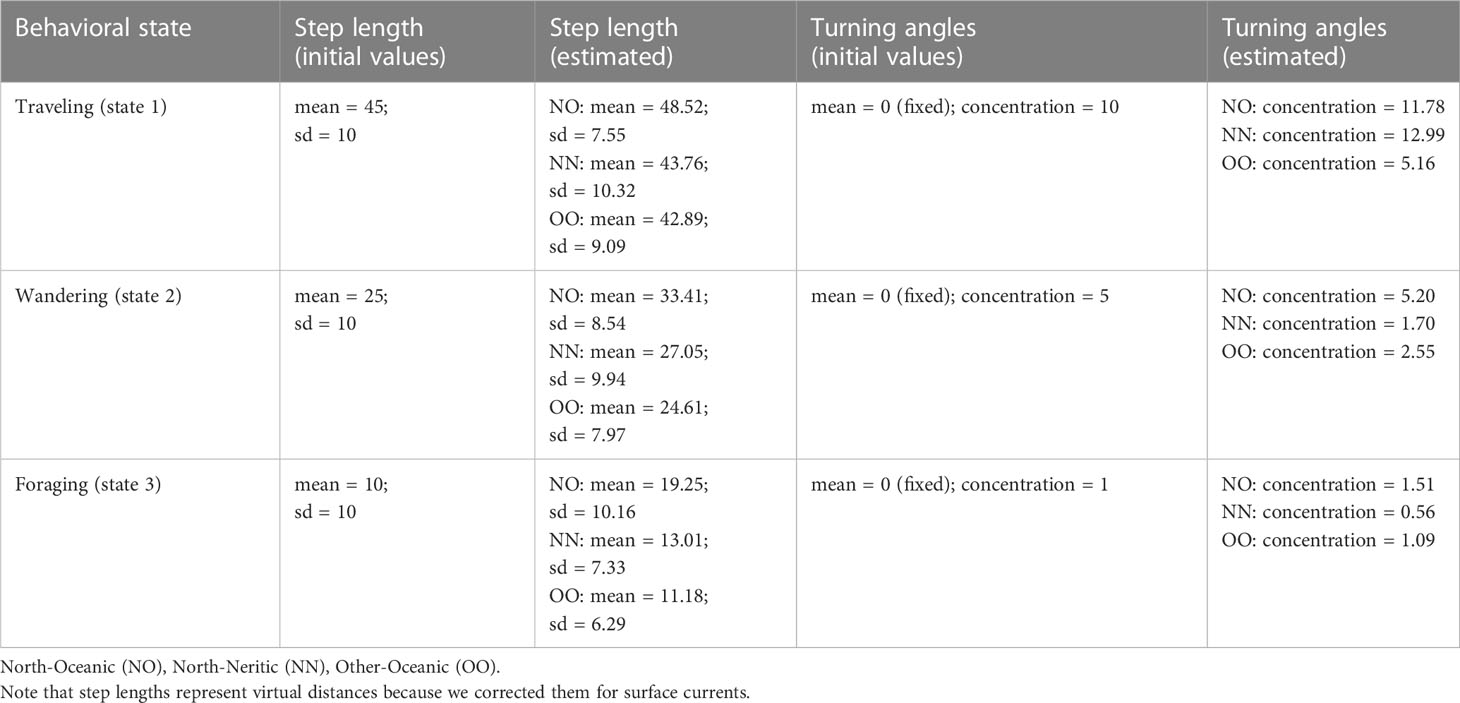
Table 2 Initial and estimated parameters of the probability distributions for step lengths (in km per day) and turning angles (in radians) for each group of turtles and behavioral state.
2.3 Oceanographic data
Oceanographic data from the GLORYS12 global ocean reanalysis (Lellouche et al., 2021) and the Low and Mid-Trophic Levels (LMTL) predictions (Lehodey et al., 2010; Lehodey et al., 2015) that use components of the SEAPODYM dynamical population model (Lehodey et al., 2008) were extracted at interpolated turtle locations (Table 1). Considered variables, chosen for their potential relevance in the behavioral ecology of loggerhead turtles (e.g., Frick et al., 2009; Vandeperre et al., 2019; Chambault et al., 2021b), include the velocity of surface currents, sea surface temperature, net primary production and micronekton biomass. Taking the vertical diel migration of mesopelagic micronekton into account, the total biomass of micronekton potentially available in the epipelagic zone, , was estimated from the following formula:
where is the biomass of epipelagic micronekton, is the biomass of migrant micronekton in the upper mesopelagic zone, and is the biomass of highly migrant micronekton in the lower mesopelagic zone.
2.4 Oceanic and neritic habitats
Geographic limits of Pelagic Provinces (Spalding et al., 2007) and Marine Ecoregions of the World (Spalding et al., 2012), hereinafter referred to as PPOWs and MEOWs respectively, were obtained from The Nature Conservancy (2012). PPOWs and MEOWs are cohesive spatial units that share similar characteristics at various levels (e.g., species composition and oceanographic/topographic features), with PPOWs bounding open ocean habitats and MEOWs coastal ones. These regions were used (1) to assign interpolated turtle locations to either oceanic or neritic habitats and (2) to rank the most used ones as a clue to their potential importance for loggerhead turtles.
2.5 Turtle-habitat groups and behavioral states
Among the 67 tracked individuals, 46 (69%) moved toward the Northwestern Indian Ocean and crossed the equator (Figure 1A). The 21 (31%) other individuals either took different directions or went north but stopped transmitting before reaching the Northern Hemisphere (Figure 1B). These two groups of individuals are hereinafter referred to as the ‘North’ group and the ‘Other’ group respectively (Supplementary Table S1). In both groups, interpolated locations fell within oceanic and neritic habitats. Therefore, each location was assigned to a group of turtles and a type of habitat: North-Oceanic (NO), North-Neritic (NN), Other-Oceanic (OO) and Other-Neritic (ON). The Other-Neritic turtle-habitat group (ON) was not considered as it represents only a minute fraction (0.5%) of our dataset (see next section).
Turtle horizontal movements can result from different behaviors. In this study, it was assumed that such movements can be described by three states: traveling (long steps and high directionality of movements), foraging (short steps and low directionality), and a third, intermediate state likely associated with wandering behavior. A simpler model with only two states (e.g., traveling and foraging) was also considered for parsimony. To address this, 2-state and 3-state HMMs were fitted and the best ones were selected based on the lowest AIC (Burnham and Anderson, 2002). Movement characteristics (i.e., probability distribution for step lengths and turning angles) of each behavioral state could differ depending on the group of turtles and type of habitat. To test this, HMMs were fitted separately for each turtle-habitat group (NO, NN, and OO) and the sum of AICs was compared to the AIC of a common HMM fitted with pooled data.
Pairwise comparisons among turtle-habitat groups and behavioral states were performed to investigate differences in (1) surface temperature, net primary production and micronekton biomass, and (2) the proportion of time allocated to each state within turtle-habitat groups. The R package ‘pgirmess’ (Giraudoux, 2022) was used for multiple comparison of environmental conditions after Kruskal-Wallis rank sum test. This non-parametric test was used because the oceanographic variables investigated in this study were non-normally distributed. The test assumes that the observations are independent. However, it is possible that there is spatial autocorrelation in the data and this could increase the Type I error whereby the null hypothesis is falsely rejected (Dale and Fortin, 2002). Therefore, the Moran’s I test was also performed using the R package ‘ape’ (Paradis, 2022) to identify cases where significant Kruskall-Wallis tests (p-value< 0.05) should be taken with caution. The Pearson’s chi-squared test for equality of proportions from the R package ‘stats’ (R Core Team, 2022) was used to compare proportions of time allocated to each state with the Benjamini-Yekutieli adjustment method for multiple testing (Benjamini and Yekutieli, 2001). Finally, the R package ‘multcompView’ (Graves et al., 2019) was used to visualize similarities via a letter code.
2.6 Data filtering and analysis
Various filters were applied to interpolated tracks (n = 13,185 locations):
- Locations with standard errors around spatial coordinates higher than the coarsest spatial resolution of oceanographic data (ca. 8.33 km) were discarded.
- The maximum time difference between interpolated and observed locations was set to 24 hours, which corresponds to the temporal resolution of oceanographic data.
- Potential outliers with estimated active swimming speeds higher than the 95th percentile (ca. 0.75 m s-1) were removed (Kinoshita et al., 2021).
- Locations falling outside the study area (Figures 1A, B) or neither within a PPOW or a MEOW (i.e., on land) were not considered.
- Track segments made of less than three consecutive locations (required for the calculation of turning angles) were omitted.
7,316 locations were retained, from which we removed 38 locations (0.5%) that fell in the neritic zone for turtles of the Other group (see previous section). The estimation of daily active movements and the extraction of oceanographic data were performed using Python version 3.10. The rest of the analysis was conducted using R versions 4.1.0 to 4.2.2.
3 Results
3.1 Main movements of tagged turtles
When released, the individuals measured from 54 to 85 cm in curved carapace length excluding the only adult (mean = 71.7 cm ± sd = 5.73; Supplementary Table S1) with no statistically significant difference between turtles of the North group vs the Other group (Kruskal-Wallis rank sum test, χ2 = 0.34, p-value = 0.56). Among the 46 turtles of the North group (Figure 1A), 20 (43%) reached the Somali coast: six went almost straight north during the first half of their track, 13 moved mostly northwestward nearing the northeastern coast of Madagascar, and one started its journey northeastward and changed directions several times. The 26 (57%) other individuals of this group remained relatively far from the Somali coast until they reached the Arabian Peninsula or stopped transmitting. Among the 21 turtles of the Other group (Figure 1B), seven (33%) went south: one approached the 30th parallel south before transmission was lost and six went further south and stopped transmitting between 30°S and 40°S. Transmission was lost too early for the 14 (67%) other individuals of this group to ascertain their target destination (i.e., whether they went north and crossed the equator or south and passed the 30th parallel), except for one that was released in the open ocean and went straight east toward the coast of Australia. The movements of all turtles were analyzed. In some cases, turtles released the same day took different directions (i.e., turtles of either the North or the Other group; Supplementary Table S1). For instance, among four turtles released on the 23rd of December 2011, three started their journey northward and one went southward (Supplementary Figure S1). The analysis of passive drifters shows that most drifters end up moving southward (Supplementary Figure S2), the few exceptions being when the drifters are released in the northernmost area and are likely trapped by the Northeast Madagascar Current and the East African Coastal Current (Schott et al., 2009).
3.2 Turtle behavior analysis
Using pooled data from the three turtle-habitat groups (NO, NN, OO), the HMM fitted with three states outperformed the one fitted with two states (AIC of the 2-state HMM = 63,825.84 vs AIC of the 3-state HMM = 62,511.28; ΔAIC = 1,314.56). The HMMs fitted separately for each turtle-habitat group outperformed the common model with pooled data (AIC of the common 3-state HMM = 62,511.28 vs AIC sum of the separate 3-state HMMs = 62,169.14; ΔAIC = 342.14). According to these HMMs, turtles of the North group make longer steps in oceanic habitats (Figure 2A) than in neritic ones (Figure 2C) and turtles of the Other group make the shortest steps (Figure 2E). In other words, turtles of the North group move faster during their oceanic phase, and this is the case for the three behavioral states (Table 2). When traveling (state 1), turtles of the North group move with much higher directionality in both habitats (Figures 2B, D) compared to the Other group (Figure 2F). When wandering (state 2) or foraging (state 3), turtles of the North group move with high directionality in oceanic habitats (Figure 2B) but their movements become more erratic when reaching the neritic zone (Figure 2D). Turtles of the Other group show intermediate values for these two states (Figure 2F), although the difference remains relatively small when foraging (Table 2).
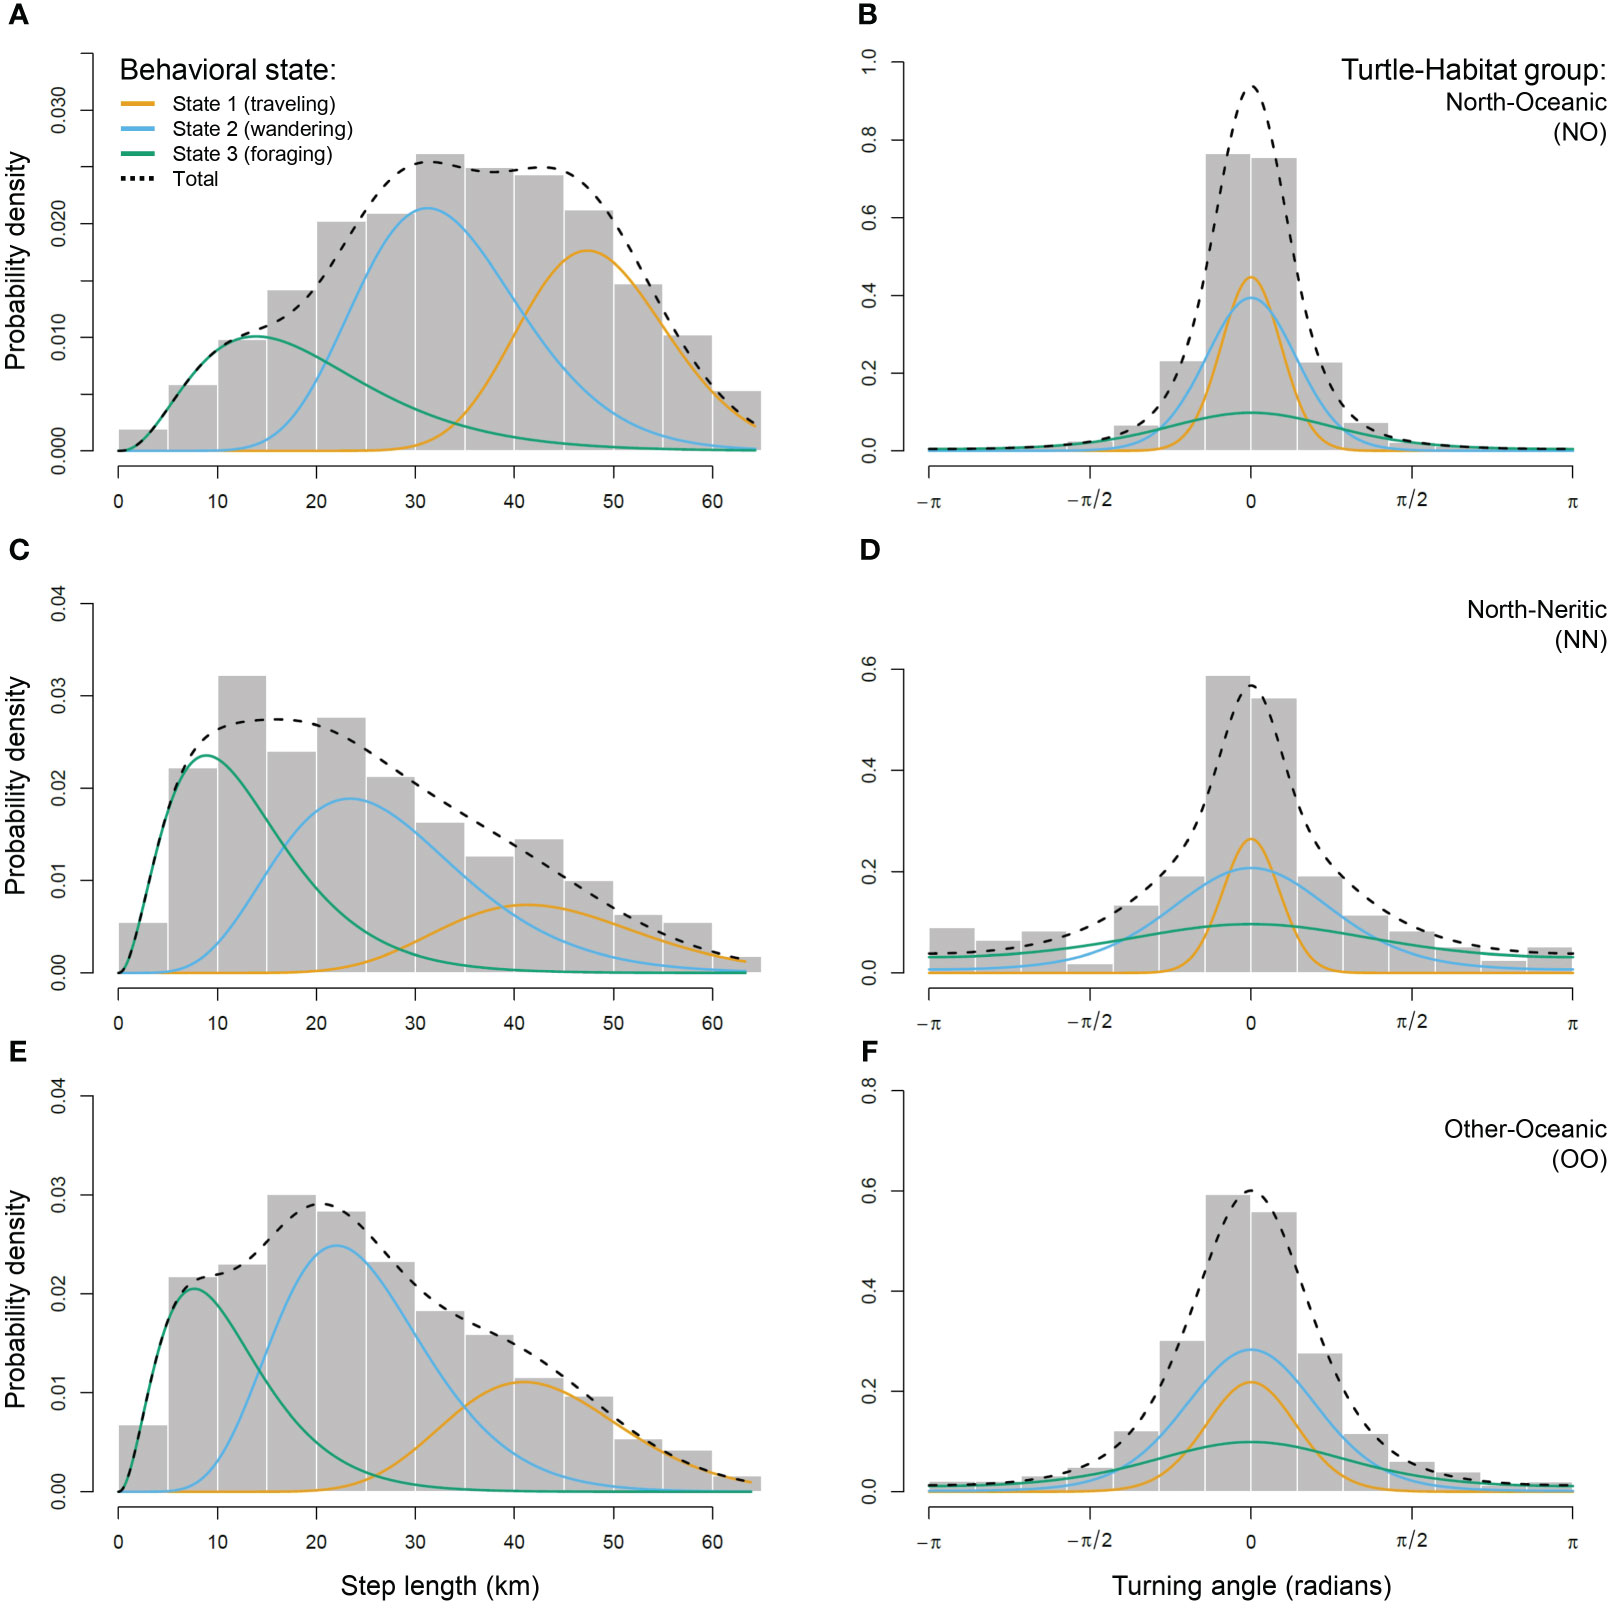
Figure 2 Movement characteristics of the three behavioral states estimated for each group of loggerhead turtles: North-Oceanic (NO; A, B), North-Neritic (NN; C, D) and Other-Oceanic (OO; E, F). Histograms show the distribution of daily step lengths (left panels) and turning angles (right panels). Solid lines show the estimated probability distribution for step lengths and turning angles for three behavioral states: State 1 assumed to be traveling behavior (orange), State 2 wandering behavior (light blue) and State 3 foraging behavior (green). Dashed lines show the estimated probability distribution for all step lengths or turning angles.
3.3 Oceanic and neritic habitats
The individuals were found traveling or wandering mostly between 30°S and 10°N (Figure 1C). Foraging locations occurred sporadically along the tracks and became more frequent in the Northern Hemisphere for turtles of the North group (Figure 1D) and between 40°S and 30°S for turtles of the Other group (Figure 1C). Turtles of the North group were found foraging mostly in the Somali Current and turtles of the Other group mostly in the Indian Ocean Gyre (Figure 3A). Most traveling and wandering locations were also found in these large oceanic areas, including the Indian Ocean Monsoon Gyre (Figures 3B, C). The Somali Current is the 5th most densely used area for foraging (Figure 3D), after the Gulf of Oman (1st), the Central Somali Coast (2nd), the Western Arabian Sea (3rd), and the Mascarene Islands (4th). Note that only four foraging locations were found in the small region of the Mascarene Islands, so this result must be taken with caution. Wandering and traveling locations were also found within the top-three foraging regions (Figure 1D). Interestingly, the Western Arabian Sea (3rd foraging region) hosts the highest density of wandering locations (Figure 3E) and the Gulf of Oman (1st foraging region) is one of the regions with the lowest density of traveling locations (Figure 3F). Note also the high density of wandering locations in the Seychelles (31 locations) and in the Northern Monsoon Current Coast (15 locations).
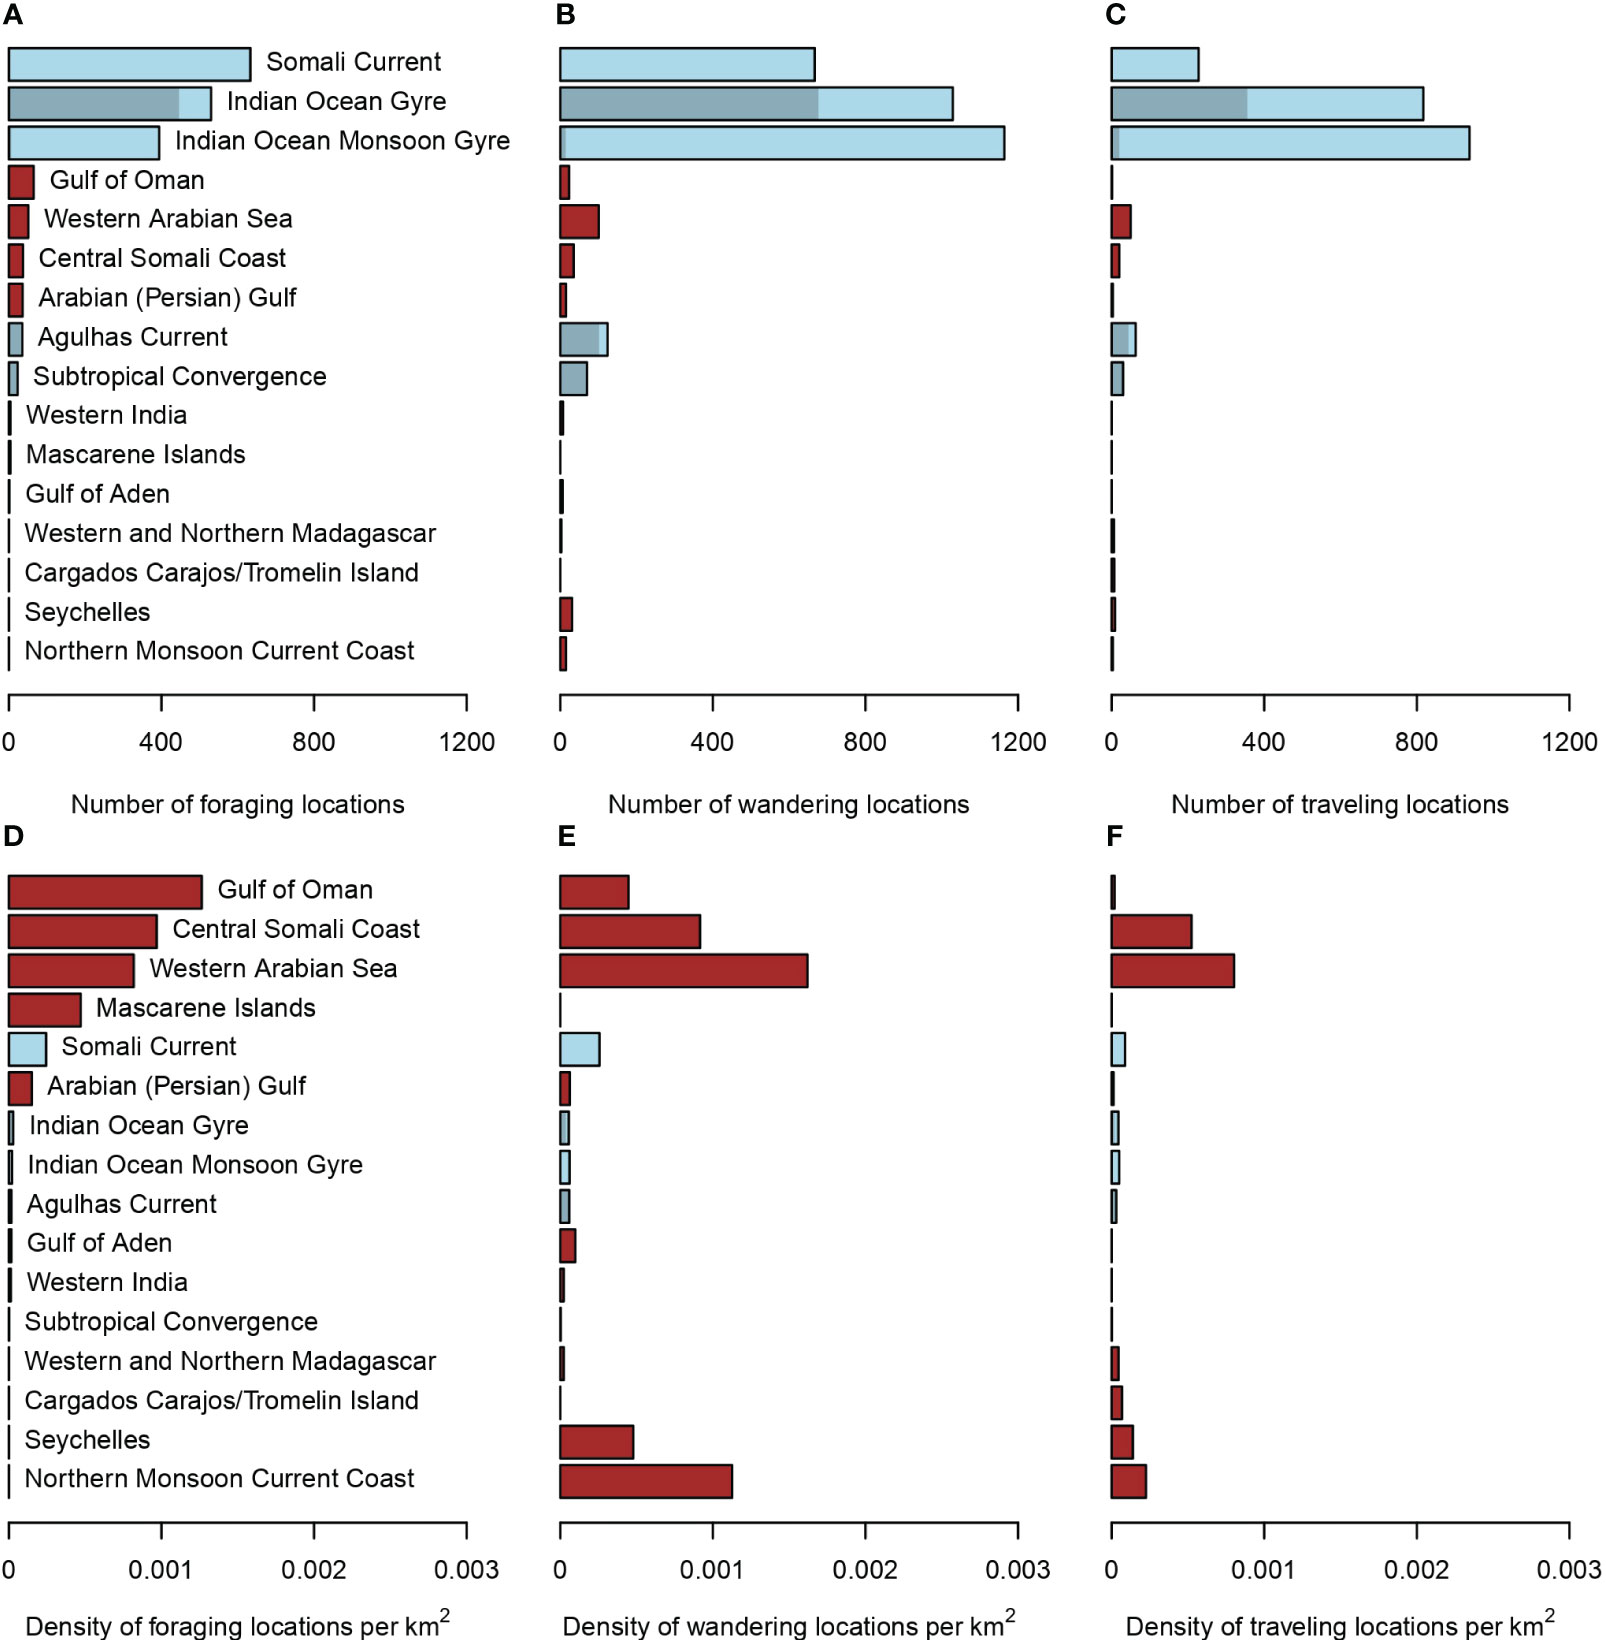
Figure 3 Number (A–C) and density (D–F) of foraging (A, D), wandering (B, E), and traveling (C, F) locations within marine ecoregions (MEOWs in dark red) and pelagic provinces (PPOWs in light blue). MEOWs are neritic habitats and PPOWs are oceanic habitats. Shaded areas in PPOWs show the proportion attributed to turtles of the Other group (MEOWs are not considered for this group).
3.4 Oceanographic conditions for the three behaviors
Turtles of the North group experienced warmer surface temperatures (mean = 27.6°C, min. = 20.6°C, max. = 33.1°C) compared to the Other group (mean = 22.5°C, min. = 14.6°C, max. = 29.7°C), similarly for the three behavioral states (Figure 4A). Within each turtle-habitat group, foraging was associated with higher net primary production than during traveling (Figure 4B). A similar pattern is observed for the biomass of micronekton (Figure 4C). For example, turtles of the North group in oceanic habitats were found foraging at a median biomass of micronekton of 1.97 g C m-2 (mean = 2.30 g C m-2, min. = 0.58 g C m-2, max. = 10.22 g C m-2), compared to 1.19 g C m-2 (mean = 1.39 g C m-2, min. = 0.53 g C m-2, max. = 7.83 g C m-2) when traveling. Note that turtles of the Other group were found foraging at locations with a higher median biomass of micronekton (3.49 g C m-2) compared to the North group in oceanic habitats. Details on statistical tests (Kruskal-Wallis and Moran’s I tests) for every compared pair (e.g., difference in surface temperature between NO-foraging and NN-foraging) are given in Supplementary Table S2. Statistically significant positive spatial autocorrelation was detected in all cases so all significant Kruskal-Wallis tests must be taken with caution. For example, surface temperature was found different between NO-foraging and NN-foraging (Kruskal-Wallis rank sum test, χ2 = 9.33, p-value = 0.002) but positive spatial autocorrelation was detected (Moran’s I = 0.134, p-value<0.001) meaning that the null hypothesis could have been falsely rejected. It is also important to put those results in an ecological context. In this example, the ecological relevance of the statistically detected difference in median surface temperatures (0.61°C) is questionable.
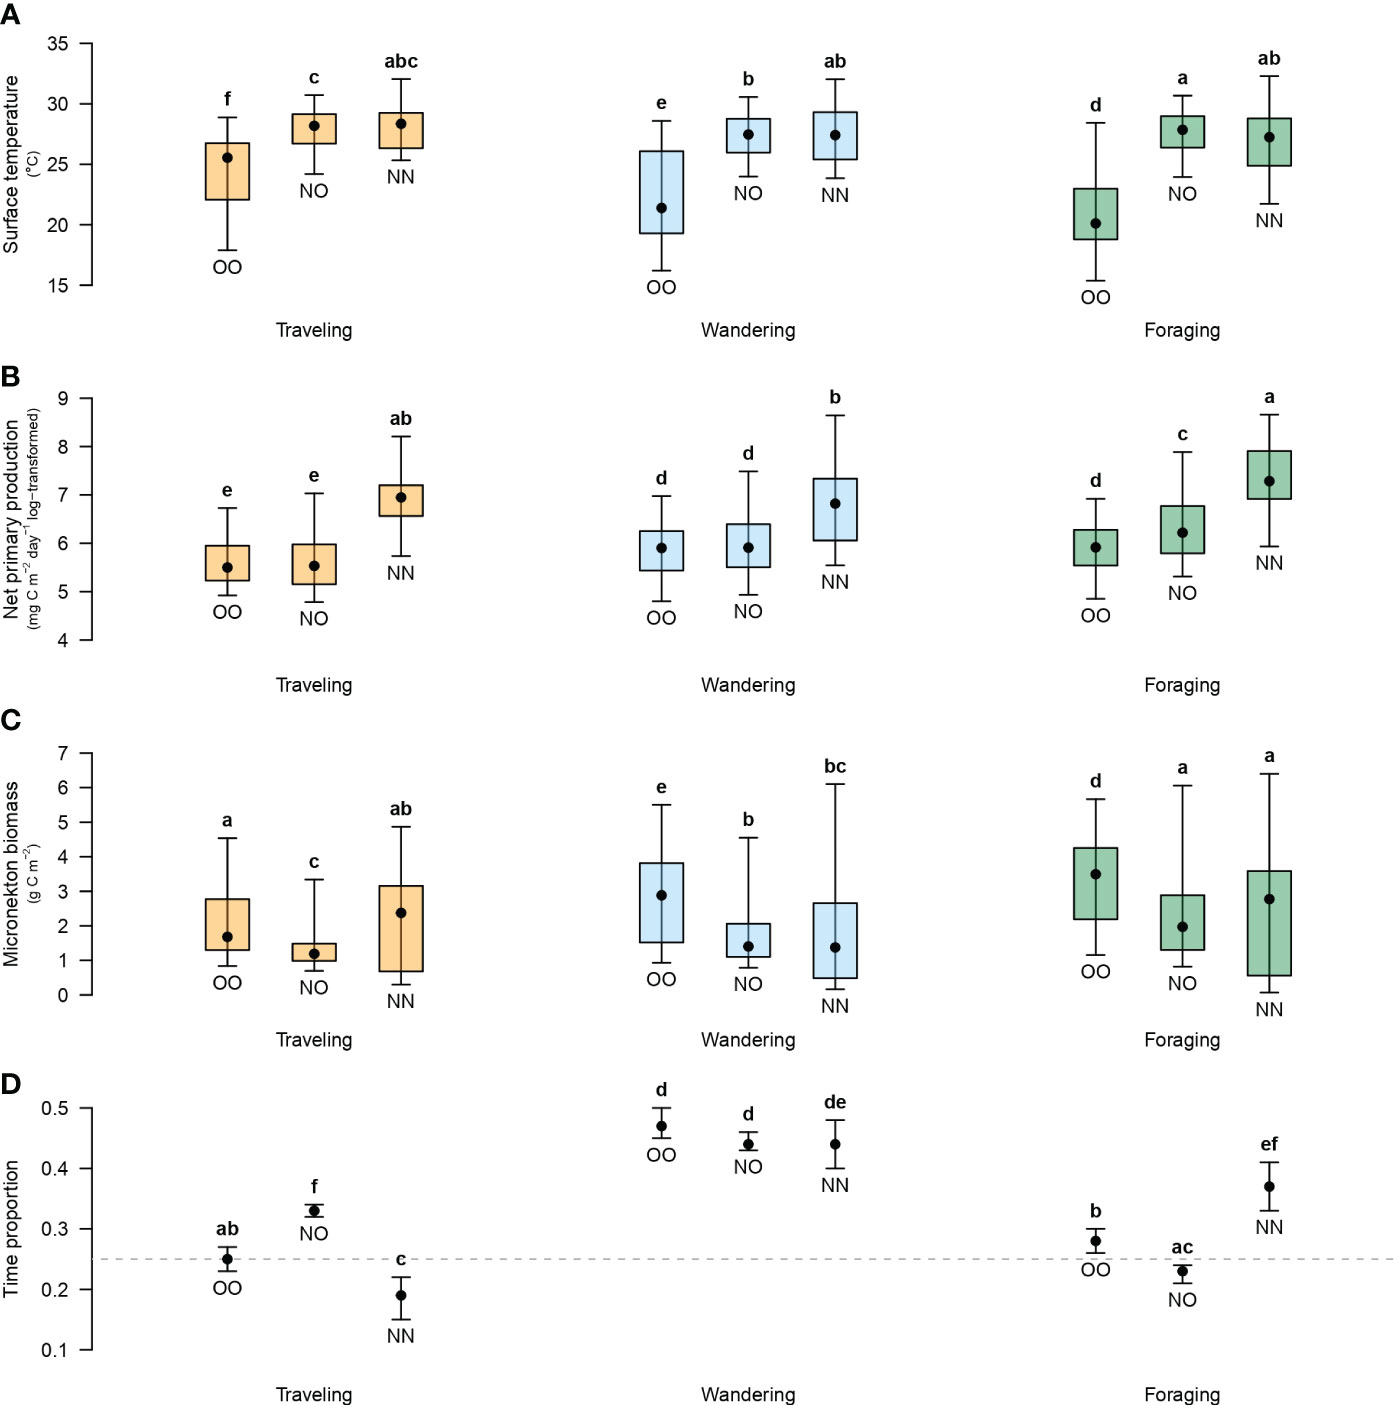
Figure 4 Oceanographic variables associated with traveling in orange, wandering in light blue, or foraging in green (A–C), and proportion of time spent in each behavioral state (D) for each turtle-habitat group: Other-Oceanic (OO), North-Oceanic (NO) and North-Neritic (NN). For oceanographic variables, black points are the median, error bars are the 2.5th and 97.5th percentiles, and boxes are the 25th and 75th percentiles. For time proportions, black points are the number of locations in one of the three states among the total number of locations within respective groups and error bars are confidence intervals assuming a binomial distribution. The grey dashed line indicates a proportion of 0.25. Letter codes indicate similarities among turtle-habitat groups and behavioral states based on p-values (details on statistical tests in Supplementary Table S2).
3.5 Time proportion allocated to the three behaviors
Turtles of the Other group allocate 25% of their time to traveling vs 33% for the North group in oceanic habitats (Figure 4D). Within neritic habitats, the proportion of time spent traveling is reduced to 19% and the difference (14%) is allocated to foraging, thereby increasing from 23% to 37%. The proportion of time spent wandering was similarly high (44% to 47%) for the three turtle-habitat groups. Details on statistical tests (Pearson’s chi-squared test) for every compared pair are given in Supplementary Table S2.
4 Discussion
Using tracking data of 67 loggerhead turtles, our study provides insights into the spatial and behavioral ecology of loggerhead turtles in the Indian Ocean, highlighting different movement characteristics depending on groups of individuals and encountered habitats. We show that some individuals, presumably still oceanic-stage juveniles, remained in the Southwestern Indian Ocean whereas most others engaged in a trans-equatorial migration toward the Northwestern Indian Ocean where we identified three potential foraging areas: the Gulf of Oman, the Central Somali Coast, and the Western Arabian Sea.
4.1 Do loggerhead turtles exhibit different movement characteristics depending on their target destination and habitat?
We found that movement characteristics of the turtles studied here differ depending on their suspected target destination (north vs other directions) and habitat (oceanic vs neritic). This suggests that turtles of the North group aimed for a precise location because they traveled fast with highly directed movements compared to turtles of the Other group. When reaching the neritic zone, mostly of Somali and the Arabian Peninsula, the individuals traveled more slowly but still with highly directed movements. This is probably due to topographical constraints when following a nearly straight coastline. On the other hand, turtles of the Other group traveled a bit more slowly and with much less directed movements. Given these striking differences between both groups, we can speculate that late juveniles aiming for the Northern Hemisphere were undertaking their ontogenetic migration to neritic habitats whereas the other individuals were still oceanic-stage juveniles.
Masirah Island, Sultanate of Oman, is the largest nesting population of loggerhead turtles in the Indian Ocean (Willson et al., 2020) and most juveniles bycaught in the Southwestern Indian Ocean and brought to Kelonia care center shared haplotypes found in the northwestern stock (Dalleau et al., 2016). It is therefore tempting to hypothesize that large individuals traveling to the Northern Hemisphere are attempting their first reproductive migration. Assuming this, traveling behavior must have different purposes depending on the group of turtles. Turtles of the North group clearly targeted the Arabian Peninsula whereas turtles of the Other group, or at least the seven individuals that went south, could rather be traveling here and there between patches of food resources. The movements associated to wandering or foraging behaviors for turtles of the North group were also highly directed (slowing down but without changing directions drastically) compared to the Other group or when reaching the neritic zone. This suggests two things for turtles of the North group: (1) wandering behavior is rather linked to navigation (i.e., searching for directions as opposed to searching for food) and (2) foraging behavior in oceanic habitats is opportunistic. As sea turtles are thought to rely on a crude map sense (Hays et al., 2022), they might take opportunities to re-evaluate their direction during their course (Hays et al., 2020; Luschi et al., 2020). This makes a ‘searching for directions’ behavior plausible. On the other hand, sea turtles are commonly considered to be capital breeders (Miller, 1997; Bonnet et al., 1998; Okuyama et al., 2016) so opportunistic feeding was unexpected. It is however possible that this behavior exists in neophyte breeders that need to invest more energy in location finding than experienced ones, although this has never been observed. Nevertheless, it is also possible that these turtles aimed for the Northwestern Indian Ocean for another reason than reproduction as they lacked external signs of sexual maturity. With this in mind, we add the ‘ontogenetic migration’ hypothesis, whereby the individuals would be traveling to neritic foraging areas to complete their development until sexual maturity, as a non-exclusive alternative to the ‘first reproductive migration’ hypothesis, whereby the individuals would be early adults with an oceanic foraging strategy (Hatase et al., 2013). This hypothesis is more likely here because all turtles of the North group were smaller (from 54 cm to 85 cm in Curved Carapace Length, CCL) than the average size of adult females nesting in Oman (mean CCL = 100.95 cm, min. = 94.5 cm, max. 108.5 cm; Rees et al., 2010).
4.2 What oceanic and neritic regions are explored and does their use depend on turtle behavior?
Wandering behavior in the Seychelles and the Northern Monsoon Current Coast could be attributed to ‘searching for directions’ as discussed previously because foraging was not observed and these shallow neritic areas were encountered on the way to the Arabian Peninsula. The Seychelles could have been a stopover for turtles that followed a quasi-straight line and the Northern Monsoon Current Coast for turtles that were probably pushed toward the Somali coast by the Northeast Madagascar Current (Schott et al., 2009). The three other neritic regions host the highest densities of foraging behavior but differ in their relative use: wandering in higher density than foraging in the Western Arabian Sea, foraging in higher density than wandering in the Gulf of Oman, and both behaviors in equivalent proportions in the Central Somali Coast. Given this, it is possible that the Western Arabian Sea and the Central Somali Coast are potential foraging areas where food is either less abundant or sparser, in space and time, than in the Gulf of Oman. The latter is also a region where traveling was found in very low density. This suggests that turtles are likely to stay foraging in this area, although they could also enter or exit it while searching for prey in the neighboring oceanic region, the Somali Current, where most foraging locations of the North group were found.
During summer monsoon, strong winds blowing southwesterly induce intense upwelling along the Arabian and Somali coasts (Schott et al., 2009; Trott et al., 2017). With offshore currents supplying upwelled nutrients and the resulting phytoplankton biomass to the open ocean, this makes the Arabian Sea one of the most productive region worldwide (Lévy et al., 2007; Kumar et al., 2010; Lakshmi et al., 2020). The loggerhead turtles tagged in this study used this area extensively to forage, in both oceanic and neritic habitats. Therefore, it is also possible that some individuals, provided that they were actually adults, were caught by fisheries on their way from their breeding site to known foraging areas, or reversibly. Loggerhead turtles exhibit high fidelity to foraging areas where they typically return after the breeding season (e.g., Schofield et al., 2010; Hart et al., 2012; Evans et al., 2019). This possibility could find support if the presumed adults were young females on their way to or from nesting sites located in the Southwestern Indian Ocean. Nevertheless, it is unlikely because all but one individuals were identified as late juveniles with no statistically significant difference in carapace length between the North and the Other group. In this case, the ‘ontogenetic migration’ hypothesis is more likely and our study reveals that the Omani coast is both an important foraging and breeding area, as suspected by Rees et al. (2010) based on 10 adult females of the same species tracked during their post-nesting migration from Masirah Island. Juvenile loggerhead turtles recruit to neritic habitats at smaller size (in Straight Carapace Length, SCL) in the North Atlantic (mean = 54.2 cm SCL; Ramirez et al., 2015) and Pacific (mean = 63.23 cm SCL; Turner Tomaszewicz et al., 2017) compared to the individuals tagged in this study (mean = 66.37 cm SCL); using the formula in Snover et al. (2010) for conversion from Curved Carapace Length (CCL). This provides additional support to the ‘ontogenetic migration’ hypothesis for the individuals traveling to the Northwestern Indian Ocean but leaves an open question for further research: Assuming they never explored this area as late juveniles, how do individuals undertaking such a migration ‘know’ that there are food resources available at their target destination that is presumably their natal area?
The six individuals of the Other group that were tracked between 30°S and 40°S were found foraging and traveling in equivalent proportions in the Agulhas Current and Subtropical Convergence regions, probably seeking prey near the cold, productive waters of the Benguala Current and the Subtropical Front (Froneman et al., 1999; Hutchings et al., 2009). These individuals represent an ideal ‘control’ group because they still behave like oceanic-stage juveniles as our results suggest. More data on such individuals, including telemetry and genetics, will undoubtedly help future research resolve the phylogeography of loggerhead turtles in the entire Indian Ocean.
4.3 Do turtles experience different environmental conditions depending on their target destination, habitat, and behavior?
Turtles of the Other group were found foraging in waters associated with higher biomass of potential food resource compared to the North group in both neritic and oceanic habitats. This suggests that these individuals traveled actively between food patches that probably emerged temporally from meso- to submeso-scale processes, such as eddies, fronts or filaments. Previous studies have shown that juvenile loggerhead turtles use meso-scale eddies to forage, presumably with different strategies depending on the region (e.g., Gaube et al., 2017; Chambault et al., 2019). Understanding the precise role of these oceanic features in the foraging ecology of juvenile loggerhead turtles was beyond the scope of our study, but we encourage further research to investigate this in the Western Indian Ocean. Turtles of the North group, as they explored the warmer oceanic waters of the Northwestern Indian Ocean, were found foraging at locations associated with comparatively lower biomass of micronekton. This can be due to two non-exclusive reasons: (1) food is more scattered in this region and (2) the individuals did not actively seek potential prey. However, when considering locations independently in the Northern and the Southern Hemisphere, the biomass of micronekton remained invariably low in the Southern Hemisphere and no statistically significant difference was found between turtles of the North group that passed the equator and turtles of the Other group (Figure 5). Therefore, turtles of the North group could actually behave like the Other group in the productive waters of the Arabian Sea. In the neritic zone, turtles were found traveling and foraging at locations associated with similarly high biomass of micronekton. This suggests either that traveling behavior is not triggered to find food or that they rely more on benthic species of which biomass is not predicted by the LMTL-SEAPODYM model that focuses on the pelagic foodweb (Lehodey et al., 2010).
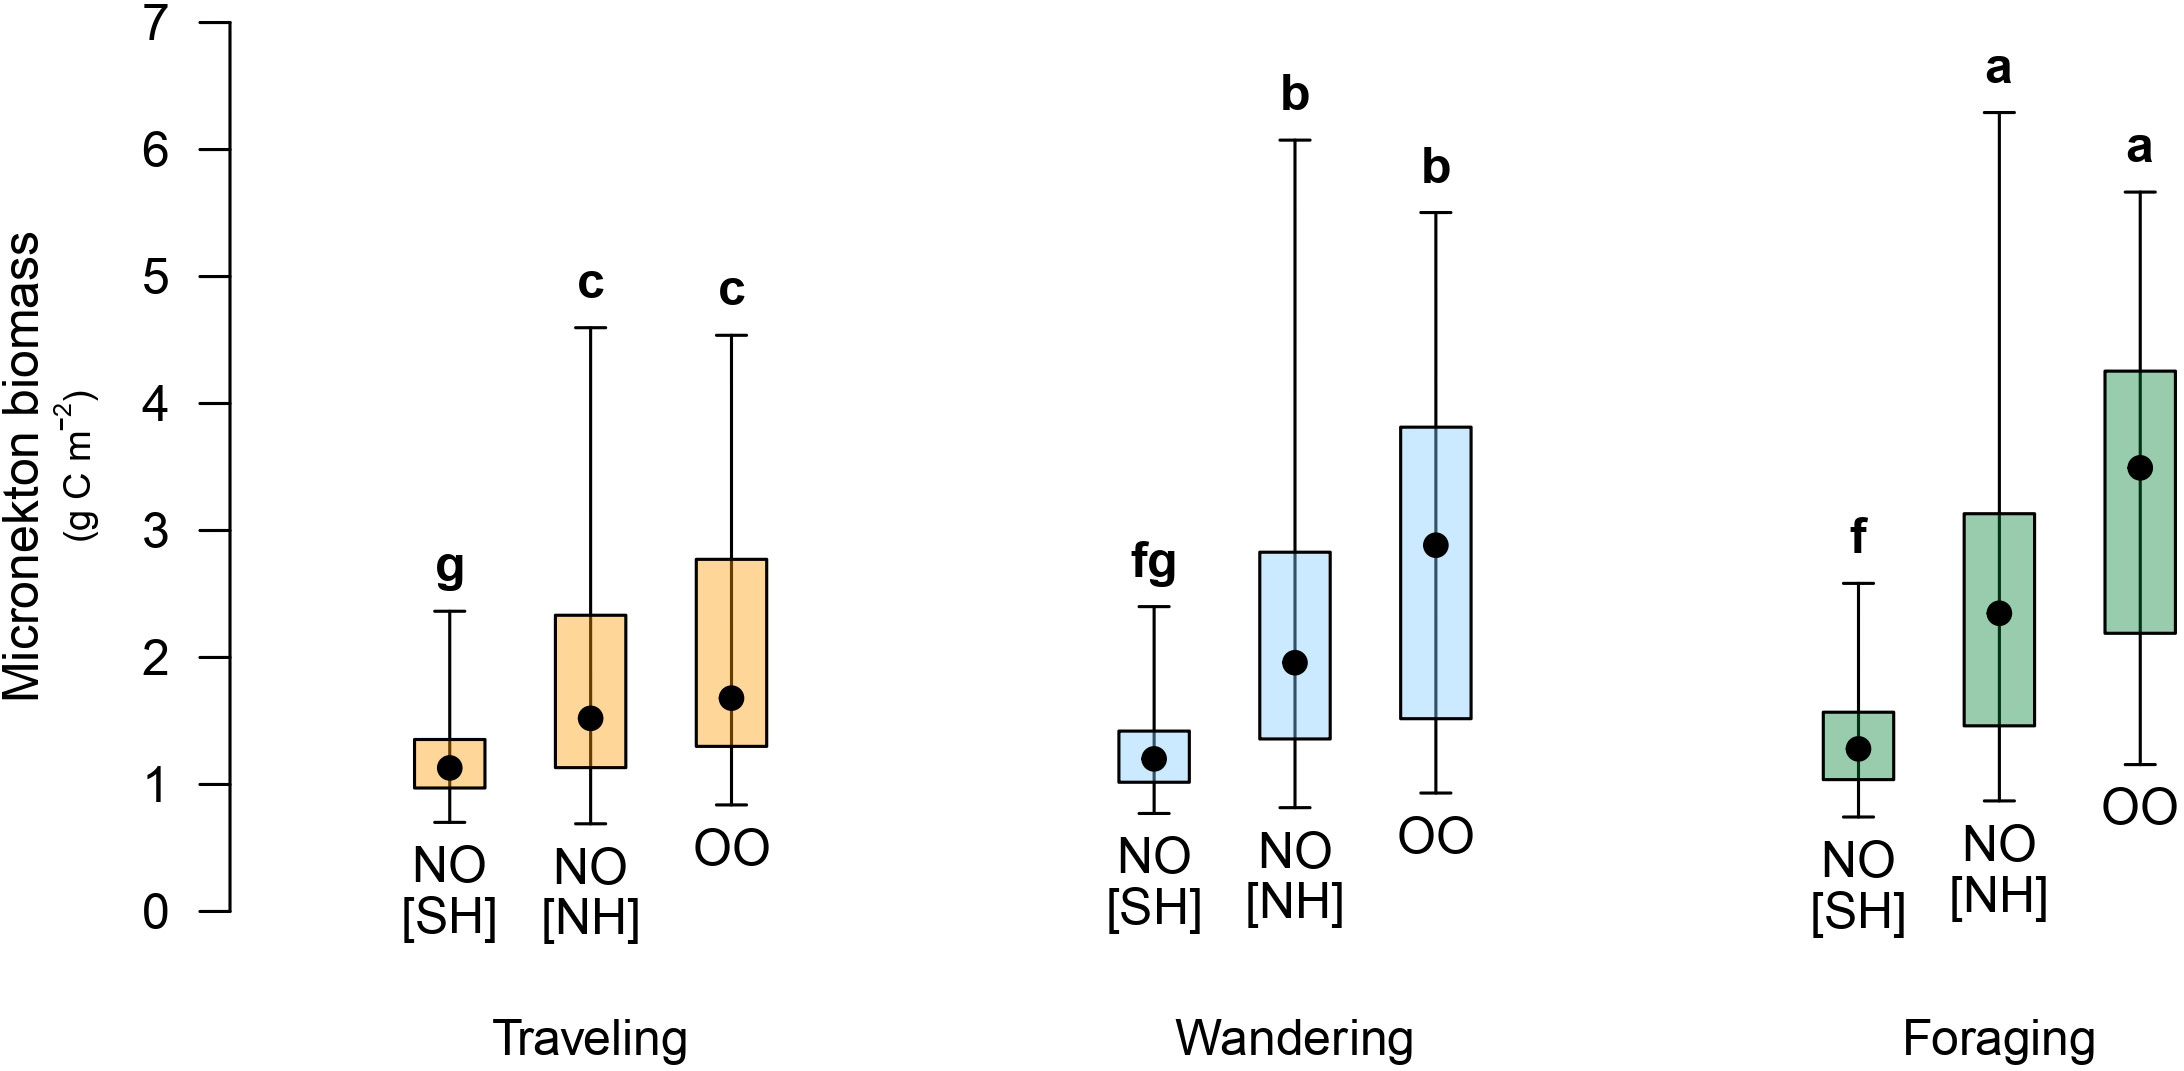
Figure 5 Micronekton biomass associated with traveling in orange, wandering in light blue, or foraging in green for turtles of the Other-Oceanic group (OO) and the North-Oceanic group (NO) in the Southern Hemisphere [SH] or the Northern Hemisphere [NH]. Black points are the median, error bars are the 2.5th and 97.5th percentiles, and boxes are the 25th and 75th percentiles. Letter codes indicate similarities among turtle-habitat groups and behavioral states based on p-values (details on statistical tests in Supplementary Table S2).
4.4 Do turtles allocate similar proportions of time to each behavior depending on their target destination and habitat?
We found that turtles of the Other group allocated equivalent times to traveling and foraging (ca. 25%). On the other hand, turtles of the North group spent more time traveling during their oceanic phase and allocated more time to foraging (37%) than traveling (19%) in neritic habitats. Given this reversal in time allocation, it is possible that these individuals realized an ontogenetic shift from oceanic juveniles to neritic adults as commonly observed in this species (e.g., Marshall et al., 2012; Ramirez et al., 2017) but also in Green (Chelonia mydas) and Hawksbill (Eretmochelys imbricata) turtles (Stringell et al., 2016). Nevertheless, it is important to note that such a shift could be progressive, reversed or never accomplished in loggerhead turtles, as studies in both adults and juveniles revealed the co-existence of both neritic and oceanic foraging strategies within the same population (e.g., McClellan et al., 2010; Hatase et al., 2013). This could have far-reaching conservation implications, as it would substantiate the ecological importance of Somali and Arabian coasts, and more generally the entire Arabian Sea, for loggerhead turtles (Rees et al., 2010). We encourage further studies, combining telemetry, skeletochronology and stable isotope analysis (e.g., Ceriani et al., 2012; Turner Tomaszewicz et al., 2017; Haywood et al., 2020), to investigate loggerhead turtle ontogenetic habitat shifts and identify core foraging areas in the Northwestern Indian Ocean.
4.5 Limitations
This study provides valuable insights into the behavioral ecology of loggerhead turtles but several limitations must be considered. We used modelled-derived oceanographic data that are inherently prone to uncertainties. For example, behavioral states can be misidentified where there is poor agreement between modelled surface currents and the ones turtles really experienced. In addition, we did not account for diving profiles as such data were unavailable for most tracked individuals. Accounting for diving behavior would allow for a better estimation of active motion, especially if there is a strong vertical gradient in current velocities within the range of depths used by turtles. Moreover, the ecological significance of daily step lengths derived from current-correct tracks is questionable because it represents virtual distances at coarse temporal resolution. Using measures of energy expenditure instead, for example derived from dynamic body acceleration data (e.g., Fossette et al., 2012), would be more appropriate to infer behavioral states. In combination with acceleration data, 3D movements obtained at finer temporal resolution would be more suited to identify when turtles are searching for food or directions, foraging on benthic vs pelagic species, and resting or breeding (e.g., Chimienti et al., 2020; Jeantet et al., 2020). Finally, the reason why transmission was lost prematurely for some turtles remains obscure. Given the short tracking duration, it is unlikely that the tags stopped relaying data because of biofouling or battery exhaustion. On the other hand, it is possible that the turtles died (e.g., predation or bycatch in fisheries) and sunk. If they were floating (dead or moribund), we would have detected a sharp increase in the reception of locations (Hays et al., 2021). We did not see such an increase for any of the 67 individuals tagged (Supplementary Figure S3) so it is very unlikely that the tracks contain unusual behavior at the surface.
4.6 Conclusions
- Different behaviors. This study highlights differences in three behavioral states (traveling, wandering, and foraging) and associated environmental parameters (temperature and potential prey) among groups of loggerhead turtles defined based on their target destination and encountered habitats. We show that most individuals migrated toward the Arabian Peninsula with highly directed movements whereas the others explored the Southern Hemisphere with slower and less directed movements. This reveals different strategies of habitat use among individuals of similar sizes.
- Key foraging areas. Subsequently, we ranked oceanic and neritic regions based on inferred behaviors and discussed their potential importance in the life cycle and foraging ecology of loggerhead turtles. Our results identified potentially important foraging areas in the Arabian Sea, which warrant consideration for the conservation of loggerhead turtles.
- Ontogenetic migration. Our results suggest that most individuals undertook an ontogenetic migration to neritic foraging areas while the others, despite of similar sizes, continued to behave like oceanic-stage juveniles. It is still unclear whether the individuals that traveled to the Arabian Sea attempted to breed or were driven there primarily to complete their development. In either case, this substantiates the ecological importance of this region for loggerhead turtles as it hosts both important nesting and foraging areas.
- Perspective. This study enabled identifying locations where turtles are likely foraging, which will allow further studies to address the following question: Where and when do oceanic foraging areas emerge? Habitat modelling applied to our data, for instance via machine learning algorithms (Chambault et al., 2021a), holds promise for bycatch mitigation using spatial predictions in near-real time (e.g., Hazen et al., 2018).
Data availability statement
The datasets presented in this study can be found in the online repository FigShare: https://doi.org/10.6084/m9.figshare.22592386.
Ethics statement
The animal study was reviewed and approved by the Ethics committee of Reunion Island #114, managed by the user establishment CYROI (Cyclotron Réunion Océan Indien, 2 rue Maxime Rivière, 97490 Sainte-Clotilde, Reunion).
Author contributions
OB, PG, SC, CJ, KB, MD, RC, SB, and JB contributed to conception and design of the study. AB and AL organized the database. JM and AL performed the statistical analysis. JM wrote the manuscript. All authors contributed to manuscript revision, read, and approved the submitted version.
Funding
This study was conducted as part of a postdoctoral research project funded by Ifremer. STORM data were collected within the frame of research projects PreSTORM (CNRS/LEFE), STORM-SAT (CNES/TOSCA) and STORM-IO (INTERREG-V Indian Ocean 2014-2020). Other data were collected under the PhD thesis of Mayeul Dalleau and the rehabilitation program of Kelonia care center (funded by the Regional Council of Reunion Island, Credit Agricole Foundation, RSS/SWIOFP/IRD) and the COCA-LOCA project (BEST, UE/AFD/IUCN).
Acknowledgments
We thank fishery observers from the Portuguese Institute for the Ocean and Atmosphere (IPMA) for deploying tags on loggerhead bycaught by Portuguese longliners in the southern part of the study, that were on missions from the National Program for Biological Sampling (PNAB) within the EU Data Collection Framework (EU/DCF). We thank Julien Temple-Boyer from Mercator Ocean for participating in the development of the python module to correct tracking data for ocean currents and extract oceanographic variables including the calculation of the total biomass of micronekton. For rescuing and taking care of the turtles, we thank Mathieu Barret and all the staff of the Kelonia Sea Turtle care center as well as Francis Schneider and his veterinary team for surgical operations and medical care. We are also grateful to all the longline fishermen of the Reunion fleet for their involvement in sea turtle conservation by bringing them to the care center. This study was approved by the ethic committee of Reunion Island #114, managed by the user establishment CYROI (Cyclotron Réunion Océan Indien, 2 rue Maxime Rivière, 97490 Sainte-Clotilde, Reunion), following the French territory’s legal requirements concerning the activities of a rescue center (permit numbers: 09-1405/SG/DRCTCV and DEAL/SEB/UBIO/2019-13). The French territory’s legal requirements do not apply to sea turtle external tagging with Argos Platform Terminal Transmitters. Therefore, an ethical review and the authorization by the French Ministry of Higher Education and Research were not required.
Conflict of interest
The authors declare that the research was conducted in the absence of any commercial or financial relationships that could be construed as a potential conflict of interest.
Publisher’s note
All claims expressed in this article are solely those of the authors and do not necessarily represent those of their affiliated organizations, or those of the publisher, the editors and the reviewers. Any product that may be evaluated in this article, or claim that may be made by its manufacturer, is not guaranteed or endorsed by the publisher.
Supplementary material
The Supplementary Material for this article can be found online at: https://www.frontiersin.org/articles/10.3389/fmars.2023.1204664/full#supplementary-material
Supplementary Table 1 | Information on the 67 satellite-tracked loggerhead turtles.
Supplementary Table 2 | Details on statistical tests presented in Figures 4 and 5.
Supplementary Figure 3 | Number of Argos locations received per day for each turtle.
References
Benjamini Y., Yekutieli D. (2001). The control of the false discovery rate in multiple testing under dependency. Ann. Statistics 29, 1165–1188. doi: 10.1214/aos/1013699998
Bjorndal K. A., Bolten A. B., Dellinger T., Delgado C., Martins H. R. (2003). Compensatory growth in oceanic loggerhead sea turtles: Response to a stochastic environment. Ecology 84 (5), 1237–1249. doi: 10.1890/0012-9658(2003)084[1237:CGIOLS]2.0.CO;2
Bolten A. B. (2003). “Variation in sea turtle life history patterns: neritic vs. Oceanic developmental stages,” in The Biology of Sea Turtles (Vol. II), vol. 2 . Eds. Lutz P. L., Musick J. A., Wyneken J. (Boca Raton, FL: CRC Press), 243–257.
Bonnet X., Bradshow D., Shine R. (1998). Capital versus income breeding: an ectothermic perspective. Oikos 83 (2), 333–342. doi: 10.2307/3546846
Bousquet O., Dalleau M., Bocquet M., Gaspar P., Bielli S., Ciccione S., et al. (2020). Sea turtles for ocean research and monitoring: overview and initial results of the STORM project in the southwest Indian ocean. Front. Mar. Sci. 7. doi: 10.3389/fmars.2020.594080
Bowen B. W., Bass A. L., Chow S.-M., Bostrom M., Bjorndal K. A., Bolten A. B., et al. (2004). Natal homing in juvenile loggerhead turtles (Caretta caretta). Mol. Ecol. 13 (12), 3797–3808. doi: 10.1111/j.1365-294X.2004.02356.x
Burnham K. P., Anderson D. R. (2002). Model selection and multimodel inference: A practical information-theoretic approach (New York: Springer-Verlag).
Ceriani S. A., Roth J. D., Evans D. R., Weishampel J. F., Ehrhart L. M. (2012). Inferring foraging areas of nesting loggerhead turtles using satellite telemetry and stable isotopes. PloS One 7 (9), e45335. doi: 10.1371/journal.pone.0045335
Chambault P., Baudena A., Bjorndal K. A., Santos M. A. R., Bolten A. B., Vandeperre F. (2019). Swirling in the ocean: Immature loggerhead turtles seasonally target old anticyclonic eddies at the fringe of the North Atlantic gyre. Prog. Oceanography 175, 345–358. doi: 10.1016/j.pocean.2019.05.005
Chambault P., Fossette S., Heide-Jørgensen M. P., Jouannet D., Vély M. (2021a). Predicting seasonal movements and distribution of the sperm whale using machine learning algorithms. Ecol. Evol. 11 (3), 1432–1445. doi: 10.1002/ece3.7154
Chambault P., Gaspar P., Dell’Amico F. (2021b). Ecological trap or favorable habitat? first evidence that immature Sea turtles may survive at their range-limits in the north-East Atlantic. Front. Mar. Sci. 8. doi: 10.3389/fmars.2021.736604
Chimienti M., Blasi M. F., Hochscheid S. (2020). Movement patterns of large juvenile loggerhead turtles in the Mediterranean Sea: Ontogenetic space use in a small ocean basin. Ecol. Evol. 10, 6978–6992. doi: 10.1002/ece3.6370
Conners M. G., Sisson N. B., Agamboue P. D., Atkinson P. W., Baylis A. M. M., Benson S. R., et al. (2022). Mismatches in scale between highly mobile marine megafauna and marine protected areas. Front. Mar. Sci. 9. doi: 10.3389/fmars.2022.897104
Dale M. R. T., Fortin M.-J. (2002). Spatial autocorrelation and statistical tests in ecology. Ecoscience 9 (2), 162–167. doi: 10.1080/11956860.2002.11682702
Dalleau M. (2013). Ecologie spatiale des tortues marines dans le sud-ouest de l’océan indien: Apport de la géomatique et de la modélisation pour la conservation. Ph.D. Thesis. (Saint-Denis, La Réunion, France: Université de la Réunion). Available at: https://theses.hal.science/tel-02172111.
Dalleau M., Benhamou S., Sudre J., Ciccione S., Bourjea J. (2014). The spatial ecology of juvenile loggerhead turtles (Caretta caretta) in the Indian Ocean sheds light on the “lost years” mystery. Mar. Biol. 161, 1835–1849. doi: 10.1007/s00227-014-2465-z
Dalleau M., Hoarau L., Lalire M., Gaspar P., Tardy C., Jaquemet S., et al. (2016). COCA LOCA. Connectivity of the loggerhead turtle (Caretta caretta) in the western Indian ocean: implementation of local and regional management. Rap. Sci. 161, 1835–1849.
Dawson T. M., Formia A., Agamboué P. D., Asseko G. M., Boussamba F., Cardiec F., et al. (2017). Informing marine protected area designation and management for nesting olive ridley sea turtles using satellite tracking. Front. Mar. Sci. 4. doi: 10.3389/fmars.2017.00312
Evans D. R., Carthy R. R., Ceriani S. A. (2019). Migration routes, foraging behavior, and site fidelity of loggerhead sea turtles (Caretta caretta) satellite tracked from a globally important rookery. Mar. Biol. 166, 134. doi: 10.1007/s00227-019-3583-4
Fossette S., Schofield G., Lilley M. K. S., Gleiss A. C., Hays G. C. (2012). Acceleration data reveal the energy management strategy of a marine ectotherm during reproduction. Funct. Ecol. 26 (2), 324–333. doi: 10.1111/j.1365-2435.2011.01960.x
Frick M. G., Williams K. L., Bolten A. B., Bjorndal K. A., Martins H. R. (2009). Foraging ecology of oceanic-stage loggerhead turtles Caretta caretta. Endang Species Res. 9, 91–97. doi: 10.3354/esr00227
Froneman P. W., McQuaid C. D., Laubscher R. K. (1999). Size-fractionated primary production studies in the vicinity of the subtropical front and an adjacent warm-core eddy south of Africa in austral winter. J. Plankton Res. 21 (11), 2019–2035. doi: 10.1093/plankt/21.11.2019
Gaspar P., Georges J.-Y., Fossette S., Lenoble A., Ferraroli S., Maho Y. L. (2006). Marine animal behaviour: neglecting ocean currents can lead us up the wrong track. Proc. R. Soc. B-Biological Sci. 273, 2697–2702. doi: 10.1098/rspb.2006.3623
Gaube P., Barceló C., McGillicuddy D. J. Jr, Domingo A., Miller P., Giffoni B., et al. (2017). The use of mesoscale eddies by juvenile loggerhead sea turtles (Caretta caretta) in the southwestern Atlantic. PloS One 12 (3), e0172839. doi: 10.1371/journal.pone.0172839
Giraudoux P. (2022). “Pgirmess: Spatial analysis and data mining for field ecologists (Version 2.0.0),” (The Comprehensive R Archive Network). Available at: https://CRAN.R-project.org.
Graves S., Piepho H.-P., Selzer L. (2019). “multcompView: Visualizations of paired comparisons (Version 0.1-8),” (The Comprehensive R Archive Network). Available at: https://CRAN.R-project.org.
Guzman H. M., Rogers G., Gomez C. G. (2019). Behavioral states related to environmental conditions and fisheries during olive ridley turtle migration from pacific Panama. Front. Mar. Sci. 6. doi: 10.3389/fmars.2019.00770
Hart K. M., Lamont M. M., Fujisaki I., Tucker A. D., Carthy R. R. (2012). Common coastal foraging areas for loggerheads in the gulf of Mexico: Opportunities for marine conservation. Biol. Conserv. 145 (1), 185–194. doi: 10.1016/j.biocon.2011.10.030
Hatase H., Omuta K., Tsukamoto K. (2013). A mechanism that maintains alternative life histories in a loggerhead sea turtle population. Ecology 94 (11), 2583–2594. doi: 10.1890/12-1588.1
Hawkes L. A., Broderick A. C., Coyne M. S., Godfrey M. H., Lopez-Jurado L. F., Lopez-Suarez P., et al. (2006). Phenotypically linked dichotomy in sea turtle foraging requires multiple conservation approaches. Curr. Biol. 16 (10), 990–995. doi: 10.1016/j.cub.2006.03.063
Hays G. C., Atchison-Balmond N., Cerritelli G., Laloë J.-O., Luschi P., Mortimer J. A., et al. (2022). Travel routes to remote ocean targets reveal the map sense resolution for a marine migrant. J. R. Soc Interface 19, 20210859. doi: 10.1098/rsif.2021.0859
Hays G. C., Cerritelli G., Esteban N., Rattray A., Luschi P. (2020). Open ocean reorientation and challenges of island finding by sea turtles during long-distance migration. Curr. Biol. 30 (16), 3236–3242. doi: 10.1016/j.cub.2020.05.086
Hays G. C., Hawkes L. A. (2018). Satellite tracking sea turtles: opportunities and challenges to address key questions. Front. Mar. Sci. 5. doi: 10.3389/fmars.2018.00432
Hays G. C., Laloë J.-O., Rattray A., Esteban N. (2021). Why do Argos satellite tags stop relaying data? Ecol. Evol. 11, 7093–7101. doi: 10.1002/ece3.7558
Haywood J. C., Fuller W. J., Godley B. J., Margaritoulis D., Shutler J. D., Snape R. T., et al. (2020). Spatial ecology of loggerhead turtles: Insights from stable isotope markers and satellite telemetry. Divers. Distrib 26 (3), 368–381. doi: 10.1111/ddi.13023
Hazen E. L., Scales K. L., Maxwell S. M., Briscoe D. K., Welch H., Bograd S. J., et al. (2018). A dynamic ocean management tool to reduce bycatch and support sustainable fisheries. Sci. Adv. 4 (5), eaar3001. doi: 10.1126/sciadv.aar3001
Hussey N. E., Kessel S. T., Aarestrup K., Cooke S. J., Cowley P. D., Fisk A. T., et al. (2015). Aquatic animal telemetry: A panoramic window into the underwater world. Science 348, 1255642. doi: 10.1126/science.1255642
Hutchings L., Lingen C. D., Shannon L. J., Crawford R. J. M., Verheye H. M. S., Bartholomae C. H., et al. (2009). The benguela current: An ecosystem of four components. Prog. Oceanography 83 (1-4), 15–32. doi: 10.1016/j.pocean.2009.07.046
Jeantet L., Planas-Bielsa V., Benhamou S., Geiger S., Martin J., Siegwalt F., et al. (2020). Behavioural inference from signal processing using animal-borne multi-sensor loggers: a novel solution to extend the knowledge of sea turtle ecology. R. Soc Open Sci. 7, 200139. doi: 10.1098/rsos.200139
Jonsen I. D., Grecian W. J., Phillips L., Carroll G., McMahon C., Harcourt R. G., et al. (2023). aniMotum, an R package for animal movement data: Rapid quality control, behavioural estimation and simulation. Methods Ecol. Evol. 14 (3), 806–816. doi: 10.1111/2041-210X.14060
Jonsen I. D., Patterson T., Grecian W. J. (2021) aniMotum: fit latent variable movement models to animal tracking data for location quality control and behavioural inference (Version 0.7-6). Available at: https://zenodo.org/:Zenodo.
Kinoshita C., Fukuoka T., Narazaki T., Niizuma Y., Sato K. (2021). Analysis of why sea turtles swim slowly: a metabolic and mechanical approach. J. Exp. Biol. 224 (4), jeb236216. doi: 10.1242/jeb.236216
Kot C. Y., Åkesson S., Alfaro-Shigueto J., Llanos D. F. A., Antonopoulou M., Balazs G. H., et al. (2022). Network analysis of sea turtle movements and connectivity: A tool for conservation prioritization. Diversity Distributions 28 (4), 810–829. doi: 10.1111/ddi.13485
Kumar S. P., Roshin R. P., Narvekar J., Kumar P. K. D., Vivekanandan E. (2010). What drives the increased phytoplankton biomass in the Arabian Sea? Curr. Sci. 99 (1), 101–106. Available at: http://www.jstor.org/stable/24108356.
Lakshmi R. S., Chatterjee A., Prakash S., Mathew T. (2020). Biophysical interactions in driving the summer monsoon chlorophyll bloom off the Somalia coast. JGR Oceans 125 (3), e2019JC015549. doi: 10.1029/2019JC015549
Lehodey P., Conchon A., Senina I., Domokos R., Calmettes B., Jouanno J., et al. (2015). Optimization of a micronekton model with acoustic data. ICES J. Mar. Sci. 72 (5), 1399–1412. doi: 10.1093/icesjms/fsu233
Lehodey P., Murtugudde R., Senina I. (2010). Bridging the gap from ocean models to population dynamics of large marine predators: A model of mid-trophic functional groups. Prog. Oceanography 84 (1–2), 69–84. doi: 10.1016/j.pocean.2009.09.008
Lehodey P., Senina I., Murtugudde R. (2008). A spatial ecosystem and populations dynamics model (SEAPODYM) – modeling of tuna and tuna-like populations. Prog. Oceanography 78, 304–318. doi: 10.1016/j.pocean.2008.06.004
Lellouche J.-M., Greiner E., Bourdallé-Badie R., Garric G., Melet A., Drévillon M., et al. (2021). The Copernicus global 1/12° oceanic and Sea ice GLORYS12 reanalysis. Front. Earth Sci. 9. doi: 10.3389/feart.2021.698876
Lévy M., Shankar D., André J.-M., Shenoi S. S. C., Durand F., de Boyer Montégut C. (2007). Basin-wide seasonal evolution of the Indian ocean's phytoplankton blooms. JGR: Oceans 112 (C12), C12014. doi: 10.1029/2007JC004090
Luschi P., Sözbilen D., Cerritelli G., Ruffier F., Başkale E., Casale P. (2020). A biphasic navigational strategy in loggerhead sea turtles. Sci. Rep. 10, 18130. doi: 10.1038/s41598-020-75183-6
Marshall C. D., Guzman A., Narazaki T., Sato K., Kane E. A., Sterba-Boatwright B. D. (2012). The ontogenetic scaling of bite force and head size in loggerhead sea turtles (Caretta caretta): implications for durophagy in neritic, benthic habitats. J. Exp. Biol. 215 (23), 4166–4174. doi: 10.1242/jeb.074385
Maxwell S. M., Hazen E. L., Lewison R. L., Dunn D. C., Bailey H., Bograd S. J., et al. (2015). Dynamic ocean management: Defining and conceptualizing real-time management of the ocean. Mar. Policy 58, 42–50. doi: 10.1016/j.marpol.2015.03.014
McClellan C. M., Braun-McNeill J., Avens L., Wallace B. P., Read A. J. (2010). Stable isotopes confirm a foraging dichotomy in juvenile loggerhead sea turtles. J. Exp. Mar. Biol. Ecol. 387 (1–2), 44–51. doi: 10.1016/j.jembe.2010.02.020
McClintock B. T., Michelot T. (2018). momentuHMM: R package for generalized hidden Markov models of animal movement. Methods Ecol. Evol. 9 (6), 1518–1530. doi: 10.1111/2041-210X.12995
McClintock B., Michelot T. (2022). momentuHMM: Maximum Likelihood Analysis of Animal Movement Behavior Using Multivariate Hidden Markov Models (Version 1.5.5) (The Comprehensive R Archive Network). Available at: https://CRAN.R-project.org.
McMahon C. R., Roquet F., Baudel S., Belbeoch M., Bestley S., Blight C., et al. (2021). Animal borne ocean sensors – aniBOS – an essential component of the global ocean observing system. Front. Mar. Sci. 8. doi: 10.3389/fmars.2021.751840
Miller J. D. (1997). “Reproduction in sea turtles,” in The biology of Sea turtles. Eds. Lutz P. L., Musick J. A. (New York, USA: CRC Press), 51–81.
Okuyama J., Seminoff J. A., Dutton P. H., Benson S. R. (2016). Fine-scale monitoring of routine deep dives by gravid leatherback turtles during the internesting interval indicate a capital breeding strategy. Front. Mar. Sci. 3. doi: 10.3389/fmars.2016.00166
Paradis E. (2022). “Ape: Analyses of phylogenetics and evolution (Version 5.6-2),” (The Comprehensive R Archive Network). Available at: https://CRAN.R-project.org.
Polovina J., Uchida I., Balazs G., Howell E. A., Parker D., Dutton P. (2006). The Kuroshio Extension Bifurcation Region: A pelagic hotspot for juvenile loggerhead sea turtles. Deep-Sea Res. II 53 (3-4), 326–339. doi: 10.1016/j.dsr2.2006.01.006
R Core Team (2022). R: A language and environment for statistical computing (Version r version 4.2.2) (Vienna, Austria: R Foundation for Statistical Computing). Available at: https://www.R-project.org/.
Ramirez M. D., Avens L., Seminoff J. A., Goshe L. R., Heppell S. S. (2017). Growth dynamics of juvenile loggerhead sea turtles undergoing an ontogenetic habitat shift. Oecologia 183, 1087–1099. doi: 10.1007/s00442-017-3832-5
Ramirez M. D., Avens L., Seminoff J. A., Goshe L. R., Heppell S. S. (2015). Patterns of loggerhead turtle ontogenetic shifts revealed through isotopic analysis of annual skeletal growth increments. Ecosphere 6 (11), 244. doi: 10.1890/ES15-00255.1
Rees A. F., Al Saady S., Broderick A. C., Coyne M. S., Papathanasopoulou N., Godley B. J. (2010). Behavioural polymorphism in one of the world’s largest populations of loggerhead sea turtles Caretta caretta. Mar. Ecol. Prog. Ser. 418, 201–212. doi: 10.3354/meps08767
Roberts K. E., Smith B. J., Burkholder D., Hart K. (2021). Evaluating the use of marine protected areas by endangered species: A habitat selection approach. Ecol. Solut Evid 2, e12035. doi: 10.1002/2688-8319.12035
Sequeira A. M. M., Hays G. C., Sims D. W., Eguíluz V. M., Rodríguez J. P., Heupel M. R., et al. (2019). Overhauling ocean spatial planning to improve marine megafauna conservation. Front. Mar. Sci. 6. doi: 10.3389/fmars.2019.00639
Sequeira A. M. M., Rodríguez J. P., Eguíluz V. M., Harcourt R., Hindell M., Sims D. W., et al. (2018). Convergence of marine megafauna movement patterns in coastal and open oceans. PNAS 115 (12), 3072–3077. doi: 10.1073/pnas.1716137115
Schofield G., Hobson V. J., Fossette S., Lilley M. K. S., Katselidis K. A., Hays G. C. (2010). Fidelity to foraging sites, consistency of migration routes and habitat modulation of home range by sea turtles. Diversity Distributions 16, 840–853. doi: 10.1111/j.1472-4642.2010.00694.x
Schott F. A., Xie S.-P., McCreary J. P. Jr. (2009). Indian Ocean circulation and climate variability. Rev. Geophysics 47 (1), RG1002. doi: 10.1029/2007RG000245
Snover M. L., Hohn A. A., Crowder L. B., Macko S. A. (2010). Combining stable isotopes and skeletal growth marks to detect habitat shifts in juvenile loggerhead sea turtles Caretta caretta. Endangered Species Res. 13 (1), 25–31. doi: 10.3354/esr00311
Spalding M. D., Fox H. E., Allen G. R., Davidson N., Ferdaña Z. A., Finlayson M., et al. (2007). Marine ecoregions of the world: A bioregionalization of coastal and shelf areas. Bioscience 57 (7), 573–583. doi: 10.1641/B570707
Stringell T. B., Clerveaux W. V., Godley B. J., Kent F. E. A., Lewis E. D. G., Marsh J. E., et al. (2016). Taxonomic distinctness in the diet of two sympatric marine turtle species. Mar. Ecol. 37 (5), 1036–1049. doi: 10.1111/maec.12349
The Nature Conservancy (2012). Marine Ecoregions and Pelagic Provinces of the World. GIS layers developed by The Nature Conservancy with multiple partners, combined from Spalding et al., (2007) and Spalding et al., (2012) (Cambridge (UK: The Nature Conservancy). Available at: http://data.unep-wcmc.org/datasets/38.
Trott C. B., Subrahmanyam B., Murty V. S. N. (2017). Variability of the Somali current and eddies during thesouthwest monsoon regimes. Dynamics Atmospheres Oceans 79, 43–55. doi: 10.1016/j.dynatmoce.2017.07.002
Turner Tomaszewicz C. N., Seminoff J. A., Peckham S. H., Avens L., Kurle C. M. (2017). Intrapopulation variability in the timing of ontogenetic habitat shifts in sea turtles revealed using δ15N values from bone growth rings. J. Anim. Ecol. 86, 694–704. doi: 10.1111/1365-2656.12618
Vandeperre F., Parra H., Pham C. K., Machete M., Santos M., Bjorndal K. A., et al. (2019). Relative abundance of oceanic juvenile loggerhead sea turtles in relation to nest production at source rookeries: implications for recruitment dynamics. Sci. Rep. 913019. doi: 10.1038/s41598-019-49434-0
Keywords: behavioral ecology, marine megafauna, migration, satellite tracking, telemetry, ontogenetic shift, hidden Markov model, Caretta caretta
Citation: Monsinjon JR, Laforge A, Gaspar P, Barat A, Bousquet O, Ciccione S, Jean C, Ballorain K, Dalleau M, Coelho R, Bonhommeau S and Bourjea J (2023) Loggerhead turtle oceanic-neritic habitat shift reveals key foraging areas in the Western Indian Ocean. Front. Mar. Sci. 10:1204664. doi: 10.3389/fmars.2023.1204664
Received: 12 April 2023; Accepted: 20 July 2023;
Published: 08 August 2023.
Edited by:
Jamie Shutler, University of Exeter, United KingdomReviewed by:
Nicole Esteban, Swansea University, United KingdomGraeme Clive Hays, Deakin University, Australia
Copyright © 2023 Monsinjon, Laforge, Gaspar, Barat, Bousquet, Ciccione, Jean, Ballorain, Dalleau, Coelho, Bonhommeau and Bourjea. This is an open-access article distributed under the terms of the Creative Commons Attribution License (CC BY). The use, distribution or reproduction in other forums is permitted, provided the original author(s) and the copyright owner(s) are credited and that the original publication in this journal is cited, in accordance with accepted academic practice. No use, distribution or reproduction is permitted which does not comply with these terms.
*Correspondence: Jonathan R. Monsinjon, jonathan.monsinjon@gmail.com