Coastal inundation regime moderates the short-term effects of sediment and soil additions on seawater oxygen and greenhouse gas dynamics: a microcosm experiment
 Peter Regier1*
  Nicholas D. Ward1,2
  Alex Izquierdo1
  Andrew H. Baldwin3 Donnie Day4 Julia McElhinny1
  Kaizad Patel5
  Rodrigo Vargas6
  Jianqiu Zheng5 Exchange Consortium
  Allison Myers-Pigg1,4*
- 1Marine and Coastal Research Laboratory, Pacific Northwest National Laboratory, Sequim, WA, United States
- 2School of Oceanography, University of Washington, WA, United States
- 3Department of Environmental Science and Technology, University of Maryland, College Park, MD, United States
- 4Department of Environmental Science, University of Toledo, Toledo, OH, United States
- 5Pacific Northwest National Laboratory, Richland, WA, United States
- 6Department of Plant and Soil Sciences, University of Delaware, Newark, DE, United States
The frequency and persistence of tidal inundation varies along the coastal terrestrial-aquatic interface, from frequently inundated wetlands to rarely inundated upland forests. This inundation gradient controls soil and sediment biogeochemistry and influence the exchange of soils and sediments from terrestrial to aquatic domains. Although a rich literature exist on studies of the influence of tidal waters on the biogeochemistry of coastal ecosystem soils, few studies have experimentally addressed the reverse question: How do soils (or sediments) from different coastal ecosystems influence the biogeochemistry of the tidal waters that inundate them? To better understand initial responses of coastal waters that flood coastal wetlands and uplands, we conducted short-term laboratory experiments where seawater was amended with sediments and soils collected across regional gradients of inundation exposure (i.e., frequently to rarely inundated) for 14 sites across the Mid-Atlantic, USA. Measured changes in dissolved oxygen and greenhouse gas concentrations were used to calculate gas consumption or production rates occurring during seawater exposure to terrestrial materials. We also measured soil and water physical and chemical properties to explore potential drivers. We observed higher oxygen consumption rates for seawater incubated with soils/sediments from frequently inundated locations and higher carbon dioxide production for seawater incubated with soils from rarely inundated transect locations. Incubations with soil from rarely inundated sites produced the highest global warming potential, primarily driven by carbon dioxide and secondarily by nitrous oxide. We also found environmental drivers of gas rates varied notably between transect locations. Our findings indicate that seawater responses to soil and sediment inputs across coastal terrestrial-aquatic interfaces exhibit some consistent patterns and high intra- and inter-site variability, suggesting potential biogeochemical feedback loops as inundation regimes shift inland.
1 Introduction
Coastal systems are characterized by high spatial heterogeneity in ecosystem characteristics and biogeochemical function (Du et al., 2018; Seyfferth et al., 2020). The coastal terrestrial-aquatic interface, where land meets water, represents a key control point of biogeochemical activity with sharp gradients in physical, chemical, and biological properties. Due to the spatial complexity across these interfaces, our understanding of biogeochemical functions remains largely site- or system-specific, which limits our ability to model coastal biogeochemistry across scales (Ward et al., 2020).
Quantifying the dynamics and drivers of biogeochemistry in coastal systems is a critical component of closing global carbon and nutrient budgets (Regnier et al., 2022). While much of the carbon buried in soils and sediments along the coastal interface remains stable for thousands of years (Duarte and Prairie, 2005; Hopkinson et al., 2012), greenhouse gases (GHGs), such as carbon dioxide (CO2), methane (CH4), and nitrous oxide (N2O), are essential components of carbon and nutrient cycles for both terrestrial and aquatic coastal ecosystems, and represent substantial uncertainty in coastal carbon inventorying (Holmquist et al., 2018; Capooci and Vargas, 2022). Dissolved oxygen (DO) is an important driver of coastal carbon and nutrient cycling via control of redox conditions on aerobic activity within soils, sediments, groundwater, and surface water, which regulates the fate and transport of organic matter and GHGs across the coastal interface (Elberling et al., 2011; Ward et al., 2017; Chapman et al., 2019).
As sea levels rise, coastal systems are experiencing increasing frequency and duration of flooding (Ensign and Noe, 2018), which influences the fate of soil carbon (e.g., DeLaune and White, 2012) as well as DO and GHG dynamics (Martinez and Ardón, 2021; Fettrow et al., 2023b). Increased flooding extent along the coast drives lateral export of dissolved geochemical components (e.g., Bianchi et al., 2009; Fettrow et al., 2023a), of soils from the landscape (Wilson and Allison, 2008; Leonardi et al., 2016; Ganju et al., 2019), and resuspension of aquatic sediments (Green and Coco, 2014). Further, field studies indicate that increased flooding of coastal regions can create both sources and sinks of GHGs, demonstrating that these ecosystems are temporally dynamic and spatially heterogeneous (Gatland et al., 2014; Kroeger et al., 2017; Diefenderfer et al., 2018; Capooci et al., 2019). Numerous studies have examined how erosion and leaching of organic matter from coastal soils and resuspension of coastal sediments may drive elevated rates of respiration and degradation of previously stable carbon (Fichot and Benner, 2014; Guenet et al., 2014; Aller and Cochran, 2019; Ward et al., 2019a). However, few studies have examined how changes in flooding regime, for example due to sea-level rise, affect water column oxygen consumption and GHG production across coastal ecosystem locations and habitats. Thus, understanding how the type of material (e.g., wetland versus upland-derived soils) delivered to coastal aquatic systems impacts the response of DO and GHG dynamics is important for predicting the future stability of coastal carbon and nutrient pools with predicted shifts in inundation extent (Ensign and Noe, 2018).
The goal of this study was to capture the dynamics and drivers of short-term (24-hour) experimental responses of seawater DO and GHG dynamics to different soil/sediment inputs from locations across the coastal terrestrial-aquatic interface in order to understand how soil erosion or sediment resuspension may effect aquatic biogeochemistry in coastal systems. This time-period was selected to represent the short-term (<24-hour) response of coastal waters following tidal inundation and subsequent mobilization of soils/sediments into the water column. To accomplish this, we conducted incubation experiments where we amended seawater with small amounts of soils or sediments collected along coastal transects representing a gradient of inundation frequency. We explored two hypotheses: H1) Introduction of soils and sediments to seawater will stimulate DO consumption and GHG production differently based on soil/sediment provenance, with stronger oxygen responses for more frequently inundated transect locations, and H2) Patterns in DO and GHG rates will be more strongly related to water quality in frequently inundated locations, and more strongly related to soil physicochemistry in rarely inundated locations. Our results provide new information on how mobilization of soils and sediments from different locations along the coastal terrestrial-aquatic interface may affect short-term dynamics of coastal DO and GHGs across the greater Mid-Atlantic region. These findings have the potential to enhance our understanding regional to continental-scale coastal DO and GHG responses to changing flooding regimes.
2 Methods
2.1 Sample collection
Surface soil and sediment samples were collected as part of the first campaign from the Exploration of Coastal Hydrobiogeochemistry Across a Network of Gradients and Experiments (EXCHANGE) research consortium. The EXCHANGE consortium collaborates throughout the research life-cycle, from study design and sample collection to manuscript preparation (Myers-Pigg et al., 2023). Samples for this study were collected at 14 locations distributed throughout Chesapeake and Delaware Bays and their tributaries (Figure 1A). At each site, EXCHANGE consortium members sampled four locations along a coastal terrestrial-aquatic interface transect spanning a gradient of inundation regimes: (1) frequently inundated sediment underlying shallow nearshore surface waters, 2) frequently inundated soils from wetlands; 3) rarely inundated soils from transitional forests with unhealthy trees (ghost forests); and 4) rarely inundated soils from upland forests that may have never been exposed to tidal inundation (Figure 1B). To simplify references to different locations across the coastal terrestrial-aquatic interface, we refer collectively to samples collected at Sediment and Wetland locations as “frequently inundated” and samples collected at Transition and Upland locations as “rarely inundated” (Figure 1B). Soil and sediment samples were collected from the top 10 cm of the profile by hand by the EXCHANGE consortium, transferred to plastic bags, then shipped on ice overnight to the lab as described in Myers-Pigg et al. (2023). We flushed samples with N2 gas upon arrival to minimize aerobic activity during storage before to incubations.
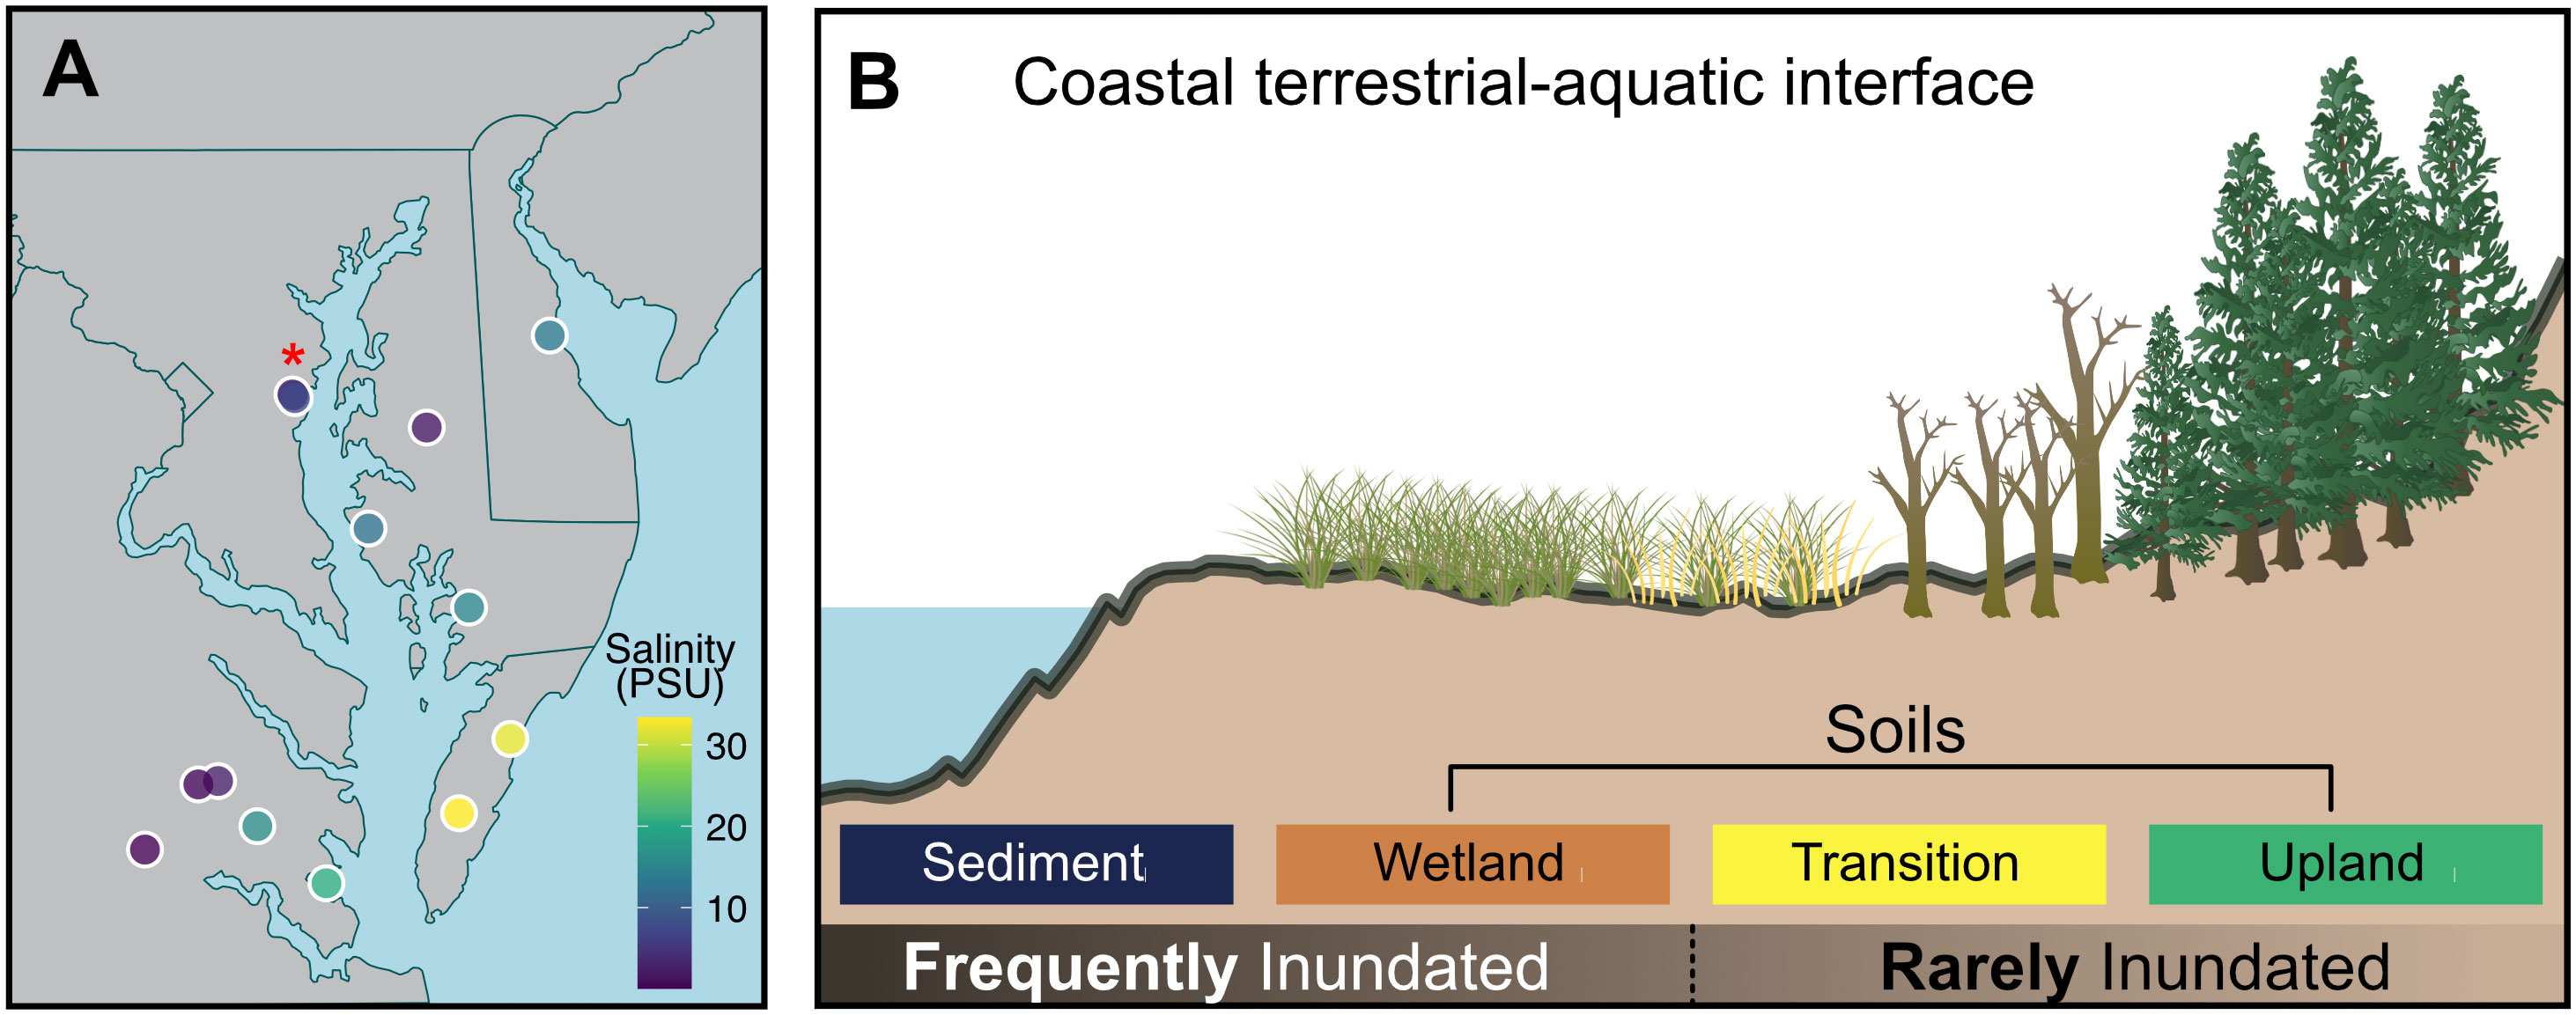
Figure 1 (A) Map showing regional representation of samples collected, where each point represents a sampling site, and the color represents the surface water salinity at that site. Three of the sampling sites are too close together to resolve visually, and are marked with a red asterisk. (B) a representation of transect locations sampled across the terrestrial-aquatic interface at each site.
2.2 Laboratory incubations
We conducted laboratory incubation experiments to understand how amendments of soils or sediments collected across the inundation gradient of the coastal terrestrial-aquatic interface (i.e., the sampling site’s expected antecedent exposure to tidal inundation based on its location along the coastal terrestrial-aquatic interface, Figure 1B) influenced seawater DO and GHG dynamics. To do this, we quantified the consumption or production of DO and GHGs during short-term (24-hour duration) incubations where seawater was mixed with a small quantity of soil or sediment. We limited incubation time to 24 hours to capture the initial response of introducing soils and sediments into our experimental coastal ocean surface water microcosm environment. The day before each incubation, soil/sediment samples were taken out of the refrigerator to reach room temperature (~18 C) before incubating. We used fresh seawater collected from Sequim Bay, WA prior to each incubation as our consistent seawater source to reduce complexity and confounding factors associated with using water from each sampling site. During the Fall/Winter period when seawater was collected for our incubations, salinity averaged ~30 PSU, pH ranged from 7.9-8.3, and DO concentrations centered around atmospheric equilibration.
For each sample, we filled triplicate combusted 40 mL amber borosilicate glass scintillation vials with gas-tight septum caps with ~5g of field-moist soil or sediment. We chose field-moist over dry weight to standardize our incubations by the weight of biogeochemically relevant material (i.e., soil/sediment and interstitial water). We then added room-temperature seawater to the vial (which was equilibrated with the atmosphere by vigorously shaking a bottle with headspace for several minutes), leaving less than 1 mL of headspace. Each vial was then homogenized via shaking by hand for 60 seconds, and then incubated at ~18 °C in the dark for 24 hours.
2.3 Oxygen consumption rates
We measured dissolved oxygen (DO) concentrations every minute for 24 hours using optical sensors attached to a 4-channel hub (Firesting FS02-C4, Aachen, Germany). DO measurements were automatically corrected for temperature and pressure by the instrument software as suggested by the manufacturer. DO probes were inserted through a gas-tight septum cap, and further sealed with silicone around the insertion point immediately after homogenization. In addition to incubating seawater with soil added, we also incubated seawater as a control to evaluate background GHG production or consumption. Due to the number of sensors available, we only measured DO in a single combusted (550° C) amber borosilicate glass scintillation vial per site-transect location combination.
To calculate the rate at which oxygen was consumed or produced in each sample, we removed all values before the value before the onset of oxygen depletion (i.e., the brief initial period with stable DO concentrations). We removed all DO values < 0.01 mg/L based on manufacturer sensor sensitivity at low DO concentrations. We also removed all values after the minimum DO value was reached. DO consumption rates in µM/hr were then calculated based on:
where DOinitial is the DO concentration in µM at the start of the experiment, DOfinal is the DO concentration in µM at the end of the experiment, and timeinitial and timefinal are the corresponding times relative to the start of the experiment. DO consumption was not monitored in the control seawater vial, and we therefore assume similar (and minimal) background responses for DO in seawater across all incubations. We did not observe net oxygen production in any samples.
2.4 Greenhouse gas rates and global warming potentials
After a 24-hour incubation period, we sampled GHGs from all incubations. Gases were first extracted from 20 mL of water collected from the top of each vial. The water was carefully poured into a 60 mL syringe without bubbling and filled with 40 mL of N2 to perform a headspace extraction following methods by Ward et al. (2019b). The partial pressures in parts per million (ppm) of CO2, CH4, and N2O were measured using a Picarro G2508 Cavity Ring‐Down Spectrometer with a flow limiter to reduce gas flow rates. Details on converting GHG partial pressures to molar units can be found in Supplementary Information.
GHG production or consumption rates were calculated in the same manner as DO:
assuming initial GHG concentrations were equivalent to atmospheric concentrations (CO2 = 420 ppm, CH4 = 1.9 ppm, N2O = 0.3 ppm). We assumed this as seawater was equilibrated with the atmosphere before the experiment, as described above. To understand the relative influence of each GHG to changes in overall warming (or cooling) potential after introducing soils and sediments to seawater, we first converted GHG rates in µM/hr to µg L-1 hr-1 then multiplied CH4 and N2O rates by the 100-yr sustained-flux global warming potential (SGWP) of each gas (45 CO2 equivalents for CH4 and 270 CO2 equivalents for N2O) reported in Neubauer and Megonigal (2015). We note that SGWP calculations come with several important considerations that should be kept in mind when interpreting values (Neubauer and Megonigal, 2015).
2.5 Ancillary data
Ancillary datasets (Myers-Pigg et al., 2023; Pennington et al., 2023) for soil and sediment physicochemical properties, surface water chemistry adjacent to collected soils and sediments, and ecosystem properties, were retrieved from published EXCHANGE datasets. Methodology and details on datasets can be found in Myers-Pigg et al. (2023). Sand/silt/clay content was collected based on latitude and longitude for each transect location in each site using the soilDB R package which queries U.S. Department of Agriculture Natural Resources Conservation Service and National Cooperative Soil Survey databases (Beaudette et al., 2023). Mean monthly air temperatures were pulled for each site from the National Aeronautics and Space Administration’s POWER database via the nasapower R package (Sparks et al., 2023).
2.6 Statistical analysis
We compared mean values across transect locations with varying inundation using Wilcoxon tests. Correlation networks were created using the ggraph package (Pedersen, 2022) to understand which environmental variables had significant (p < 0.05) linear relationships with DO and GHG production/consumption rates. We used Kendall’s Rank Correlation in preference to Pearson’s Correlation due to non-normal distributions of some of the variables (Kendall, 1938). Potential predictor variables included a wide range of surface water quality (salinity, pH, dissolved organic carbon (DOC), and total dissolved nitrogen (TDN)), soil/sediment physicochemistry (gravimetric water content (GWC), total carbon (TC), total nitrogen (TN), sand/silt/clay content), mean monthly air temperature (MAT) and annual precipitation, and C:N stoichiometry metrics for surface water (DOC/TDN) and soil/sediments (TC/TN). We applied principal component analysis (PCA) to production/consumption rates for DO and GHGs and selected predictors included in our correlation analysis. To select which variables to use, we took all variables included in correlation analysis and used them as predictors in a Random Forest model designed to predict transect location using the ranger R package (Wright and Ziegler, 2017) using default hyper-parameters. We constructed our model to better understand and visualize how gas rates and potential drivers relate in multivariate space, and how those relationships explain differences between transect locations with varying inundation regimes. All statistical analyses were conducted in R (R Core Team, 2021).
3 Results
3.1 Seawater oxygen and GHG responses to soil inputs from different coastal landscapes
DO consumption rates were highly variable across our study sites and transect locations with a mean consumption rate of 95.8 µM/hr ranging from 2.16 to 1410 µM/hr (Figure 2A, Table S1). We note that n=5 extreme outliers were removed from Figure 2 to better show patterns in the dataset but are included in Figure S1. Samples from frequently inundated locations (Sediment and Wetland, Figure 1A) yielded higher (mean of 135.4 µM/hr) and more variable (range of 6.82 to 1410 µM/hr) DO consumption rates when compared to seawater mixed with soils from rarely inundated locations (Transition and Upland) - mean: 41.2 µM/hr, range: 2.16 – 770 µM/hr (Figure 2A, Table SA). Consistent with H1, we found that DO consumption rates were highest in the frequently inundated (Sediment and Wetland) locations, compared to the rarely inundated (Upland and Transition) locations (Figure 2A).
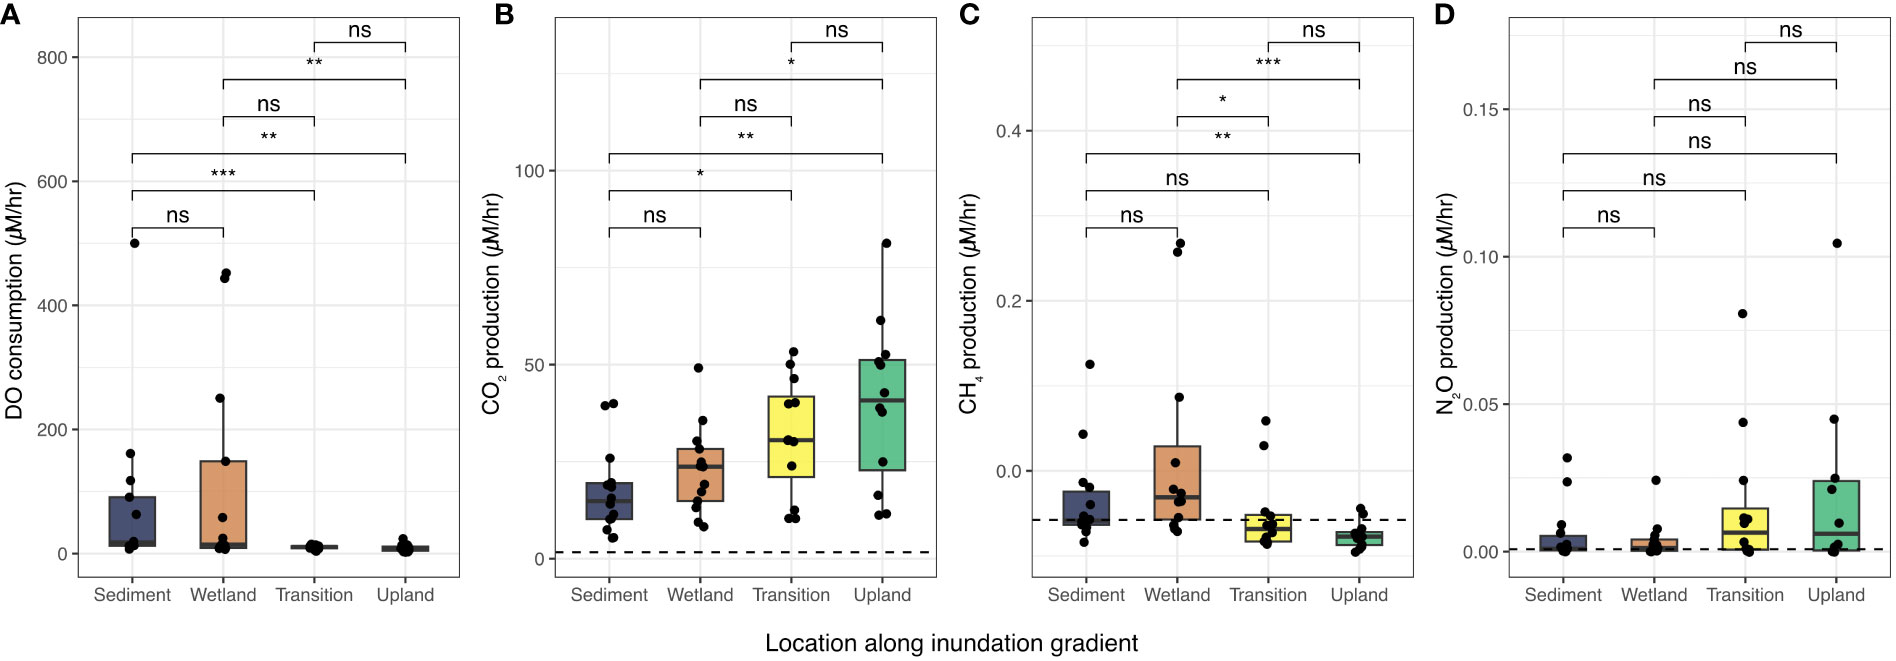
Figure 2 (A) Aquatic DO consumption rates and (B–D) greenhouse gas rates with soil and sediment inputs from different coastal locations for all 14 sampling sites shown in Figure 1. Dashed horizontal lines represent ambient consumption rates for seawater with no soil or sediment amendments (no rate reported for DO as consumption was assumed to be negligible). The boxplot boxes represent the interquartile range (IQR, between 1st and 3rd quartiles), with the median as the solid line. The whiskers represent 1.5 * IQR and points represent outliers. Extreme outliers (n=5 across all panels) were removed to better visualize patterns, and are presented in Figure S1. Significant differences between group means are presented as “ns” (p > 0.05), “*” (p < 0.05), “**” (p<0.01), and “***” (p<0.001).
Post-incubation GHG measurements indicated a net production of CO2, and N2O during the 24-hour incubation. Across all samples, we observed mean CO2 production of 27.4 µM/hr (range of 5.31 to 81.3 µM/hr), which was 16.5 times greater than average CO2 production in the seawater control treatment. CO2 production rates increased with decreasing inundation regime, with lowest average rates for Sediment samples (17.3 µM/hr), and highest average rates (more than double Sediment samples) for Upland samples (39.9 µM/hr). The pattern of increasing CO2 production rates from frequently inundated to rarely inundated transect locations (Figure 1B) along the coastal terrestrial-aquatic interface is opposite the pattern observed for DO consumption (Figure 2).
CH4 production rates averaged -0.0154 µM/hr across all samples (Table S1). However, for incubations using Wetland soils, we observed mean CH4 production (0.095 µM/hr) while the other three locations all exhibited net CH4 consumption (i.e., negative mean rates). The seawater control also showed mean negative rates (-0.058 µM/hr). In contrast to CH4, mean N2O production rates were positive (0.032 µM/hr) and, consistent with patterns in CO2, increased from frequently inundated Sediment and Wetland locations (mean: 0.005 µM) to rarely inundated Transition and Upland locations (mean: 0.034 µM/hr). Notably, average N2O production rates for least frequently inundated samples (Upland, 0.109 µM/hr) were more than two orders of magnitude higher than the average N2O production rates for the most frequently inundated samples (Sediment, 0.0056 µM/hr, Table S1). All transect locations exhibited higher mean N2O production rates than the seawater control (0.0008 µM/hr, Table S1).
3.2 Global warming potential of GHG responses
We observed a consistent increase in cumulative sustained-flux global warming potential (SGWP) rates with decreasing inundation frequency from Sediment samples (mean of 0.8 CO2 eq: mg L-1 hr-1 for all GHGs combined) to Upland samples (mean of 3.0 CO2 eq: mg L-1 hr-1) (Figure 3). The increase in mean SGWP from Sediment to Transition was driven primarily by CO2, which accounted for 87-90% of total mean SGWP at each location (Figure 3). However, while CO2 was still the primary contributor to SGWP (57%) for Upland samples, N2O contributed to 44% of total SGWP, compared to 3%-12% across the other locations. We also note that CH4 was a source of cooling (albeit a small one) rather than warming for Upland (i.e., net consumption of CH4 was stimulated compared to the seawater control) but was a notable source of warming in the Wetland, where it accounted for 10% of total SGWP (Figure 3B).
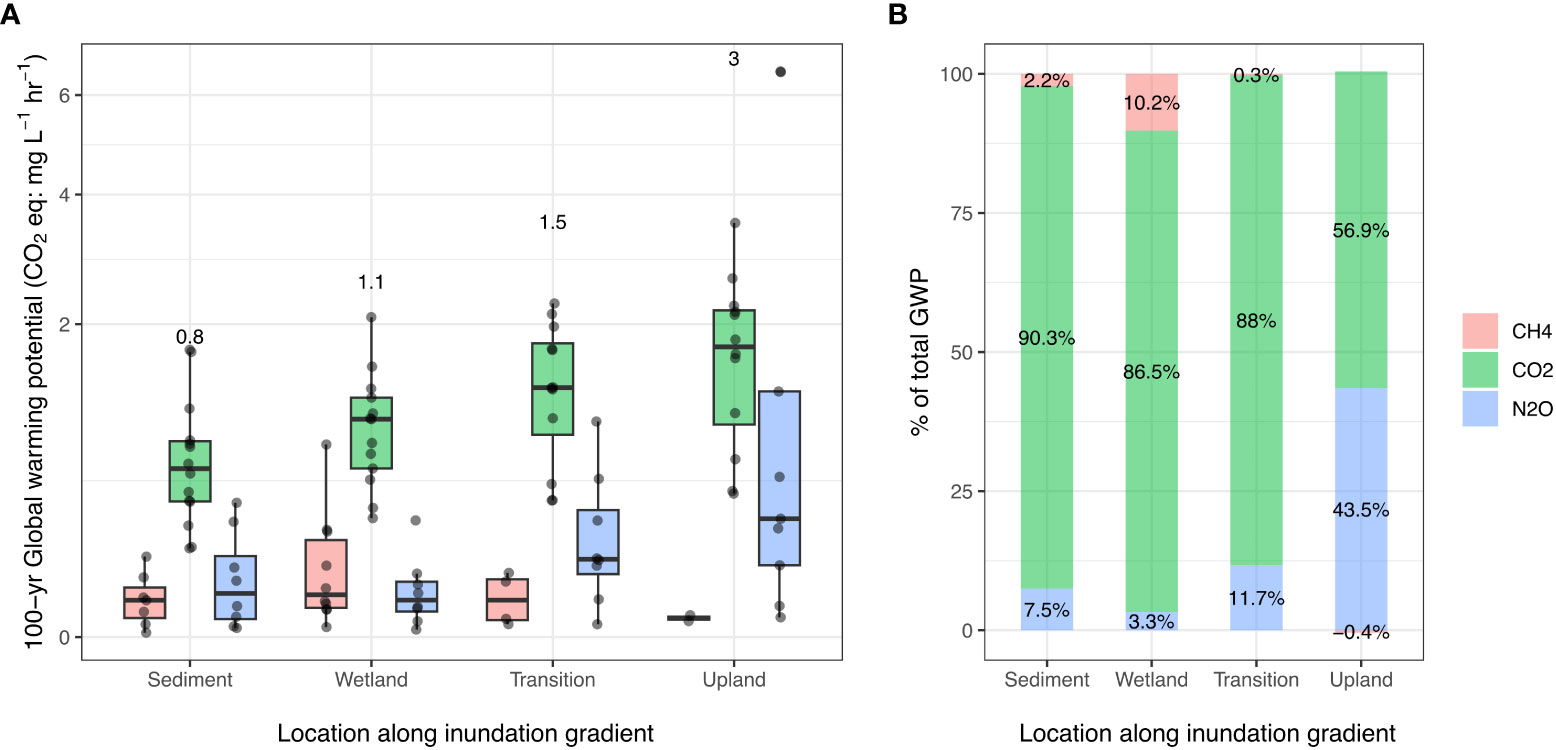
Figure 3 Mean 100-year sustained-flux global warming potential (SGWP) values in CO2-equivalents per hour presented by GHG (colors) for each transect location of the coastal terrestrial-aquatic interface (x-axis). (A) All SGWP values presented as boxplots, where boxes represent the interquartile range (IQR, between 1st and 3rd quartiles), with the median as the solid line. The whiskers represent 1.5 * IQR and points represent outliers. Numbers above each transect location indicate the sum of mean SGWP values for all three gases at the location in CO2 eq/hr. (B) Percentages of total SGWP for each GHG at each transect location.
3.3 Drivers of DO and GHG responses across the coastal terrestrial-aquatic interface
To better understand the relationships between DO and GHG production/consumption rates and potential driver variables, we constructed correlation networks that included a range of environmental factors, including endemic water quality, soil physicochemistry, and climate (Figure 4). We divided our dataset by transect location before calculating correlations to assess how relationships changed based on the provenance of the soil/sediment.
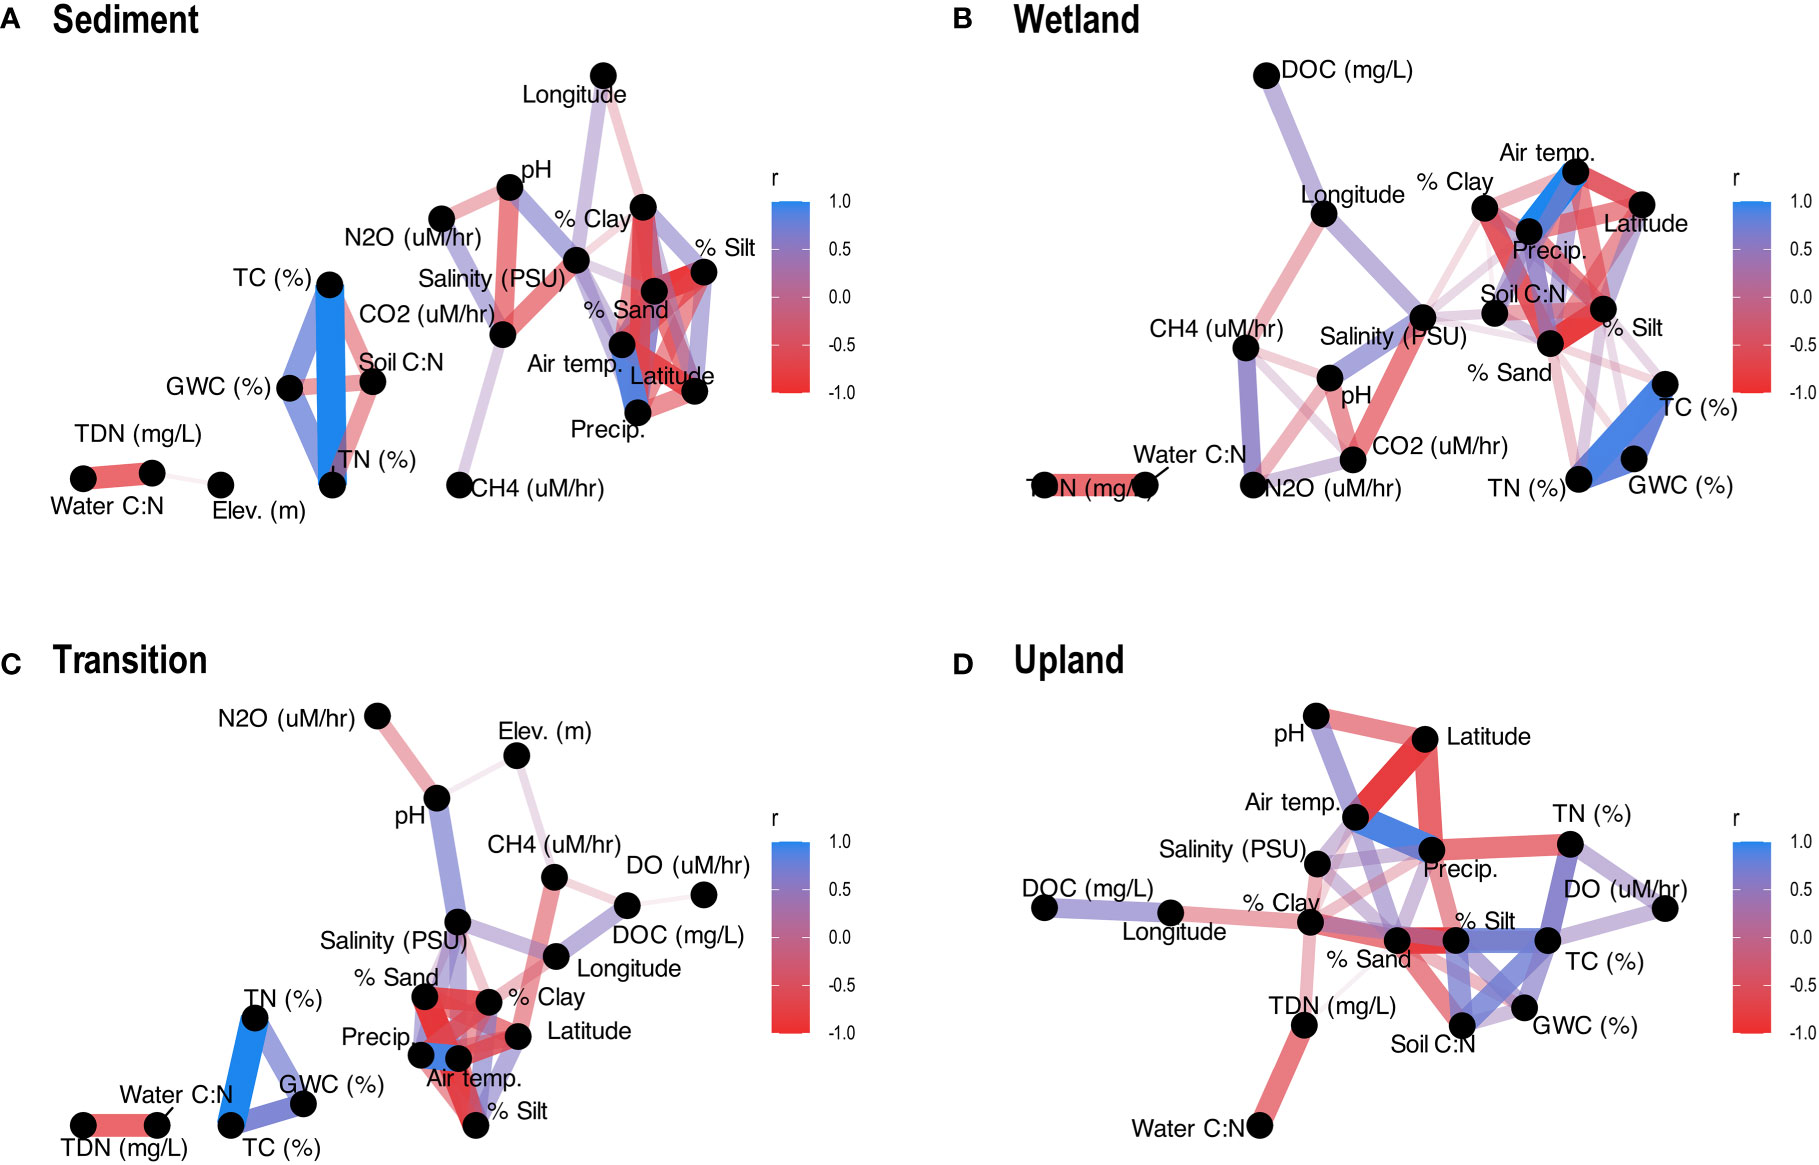
Figure 4 Correlation networks displaying all significant (p < 0.05) correlations (based on Kendall Rank Correlations) between gas rates and environmental variables for each transect location: (A) Sediment, (B) Wetland, (C) Transition, (D) Upland. Positive correlations are shaded blue, negative correlations are shaded red, and thicker lines indicate stronger correlations.
For Sediment samples, we observed significant correlations between environmental drivers and rates for CO2 (negatively correlated to pH and salinity) and N2O (negatively correlated to pH) but not CH4 or DO rates (Figure 4A). For Wetland samples, we observed significant correlations between environmental drivers and rates for CO2 (again, negatively correlated to pH and salinity), CH4 (negatively correlated to salinity and longitude), and N2O (negatively correlated to salinity) but not DO rates. The relationship between N2O and CH4 rates was not significant for Sediment samples, but was significant (and positive) for Wetland samples, while correlations to CO2 rates (CH4, N2O, salinity, and pH) were consistent for both Sediment and Wetland samples. Relatively consistent relationships to pH and salinity for Sediment and Wetland sites support our hypothesis (H2) that frequently inundated sites will relate primarily to water quality. For Transition samples Figure 4C), correlations differed notably from frequently inundated samples (Figures 4A, B). First, we observed significant relationships for DO, CH4, and N2O rates but not for CO2 rates. Second, while N2O was still correlated to pH, CH4 was only correlated to surface water DOC and DO. Third, CH4 was correlated to elevation. Finally, for Upland samples, DO was the only gas rate with any significant correlations to environmental parameters, with positive correlations to both soil TC and TN (Figure 4D).
Finally, we explored multivariate relationships between DO/GHG rates and potential explanatory variables using principal component analysis (PCA) (Figure 5). Prior to analysis, variables to include in the PCA were selected based on variable importance determined using a Random Forest model (Figure S2). PC1, which explained 28.7% of the variability, had the strongest positive loadings from soil carbon and nitrogen content and CO2 rates, soil C:N ratios and gravimetric water content. PC2, which explained 20.5% of the variability, had the strongest negative loadings for DO and CH4 rates and GWC, and strongest negative loadings for CO2 rates, soil C:N ratios, and elevation. PC1 appears to be more related to variability in soil physicochemistry across inundation regimes, with largest PC1 ranges for Wetland and Transition samples. We observed significant (p < 0.05) differences in mean PC1 values between Sediment and both Wetland and Transition (Figure S3). PC2 separated transect locations, with mostly negative PC2 values for frequently inundated locations and mostly positive PC2 values for rarely inundated locations (Figure 5). Along PC2, Upland samples had significantly higher average loadings than all other locations, but we observed no significant differences between the other three transect locations (Figure S3).
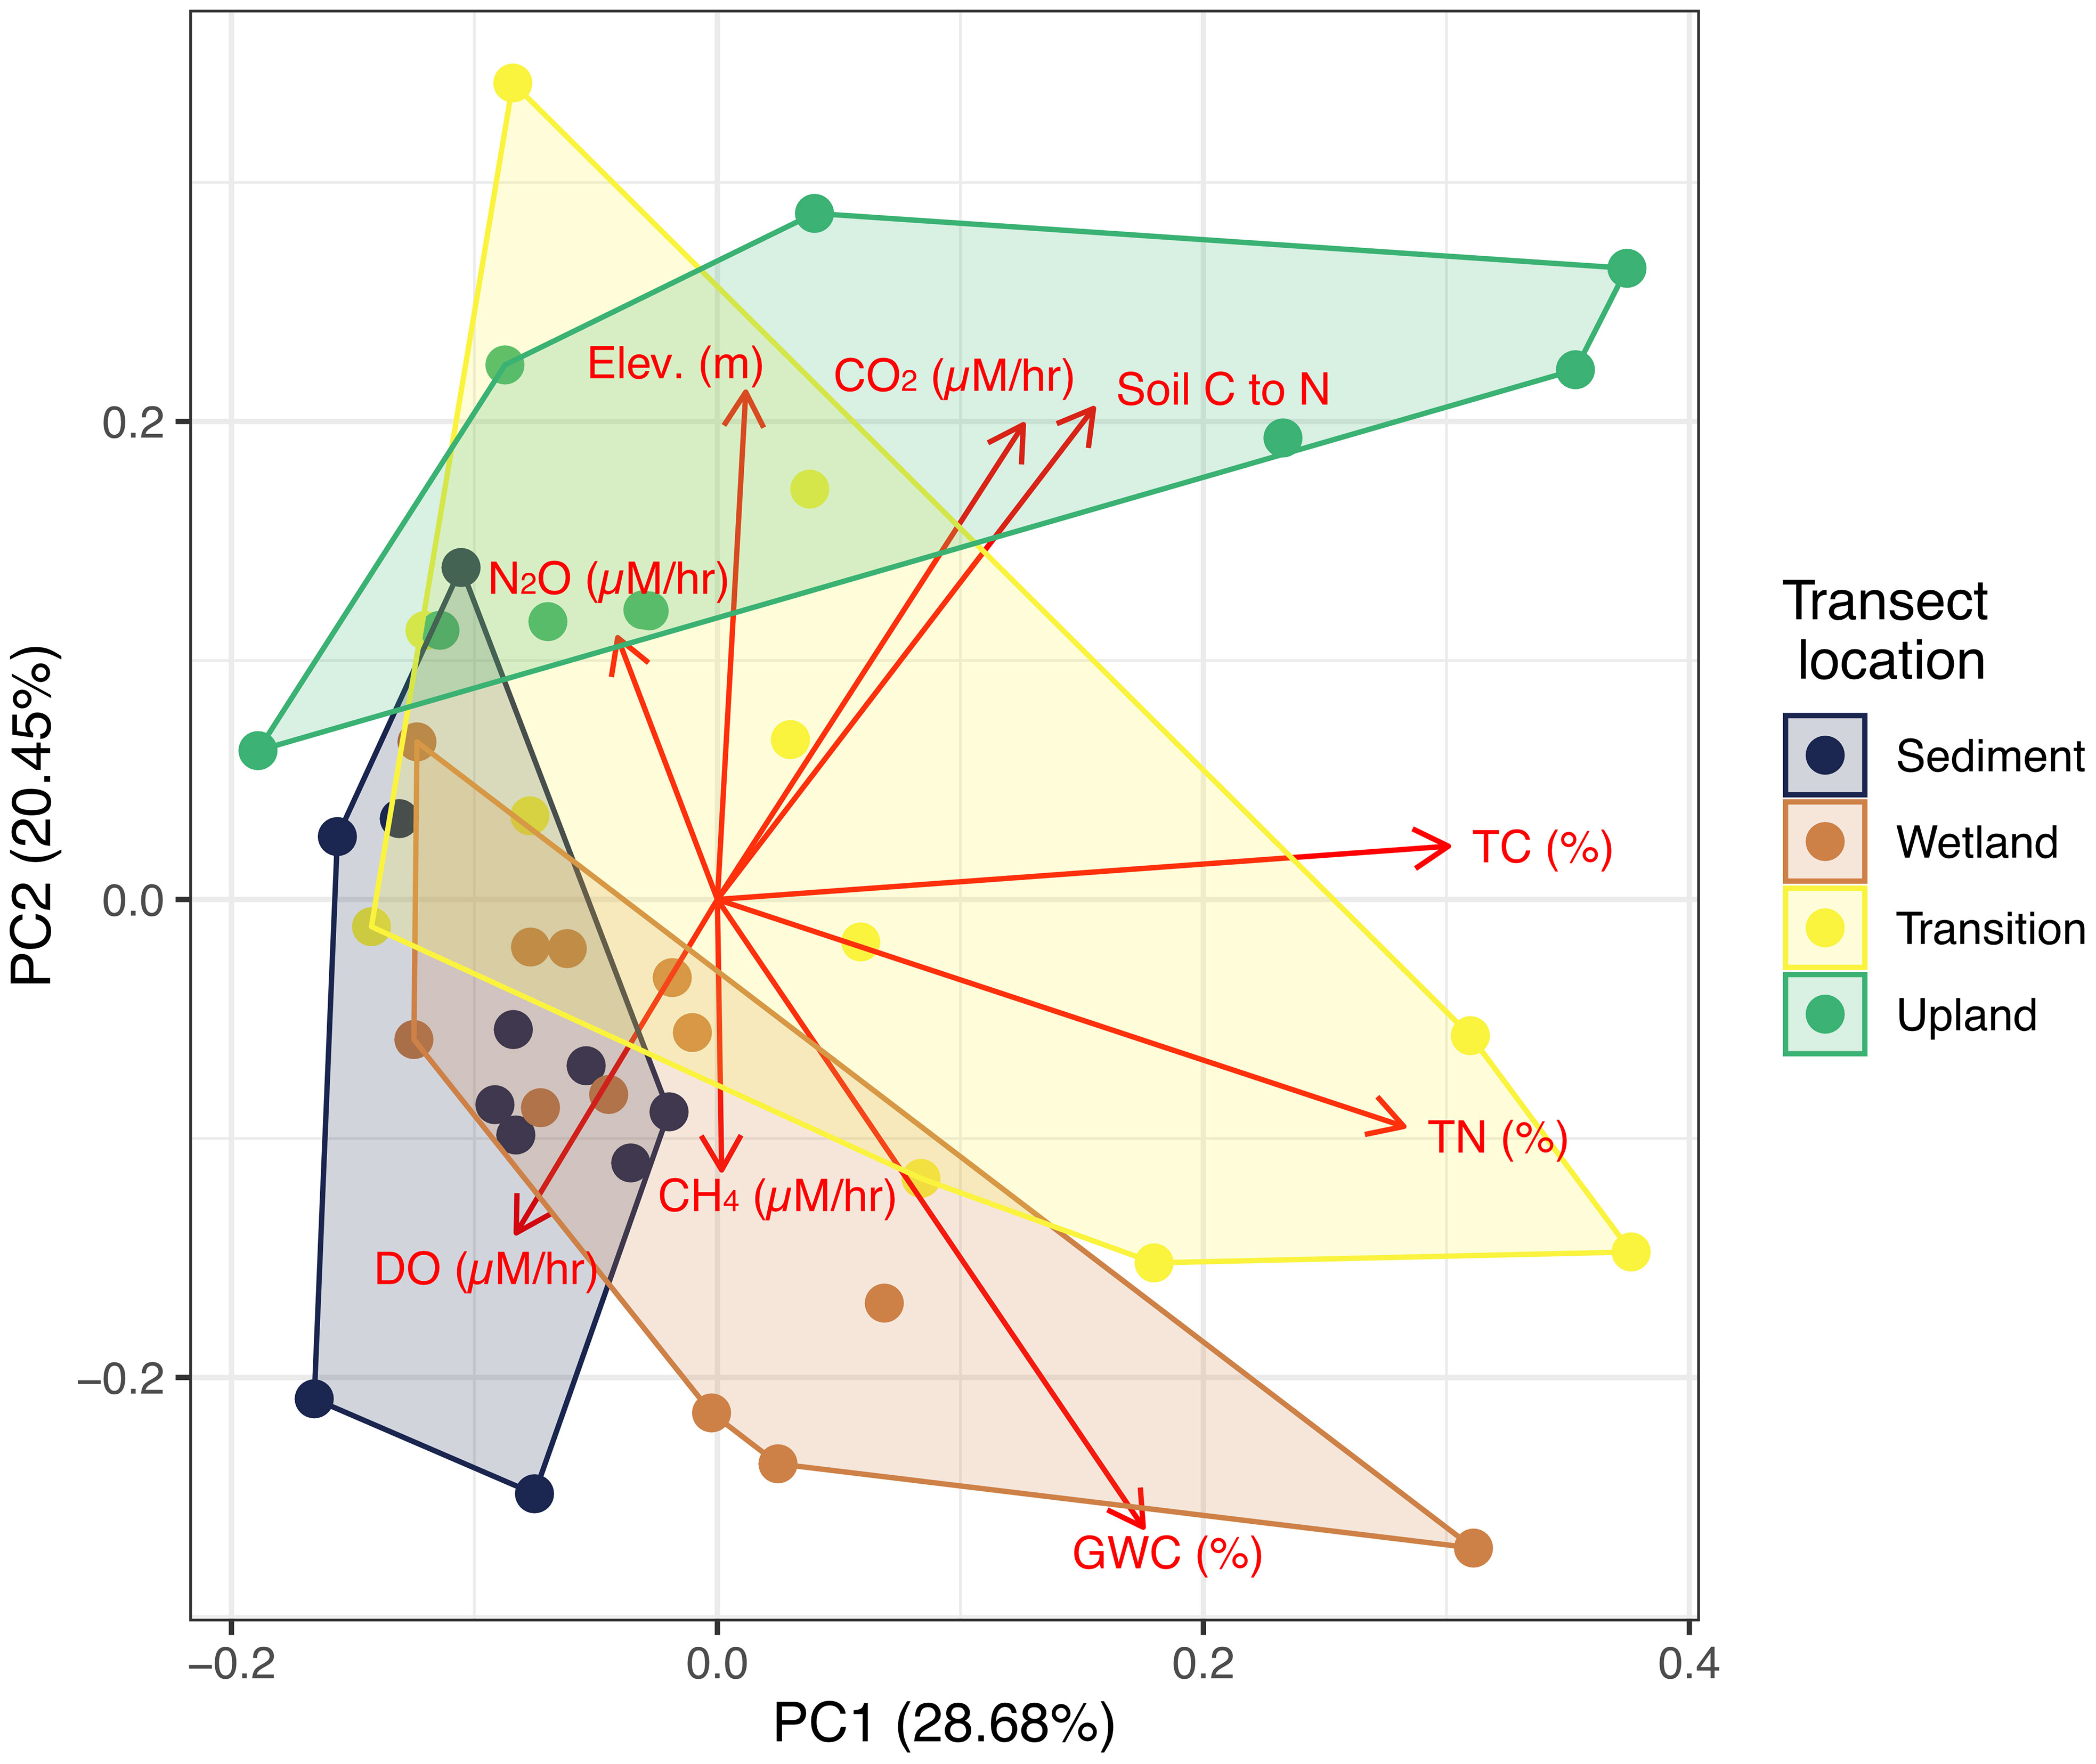
Figure 5 Principal component analysis using variables selected via Random Forest analysis showing the first two principal components. Red labeled arrows indicate loadings and points indicate scores, while colored hulls represent each location along the transect.
4 Discussion
4.1 DO and GHG rates differ with inundation regime
We observed relatively clear patterns for DO consumption and production of CO2 and N2O across our inundation gradient (Figure 2). As hypothesized in H1, we observed significant differences in seawater DO and GHG production or consumption rates based on the inundation regime of soils/sediment inputs across the coastal terrestrial-aquatic interface (Figure 2). Higher rates of DO consumption for frequently inundated samples (Sediment and Wetland, Figure 2) were also consistent with H1 and align with inundation-driven decreases in redox potential, where powerful electron acceptors like oxygen are rapidly consumed (e.g., Machado-Silva et al., 2023). Our results are consistent with laboratory experiments of higher biological and perhaps chemical oxygen demand in wetland soils relative to less frequently inundated soils (Patel et al., 2022). Consistent with rapid DO consumption, highest CH4 production rates were observed for frequently inundated samples (Sediment and Wetland, Figure 2). Due to the short duration of our experiment, we were surprised to see CH4 production occur, especially considering that seawater contains oxygen, sulfate and nitrate, which are all generally considered more preferred electron acceptors than CO2. Soil/sediment inputs from these two transect locations may produce CH4 naturally as opposed to rarely inundated locations (e.g., Transition and Upland), which generally consume CH4 (Pitz and Megonigal, 2017). Additional potential explanations include variation in microbial communities along inundation gradients in coastal marshes (e.g., Gao et al., 2020), evidence that methanogens can tolerate short-lived oxic conditions (Conrad, 2020), or alternative methanogenesis pathways such as methyl methanogenesis (Seyfferth et al., 2020). We note that, due to the short nature of our study, we only captured the initial response without allowing time for stable anoxia to develop, which likely inhibited conditions conducive to methanogenesis. Studies of the formation of ghost forests (i.e., dead forests killed by rising water levels) due to inundation of previously unflooded areas indicate dramatic shifts in biogeochemistry, including the release of CH4 (e.g., Norwood et al., 2021), suggesting longer-term incubations would expect an increase in Transition and Upland CH4 production as well.
Because oxygen is an input to respiration and CO2 is an output, we expected a positive correlation between DO consumption and CO2 production (i.e., when oxygen consumption increases, so does CO2 production). Instead, we observed an inverse relationship based on transect locations, with the highest DO consumption rates coinciding with the lowest CO2 production rates, and vice versa (Figure 2). This unexpected pattern suggests that the relationship between CO2 and DO, at least on the timescale of our experiments, was controlled by other factors besides aerobic respiration. One possible explanation is consumption of DO via redox reactions, as proposed above. Alternatively, DO can stimulate CO2 production, potentially associated with organic matter decomposition around roots in anaerobic soils (e.g., Barreto et al., 2018).
Although there was no significant difference in N2O responses associated with soil and sediment additions from the different transect positions (Figure 2D), we observed higher maxima and variability for both rarely inundated locations (Transition and Upland, Table S1), suggesting that N2O emissions may be higher when seawater is exposed to soils from rarely inundated regions. Increasing N2O emissions with decreasing inundation frequency is consistent with a recent synthesis of vegetation, where N2O emissions were generally higher with increasing elevation/decreasing inundation extent (Rosentreter et al., 2021). This is noteworthy, as inundation regimes are moving inland into rarely inundated locations in many coastal regions due to sea level rise (Ensign and Noe, 2018). The difference in effect size for N2O at Upland sites (Figure 3) may support the importance of transitional zone soils as potential GHG control points under increased flooding conditions, though these responses are likely system-specific. We also note that N2O is highly variable in coastal marshes (Capooci et al., 2019; Capooci and Vargas, 2022), and a larger sample size (and potentially a longer experiment duration) would be needed to explore this suggestion.
Our SGWP calculations indicated that short-term mixing of surface soils or sediments with seawater drives relatively rapid production of GHGs, where CO2 is the largest contributor to SGWP rates associated with soil and sediment inputs for all transect locations (Figure 3). Trends along the inundation gradient for GWP mirror our findings in Figure 2, where increasing GWP from Sediment to Upland follows CO2 rate patterns (Figure 3A), and the relative importance of N2O (Figure 3B) follows higher N2O rates in Transition and Upland samples (Figure 3B). Our results indicating higher GWP with decreasing inundation frequency also match previous microcosm experiments, which found that GWP decreased when the water table was closer to the surface (Zhao et al., 2020). The increasing trend along the terrestrial-aquatic interface from Sediment to Upland is also potentially related to N2O production from Transition and Upland soils mobilized during flooding, which may become an increasingly important GHG vector, as suggested above. However, we note that the complex interplay between drivers of N2O production, including nitrification/denitrification and microbial community composition (e.g., Zhang et al., 2019) will all respond to changes in inundation, which will likely influence this pattern. Interestingly, we observed a warming effect of CH4 in Wetland soils, consistent with observations of CH4 emissions reported for various wetlands (Gatland et al., 2014). One suggestion is that wetland soils have been shown to increase CH4 production after rapid exposure to oxygen in a redox-cycled environment (Wilmoth et al., 2021). Our observation of considerable CH4 production by mixing of seawater with Wetland soils relative to all other transect locations supports this explanation, where redox cycling associated with tidal flooding is likely strongest for the Wetland location (frequently inundated) compared to Sediments (continuously inundated) or Transition/Upland locations (rarely or never inundated). We note that our SGWP calculations are based on a very short time-period (i.e., a pulse response), and GHG dynamics likely change over longer incubation periods, so these results can only be interpreted as initial responses, and do not represent the cumulative SGWP of these systems.
4.2 Heterogeneity in drivers of aquatic biogeochemical responses to soil additions
Patterns in gas dynamics related to soil and sediment additions from different transect locations (Figure 2), correlations to environmental factors (Figure 4), and PCA results (Figure 5) all provide different levels of insight into the potential drivers of aquatic DO and GHG responses to soil inputs. Significant (p < 0.05) changes between frequently inundated (Sediment and Wetland) and rarely inundated (Transition and Upland) locations for DO, CO2, and CH4 suggest that antecedent flooding frequency plays an important role in how coastal aquatic biogeochemical cycles respond to soil or sediment inputs (Figure 2). This is consistent with previous literature which shows that flooding impacts GHG and oxygen dynamics in wetlands (Gatland et al., 2014; Regier et al., 2021; Regier et al., 2023).
Consistent with H2, we observed significant correlations between CO2 and surface water salinity/pH for frequently inundated locations, but not for rarely inundated locations (Figure 4), which indicates the influence of surface water chemistry did not extend to Transition or Upland locations. The CO2-salinity relationships for frequently inundated locations (Sediment and Wetland) were both negative (Figure 4), consistent with mesocosm experiments showing salt inhibited CO2 production (Ardón et al., 2018). Since inundation is the defining characteristic for our transect locations, we also expected to see correlations to GWC but observed none in Figure 4.
Our PCA allowed us to explore which factors distinguished the transect locations from each other, primarily gas rates, soil physicochemical parameters (TC, TN, soil C:N, and GWC), and elevation (Figure 5). This partially supports H2, where PC2 loadings for C:N ratios and GWC relate to differences in transect locations (generally higher GWC and lower soil C:N ratios for Upland sites and vice versa for Wetland sites). The distributions of each transect location in PCA space also suggest shifting relationships (and potentially drivers). While Sediment samples vary primarily along PC2, Wetland and Transition samples vary along both axes (with Transition occupying a much larger area, indicative of large variance in the variables selected for the PCA), and Upland samples largely vary across PC1. Although we do not want to over-interpret this pattern, it suggests there may be shifting relationships between gas rates and soil physicochemical properties across the coastal terrestrial-aquatic interface that may be generalizable across regional scales. We also note that the Transition transect location occupies the largest PCA space, matching our expectation that this transect location between Wetland and Upland is the most variable across our study sites (Figure 5).
Despite collecting a broad suite of explanatory variables, identifying generalizable relationships between DO/GHG rates and environmental characteristics remained challenging, with correlations changing between transect locations (Figure 4), and variables selected for PCA only explaining about half the variance in the dataset. Our findings mirror studies seeking to identify drivers of coastal DO and GHG dynamics, including a study in the Mid-Atlantic that found no significant relationships between N2O flux and 20 potential environmental drivers (Batson et al., 2015). We note that there are limitations based on our experimental design that should be considered when interpreting our results. We did not measure initial concentrations of GHGs in seawater and assumed atmospheric concentrations. Further, we did not measure DO consumption in the seawater control and assumed negligible DO consumption over the 24-hour incubation period. In addition, our single point of measurement at the end of each experiment for GHG concentrations used to calculate rates assumes linear behavior across the 24-hour incubation period. Based on non-linear behavior in DO consumption observed in this study and others (e.g., Patel et al., 2022), and potential relationships between DO and GHG rates (e.g., Figures 2, 5), higher-frequency sampling was not logistically feasible for this experiment. We suggest that future studies incorporating high-frequency in-situ sensors for GHGs would more accurately quantify GHG production rates through time, and help capture potential non-linearity.
We observed some consistent patterns along the gradient of inundation frequency in the production/consumption rates of DO and GHGs (Figure 2), their GWP (Figure 3), and relationships to environmental factors, including DO and GHG rates (Figure 5). Our results also suggest that, while some clear patterns exist, defining the specific drivers of individual gas species responses to soil/sediment and surface water mixing remains difficult to generalize across regional spatial scales. This may be partly due in part to the limitations discussed above: our relatively small sample size, the limited experimental duration, or the diversity of systems sampled. However, when given all variables in Figure 4, we note that the Random Forest model indicated all four gas rates (in addition to environmental factors) were important for differentiating transect locations (Figure S3). While Figures 2, 4 suggested high variability, Figure 5 suggests that understanding DO and GHG rates is critical for understanding biogeochemical cycling variability across coastal terrestrial-aquatic interfaces. Thus, further studies incorporating larger sample sets and exploring other coastal regions will be beneficial for constraining the dynamics and drivers of oxygen and GHGs across coastal terrestrial-aquatic interfaces. We highlight that our controlled experiment provides insights into short-term responses of seawater exposed to soils and sediments across with different hydrologic regimes at the microcosm scale, which cannot accurately represent the complexity of coastal ecosystem processes. Long-term experiments of water inundation events in mesocosms (Capooci et al., 2019) or at the ecosystem scale (Hopple et al., 2023) will be fundamental for incorporating environmental complexity. These future experiments will improve our ability to predict how changing inundation along coastlines will ultimately alter coastal biogeochemistry.
Data availability statement
The datasets presented in this study can be found in online repositories. The names of the repository/repositories and accession number(s) can be found below: https://github.com/COMPASS-DOE/ec1_ghg_paper, https://data.ess-dive.lbl.gov/view/doi:10.15485/1960313, https://data.ess-dive.lbl.gov/view/doi:10.15485/2222680.
Author contributions
PR: Conceptualization, Data curation, Formal Analysis, Investigation, Methodology, Resources, Software, Supervision, Validation, Visualization, Writing – original draft, Writing – review & editing. NW: Conceptualization, Data curation, Funding acquisition, Investigation, Methodology, Project administration, Resources, Supervision, Validation, Writing – review & editing. AI: Conceptualization, Formal Analysis, Investigation, Methodology, Writing – review & editing. AB: Investigation, Resources, Writing – review & editing. DD: Data curation, Investigation, Resources, Writing – review & editing. JM: Data curation, Investigation, Software, Writing – review & editing. KP: Conceptualization, Validation, Writing – review & editing. RV: Conceptualization, Validation, Writing – review & editing. JZ: Conceptualization, Validation, Writing – review & editing. EC: Conceptualization, Writing – review & editing. AM: Conceptualization, Data curation, Investigation, Project administration, Resources, Supervision, Validation, Writing – review & editing.
Consortium authorship
Silver Alford1, Michael P Back2, Vanessa Bailey3, Andrew H Baldwin1, Jade Bolinger4, Madison Bowe5, Maxim I. Boyanov6, Jacob A. Cianci-Gaskill4, Nathan A. Conroy7, Matthew J. Cooper8, Donnie Day9, Alex Demeo10, Kyle Derby11, Derek Detweiler10, Suzanne Devres-Zimmerman12, Erin Eberhard13, Keryn Gedan14, LeeAnn Haaf15, Khadijah K. Homolka5, Erin Johnson16, Kenneth M. Kemner6, Aliya Khan14, Matthew Kirwan10, Payton Kittaka17, Erika Koontz18, Adam Langley16, Riley Leff14, Scott Lerberg10, Allison M. Lewis19, Sairah Malkin20, Amy M. Marcarelli13, Steven E. McMurray4, Tyler Messerschmidt10, Taylor C. Michael2, Holly A. Michael21, Elizabeth C. Minor22, Brian Moye1, Thomas J. Mozdzer23, Allison N. Myers-Pigg5,9, Scott Neubauer24, Cooper G. Norris3, Edward J. O’Loughlin6, Opal Otenburg5, Andrea Pain20, Kaizad F. Patel3, Stephanie C. Pennington25, Michael Philben12, Evan Phillips18, Dannielle Pratt21, Peter Regier5, J. Alan Roebuck Jr.5, Lauren Sage16, Daniel Sandborn22, Stacy Smith26, Alex Smith10, Samina Soin-Voshell27, Bongkeun Song10, Amanda Sprague-Getsy21, Kari St Laurent28, Lorie Staver20, Alice Stearns18, Lucie Stetten6, Rebecca Swerida11, Ethan J. Theuerkauf29, Katherine Tully1, Rodrigo Vargas21, Nicholas D Ward5, Elizabeth Watson30, Coreen Weilminster27, 1University of Maryland, College Park, MD. 2Kent State University, Kent, OH. 3Pacific Northwest National Laboratory, Richland, WA. 4Old Woman Creek National Estuarine Research Reserve, Huron, OH. 5Pacific Northwest National Laboratory, Sequim, WA. 6Argonne National Laboratory, Lemont, IL. 7Los Alamos National Laboratory, Los Alamos, NM. 8Central Michigan University, Institute for Great Lakes Research, Mount Pleasant, MI. 9University of Toledo, Toledo, OH. 10Virginia Institute of Marine Science, Gloucester Point, VA. 11Maryland Department of Natural Resources, Annapolis, MD. 12Hope College, Holland, MI. 13Michigan Technological University, Houghton, MI. 14George Washington University, Washington, DC. 15Partnership for the Delaware Estuary, Wilmington, DE. 16Villanova University, Villanova, PA. 17University of Minnesota, St. Paul, MN. 18Smithsonian Environmental Research Center, Edgewater, MD. 19Lawrence Berkeley National Laboratory, Berkeley, CA. 20University of Maryland Center for Environmental Science, Cambridge, MD. 21University of Delaware, Newark, DE. 22Large Lakes Observatory, University of Minnesota, Duluth, MN. 23Bryn Mawr College, Bryn Mawr, PA. 24Virginia Commonwealth University, Richmond, VA. 25Pacific Northwest National Laboratory, College Park, MD. 26Delaware State University, Dover, DE. 27Chesapeake Bay National Estuarine Research Reserve - Maryland, Annapolis, MD. 28Delaware Department of Natural Resources and Environmental Control, Dover, DE. 29Michigan State University, East Lansing, MI. 30Stony Brook University, Stony Brook, NY.
Funding
The author(s) declare financial support was received for the research, authorship, and/or publication of this article. This study was supported by COMPASS-FME, a multi-institutional project supported by DOE-BER as part of the Environmental System Science Program. The Pacific Northwest National Laboratory is operated for DOE by Battelle Memorial Institute under contract DE-AC05-76RL01830.
Conflict of interest
The authors declare that the research was conducted in the absence of any commercial or financial relationships that could be construed as a potential conflict of interest.
Publisher’s note
All claims expressed in this article are solely those of the authors and do not necessarily represent those of their affiliated organizations, or those of the publisher, the editors and the reviewers. Any product that may be evaluated in this article, or claim that may be made by its manufacturer, is not guaranteed or endorsed by the publisher.
Supplementary material
The Supplementary Material for this article can be found online at: https://www.frontiersin.org/articles/10.3389/fmars.2023.1308590/full#supplementary-material
References
Aller R. C., Cochran J. K. (2019). The critical role of bioturbation for particle dynamics, priming potential, and organic C remineralization in marine sediments: local and basin scales. Front. Earth Sci. 7. doi: 10.3389/feart.2019.00157
Ardón M., Helton A. M., Bernhardt E. S. (2018). Salinity effects on greenhouse gas emissions from wetland soils are contingent upon hydrologic setting: a microcosm experiment. Biogeochemistry 140 (2), 217–232. doi: 10.1007/s10533-018-0486-2
Barreto C. R., Morrissey E. M., Wykoff D. D., Chapman S. K. (2018). Co-occurring mangroves and salt marshes differ in microbial community composition. Wetlands 38 (3), 497–508. doi: 10.1007/s13157-018-0994-9
Batson J., Noe G. B., Hupp C. R., Krauss K. W., Rybicki N. B., Schenk E. R. (2015). Soil greenhouse gas emissions and carbon budgeting in a short-hydroperiod floodplain wetland. J. Geophysical Research: Biogeosciences 120 (1), 77–95. doi: 10.1002/2014JG002817
Beaudette D., Skovlin J., Roecker S., Brown A. (2023) soilDB: soil Database Interface (Version 2.7.7). Available at: https://cran.r-project.org/web/packages/soilDB/index.html.
Bianchi T. S., DiMarco S. F., Smith R. W., Schreiner K. M. (2009). A gradient of dissolved organic carbon and lignin from Terrebonne–Timbalier Bay estuary to the Louisiana shelf (USA). Mar. Chem. 117 (1), 32–41. doi: 10.1016/j.marchem.2009.07.010
Capooci M., Barba J., Seyfferth A. L., Vargas R. (2019). Experimental influence of storm-surge salinity on soil greenhouse gas emissions from a tidal salt marsh. Sci. Total Environ. 686, 1164–1172. doi: 10.1016/j.scitotenv.2019.06.032
Capooci M., Vargas R. (2022). Trace gas fluxes from tidal salt marsh soils: implications for carbon–sulfur biogeochemistry. Biogeosciences 19 (19), 4655–4670. doi: 10.5194/bg-19-4655-2022
Chapman S. K., Hayes M. A., Kelly B., Langley J. A. (2019). Exploring the oxygen sensitivity of wetland soil carbon mineralization. Biol. Lett. 15 (1), 20180407. doi: 10.1098/rsbl.2018.0407
Conrad R. (2020). Methane production in soil environments—Anaerobic biogeochemistry and microbial life between flooding and desiccation. Microorganisms 8 (6), 881. doi: 10.3390/microorganisms8060881
DeLaune R. D., White J. R. (2012). Will coastal wetlands continue to sequester carbon in response to an increase in global sea level?: a case study of the rapidly subsiding Mississippi river deltaic plain. Climatic Change 110 (1), 297–314. doi: 10.1007/s10584-011-0089-6
Diefenderfer H. L., Cullinan V. I., Borde A. B., Gunn C. M., Thom R. M. (2018). High-frequency greenhouse gas flux measurement system detects winter storm surge effects on salt marsh. Global Change Biol. 24 (12), 5961–5971. doi: 10.1111/gcb.14430
Du J., Shen J., Zhang Y. J., Ye F., Liu Z., Wang Z., et al. (2018). Tidal response to sea-level rise in different types of estuaries: the importance of length, bathymetry, and geometry. Geophysical Res. Lett. 45 (1), 227–235. doi: 10.1002/2017GL075963
Duarte C. M., Prairie Y. T. (2005). Prevalence of heterotrophy and atmospheric co2 emissions from aquatic ecosystems. Ecosystems 8 (7), 862–870. doi: 10.1007/s10021-005-0177-4
Elberling B., Askaer L., Jørgensen C. J., Joensen H. P., Kühl M., Glud R. N., et al. (2011). Linking soil O2, CO2, and CH4 concentrations in a wetland soil: implications for CO2 and CH4 fluxes. Environ. Sci. Technol. 45 (8), 3393–3399. doi: 10.1021/es103540k
Ensign S. H., Noe G. B. (2018). Tidal extension and sea-level rise: recommendations for a research agenda. Front. Ecol. Environ. 16 (1), 37–43. doi: 10.1002/fee.1745
Fettrow S., Jeppi V., Wozniak A., Vargas R., Michael H., Seyfferth A. L. (2023a). Physiochemical controls on the horizontal exchange of blue carbon across the salt marsh-tidal channel interface. J. Geophysical Research: Biogeosciences 128 (6), e2023JG007404. doi: 10.1029/2023JG007404
Fettrow S., Vargas R., Seyfferth A. L. (2023b). Experimentally simulated sea level rise destabilizes carbon-mineral associations in temperate tidal marsh soil. Biogeochemistry 163 (2), 103–120. doi: 10.1007/s10533-023-01024-z
Fichot C. G., Benner R. (2014). The fate of terrigenous dissolved organic carbon in a river-influenced ocean margin. Global Biogeochemical Cycles 28 (3), 300–318. doi: 10.1002/2013GB004670
Ganju N. K., Defne Z., Elsey-Quirk T., Moriarty J. M. (2019). Role of tidal wetland stability in lateral fluxes of particulate organic matter and carbon. J. Geophysical Research: Biogeosciences 124 (5), 1265–1277. doi: 10.1029/2018JG004920
Gao G.-F., Peng D., Tripathi B. M., Zhang Y., Chu H. (2020). Distinct community assembly processes of abundant and rare soil bacteria in coastal wetlands along an inundation gradient. mSystems 5 (6), e01150–e01120. doi: 10.1128/mSystems.01150-20
Gatland J. R., Santos I. R., Maher D. T., Duncan T. M., Erler D. V. (2014). Carbon dioxide and methane emissions from an artificially drained coastal wetland during a flood: Implications for wetland global warming potential. J. Geophysical Research: Biogeosciences 119 (8), 1698–1716. doi: 10.1002/2013JG002544
Green M. O., Coco G. (2014). Review of wave-driven sediment resuspension and transport in estuaries. Rev. Geophysics 52 (1), 77–117. doi: 10.1002/2013RG000437
Guenet B., Danger M., Harrault L., Allard B., Jauset-Alcala M., Bardoux G., et al. (2014). Fast mineralization of land-born C in inland waters: first experimental evidences of aquatic priming effect. Hydrobiologia 721 (1), 35–44. doi: 10.1007/s10750-013-1635-1
Holmquist J. R., Windham-Myers L., Bernal B., Byrd K. B., Crooks S., Gonneea M. E., et al. (2018). Uncertainty in United States coastal wetland greenhouse gas inventorying. Environ. Res. Lett. 13 (11), 115005. doi: 10.1088/1748-9326/aae157
Hopkinson C. S., Wei-Jun C., Xinping H. (2012). Carbon sequestration in wetland dominated coastal Systems—a global sink of rapidly diminishing magnitude. Current Opinion in Environmental Sustainability, Carbon and nitrogen cycles 4 (2), 186–194. doi: 10.1016/j.cosust.2012.03.005
Hopple A. M., Doro K. O., Bailey V. L., Bond-Lamberty B., McDowell N., Morris K. A., et al. (2023). Attaining freshwater and estuarine-water soil saturation in an ecosystem-scale coastal flooding experiment. Environ. Monit. Assess. 195 (3), 425. doi: 10.1007/s10661-022-10807-0
Kendall M. G. (1938). A new measure of rank correlation. Biometrika 30 (1–2), 81–93. doi: 10.1093/biomet/30.1-2.81
Kroeger K. D., Crooks S., Moseman-Valtierra S., Tang J. (2017). Restoring tides to reduce methane emissions in impounded wetlands: A new and potent Blue Carbon climate change intervention. Sci. Rep. 7 (1), 11914. doi: 10.1038/s41598-017-12138-4
Leonardi N., Ganju N. K., Fagherazzi S. (2016). A linear relationship between wave power and erosion determines salt-marsh resilience to violent storms and hurricanes. Proc. Natl. Acad. Sci. 113 (1), 64–68. doi: 10.1073/pnas.1510095112
Machado-Silva F., Weintraub M., Ward N., Doro K. O., Regier P. J., Ehosioke S., et al. (2023). Groundwater redox dynamics across the terrestrial-aquatic interface of Lake Erie coastal ecosystems. bioRxiv. doi: 10.1101/2023.06.12.544684
Martinez M., Ardón M. (2021). Drivers of greenhouse gas emissions from standing dead trees in ghost forests. Biogeochemistry 154 (3), 471–488. doi: 10.1007/s10533-021-00797-5
Myers-Pigg A., Pennington S. C., Homolka K. K., Lewis A. M., Otenburg O., Patel K. F., et al. (2023). Biogeochemistry of soils, sediments, and surface waters across the upland to wetland gradient of coastal interfaces. Scientific Data 10, 822.
Neubauer S. C., Megonigal J. P. (2015). Moving beyond global warming potentials to quantify the climatic role of ecosystems. Ecosystems 18 (6), 1000–1013. doi: 10.1007/s10021-015-9879-4
Norwood M. J., Ward N. D., McDowell N. G., Myers-Pigg A. N., Bond-Lamberty B., Indivero J., et al. (2021). Coastal forest seawater exposure increases stem methane concentration. J. Geophysical Research: Biogeosciences 126 (2), e2020JG005915. doi: 10.1029/2020JG005915
Patel K. F., Rod K. A., Norris C., Kaufman M., Megonigal P., Weintraub M. N., et al. (2022). Time to anoxia: oxygen consumption in soils varies across a coastal gradient 2022, GC46D-08. Presented at AGU Fall Meeting Abstracts. doi: 10.2139/ssrn.4534453
Pedersen T. L. (2022) ggraph: An Implementation of Grammar of Graphics for Graphs and Networks (Version 2.1.0). Available at: https://cran.r-project.org/web/packages/ggraph/index.html.
Pennington S. C., Alford S., Back M. P., Bailey V., Baldwin A., Bolinger J., et al. (2023). EXCHANGE Campaign 1: A Community-Driven Baseline Characterization of Soils, Sediments, and Water Across Coastal Gradients. (Environmental System Science Data Infrastructure for a Virtual Ecosystem (ESS-DIVE) repository). doi: 10.15485/1960313
Pitz S., Megonigal J. P. (2017). Temperate forest methane sink diminished by tree emissions. New Phytol. 214 (4), 1432–1439. doi: 10.1111/nph.14559
R Core Team (2021). R: A Language and Environment for Statistical Computing (Vienna, Austria: R Core Team).
Regier P., Ward N. D., Indivero J., Moore C. W., Norwood M., Myers-Pigg A. (2021). Biogeochemical control points of connectivity between a tidal creek and its floodplain. Limnology Oceanography Lett. 6 (3), 134–142. doi: 10.1002/lol2.10183
Regier P., Ward N. D., Myers-Pigg A. N., Grate J., Freeman M. J., Ghosh R. N. (2023). Seasonal drivers of dissolved oxygen across a tidal creek–marsh interface revealed by machine learning. Limnology Oceanography 67 (10), 2359–2374. doi: 10.1002/lno.12426
Regnier P., Resplandy L., Najjar R. G., Ciais P. (2022). The land-to-ocean loops of the global carbon cycle. Nature 603 (7901), 401–410. doi: 10.1038/s41586-021-04339-9
Rosentreter J. A., Al-Haj A. N., Fulweiler R. W., Williamson P. (2021). Methane and nitrous oxide emissions complicate coastal blue carbon assessments. Global Biogeochemical Cycles 35 (2), e2020GB006858. doi: 10.1029/2020GB006858
Seyfferth A. L., Bothfeld F., Vargas R., Stuckey J. W., Wang J., Kearns K., et al. (2020). Spatial and temporal heterogeneity of geochemical controls on carbon cycling in a tidal salt marsh. Geochimica Cosmochimica Acta 282, 1–18. doi: 10.1016/j.gca.2020.05.013
Sparks A. H., Scott C., Hazel K., Alison B., et al. (2023) nasapower: NASA POWER API Client (Version 4.0.10). Available at: https://cran.r-project.org/web/packages/nasapower/index.html.
Ward N. D., Bianchi T. S., Medeiros P. M., Seidel M., Richey J. E., Keil R. G., et al. (2017). Where carbon goes when water flows: carbon cycling across the aquatic continuum. Front. Mar. Sci. 4. doi: 10.3389/fmars.2017.00007
Ward N. D., Indivero J., Gunn C., Wang W., Bailey V., McDowell N. G. (2019b). Longitudinal gradients in tree stem greenhouse gas concentrations across six Pacific Northwest Coastal forests. J. Geophysical Research: Biogeosciences 124 (6), 1401–1412. doi: 10.1029/2019JG005064
Ward N. D., Megonigal J. P., Bond-Lamberty B., Bailey V. L., Butman D., Canuel E. A., et al. (2020). Representing the function and sensitivity of coastal interfaces in Earth system models. Nat. Commun. 11 (1), 2458. doi: 10.1038/s41467-020-16236-2
Ward N. D., Morrison E. S., Liu Y., Rivas-Ubach A., Osborne T. Z., Ogram A. V., et al. (2019a). Marine microbial community responses related to wetland carbon mobilization in the coastal zone. Limnology Oceanography Lett. 4 (1), 25–33. doi: 10.1002/lol2.10101
Wilmoth J. L., Schaefer J. K., Schlesinger D. R., Roth S. W., Hatcher P. G., Shoemaker J. K., et al. (2021). The role of oxygen in stimulating methane production in wetlands. Global Change Biol. 27 (22), 5831–5847. doi: 10.1111/gcb.15831
Wilson C. A., Allison M. A. (2008). An equilibrium profile model for retreating marsh shorelines in southeast Louisiana. Estuarine Coast. Shelf Sci. 80 (4), 483–494. doi: 10.1016/j.ecss.2008.09.004
Wright M. N., Ziegler A. (2017). ranger: A fast implementation of random forests for high dimensional data in C++ and R. J. Stat. Software 77 (1), 1–17. doi: 10.18637/jss.v077.i01
Zhang Y., Ji G., Wang C., Zhang X., Xu M. (2019). Importance of denitrification driven by the relative abundances of microbial communities in coastal wetlands. Environ. pollut. 244, 47–54. doi: 10.1016/j.envpol.2018.10.016
Keywords: greenhouse gases, dissolved oxygen, aquatic carbon cycle, terrestrial-aquatic interface, coastal inundation
Citation: Regier P, Ward ND, Izquierdo A, Baldwin AH, Day D, McElhinny J, Patel K, Vargas R, Zheng J, Exchange Consortium and Myers-Pigg A (2023) Coastal inundation regime moderates the short-term effects of sediment and soil additions on seawater oxygen and greenhouse gas dynamics: a microcosm experiment. Front. Mar. Sci. 10:1308590. doi: 10.3389/fmars.2023.1308590
Received: 06 October 2023; Accepted: 21 November 2023;
Published: 11 December 2023.
Edited by:
Feng Pan, Xiamen University, ChinaCopyright © 2023 Regier, Ward, Izquierdo, Baldwin, Day, McElhinny, Patel, Vargas, Zheng, Exchange Consortium and Myers-Pigg. This is an open-access article distributed under the terms of the Creative Commons Attribution License (CC BY). The use, distribution or reproduction in other forums is permitted, provided the original author(s) and the copyright owner(s) are credited and that the original publication in this journal is cited, in accordance with accepted academic practice. No use, distribution or reproduction is permitted which does not comply with these terms.
*Correspondence: Peter Regier, peter.regier@pnnl.gov; Allison Myers-Pigg, allison.myers-pigg@pnnl.gov