Coupled Evolution of Preferential Paths for Force and Damage in the Pre-failure Regime in Disordered and Heterogeneous, Quasi-Brittle Granular Materials
 Antoinette Tordesillas
 Sanath Kahagalage
 Charl Ras1
 - 1School of Mathematics & Statistics, The University of Melbourne, Parkville, VIC, Australia
- 2Faculty of Civil and Environmental Engineering, Gdańsk University of Technology, Gdańsk, Poland
A disordered and heterogeneous, quasi-brittle granular material can withstand certain levels of internal damage before global failure. This robustness depends not just on the bond strengths but also on the topology and redundancy of the bonded contact network, through which forces and damage propagate. Despite extensive studies on quasi-brittle failure, there still lacks a unified framework that can quantitatively characterize and model the interdependent evolution of damage and force transmission. Here we develop a framework to do so. It is data-driven, multiscale and relies solely on the contact strengths and topology of the contact network for material properties. The discrete element method (DEM) was used to directly simulate quasi-brittle materials like concrete under uniaxial tension. Concrete was modeled as a random heterogeneous 2-phase and 3-phase material composed of aggregate particles, cement matrix and interfacial transitional zones with experimental-based meso-structure from X-ray micro-CT-images of real concrete. We uncover evidence of an optimized force transmission, characterized by two novel transmission patterns that predict and explain the coupled evolution of force and damage pathways from the microstructural to the macroscopic level. The first comprises the shortest possible percolating paths that can transmit the global force transmission capacity. These paths reliably predict tensile force chains. The second pattern is the flow bottleneck, a path in the optimized route that is prone to congestion and is where the macrocrack emerges. The cooperative evolution of preferential pathways for damage and force casts light on why sites of highest concentrations of stress and damage in the nascent stages of pre-failure regime do not provide a reliable indicator of the ultimate location of the macrocrack.
1. Introduction
Mankind has used concrete and rocks to build cities for centuries. Yet many important questions remain open about the mechanisms that make these materials strong and robust. One of these concerns the coupled evolution of the preferential pathways for damage and force (Potyondy and Cundall, 2004; Lan et al., 2010; Jiang et al., 2011; Xiao et al., 2012; Duan et al., 2015; Nitka and Tejchman, 2015, 2018; Suchorzewski et al., 2018b; McBeck et al., 2019; Vu et al., 2019). For a subclass of these assemblies of bonded grains, in which damage is solely due to bond breakage, simulations and experiments have shown that this evolution arises from a non-trivial interplay between: (a) the forces that the bonds can bear before they break (Potyondy and Cundall, 2004; Nitka and Tejchman, 2015; Oliver-Leblond, 2019), and (b) the availability of alternative paths to which forces can be redirected to minimize damage (Potyondy and Cundall, 2004; Cho et al., 2007; Lan et al., 2010; Ovalle et al., 2013; Huang and Zhu, 2018; Oliver-Leblond, 2019). The former is simply the bond strength, which is a microscale (contact) property (Potyondy and Cundall, 2004; Cho et al., 2007; Nitka and Tejchman, 2015). The latter is a multiscale (topological) property of the contact network, which evolves with the loading and boundary conditions, as well as endogenous mechanisms like strain localization (Ord and Hobbs, 2010; Nitka and Tejchman, 2014, 2018; Skarżyński et al., 2015; Skarżyński and Tejchman, 2016, 2019; Suchorzewski et al., 2018a). For disordered and heterogeneous quasi-brittle granular materials, the evolution of this complex network and associated preferential pathways has proved difficult to characterize quantitatively, even in relatively simple uniaxial tests (Duan et al., 2015; Nitka and Tejchman, 2015; Suchorzewski et al., 2018b; McBeck et al., 2019; Oliver-Leblond, 2019; Vu et al., 2019). Various mechanisms relating to the preferred pathways for force and damage have been observed, including: force chains (Jiang et al., 2011; Duan et al., 2015; Nitka and Tejchman, 2015, 2018; Sinaie et al., 2018; McBeck et al., 2019) and their collapse by buckling under compression and shear (Ord and Hobbs, 2010; Scholtes and Donze, 2013; Liu et al., 2019), crack interaction (Potyondy and Cundall, 2004; Duan et al., 2015), and strain localization (Ord and Hobbs, 2010; Nitka and Tejchman, 2014, 2018; Skarżyński et al., 2015; Skarżyński and Tejchman, 2016, 2019; Suchorzewski et al., 2018a). However, what is still lacking is a single theoretical framework that can account for the interplay between bond strengths and contact topology and, accordingly, predict and explain the coupled evolution of preferential pathways for damage and force (Lan et al., 2010; Duan et al., 2015; McBeck et al., 2019; Oliver-Leblond, 2019). Overcoming this knowledge gap is essential for the prediction and control of mechanical performance as well as rational design of mechanically robust particulate materials by optimization of their microstructure (e.g., Schenker et al., 2008; Gu et al., 2013; Yin et al., 2015; Suzuki et al., 2016; Agnew et al., 2018; Kondo et al., 2019). Here we seek to fill this knowledge gap.
A starting point for this investigation is the work of Ord and Hobbs (Ord and Hobbs, 2010). They used discrete element simulations to examine damage patterns in deforming rocks and then modeled the propagation of damage using the concept of Turing instabilities, henceforth treating damage as interacting-competing defects that diffused through the rock mass. Here we similarly analyze the “diffusion” of damage but in a manner that is coupled with force transmission within a graph-theoretic framework, namely, Network Flow Theory. In our formulation, detailed attention is paid to redundancy—the presence of multiple feasible paths for force transfer. When a bond breaks1, flow is redirected to alternative paths. Consequently, previously latent paths may suddenly become important for force transfer, thus predisposing associated bonded contacts to breakage. In the high-stress regime, a critical state is ultimately reached where most bonds are close to breaking point. In this case, damage to a contact may trigger a cascade of force chain failures and, in turn, precipitate catastrophic failure (Ord and Hobbs, 2010; Nitka and Tejchman, 2015; Zhao et al., 2018; Liu et al., 2019; McBeck et al., 2019). This sequence of events demands a framework that can account for the different bond strengths as well as all the available pathways for force transfer across the scales—across a contact, between member contacts in individual force chains, and between all force chains and their supporting neighbors.
To minimize simplifying assumptions, we formulate instead a data-driven network flow model that depends on the bonded contact network and the bond strengths for its input. We demonstrate this approach using data from two-dimensional discrete element simulations of concrete specimens under quasistatic uniaxial tension (van Mier and van Vliet, 2002; Nitka and Tejchman, 2015). We choose these tests because their pre-failure mechanics is governed by a contact network topology that changes solely from a progressive loss of contacts due to bond breakage under tension. Essentially no new contacts form from grain rearrangements prior to failure, as likewise found by Ord and Hobbs (Ord and Hobbs, 2010) in their compression tests. That is, each specimen responds to damage solely by “rerouting” force transfer to alternative pre-existing pathways: no “rewiring” occurs that results in new pathways for force transmission. This constrained evolution of the contact network presents an ideal baseline for demonstrating the essential elements of this framework in an explicit manner, while still retaining the key elements of force transfer and failure germane to quasi-brittle granular materials under uniaxial tension (van Mier and van Vliet, 2002; Nitka and Tejchman, 2015).
The paper is arranged as follows. A brief summary of related past work is given in section 2. In section 3, we discuss the data examined, before presenting our proposed framework in section 4. Results are given in section 5 with the key findings discussed in section 6. We conclude in section 7. Further details are also provided in (Tordesillas et al., 2018).
2. Related Past Work
The framework we propose is drawn from the network flow theory (Ahuja et al., 1993). The aim of a network flow analysis is to optimize the flow of an entity through a network, given the network topology and finite link capacities that cannot be exceeded. This problem arises in many settings: traffic on a road network, fluid in a pipeline network, data on the Internet, electricity on a power grid, etc. (DueÃas-Osorio and Vemuru, 2009; West and Scafetta, 2010; Estrada et al., 2012; Patel et al., 2018; van der Linden et al., 2019). In general, this process involves an evolution on and of the network; that is, the flow that takes place on the network can change the structure of the network, and vice versa (Ahuja et al., 1993; van der Linden et al., 2019). For example, a link may break when flow reaches or exceeds its capacity: this changes the network topology and, in turn, the flows both with respect to the paths they take and the fraction of flow allocated to each path. Among the most actively studied in recent decades are the performance and resilience of complex flow networks (viz., heterogeneous networks with inherent redundancies) in challenging environments where disruptions to transmission are the norm (DueÃas-Osorio and Vemuru, 2009; West and Scafetta, 2010; Estrada et al., 2012; van der Linden et al., 2019). The problems of interest here belong to this class.
The link capacities, established from models and/or empirical measurements, quantify the different forms of disruption to the flow: disconnections and/or degraded transmission. With these and the network topology as “input,” a network flow analysis generates several “output” information including: the maximum flow that can be transmitted through the entire network (global capacity), the corresponding flows transmitted through the individual network links when the network transmits at the global capacity, and key transmission patterns such as the preferential flow paths and the flow bottleneck (i.e., that part of the network that is most vulnerable to congestion, with a total capacity equal to the global capacity).
We have tested the potential of a network flow approach in the characterization and modeling of force transmission from data in various 2D and 3D granular systems (Tordesillas et al., 2013, 2015a,b; Lin and Tordesillas, 2014; Kahagalage et al., 2017) and, more recently, in a biostructure like the paddlefish rostrum (Patel et al., 2018). Data came from high performance computational mechanics models which were supported by physical experiments with respect to the model calibration and micro/meso-structural information. Various natural and synthetic granular materials (i.e., Ottawa, Caicos ooid, silica sands, and sandstone using X-ray μCT, photoelastic particles using birefringence measurements) have been examined under different loading conditions: triaxial compression, biaxial compression (constant volume, constant confining pressure), uniaxial compression, simple shear, pure shear and uniaxial tension. Granular deformation occurred in the presence of multiple failure mechanisms including: slip and rolling at contacts, force chain buckling, bond breakage and grain fracture. In all these studies, the network nodes represented the grains, while the network links represented the contacts, bonded or unbonded. By this definition, the link capacity corresponds to the contact strength: the maximum force that the contact can support before breaking. Due to the general lack of a priori information on the contact strengths, various proxy models were used to estimate them based on the local topology of the grains engaged in the contact. Crucially, the coupled evolution of damage and force transmission was not addressed in these studies.
3. Data
The data sets come from a family of discrete element (DEM) models of fracture in concrete, in which particular attention was paid to modeling the meso-scale structure of real concrete from X-ray micro-computed tomography images (Nitka and Tejchman, 2015, 2018; Skarżyński et al., 2015; Suchorzewski et al., 2018a,b; Skarżyński and Tejchman, 2019). These models in two- and three-dimensions were developed for 2-phase (aggregate, cement matrix), 3-phase [aggregate, cement matrix, interfacial transitional zones (ITZs)] to 4-phase material (aggregate, cement matrix, ITZs, macro-voids), using the explicit 3D spherical, open-source DEM code YADE (Kozicki and Donzé, 2008; Šmilauer and Chareyre, 2010).
The heterogeneous internal structures of concrete at micro/meso-scales bear a profound influence on their strength and crack propagation properties (van Mier, 1986; Van Vliet and Van Mier, 1999; van Mier and van Vliet, 2002; Skarżyński and Tejchman, 2019; Vu et al., 2019). This is why conventional fracture mechanics models which assume homogeneous material properties often predict unrealistically smooth crack paths and load-bearing capacities, and are unable to capture micro-fractures from the beginning of deformation. The crucial role of initial local micro-fractures in concrete strength, damage and brittleness was recently highlighted in (Skarżyński and Tejchman, 2019; Vu et al., 2019). Accordingly, the data used in this study come from DEM simulations for which meso-scale modeling was conducted to achieve an accurate representation of the complex damage initiation and evolution patterns until failure. In particular, this study exploits recent advances in meso-scale concrete modeling where realistic fracture patterns (location, shape and width) and a post-peak stress-strain responses were achieved due to: (a) the 2D DEM model having been properly calibrated for concrete with laboratory tests, and (b) 2D calculations were performed with the aid of X-ray micro-computed tomography images of real concrete meso-structure in a cross-section, to ensure a realistic representation of its aggregate sizes and shapes and other geometrical properties (Figure 1) (Nitka and Tejchman, 2015, 2018; Skarżyński et al., 2015). Note that a crystallographic structure of the cement mortar may be considered at the micro-scale only, i.e., atomic scale (Mishra et al., 2017). Due to the presence of stochastically distributed aggregates, a crystallographic structure should not be assumed in concrete. Furthermore, although 3D simulations provide obviously more realistic outcomes than 2D models (Nitka and Tejchman, 2018), the stress differences between 2D and 3D DEM simulations for concrete were found to be minimum at the peak load, and increases with growing post-peak deformation when assuming the same material parameters. Here our main focus lies in the initiation and propagation of damage in the pre-peak regime.
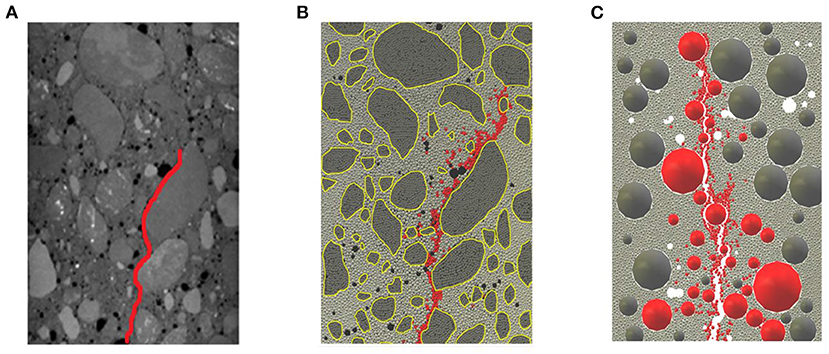
Figure 1. (Color online) Mapping of the experimental sample properties to the DEM simulation (Skarżyński et al., 2015). Two-dimensional micro/meso-structure of concrete: (A) experiment (X-ray μCT image), (B) DEM for real aggregate (clusters of spheres) and (C) DEM for real aggregate (spheres). Cracks and particles along cracks are shown in red; voids are white; aggregates are dark gray; cement matrix are light gray.
For more details on the performance of the DEM models used here for describing fracture characteristics and size effect in concrete, we refer readers to the following studies of different loading conditions: bending (Skarżyński et al., 2015; Nitka and Tejchman, 2018), uniaxial compression (Nitka and Tejchman, 2015; Suchorzewski et al., 2018a) and splitting tension (Suchorzewski et al., 2018b). In all cases, good agreement between numerical and experimental results on real concrete was achieved.
3.1. Laboratory Tests to Calibrate the DEM Models for DI and DII
We examine two data sets, DI and DII, obtained from DEM simulations of concrete specimens under quasistatic, two-dimensional uniaxial tension (Figure 2). The DEM models were calibrated against laboratory tests on 3D concrete specimens of thickness 100 mm (van Mier, 1986; Van Vliet and Van Mier, 1999), as described in (Nitka and Tejchman, 2015; Skarżyński et al., 2015). To reduce the computational cost of simulating a huge number of particles in 3D conditions, 2D models were constructed involving one layer of spherical grains. DI is from a “dog-bone” shaped concrete specimen: 150 mm high and 100 mm wide (60 mm at the mid-height). It consists of 4,942 spherical grains: 704 aggregate grains (diameter range of 2–10 mm) and 4,238 cement matrix grains (diameter range of 0.5–2 mm). DII is from a rectangular concrete specimen: 150 mm high and 100 mm wide with two diagonally opposite U-shaped notches. Each notch is of size 15 × 5 mm: the notch on the left (right) boundary is 50 mm (100 mm) from the bottom boundary. The specimen is modeled as a 3-phase material composed of aggregate, cement matrix and ITZs. The ITZs, the weakest phase, are weaker by 30% than the cement matrix, following (Xiao et al., 2013). There are 200 aggregate spherical grains (diameter range of 2–16 mm) and 8,000 cement matrix spherical grains (diameter range of 0.25–2 mm). Aggregate grains possess ITZs which are simulated as contacts between aggregate and cement matrix grains. The cement matrix grains have no ITZs. Overall, the grains comprise 95% of the specimen in DI and DII. See section 1 of the Supplementary Material for additional information.
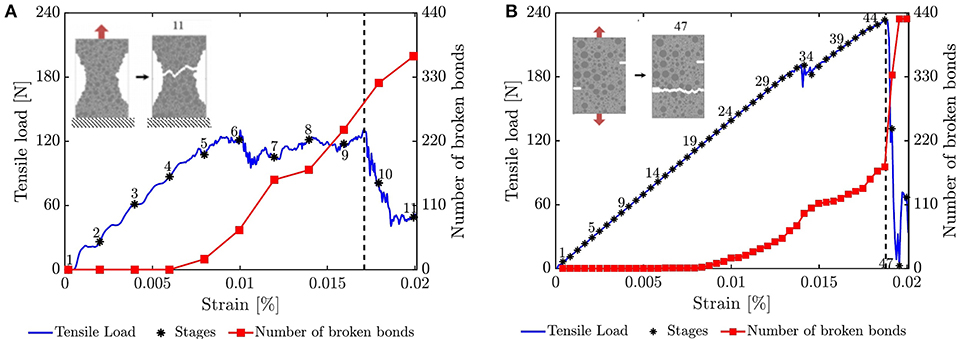
Figure 2. (Color online) Global response. Evolution with strain of the macroscopic tensile load and the total number of broken bonds in the specimen for (A) DI, (B) DII. Dashed vertical line marks the stage at peak load.
The input data for our proposed network flow framework consist of the bond strengths and the evolving topology of the bonded contact network. For brevity, we focus the discussion below on these two aspects only: full details are published elsewhere (Nitka and Tejchman, 2015; Skarżyński et al., 2015). Supplementary data on force chains were also generated to assess the significance of the predicted preferential force pathways.
3.2. Bond Strength
Albeit bonds can break by shear in both specimens, the essential microscale mechanism for damage in the pre-failure regime is bond breakage in tension (Nitka and Tejchman, 2015). No new bonded contacts form during the tests. Moreover, bond breakage immediately results in loss of contact until after peak load when a small fraction of slip contacts emerge: from a mere 0.06% of all contacts just after peak through to 0.18% at the residual state for both specimens. Shear forces are relatively small throughout the pre-peak regime: at peak load, the sum of the magnitudes of the tangential contact forces relative to that of the total contact forces is 26% for DI (17% for DII). Thus the contact capacity that is relevant to our analysis is the tensile bond strength which is defined to be the force needed to break a bonded contact. Specifically, the bond strength is given by the minimum normal force :
where Tn is the minimum tensile normal stress and rmin is the radius of the smaller of the two spherical grains in bonded contact. For DI, Tn = 25 MPa. For DII, Tn = 24.5 MPa for cement-cement contacts, while Tn = 17.5 MPa for cement-aggregate (ITZ) contacts. Thus the weakest bonds are those between aggregate and cement matrix grains and between ITZ grains. Additional information on the contact laws and material parameters is given in section 2 of the Supplementary Material.
3.3. Bonded Contact Network
In the test that generated DI, the specimen was subjected to a top boundary-driven tension while the bottom boundary was held at a fixed vertical position; both boundaries were free to move in the horizontal direction. The constant vertical strain rate of 10−3 per second, applied on the top boundary, was small enough to ensure the test was conducted under quasistatic conditions. The evolution of the macroscopic tensile load (vertical force on the top boundary) and the number of broken bonds (normal grain contacts) with the vertical normal strain is shown in Figure 2A. We analyze 11 equilibrium stages of the loading program: stages 1–9 in the pre-peak load regime and stages 10–11 in the post-peak failure regime. The initial and final number of bonds were 12,350 and 11,984, respectively. Initially, bonds did not break (stages 1-4, Figure 2A). From stage 5 onwards, the damage was progressive as seen in the steady increase in the population of broken bonds (reaches 240 in stage 9 just before the peak load). Damage evolves as shown in Figure 3A. The initial sites of damage were spread throughout the specimen, although fracture started almost simultaneously at the right and left corners of the specimen along the mid-region or “neck” of the specimen (stage 5); these form the ends of what will later become the primary macrocrack. At stage 6, a group of interconnected bonds on the lower left region of the specimen collectively broke, giving way to a second macrocrack in the lower region of the specimen (stages 7–8). Just before peak load, the crack in the mid-region became dominant as damage spread rapidly across the neck of the specimen, while the second crack did not develop further (stages 9–11). The primary macrocrack that formed in stage 11 exhibited a zigzag pattern that spanned the neck of the specimen. Similar tortuous patterns were found in past studies of concrete specimens, especially where cracks formed around the aggregate grains, i.e., ITZ zones and aggregate-cement contacts (Mindess and Diamond, 1982; Bentur and Mindess, 1986; Pease et al., 2006; Schlangen, 2008).
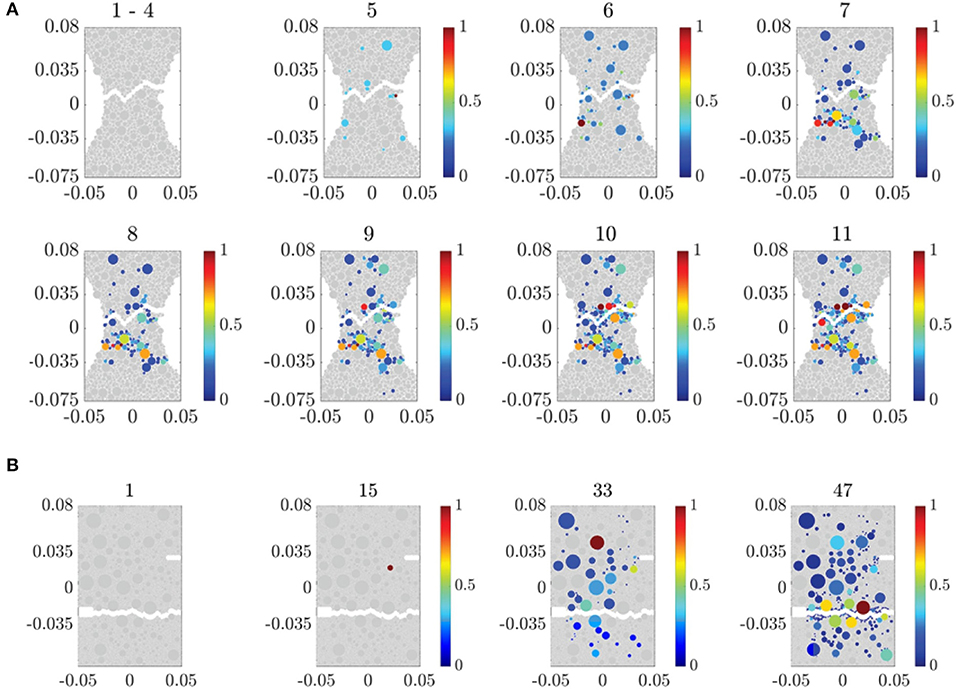
Figure 3. (Color online) Spatial distribution of grain damage. Map of the ratio of the number of broken bonded contacts to the initial number of bonded contacts dp. (A) DI and (B) DII. Undamaged grains, dp = 0, are colored gray. Damaged grains, dp > 0, are colored according to dp normalized to its maximum value for the given stage. An artificial separation between the grains on either side of the macrocrack that develops after peak load is introduced to aid a visual comparison with the particles that sustained damage. Damage below (above) the separation dominates over stages 7–8 for DI (stages 32–33 for DII).
In the test that generated DII, the top and bottom boundaries of the specimen were pulled in opposite directions, at a constant vertical strain rate of 10−3 per second; both boundaries were free to move in the horizontal direction. We analyzed 47 equilibrium stages: stages 1-45 in the pre-peak load regime and stages 46–47 in the post-peak failure regime (Figure 2B). The initial and final number of bonds were 23,492 and 23,062, respectively. Initially, bonds did not break (stages 1–14). From stage 15 onwards, progressive damage can be seen in the near-linear increase in the population of broken bonds (reaches 175 in stage 45 just before peak load). Damage evolves as shown in Figure 3B. The sites of damage were initially spread throughout the specimen, but began to concentrate in two regions in stages 24–33. The first site was near the lower left notch (stage 24): just before and around peak load, damage here spread rapidly across to the right of the specimen, leading to the primary macrocrack at stage 47. The second site, located in the weak ITZ zones in the upper region of the specimen just above and near the second notch (≈0.035 above the specimen midline), gave way to a second macrocrack at stages 32–33.
3.4. Data on Tensile Force Chains
Data on force chains were obtained to supplement the study here, by extending the method in Muthuswamy and Tordesillas (2006) to accommodate the coexistence of tensile and compressive forces at the contacts of each grain. Individual tensile and compressive force chains were identified at each studied stage of loading ϵ of each test (see section 3 of the Supplementary Material). In the pre-failure regime, essentially only tensile force chains emerged (Figure 4; Figures S1–S4). In the subsequent sections, any reference to contacts between tensile force chain grains strictly applies to contacts between member grains of individual tensile force chains: that is, the contact between two grains belonging to different force chains is not included in this set.
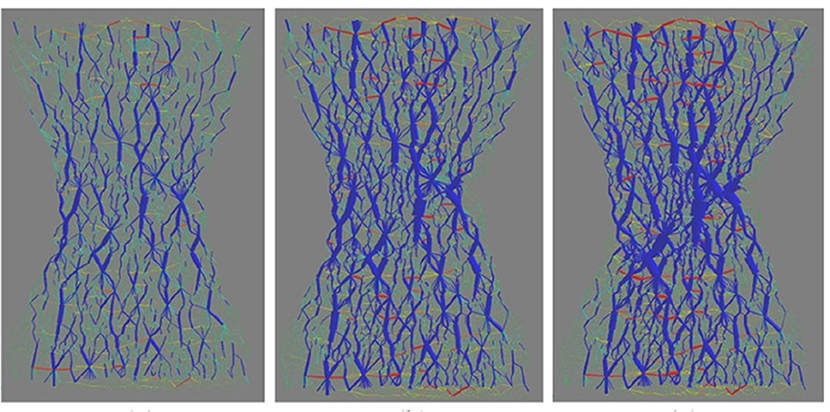
Figure 4. (Color online) Alignment with applied loading of preferred paths for tensile force propagation in bonded granular materials (Nitka and Tejchman, 2015). Visualization of force transmission in DI in the pre-failure regime (peak load is to the right). Contact forces are visualized as lines joining the centers of two member particles in contact. Line thickness is proportional to the magnitude of the normal contact force. Tensile forces are shown in blue; compressive forces are in red.
4. Methods
Here we develop a framework for characterization and modeling of the coevolution of damage and force transmission in the specimen (Figure 4). A summary of our data-driven framework in which force propagation is modeled as a “flow” through a network is given in Figure 5. A set of optimization problems on this network is solved at each stage of loading ϵ where: the input comprises data on the contact bond strengths and the contact network topology, and the output is the maximum flow and the preferential paths for force and damage. In what follows, we show that this representation is valid and fit for the purpose since the physical laws that govern the transmission of vector forces in the specimen satisfy the constraints of the underlying optimization problem for the scalar flows in the flow network.
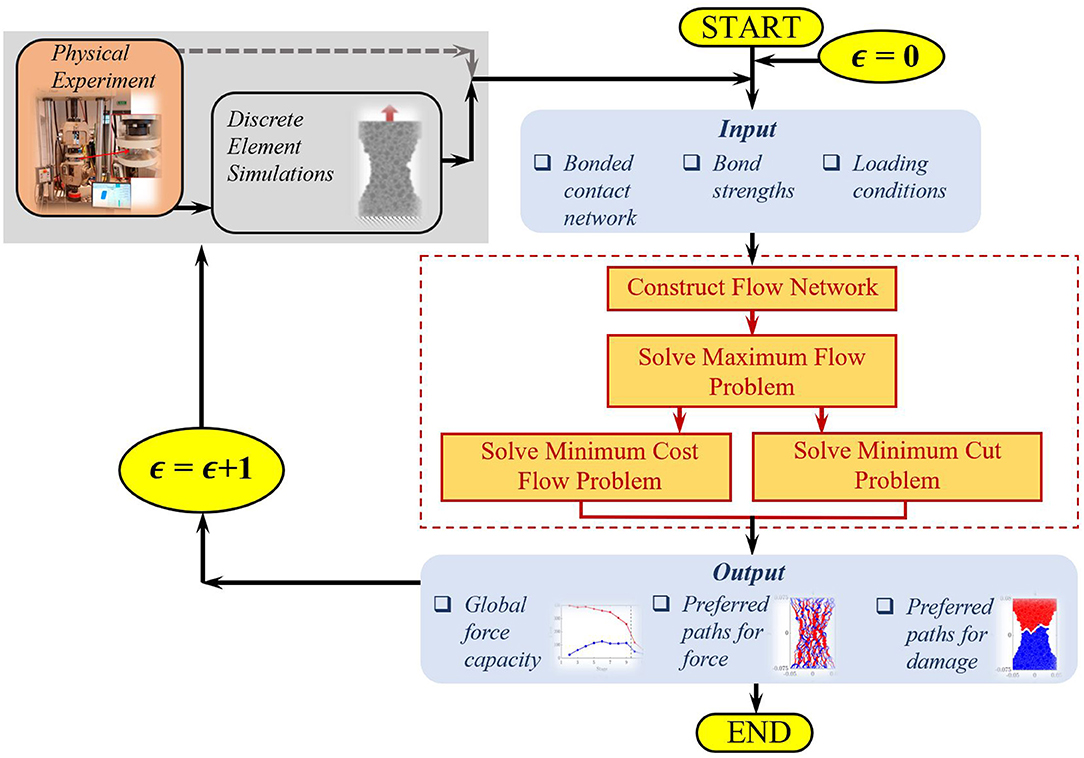
Figure 5. (Color online) Leveraging microstructural data assets on heterogeneous solids. Flow chart summarizing the network flow framework for prediction of force and damage propagation patterns from data across the various stages of the loading history ϵ = 1, 2, .., r. In this study, data were derived from DEM simulations of the experiments of Van Vliet and Van Mier (1999) on concrete under uniaxial tension, with attention paid to the meso-scale structure of real concrete using Xray μCT images.
4.1. Modeling Force Propagation as a Flow Through a Network
The network flow analysis has three key components: (a) the flow network and principal direction of flow, (b) the conservation of flow, and (c) the capacity rule.
4.1.1. Flow Network and Principal Direction of Flow
The flow network is represented by the bonded contact network (Figure 6). Each node of this network represents a grain that can transmit tensile force to another grain, while each network link represents a bonded contact2. Both the number of nodes and the number of links in vary with loading history ϵ. Next, is transformed to a directed network G. That is, each link connecting nodes i and j in is represented by a pair of symmetric arcs: one from i to j and another vice versa. Every arc e is assigned a non-negative capacity ue which corresponds to the tensile bond strength, as governed by the capacity function in Equation (1). The capacity function for all of E is therefore written as
We designate one of the nodes of G as the source s, and another as the sink t. The quadruple = (G, u, s, t) is called a flow network.
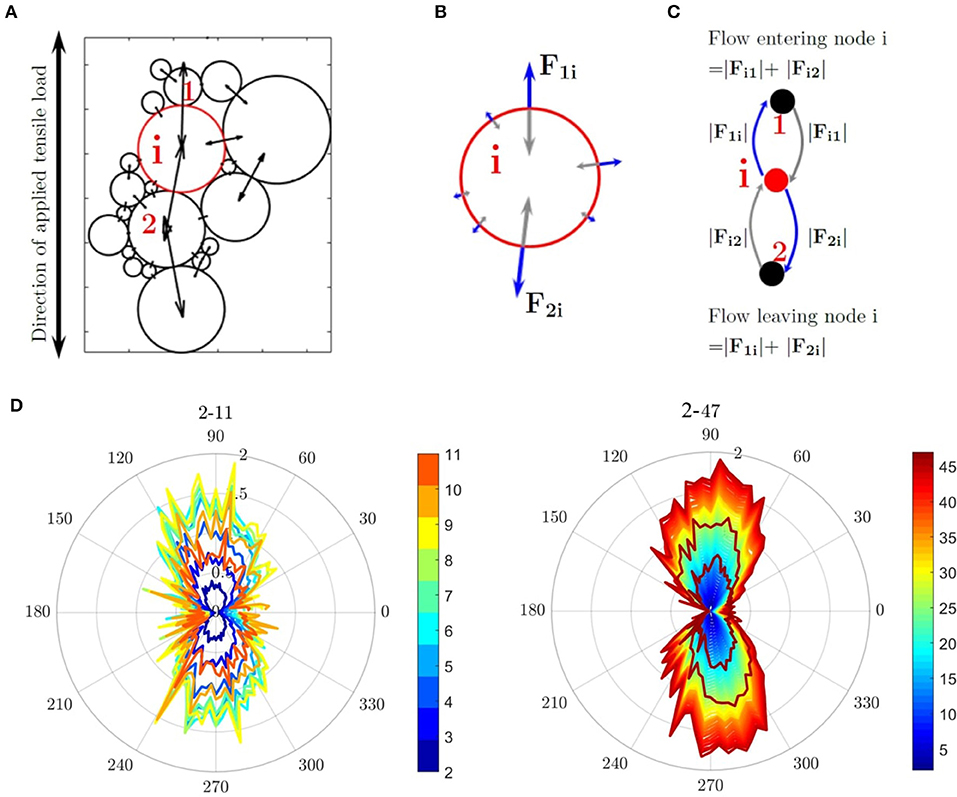
Figure 6. (Color online) Mapping the bonded contact network to the flow network. (A) Representative grain cluster embodying a tensile force chain with member grains {1, i, 2}, taken from DI. Dominant normal tensile forces on grain i are aligned in the direction of the applied tensile load. (B) Blue (gray) arrows correspond to forces acting on i from neighbor grains (forces from i acting on neighbor grains). (C) Depiction of the conservation rule: force flow out of node i = force flow into node i (for clarity, only the arcs transmitting the dominant forces are shown). (D) Conservation of tensile force flow evident in the symmetry of polar plots for normal tensile contact forces above and below the centroid of each grain [from stages 2 to 11 (47) for DI (DII)].
The principal direction of flow from source to sink is given by the direction of the applied loading. In grain contact networks, it is not immediately clear how to designate the source and sink nodes (s and t). Since the applied tensile load is in the vertical direction, an intuitive approach is to select all nodes in contact with the top wall as sources, and all nodes in contact with the bottom wall as sinks. This results in a multiple source and sink flow problem. To reduce this to a single source and sink problem, we simply make the top and bottom walls as two new nodes of G, i.e., the supersource and supersink, respectively.
4.1.2. Conservation of Flow
The conservation of flow requires that for any node in G except the source s and the sink t, the sum of the flows entering the node must equal the sum of the flows leaving the node. The vector forces that develop in the sample approximately satisfy the conservation rule due to Newton's third law, as illustrated for a representative tensile force chain grain i from DI (Figure 6A). The force flow entering grain i is the sum of the magnitudes of the forces from grain i on its neighbors (gray vectors), while the force flow leaving grain i is the sum of the magnitudes of the forces acting on grain i from its neighbors (blue vectors). Since grain i is in equilibrium, the force flow entering grain i is equal to the force flow leaving grain i (Figure 6B). Figure 6C shows the nodes and arcs between grain i and grains 1 and 2: note that there are two oppositely directed arcs for each contact to take account of the symmetry of grain-grain links. Further evidence of a near-conserved flow for the entire specimen DI is evident in the symmetry of the polar plots for the normal tensile contact forces above and below the centroid of each grain, with a mean percentage error being <16% for DI (11% for DII) across all of loading history (Figure 6D).
4.1.3. Capacity Rule
The capacity rule dictates that the amount of flow transmitted through any arc e in G is limited by the corresponding link capacity ue. This rule is automatically satisfied by the bond breakage criterion in the DEM model which requires that the tensile force at any contact cannot exceed the bond strength . From Equation (1), the contact capacity is thus given by.
4.2. Quantifying the Global Force Transmission Capacity
The global force transmission capacity is measured by F*, the maximum flow that the flow network can support given its topology and link capacities. Here we focus solely on how to compute F*. Later in section 4.3, we will prove that F* is the fracture or breaking strength of the specimen. That is, when the actual tensile force flow transmitted through the specimen reaches F*, the specimen will completely break apart into two: one part being in contact with the top wall, while the other is in contact with the bottom wall. No forces applied from the walls can propagate through the specimen since no paths exist for force transfer from one wall to the next. Accordingly, we expect the failure regime to correspond to that time period when the transmitted flow is very close, if not equal, to the maximum flow F* depending on whether the failed specimen is partially or fully split apart by the macrocrack.
To find F*, we solve an optimization problem known as the Maximum Flow Problem (MFP). The MFP is equivalent to assigning force flows xe to every arc e in G, without violating the two constraints of conservation of flow and the capacity rule (Definition 1), such that the total amount of flow transmitted out of the source (or into the sink) in G is as high as possible.
DEFINITION 1. Given a flow network = (G, u, s, t), a flow x
is called a feasible (s, t)-flow, if it satisfies:
(a) the conservation of flow
where e ∈ δ−(v) denotes arcs entering node v and e ∈ δ+(v) denotes arcs leaving node v;
(b) the capacity rule
The value of a flow x, or net flow transmitted from the source s, is defined as
We now have the following mathematical definition for our optimization problem.
The Maximum Flow Problem (MFP): Given a flow network = (G, u, s, t), find a feasible (s, t)-flow x such that f(x) is maximum.
Let S ⊂ V and T ⊂ V be disjoint sets of nodes of G. The quadruple (G, u, S, T) is called a multiple-source, multiple-sink flow network.
DEFINITION 2. Given a multiple-source multiple-sink flow network (G, u, S, T), a flow
is called a feasible (S, T)-flow if it satisfies:
The value of a flow x, or net flow transmitted from the supersource s, is defined as
To solve the multiple-source multiple-sink maximum flow problem, we convert it to a (single source, single sink) Maximum Flow Problem as follows. Given (G, u, S, T) create a new node, the supersource s, and add an arc from s to every node in S. Similarly, create a new node, the supersink t, and add an arc from every node in T to t. Let the capacity of all new arcs be infinite. It can easily be shown that a maximum flow on the resulting flow network is a maximum flow on (G, u, S, T) when restricted to the arcs of G. Even for large networks, this problem can be solved efficiently by the use of existing algorithms (Ahuja et al., 1993).
Figure 7 is a toy example of a flow network showing two different flow assignments of equal value. Note that this figure serves to illustrate multiple aspects of the framework, both here and in future sections. Of relevance to the present discussion are the added arcs with infinite capacity from supersource s to nodes in S and from nodes in T to supersink t, where set S is {1, 2, 3} and set T is {8, 9}. We use labels (xe, ue) for each link e such that: xe is the flow on e, ue is the capacity of e, and each undirected link in the figure represents two arcs in opposite directions. The directed arcs which are not shown here correspond to zero flow. By summing the flows entering t or leaving s, we see that the maximum flow F* is 3.
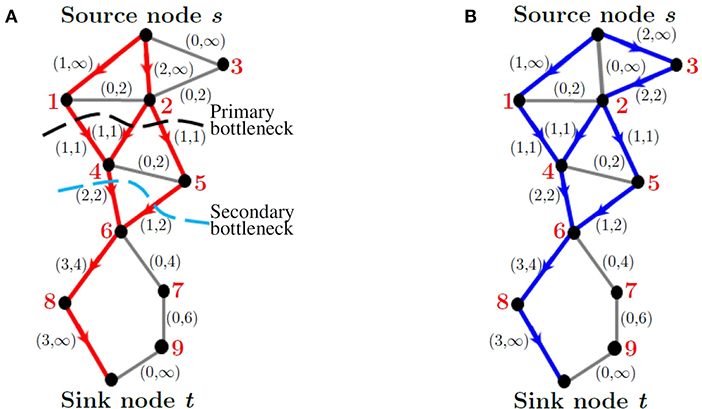
Figure 7. (Color online) A depiction of the multiple concepts discussed in sections 4.1–4.4. Two examples of a feasible (s, t)-flow with maximum flow F* = 3. Link labels are of the form (xe, ue). (A) Maximum flow pathways with unit cost (red arcs), primary bottleneck or minimum cut (black dashed line), and secondary bottleneck (light blue dashed line). (B) Maximum flow pathways without cost (blue arcs). Gray arcs in (A,B) are not part of the maximum flow pathways: arcs with zero flow.
4.3. Predicting the Preferential Pathways for Force Transmission
As seen from Figure 7, solutions to the MFP are generally not unique. Depending on the algorithm used, different pathways may be used to transmit the flow through from source to sink. In grain contact networks, there is a tendency for the preferred force transmission pathways to self-organize in quasilinear formation in alignment with the direction of the major principal stress axis (Muthuswamy and Tordesillas, 2006; Tordesillas et al., 2013, 2015a,b; Lin and Tordesillas, 2014; Kahagalage et al., 2017). These preferred pathways are more commonly known as force chains, quasilinear chains of contacting particles with high bond strengths or capacities, which transmit above-average forces. Here the tensile force chains align in the vertical direction in alignment with the applied tensile load (Nitka and Tejchman, 2015). With respect to , such a pattern of self-organization implies relatively short transmission paths. To capture this behavior we extend our model to the Minimum Cost Flow Problem (MCFP). Solutions to this problem maximize the total flow while also using paths that are as short as possible. That is, we send the maximum flow F* through the shortest possible paths to capture most, if not all, the tensile force chains; sending less than F* may not mobilize certain preferred paths which in turn may miss some force chains. To ensure that the shortest possible paths are followed, we associate a unit cost with every arc in the network, and then solve the optimization problem of finding a maximum flow through the network while also minimizing the total cost of all arcs used in the maximum flow. As with the MFP, there exist algorithms that can solve the MCFP for large networks (Ahuja et al., 1993).
In Figure 7, we depict two different maximum flow pathways: (a) maximum flow pathways with unit cost (red arcs); (b) maximum flow pathways without cost (blue arcs). In Figure 7, gray arcs are not utilized in the flow pathways. As can be seen from Figure 7A, the optimized routes comprises the flow pathways s − 1 − 4 − 6 − 8 − t, s − 2 − 4 − 6 − 8 − t, and s − 2 − 5 − 6 − 8 − t. Each pathway has a length of 5 (5 arcs). The maximum flow value is 3 and the total cost (with unit cost for each arc) is 15. In Figure 7B the flow pathways are s − 1 − 4 − 6 − 8 − t, s − 3 − 2 − 4 − 6 − 8 − t, and s − 3 − 2 − 5 − 6 − 8 − t. These paths have lengths 5, 6, and 6 and the maximum flow value is also 3. It is clear that utilizes shorter paths than the flow paths without cost. Note also that is not necessarily a subset of the paths used in the MFP. From Figure 7, it is clear that link (s, 2) is in , but not used in the flow of Figure 7B. We now provide a formal definition of the MCFP.
The Minimum Cost Flow Problem (MCFP): The input of MCFP is a quadruple (G, u, b, c), where G = (V, E) is a directed graph,
is a capacity function on arcs of G,
is a demand function satisfying
and
is a cost function. We call bv the demand (or balance) of v and ce the cost of e. If bv ≥ 0 then v is a “demander”; if bv < 0 then v is a “supplier.” Based on these, and the capacity ue of arc e, the minimum cost flow problem is defined as follows.
We minimize the function
subject to the net flow transmitted from any node v being given by
and
In our model, we let ce = 1 for all arcs e; we let bv = 0 for all v ≠ s and v ≠ t; and we let and where F* is the maximum flow in G. Since the cost ce of every arc is the same, solving the MCFP with these parameters creates an (s, t)-flow of value F* while using flow paths that have as few arcs as possible.
4.4. Predicting the Preferential Pathways for Damage Propagation
We find the preferential pathways for damage propagation from the flow bottlenecks, sites in the flow network that are highly prone to congestion. Flow bottlenecks are “cuts” of a network: partitions of the nodes of the network so that the source is in one part of the partition and the sink in another. In a grain contact network, a cut can be visualized as a literal partition of the set of grains by means of a crack. In this sense, the cut capacity is the fracture strength of the cut: the sum of the individual bond strengths required to break apart the bonds connecting the grains on either side of the cut. The cut with the minimum fracture strength is called the minimum cut and this identifies the flow bottleneck B.
In Figure 7A, we depict two distinct cuts in a contact network using dashed lines. The first cut is the minimum cut (the primary bottleneck), highlighted by the black dashed curve. It partitions the set of grains into two sets {1, 2, 3} and {4, 5, 6, 7, 8, 9}. The links in this cut are (1, 4), (2, 4), and (2, 5), each with a capacity of 1. The total capacity of this cut is therefore 3. The second cut, highlighted by the light blue dashed curve, partitions the network into {1, 2, 3, 4, 5} and {6, 7, 8, 9}. The links in this cut are (4, 6) and (5, 6), each with the capacity of 2. The total capacity of this cut is therefore 4. We call this the secondary bottleneck since this cut has the second-lowest capacity: that cut with a capacity closest to the minimum cut capacity.
There is a useful relationship between the maximum flow F* and the problem of finding the bottleneck. This arises from the famous Max-flow min-cut theorem in graph theory (Ahuja et al., 1993). The maximum flow and the minimum cut hold a dual relationship, namely, the maximum amount of flow that can be transmitted through a given flow network is equal to the capacity of the minimum cut. Now we define network cuts formally, and give a mathematical description of the Max-flow min-cut theorem.
For S ⊂ V, denote . The sets S and form a partition of V, and the set of arcs from S to , denoted by
is called a cut of G induced by S. If the source s ∈ S, then δ+(S) corresponds to the set of arcs leaving the set of nodes containing the source.
DEFINITION 3. A cut δ+(S) such that s ∈ S and is called an (s, t)-cut of the flow network (G, u, s, t). The capacity of such a cut is defined to be
The Minimum Cut Problem (MCP): Given a directed graph G = (V, E) with two specific nodes, s (source) and t (sink), and a capacity ue ≥ 0 on each arc e ∈ E, find an (s, t)-cut δ+(S) with minimum capacity u(δ+(S)).
The Minimum Cut Problem is equivalent to the MFP by the following theorem.
Theorem 1. Max-flow min-cut theorem: In any flow network (G, u, s, t), the maximum value of a feasible (s, t)-flow is equal to the minimum capacity of an (s, t)-cut. That is,
From above it is clear that F*, the smallest transmitted tensile force flow needed to break apart all the member bonds of any cut such that no forces can be further transmitted through , is also the fracture strength of . That is, when the transmitted tensile force flow through the minimum cut B reaches F*, the specimen will completely break apart along this flow bottleneck. It is also easy to see that the minimum cut set B is a subset of . Forward arcs in the minimum cut must be saturated (each arc has the flow value equal to its capacity). If any arc in the minimum cut is not saturated, then F* is not the maximum flow as the flow can be further increased.
As mentioned, all the above optimization problems can be solved efficiently, and a number of polynomial-time algorithms for them have been discovered, as discussed in (Ahuja et al., 1993). For the MCFP, we used a version of the Ford–Fulkerson algorithm called the Edmonds–Karp Algorithm. The Ford–Fulkerson is relatively simple to describe. The algorithm keeps looking for a path from the source to the sink which has unused capacity on every link (such paths are called augmenting paths). It then increases the flow on this path and repeats this process until there are no more augmenting paths. The complexity of the Edmonds–Karp algorithm is O(nm2), where n is the number of nodes and m is the number of arcs. This is a polynomial complexity and is therefore considered efficient.
5. Results
5.1. Global Force Capacity Relative to the Applied Load
The global force capacity, as measured by the maximum flow , is highest at the initial loading stage ϵ = 1 when there is no damage to the sample: for all ϵ = 1, 2, .., r. As damage initiates and spreads with increasing applied load, the number of transmission paths through the flow network decreases, which in turn leads to a concomitant decrease in . Thus, the failure regime is when the transmission of the maximum flow is essentially realized in the flow network . That is, the transmitted tensile force flow Fr (i.e., the sum of the magnitudes of the tensile forces in the bottleneck B at failure stage r) is very close to the maximum flow for both samples (Figure 8). We confirmed this limit by quantifying the flow capacity index , 0 ≤ η ≤ 1, over an extended period of the failure regime: ϵ = 1, .., 10, …., 25 for DI, while ϵ = 1, .., 46, …., 62 for DII (Figure S5 in section 4 of the Supplementary Material). In both samples, ηϵ ≤ 0.1 throughout failure. Note that the lower limit of η = 0 corresponds to , the condition for a complete separation of the specimen along the bottleneck B. This limit is not reached in either test, as a few bonds remain intact along the path of the macrocrack throughout the failure regime.
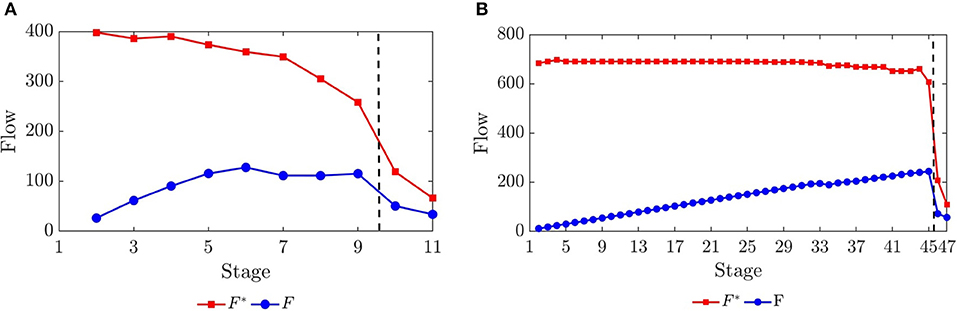
Figure 8. (Color online) Failure is characterized by the transmission of flow near or at global force capacity. Evolution of the transmitted tensile force flow F and the maximum flow F* for (A) DI and (B) DII. Some bonds remain in the path of the macrocrack at the final stage.
5.2. Preferential Paths for Force Transmission
The system-spanning, preferential paths for force transmission are shown in Figure 9. We find that most contacts in transmit above the global mean tensile force magnitude and belong to tensile force chains: on average, 73% of contacts between tensile force chain grains across stages 2–9 for DI, 91% across stages 1–45 for DII (Figure S6 in section 5 of the Supplementary Material). The thickest links (highest force flows) generally align with the vertical direction, the direction of major (tensile) principal stress: those aligned in the transverse direction are either not in or transmit smaller force flow values. The sudden breakdown of pathways in in the failure regime coincides spatially and temporally with the collective failure of tensile force chains: compare the marked loss of links along the right side of DI (left side of DII) with the absence of force chains in the same region (Figures S1, S3 in section 3 of the Supplementary Material). The key difference between the optimized routes of the specimens explains why DII is both stronger and more robust. Note the abundance of supporting contacts (blue) on either side of tensile force chain contacts (red) in DII compared to DI in the pre-failure regime (Figure 9): thus, many more contacts in DII can share and take the load off, or replace damaged, tensile force chains.
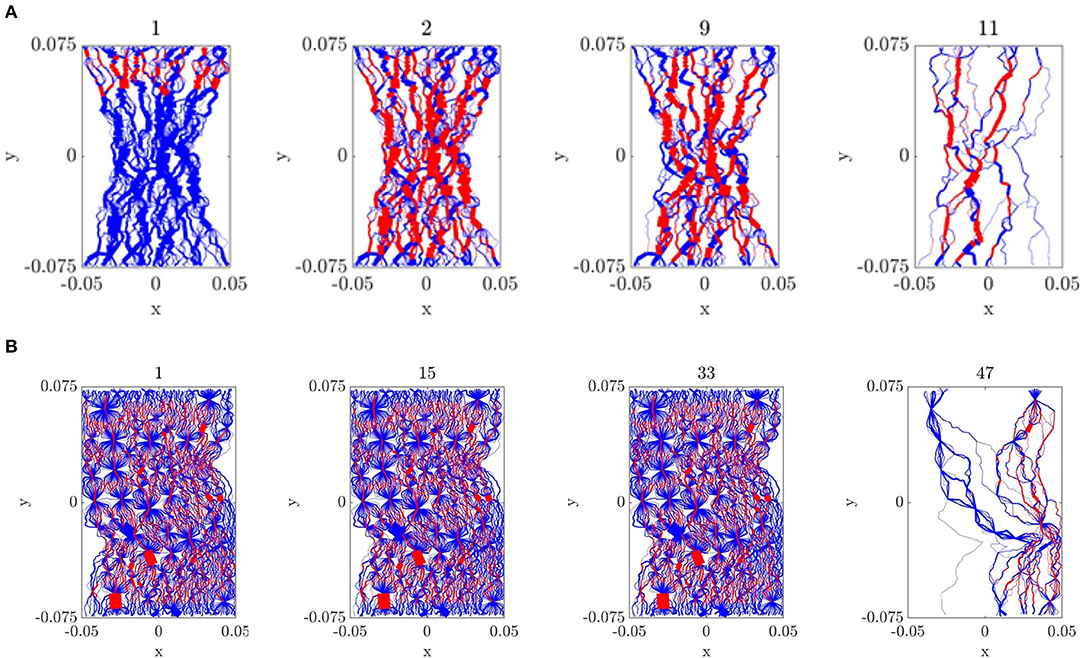
Figure 9. (Color online) System-spanning preferential paths for force transmission . (A) DI and (B) DII. Link thickness is proportional to the force flow across each link: between grains in tensile force chains (red) or otherwise (blue). Note percolating tensile force chains are first established at stage 2 in DI (Figure S1).
5.3. Preferential Paths for Damage Propagation
Preferential paths for damage propagation form in two separate locations of the specimen in the pre-failure regime (Figures 10A,C and Figure S7). In DI, the primary bottleneck B* persists in the middle of the gauge region or neck of the specimen across all stages except stage 8 (Figure 10A). This recurring bottleneck predicts the location of the dominant macrocrack: the primary crack that forms during failure (stages 10 − 11). The secondary bottleneck B8 emerges momentarily in stage 8 in the lower section of the specimen. The secondary crack forms in B8. Similar trends apply in DII (Figure 10C). The cracks propagated along the aggregate surfaces where the relatively weak bonds lie, thereby forming tortuous crack paths (recall Figure 1). The maximum error of the prediction of the macrocrack location by the primary bottleneck B* is <1% for both samples—at all stages of loading—except when the secondary bottleneck appears (see also Figures S7,S8 in sections 6 and 7 respectively of the Supplementary Material).
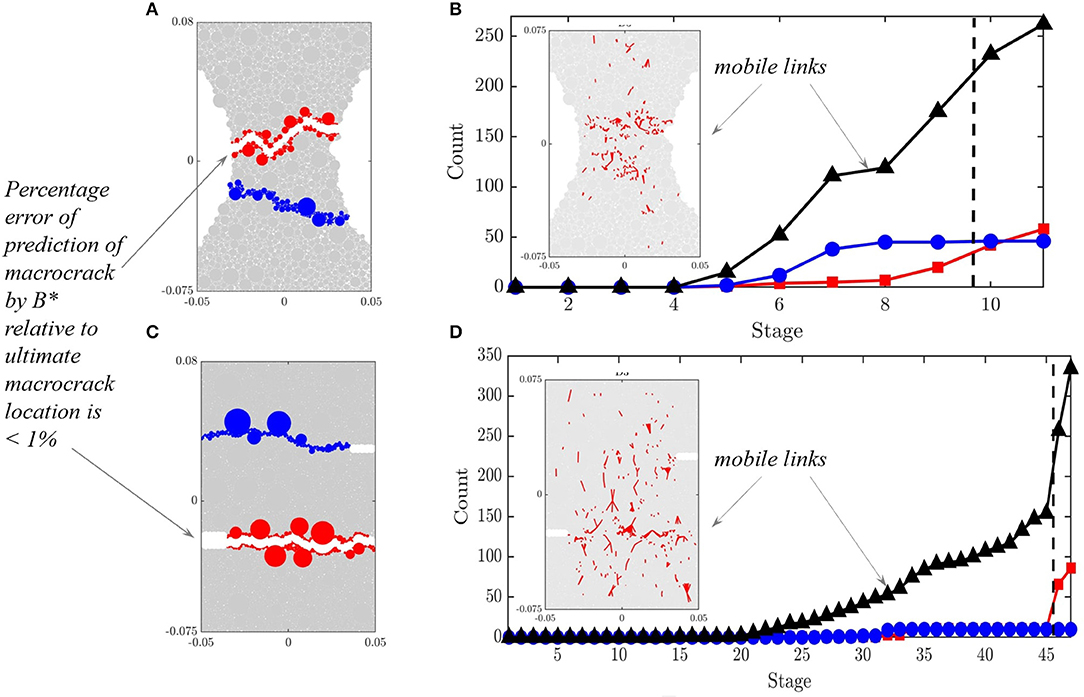
Figure 10. (Color online) System-spanning preferential paths for damage. (A,B) DI and (C,D) DII. (A,C) Preferential paths for damage B. Grains on either side of the ultimate macrocrack location are artificially separated to aid visual comparison with the primary bottleneck B* (red grains) and the secondary bottleneck (blue grains) (B,D) Evolution of the number of broken bonds in B* (red), the secondary bottleneck (blue), and mobile links elsewhere (black) with their spatial distribution (inset). Dashed vertical line marks the stage at peak load.
Following Ord and Hobbs (2010), who borrowed from dislocation theory the concept of mobile vs. immobile to describe the damage in their systems, here we also consider two families of broken bonds: mobile links which correspond to the broken bonds that form relatively easily at low stress vs. immobile links which are the broken bonds that only develop at high stresses. By this definition, the bonds that break in the primary bottleneck are immobile. Consequently, we refer to the set of all bonds that break in the primary bottleneck across all observed stages (1–11 for DI, 1–47 for DII) the immobile links, and all bonds that break outside of the primary bottleneck comprise the mobile links (all bonds shown in Figures 10B,D insets and those that break in the secondary bottleneck in Figures 10A,C). Note that not all bonds in the bottlenecks break. Most of the pre-failure damage are mobile—that is, they lie outside the primary bottleneck B* (Figures 10B,D). Therefore, sites of high concentration damage in the pre-failure regime are not reliable indicators of where the dominant macrocrack that precipitates global failure will likely form.
To understand why the flow bottleneck (minimum cut) provides an early prediction of the location of the ultimate crack pattern, it is essential to examine the fracture strength of the force bottleneck relative to those of arbitrary cuts that partition . The fracture strength of B* and B8 turns out to be significantly less than those of other cuts for all of loading history (Figure 11A), which explains why these bottlenecks become prone to congestion and manifest a distinct pattern of damage evolution relative to other cuts (Figure 11B). Specifically, while damage values sustained by B* and B8 are comparable to other cuts in the initial stages of the pre-failure regime, these rapidly increase close to peak load (stage 9) and consistently exceed those of other cuts of during failure (stages 10–11). The greatest damage occurs initially in the secondary bottleneck B8 up until stage 9, after which damage concentrates in the primary bottleneck B* (Figure 11B inset) where the macrocrack ultimately forms (recall Figure 10A). Figures 11C,D for DII shows the same trends. More damage concentrates in the second bottleneck B32 across stages 30–34 (note only 1 bond breaks in B* and in B32 prior to stage 30). But as the tensile load rises, damage in B* also rises, eventually matching that of B32 across stages 35–36, before the abrupt cascade of bond failures across stages 45–47.
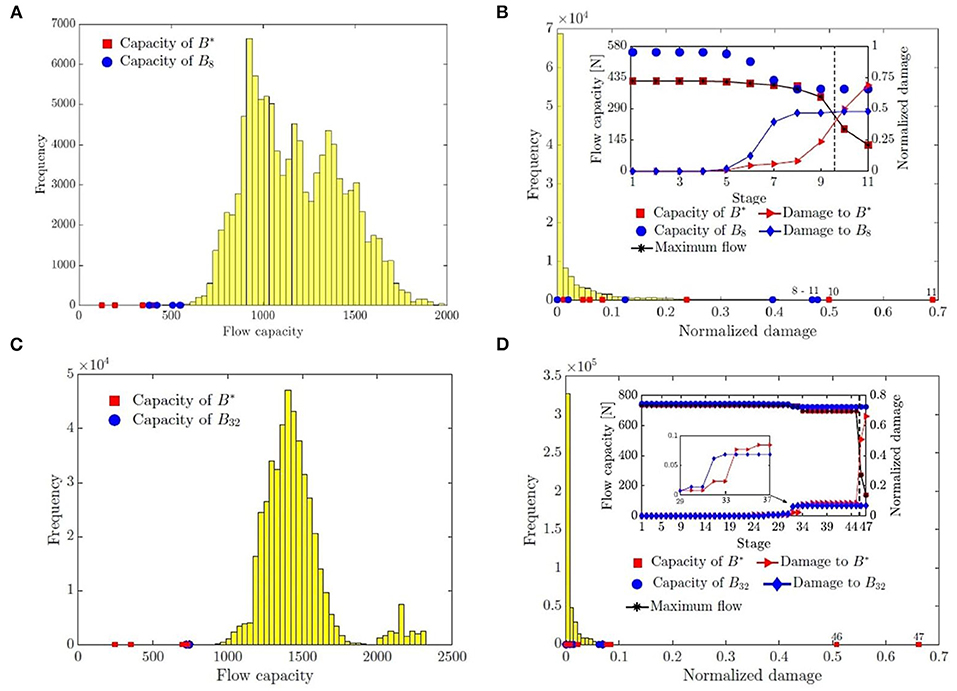
Figure 11. (Color online) Fracture strength of force bottlenecks. (A,B) DI and (C,D) DII. Frequency distribution of: (A,C) the capacities of 10, 000 random cuts of ; and (B,D) their normalized damage across all observed stages of loading. The capacities of the primary bottleneck B* (secondary bottleneck) are marked by the red squares (blue circles). Normalized damage in a given bottleneck is the number of broken bonds relative to the initial number of bonds at stage 1. Inset shows coevolution of the fracture strength of, and damage in, the bottlenecks. Dashed vertical line marks the stage at peak load.
The evolution of the distributions in cut capacities and attendant damage in Figure 11 also provides new insight into crack interaction in the presence of damage. With both distributions in mind, and the fact that global force transmission capacity F* is equal to the minimum cut capacity, consider now two possible cases at some equilibrium state early in the pre-failure regime for DI. In case 1, we have the capacity of the minimum cut being much smaller than any other cut (e.g., B* in stages 1–6, Figure 11A). In case 2, we have multiple potential force bottlenecks exist, meaning one or more cuts have capacities that are close to the minimum value (e.g., B8 in stages 7–9, Figure 11B inset). In case 1, a single recurring bottleneck would likely emerge in the pre-failure regime (stages 1–6, Figure 10A), since a few links can be lost to other cuts without change to the minimum cut capacity (stage 5–6, Figure 11B). By contrast, in case 2, we can expect changes to the bottlenecks in the pre-failure regime (stages 7–9, Figures 10A, 11A,B), since the loss of one to a few links in another cut with only a slightly higher capacity would suffice to reduce its capacity to the global minimum. In turn, this cut would become the new minimum cut (bottleneck). This is seen in the switches in a bottleneck: from B* to B8 across stages 7–8, and vice versa across stages 8–9. This process whereby another cut (a secondary force bottleneck) takes the “fall” by losing its links in place of the previous minimum cut sustaining a further loss of links (a condition that would guarantee a reduction in F*)—ensures that the loss of global force transmission capacity is minimized, as the damage spreads. Qualitatively similar trends manifest between B* and B32 in DII. In summary, the results here suggest that multiple crack interaction in the pre-failure regime can be viewed as a cooperative process among force bottlenecks to minimize loss of global force transmission capacity |ΔF*| due to damage. We quantify this in the next section.
5.4. Cooperative Interaction Between Mobile and Immobile Contacts
We explored how pathway redundancy is exploited through force reroutes at the global level relative to the preferential force paths using the reroute score Rre. When a bond breaks, certain paths may no longer be available for force transfer. However, if there is path redundancy in , then flow can be diverted to alternative paths with minimal reduction to the maximum flow F*. This capability to reroute flow can be quantified through a reroute score Rre, given by
here 0 ≤ ρ ≤ 1 where ρ is the ratio of the number of links in relative to its initial value prior to the damage, α ≥ 0 is the number of replacement links to which flow is diverted, and γ ≥ 0 is the number of links that ceases to be part of (links that leave either to join the complementary set in or are damaged). The reroute score is maximum when a replacement contact from is found for every contact lost to : Rre = ρ if α = γ, where ρ = 1 when there is no damage to .
At the onset of damage in (stage 5 for DI; stage 15 for DII), old links leave as new links enter . An old link that ceases to be part of can be either damaged (link at stage t − 1 breaks and is no longer in at t) or the link is a member of the complement set of (link is no longer accessed in but exists in ). The evolution of Rre accurately tracks the transition from pre-failure to post-failure regime (Figures 12A,B). For DI, across stages 1–8, the system compensates for the disruptions to transmission by finding contacts in for almost every contact that is no longer accessed in : note that these replacement contacts include the mobile links (Figure 12A inset, Figures 13A,B). By contrast, across stages 9-11, we observe a sudden degradation in without a matching recovery: Figure 12A inset shows the surge in the number of contacts that leave at the same time as feasible replacement contacts from dwindle in numbers.
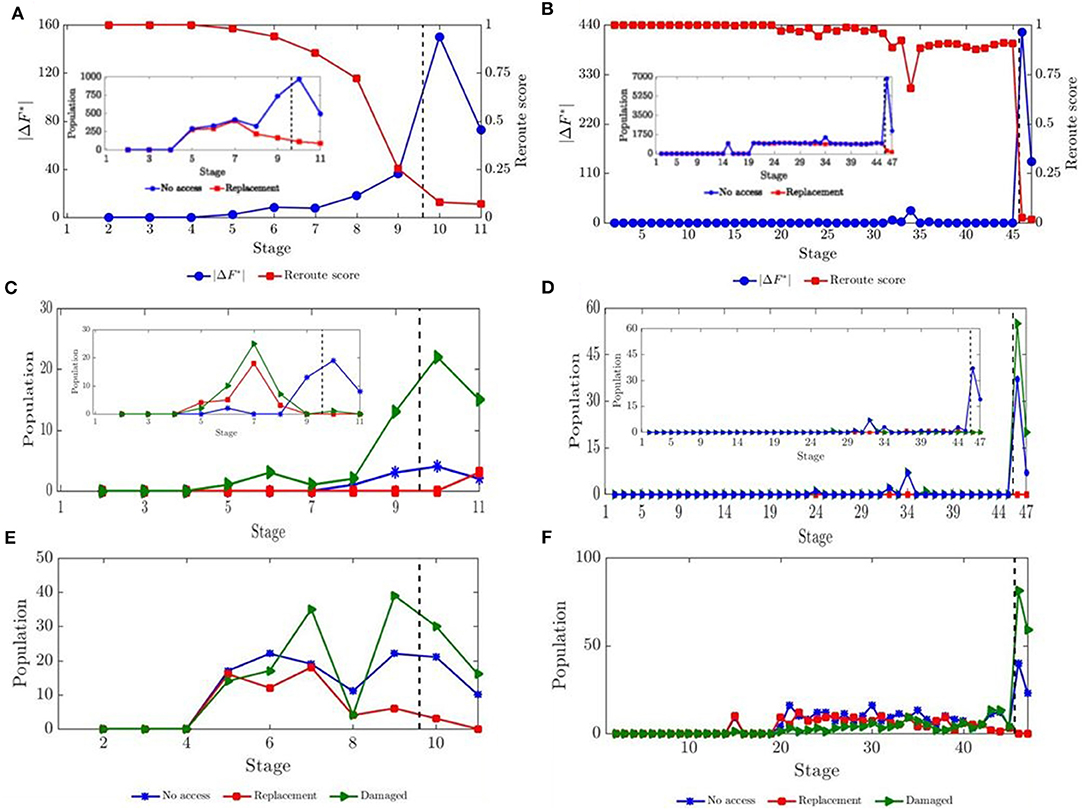
Figure 12. (Color online) Loss of global force transmission capacity and force reroutes in . (A,C,E) DI and (B,D,F) DII. (A,B) Evolution of the reroute score Rre and |ΔF*|: inset shows the evolution of the population of no access and replacement links. Population of no access, replacement, and damaged links across the preceding stage [ϵ − 1, ϵ]: (C,D) in B* and the secondary bottleneck (inset); and (E,F) in the mobile links outside of bottleneck. Dashed vertical line marks the stage at peak load.
Figure 13. (Color online) Force reroutes in . (A) Spatial distribution of for DI in the region of the bottlenecks at ϵ = 4: mobile links (magenta), other bottleneck contacts (black). (B) Spatial distribution of mobile links used to replace links lost to across ϵ = 4 − 9 (red) shown with other bottleneck contacts (black). All other links of are shown in gray.
In DII, the sudden drop in global force capacity |ΔF*| occurred only across stages 45 − 46 when the cascade of bond breakages developed in the primary bottleneck B* (Figure 12B). Before this, there was limited bond breakage in B* and therefore the maximum flow remained constant (Figure 12B, 11D inset). In stages leading up to stage 45, damage occurred mainly outside of B* (i.e., mobile links) where there are many available redundant pathways to replace the broken bonds whilst maintaining maximum flow. This is clearly not true for edges in the bottleneck, which are at or close to full capacity in this peak stress regime. This is confirmed by the sudden decrease in reroute score across stages 45–46 when enough bonds, and hence force pathways, have broken that flow reroutes are no longer possible.
To better understand the cooperative dynamics between the sites of damage, and their coevolution with the preferential force pathways , we extended our study to all the sites of damage. We find the mobile links sustain most of the force reroutes up until stage 8, consistent with these links being also the main sites of damage in this regime (Figure 12C inset, Figures 12E, 13). This leaves B* essentially intact with all of its contacts used entirely in the preferred force pathways until stage 8 (Figure 12C). However, the damage that occurs across 8–9 in B* significantly reduces the available pathways for force reroutes, as evident in the marked reduction in the reroute score before the sharp increase in |ΔF*| (Figure 12A). By contrast, DII maintains a high reroute score for all of the pre-failure regime due to the high level of redundancy in and only drops at the same time as |ΔF*| rises to a peak (Figures 12B,D,F). The reroute score being close to zero in the failure regime is consistent with the earlier result of the force capacity index being similarly small in this regime (Figure 8 and Figure S5).
6. Discussion
We developed a framework for characterization and modeling of the coevolution of damage and force transmission using data on bond strengths and the contact network for a bonded granular material under uniaxial tension. We uncovered evidence of an optimized force transmission which gives rise to two system-spanning patterns in the pre-failure regime: one corresponds to the preferential paths for force transmission (Figure 9), the other to the preferential paths for damage B (Figure 10). Mathematically, these pathways are related to each other by a strong duality theorem in linear programming (Ahuja et al., 1993): the maximum-flow minimum-cut theorem. Paths in are those that can transmit the maximum flow F*, the global force capacity of , through the most direct and shortest possible paths. On the other hand, the flow bottleneck B sets this upper bound on the flow through . That is, the so-called minimum cut (the cut with the least fracture strength) is the bottleneck B, the capacity of which is F*.
We uncovered a self-organization rule that may potentially govern force chain formation. Throughout the pre-failure regime, the majority of force chains emerged in . Thus, force chains serve as “adaptive highways” in a force transport network that evolves under progressive damage, by continually forming in locations which facilitate maximum throughput (i.e., transmit maximum flow F*) along the shortest possible paths in the direction of the major principal stress (Figure 9). In systems with high redundancy, the force chains are reinforced on both sides by alternative force pathways that can share and take the load off, as well as replace damaged, force chains.
The macrocracks emerged in the force bottleneck B, the path of a literal cut or partition of the sample that has the minimum fracture strength—the minimum total force required to break all member bonds in the cut—out of all possibles cuts of the specimen. Across pre-failure, we found two bottlenecks in both samples. The primary bottleneck B*, which appeared first and persisted across most of the loading stages, is where the primary or ultimate macrocrack formed close to peak stress. Because the fracture strength of the force bottleneck depends not just on the number of bonds in the corresponding cut, but also on the values of the individual forces needed to break the bonds in the cut, cases may arise where a torturous cut is favored as a force bottleneck over a straighter cut with fewer bonds: see, for example, the case in (Yin et al., 2015; Kondo et al., 2019) where the straighter cut has a higher cut capacity and evidence of tortuous cracks paths in concrete specimens around aggregate grains (Mindess and Diamond, 1982; Bentur and Mindess, 1986; Pease et al., 2006; Schlangen, 2008).
We observed cooperative interaction among the various sites of damage during the pre-failure regime, which effectively minimized the impact of damage at each increment of loading, as measured by the loss of global force capacity |ΔF*| (Figures 12A,B). In the nascent stages of pre-failure, the network contained many redundant pathways which allowed forces to be rerouted. Consequently, force and hence damage are initially diverted away from the immobile links that lie strictly in B* and into the secondary bottleneck and elsewhere (i.e., the mobile links in the sense of Ord and Hobbs, 2010). However, a critical state is ultimately reached when the transmitted load through becomes very close to F* with no more redundant pathways left to reroute the flow. This condition then triggers global failure through a cascade of bond breakages in B* leading to the macrocrack. These findings cast light on why sites of relatively high-stress concentrations and damage in the early stages of the pre-failure regime may not give a reliable indicator of the nucleation and path of the ultimate macrocrack. In other words, in an optimized force transmission system, there is a tendency for forces and damage to be redirected away from the true bottleneck in order to maintain (or at least minimize the loss of) transmission capacity. In this sense, we can think of the material as “protecting” the bottleneck in order to delay failure for as long as possible under increasing load. This is crucially enabled by redundancy in the pre-failure regime, but only up to a point. Eventually, after enough damage has occurred, the rerouting of flow becomes infeasible.
Finally, we raise the limitations of this analysis and highlight where future research may be directed. The optimized force transmission process uncovered in this study can be subjected to many other factors. Among these are loading conditions that give rise to interactions among tensile and compressive force chains (Potyondy and Cundall, 2004; Cho et al., 2007; Ord and Hobbs, 2010; Jiang et al., 2011; Nitka and Tejchman, 2014, 2015; Liu et al., 2019), as well as network rewiring where new contact paths for force transmission emerge from grain rearrangements (e.g., in specimens under compression Jiang et al., 2014; Sun et al., 2017). These warrant further research as they could lead to patterns of evolution different from those reported here. Note also that the present formulation accounts only for the one microscale failure mechanism that was observed in the pre-failure regime (i.e., bond breakage in tension). There are various strategies for extending this analysis to accommodate the influence of other forms of heterogeneities and failure mechanisms on force and fracture propagation. For example, heterogeneities at the sub-grain level can be addressed by modeling each grain as a sub-network of nodes and links, similar to past work on grain fracture (Tordesillas et al., 2015b), with sub-grain links given different capacities. Heterogeneities at the grain-grain contact level have been addressed here with both material and geometrical (grain sizes) properties influencing the tensile strength of each bonded contact in the 3-phase specimen of DII. To account for additional sources of strengths, each contact may be modeled by multiple links. For example, a bonded contact may be given two links: one whose capacity reflects the shear strength of the bond, while the other the tensile strength. Last but not least, while all these strategies concern force transmission, the framework developed here can be applied to study the conductivity of other mechanical properties in heterogeneous media, such as interstitial pore fluid as shown in van der Linden et al. (2019), given data on the available pathways for transmission and their relative capacities.
7. Conclusion
A data-driven framework that leverages microstructural data assets, be they from experiments or physics-based computational mechanics models, has been developed to characterize and model the coupled evolution of damage and force transmission in disordered and heterogeneous, quasi-brittle granular media. Using this framework, we demonstrated that data on the internal bond strengths and connectivity of a system can be mapped to a complex flow network, and non-trivial patterns in the dynamics on and of this network can then be extracted to gain important insights on transmission in the presence of damage. The key findings for the uniaxial tension tests studied here are:
• The coupled evolution of the preferred pathways for force and damage propagation arises from an optimized force transmission process. These pathways form the solutions to two classical network flow optimization problems: the minimum cost flow problem and the minimum cut problem, respectively. These problems are related to each other by the global force capacity, the solution to the classical maximum flow problem.
• The preferred pathways for force transmission consist of the shortest possible percolating paths that can transmit the global force capacity in alignment with the applied loading. The majority of tensile force chains emerge along these paths, while the force bottleneck lies across these paths. By the strong duality theorem of linear programming, the fracture strength of the force bottleneck is equal to the global force capacity. Thus, the transmitted force flow through the specimen rises to the global force transmission capacity in the pre-failure regime, before essentially reaching this limiting capacity in the failure regime. Cascading bond failures develop along the congested bottleneck from peak strength, giving way to the macrocrack and the attendant sharp drop from the peak load (softening).
• Pre-failure dynamics is governed by the inherent redundant pathways for force transfer. Force reroutes help alleviate force congestion in the bottleneck, by redirecting forces and damage to other parts of the sample. Consequently, in the nascent stages of the pre-failure regime, sites of highest concentrations of stress and damage do not provide reliable indicators of the ultimate location of macrocracks in disordered granular media.
Findings suggest that a nuanced “systems” approach is essential in the characterization and modeling of transmission patterns, especially when it comes to early detection of cracks in complex disordered materials like concrete. Beyond early prediction of failure, our approach may also prove useful in the de novo design of mechanically robust multi-component granular materials through rational fine-tuning of the heterogeneities in microstructural fabric and strength to achieve various levels of redundancies in transmission pathways.
Data Availability Statement
The data in this paper are available upon reasonable request to Michał Nitka and Jacek Tejchman.
Author Contributions
AT conceived, designed, and directed the study. MN and JT acquired the data. SK implemented the model and generated all the figures. AT and SK analyzed and interpreted the results. AT wrote the manuscript with contributions from CR, MN, and JT. All authors contributed to the final version of the manuscript.
Funding
AT, SK, and CR were supported by the U.S. Army International Technology Center Pacific (ITC-PAC) and the US DoD High Performance Computing Modernization Program (HPCMP) under Contract No. FA5209-18-C-0002. MN and JT were supported under the project: Effect of mesostructure of concrete on a crack formation and propagation– experiments and two-scale numerical model financed by the National Science Centre NCN (UMO-2017/25/B/ST8/02108).
Conflict of Interest
The authors declare that the research was conducted in the absence of any commercial or financial relationships that could be construed as a potential conflict of interest.
Acknowledgments
We thank the Editor Professor Giles Hunt and our reviewers for constructive comments.
Supplementary Material
The Supplementary Material for this article can be found online at: https://www.frontiersin.org/articles/10.3389/fmats.2020.00079/full#supplementary-material
Footnotes
1. ^Damage to a contact can be defined as a reduction in the contact capacity. For a bonded contact, damage may take one of two forms: the bond is broken but the contact is maintained resulting in a degraded but non-zero capacity, or, both the bond and contact are broken resulting in zero capacity. Here we are interested in the latter.
2. ^Rattler grains with no contacts or grains with only unbonded contacts are excluded from
References
Agnew, S. R., Dong, L., Keene, J. I., and Wadley, H. N. (2018). Mechanical properties of large TiC-Mo-Ni cermet tiles. Int. J. Refract. Metals Hard Mater. 75, 238–247. doi: 10.1016/j.ijrmhm.2018.05.005
Ahuja, R. K., Magnanti, T. L., and Orlin, J. B. (1993). Network Flows: Theory, Algorithms, and Applications. Englewood Cliffs, NJ: Prentice Hall.
Bentur, A., and Mindess, S. (1986). The effect of concrete strength on crack patterns. Cement Concrete Res. 16, 59–66. doi: 10.1016/0008-8846(86)90068-2
Cho, N., Martin, C. D., and Sego, D. C. (2007). A clumped particle model for rock. Int. J. Rock Mech. Mining Sci. 44, 997–1010. doi: 10.1016/j.ijrmms.2007.02.002
Duan, K., Kwok, C., and Tham, L. (2015). Micromechanical analysis of the failure process of brittle rock. Int. J. Num. Anal. Methods Geomech. 39, 618–634. doi: 10.1002/nag.2329
Dueñas-Osorio, L., and Vemuru, S. M. (2009). Cascading failures in complex infrastructure systems. Struct. Saf. 31, 157–167. doi: 10.1016/j.strusafe.2008.06.007
Estrada, E., Hatano, N., and Benzi, M. (2012). The physics of communicability in complex networks. Phys. Rep. 514, 89–119. doi: 10.1016/j.physrep.2012.01.006
Gu, X. W., Wu, Z., Zhang, Y.-W., Srolovitz, D. J., and Greer, J. R. (2013). Microstructure versus flaw: mechanisms of failure and strength in nanostructures. Nano Lett. 13, 5703–5709. doi: 10.1021/nl403453h
Huang, D., and Zhu, T.-T. (2018). Experimental and numerical study on the strength and hybrid fracture of sandstone under tension-shear stress. Eng. Fract. Mech. 200, 387–400. doi: 10.1016/j.engfracmech.2018.08.012
Jiang, M., Zhu, F., Liu, F., and Utili, S. (2014). A bond contact model for methane hydrate-bearing sediments with interparticle cementation. Int. J. Num. Anal. Methods Geomech. 38, 1823–1854. doi: 10.1002/nag.2283
Jiang, M. J., Yan, H. B., Zhu, H. H., and Utili, S. (2011). Modeling shear behavior and strain localization in cemented sands by two-dimensional distinct element method analyses. Comput. Geotech. 38, 14–29. doi: 10.1016/j.compgeo.2010.09.001
Kahagalage, S., Tordesillas, A., Nitka, M., and Tejchman, J. (2017). “Of cuts and cracks: data analytics on constrained graphs for early prediction of failure in cementitious materials,” in EPJ Web of Conferences (Montpellier), 08012. doi: 10.1051/epjconf/201714008012
Kondo, S., Ishihara, A., Tochigi, E., Shibata, N., and Ikuhara, Y. (2019). Direct observation of atomic-scale fracture path within ceramic grain boundary core. Nat. Commun. 10:2112. doi: 10.1038/s41467-019-10183-3
Kozicki, J., and Donzé, F. (2008). A new open-source software developed for numerical simulations using discrete modeling methods. Comput. Methods Appl. Mech. Eng. 197, 4429–4443. doi: 10.1016/j.cma.2008.05.023
Lan, H., Martin, C. D., and Hu, B. (2010). Effect of heterogeneity of brittle rock on micromechanical extensile behavior during compression loading. J.Geophys. Res. Solid Earth. 115:B1. doi: 10.1029/2009JB006496
Lin, Q., and Tordesillas, A. (2014). Towards an optimization theory for deforming dense granular materials: minimum cost maximum flow solutions. J. Indus. Manage. Optimizat. 10, 337–362. doi: 10.3934/jimo.2014.10.337
Liu, H., Ren, X., Liang, S., and Li, J. (2019). Physical mechanism of concrete damage under compression. Materials 12:3295. doi: 10.3390/ma12203295
McBeck, J., Mair, K., and Renard, F. (2019). How porosity controls macroscopic failure via propagating fractures and percolating force chains in porous granular rocks. J. Geophys. Res. Solid Earth. 124, 9920–9939. doi: 10.1029/2019JB017825
Mindess, S., and Diamond, S. (1982). The cracking and fracture of mortar. Matériaux et Construction 15, 107–113. doi: 10.1007/BF02473571
Mishra, R. K., Mohamed, A. K., Geissbühler, D., Manzano, H., Jamil, T., Shahsavari, R., et al. (2017). cemff: A force field database for cementitious materials including validations, applications and opportunities. Cement and Concrete Res. 102, 68–89. doi: 10.1016/j.cemconres.2017.09.003
Muthuswamy, M., and Tordesillas, A. (2006). How do interparticle contact friction, packing density and degree of polydispersity affect force propagation in particulate assemblies? J. Stat. Mech. Theory Exp. 2006:P09003. doi: 10.1088/1742-5468/2006/09/P09003
Nitka, M., and Tejchman, J. (2014). Discrete modeling of micro-structure evolution during concrete fracture using DEM. Comput. Modell. Concrete Struct. 345, 345–354. doi: 10.1201/b16645-39
Nitka, M., and Tejchman, J. (2015). Modelling of concrete behaviour in uniaxial compression and tension with DEM. Granular Matter 17, 145–164. doi: 10.1007/s10035-015-0546-4
Nitka, M., and Tejchman, J. (2018). A three-dimensional meso-scale approach to concrete fracture based on combined DEM with X-ray μCT images. Cement Concrete Res. 107, 11–29. doi: 10.1016/j.cemconres.2018.02.006
Oliver-Leblond, C. (2019). Discontinuous crack growth and toughening mechanisms in concrete: a numerical study based on the beam-particle approach. Eng. Fract. Mech. 207, 1–22. doi: 10.1016/j.engfracmech.2018.11.050
Ord, A., and Hobbs, B. E. (2010). Fracture pattern formation in frictional, cohesive, granular material. Philos. Trans. R. Soc. A Math. Phys. Eng. Sci. 368, 95–118. doi: 10.1098/rsta.2009.0199
Ovalle, C., Dano, C., and Hicher, P.-Y. (2013). Experimental data highlighting the role of surface fracture energy in quasi-static confined comminution. Int. J. Fract. 182, 123–130. doi: 10.1007/s10704-013-9833-4
Patel, R., Valles, D., Riveros, G., Thompson, D., Perkins, E., Hoover, J., et al. (2018). Stress flow analysis of bio-structures using the finite element method and the flow network approach. Finite Elements Design 152, 46–54. doi: 10.1016/j.finel.2018.09.003
Pease, B. J., Geiker, M. R., Stang, H., and Weiss, J. (2006). “Photogrammetric assessment of flexure induced cracking of reinforced concrete beams under service loads,” in Second International RILEM Symposium: Advances in Concrete Through Science and Engineering (Quebec City: Rilem Publications). doi: 10.1617/2351580028.041
Potyondy, D. O., and Cundall, P. A. (2004). A bonded-particle model for rock. Int. J. Rock Mech. Mining Sci. 41, 1329–1364. doi: 10.1016/j.ijrmms.2004.09.011
Schenker, I., Filser, F. T., Aste, T., and Gauckler, L. J. (2008). Microstructures and mechanical properties of dense particle gels: microstructural characterisation. J. Eur. Ceramic Soc. 28, 1443–1449. doi: 10.1016/j.jeurceramsoc.2007.12.007
Schlangen, E. (2008). “Crack development in concrete, part 1: fracture experiments and CT-scan observations,” in Key Engineering Materials (Stafa-Zurich, UK: Trans Tech Publ.), 69–72. doi: 10.4028/www.scientific.net/KEM.385-387.69
Scholtes, L., and Donze, F.-V. (2013). A DEM model for soft and hard rocks: role of grain interlocking on strength. J. Mech. Phys. Solids 61, 352–369. doi: 10.1016/j.jmps.2012.10.005
Sinaie, S., Ngo, T. D., and Nguyen, V. P. (2018). A discrete element model of concrete for cyclic loading. Comput. Struct. 196, 173–185. doi: 10.1016/j.compstruc.2017.11.014
Skarzynski, L., Nitka, M., and Tejchman, J. (2015). Modelling of concrete fracture at aggregate level using FEM and DEM based on X-ray μCT images of internal structure. Eng. Fract. Mech. 147, 13–35. doi: 10.1016/j.engfracmech.2015.08.010
Skarzynski, L., and Tejchman, J. (2016). Experimental investigations of fracture process in concrete by means of x-ray micro-computed tomography. Strain 52, 26–45. doi: 10.1111/str.12168
Skarzynski, L., and Tejchman, J. (2019). Experimental investigations of damage evolution in concrete during bending by continuous micro-CT scanning. Mater. Character. 154, 40–52. doi: 10.1016/j.matchar.2019.05.034
Suchorzewski, J., Tejchman, J., and Nitka, M. (2018a). Discrete element method simulations of fracture in concrete under uniaxial compression based on its real internal structure. Int. J. Damage Mech. 27, 578–607. doi: 10.1177/1056789517690915
Suchorzewski, J., Tejchman, J., and Nitka, M. (2018b). Experimental and numerical investigations of concrete behaviour at meso-level during quasi-static splitting tension. Theor. Appl. Fract. Mech. 96, 720–739. doi: 10.1016/j.tafmec.2017.10.011
Sun, W., Hou, K., Yang, Z., and Wen, Y. (2017). X-ray CT three-dimensional reconstruction and discrete element analysis of the cement paste backfill pore structure under uniaxial compression. Construct. Build. Mater. 138, 69–78. doi: 10.1016/j.conbuildmat.2017.01.088
Suzuki, H., Bae, S., and Kanematsu, M. (2016). Nanostructural deformation analysis of calcium silicate hydrate in portland cement paste by atomic pair distribution function. Adv. Mater. Sci. Eng. 2016, 1–6. doi: 10.1155/2016/8936084
Tordesillas, A., Cramer, A., and Walker, D. M. (2013). “Minimum cut and shear bands,” in Powders and Grains 2013: Proceedings of the 7th International Conference on Micromechanics of Granular Media (Sydney, NSW: AIP Publishing), 507–510. doi: 10.1063/1.4811979
Tordesillas, A., Kahagalage, S., Ras, C., Nitka, M., and Tejchman, J. (2018). Interdependent evolution of robustness, force transmission and damage in a heterogeneous quasi-brittle granular material: from suppressed to cascading failure. arXiv preprint arXiv:1809.01491. Available online at: http://arxiv.org/abs/1809.01491
Tordesillas, A., Pucilowski, S., Tobin, S., Kuhn, M. R., Andó, E., et al. (2015a). Shear bands as bottlenecks in force transmission. Europhys. Lett. 110:58005. doi: 10.1209/0295-5075/110/58005
Tordesillas, A., Tobin, S., Cil, M., Alshibli, K., and Behringer, R. P. (2015b). Network flow model of force transmission in unbonded and bonded granular media. Phys. Rev. E 91:062204. doi: 10.1103/PhysRevE.91.062204
van der Linden, J. H., Tordesillas, A., and Narsilio, G. A. (2019). Preferential flow pathways in a deforming granular material: self-organization into functional groups for optimized global transport. Sci. Rep. 9, 1–15. doi: 10.1038/s41598-019-54699-6
van Mier, J. G. (1986). Multiaxial strain-softening of concrete. Mater. Struct. 19, 179–190. doi: 10.1007/BF02472034
van Mier, J. G. M., and van Vliet, M. R. A. (2002). Uniaxial tension test for the determination of fracture parameters of concrete: state of the art. Eng. Fract. Mech. 69, 235–247. doi: 10.1016/S0013-7944(01)00087-X
Van Vliet, M. R., and Van Mier, J. G. (1999). “Effect of strain gradients on the size effect of concrete in uniaxial tension,” in Fracture Scaling, Z. P. Bazant and Y. D. S. Rajapakse (Dordrecht: Springer), 195–219. doi: 10.1007/978-94-011-4659-3_11
Vu, C.-C., Amitrano, D., Plé, O., and Weiss, J. (2019). Compressive failure as a critical transition: Experimental evidence and mapping onto the universality class of depinning. Phys. Rev. Lett. 122:015502. doi: 10.1103/PhysRevLett.122.015502
West, B., and Scafetta, N. (2010). Disrupted networks: from physics to climate change. Studies of nonlinear phenomena in life sciences. World Sci. 13, 1–68; 253–261. doi: 10.1142/7714
Xiao, J., Li, W., Corr, D. J., and Shah, S. P. (2012). Simulation study on the stress distribution in modeled recycled aggregate concrete under uniaxial compression. J. Mater. Civil Eng. 25, 504–518. doi: 10.1061/(ASCE)MT.1943-5533.0000598
Xiao, J., Li, W., Sun, Z., Lange, D. A., and Shah, S. P. (2013). Properties of interfacial transition zones in recycled aggregate concrete tested by nanoindentation. Cement Concrete Composites 37, 276–292. doi: 10.1016/j.cemconcomp.2013.01.006
Yin, H., Qi, H. J., Fan, F., Zhu, T., Wang, B., and Wei, Y. (2015). Griffith criterion for brittle fracture in graphene. Nano Lett. 15, 1918–1924. doi: 10.1021/nl5047686
Zhao, T., Crosta, G. B., Dattola, G., and Utili, S. (2018). Dynamic fragmentation of jointed rock blocks during rockslide-avalanches: insights from discrete element analyses. J. Geophys. Res. Solid Earth 123, 3250–3269. doi: 10.1002/2017JB015210
A. Nomenclature
The list below contains the symbols and nomenclature used in this paper. It is divided into two groups, each arranged in alphabetical order: symbols in the Greek alphabet, and symbols in the English alphabet.
Keywords: preferential paths, concrete, crack mechanics, robustness, redundancy, tensile force chains, force bottlenecks, granular material
Citation: Tordesillas A, Kahagalage S, Ras C, Nitka M and Tejchman J (2020) Coupled Evolution of Preferential Paths for Force and Damage in the Pre-failure Regime in Disordered and Heterogeneous, Quasi-Brittle Granular Materials. Front. Mater. 7:79. doi: 10.3389/fmats.2020.00079
Received: 21 December 2019; Accepted: 18 March 2020;
Published: 24 April 2020.
Edited by:
Giles Hunt, University of Bath, United KingdomReviewed by:
Liang-Yu Chen, Jiangsu University of Science and Technology, ChinaArcady Dyskin, University of Western Australia, Australia
Copyright © 2020 Tordesillas, Kahagalage, Ras, Nitka and Tejchman. This is an open-access article distributed under the terms of the Creative Commons Attribution License (CC BY). The use, distribution or reproduction in other forums is permitted, provided the original author(s) and the copyright owner(s) are credited and that the original publication in this journal is cited, in accordance with accepted academic practice. No use, distribution or reproduction is permitted which does not comply with these terms.
*Correspondence: Antoinette Tordesillas, atordesi@unimelb.edu.au
†ORCID: Antoinette Tordesillas orcid.org/0000-0001-5497-292X