The In Situ Observation of Phase Transformations During Intercritical Annealing of a Medium Manganese Advanced High Strength Steel by High Energy X-Ray Diffraction
 Xiaohua Hu1*
  Josh J. Mueller2 Xin Sun1*
  Emmanuel De Moor2
  John G. Speer2
  David K. Matlock2 Yang Ren3
- 1Oak Ridge National Lab, Oak Ridge, TN, United States
- 2Advanced Steel Processing and Products Research Center, Colorado School of Mines, Golden, CO, United States
- 3X-ray Science Division, Argonne National Laboratory, Argonne, IL, United States
Microstructural changes during thermal processing of a medium manganese steel containing (in wt%) 0.19C and 4.39 Mn were evaluated in situ with a high energy X-ray diffraction system (HEXRD). Samples with an initial fully martensitic microstructure were heated to intercritical annealing (IA) temperatures of 600 or 650°C, held for 30 min, and cooled to room temperature. Diffraction data were analyzed to determine the variations in austenite and ferrite phase fractions and phase lattice constants throughout the ICA cycles. On heating, the 2 vol. pct of austenite present in the starting microstructure decomposed, and cementite precipitation then occurred. During isothermal holding, the austenite fraction increased, up to 20% for the sample annealed at 650°C. The measured austenite fractions were less than those calculated by Thermo-Calc for equilibrium conditions, indicating that the 30-min hold time was insufficient to achieve near-equilibrium conditions. Observed changes in lattice parameters during isothermal holding were interpreted to reflect composition changes due to redistribution of the C and Mn between austenite and ferrite. The results are discussed in relation to the potential for controlling austenite stability during ambient temperature deformation.
Introduction
Medium manganese steels represent one of the third-generation advanced high strength steels (3Gen AHSS) which have attracted significant attention from the global automotive industry and steel researchers as potential enablers for vehicle light weighting (Abu-Farha et al., 2018). The enhanced interest in these steels is due to excellent combinations of strength and formability which have been shown to reflect the transformation of retained austenite to martensite during forming, a characteristic referred to as transformation-induced plasticity (i.e., the TRIP effect), and the potential that automotive components can be formed from lighter gage steels to achieve vehicle weight reductions (Taub and Luo, 2015).
In contrast to other types of 3Gen AHSS, one of which utilizes the quenching and partitioning (Q&P) process (Speer et al., 2003), medium manganese steels are typically processed by intercritical annealing (IA) (Bleck et al., 2019) steels with Mn contents between 5 and 12 wt%, having primarily martensitic microstructures after hot and/or cold rolling. The intercritical annealing process reheats the material to a temperature between AC1 and AC3 and forms a two-phase microstructure of ferrite (α) and austenite (γ). With appropriate alloying to stabilize austenite, the two-phase microstructure can be mostly retained after cooling to room temperature. However, due to the potential to utilize wide ranges of processing parameters, e.g., ICA temperature and holding time, medium Mn steels which exhibit a wide variety of properties have been reported. For example, tensile elongations of an 8 Mn steel annealed for 30 min have been reported to range from 15% to 35% over the range of IA temperature between 600 and 700°C (Zhao et al., 2014). The observed variations in ductility can be attributed to the different microstructural characteristics (e.g., volume fractions of retained austenite, the sizes, morphologies and distributions of the austenite and ferrite, etc.) which result from the different annealing conditions. Specifically, the sample which exhibited the highest elongation was annealed at 600°C resulting in the highest austenite volume fraction (around 40%) after cooling to room temperature. In addition to high elongations, medium Mn steels may also exhibit substantial yield point elongations (Abu-Farha et al., 2018).
To understand the influences of the IA temperature and holding time on microstructure, ex situ microstructure analyses are usually performed at room temperature on as-annealed samples using various characterization techniques including light optical microscopy, scanning electron microscopy (SEM), transmission electron microscopy (TEM), and lab scale Cu Kα low energy X-ray diffraction (XRD). These techniques primarily assess surface or near-surface microstructures, and there is interest to incorporate alternate techniques, as discussed below, to more completely analyze materials by assessing bulk microstructures, both during and after processing.
Synchrotron-based high energy X-ray diffraction (HEXRD) is a volumetric characterization technique where X-rays possess sufficient energy to penetrate samples up to dimensions of multiple millimeters. Data obtained can be used to calculate multiple important properties including phase volume fractions, lattice distortions, and variations in lattice parameters which can be correlated to individual phase compositions, etc. Furthermore, in situ HEXRD techniques have been well developed to measure the microstructural changes during heating/cooling (Michalik et al., 2016) or during deformation (Hu et al., 2016; Hu et al., 2017). In situ HEXRD characterization of medium Mn steels during the ICA heat treatments can provide opportunities to obtain information on phase transformations and microstructural development during processing. It can provide, for example, continuous austenite and ferrite/martensite volume fraction measurements at different temperatures for different IA stages, e.g., heating, isothermal annealing, and cooling, etc. It can also characterize the evolution of lattice parameters and phase chemical compositions between constituents during an IA thermal cycle.
This current work focuses on evaluating microstructural evolution using in situ HEXRD IA during processing of a medium manganese steel subjected to IA. The results are discussed together with the equilibrium calculations using Thermo-Calc (Thermo-Calc, 2020).
Experiments
The material used in this study, a Fe-0.19C-4.39 Mn (wt%) medium Mn steel, was vacuum cast as a 35 cm × 13 cm × 13 cm ingot, reheated to 1,180°C for 2 h, hot rolled to a thickness of 4 mm, and air cooled (Mueller et al., 2021). The steel was then annealed for 16 h between 550 and 600°C prior to cold rolling to a thickness of 1 mm. To reproduce an as-quenched (AQ) condition, 4 mm × 10 mm samples were machined from the sheet steel and heated to 850°C and held 300 s (5 min) for austenitization under vacuum before quenching to room temperature at 60°C⋅s−1 with helium gas in a TA Instruments DIL 805A dilatometer.
Samples for microstructural analysis were cross-sectioned, hot-mounted in Bakelite, polished using standard metallographic procedures, and etched with a 1 pct nital solution for 5 s. Metallography was conducted using a JEOL 7000 FESEM with a 15 kV accelerating voltage and working distance of 10 mm. Figure 1 shows a scanning electron micrograph of the as-quenched martensitic microstructure present in the material which was the basis for subsequent ICA treatments and analysis.
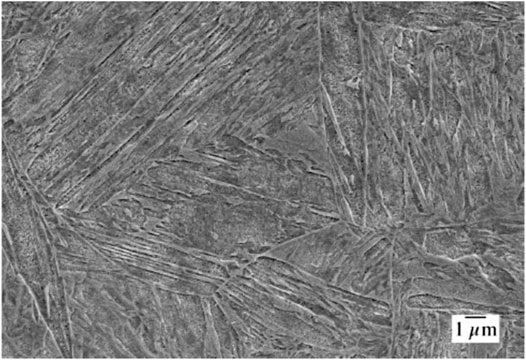
FIGURE 1. Scanning electron micrograph of the as-quenched microstructure of the Fe-0.19°C-4.39 Mn steel (nital etch).
High energy X-ray diffraction was conducted in situ during intercritical annealing (IA) of a sample at the 11-ID-C beamline of the Advanced Photon Source at Argonne National Laboratory. Sample heating was accomplished with a Linkam TS1500 microheating stage (Linkam, 2020) where the chamber can be heated to 1,500°C. In the current work, IA heat treatments were accomplished by first heating the sample which is seated in the chamber at a rate of 0.76 °C/s to either 600°C or 650°C, the two IA temperatures selected for this study, and then holding for 30 min. This was followed by cooling to room temperature again at a rate of 0.76 °C/s. The IA temperatures were between the AC1 (550°C) and AC3 (730°C) temperatures, based on Thermo-Calc calculations for the experimental alloy with the use of TCFE9 database (ThermoCalc, 2020).
During IA, a monochromatic synchrotron-source X-ray beam with an energy of 106.42 keV and a wavelength (λ) of 0.01165 nm impinged the sample over a 500 μm × 500 μm area through the circular glass window of the TS 1500 microheating stage. The high-energy X-ray beam penetrated through the 1 mm sample thickness and diffracted according to Bragg’s law (Bragg, 1929):
where hkl denotes Miller indices for the diffracting plane of interest,
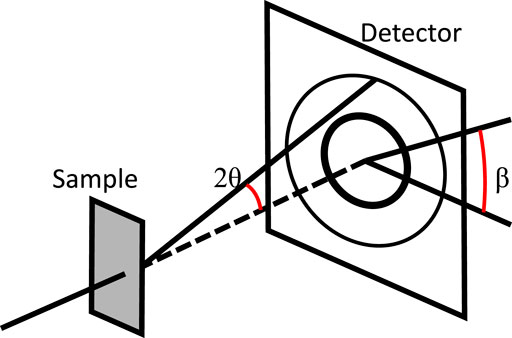
FIGURE 2. An illustrative sketch of the in situ HEXRD set up at the 11-ID-C beamline of the Advanced Photon Source at Argonne National Laboratory. Adapted from Mueller et al. (2021). Elsevier © 2021.
The two-dimensional HEXRD Debye ring data were processed using the software fit2D (Hammersley, 2020). As an example, Figure 3A shows the Debye rings recorded on the detector at room temperature before thermal processing of the sample. Figure 3B shows the corresponding diffraction profile from the intensities of the Debye rings integrated over the 360-degree range of β plotted relative to the 2θ position, identifying ferrite (α) and austenite (γ) peaks. Intensities for selected peaks were truncated to emphasize the presence of the lower intensity γ peaks. The diffraction profile for each time-step was fit using the software OriginPro (Edwards, 2002). The integrated area A under a peak of lattice plane i of phase j was obtained for each peak. The volume fraction
where Ph is the number of phases present, Pj is the number of peaks for phase j, and Rij is the X-ray normalization factor for peak i of phase j and can be theoretically calculated (E975-13, A., 2013; Kim, 1979).
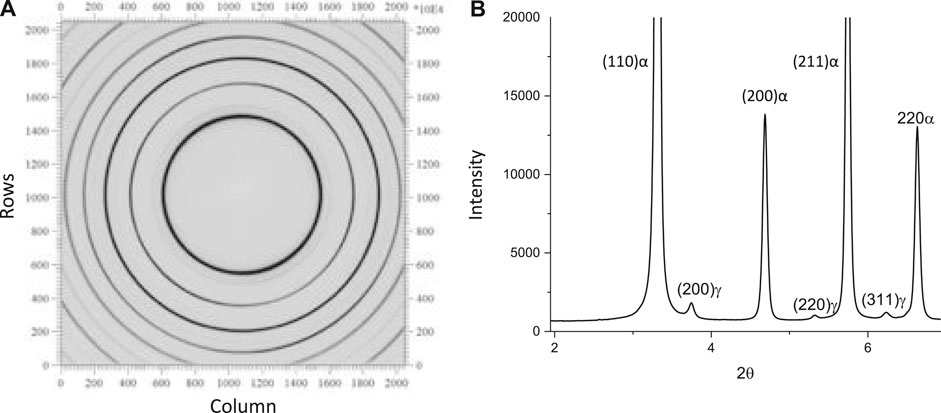
FIGURE 3. Debye rings recorded on the detector at room temperature before thermal processing of the sample (A) and the corresponding diffraction spectrum from the integrated intensity of the Debye rings over the 360-degree range of β plotted relative to 2θ position (B); ferrite (α) and austenite (γ) peaks are identified in the spectrum.
Equation 1 was used to calculate dhkl values from 2θhkl measurements and the corresponding lattice constants were calculated from the following equation:
As both ferrite and austenite crystal structures are cubic, only one independent lattice constant a was calculated for each. In the current work, martensite was not differentiated from ferrite since both have similar lattice constants even though the later has a body centered tetragonal (BCT) crystal structure which is slightly distorted from the ferrite cubic crystal structure. The subscript hkl for a in Eq. 3 was used to correlate specific calculations of ahkl to a specific interplanar spacing, since calculated a-values may not be the same when referenced to different planes within each crystal structure.
In the current work, the (200) and (211) peaks were used to calculate the lattice constant ahkl of the ferrite/martensite (α) phases and to find the average value, i.e., a=(a200+a211)/2. A normalized value was used to represent lattice constant variations during processing relative to the value measured for the starting as-quenched condition defined as a0 (i.e., the normalized values equal a/a0-α). Similarly, (200) and (220) peaks were used for the calculation of normalized lattice constants of the austenite (γ) phase (a/a0-γ) relative to the as-received condition.
Results
Austenite Volume Fraction
Figures 4A, 5B, respectively, show the variation in austenite volume fraction with temperature and time for samples processed to holding temperatures of 600°C and 650°C. Note in each figure the data are shown for a complete thermal cycle starting from room temperature at time “0,” through heating to the isothermal hold temperatures, and on cooling back to room temperature. The thermal cycle is emphasized by the arrows in Figure 5A. It can be seen from Figures 4A,B that the initial austenite volume fraction of the as-quenched material is about 0.02. The austenite, however, almost completely disappears when the sample reaches 370°C which takes 7.6 min. On continued heating to the holding temperature, there is a very slight increase of austenite fraction. The temperature of 370°C is quite close to the expected temperature for cementite precipitation of this alloy shown in Figure 5 which presents predicted (Thermo-Calc) variations in equilibrium mole-fractions with temperature for austenite, ferrite, and cementite.
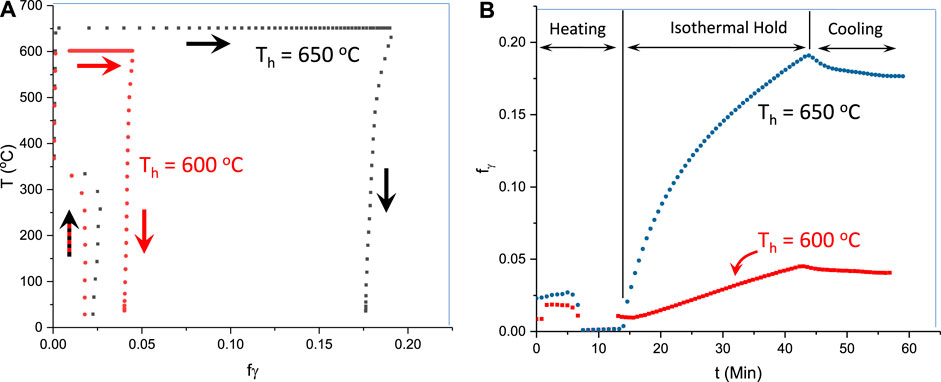
FIGURE 4. Measured austenite volume fractions as a function of (A) temperature and (B) time. In (A) the large arrows indicate data obtained through the thermal cycle from heating, holding, and cooling. In (B), the times which correspond to the processing steps (A) are indicated.
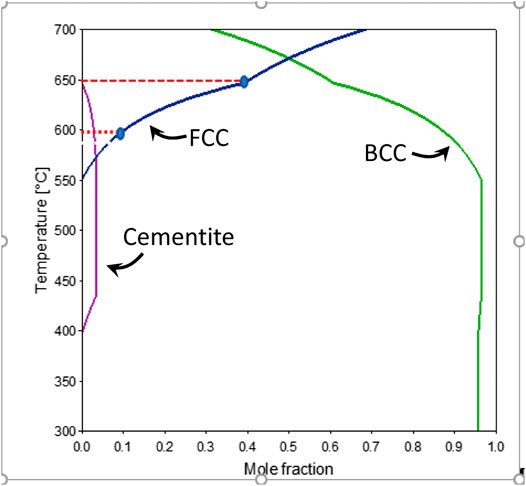
FIGURE 5. Equilibrium mole fraction of different phases in the material determined by Thermo-calc. BCC stands for ferrite and FCC stands for austenite.
To correlate with the results shown above (Figures 4, 5), Figures 6 shows diffraction spectra observed for a sample during heating to 375°C (Figure 6A) and after isothermal holding for 25 min at 650°C (Figure 6B). In both sets of HEXRD data, minor peaks are associated with the formation of cementite, consistent with the predictions shown in Figure 5. Note the cementite peaks were not evident in the spectrum for the starting as-quenched microstructure shown in Figure 4B.
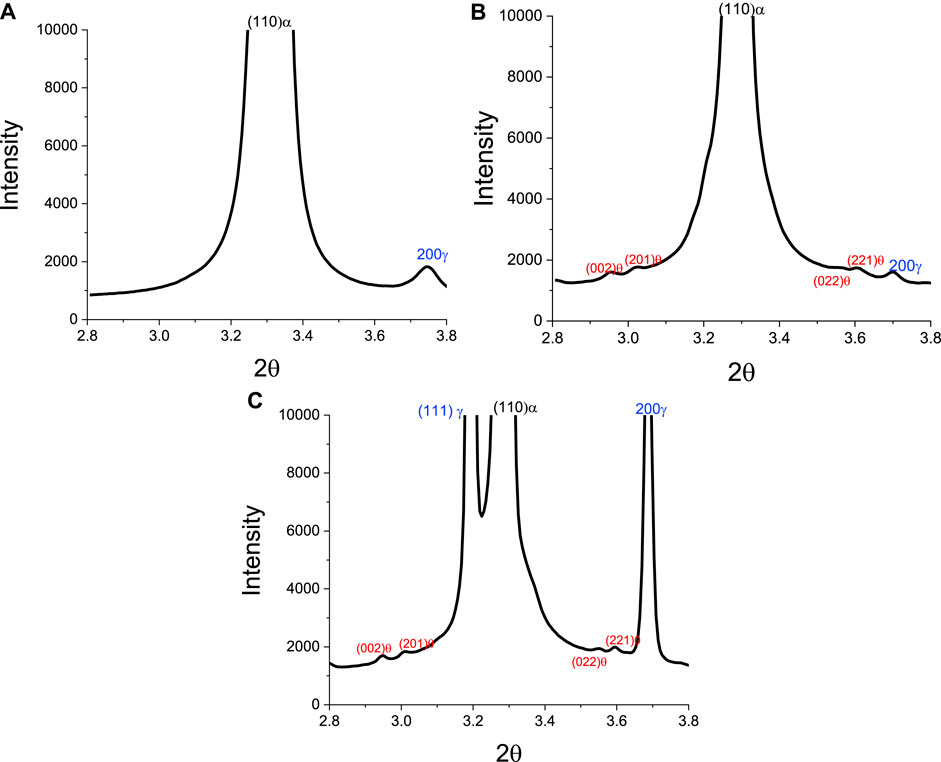
FIGURE 6. HEXRD diffraction spectra for a sample at selected stages in the ICA thermal cycle: (A) before heating, (B) after heating to 375°C, and (C) after holding for 25 min at 650°C.
As shown in Figure 4B, during holding at 600°C, the austenite volume fraction increases to a maximum value of 4.5% after isothermal holding for 30 min (which occurs at about 42.7 min, accounting for the heating time). After cooling to room temperature (time of about 56 min on the x-axis of Figure 4B), the volume fraction of austenite reduced to approximately 4%. During holding at 650°C, the volume fraction increases faster and reaches 20% after 30 min holding (total time of approximately 44 min). It should be noted that the predicted equilibrium fractions (Figure 5) are 10% for 600°C and 40% for 650°C; these points are marked as blue ellipses in Figure 5. The predicted equilibrium values at the two ICA temperatures used here are about twice the measured values in the current study. This difference between actual and predicted indicates that thermodynamic equilibrium was not achieved after 30 min of holding, presumably associated with sluggish Mn redistribution.
Normalized Lattice Constant
Figure 7 shows measured lattice constants normalized by the values determined at time “0” for austenite (Figure 7A,C) and ferrite (Figure 7B,D) as a function of time for complete ICA cycles up to the peak temperatures of 600 and 650°C. Figure 7A shows that during heating the lattice constant of austenite increases approximately linearly, an observation interpreted to reflect thermal expansion. After about 6 min when the temperature reaches around 300°C, the slope of the lattice constant increase becomes larger. For times above this point until the initiation of the isothermal hold, no austenite lattice parameters are registered as the small amount of austenite present in the initial as-quenched material dissolves as discussed earlier with respect to Figure 4. Figure 7C shows that on the initiation of holding at 600°C, austenite starts to form, and the lattice constant of austenite increases slightly at first and then decreases gradually during holding. On cooling to room temperature, the lattice constant decreases, due to thermal contraction. However, as shown in Figure 7A, the final lattice constant of austenite is greater than the value in the as-quenched state (normalized lattice constant of 1.006). Figure 7C also shows that, during isothermal holding at 650°C, the normalized lattice constant of austenite decreases from 1.019 at the beginning of the isothermal hold to 1.005 just prior to cooling.
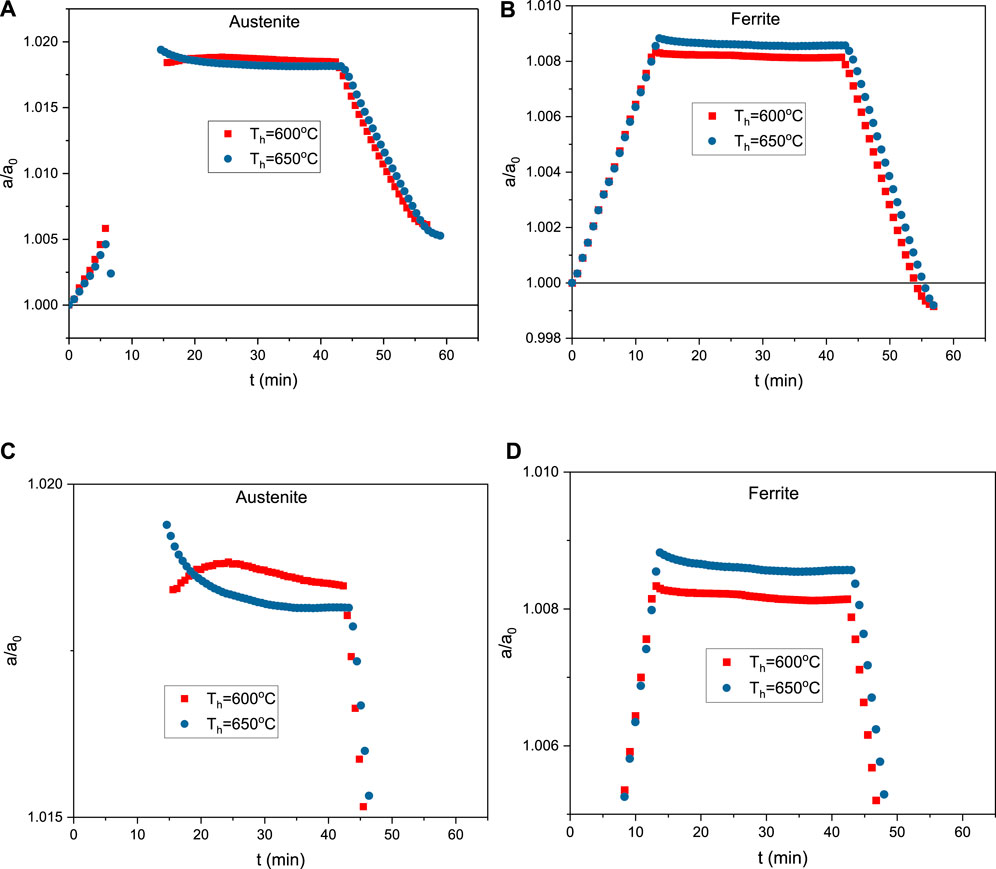
FIGURE 7. Normalized lattice parameters as a function of time during ICA thermal cycles for peak hold times of 600 and 650°C: (A) austenite and (B) ferrite/martensite. (C) and (D) are rescaled versions of (A) and (B) to show a clearer trend of lattice constant change during holding.
Figure 7B,D show the effects of time on normalized lattice constants for ferrite/martensite. Initially the lattice constant increases due to thermal expansion, followed by decreases during isothermal holding at 600°C or 650°C. After the 30 min isothermal holds, on cooling to room temperature the lattice constant decreases due to thermal contraction. Independent of isothermal holding temperature, the final normalized lattice constant of ferrite is 0.9991 for both holding temperatures, indicating a small amount of contraction that occurred as a result of the ICA thermal cycles.
Discussion
The HEXRD results presented here provide direct evidence of changes that occur during ICA of a medium Mn steel, initially processed with a fully martensitic microstructure. In addition to quantitative measurements of changes in austenite and ferrite/martensite volume fractions and lattice parameters, the in situ high energy X-ray diffraction data provide the first direct evidence of austenite decomposition during heating of these steels and the fact that dissolution occurs at a temperature (370°C) near the onset of cementite precipitation based on equilibrium calculations as shown in Figure 5.
Thermo-Calc equilibrium calculations can predict equilibrium phase volume fractions and compositions at different temperatures. The equilibrium state is an ideal state where the material is assumed to be placed at a certain temperature for an infinite amount of time, while the actual heat treatment of a material ranges from seconds to hours. Equilibrium phase transformations usually involve a diffusional process. Therefore, equilibrium is usually not reached, especially at lower temperatures when the diffusivity (D) is low. Therefore, austenite fractions after 30 min of holding at both 600°C and 650°C for 30 min are well below equilibrium values at those temperatures. It is to be noted that diffusivity (D) of an element in a phase has a linear relationship with mobility (μ) and temperature (T) based on the Einstein relation (Einstein, 1905):
where KB is Boltzmann’s constant.
On the other hand, Thermo-Calc does not differentiate ferrite and martensite, since the latter is a nonequilibrium variant. The effective rate of atomic transport contributing to a diffusional phase transformation may be in excess of the bulk diffusivity value due to the so-called short-circuit diffusion pathways, such as grain boundaries and dislocations; this may lead to phase growth that exceeds the rate predicted using a bulk diffusivity value (Atkinson, 1988). Due to the elevated dislocation density in low-carbon martensite (Speich, 1969), the effect of short-circuit diffusion is likely also prevalent in the case of martensite-to-austenite transformation during intercritical annealing. Using the diffusion module of Thermo-Calc®, DICTRA™, Mueller et al. performed one-dimensional calculations of martensite (/or ferrite)-to-austenite transformation at 650°C with considerations for elevated diffusivity of Mn in martensite (/or ferrite) (Mueller et al., 2021). The transformation kinetics, i.e., the volume fraction changes with time, were in best agreement with experimental results when a multiplicative factor of 1.5 was applied to the database value for Mn mobility in ferrite.
Changes in the austenite or ferrite lattice constants during the intercritical annealing shown in Figure 7 reflect thermal-expansion (or contraction) and chemical composition changes. On heating and cooling, the observed changes primarily reflect thermal expansion or contraction. However, during the isothermal holding stage, observed variations in the lattice constants primarily reflect the effects of compositional changes. As can be seen from Figure 7C, the austenite lattice constant increases during initial holding at 600°C. This can be correlated to the chemical composition changes from low to higher temperatures as calculated by Thermo-Calc of the major alloy elements: C and Mn (Figure 8). Figure 8 shows increasing equilibrium C content and decreasing Mn content with temperature in austenite. Since the lattice constants of both austenite and ferrite (/martensite) are known to have positive correlations with C and Mn content (Onink et al., 1993; Fellinger et al., 2019), the increasing lattice constant from HEXRD at initial holding at 600°C should represent the combined effects of Mn and C redistribution. Since C has considerably higher mobility (therefore diffusivity) than Mn, it therefore dominates the initial stage of diffusional partitioning during holding. The increasing carbon content in austenite from 550°C (AC1 temperature) to 600°C should lead to an increasing lattice constant of austenite, consistent with the in situ HEXRD measurement. When C diffusion is almost complete, Mn diffusion then dominates during the later stages of holding. The decrease of Mn content in austenite from AC1 to 600°C explains the reason why the lattice constant decreases during the later stage of holding at 600°C.
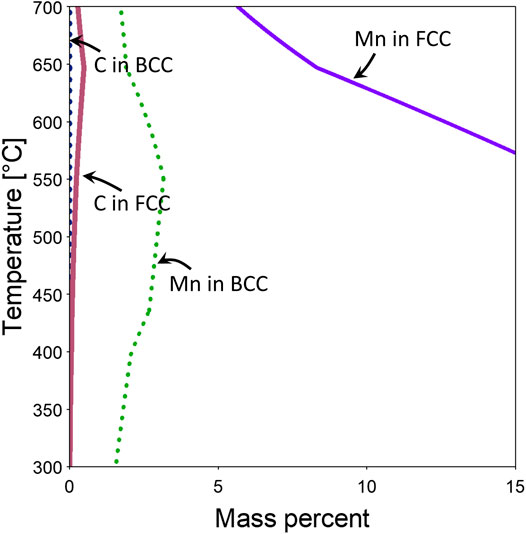
FIGURE 8. Equilibrium predictions of compositions (mass percent) of selected elements in austenite (FCC A1) and Ferrite/martensite (BCC A2) based on Thermo-Calc.
Due to greater mobility of C at 650°C, diffusion of C is completed earlier. In addition, from Thermo-Calc calculation (Figure 8), the C content should decrease from 647°C to 650°C. Considering Mn content in austenite is consistently decreasing from low to high temperatures as seen in Figure 8, it is easy to understand why there is a consistent trend of decreasing lattice constant during holding at 650°C.
The equilibrium carbon content in ferrite is very low and ranges from nearly 0 wt% at 300°C to 0.004 wt% at 650°C (Figure 8). On the other hand, the nonequilibrium martensite phase should have a composition similar to that of austenite for the as-quenched condition due to the diffusionless nature of the martensitic transformation and thus should have a carbon composition similar to the alloy composition (0.19 wt%). Combined with the decreasing trend of change of Mn content in ferrite from 550°C to 650°C (Figure 8), it is understandable why there is a decreasing trend of lattice parameters while holding at both 600°C and 650°C.
Looking at the lattice constants of ferrite (/martensite) and austenite in the as-quenched and intercritically annealed states, we see in Figure 7A that the lattice constant for austenite increased (a/a0>1), while that for ferrite (/martensite) decreased (a/a0<1) during annealing (Figure 7B). This indicates that the intercritical annealing process leads to an increase of C and Mn content in austenite and decrease of C and Mn content in ferrite (/martensite), as expected.
The increase of C and Mn content in austenite considerably increases the austenite stability and leads to much higher austenite volume fractions after ICA (19% after holding at 650°C, followed by cooling down to room temperature) as compared to 2% in the as-quenched state. The volume fraction of austenite is 20% before cooling, indicating that only about 1% transforms on cooling. The as-quenched sample, on the other hand, is derived from the fully austenitic state in which the austenite is represented by the bulk material composition and has much less carbon and Mn in the austenite; therefore, the austenite is much less stable and is mostly transformed into martensite during quenching.
The lower lattice constant in ferrite after ICA compared to the as-quenched state is easy to understand. The as-quenched state consists of nonequilibrium martensite having a larger lattice constant due to its substantial content of interstitial C. Intercritical annealing transforms the martensite into ferrite with depleted C and Mn concentrations, therefore having a lower lattice constant.
It needs to be noted that it is quite challenging to assess quantitatively the variation of C and Mn content from the HEXRD measured lattice constants during the ICA process. This is due to the lack of an accurate quantitative correlation between them at elevated temperature.
Summary
In the current work, advanced in situ HEXRD observation of the austenite characteristics during intercritical annealing has been performed using a Linkam 1,500 heating stage positioned on the high energy synchrotron X-ray beamline. From these in situ observations, the following conclusions can be drawn:
1. The as-quenched 5 Mn steel contains a mainly martensitic microstructure with a small amount of austenite, around 2%.
2. The dissolution of the small amount of austenite is observed during initial heating at around of 375°C, with the associated appearance of cementite in the microstructure.
3. During holding, the austenite volume fraction increases with time to about 20% after 30 min holding at the temperature of 650°C.
4. The lattice constant of austenite increases considerably during intercritical annealing, indicating C and Mn enrichment, which is beneficial for the austenite stability and transformation induced plasticity during deformation.
5. The lattice constant of ferrite/martensite decreases after intercritical annealing, indicating C and Mn depletion, making it closer to equilibrium ferrite.
In situ observation of phase transformation can give a comprehensive understanding of microstructure responses during the heat treatment process which can guide intercritical annealing heat treatment process parameter design for optimum microstructure and properties.
Data Availability Statement
The raw data supporting the conclusions of this article will be made available by the authors, without undue reservation.
Author Contributions
XH prepared the manuscript and performed in situ HEXRD experiment and analysis and Thermal-Calc calculations. JM was involved in manuscript editing, material preparation, and microstructure examination. XS was involved in manuscript editing and was the principle investigator. ED, JS, and DM performed manuscript editing and were the subcontractors. YR performed manuscript editing and helped in in situ HEXRD experiment and analysis.
Funding
This work was funded by the Department of Energy Office of FreedomCAR and Vehicle Technologies under the Automotive Light-Weighting Materials Program managed by Mrs. Sarah Kleinbaum.
Conflict of Interest
The authors declare that the research was conducted in the absence of any commercial or financial relationships that could be construed as a potential conflict of interest.
Acknowledgments
Oak Ridge National Laboratory is operated by UT-Battelle, LLC, for the U.S. Department of Energy under contract DE-AC05-00OR22725. The authors would like to thank the support of the Advanced Steel Processing and Products Research Center (ASPPRC) at the Colorado School of Mines. The authors also thank the Pacific Northwest National Laboratory, which is operated by the Battelle Memorial Institute for the U.S. Department of Energy (DOE) under Contract No. DE-AC05-76RL01830, for their support. This research used resources of the Advanced Photon Source (APS), a U.S. DOE Office of Science User Facility operated for the DOE Office of Science by Argonne National Laboratory under Contract No. DE-AC02-06CH11357.
References
Abu-Farha, F., Hu, X., Sun, X., Ren, Y., Hector, L. G., Thomas, G., et al. (2018). In situ local measurement of austenite mechanical stability and transformation behavior in third-generation advanced high-strength steels. Metall. Mat Trans. A. 49, 2583–2596. doi:10.1007/s11661-018-4660-x
Bleck, W., Brühl, F., Ma, Y., and Sasse, C. (2019). Materials and processes for the third-generation advanced high-strength steels. Berg Huettenmaenn Monatsh 164, 466–474. doi:10.1007/s00501-019-00904-y
Brown, A. (1988). Wagner theory and short circuit diffusion. Mater. Sci. Technol. 4, 1046–1051. doi:10.1179/mst.1988.4.12.1046
E975-13, A. (2013). Standard practice for X-ray determination of retained austenite in steel with near random crystallographic orientation. West Conshohocken, PA: ASTM International.
Edwards, P. M. (2002). Origin 7.0: scientific graphing and data analysis software. J. Chem. Inf. Comput. Sci. 42, 1270. doi:10.1021/ci0255432
Einstein, A. (1905). Über die von der molekularkinetischen Theorie der Wärme geforderte Bewegung von in ruhenden Flüssigkeiten suspendierten Teilchen. Annalen Der Physik 4, 549. doi:10.1002/andp.19053220806
Fellinger, M. R., Hector Jr, L. G., and Trinkle, D. R. (2019). Impact of solutes on the lattice parameters and elastic stiffness coefficients of hcp Fe from first-principles calculations. Comput. Mater. Sci. 164, 116–126. doi:10.1016/j.commatsci.2019.03.056
Gnäupel-Herold, T., and Creuziger, A. (2011). Diffraction study of the retained austenite content in TRIP steels. Mater. Sci. Eng. A 528, 3594–3600. doi:10.1016/j.msea.2011.01.030
Hammersley, A. (2020). The FIT2D home page. Available at: http://www.esrf.eu/computing/scientific/FIT2D/ (Accessed December 15, 2020).
Hu, X., Choi, K. S., Sun, X., Ren, Y., and Wang, Y. (2016). Determining individual phase flow properties in a quench and partitioning steel with in situ high-energy X-ray diffraction and multiphase elasto-plastic self-consistent method. Metall. Mat Trans. A. 47, 5733–5749. doi:10.1007/s11661-016-3373-2
Hu, X. H., Sun, X., Hector, L. G., and Ren, Y. (2017). Individual phase constitutive properties of a TRIP-assisted QP980 steel from a combined synchrotron X-ray diffraction and crystal plasticity approach. Acta Materialia 132, 230–244. doi:10.1016/j.actamat.2017.04.028
Kim, C. (1979). X-ray method of measuring retained austenite in heat treated white cast irons. J. Heat Treating 1, 43–51. doi:10.1007/bf02833237
Linkam (2020). TS1500 FEATURES: Temperature and environmental control from ambient to 1500°C. https://www.linkam.co.uk/ts1500 (Accessed December 15, 2020).
Michalik, Š., Ďurišin, J., Balga, D., Saksl, K., Ďurišin, M., and Drakopoulos, M. (2016). In situ HEXRD study of a Ca61Al39 metallic glass. J. Alloys Compounds 687, 188–196. doi:10.1016/j.jallcom.2016.06.094
Mueller, J., Hu, X., Sun, X., Ren, Y., Choi, K. S., Barker, E., et al. (2021). Austenite formation and cementite dissolution during intercritical annealing of a medium-manganese steel from a martensitic condition. Mater. Des. 203, 109598. doi:10.1016/j.matdes.2021.109598
Onink, M., Brakman, C. M., Tichelaar, F. D., Mittemeijer, E. J., van der Zwaag, S., Root, J. H., et al. (1993). The lattice parameters of austenite and ferrite in Fe‐C alloys as functions of carbon concentration and temperature. Scripta Metallurgica Et Materialia 29, 1011–1016. doi:10.1016/0956-716x(93)90169-s
Speer, J., Matlock, D. K., De Cooman, B. C., and Schroth, J. G. (2003). Carbon partitioning into austenite after martensite transformation. Acta Materialia 51, 2611–2622. doi:10.1016/s1359-6454(03)00059-4
Taub, A. I., and Luo, A. A. (2015). Advanced lightweight materials and manufacturing processes for automotive applications. MRS Bull. 40, 1045–1054. doi:10.1557/mrs.2015.268
ThermoCalc (2020). ThermoCalc software. Available at: https://www.thermocalc.com/ (Accessed December 15, 2020).
Keywords: in situ HEXRD, phase transformation, lattice constant, austenite stability, medium Mn steels
Citation: Hu X, Mueller JJ, Sun X, De Moor E, Speer JG, Matlock DK and Ren Y (2021) The In Situ Observation of Phase Transformations During Intercritical Annealing of a Medium Manganese Advanced High Strength Steel by High Energy X-Ray Diffraction. Front. Mater. 8:621784. doi: 10.3389/fmats.2021.621784
Received: 27 October 2020; Accepted: 25 January 2021;
Published: 25 March 2021.
Edited by:
Antonio Caggiano, Darmstadt University of Technology, GermanyReviewed by:
Yandong Wang, University of Science and Technology Beijing, ChinaZhigang Yang, Tsinghua University, China
Copyright © 2021 Hu, Mueller, Sun, De Moor, Speer, Matlock and Ren. This is an open-access article distributed under the terms of the Creative Commons Attribution License (CC BY). The use, distribution or reproduction in other forums is permitted, provided the original author(s) and the copyright owner(s) are credited and that the original publication in this journal is cited, in accordance with accepted academic practice. No use, distribution or reproduction is permitted which does not comply with these terms.
*Correspondence: Xiaohua Hu, hux3@oml.gov; Xin Sun, sunx1@ornl.gov