Bitter-RF: A random forest machine model for recognizing bitter peptides
 Yu-Fei Zhang1†
  Yu-Hao Wang1†
  Zhi-Feng Gu1
  Xian-Run Pan2
  Jian Li3
  Hui Ding1*
  Yang Zhang2*
  Ke-Jun Deng1*
- 1School of Life Science and Technology, Center for Informational Biology, University of Electronic Science and Technology of China, Chengdu, China
- 2Innovative Institute of Chinese Medicine and Pharmacy, Academy for Interdiscipline, Chengdu University of Traditional Chinese Medicine, Chengdu, China
- 3School of Basic Medical Sciences, Chengdu University, Chengdu, China
Introduction: Bitter peptides are short peptides with potential medical applications. The huge potential behind its bitter taste remains to be tapped. To better explore the value of bitter peptides in practice, we need a more effective classification method for identifying bitter peptides.
Methods: In this study, we developed a Random forest (RF)-based model, called Bitter-RF, using sequence information of the bitter peptide. Bitter-RF covers more comprehensive and extensive information by integrating 10 features extracted from the bitter peptides and achieves better results than the latest generation model on independent validation set.
Results: The proposed model can improve the accurate classification of bitter peptides (AUROC = 0.98 on independent set test) and enrich the practical application of RF method in protein classification tasks which has not been used to build a prediction model for bitter peptides.
Discussion: We hope the Bitter-RF could provide more conveniences to scholars for bitter peptide research.
1. Introduction
The bitter peptides, often produced in fermented, aged, and spoiled foods, are oligopeptides with diverse structures. Studies have shown that hydrophobic amino acids and their positions are crucial determinants for bitter peptides to exhibit bitter taste (1, 2). Experiments have found that many toxins are bitter taste, so most mammals, including humans, avoid the intake of toxins by avoiding bitter substances (3). However, some bitter substances may have medicinal effects. In biomedical and clinical sciences, hormetic responses were of considerable importance. Many drugs displayed hormetic-like biphasic dose responses and showed opposite effects at low and high doses (4). In diabetic patients, the peptides in Momordica charantia (M. charantia) can significantly regulate blood glucose concentration. A 68-residue insulin receptor binding protein was isolated from M. charantia. MclRBP-19 in this protein can span the 50th-68th residues, enhance the binding of insulin and IR, stimulate the phosphorylation of PDK1 and Akt, and induce the expression of glucose transporter 4, thus promoting glucose clearance (5). And frequent consumption of M. charantia peptide is beneficial to multiple organs of human body (6). The active compound polypeptide K extracted from the seeds of M. charantia has gastroprotective effects in some gastric ulcer models (7). Hence, bitter peptides, previously avoided due to their potential toxicity, can be beneficial at the correct dosage. Consequently, the bitter peptides may be very useful in medicine, making their identification extremely important (8).
Experimental methods for identifying bitter peptides have a solid theoretical basis, but the operation is complex, time-consuming, and inaccurate. Biological methods often involve the extraction of bitter peptides from raw materials through gel separation, multiple rounds of liquid chromatography separation, and purification. Finally, Fourier transforms infrared spectroscopy (FTIR) was used to identify bitter peptides. Generally, spectroscopic-based methods have requirements for instruments, which are not universal (9, 10). Therefore, the bitterness evaluation stage requires the participation of human subjects, which may lead to inaccurate results (11, 12). Bioinformatics-based methods for predicting bitter peptides have the advantages of no professional instrument requirements, short time consumption, and high prediction accuracy. Therefore, it is imperative to develop a machine learning model for predicting bitter peptides.
At present, computational methods have been carried out to study peptides (13, 14). Models based on the quantitative structure of bitter taste relationship (QSBR), including multiple linear regression, the support vector machine (SVM), and artificial neural network (ANN), have been used to predict bitter peptides (2, 15–21). Specifically, based on 229 experimental bitterness values determined by human sensory evaluations, Dragon 5.4 software was designed to predict bitter peptides by extracting 1292 descriptors and reducing descriptors to 244 using a home-developed toolbox. Then, the GA-PLS method was used to select the six best-scoring descriptors for the QSAR model construction. The six descriptors, including SPAN, Mean square distance (MSD), E3s, G3p, Hats8U, and 3D-MoRSE, represent the dimension of the molecule, the numbers of atoms, weighted atomic electrical topological states, the 3rd-component symmetry directional WHIM index (weighed by polarizability), spatial autocorrelation-based descriptors and an indicator of size, mass, and volume of the molecules.
Further, to improve prediction accuracy, four generations of classification models based on bitter peptide sequences have been developed. The first-generation model used dipeptide propensity scores to predict bitter peptides by extracting a few characteristics of bitter peptides (22). The second-generation model utilized deep learning research methods. However, there may be problems with information redundancy and overfitting (23). The third-generation model integrated five peptide features to formulate bitter peptides, but the representativeness should be further optimized (24, 25). The fourth-generation model extracted feature extraction by deep learning pre-training, and then built a prediction model based on light gradient boosting machine (LGBM) (26).
Inspired by the previous four generations of models, we proposed Bitter-RF, a novel machine learning method for predicting bitter peptides. In total, ten kinds of feature information were extracted, consisting of 1,337 features in the feature set. By deleting all zero items, 1206 features were used for model learning. Here, we used five machine learning models to learn the features. After comparison, the RF method has the best classification effect. The schematic framework of Bitter-RF for bitter peptide prediction is shown in Figure 1.
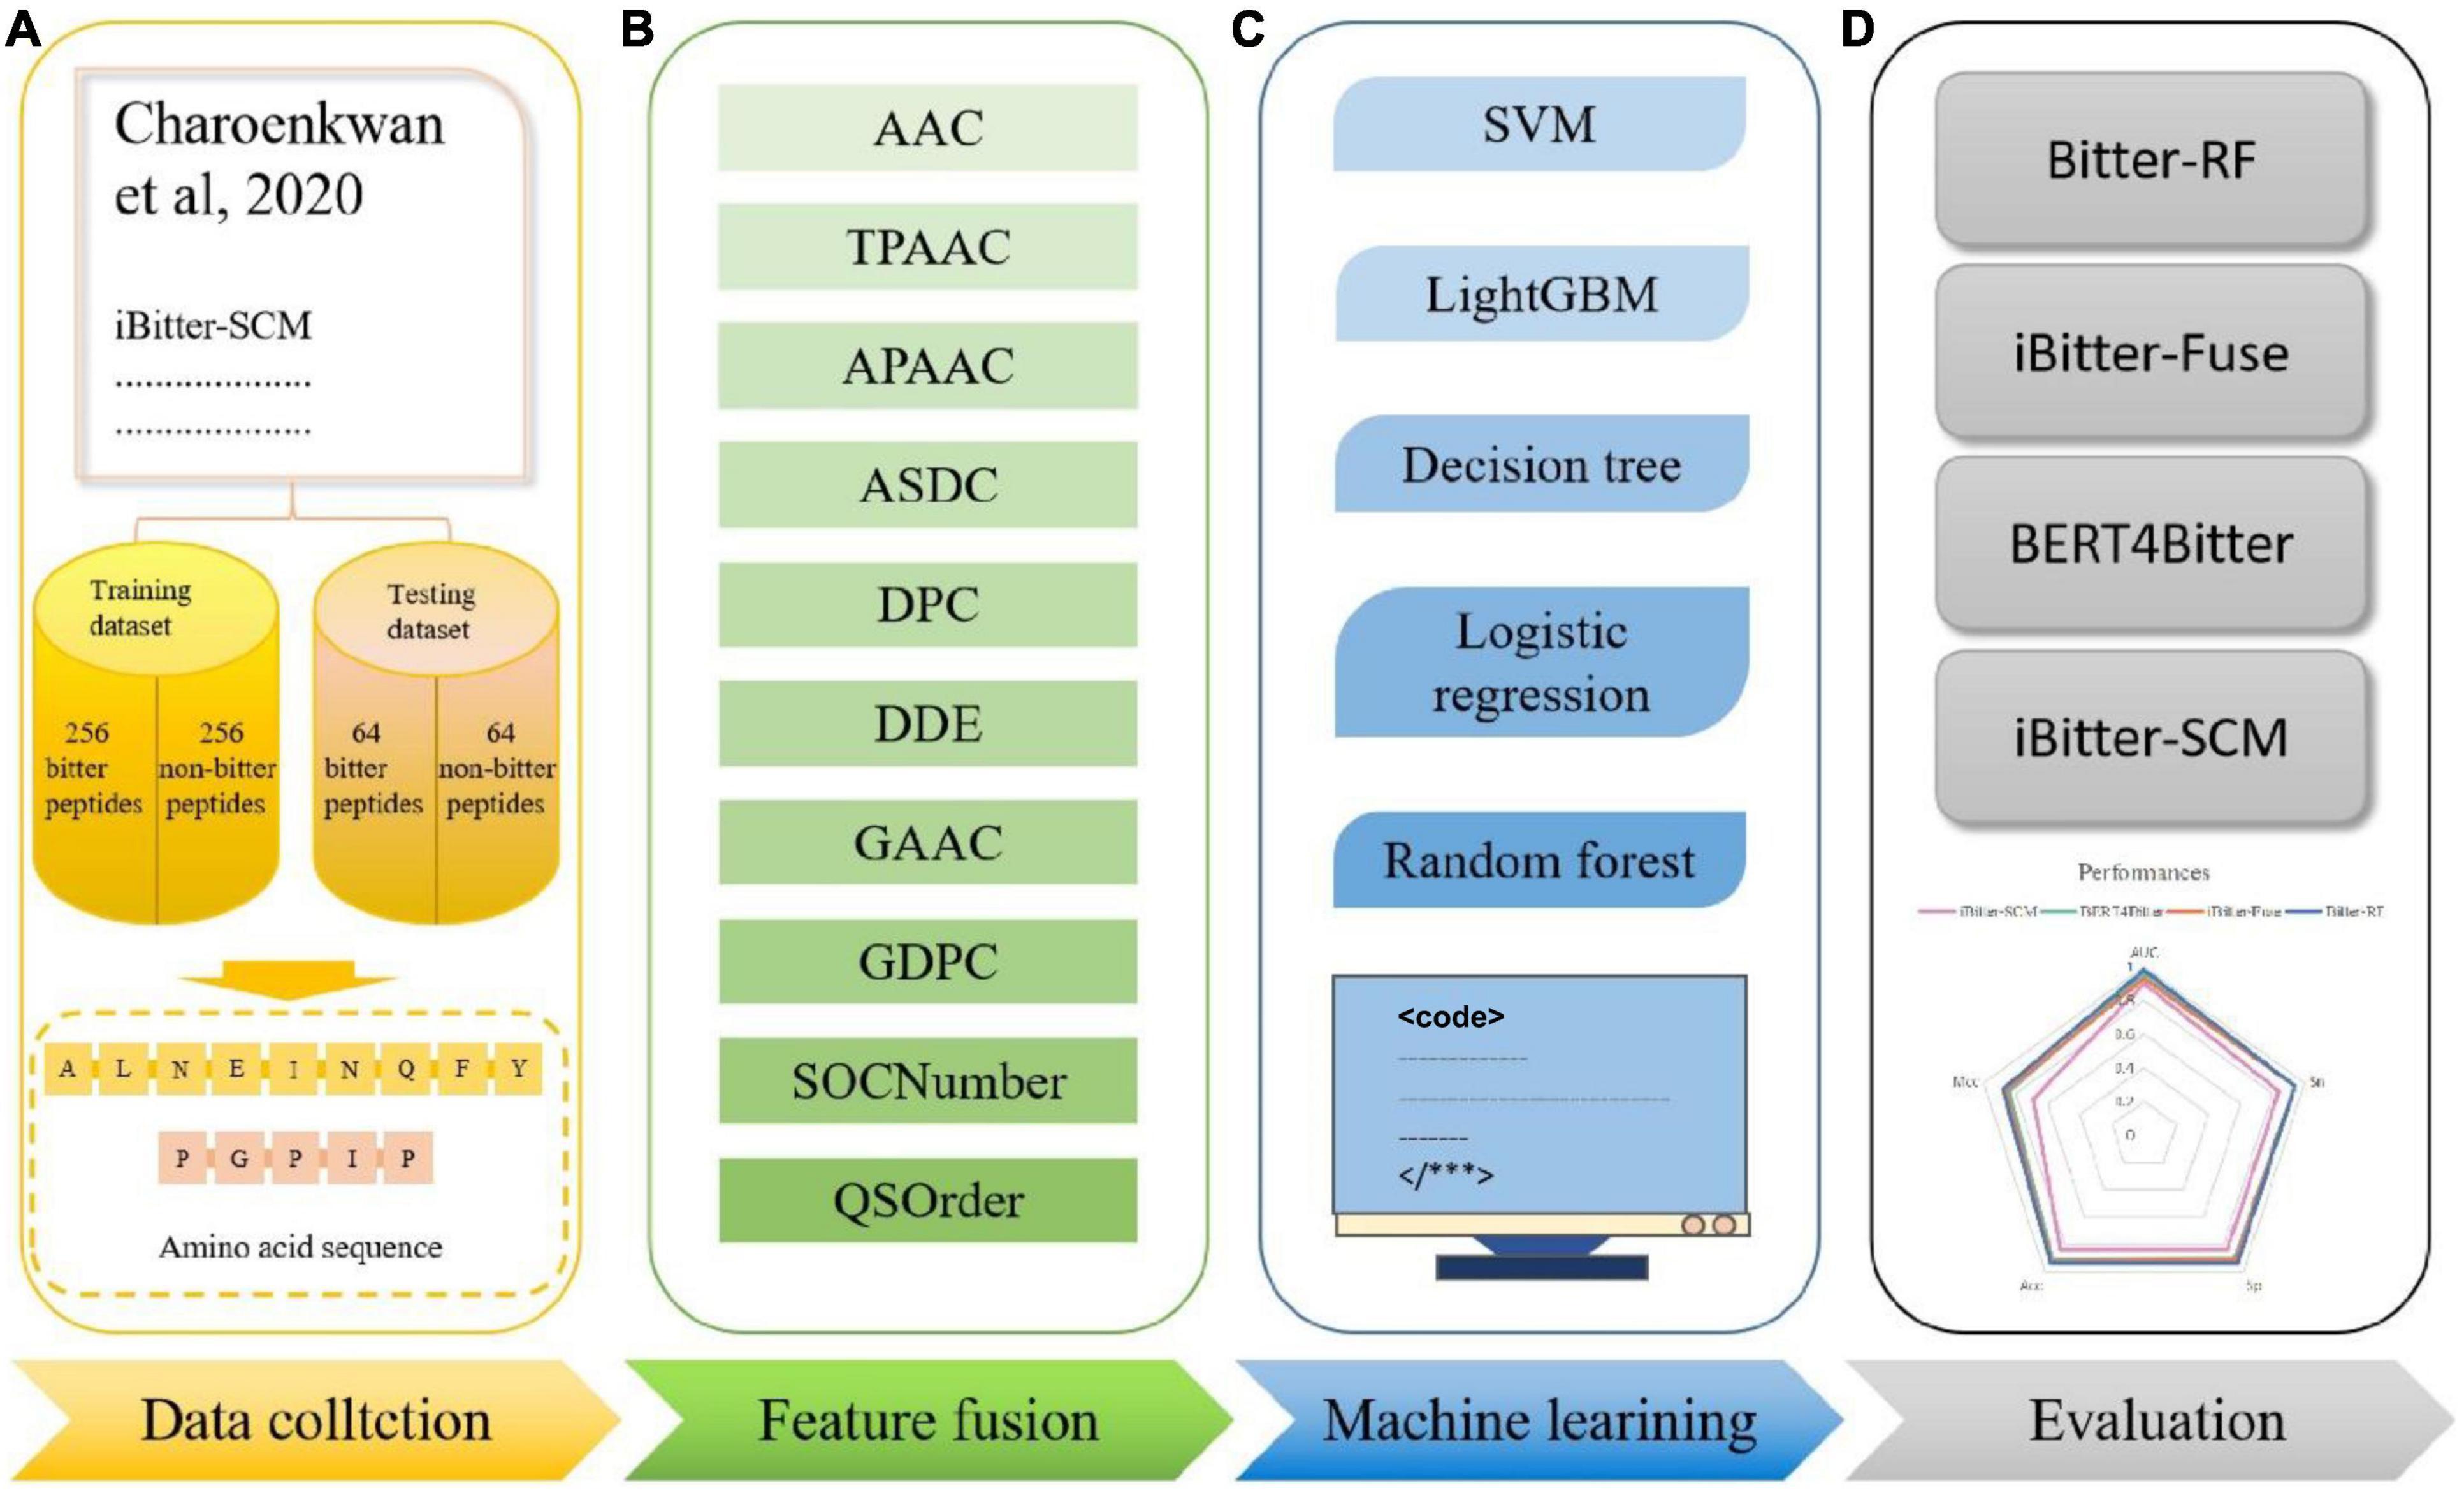
Figure 1. Schematic framework of the Bitter peptide prediction model (Bitter–RF). The main process of Bitter-RF design mainly includes the following steps: (A) dataset collection, (B) feature fusion, (C) modeling with multiple machine learning methods, (D) Bitter-RF performance evaluation.
2. Materials and methods
2.1. Dataset source
The fundamental for constructing a powerful model is to generate a high-quality benchmark dataset. To provide a reliable model and make a fair comparison, we used the same dataset as the previous four generation models (22–24), which can be obtained from http://pmlab.pythonanywhere.com/BERT4Bitter (accessed on 13 January 2022). This data was originally obtained by manually collecting experimentally validated bitter peptides from various literatures (22). The data contains 640 records, including 320 experimentally validated bitter peptides and 320 non-bitter peptides, which were randomly generated from BIOPEP. In order to objectively evaluate the model, we divided the data into training set and independent set at a ratio of 8:2. The training set contains 256 bitter peptides and 256 non-bitter peptides. The independent set contains 64 bitter peptides and 64 non-bitter peptides.
2.2. Feature extraction
In a computational model based on machine learning methods for biological sequence data, the coding methods of sequences, which can reveal as much sequence information as possible, are the most critical step (27–36). In the field of sequence analysis, scholars have done a lot of works, and various of sequence descriptors were proposed. Here, we used iLearnPlus to extract 10 types of features of bitter peptides (37). The specific information was described as follows.
2.2.1. Amino acid composition (AAC)
The AAC encoding calculates the frequencies of 20 natural amino acids in a peptide sequence (38–42). The equation was shown as follows.
where N(t) means the number of amino acid type t, and N means the length of peptides.
2.2.2. Traditional pseudo-amino acid composition (TPAAC)
The TPAAC descriptor is proposed by Chou, which is also called the type1 pseudo-amino acid composition (43). Here, we use, , and M0(i) (i = 1, 2, 3,, 20) to respectively represent the original hydrophobicity values (44), original hydrophilicity values (45) and original side chain masses of 20 natural amino acids. We normalized these values based on the standard normal distribution, as follows.
Then, the correlation function for residues Ri and Rj can be defined as:
The correlation function contains the three amino acid properties mentioned above. By generalizing this function definition, an amino acid property (Eq. 6) and a set of amino acid properties (Eq.7) are defined.
where H (Ri) is the amino acid property of amino acid Ri after standardization and Hk (Ri) is the k-th attribute in the amino acid attribute set of amino acid Ri. And sequence order-correlated factors were defined as:
…
where λ is a correlation parameter that can be adjusted, and λ should be less than N, we set λ = 1. And traditional pseudo-amino acid composition for a protein sequence can be defines as:
where ω is the weigthing factor and is set to 0.05 in this study.
2.2.3. Amphiphilic pseudo-amino acid composition (APAAC)
The APAAC is a kind of PseAAC. It contains 20+2λ discrete numbers: the first 20 numbers consist of conventional amino acids; the next 2λ numbers are a set of correlation factors that reflect different distribution patterns of hydrophobicity and hydrophilicity along the peptide chain (46). This feature was described as follows.
Firstly, using H1(i)(Eq.2) and H2(i)(Eq.3) which are defined in TPAAC to define hydrophobicity and hydrophilicity correlation functions:
Secondly, sequence order factors can be formulated as:
…
Finally, the APAAC is defined as:
where w is the weighting factor, and it is set to 0.5 in this study. This value refers to Chou’s work on protein cell property prediction using this feature (43). And we set λ 1 in this study.
2.2.4. Adaptive skip dinucleotide composition (ASDC)
ASDC is a modified dipeptide composition, which takes full account of the relevant information that exists between adjacent residues and between intervening residues. The feature vector for ASDC was defined as:
where fvi means the occurrence frequency of all possible dipeptide with ≤ L-1 intervening peptides.
2.2.5. Di-peptide composition (DPC)
The DPC encoding describes the frequencies of 400 dipeptide combination in peptide sequence (47). The calculation method was shown as follows.
where Nrs means the number of dipeptides combined by amino acid types r and amino acid types s and N is the length of peptide.
2.2.6. Dipeptide deviation from expected mean (DDE)
DDE includes three parameters: dipeptides composition (Dc), theoretical mean (Tm), and theoretical variance (Tv). Dc is the same as DPC’s calculation method.Tm and Tv were calculated as follows:
where Cr means the number of codons for the amino acid types r, and Cs means the number of codons for the amino acid types s. CN includes total possible codons, which means not including the three stop codons.
Using three parameters, DDE was calculated as follows:
2.2.7. Grouped amino acid composition (GAAC)
GAAC divides 20 amino acids into five groups based on their physicochemical properties that are the aliphatic group (g1: GAVLMI), aromatic group (g2: FYW), positive charge group (g3: KRH), negative charged group (g4: DE) and uncharged group (g5: STCPNQ). This feature describes the frequencies of these five groups of amino acids and can be calculated as follows:
where N(g) is the sum of the number of the amino acid which belongs to group g, and N is the length of peptide sequence.
2.2.8. Grouped dipeptide composition (GDPC)
GDPC is a variant of DPC based on the amino acid classification already mentioned in GAAC. The feature consists of 25 descriptors, calculated as follows:
where Nrs is the number of dipeptides represented by amino acid type groups r and s, and N is the length of peptide sequence.
2.2.9. Sequence-order-coupling number (SOCNumber)
The d-th rank sequence-order-coupling number was calculated as follows:
where di,i+d describes the distance between two amino acids at positions i and i + d in a given distance matrix, nlag denotes the maximum value of the lag (default value: 30) and N is the length of the peptide sequence. The distance matrix used here from both Schneider–Wrede physicochemical distance matrix (48) and Grantham chemical distance matrix (49).
2.2.10. Quasi-sequence-order (QSOrder)
For each amino acid, defined QSOrder as follows:
where fr represent the normalized occurrence of amino acid which is r typed, and the weighting factor w is defined as 0.1, and nlag denotes the maximum value of the lag (default value: 30). τd is the same as the definition in SOCNumber.
For other 30 quasi-sequence-order descriptors, defined QSOrder as follows:
2.3. Random forest
RF algorithm is an ensemble of decision trees and has been widely used for classification. Each tree depends on the value of a random vector that is sampled independently and has the same distribution for all trees in the forest. The introduction of randomness can reduce the possibility of overfitting, improve the ability to resist noise, and has strong adaptability to high-dimensional data.
RF algorithm has been applied to a variety of protein classification problems (50–54).
2.4. Model evaluation metrics
To evaluate the training effect and prediction ability of the model, we mainly used the Area Under the Receiver Operating Characteristic curve value (AUROC), supplemented by Sensitivity (Sn), Specificity (Sp), Matthew’s correlation coefficient (MCC), accuracy (ACC) (55–72). These indexes can be formulated as follows:
where TP and FN represent the number that the bitter peptides are predicted as true bitter peptides and non-bitter peptides, respectively. On the contrary, TN and FP represent the number that the non-bitter peptides are predicted as true non-bitter peptides and bitter peptides, respectively. That is to say, bitter peptides were defined as positive samples, and non-bitter peptides were defined as negative samples in this work.
Sn is the model’s sensitivity, representing the proportion of correctly predicted positive samples to the total number of actual positive samples (73–76). Sp is the model’s specificity, representing the proportion of correctly predicted negative samples to the total number of actual negative samples (77, 78). Here ACC, MCC and AUROC are all comprehensive indicators. ACC represents the proportion of correct predicted samples to the total samples. And MCC is the correlation coefficient between the description classification and the predicted classification. Its range is [-1, 1]. If the value is 1, it means the model prediction performance is perfect. If the value is -1, it means the prediction is completely opposite to the actual. The AUROC indicator can be used as a standard for evaluating the quality of the binary classification model (79–82). The closer the value of AUROC is to 1, the better the classification effect.
3. Results and discussion
3.1. Single-feature-based results
Here, we used iLearnPlus to extract the above 10 features (AAC, TPAAC, APAAC, ASDC, DPC, DDE, GAAC, GDPC, SOCNumber, QSOrder) and then utilized them to train a RF-based predictive model for accurately identifying Bitter peptides (37). Table 1 shows the results of 10-fold cross-validation and independent set.
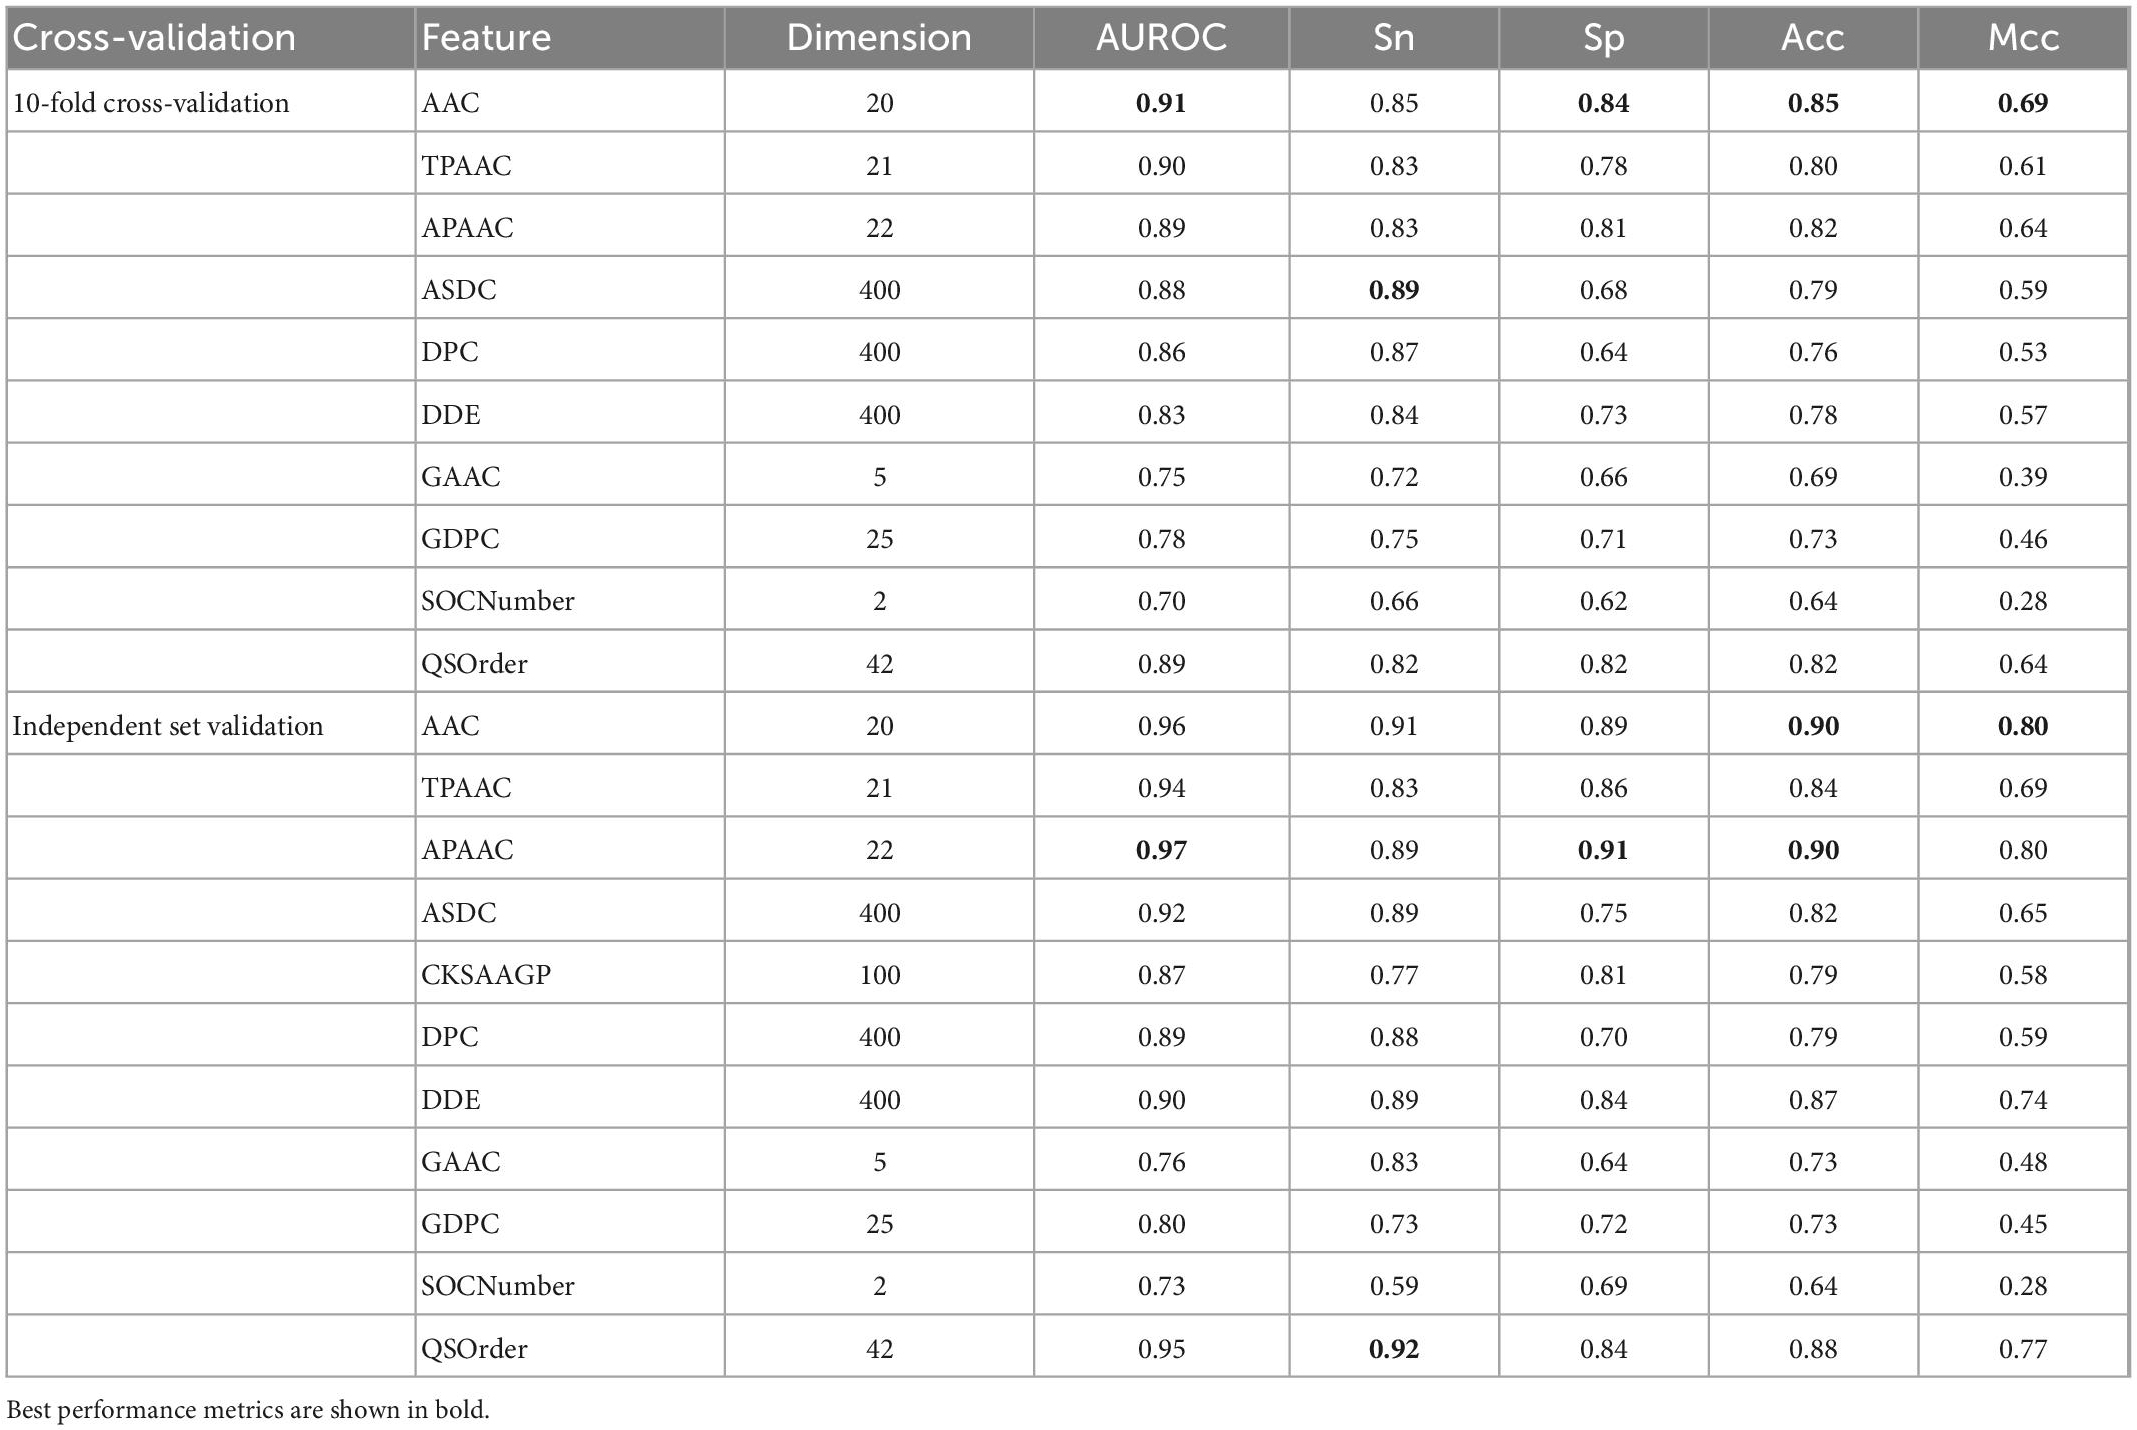
Table 1. Results of RF-based models using 10 single features.
As can be seen, AAC is the best among all single features, with AUROC of 0.91 and 0.96 in 10-fold cross-validation and independent data test, while the worst was SOCNumber, with AUROC of 0.70 and 0.73. This result should show that SOCNumber has only two dimensions, so this feature cannot afford enough information. Thus, this feature may be used to fuse other features to supplement additional information.
Amino acid composition is only a basic feature and does not burden physicochemical properties. Therefore, we think that there is still a large space for optimization. Previous studies have shown the relationship between bitter peptides and factors such as amino acid hydrophobicity and amino acid position. Some single features with poor performance have rich information that AAC does not have and can improve prediction performance. Therefore, we will study how to optimize the parameters of characteristics in following section.
3.2. Fusion feature processing
By fusing the 10 features mentioned above, we will get a 1,337-dimensional fusion feature. In this step, we de-zero the fusion feature. When a column contains only zero, it has no practical effect on the discrimination and is removed. After deleting all zero columns, 1206 features remain, as shown in detail in Table 2.
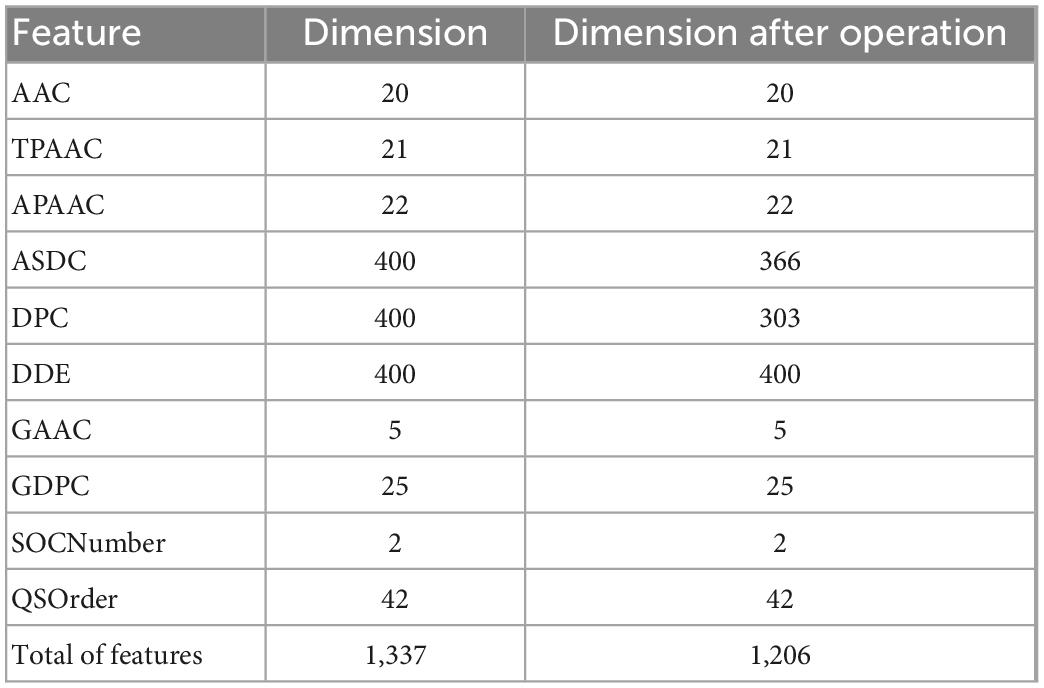
Table 2. Features after feature reduction operation.
3.3. Fusion-feature–based results
In this study, we compared the prediction effect of the fusion features and the three features with the highest independent set validation AUROC value among the above 10 single features. It has been proved that using the RF method to deal with fused features does have more advantages in terms of predictive ability. Table 3 and Figure 2 show the results of 10-fold cross-validation and independent set validation.
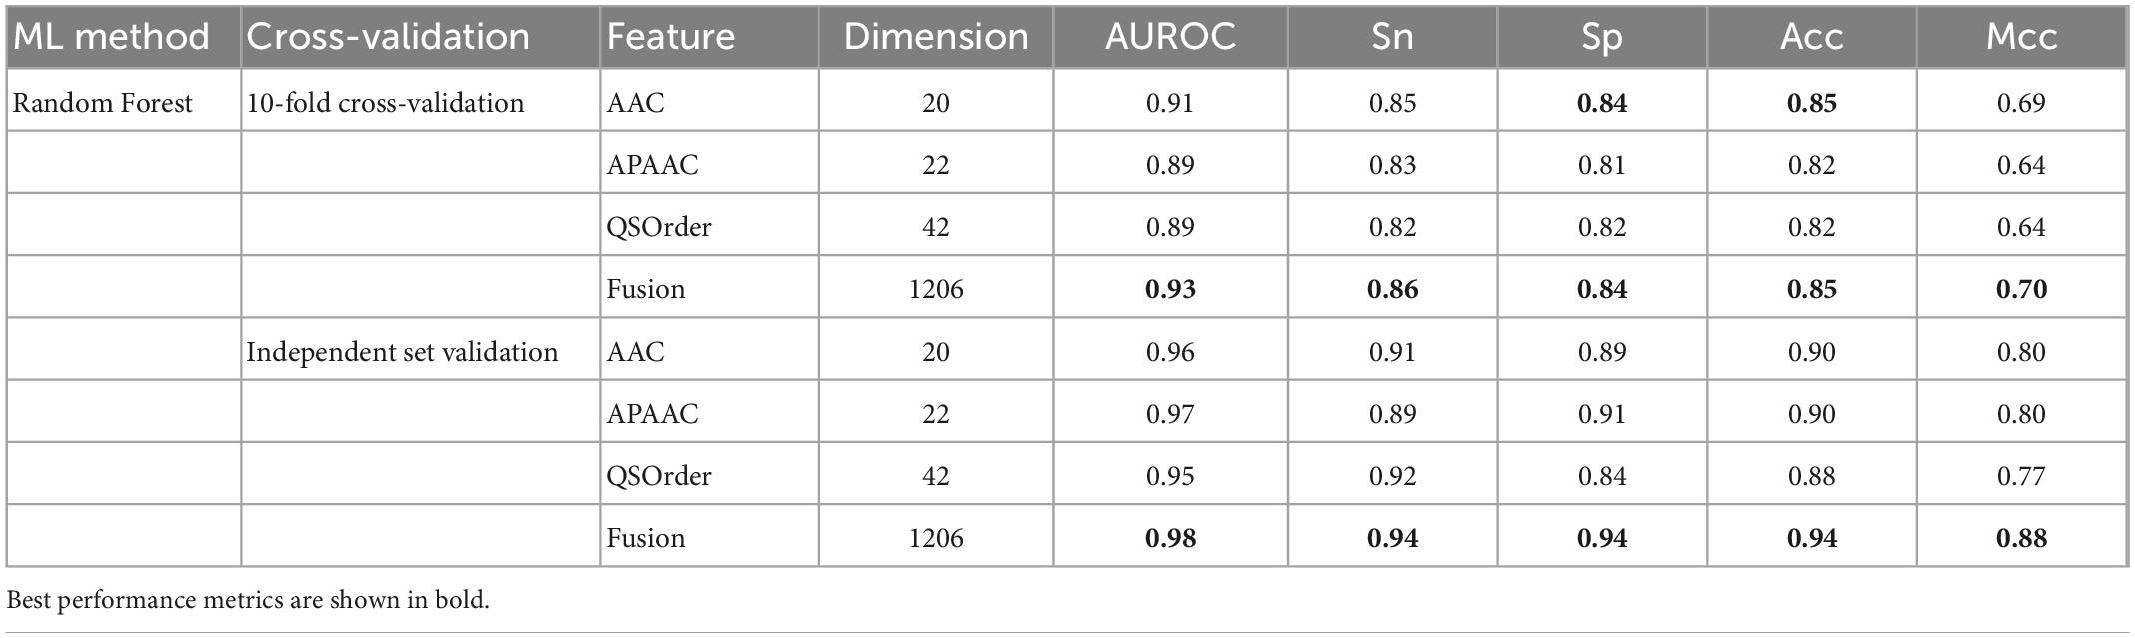
Table 3. Comparison between single-features and fusion feature using RF algorithm.
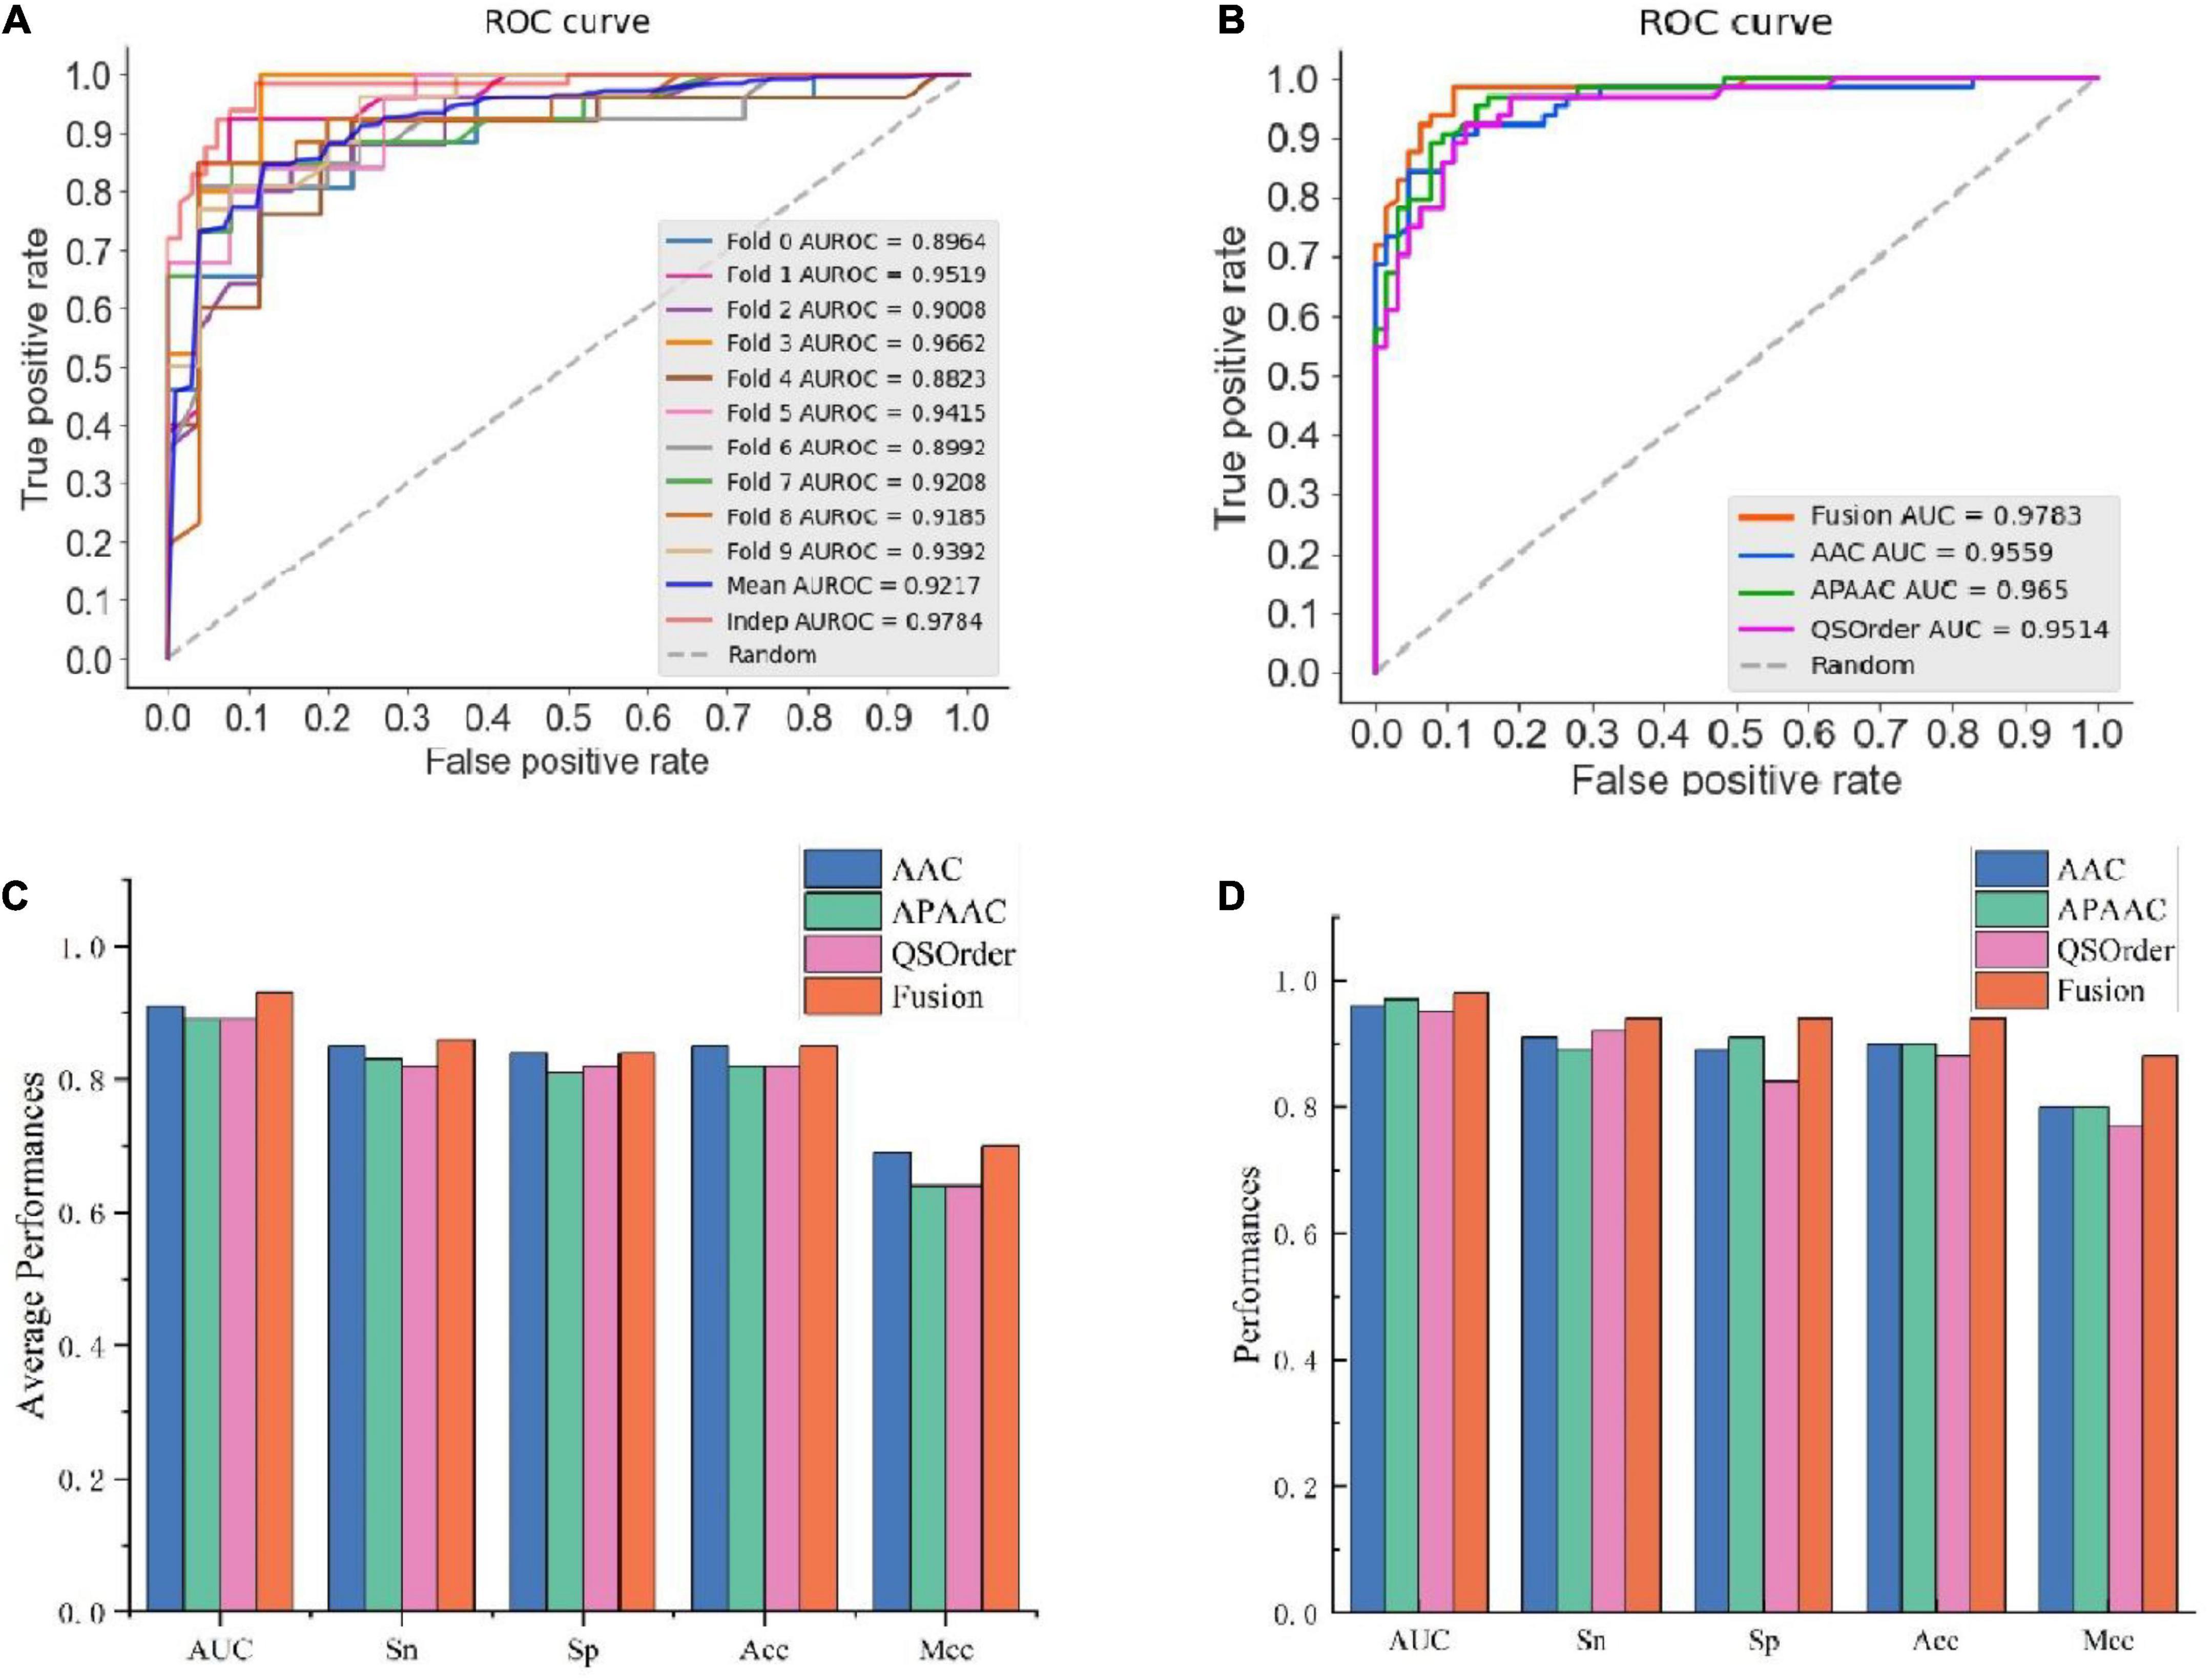
Figure 2. The prediction results using different features. (A) AUROC curves of fused features using RF; (B) AUROC curves of fusion features and three single-feature on independent data; (C) detailed results on training data using 10-fold cross-validation; (D) independent data validated results.
It could be seen that, in 10-fold cross-validation and independent set validation, the prediction performance of fusion features was improved or remained unchanged compared with single feature prediction. That is to say, the fusion features have better predictive ability.
3.4. Comparison with other machine learning methods on fusion features
To further validate the prediction model of the RF method for bitter peptides, we compared it with some traditional machine learning methods. Here, Support Vector Machines (SVM), LightGBM, Decision Trees (DT), and Logistic Regression (LR) were selected to build models for comparison. The prediction results of each machine learning method are shown in Table 4 and Figure 3. It can be seen that the RF method is superior to or equal to other machine learning methods in various indicators, and has good learning effect and prediction ability. Therefore, according to the data characteristics provided by us, the RF method shows the best predictive ability.
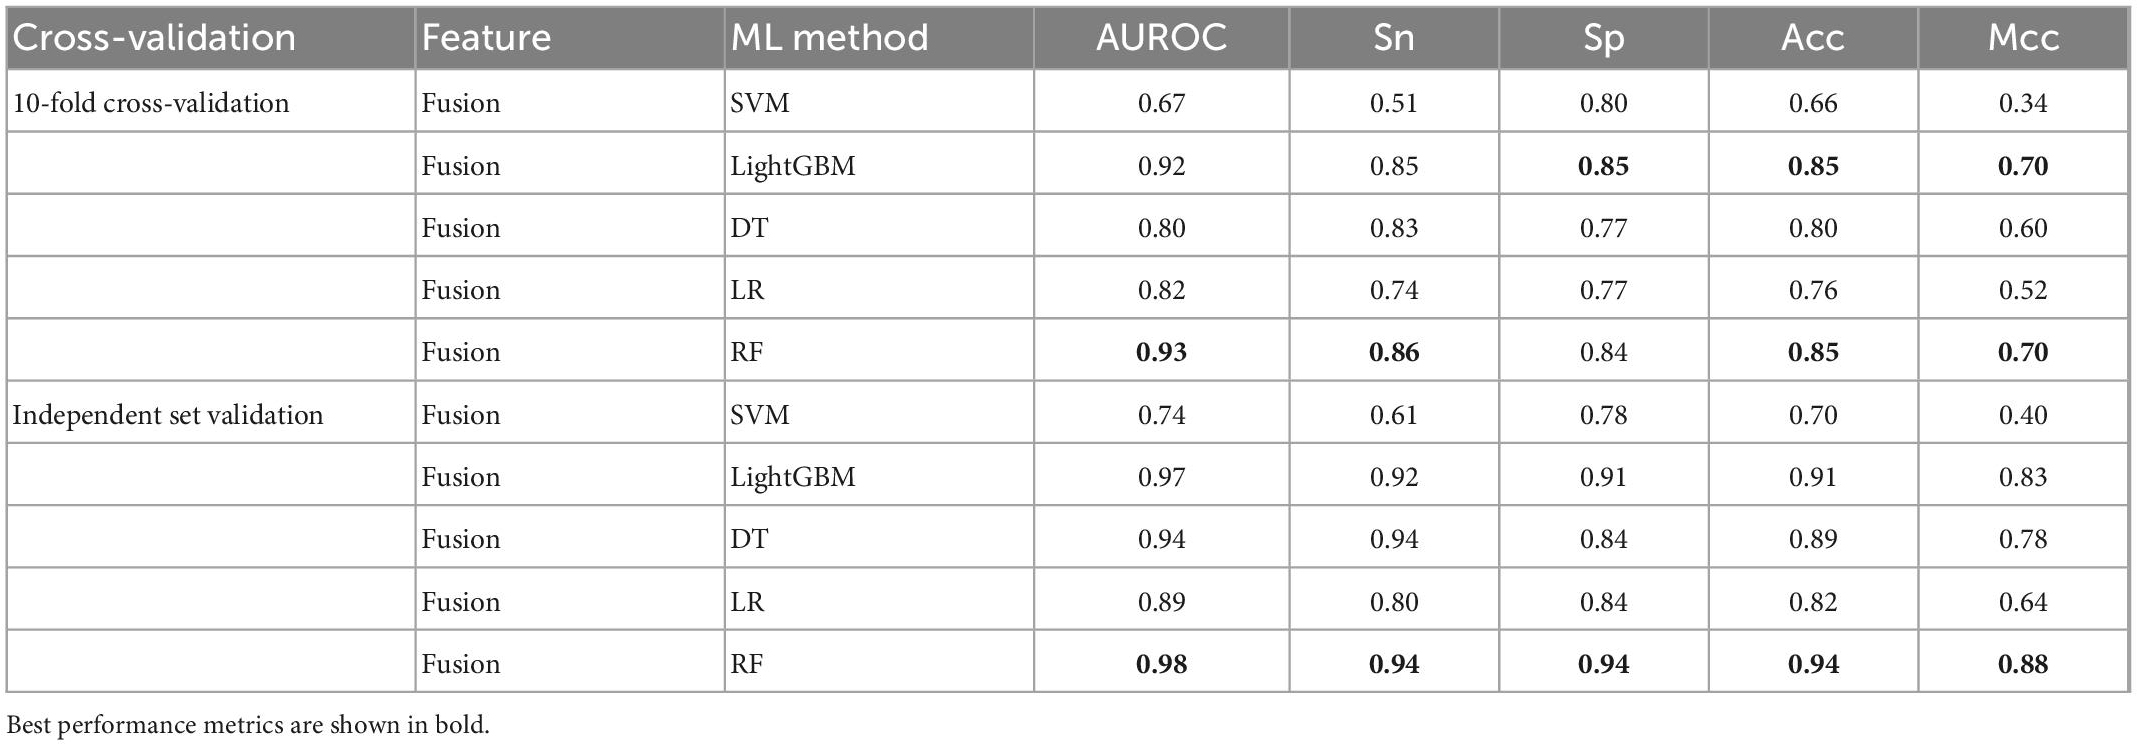
Table 4. Comparison of multiple machine learning methods using fusion features.
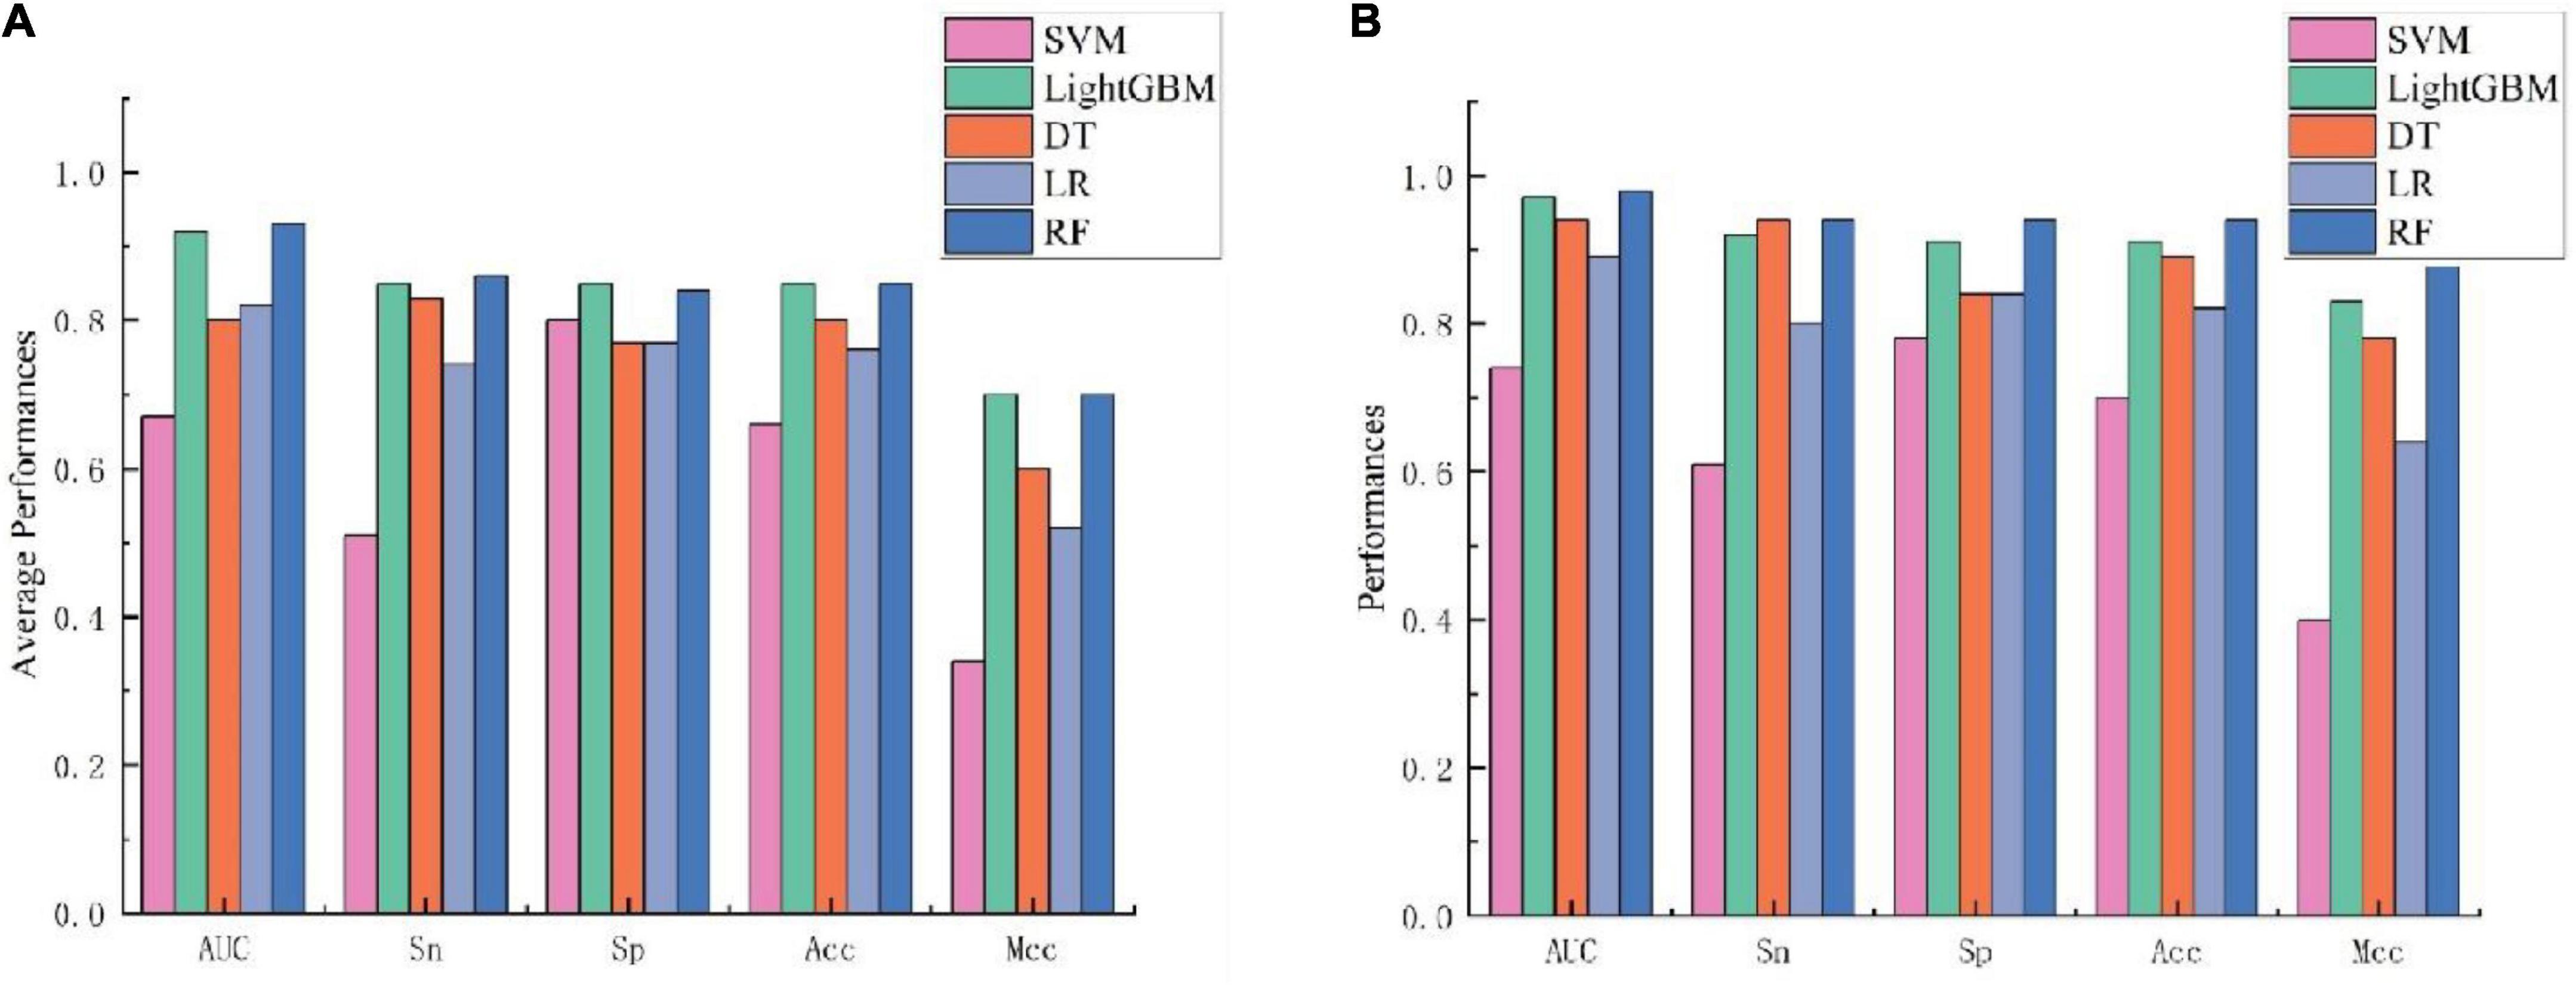
Figure 3. Performance evaluation of different machine learning models using (A) 10-fold cross-validation and (B) independent testing.
3.5. Comparison with existed models
To evaluate the predictive ability of Bitter-RF, we compared it with the existing four sequence-based models. The first model is iBitter-SCM which was constructed based on the dipeptide propensity score, the second model is BERT4Bitter using deep learning method, the third model is iBitter-Fuse by combining fuses features with SVM, and the fourth model was iBitter-DRLF by selecting features through deep learning (22–24, 26). Here, Bitter-RF model used the same bitter peptide and non-bitter peptide sequences as the previous four models. We further extended the types of extracted features on the basis of the third model, and used the RF method for modeling. By referring to relevant literatures, we obtained the performance indicators of the four models. The comparison results have been shown in Table 5 and Figure 4.
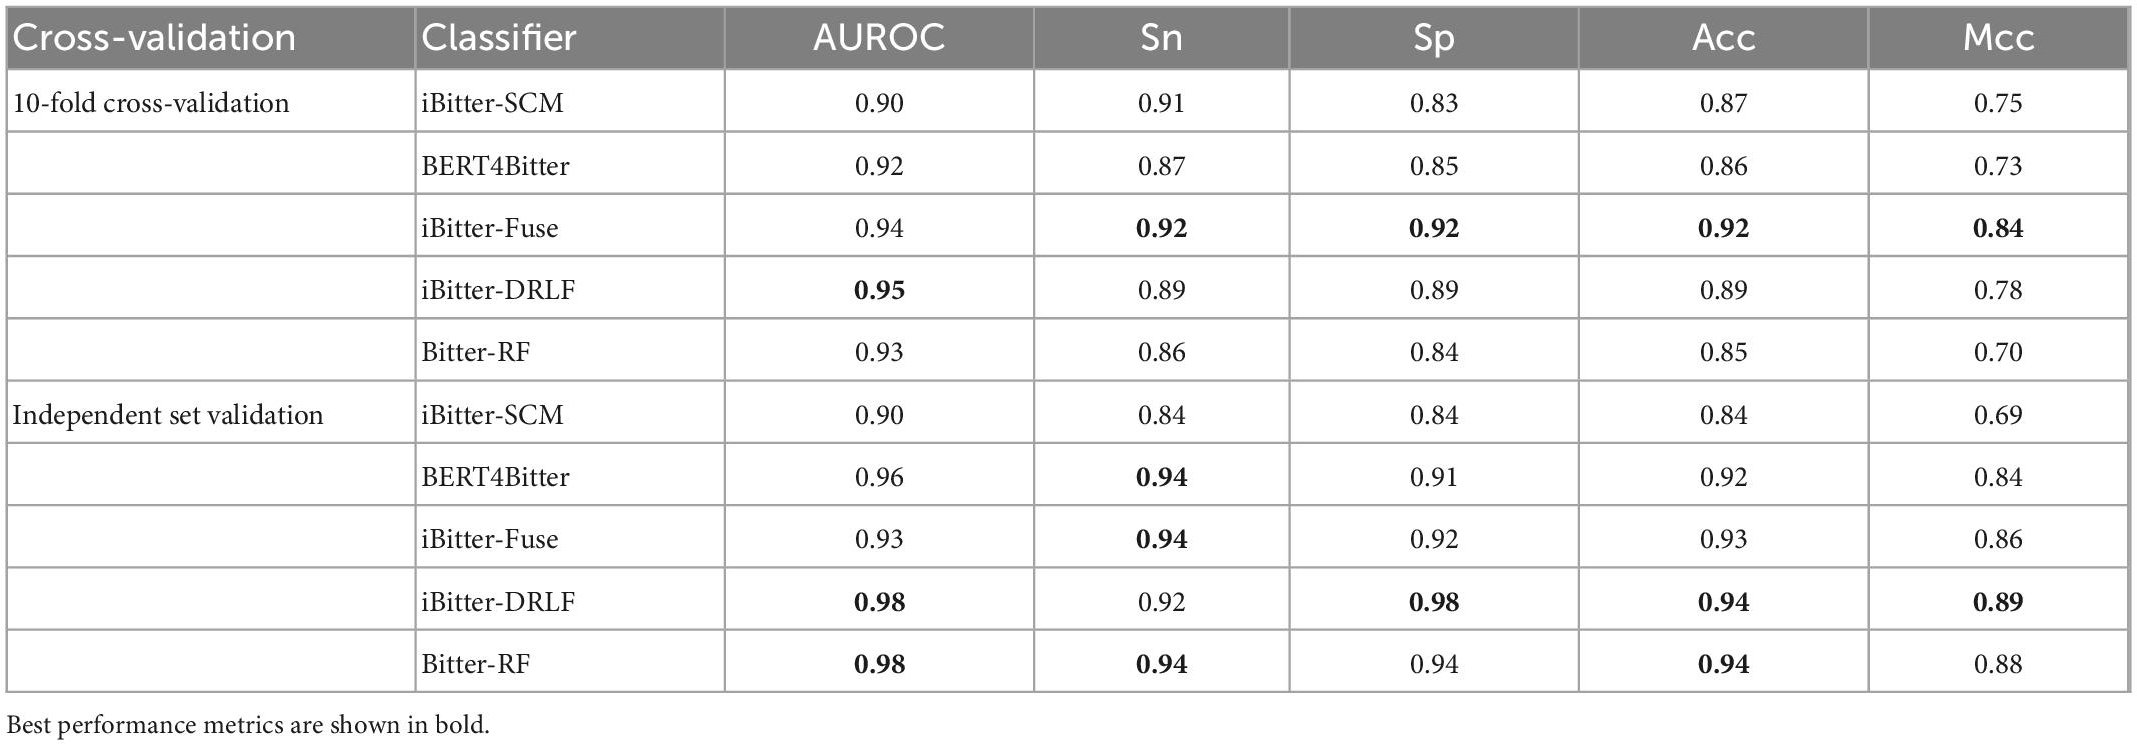
Table 5. Performance comparison of Bitter-RF with the existing methods.
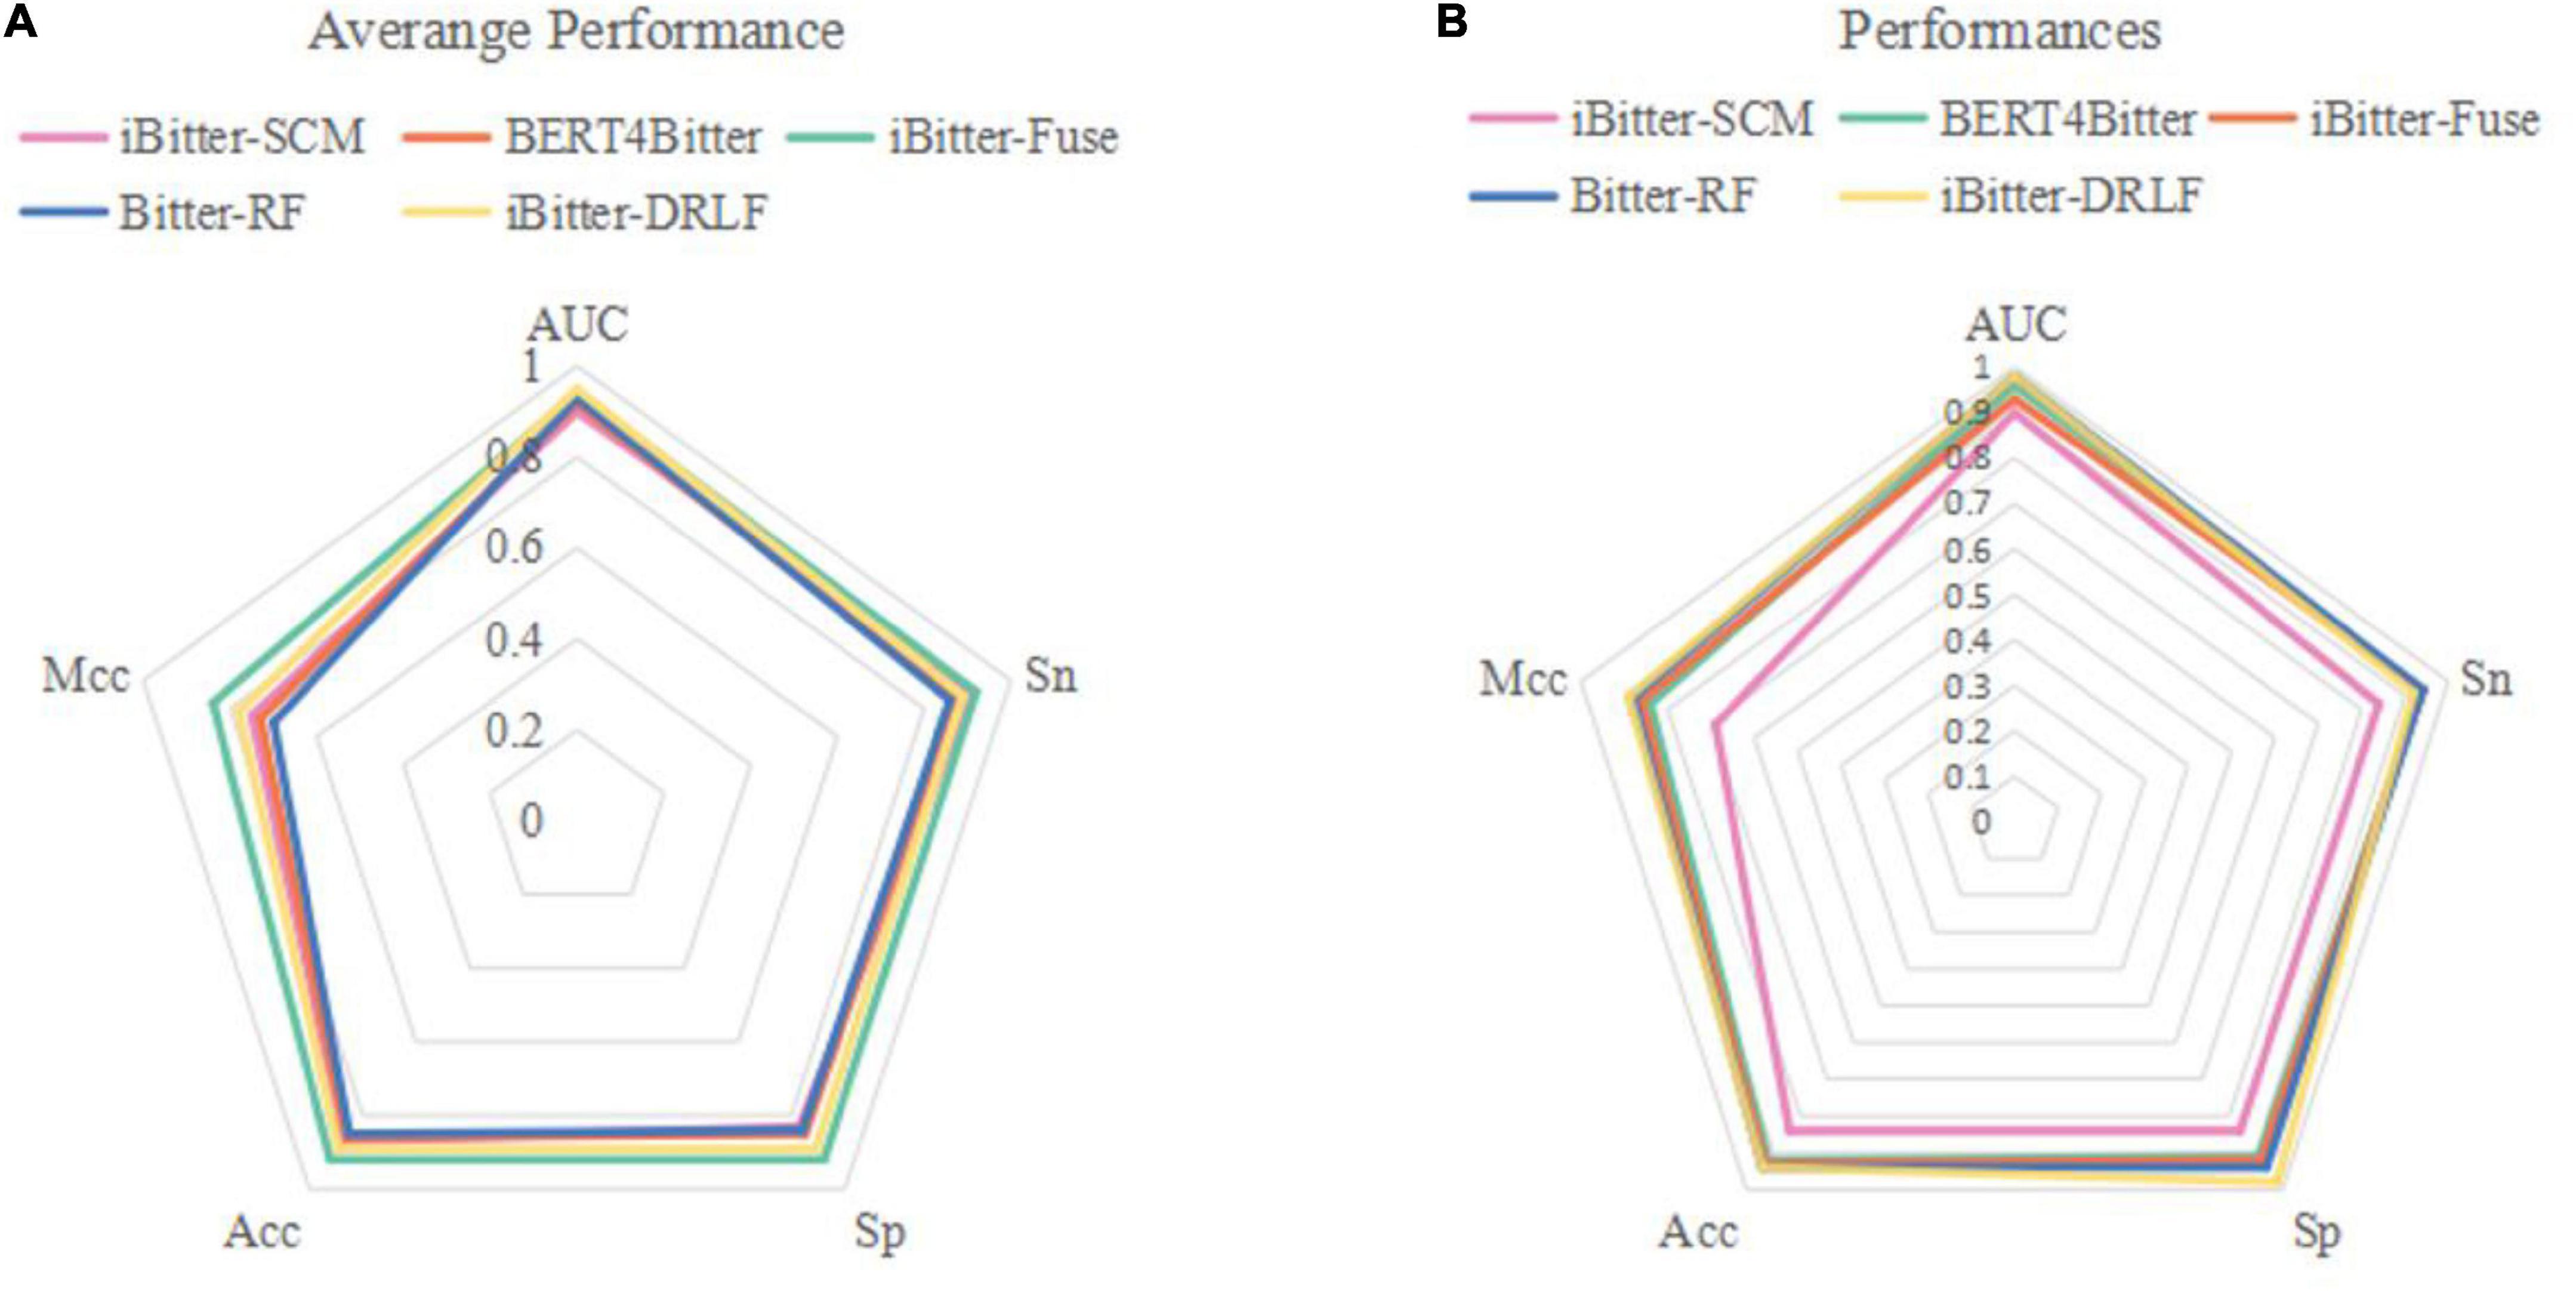
Figure 4. Radar plot for comparing Bitter-RF with other published models using (A) 10-fold cross-validation and (B) independent testing.
The performance comparison between Bitter-RF model and the four models showed that the results of Bitter-RF model in 10-fold cross-validation are similar to BERT4Bitter, and slightly lower than iBitter-Fuse. However, the results of Bitter-RF model on independent data are generally better than those of the first three models, and are comparable to those of the fourth model. Bitter-RF model has the same Sn index as the previous two generation models, which is superior to the first generation model. The indexes of Sp, ACC and MCC are better than those of the previous three generations. Furthermore, the AUROC of Bitter-RF model is 5% higher than that of iBitter-Fuse. Although the prediction performance of Bitter-RF is close to that of iBitter-DRLF, we used a traditional machine learning method, which consumes less computing resources. To sum up, Bitter-RF model shows stronger prediction performance and better practical application ability.
To our knowledge, we could not find any alternative bitterness classification studies allowing us to assess the intrinsic robustness of the bitter/non-bitter classification and therefore it cannot be excluded that the model may be affected by the inherent bias of training/test set data.
4. Conclusion
Compared with other proteins, there is still much room for related research on bitter peptides, and it has shown potential medical benefits. To better study bitter peptides, we developed a novel model Bitter-RF for predicting bitter peptides, which uses information from multiple perspectives, including sequence internal information and physicochemical properties. By comparison, we concluded that fused features could produce better performance than single features, RF is more suitable for bitter peptide prediction, and Bitter-RF has more application advantages than the four published models. Our research further enriches the application of RF method in the field of protein classification. And Bitter-RF model’s better results also show that enrich physical and chemical properties, location information and other characteristics play an important role in the identification of bitter peptides, which can provide biologists with more directions for biological experiments to verify bitter peptides.
However, one may notice that the features were not optimized. In the future, we will use various of feature selection techniques (83–86) to pick out the best features for improving model’s performance.
Based on the proposed method, a free and easy-to-use python package has been built and accessible at GitHub: https://github.com/ZhangYufei01/Bitter-RF.git, which can help scholars to identify bitter peptides.
Data availability statement
The original contributions presented in this study are included in this article/supplementary material, further inquiries can be directed to the corresponding authors.
Author contributions
HD, YZ, and K-JD conceived and designed the study. Y-FZ and Y-HW conducted the experiments and implemented the algorithms. Z-FG, X-RP, and JL performed the analysis. Y-FZ, JL, HD, YZ, and K-JD wrote the manuscript. JL, HD, YZ, and K-JD reviewed and edited the manuscript. HD and K-JD supervised the study. All authors contributed to the article and approved the submitted version.
Funding
This work was supported by the National Nature Scientific Foundation of China (81872957 and 62202069) and Natural Science Foundation of Sichuan Province (2022NSFSC1610).
Conflict of interest
The authors declare that the research was conducted in the absence of any commercial or financial relationships that could be construed as a potential conflict of interest.
Publisher’s note
All claims expressed in this article are solely those of the authors and do not necessarily represent those of their affiliated organizations, or those of the publisher, the editors and the reviewers. Any product that may be evaluated in this article, or claim that may be made by its manufacturer, is not guaranteed or endorsed by the publisher.
References
1. Xu B, Chung H. Quantitative structure-activity relationship study of bitter di-, tri- and tetrapeptides using integrated descriptors. Molecules. (2019) 24:2846. doi: 10.3390/molecules24152846
2. Kim H, Li-Chan E. Quantitative structure-activity relationship study of bitter peptides. J Agric Food Chem. (2006) 54:10102–11. doi: 10.1021/jf062422j
3. Maehashi K, Huang L. Bitter peptides and bitter taste receptors. Cell Mol Life Sci. (2009) 66:1661–71. doi: 10.1007/s00018-009-8755-9
4. Calabrese E, Baldwin L. Toxicology rethinks its central belief. Nature. (2003) 421:691–2. doi: 10.1038/421691a
5. Lo H, Li C, Ho T, Hsiang C. Identification of the bioactive and consensus peptide motif from Momordica charantia insulin receptor-binding protein. Food Chem. (2016) 204:298–305. doi: 10.1016/j.foodchem.2016.02.135
6. Hsu P, Pan F, Hsieh C. mcIRBP-19 of bitter melon peptide effectively regulates diabetes mellitus (dm) patients’ blood sugar levels. Nutrients. (2020) 12:1252. doi: 10.3390/nu12051252
7. Abu Bakar N, Hakim Abdullah M, Lim V, Yong Y. Gastroprotective effect of polypeptide-K Isolated from Momordica charantia’s seeds on multiple experimental gastric ulcer models in rats. Evid Based Complement Alternat Med. (2022) 2022:6098929. doi: 10.1155/2022/6098929
8. Ning L, Abagna H, Jiang Q, Liu S, Huang J. Development and application of therapeutic antibodies against covid-19. Int J Biol Sci. (2021) 17:1486–96. doi: 10.7150/ijbs.59149
9. Van Der Ven C, Muresan S, Gruppen H, De Bont D, Merck K, Voragen A. FTIR spectra of whey and casein hydrolysates in relation to their functional properties. J Agric Food Chem. (2002) 50:6943–50. doi: 10.1021/jf020387k
10. Kim H, Li-Chan E. Application of fourier transform Raman spectroscopy for prediction of bitterness of peptides. Appl Spectrosc. (2006) 60:1297–306. doi: 10.1366/000370206778998978
11. Karametsi K, Kokkinidou S, Ronningen I, Peterson D. Identification of bitter peptides in aged cheddar cheese. J Agric Food Chem. (2014) 62:8034–41. doi: 10.1021/jf5020654
12. Liu X, Jiang D, Peterson D. Identification of bitter peptides in whey protein hydrolysate. J Agric Food Chem. (2014) 62:5719–25. doi: 10.1021/jf4019728
13. Gauthaman A, Jacob R, Pasupati S, Rajadurai A, Doss C, Moorthy A. Novel peptide-based inhibitor for targeted inhibition of T cell function. J Cell Commun Signal. (2022) 16:349–59. doi: 10.1007/s12079-021-00660-0
14. Tayubi I, Kumar S, Doss C. Identification of potential inhibitors, conformational dynamics, and mechanistic insights into mutant Kirsten rat sarcoma virus (G13d) driven cancers. J Cell Biochem. (2022) 123:1467–80. doi: 10.1002/jcb.30305
15. Wu J, Aluko R. Quantitative structure-activity relationship study of bitter di- and tri-peptides including relationship with angiotensin I-converting enzyme inhibitory activity. J Pept Sci. (2007) 13:63–9. doi: 10.1002/psc.800
16. Soltani S, Haghaei H, Shayanfar A, Vallipour J, Asadpour Zeynali K, Jouyban A. QSBR study of bitter taste of peptides: application of Ga-Pls in combination with Mlr, Svm, and Ann approaches. Biomed Res Int. (2013) 2013:501310. doi: 10.1155/2013/501310
17. Lv Z, Ao C, Zou Q. Protein function prediction: from traditional classifier to deep learning. Proteomics. (2019) 19:e1900119. doi: 10.1002/pmic.201900119
18. Lv Z, Cui F, Zou Q, Zhang L, Xu L. Anticancer peptides prediction with deep representation learning features. Brief Bioinform. (2021) 22:bbab008. doi: 10.1093/bib/bbab008
19. Ao C, Yu L, Zou Q. Prediction of bio-sequence modifications and the associations with diseases. Brief Funct Genom. (2021) 20:1–18. doi: 10.1093/bfgp/elaa023
20. Zhang Y, Liu T, Hu X, Wang M, Wang J, Zou B, et al. Cellcall: integrating paired ligand-receptor and transcription factor activities for cell-cell communication. Nucleic Acids Res. (2021) 49:8520–34. doi: 10.1093/nar/gkab638
21. Zhang Y, Liu T, Wang J, Zou B, Li L, Yao L, et al. Cellinker: a platform of ligand-receptor interactions for intercellular communication analysis. Bioinformatics. (2021) 37:2025–32. doi: 10.1093/bioinformatics/btab036
22. Charoenkwan P, Yana J, Schaduangrat N, Nantasenamat C, Hasan M, Shoombuatong W. iBITTER-SCM: identification and characterization of bitter peptides using a scoring card method with propensity scores of dipeptides. Genomics. (2020) 112:2813–22. doi: 10.1016/j.ygeno.2020.03.019
23. Charoenkwan P, Nantasenamat C, Hasan M, Manavalan B, Shoombuatong W. BERT4Bitter: a bidirectional encoder representations from transformers (bert)-based model for improving the prediction of bitter peptides. Bioinformatics. (2021) 37:2556–62. doi: 10.1093/bioinformatics/btab133
24. Charoenkwan P, Nantasenamat C, Hasan M, Moni M, Lio P, Shoombuatong W. iBitter-Fuse: a novel sequence-based bitter peptide predictor by fusing multi-view features. Int J Mol Sci. (2021) 22:8958. doi: 10.3390/ijms22168958
25. Yan N, Lv Z, Hong W, Xu X. Editorial: feature representation and learning methods with applications in protein secondary structure. Front Bioeng Biotechnol. (2021) 9:748722. doi: 10.3389/fbioe.2021.748722
26. Jiang J, Lin X, Jiang Y, Jiang L, Lv Z. Identify bitter peptides by using deep representation learning features. Int J Mol Sci. (2022) 23:7877. doi: 10.3390/ijms23147877
27. Zhao-Yue ZZ, Yu-He Y, Hao L. Towards a better prediction of subcellular location of long non-coding RNA. Front Comput Sci. (2022) 16:165903. doi: 10.1007/s11704-021-1015-3
28. Yang H, Luo Y, Ren X, Wu M, He X, Peng B, et al. Risk prediction of diabetes: big data mining with fusion of multifarious physical examination indicators. Inform Fus. (2021) 75:140–9. doi: 10.1016/j.inffus.2021.02.015
29. Hasan M, Basith S, Khatun M, Lee G, Manavalan B, Kurata H. Meta-I6ma: an interspecies predictor for identifying DNA N6-methyladenine sites of plant genomes by exploiting informative features in an integrative machine-learning framework. Brief Bioinform. (2021) 22:bbaa202. doi: 10.1093/bib/bbaa202
30. Wu X, Yu L. Epsol: sequence-based protein solubility prediction using multidimensional embedding. Bioinformatics. (2021) 37:4314–20. doi: 10.1093/bioinformatics/btab463
31. Jeon Y, Hasan M, Park H, Lee K, Manavalan B. Tacos: a novel approach for accurate prediction of cell-specific long noncoding RNAs subcellular localization. Brief Bioinform. (2022) 23:bbac243. doi: 10.1093/bib/bbac243
32. Ao C, Zou Q, Yu L. NMRF: identification of multispecies RNA 2’-O-methylation modification sites from RNA sequences. Brief Bioinform. (2022) 23:bbab480. doi: 10.1093/bib/bbab480
33. Su R, Liu X, Wei L. MinE-RFE: determine the optimal subset from RFE by minimizing the subset-accuracy-defined energy. Brief Bioinform. (2020) 21:687–98. doi: 10.1093/bib/bbz021
34. Wei L, Zhou C, Chen H, Song J, Su R. ACPred-FL: a sequence-based predictor using effective feature representation to improve the prediction of anti-cancer peptides. Bioinformatics. (2018) 34:4007–16. doi: 10.1093/bioinformatics/bty451
35. Teng Z, Zhang Z, Tian Z, Li Y, Wang G. ReRF-Pred: predicting amyloidogenic regions of proteins based on their pseudo amino acid composition and tripeptide composition. BMC Bioinform. (2021) 22:545. doi: 10.1186/s12859-021-04446-4
36. Li H, Shi L, Gao W, Zhang Z, Zhang L, Zhao Y, et al. Dpromoter-Xgboost: detecting promoters and strength by combining multiple descriptors and feature selection using Xgboost. Methods. (2022) 204:215–22. doi: 10.1016/j.ymeth.2022.01.001
37. Chen Z, Zhao P, Li C, Li F, Xiang D, Chen Y, et al. Ilearnplus: a comprehensive and automated machine-learning platform for nucleic acid and protein sequence analysis, prediction and visualization. Nucleic Acids Res. (2021) 49:e60. doi: 10.1093/nar/gkab122
38. Ahmed Z, Zulfiqar H, Tang L, Lin H. A statistical analysis of the sequence and structure of thermophilic and non-thermophilic proteins. Int J Mol Sci. (2022) 23:10116. doi: 10.3390/ijms231710116
39. Hasan M, Schaduangrat N, Basith S, Lee G, Shoombuatong W, Manavalan B. Hlppred-Fuse: improved and robust prediction of hemolytic peptide and its activity by fusing multiple feature representation. Bioinformatics. (2020) 36:3350–6. doi: 10.1093/bioinformatics/btaa160
40. Basith S, Lee G, Manavalan B. STALLION: a stacking-based ensemble learning framework for prokaryotic lysine acetylation site prediction. Brief Bioinform. (2022) 23:bbab376. doi: 10.1093/bib/bbab376
41. Zhao X, Wang H, Li H, Wu Y, Wang G. Identifying plant pentatricopeptide repeat proteins using a variable selection method. Front Plant Sci. (2021) 12:506681. doi: 10.3389/fpls.2021.506681
42. Zhai Y, Chen Y, Teng Z, Zhao Y. Identifying antioxidant proteins by using amino acid composition and protein-protein interactions. Front Cell Dev Biol. (2020) 8:591487. doi: 10.3389/fcell.2020.591487
43. Chou K. Prediction of protein cellular attributes using pseudo-amino acid composition. Proteins. (2001) 43:246–55. doi: 10.1002/prot.1035
44. Damborsky J. Quantitative structure-function and structure-stability relationships of purposely modified proteins. Protein Eng. (1998) 11:21–30. doi: 10.1093/protein/11.1.21
45. Hopp T, Woods K. Prediction of protein antigenic determinants from amino acid sequences. Proc Natl Acad Sci U.S.A. (1981) 78:3824–8. doi: 10.1073/pnas.78.6.3824
46. Chou K. Using amphiphilic pseudo amino acid composition to predict enzyme subfamily classes. Bioinformatics. (2005) 21:10–9. doi: 10.1093/bioinformatics/bth466
47. Tang H, Zhao Y, Zou P, Zhang C, Chen R, Huang P, et al. HBPred: a tool to identify growth hormone-binding proteins. Int J Biol Sci. (2018) 14:957–64. doi: 10.7150/ijbs.24174
48. Schneider G, Wrede P. The rational design of amino acid sequences by artificial neural networks and simulated molecular evolution: de novo design of an idealized leader peptidase cleavage site. Biophys J. (1994) 66(2 Pt 1):335–44. doi: 10.1016/s0006-349580782-9
49. Grantham R. Amino acid difference formula to help explain protein evolution. Science. (1974) 185:862–4. doi: 10.1126/science.185.4154.862
50. Manavalan B, Patra M. MLCPP 2.0: an updated cell-penetrating peptides and their uptake efficiency predictor. J Mol Biol. (2022) 434:167604. doi: 10.1016/j.jmb.2022.167604
51. Thi Phan L, Woo Park H, Pitti T, Madhavan T, Jeon Y, Manavalan B. MLACP 2.0: an updated machine learning tool for anticancer peptide prediction. Comput Struct Biotechnol J. (2022) 20:4473–80. doi: 10.1016/j.csbj.2022.07.043
52. Lv Z, Jin S, Ding H, Zou Q. A random forest sub-golgi protein classifier optimized via dipeptide and amino acid composition features. Front Bioeng Biotechnol. (2019) 7:215. doi: 10.3389/fbioe.2019.00215
53. Lv Z, Zhang J, Ding H, Zou Q. RF-PseU: a random forest predictor for RNA pseudouridine sites. Front Bioeng Biotechnol. (2020) 8:134. doi: 10.3389/fbioe.2020.00134
54. Ao C, Zou Q, Yu L. RFhy-m2G: identification of RNA N2-methylguanosine modification sites based on random forest and hybrid features. Methods. (2022) 203:32–9. doi: 10.1016/j.ymeth.2021.05.016
55. Lv H, Dao F, Lin H. DeepKla: an attention mechanism-based deep neural network for protein lysine lactylation site prediction. iMeta. (2022) 1:e11. doi: 10.1002/imt2.11
56. Han Y, Yang H, Huang Q, Sun Z, Li M, Zhang J, et al. Risk prediction of diabetes and pre-diabetes based on physical examination data. Math Biosci Eng. (2022) 19:3597–608. doi: 10.3934/mbe.2022166
57. Akbar S, Ahmad A, Hayat M, Rehman A, Khan S, Ali F. iAtbP-Hyb-EnC: prediction of antitubercular peptides via heterogeneous feature representation and genetic algorithm based ensemble learning model. Comput Biol Med. (2021) 137:104778. doi: 10.1016/j.compbiomed.2021.104778
58. Dong F, Zhao G, Tong H, Zhang Z, Lao X, Zheng H. The prospect of bioactive peptide research: a review on databases and tools. Curr Bioinform. (2021) 16:494–504. doi: 10.2174/1574893615999200813192148
59. Jagadeb M, Pattanaik K, Rath S, Sonawane A. Identification and evaluation of immunogenic Mhc-I and Mhc-Ii binding peptides from mycobacterium tuberculosis. Comput Biol Med. (2021) 130:104203. doi: 10.1016/j.compbiomed.2020.104203
60. Lin D, Yu J, Zhang J, He H, Guo X, Shi S. Predaip: computational prediction and analysis for anti-inflammatory peptide via a hybrid feature selection technique. Curr Bioinform. (2021) 16:1048–59. doi: 10.2174/1574893616666210601111157
61. Liu Y, Ouyang X, Xiao Z, Zhang L, Cao Y. A review on the methods of peptide-Mhc binding prediction. Curr Bioinform. (2020) 15:878–88. doi: 10.2174/1574893615999200429122801
62. Masoudi-Sobhanzadeh Y, Jafari B, Parvizpour S, Pourseif M, Omidi YA. Novel multi-objective metaheuristic algorithm for protein-peptide docking and benchmarking on the leads-pep dataset. Comput Biol Med. (2021) 138:104896. doi: 10.1016/j.compbiomed.2021.104896
63. Mulpuru V, Semwal R, Varadwaj P, Mishra N. Hamp: a knowledgebase of antimicrobial peptides from human microbiome. Curr Bioinform. (2021) 16:534–40. doi: 10.2174/1574893615999200802041228
64. Yu L, Wang M, Yang Y, Xu F, Zhang X, Xie F, et al. Predicting therapeutic drugs for hepatocellular carcinoma based on tissue-specific pathways. PLoS Comput Biol. (2021) 17:e1008696. doi: 10.1371/journal.pcbi.1008696
65. Wei L, Su R, Wang B, Li X, Zou Q, Gao X. Integration of deep feature representations and handcrafted features to improve the prediction of N-6-methyladenosine sites. Neurocomputing. (2019) 324:3–9. doi: 10.1016/j.neucom.2018.04.082
66. Wei L, Tang J, Zou Q. Local-Dpp: an improved DNA-binding protein prediction method by exploring local evolutionary information. Inform Sci. (2017) 384:135–44. doi: 10.1016/j.ins.2016.06.026
67. Wang X, Yang Y, Liu J, Wang G. The stacking strategy-based hybrid framework for identifying non-coding RNAs. Brief Bioinform. (2021) 22:bbab023. doi: 10.1093/bib/bbab023
68. Tao Z, Li Y, Teng Z, Zhao Y. A method for identifying vesicle transport proteins based on Libsvm and Mrmd. Comput Math Methods Med. (2020) 2020:8926750. doi: 10.1155/2020/8926750
69. Guo Z, Wang P, Liu Z, Zhao Y. Discrimination of thermophilic proteins and non-thermophilic proteins using feature dimension reduction. Front Bioeng Biotechnol. (2020) 8:584807. doi: 10.3389/fbioe.2020.584807
70. Jiang Q, Wang G, Jin S, Li Y, Wang Y. Predicting human microrna-disease associations based on support vector machine. Int J Data Min Bioinform. (2013) 8:282–93.
71. Huang Y, Zhou D, Wang Y, Zhang X, Su M, Wang C, et al. Prediction of transcription factors binding events based on epigenetic modifications in different human cells. Epigenomics. (2020) 12:1443–56. doi: 10.2217/epi-2019-0321
72. Xu Z, Luo M, Lin W, Xue G, Wang P, Jin X, et al. DLpTCR: an ensemble deep learning framework for predicting immunogenic peptide recognized by T cell receptor. Brief Bioinform. (2021) 22:bbab335. doi: 10.1093/bib/bbab335
73. Lv H, Dao F, Guan Z, Yang H, Li Y, Lin H. Deep-Kcr: accurate detection of lysine crotonylation sites using deep learning method. Brief Bioinform. (2021) 22:bbaa255. doi: 10.1093/bib/bbaa255
74. Dao F, Lv H, Zhang D, Zhang Z, Liu L, Lin H. Deepyy1: a deep learning approach to identify Yy1-mediated chromatin loops. Brief Bioinform. (2021) 22:bbaa356. doi: 10.1093/bib/bbaa356
75. Dao F, Lv H, Su W, Sun Z, Huang Q, Lin H. Idhs-Deep: an integrated tool for predicting Dnase I hypersensitive sites by deep neural network. Brief Bioinform. (2021) 22:bbab047. doi: 10.1093/bib/bbab047
76. Zhang D, Xu Z, Su W, Yang Y, Lv H, Yang H, et al. Icarps: a computational tool for identifying protein carbonylation sites by novel encoded features. Bioinformatics. (2020) 37:171–7. doi: 10.1093/bioinformatics/btaa702
77. Zhang L, Yang Y, Chai L, Li Q, Liu J, Lin H, et al. A deep learning model to identify gene expression level using cobinding transcription factor signals. Brief Bioinform. (2022) 23:bbab501. doi: 10.1093/bib/bbab501
78. Lv H, Zhang Y, Wang J, Yuan S, Sun Z, Dao F, et al. Irice-Ms: an integrated Xgboost model for detecting multitype post-translational modification sites in rice. Brief Bioinform. (2022) 23:bbab486. doi: 10.1093/bib/bbab486
79. Zhang Q, Li H, Liu Y, Li J, Wu C, Tang H. Exosomal non-coding RNAs: new insights into the biology of hepatocellular carcinoma. Curr Oncol. (2022) 29:5383–406.
80. Sun Z, Huang Q, Yang Y, Li S, Lv H, Zhang Y, et al. Psnod: identifying potential snorna-disease associations based on bounded nuclear norm regularization. Brief Bioinform. (2022) 23:bbac240. doi: 10.1093/bib/bbac240
81. Dao F, Lv H, Zhang Z, Lin H. Bdselect: a package for K-Mer selection based on the binomial distribution. Curr Bioinform. (2022) 17:238–44. doi: 10.2174/1574893616666211007102747
82. Yu L, Xia M, An Q. A network embedding framework based on integrating multiplex network for drug combination prediction. Brief Bioinform. (2022) 23:bbab364. doi: 10.1093/bib/bbab364
83. Huang H, Wu N, Liang Y, Peng X, Shu J. Slnl: a novel method for gene selection and phenotype classification. Int J Intell Syst. (2022) 37:6283–304. doi: 10.1002/int.22844
84. Huang H, Liang Y. A novel cox proportional hazards model for high-dimensional genomic data in cancer prognosis. IEEE/ACM Trans Comput Biol Bioinform. (2021) 18:1821–30. doi: 10.1109/TCBB.2019.2961667
85. Huang H, Peng X, Liang Y. Splsn: an efficient tool for survival analysis and biomarker selection. Int J Intell Syst. (2021) 36:5845–65. doi: 10.1002/int.22532
Keywords: bitter peptide, sequence information, random forest, feature fusion, classification method
Citation: Zhang Y-F, Wang Y-H, Gu Z-F, Pan X-R, Li J, Ding H, Zhang Y and Deng K-J (2023) Bitter-RF: A random forest machine model for recognizing bitter peptides. Front. Med. 10:1052923. doi: 10.3389/fmed.2023.1052923
Received: 24 September 2022; Accepted: 05 January 2023;
Published: 26 January 2023.
Edited by:
C. George Priya Doss, VIT University, IndiaReviewed by:
HaiHui Huang, Shaoguan University, ChinaDragos Horvath, UMR 7140 Chimie de la Matière Complexe, France
Zhibin Lv, Sichuan University, China
Copyright © 2023 Zhang, Wang, Gu, Pan, Li, Ding, Zhang and Deng. This is an open-access article distributed under the terms of the Creative Commons Attribution License (CC BY). The use, distribution or reproduction in other forums is permitted, provided the original author(s) and the copyright owner(s) are credited and that the original publication in this journal is cited, in accordance with accepted academic practice. No use, distribution or reproduction is permitted which does not comply with these terms.
*Correspondence: Hui Ding,  hding@uestc.edu.cn; Yang Zhang, yangzhang@cdutcm.edu.cn; Ke-Jun Deng, dengkj@uestc.edu.cn
†These authors have contributed equally to this work