Metabolomic Biomarkers of Multiple Sclerosis: A Systematic Review
 Lachlan Porter1*
  Alireza Shoushtarizadeh1
  George A. Jelinek1
  Chelsea R. Brown2 Chai K. Lim3 Alysha M. de Livera1 Kelly R. Jacobs3
  Tracey J. Weiland1
- 1Neuroepidemiology Unit, Melbourne School of Population and Global Health, The University of Melbourne, Carlton, VIC, Australia
- 2The Peter Doherty Institute for Infection and Immunity, Melbourne, VIC, Australia
- 3Department of Biomedical Sciences, Faculty of Medicine and Health Sciences, Macquarie University, Macquarie Park, NSW, Australia
Background: Magnetic resonance imaging (MRI), cerebrospinal fluid (CSF) analysis, and the McDonald’s clinical criteria are currently utilized tools in diagnosing multiple sclerosis. However, a more conclusive, consistent, and efficient way of diagnosing multiple sclerosis (MS) is yet to be discovered. A potential biomarker, discovered using advances in high-throughput sequencing such as nuclear magnetic resonance (NMR) spectroscopy and other “Omics”-based techniques, may make diagnosis and prognosis more reliable resulting in a more personalized and targeted treatment regime and improved outcomes. The aim of this review was to systematically search the literature for potential biomarkers from any bodily fluid that could consistently and accurately diagnose MS and/or indicate disease progression.
Methods: A systematic literature review of EMBASE, PubMed (MEDLINE), The Cochrane Library, and CINAHL databases produced over a thousand potential studies. Inclusion criteria stated studies with potential biomarker outcomes for people with MS were to be included in the review. Studies were limited to those with human participants who had a clinically defined diagnosis of MS and published in English, with no limit placed on date of publication or the type of bodily fluid sampled.
Results: A total of 1,805 studies were recorded from the literature search. A total of 1,760 studies were removed based on their abstract, with a further 18 removed after considering the full text. A total of 30 studies were considered relevant and had their data retrieved and analyzed. Due to the heterogeneity of focus and results from the refined studies, a narrative synthesis was favored.
Conclusion: Several promising candidate biomarkers suitable for clinical application in MS have been studied. It is recommended follow-up studies with larger sample sizes be completed on several potential biomarkers.
Background
Multiple sclerosis (MS) is a chronic, progressive, neurological disease which affects over 2.5 million people worldwide (Raphael et al., 2015). Disease presentation and progression vary between patients, making diagnosis sometimes challenging. MS is often categorized into three principal subtypes: relapsing remitting MS (RRMS), secondary progressive MS (SPMS), and primary progressive MS (PPMS). RRMS is defined as having episodes of relapses or attacks where new symptoms appear, followed by periods of remission where there are little to no symptoms, although neurological damage accumulates with repeated relapses. SPMS is characterized by gradual worsening after an initial relapsing disease course, with or without acute exacerbations during the progressive course (Lublin et al., 2014). PPMS is defined as continued worsening without exacerbations prior to clinical progression (Lublin et al., 2014). Clinically isolated syndrome (CIS) is the term given to the first clinical onset of potential MS where inflammatory demyelination has occurred but the criterion of dissemination has not been fulfilled (EfendI, 2015).
At present, MS is diagnosed using clinical tests such as the McDonald criteria (McDonald et al., 2001), magnetic resonance imaging (MRI), and the presence of oligoclonal bands (OCB) in cerebrospinal fluid (CSF) (Raphael et al., 2015). The discovery of a molecular biomarker that could assist with the diagnosis of MS would allow treatment and management to begin sooner. A molecular biomarker could also be used to quantify disease exacerbation and assess response to treatment.
Traditionally, two techniques are used to search for biomarkers: hypothesis-based and discovery-based methods (McDermott et al., 2013). Hypothesis-based biomarker searches are focused on understanding disease mechanisms, to date not fully elucidated in MS. Discovery-based biomarker methods seek to identify changes in the concentration of molecular species, such as metabolites, that are associated with the disease of interest (McDermott et al., 2013).
Metabolites are defined as low molecular weight (<900 Da) organic and inorganic molecules which are the reactants, intermediates, or products of enzyme-mediated biochemical reactions (Dunn et al., 2011). The compositional diversity of metabolites results in a range of physiochemical properties, making their investigation a challenge. Analytical chemistry techniques such as mass spectrometry and nuclear magnetic resonance (NMR) spectroscopy which may be coupled with chromatography are the most common techniques used to identify and quantify metabolites (Dunn et al., 2011). An explosion in these high-throughput sequencing and “-omics”-based technologies over the past decade has been the catalyst for many published candidate biomarkers for MS; however, many of these are general inflammatory markers and have not yet translated into practical, clinical biomarkers (Housley et al., 2015). Another problem currently faced when using high-throughput sequencing on biological samples from people with MS is the considerable difference in metabolite concentrations between studies. It has been hypothesized that this is due to MS disease heterogeneity as well as technical and chemometric limitations (Reinke et al., 2014) and could also be due to variations in sample cohorts and differences in classification criteria.
The aim of this review was to systematically collate published literature on potential biomarkers found in the biological samples collected from individuals with confirmed MS.
Methods
Literature Search Strategy
The review was registered with Prospero (CRD42017060866) at https://www.crd.york.ac.uk/prospero/prior to the official systematic search being conducted on the 30th of September 2017. Databases searched included EMBASE, PubMed (MEDLINE), The Cochrane Library, and CINAHL using the search strategy that can be found at https://www.crd.york.ac.uk/PROSPEROFILES/60866_STRATEGY_20170728.pdf. Medical subject heading (MeSH) terms were used where applicable. Articles were imported into EndNote and duplicates removed electronically using EndNote software and checked manually before being screened based on title and abstract for relevance against the inclusion/exclusion criteria. Additional searches of reference lists of relevant papers and gray literature were undertaken. Full-length papers of abstracts that matched the inclusion/exclusion criteria were retrieved for further assessment of relevance. To minimize selection bias and ensure accuracy, two independent researchers (LP and CB) screened full-length papers for relevancy. A third, independent, blinded researcher (AS) settled disputes. AS and LP screened the full texts of the refined papers through consensus for relevance according to the inclusion/exclusion criteria. The process of refining studies is reported following the Preferred Reporting Items for Systematic Reviews and Meta-Analyses (PRISMA) flow diagram from the PRISMA statement (Moher et al., 2009).
Inclusion Criteria
Studies of the metabolomic profiles or studies with potential biomarker outcomes for people diagnosed with MS were included in the review. An a priori decision was made to include lipids of a low atomic weight and metabolites as relevant to the metabolomic profile (Dunn et al., 2011). Studies were limited to those with human participants and published in English, with no limit placed on the year of publication. Studies were not excluded based on the type of bodily fluid sampled but were excluded if the participants lacked a clinical diagnosis of MS. Systematic reviews and meta-analyses were also excluded from the review. After reviewing the abstracts, the protocol was updated so that studies focusing on “lipid profiles” were also excluded. We defined “lipid profiles” to include cholesterol (both high and low density lipoprotein) and triglycerides. This decision was made after reviewing the abstracts due to the excessive number of eligible studies found. A review of lipid profiles will be reported elsewhere in a planned separate paper.
Data Extraction and Analysis
Two researchers (LP and AS) extracted data independently from the refined papers (Tables 1, 2). Due to the heterogeneity of focus and results from the refined studies, it was not appropriate to conduct a meta-analysis, so a narrative synthesis was performed. The data points taken from each study included year of publication, sample size, study design, control used, sample type, sample analysis technique, metabolite pathway(s) examined, and the main findings from the metabolites/potential biomarker analyzed (in quantitative form where possible). It was assumed that if the study did not report blinding then the researchers were not blinded. Authors were not contacted to provide further information. The Quadomics criteria were used in the quality assessment of the included papers. Quadomics is a set of 16 criteria that have been developed to assess the quality of -omics-based studies. The tool is an adaption of the widely used QUADAS tool—an evidence-based quality assessment tool to be used in systematic reviews of diagnostic accuracy studies—adding additional criteria to check the collection and handling of the differing biological samples used in -omics research.
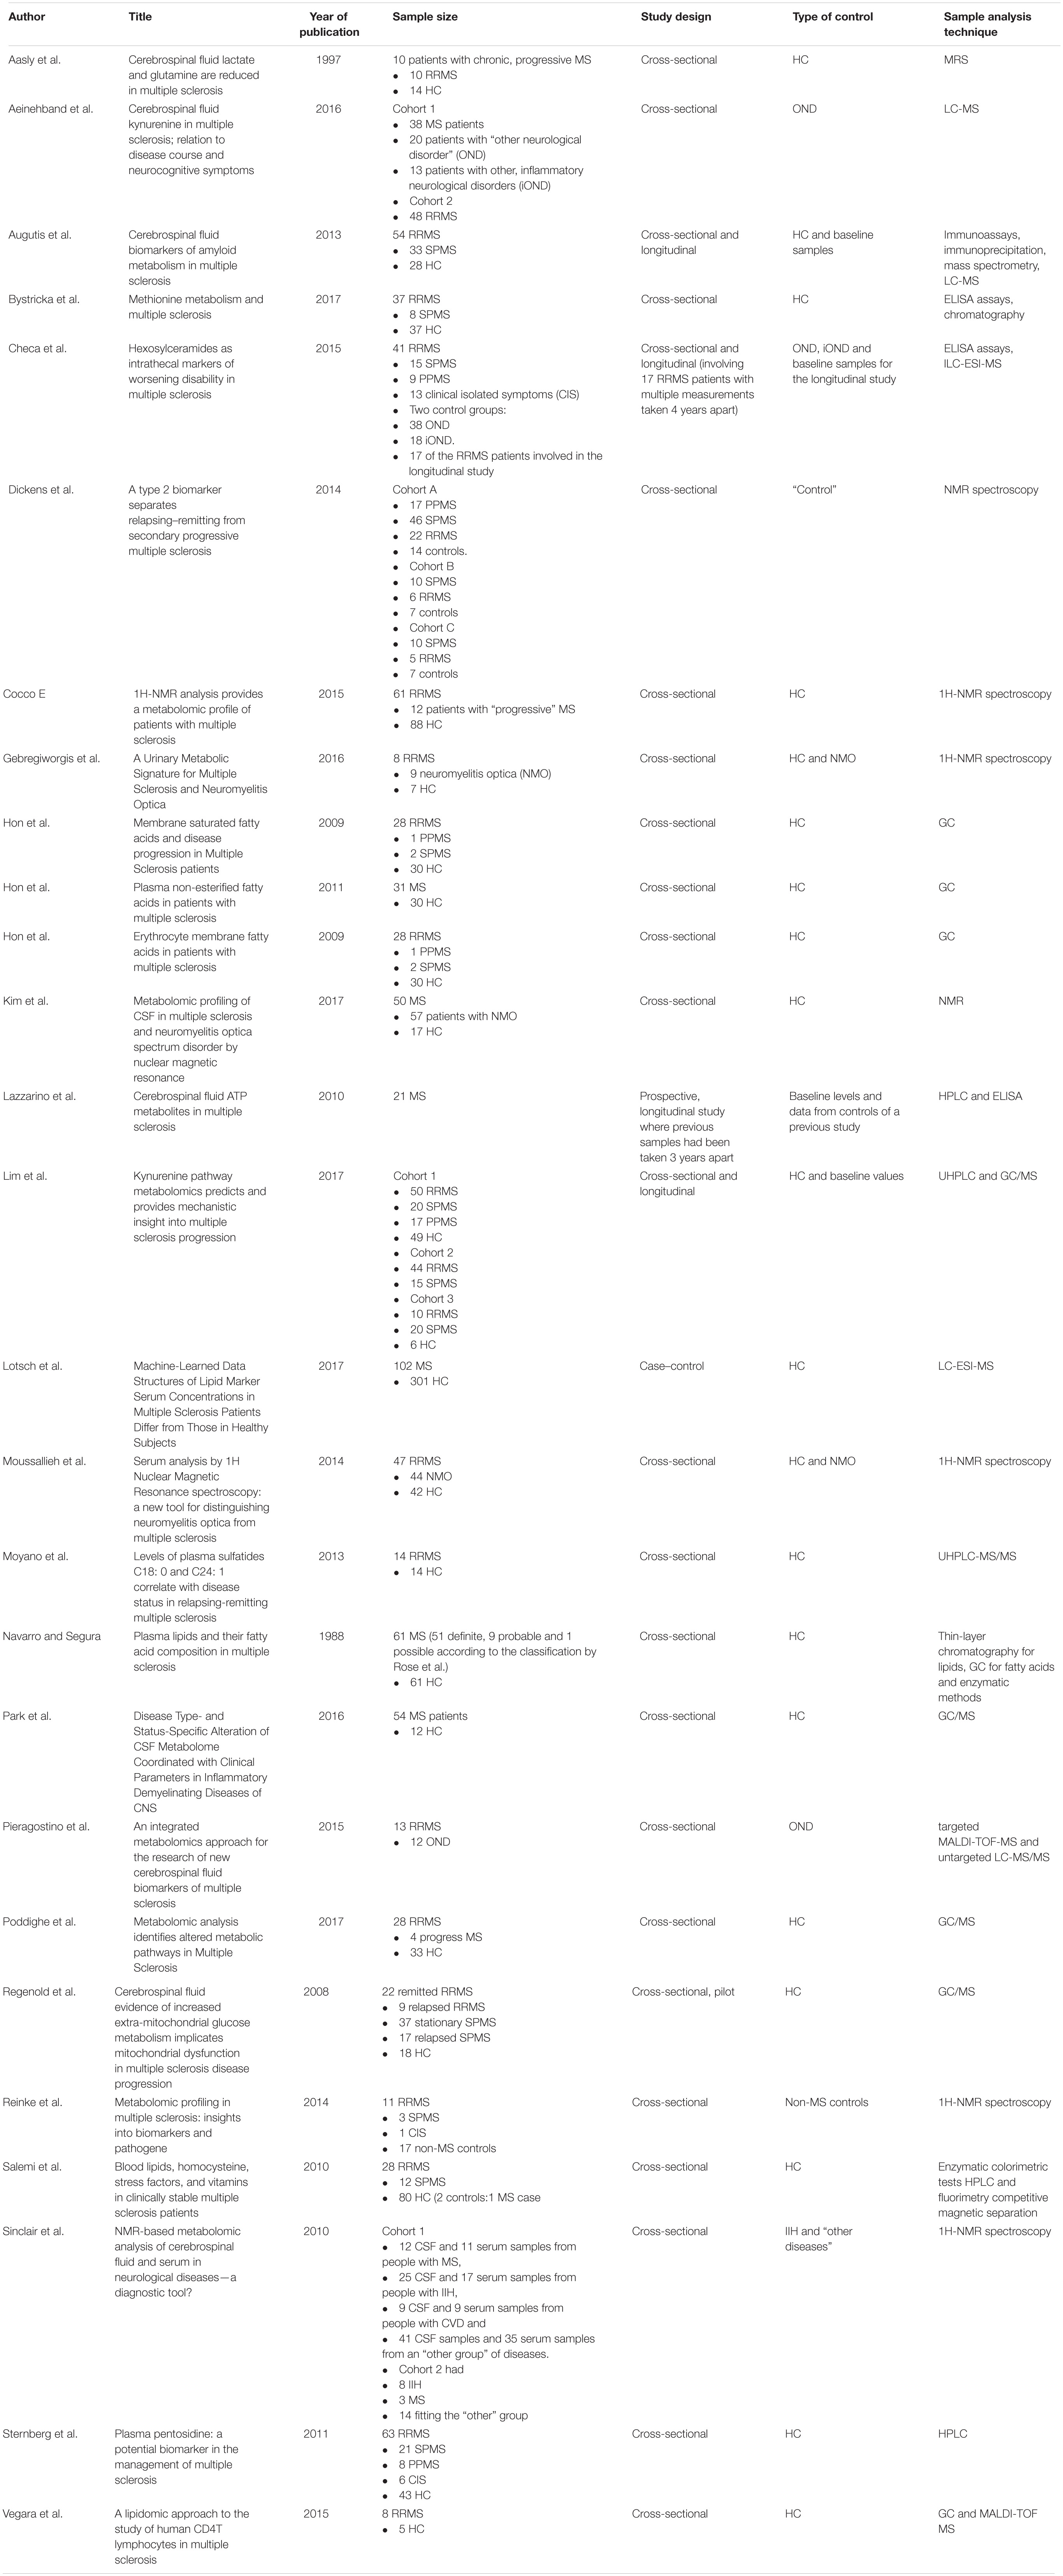
Table 1. Key data points extracted from the refined studies.
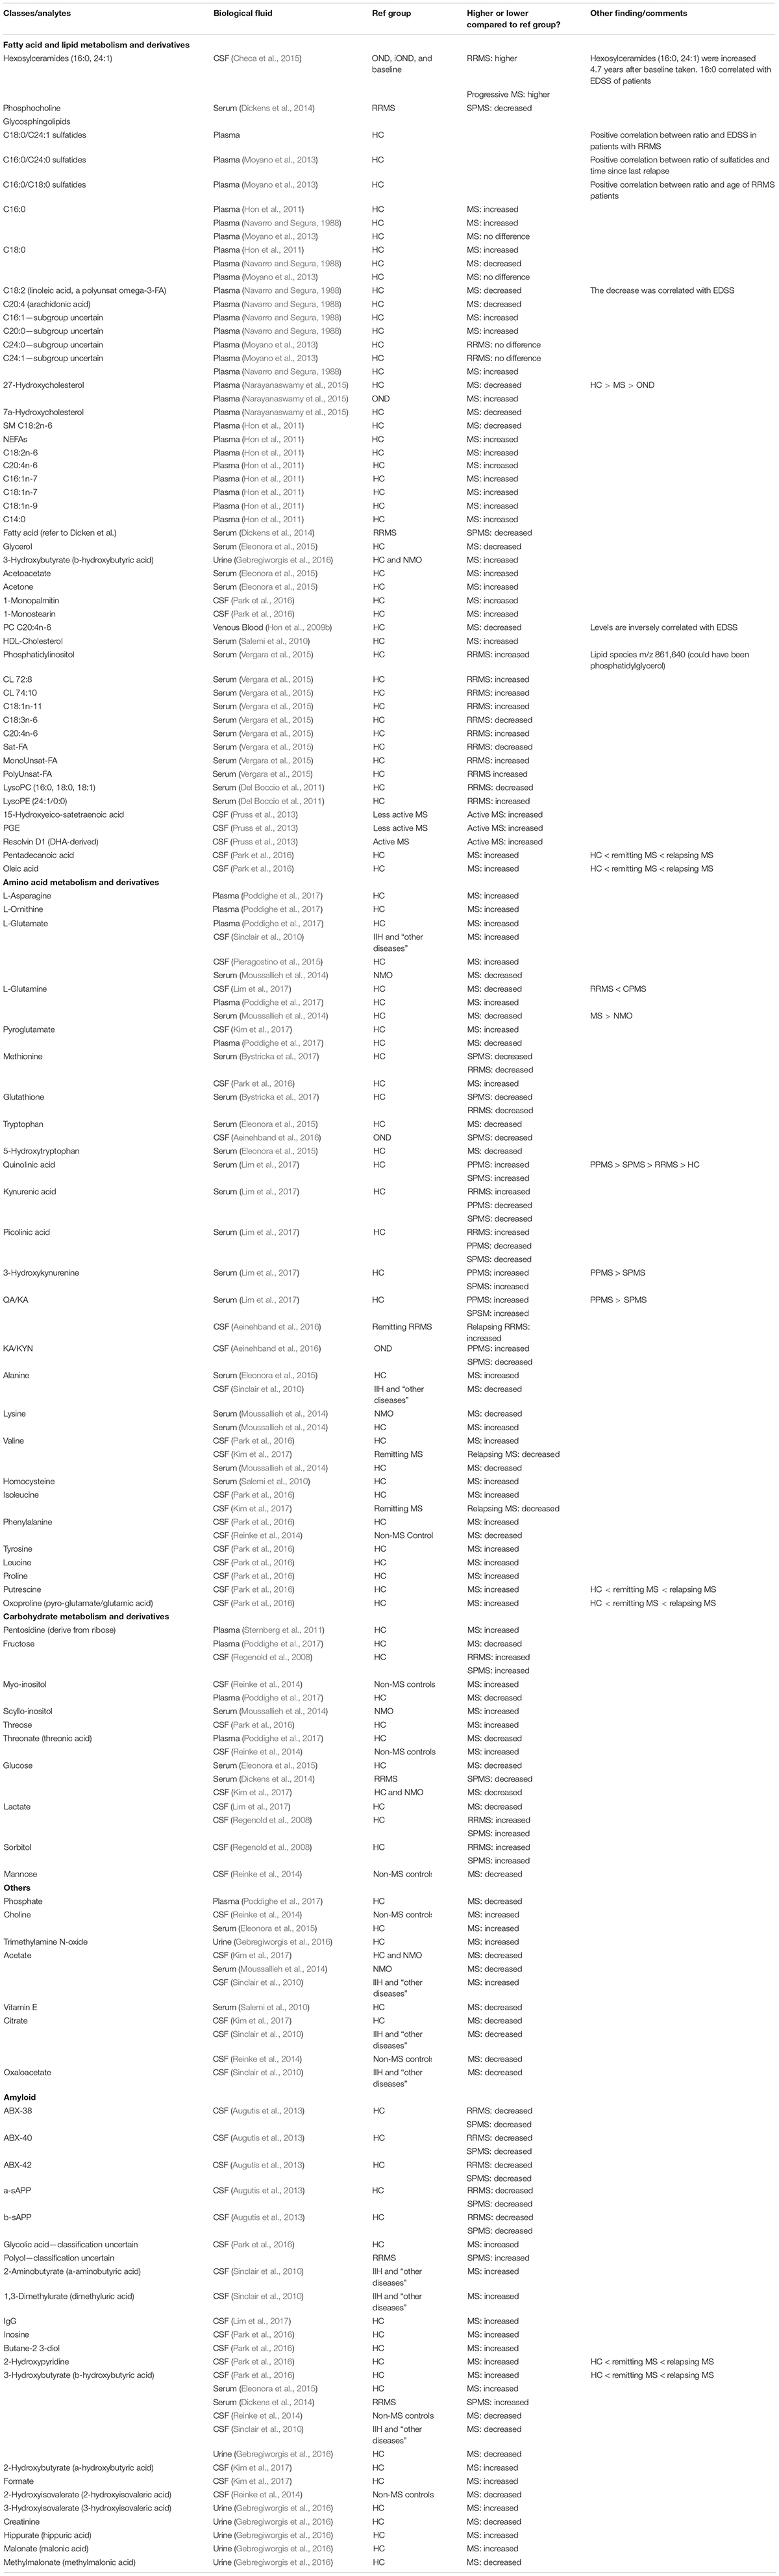
Table 2. Analytes extracted from refined studies, their concentration compared to their reference group, and other findings.
Methodological Quality Assessment
The QUADOMICS tool was developed to assess the methodologies of “-omics”-based research papers and was used to assess the methodologies of the papers included in this review (Lumbreras et al., 2008). The QUADOMICS tool is a set of 16 criteria that has been developed to rate the quality of -omics-based studies. The tool, which can provide an overall numeric rating, is an adaptation of the widely used QUADAS tool—an evidence-based quality assessment tool used in systematic reviews of diagnostic accuracy studies—supplemented with additional criteria to check the collection and handling of the differing biological samples that are used in -omics-based research. LP and AS independently assessed each paper using the QUADOMICS tool, settling disputes through consensus. EL and KJ scored question 10 of the tool for each paper. If the samples were taken from a biobank, then question 6 of the tool was marked positively. An overall score has not been provided, but the results can be interpreted from Table 3.
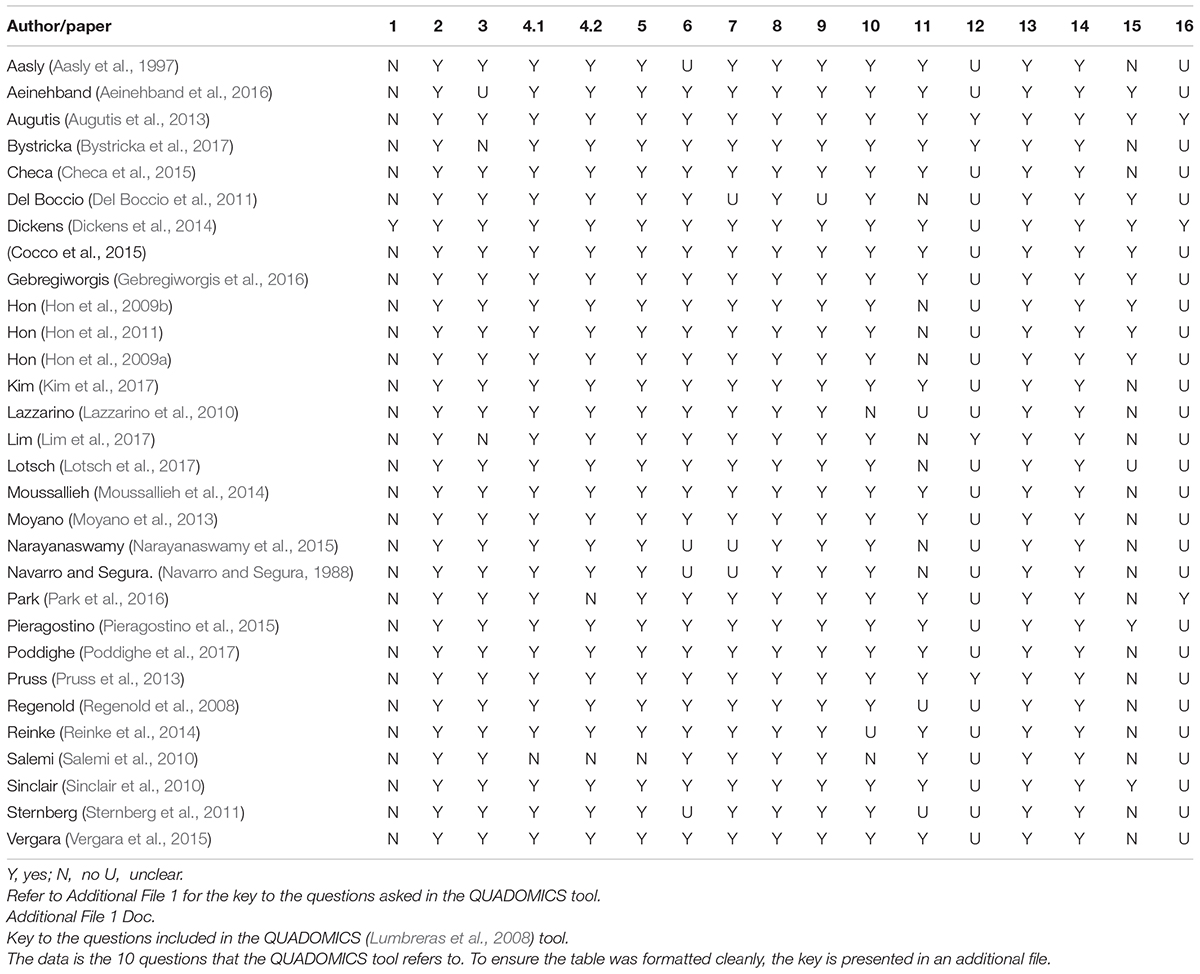
Table 3. Results from the quality appraisal tool QUADOMICS (Lumbreras et al., 2008).
Results
A total of 1805 studies were recorded following the literature search (Figure 1). 1760 of those studies were removed based on their abstract not meeting the inclusion criteria. The full text was reviewed for 48 studies of which 27 were considered relevant for inclusion in the systematic review. The main reason that studies were excluded from analysis was that they focused on the “lipid profile,” they lacked a control, or the aim of the study was to discover the impact of an intervention.
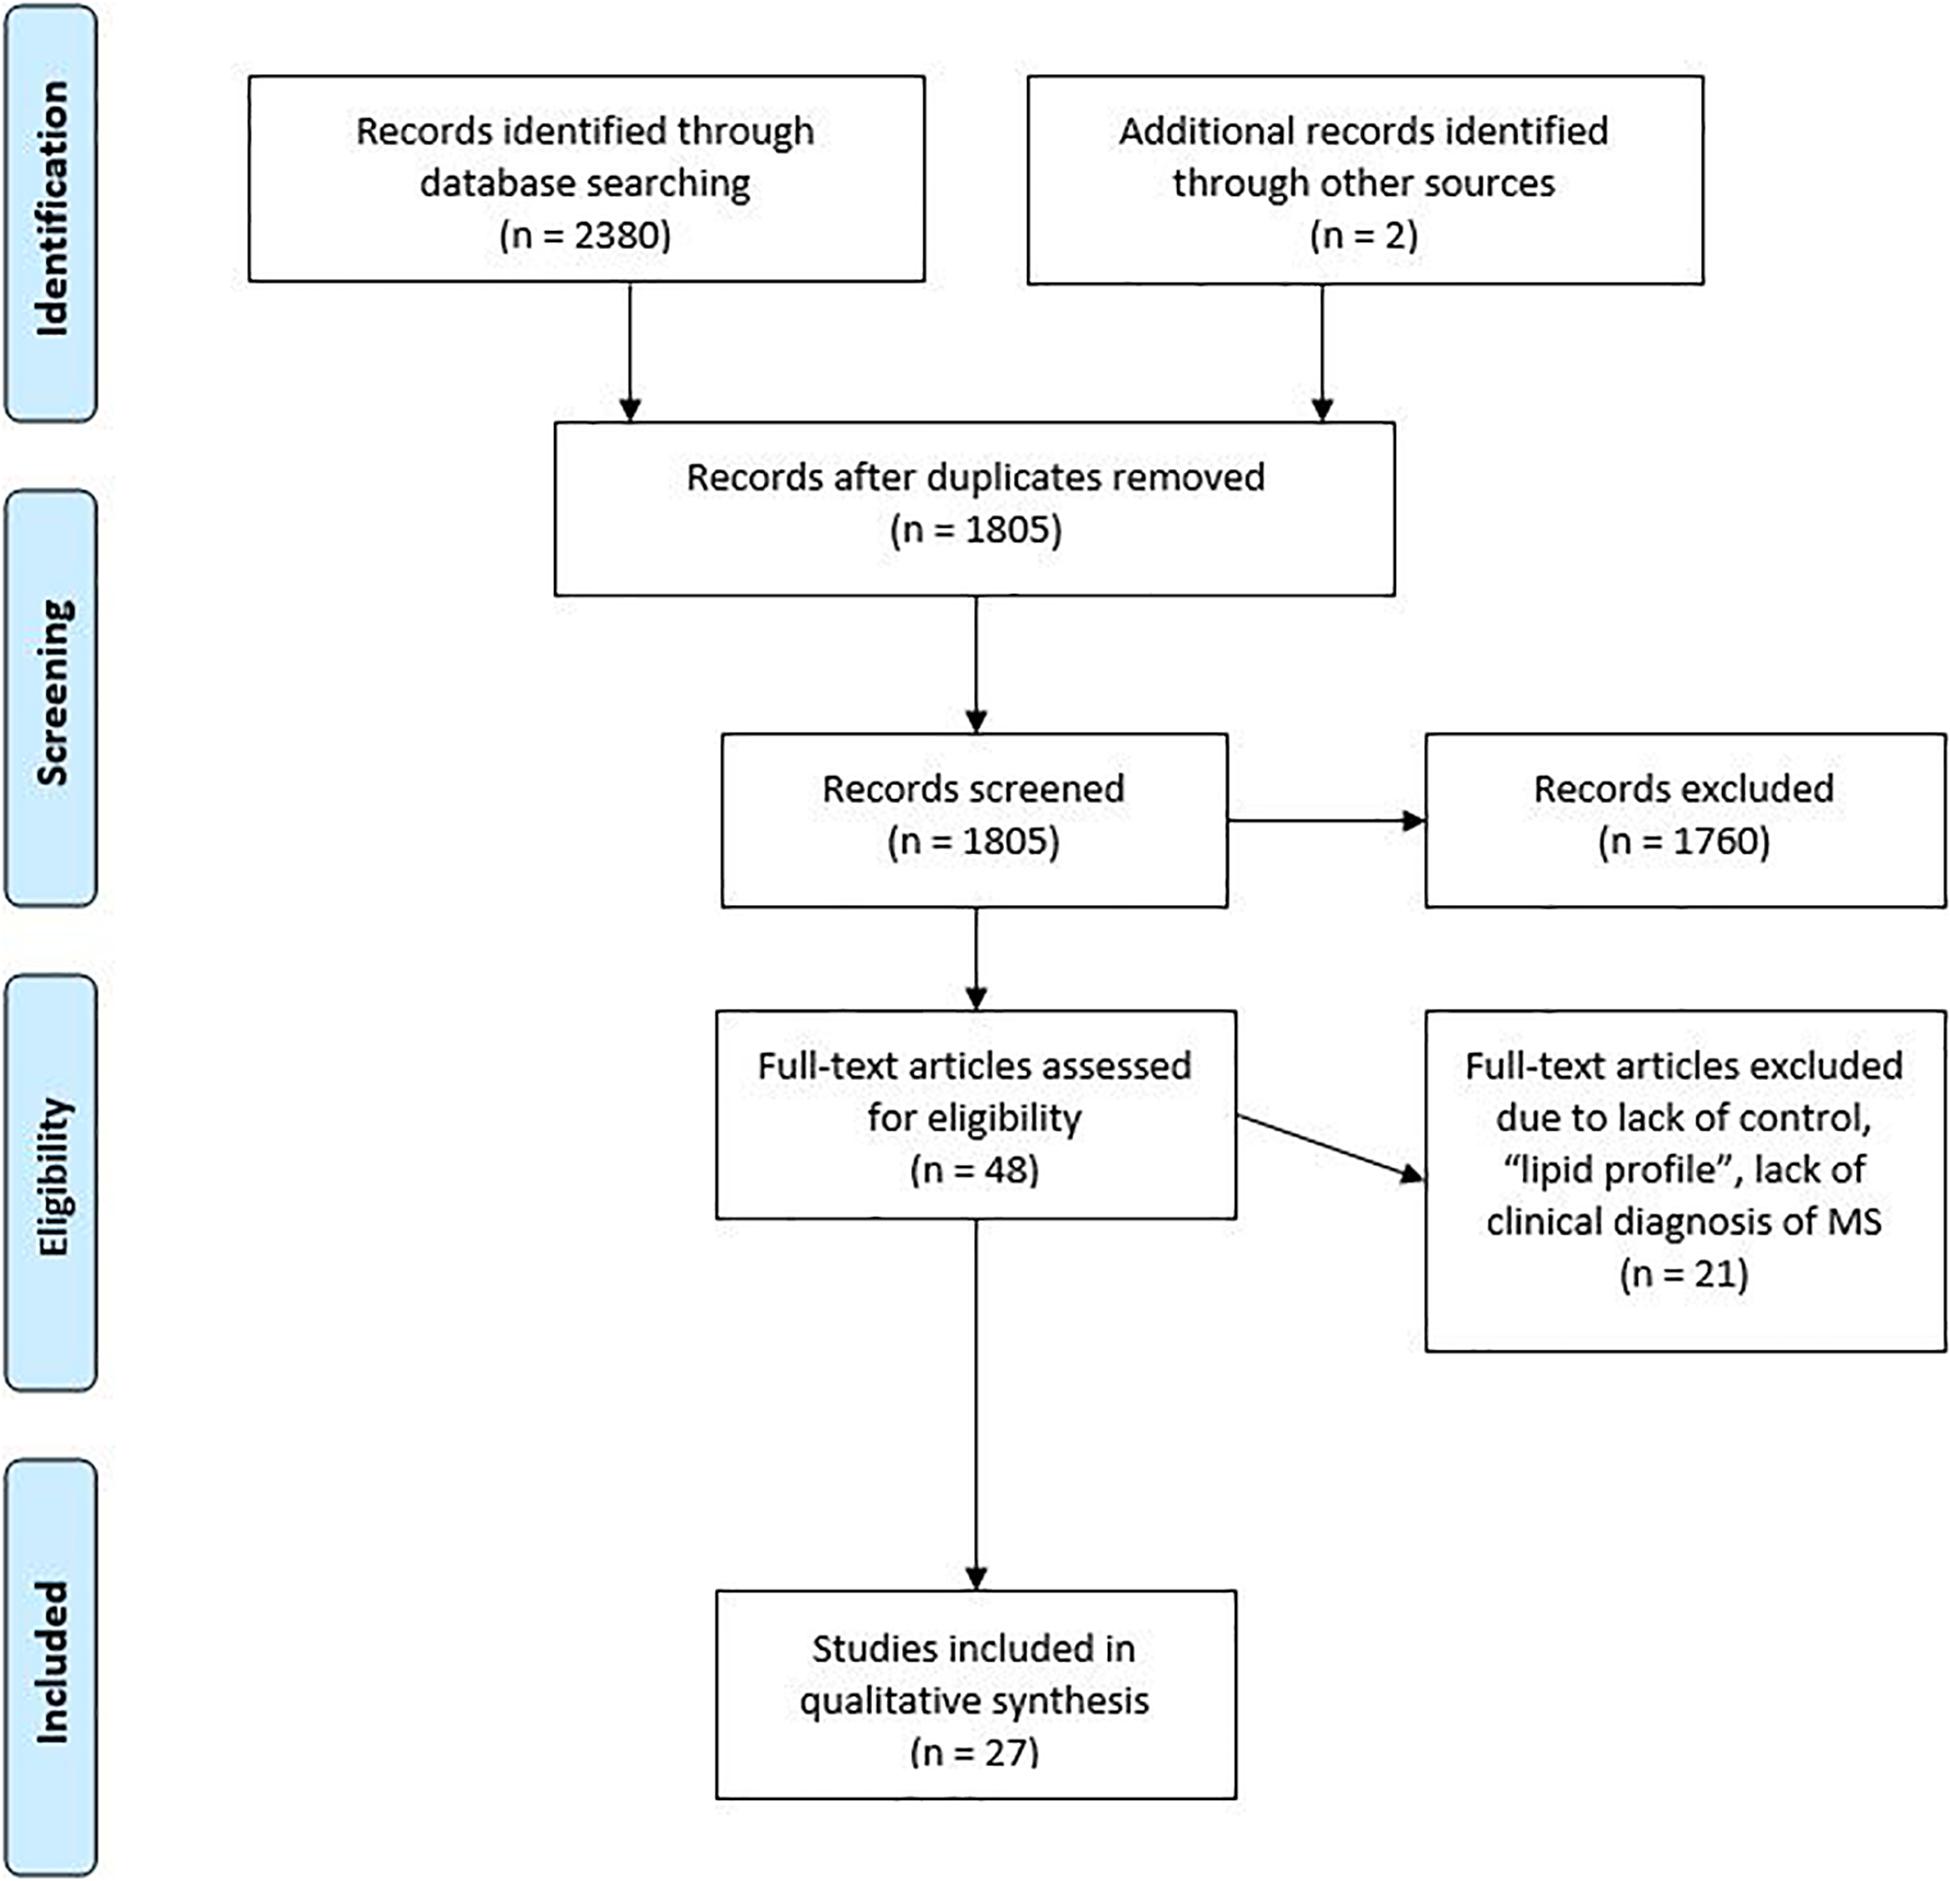
Figure 1. Flowchart showing the steps at which studies were excluded, following PRISMA guidelines.
The 27 included studies reported data on potential biomarkers that could potentially be used to discriminate between the various subtypes of MS and healthy controls. While no limitations were placed on date of publication, 18 of the 27 studies were published within the past five years. The most common type of study was case–control (26 studies), while some studies employed longitudinal data to track the change in metabolites over a course of time. Eight studies included people with other neurological disorders (OND), CIS, and/or Neuromyelitis Optica (NMO). Not all the studies recruited healthy controls, and many studies did not distinguish between the different phenotypes of MS. Some longitudinal studies used baseline values as a comparator, while some cross-sectional studies used samples of people with other conditions as a control. The most common technique used in the studies was nuclear magnetic spectroscopy, followed by liquid or gas chromatography coupled with various detectors.
Many of the studies presented metabolites that were not replicated in another study. The studies that did report on repeated metabolites often produced conflicting results.
Fatty Acids and Lipid Metabolism Derivatives
A total of 15 of the shortlisted papers described 49 different fatty acids and lipid metabolite derivatives across CSF, venous blood, serum, plasma, and urine samples. Fatty acids are the building blocks of lipids and act as important sources of energy and as structure for cells and act on biological processes. Fatty acid levels have been shown to be altered in different diseases and may potentially act as biomarkers for polycystic ovary syndrome (Zhengao et al., 2019).
Six studies (Pitt et al., 2000; Sinclair et al., 2010; Hon et al., 2011; Dickens et al., 2014; Housley et al., 2015) reported on levels of 3-hydroxybutyrate in people with MS. The results were split with three studies (Pitt et al., 2000; Dickens et al., 2014) reporting an increase in the metabolite, while the other three reported a decrease. Cocco et al. (2015) reported an increase in the metabolite in the serum of people with MS compared to healthy controls while Park et al. (2016) reported a similar result in CSF. Dickens et al. (2014) reported an increase in the metabolite in the serum of people with SPMS when compared to people with RRMS. Reinke et al. (2014) and Sinclair et al. (2010) both reported a decrease in the metabolite in CSF of people with MS when compared to non-MS controls (Housley et al., 2015) and in people with IIH and “other diseases” (Sinclair et al., 2010). Gebregiworgis et al. (2016) reported a decrease in 3-hydroxybutyrate in the urine of people with MS when compared to healthy controls.
Amino Acid Metabolism and Derivatives
Amino acids are the building blocks of proteins and other nitrogen-containing compounds such as creatinine, peptide hormones, nucleotides, and some neurotransmitters. The human body needs 20 different amino acids to function properly, with the body creating 11 of these (non-essential amino acids). The other 9 essential amino acids must be obtained through external sources (i.e., diet).
Four studies reported on the concentration of L-glutamate (non-essential amino acid) in people with MS. One study Poddighe et al. (2017) found that levels of L-glutamate in plasma increased in people with MS when compared to HC, while another study (Pieragostino et al., 2015) reported that glutamate increased in the CSF of people with MS compared to HC. Similarly, Moussallieh et al. (2014) found that CSF concentration of L-glutamate increased in MS when compared to people with idiopathic intracranial hypertension (IIH) and “other diseases.” The study by Moussallieh et al. (2014) discovered that people with MS had decreased levels of L-glutamate in their serum when compared to people with NMO. Two studies (Tisell et al., 2013; Moussallieh et al., 2014) used spectroscopy while (Pieragostino et al., 2015) used gas chromatography/mass spectrometry (GC/MS) and (Checa et al., 2015) used MALDI-TOF mass spectrometry.
Three studies (Tisell et al., 2013; Davis and Liu, 2015; Poddighe et al., 2017) measured the change in L-glutamine between HC and people with MS. The study by Aasly et al. (1997) determined a decrease in L-glutamine in the CSF of people with MS when compared to the CSF of HC and found that the levels in people with RRMS decreased when compared to people with chronic progressive MS. The study by Moussallieh et al. (2014) found that there was a decrease of L-glutamine in the serum of people with MS when compared to HC and an increase when compared to people with NMO. The study Poddighe et al. (2017) reported that in plasma, people with MS had increased levels of L-glutamine when compared to HC.
Two studies (Chen and Guillemin, 2009; Lim et al., 2017) reported on the ratio of quinolinic acid (QA)/kynurenic acid (KA) in MS. The study by Aeinehband et al. (2016) found the ratio in CSF increased in people undergoing a relapsing stage of RRMS when compared to people experiencing a remission in RRMS. Similarly, Lim et al. (2017) reported that the ratio of QA/KA in serum increased in people with PPMS and SPMS when compared to healthy controls. QA and KA metabolites are both downstream metabolites of the amino acid tryptophan (essential amino acid).
Carbohydrate Metabolism and Derivatives
Carbohydrates are the primary energy source for the body and are preferentially used by the central nervous system. Carbohydrates are broken down to monosaccharides such as glucose and stored in the body as the polysaccharide, glycogen.
Three studies (Pitt et al., 2000; Yelamanchi et al., 2016; Kim et al., 2017) reported statistically significant results on the level of glucose in people with MS. Two studies (Pitt et al., 2000; Yelamanchi et al., 2016) reported levels of glucose in serum while another study (Kim et al., 2017) reported levels in CSF. All studies reported a decrease of glucose in people with MS when compared to their controls. The study by Dickens et al. (2014) found that people with SPMS had decreased levels of glucose compared to people with RRMS. The study by Kim et al. (2017) found that glucose decreased in people with MS when compared to healthy controls and people with NMO.
Other
Other types of molecules that this review highlighted include ions which enable the flow of electrical signals through the body as well as regulating the osmotic pressure in cells and help maintain the function of muscles and nerve cells. The review also included a study of the fat soluble, Vitamin E (Salemi et al., 2010). The study recorded a decrease in the vitamin in people with MS compared to healthy controls. Vitamin E has many uses in the body including acting as an antioxidant and to boost the immune system.
Three studies (Sinclair et al., 2010; Housley et al., 2015; Kim et al., 2017) all reported a decrease in citrate in the CSF of people with MS. The study by Kim et al. (2017) compared people with MS to healthy controls while Sinclair et al. (2010) compared people with MS to people with IIH and “other diseases,” and Reinke et al. (2014) compared people with MS to non-MS controls.
Quadomics Assessment
The QUADOMICS tool was developed in response to a need to assess studies using “-omics”-based technologies. The selected studies had relatively similar results when assessed by the QUADOMICS tool. Areas where the studies failed to give enough information were as follows: clearly describing the selection criteria, describing in enough detail the execution of the reference standard to permit replication, stating whether the study was blinded, reporting uninterpretable/intermediate test results, and describing whether the presence of overfitting was avoided. An overall score was purposely left absent for each study.
Discussion
A metabolomic biomarker would revolutionize how MS is diagnosed allowing patients to be diagnosed earlier potentially improving their prognosis as lifestyle changes and disease modifying therapies could be started earlier, reducing the extent of neurological damage (Noyes and Weinstock-Guttman, 2013). Metabolomic biomarkers may also give a clearer indication of disease progression and treatment efficacy, allowing treatments to be changed if they are not effective.
This systematic review assessed studies that sought to find biomarkers capable of predicting MS disease onset and/or progression. Using our comprehensive search criteria, the number of biomarkers identified as being relevant to MS was extensive. Twenty eight papers met pre-set criteria for inclusion in the study. The heterogeneity of study designs and outcome measures limited analysis to a narrative synthesis. Unfortunately, very few studies shared similar outcomes when they measured the same metabolite. This could be due to MS disease heterogeneity as well as previously mentioned technical and chemometric limitations, variability in the sample cohorts, and/or differences in the classification criteria. A clear example of this was the metabolite beta-hydroxybutyrate, a small ketone body derived from fatty acid oxidation (Newman and Verdin, 2014). Six studies published data on this metabolite, half suggesting it increased in people with MS and the other half suggesting it decreased.
Eight studies compared people with MS to people with other neurological diseases such as NMO and CIS. While these studies did not always contain healthy controls, reducing the power of their findings, their results are important as current markers of disease are general inflammatory markers and not specific to MS. Metabolites that are discussed below were studied by more than one group.
Glutamate is a non-essential amino acid and has multiple functions in the body. Glutamate is an excitatory neurotransmitter in the central nervous system and acts as a precursor molecule for the synthesis of other metabolites and as a substrate in the synthesis of amino acids (Yelamanchi et al., 2016). The study by Sinclair et al. (2010) found that the concentration of L-glutamate in CSF was increased in MS when compared to people with IIH and “other diseases,” while Moussallieh et al. (2014) found that people with NMO had increased levels of glutamate when compared to people with MS. These results where replicated in the CSF of people with MS compared to healthy controls (Checa et al., 2015) and in the serum of people with MS compared to healthy controls (Pieragostino et al., 2015). It is not clear from these studies whether the levels of glutamate are similar in people with IIH, NMO, and healthy controls as parameters were different in each study. These data suggest that glutamate could have the potential to differentiate people with MS from other neurological, inflammatory conditions. Studies have investigated glutamate excitotoxicity contributing to lesions characteristic of MS in an animal model of MS and have inferred that it may be an important mechanism in human autoimmune demyelination (Pitt et al., 2000; Matute et al., 2001). The increase in glutamate is also consistent with findings by Srinivasan and Tisell who found that glutamate concentrations were higher in MRI scans of normal-appearing white matter in MS patients compared to healthy controls (Srinivasan et al., 2005; Tisell et al., 2013).
The precursor and main source for glutamate in the brain is glutamine (Tapiero et al., 2002). The three studies that measured glutamine produced variable results; however, this could be because three different mediums were used to measure the metabolite. Levels of glutamine were decreased in CSF (Hon et al., 2011) possibly due to an increase in glutamate consuming its precursor. As with other results, follow-up studies will need to be conducted to determine whether glutamine/glutamate metabolism can be used to produce a reliable biomarker of disease.
All three studies that published data on the concentration of glucose in people with MS reported a decrease when compared to healthy controls and people with NMO. It has been theorized that glucose metabolism is affected in people with MS (Mathur et al., 2014). Perturbed glucose metabolism has been discovered in other neurological disorders including Alzheimer’s, Parkinson’s, and Huntington’s diseases (Mathur et al., 2014). Alterations in the levels of citrate in people with MS compared to HC is further evidence that glucose metabolism could be perturbed in people with MS. All three studies reported that people with MS had a decrease in citrate.
The differences in glutamate and glutamine may also be related to the results involving the kynurenine pathway. The kynurenine pathway is the metabolic path of tryptophan to produce nicotinamide adenine dinucleotide (NAD) (Davis and Liu, 2015). NAD is a vital cofactor that regulates glucose metabolism acting as an electron transfer molecule in the electron transport chain. Given the recent interest in NAD and its link with aging and metabolic disease, especially as described by Chini et al., it may be worthwhile to further explore the role of NAD both in the treatment and pathogenesis of MS (Verdin, 2015).
By-products of the pathway include quinolinic acid (QA) and kynurenic acid (KA). QA is an amino acid that activates the NMDA receptor on excitatory neurons, causing the neurotransmitter glutamate to be released and uptake inhibited (Chen and Guillemin, 2009). KA is a NMDA receptor antagonist, blocking the excitotoxic effects of QA (Lim et al., 2017). KA also has antioxidant effects and is neuroprotective (Lim et al., 2017). Studies by Aeinehband et al. (2016) reported alterations in the ratio of QA/KA in people with MS, indicating abnormal kynurenine pathway metabolism in people with MS. Aeinehband reported an increase in the ratio in CSF of people with RRMS who were experiencing a relapsing phase, compared to people in a remitting phase. Lim found that the ratio of QA/KA increased in the serum people with PPMS and SPMS compared to healthy controls and that people with RRMS had higher levels of KA. These data, together with findings by Cocco et al. (2015) that suggest decreased levels of tryptophan in the serum of people with MS, indicate an increase in the activity of the kynurenine pathway in people with MS.
Three studies (Chen and Guillemin, 2009; Cocco et al., 2015; Lim et al., 2017) used multiple cohorts to validate their results. The first cohort of samples was used to measure differences in metabolic profiles between people with MS and healthy controls so that a model could be developed to test in the second cohort. Sinclair et al. (2010) reported that the model generated from the first cohort identified patients with MS in the second cohort with 67% sensitivity and 75% specificity. Lim et al. (2017) used six predictors, with QA and KA being the most important, to develop a model that had a prediction accuracy of 83% when validating HC, RRMS, and SPMS from another cohort. The kynurenine pathway also is altered in patients with systemic lupus erythematosus (SLE) and associated with severe fatigue (Akesson et al., 2018), limiting its ability to differentiate MS from people with other autoimmune diseases.
The study by Dickens et al. (2014) produced a model that differentiated people with RRMS from people with SPMS using metabolomics and partial least squares discriminant analysis (PLS-DA) of biofluids. Unfortunately, due to the small sample size, the model was not able to differentiate people with SPMS from PPMS. While the sample sizes were small in these studies, the idea of generating a model from multiple differences in metabolites has merit and should be explored further.
Strengths and Limitations
The strength of this review is that it used comprehensive search criteria, resulting in a large sample of studies to be reviewed. The studies included in this review all include patients with clinically confirmed MS; however, the exclusion criteria could have been more clearly defined. Due to the small sample sizes and limited follow-up studies, the power of this review was diminished and recommendations based on inferential statistics cannot be made. While every study featured patients clinically diagnosed with MS, the diagnosis classification used varied between studies and many did not differentiate between the different phenotypes of MS. Furthermore, our analysis did not factor the participants’ age and gender into the analysis. In addition, many studies did not stand up to the rigor of the QUADOMICS tool, particularly those where samples were taken from biobanks, as not enough information was provided. This could be explained due to the fact that many of the studies assessed were not necessarily diagnostic, which is what the tool was designed for. In retrospect, the tool could have been modified to suit the types of studies that were assessed. It is advised that future “-omics”-based studies keep the QUADOMICS tool in mind when conducting and publishing studies as a few small inclusions would have resulted in more positive scores on the test. A considerable limitation was the exclusion of studies that focused on the “lipid profile.” This was considered due to the large number of studies that analyzed the basic lipid profile, which we defined as cholesterol (both high-density lipoprotein and low-density lipoprotein) and triglycerides. It is intended that a follow-up study will be completed that focuses on studies involving the lipid profile.
Conclusion
Several promising candidate biomarkers suitable for clinical application in MS have been studied.
The studies that showed the most promise were those pertaining to glucose metabolism, glutamate, and tryptophan metabolism, specifically the kynurenine pathway. Kynurenine pathway metabolites have been identified as possible biomarkers for inflammatory diseases and neurodegenerative diseases such as amyotrophic lateral sclerosis (ALS) and Alzheimer’s, Parkinson’s, and Huntington’s diseases (Nemeth and Vecsei, 2006). QA could potentially be used to not only assist diagnosis of MS but also subtype it. The investigation by Lim et al. (2017) found that QA was found in higher concentrations in PPMS compared with SPMS which was higher than RRMS. Furthermore, analyzing the ratio between KA/QA enabled the team, with a high degree of certainty, to model and predict different subtypes of MS with a high sensitivity.
It is recommended that a large age- and gender-matched study that compares the different phenotypes of MS (RRMS, SPMS, and PPMS) to a healthy control utilizing an easily accessible fluid such as serum should be carried out focusing primarily on glucose metabolism, and the kynurenine pathway to validate the results of Lim et al. (2017)
While a single metabolite that could act as a biomarker of disease status is the ideal scenario, a model generated from multiple biomarkers involved in a variety of metabolomic processes may be the best possibility for a conclusive diagnostic test for MS. The identification of a biomarker, or a model from multiple metabolomic biomarkers, that can correctly diagnose MS and determine response to treatment may result in better outcomes for people diagnosed with this debilitating disease.
Author Contributions
GJ, TW, AL, CB, and LP conceived the project. LP drafted the manuscript. TW supervised the lead author LP and AS and provided extensive comments on drafts. LP and AS undertook abstract reviews, full-text reviews, and quality appraisals. CB screened full-length manuscript for relevance. CL and KJ undertook quality appraisal of technical areas (Quadomics tool item 10). All authors contributed to editing and approved the final manuscript.
Funding
GJ, TW, AL, and CB were all working in the Neuroepidemiology Unit, funded by philanthropic donations from a variety of sources.
Conflict of Interest
The authors declare that the research was conducted in the absence of any commercial or financial relationships that could be construed as a potential conflict of interest.
Abbreviations
MS, Multiple Sclerosis; RRMS, Relapsing Remitting MS; SPMS, Secondary Progressive MS; PPMS, Primary Progressive MS; CIS, Clinically Isolated Syndrome; OCB, Oligoclonal Bands; CSF, Cerebrospinal Fluid; NMR, Nuclear Magnetic Resonance; MeSH, Medical Subject Heading; OND, Other Neurological Disorder; NMO, Neuromyelitis Optica; HC, Healthy Control; IIH, Idiopathic Intracranial Hypertension; QA, Quinolinic Acid; KA, Kynurenic Acid; PLS-DA, Partial Least Squares Discriminant Analysis; SLE, Systemic Lupus Erythematosus.
References
Aasly, J., Garseth, M., Sonnewald, U., Zwart, J. A., White, L. R., and Unsgard, G. (1997). Cerebrospinal fluid lactate and glutamine are reduced in multiple sclerosis. Acta Neurol. Scand. 95, 9–12. doi: 10.1111/j.1600-0404.1997.tb00060.x
Aeinehband, S., Brenner, P., Stahl, S., Bhat, M., Fidock, M. D., Khademi, M., et al. (2016). Cerebrospinal fluid kynurenines in multiple sclerosis; relation to disease course and neurocognitive symptoms. Brain Behav. Immun. 51, 47–55.
Akesson, K., Pettersson, S., Stahl, S., Surowiec, I., Hedenstrom, M., Eketjall, S., et al. (2018). Kynurenine pathway is altered in patients with SLE and associated with fatigue. Lupus Sci. Med. 23:2018.
Augutis, K., Axelsson, M., Portelius, E., Brinkmalm, G., Andreasson, U., Gustavsson, M. K., et al. (2013). Cerebrospinal fluid biomarkers of beta-amyloid metabolism in multiple sclerosis. Mult. Scler. 19, 543–552. doi: 10.1177/1352458512460603
Bystricka, Z., Laubertova, L., Durfinova, M., and Paduchova, Z. (2017). Methionine metabolism and multiple sclerosis. Biomarkers 22, 747-754.
Checa, A., Khademi, M., Sar, D. G., Haeggstrom, J. Z., Lundberg, J. O., Piehl, F., et al. (2015). Hexosylceramides as intrathecal markers of worsening disability in multiple sclerosis. Mult. Scler. 21, 1271–1279. doi: 10.1177/1352458514561908
Chen, Y., and Guillemin, G. J. (2009). Kynurenine pathway metabolites in humans: disease and healthy States. Int. J. Tryptophan. Res. 2, 1–19.
Cocco, E., Federica, M., Lorena, L., Luigi, B., and Simone, P. (2015). H-NMR analysis provides a metabolomic profile of patients with multiple sclerosis. Neurol. Neuroimmunol. Neuroinflamm. 3:e185. doi: 10.1212/nxi.0000000000000185
Davis, I., and Liu, A. (2015). What is the tryptophan kynurenine pathway and why is it important to neurotherapeutics? Exp. Rev. Neurother. 15, 719–721. doi: 10.1586/14737175.2015.1049999
Del Boccio, P., Pieragostino, D., Di Ioia, M., Petrucci, F., Lugaresi, A., De Luca, G., et al. (2011). Lipidomic investigations for the characterization of circulating serum lipids in multiple sclerosis. J. Proteom. 74, 2826–2836. doi: 10.1016/j.jprot.2011.06.023
Dickens, A. M., Larkin, J. R., Griffin, J. L., Cavey, A., Matthews, L., Turner, M. R., et al. (2014). A type 2 biomarker separates relapsing-remitting from secondary progressive multiple sclerosis. Neurology 83, 1492–1499. doi: 10.1212/wnl.0000000000000905
Dunn, W. B., Broadhurst, D. I., Atherton, H. J., Goodacre, R., and Griffin, J. L. (2011). Systems level studies of mammalian metabolomes: the roles of mass spectrometry and nuclear magnetic resonance spectroscopy. Chem. Soc. Rev. 40, 387–426. doi: 10.1039/b906712b
EfendÝ, H. (2015). Clinically Isolated Syndromes: Clinical Characteristics, Differential Diagnosis, and Management. Nöro. Psikiyatri. Arşivi. 52, S1–S11.
Gebregiworgis, T., Nielsen, H. H., Massilamany, C., Gangaplara, A., Reddy, J., Illes, Z., et al. (2016). A Urinary Metabolic Signature for Multiple Sclerosis and Neuromyelitis Optica. J. Proteome. Res. 15, 659–666. doi: 10.1021/acs.jproteome.5b01111
Hon, G. M., Hassan, M. S., Rensburg, S. J., Abel, S., Marais, D. W., van Jaarsveld, P., et al. (2009b). Erythrocyte membrane fatty acids in patients with multiple sclerosis. Mult. Scler. 15, 759–762. doi: 10.1177/1352458509103321
Hon, G. M., Hassan, M. S., van Rensburg, S. J., Abel, S., Erasmus, R. T., and Matsha, T. (2009a). Membrane saturated fatty acids and disease progression in multiple sclerosis patients. Metab. Brain Dis. 24, 561–568. doi: 10.1007/s11011-009-9159-0
Hon, G. M., Hassen, M. S., Abel, S., Erasmus, S., and Matsha, R. (2011). Janse van Rensburg. Neurol. Asia 16, 217–222.
Housley, W. J., Pitt, D., and Hafler, D. A. (2015). Biomarkers in multiple sclerosis. Clin. Immunol. 161, 51–58.
Kim, H. H., Jeong, I. H., Hyun, J., Kong, B. S., Kim, H. J., and Park, S. J. (2017). Metabolomic profiling of CSF in multiple sclerosis and neuromyelitis optica spectrum disorder by nuclear magnetic resonance. PLoS One 12:e0181758. doi: 10.1371/journal.pone.0181758
Lazzarino, G., Amorini, A. M., Eikelenboom, M. J., Killestein, J., Belli, A., Di Pietro, V., et al. (2010). Cerebrospinal fluid ATP metabolites in multiple sclerosis. Mult. Scler. 16, 549–554.
Lim, C. K., Bilgin, A., Lovejoy, D. B., Tan, V., Bustamante, S., Taylor, B. V., et al. (2017). Kynurenine pathway metabolomics predicts and provides mechanistic insight into multiple sclerosis progression. Sci. Rep. 7:41473.
Lotsch, J., Thrun, M., Lerch, F., Brunkhosrt, R., Schiffmann, S., Thomas, D., et al. (2017). Machine-Learned Data Structures of Lipid Marker Serum Concentrations in Multiple Sclerosis Patients Differ from Those in Healthy Subjects. Int. J. Mol. Sci. 18:1217. doi: 10.3390/ijms18061217
Lublin, F. D., Reingold, S. C., Cohen, J. A., Cutter, G. R., Sorensen, P. S., Thompson, A. J., et al. (2014). Defining the clinical course of multiple sclerosis: the 2013 revisions. Neurology 83, 278–286.
Lumbreras, B., Porta, M., Marquez, S., Pollan, M., Parker, L. A., and Hernandez-Aguado, I. (2008). QUADOMICS: an adaptation of the Quality Assessment of Diagnostic Accuracy Assessment (QUADAS) for the evaluation of the methodological quality of studies on the diagnostic accuracy of ‘-omics’-based technologies. Clin. Biochem. 41, 1316–1325. doi: 10.1016/j.clinbiochem.2008.06.018
Mathur, D., Lopez-Rodas, G., Casanova, B., and Marti, M. B. (2014). Perturbed glucose metabolism: insights into multiple sclerosis pathogenesis. Front. Neurol. 5:250. doi: 10.3389/fneur.2014.00250
Matute, C., Alberdi, E., Domercq, M., Perez-Cerda, F., Perez-Samartin, A., and Sanchez-Gomez, M. V. (2001). The link between excitotoxic oligodendroglial death and demyelinating diseases. Trends Neurosci. 24, 224–230. doi: 10.1016/s0166-2236(00)01746-x
McDermott, J. E., Wang, J., Mitchell, H., Webb-Robertson, B., Hafen, R., Ramey, J., et al. (2013). Challenges in Biomarker Discovery: Combining Expert Insights with Statistical Analysis of Complex Omics Data. Exp. Opin. Med. Diagn. 7, 37–51. doi: 10.1517/17530059.2012.718329
McDonald, W. I., Compston, A., Goodkin, D., Hartun, H. P., Lublin, F. D., McFarland, H. F., et al. (2001). Recommended diagnostic criteria for multiple sclerosis: guidelines from the International Panel on the diagnosis of multiple sclerosis. Ann. Neurol. 50, 121–127. doi: 10.1002/ana.1032
Moher, D., Liberati, A., Tetzlaff, J., and Altman, D. G. (2009). PRISMA Group., Preferred reporting items for systematic reviews and meta-analyses: the PRISMA statement. Ann. Intern. Med. 151, 264–269. doi: 10.7326/0003-4819-151-4-200908180-00135
Moussallieh, F. M., Elbayed, K., Chanson, J. B., Rudolf, G., Piotto, M., De Seze, J., et al. (2014). Serum analysis by 1H nuclear magnetic resonance spectroscopy: a new tool for distinguishing neuromyelitis optica from multiple sclerosis. Mult. Scler. 20, 558–565. doi: 10.1177/1352458513504638
Moyano, A. L., Pituch, K., Li, G., Breeman, R., Mansson, J. E., and Givogri, M. I. (2013). Levels of plasma sulfatides C18 : 0 and C24 : 1 correlate with disease status in relapsing-remitting multiple sclerosis. J. Neurochem. 127, 600–604. doi: 10.1111/jnc.12341
Narayanaswamy, R., Iyver, V., Khare, P., Bodziak, M. L., Badgett, D., Zivadinov, R., et al. (2015). Simultaneous determination of oxysterols, cholesterol and 25-hydroxy-vitamin D3 in human plasma by LC-UV-MS. PLoS One 10:e0123771. doi: 10.1371/journal.pone.0123771
Navarro, X., and Segura, R. (1988). Plasma lipids and their fatty acid composition in multiple sclerosis. Acta Neurol. Scand. 78, 152–157. doi: 10.1111/j.1600-0404.1988.tb03637.x
Nemeth, H., and Vecsei, J. (2006). Kynurenines, Parkinson’s disease and other neurodegenerative disorders: preclinical and clinical studies. J. Neural. Transm. Suppl. 70, 285–304. doi: 10.1007/978-3-211-45295-0_45
Newman, J. C., and Verdin, E. (2014). beta-hydroxybutyrate: much more than a metabolite. Diabetes Res. Clin. Pract. 106, 173–181. doi: 10.1016/j.diabres.2014.08.009
Noyes, K., and Weinstock-Guttman, B. (2013). Impact of diagnosis and early treatment on the course of multiple sclerosis. Am. J. Manag. Care 19, s321– s331.
Park, S. J., Jeong, I. H., Kong, B. S., Lee, J. E., Kim, K. H., Lee, D. Y., et al. (2016). Disease Type- and Status-Specific Alteration of CSF Metabolome Coordinated with Clinical Parameters in Inflammatory Demyelinating Diseases of CNS. PLoS One 11:e0166277. doi: 10.1371/journal.pone.0166277
Pieragostino, D., D’Alessandro, M., Ioia, M. D., Rossi, C., Zucchelli, M., Urbani, E., et al. (2015). An integrated metabolomics approach for the research of new cerebrospinal fluid biomarkers of multiple sclerosis. Mol. Biosyst. 11, 1563–1572. doi: 10.1039/c4mb00700j
Pitt, D., Werner, P., and Raine, C. S. (2000). Glutamate excitotoxicity in a model of multiple sclerosis. Nat. Med. 6, 67–70. doi: 10.1038/71555
Poddighe, S., Murgia, F., Lorefice, L., Liggi, S., Cocco, E., Marrosu, M. G., et al. (2017). Metabolomic analysis identifies altered metabolic pathways in Multiple Sclerosis. Int. J. Biochem. Cell Biol. 93, 148–155. doi: 10.1016/j.biocel.2017.07.004
Pruss, H., Rosche, B., Sullivan, A. B., Brommer, B., Wengert, O., Gronert, K., et al. (2013). Proresolution lipid mediators in multiple sclerosis - differential, disease severity-dependent synthesis - a clinical pilot trial. PLoS One 8:e55859. doi: 10.1371/journal.pone.0055859
Raphael, I., Webb, J., Stuve, O., Haskins, W. E., and Forsthuber, T. G. (2015). Body fluid biomarkers in multiple sclerosis: how far we have come and how they could affect the clinic now and in the future. Exp. Rev. Clin. Immunol. 11, 69–91. doi: 10.1586/1744666x.2015.991315
Regenold, W. T., Phatak, P., Makley, M. J., Stone, R. D., and Kling, M. A. (2008). Cerebrospinal fluid evidence of increased extra-mitochondrial glucose metabolism implicates mitochondrial dysfunction in multiple sclerosis disease progression. J. Neurol. Sci. 275, 106–112. doi: 10.1016/j.jns.2008.07.032
Reinke, S. N., Broadhurst, D. L., Sykes, B. D., Baker, G. B., Catz, I., Warren, K. G., et al. (2014). Metabolomic profiling in multiple sclerosis: insights into biomarkers and pathogenesis. Mult. Scler. 20, 1396–1400. doi: 10.1177/1352458513516528
Salemi, G., Concetta Gueli, M., Vitale, F., Battaglieri, F., Guglielmini, E., Ragonese, P., et al. (2010). Blood lipids, homocysteine, stress factors, and vitamins in clinically stable multiple sclerosis patients. Lipids. Health Dis. 9:19. doi: 10.1186/1476-511x-9-19
Sinclair, A. J., Viant, M. R., Ball, A. K., Burdon, M. A., Walker, E. A., Stewart, P. M., et al. (2010). NMR-based metabolomic analysis of cerebrospinal fluid and serum in neurological diseases–a diagnostic tool? NMR Biomed. 23, 123–132.
Srinivasan, R., Sailasuta, N., Hurd, R., Nelson, S., and Pelletier, D. (2005). Evidence of elevated glutamate in multiple sclerosis using magnetic resonance spectroscopy at 3 T. Brain 128, 1016–1025. doi: 10.1093/brain/awh467
Sternberg, Z., Hennies, C., Sternberg, D., Bistulfi, G. L., Kazim, L., Benedict, R. H. B., et al. (2011). Plasma pentosidine: a potential biomarker in the management of multiple sclerosis. Mult. Scler. 17, 157–163. doi: 10.1177/1352458510384123
Tapiero, H., Mathe, G., Couvreur, R., and Tew, K. D. II (2002). Glutamine and glutamate. Biomed. Pharmacother. 56, 446–457.
Tisell, A., Leinhard, O. D., Warntjes, J. B. M., Aalto, A., Smedby, O., Landtblom, A., et al. (2013). Increased concentrations of glutamate and glutamine in normal-appearing white matter of patients with multiple sclerosis and normal MR imaging brain scans. PLoS One 8:e61817. doi: 10.1371/journal.pone.0061817
Verdin, E. (2015). NAD+ in aging, metabolism, and neurodegeneration. Science 350, 1208–1213. doi: 10.1126/science.aac4854
Vergara, D., D’Alessandro, M., Rizeello, A., De Riccardis, L., Lunetti, P., Del Boccio, P., et al. (2015). A lipidomic approach to the study of human CD4(+) T lymphocytes in multiple sclerosis. BMC Neurosci. 16:46. doi: 10.1186/s12868-015-0183-1
Yelamanchi, S. D., Jayaram, S., Thomas, J. K., Gundimeda, S., Khan, A. A., Singhal, A., et al. (2016). A pathway map of glutamate metabolism. J. Cell Commun. Sign. 10, 69–75. doi: 10.1007/s12079-015-0315-5
Keywords: metabolomics, MS, multiple sclerosis, multiple sclerois and neuroimmunology, systematic (literature) review, biomarker, neuroimmunological disease, metabolomics (OMICS)
Citation: Porter L, Shoushtarizadeh A, Jelinek GA, Brown CR, Lim CK, de Livera AM, Jacobs KR and Weiland TJ (2020) Metabolomic Biomarkers of Multiple Sclerosis: A Systematic Review. Front. Mol. Biosci. 7:574133. doi: 10.3389/fmolb.2020.574133
Received: 19 June 2020; Accepted: 27 October 2020;
Published: 14 December 2020.
Edited by:
Martin Giera, Leiden University Medical Center, NetherlandsReviewed by:
Jetty Chung-Yung Lee, The University of Hong Kong, Hong KongGijs Kooij, VU University Medical Center, Netherlands
Copyright © 2020 Porter, Shoushtarizadeh, Jelinek, Brown, Lim, de Livera, Jacobs and Weiland. This is an open-access article distributed under the terms of the Creative Commons Attribution License (CC BY). The use, distribution or reproduction in other forums is permitted, provided the original author(s) and the copyright owner(s) are credited and that the original publication in this journal is cited, in accordance with accepted academic practice. No use, distribution or reproduction is permitted which does not comply with these terms.
*Correspondence: Lachlan Porter, lachlanporter@iinet.net.au