Analyzing In Silico the Relationship Between the Activation of the Edema Factor and Its Interaction With Calmodulin
 Irène Pitard
 Damien Monet
 Pierre L. Goossens
 Arnaud Blondel1,2
  Thérèse E. Malliavin
- 1Unité de Bioinformatique Structurale, Institut Pasteur and CNRS UMR 3528, Paris, France
- 2Center de Bioinformatique, Biostatistique et Biologie Intégrative, Institut Pasteur and CNRS USR 3756, Paris, France
- 3Ecole Doctorale Université Paris Sorbonne, Paris, France
- 4Institut Pasteur, rue du Dr Roux, Unité Yersinia, Paris, France
Molecular dynamics (MD) simulations have been recorded on the complex between the edema factor (EF) of Bacilllus anthracis and calmodulin (CaM), starting from a structure with the orthosteric inhibitor adefovir bound in the EF catalytic site. The starting structure has been destabilized by alternately suppressing different co-factors, such as adefovir ligand or ions, revealing several long-distance correlations between the conformation of CaM, the geometry of the CaM/EF interface, the enzymatic site and the overall organization of the complex. An allosteric communication between CaM/EF interface and the EF catalytic site, highlighted by these correlations, was confirmed by several bioinformatics approaches from the literature. A network of hydrogen bonds and stacking interactions extending from the helix V of of CaM, and the residues of the switches A, B and C, and connecting to catalytic site residues, is a plausible candidate for the mediation of allosteric communication. The greatest variability in volume between the different MD conditions was also found for cavities present at the EF/CaM interface and in the EF catalytic site. The similarity between the predictions from literature and the volume variability might introduce the volume variability as new descriptor of allostery.
Introduction
As the interactions between proteins are essential in all biological processes, the modulation of these interactions with small ligands is a promising direction (Morelli et al., 2011; Tuffery and Derreumaux, 2012; Huang, 2014; Zhang et al., 2014; Aguirre et al., 2015; Kuenemann et al., 2015; Fischer et al., 2016; Shin et al., 2017). During the last decade, virtual screening has experienced a turning point where interest has widened from protein active sites to cryptic sites (Beglov et al., 2018; Vajda et al., 2018) not visible in the isolated protein conformation but formed upon ligand binding. These cryptic sites have been proposed to be detected by analysis of protein structures (Kozakov et al., 2015; Cimermancic et al., 2016), by mixed-solvent MD simulations (Ghanakota et al., 2019; Martinez-Rosell et al., 2020) or by biased MD simulations (Comitani and Gervasio, 2018; Sun et al., 2020). Inhibition of protein-protein interactions, search for new cryptic sites and targeting protein function in an allosteric way are three closely related goals. Targeting allostery (Tschammer, 2016; Deredge et al., 2017; Feng et al., 2018; Ni et al., 2019) is particularly suitable in the case of inhibition of protein-protein interactions, because the conformational changes in which allosteric communication plays an important role when establishing the interaction, may create or modify cavities (Goodey and Benkovic, 2008).
Allostery, discovered in the early days of molecular biology (Monod et al., 1965; Koshland et al., 1966) has since then, evolved from a model of discrete protein conformations to a more continuous description of the free energy landscape of proteins (Goodey and Benkovic, 2008; Liu and Nussinov, 2016; Wodak et al., 2019). Consequently, the allostery is nowadays quite often described as being closely connected to the variations of equilibrium between protein conformations. Networks of protein residues have been pointed out to be involved in the transmission of these equilibrium variations (Gur et al., 2013; van den Bedem et al., 2013; Raman et al., 2016). The evolution of allostery description has allowed the emergence of so-called allosteric ligands (Goodey and Benkovic, 2008; Nussinov and Tsai, 2013), for which the binding to the protein has a long-range influence on the protein conformation via residue networks. In this regard, a pioneering approach has been based on a detailed mechanistic simulation of functional motions (Laine et al., 2010a). The allosteric ligands and the associated allosteric pockets attract a lot of attention, because they expand the range of pockets and ligands that could be exploited in effector design by virtual screening studies (Zhang and Nussinov, 2019). In addition, the diversity of allosteric phenomena can be utilized to limit the emergence of resistance mutations in target proteins, making carefully selected allosteric ligands more robust to the appearance of resistance in pathogens.
As a result, numerous methods have been developed for allosteric pocket detection in protein structures (Panjkovich and Daura, 2014; Xu et al., 2018; Ghode et al., 2020; Tan et al., 2020). In particular, it was shown (Ma et al., 2016) that most of the known allosteric site motions show high correlations with corresponding orthosteric site motions, whereas other surface cavities did not. Many of the prediction methods are based on a description of protein structures as an elastic network in which each residue is replaced by the atom Cα and the structure deformations are modeled through a set of springs between these atoms (Panjkovich and Daura, 2014; Guarnera and Berezovsky, 2019). The structure-based statistical mechanical model of allostery (SBSMMA) (Guarnera and Berezovsky, 2019) has been introduced which permits to calculate the free energy variation due to allosteric communication.
In the present work, we investigate the use of molecular dynamics (MD) simulations and bioinformatics approaches to analyze protein-protein interactions, variability of cavities and allostery for one example of protein-protein interaction corresponding to the activation of a virulence factor. The Edema Factor (EF) of Bacillus anthracis is activated in the cytoplasm of the host cell by interacting with the ubiquitous protein calmodulin (CaM). This interaction depends on the level of Ca2+ loaded by CaM, the C terminal lobe of CaM (C-CaM) displaying the highest affinity for ions Ca2+ during the interaction with EF (Ulmer et al., 2003). The EF/CaM complex has been extensively studied by structural biology and biophysical techniques (Drum et al., 2000, 2001, 2002; Shen et al., 2002, 2004a, 2005; Ulmer et al., 2003; Guo et al., 2004, 2008) as well as by molecular modeling (Laine et al., 2008, 2009, 2010a,b, 2012; Martínez et al., 2009). This complex (Figure 1A) represents a very good example of an interaction with induced conformational selection for both partners. Indeed, free CaM in solution displays a very heterogeneous set of conformations, with wide range of relative re-orientations of N terminal (N-CaM) and C terminal (C-CaM) lobes (Bertini et al., 2004; Anthis et al., 2011), whereas CaM in complex with EF is blocked in an extended conformation. Similarly, the inactive state and the activated state of EF display largely different conformations. The helical region (residues 660-800) is moved apart from the CA (residues 292-349 and 490-622) region to allow CaM insertion. A large conformational reorganization of switches A (residues 502-551, purple), B (residues 578-591, cyan), and C (residues 630-659, yellow) also takes place and the catalytic site is reshaped in its active organization (Figure 1A). Strikingly, in switch C two strings β and a connection loop present in the structure of isolated EF are converted to a α helix in the structure of the EF/CaM complex.
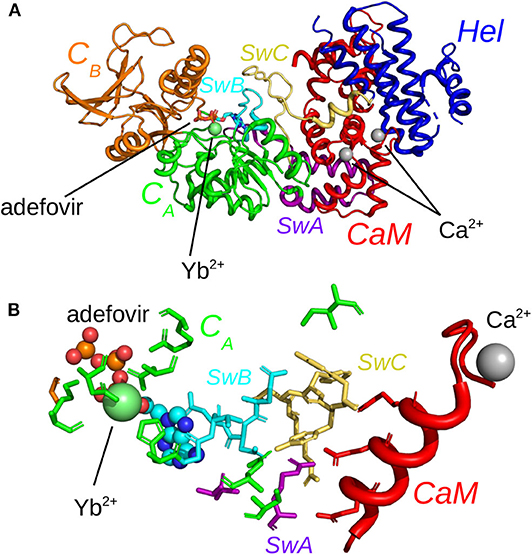
Figure 1. (A) X-ray crystallographic structure (PDB entry: 1PK0) of the complex EF/CaM with the ions Ca2+ colored in gray and the ion Yb2+ colored in lime. The ligand adefovir is drawn in ball-and-sticks, the regions CA (residues 292-349 and 490-622), CB (residues 350-489) and helical (residues 660-800, labeled “Hel” on the figure). of EF are colored in green, orange and blue and CaM is colored in red. The switches A (residues 502-551), B (residues 578-591), and C (residues 630-659), labeled SwA, SwB, and SwC, are colored in purple, cyan, and yellow. The helix V of CaM is colored in salmon. (B) Network of residues in the X-ray crystallographic structure (PDB entry: 1PK0) of the complex EF/CaM connecting residues of the catalytic site to residues of the α helix V of CaM. The ligand adefovir is drawn in spheres. The helix V is drawn in carton. The residues of CaM, region CA and of switches A, B, and C are in the same colors than in (A).
In the literature, both orthosteric and allosteric ligands have been proposed to inhibit EF activity. Several orthosteric inhibitors, binding to the catalytic site, have been discovered (Soelaiman et al., 2003; Shen et al., 2004b; Chen et al., 2009; Taha et al., 2009, 2012; Geduhn et al., 2011). Among them, the ligand adefovir (Shen et al., 2004b) was found by X-ray crystallography to bind in the catalytic site in the presence of an Yb3+ ion coordinated by adefovir as well as by protein residues. On the other hand, the compound 10506-2A has been shown to be an IPPI (inhibitor of protein-protein interaction) and to bind close to the EF helical regions (Lee et al., 2004). Thiophen ureoacid ligands have been discovered following virtual screening on the pocket SABC, formed by residues from the three switches A, B, and C (Laine et al., 2010a). Since it is believed that they do not bind to the enzymatic site of EF, compounds 10506-2A and thiophene ureoacids must by definition bind to an allosteric site.
Here, we propose the following approach to detect protein regions which should be targeted using an allosteric approach to inhibit the activity of EF. Starting from the X-ray crystallographic structure of EF/CaM complex bound to the orthosteric inhibitor adefovir (Shen et al., 2004b), we destabilized it by removing alternatively several co-factors: the ion Mg2+ present in the catalytic site, the ions Ca2+ loaded by CaM or the ligand adefovir. The analysis of the trajectories made it possible to detect a network of hydrogen bonds and stacking interactions, connecting the EF catalytic site and the EF/CaM interface and showing a strong destabilization when the co-factors are removed from the EF/CaM structure. In addition, cavities present in the EF/CaM complex have been tracked along all MD trajectories, and cavity volume variability has been proposed as a method of detecting allosteric pockets. The results obtained by this approach on EF/CaM have been confirmed by analyzes (Xu et al., 2018; Guarnera and Berezovsky, 2019). Therefore, the network of hydrogen bonds and stacking interactions connecting the EF catalytic site and the EF/CaM interface could be considered a plausible candidate for the allosteric communication path within the complex structure.
Materials and Methods
Preparation of the Systems for MD Simulations
The X-ray crystallographic complex of EF with the inhibitor adefovir (Shen et al., 2004b) (PDB entry: 1PK0, Figure 1A) served as the starting point of the MD trajectories. The protein chain was analyzed using Molprobity (Chen et al., 2010) (molprobity.biochem.duke.edu), in order to add hydrogen atoms and to select the sidechains orientations optimizing the network of hydrogen bonds. The ion Yb3+ present in the catalytic site, was replaced by a physiologically compatible ion Mg2+.
The files to perform MD simulations were prepared with the CHARMM GUI interface (www.charmm-gui.org) (Lee et al., 2016; Jo et al., 2017). The chains A and D of the structure 1PK0 were neutralized using potassium ions and solvated with water molecules (Table 1). The loop (residues 675-695) located between helices L and M (Drum et al., 2002) in the helical domain is disordered and not visible in the initial 1PK0 structure. This missing loop was added to the structure using the CHARMM GUI interface. The force field CHARMM36 (MacKerell et al., 1998, 2004; Best et al., 2012) and the TIP3P water model (Jorgensen et al., 1983) were used to model the physical interactions. The parameters for ligand adefovir were obtained using the CHARMM GUI interface (www.charmm-gui.org). with the Ligand Reader and Modeler tool (Kim et al., 2017). Six different systems have been prepared with different molecular compositions, starting from the structure 1PK0 then by removing various co-factors: ions Mg2+, Ca2+ and adefovir (Table 1).
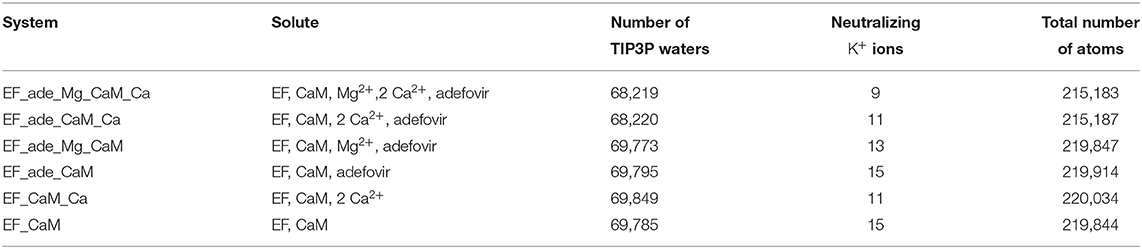
Table 1. Systems composition.
Recording MD Trajectories
The MD trajectories were recorded using NAMD 2.13 (Phillips et al., 2005) (www.ks.uiuc.edu/Research/namd/). The simulations were performed in the NPT ensemble. A cutoff of 12 Å and a switching distance of 10 Å were defined for non-bonded interactions, while long-range electrostatic interactions were calculated with the Particle Mesh Ewald (PME) protocol (Darden et al., 1993). The RATTLE algorithm (Ryckaert et al., 1977; Andersen, 1983) was used to keep all covalent bonds involving hydrogens rigid, enabling a time step of 2 fs. Atomic coordinates were saved every 10 picoseconds. At the beginning of each trajectory, the system was first minimized for 10,000 steps, then heated up gradually from 0 to 300 K in 300,000 integration steps. Then, the system was equilibrated for 50,000 steps. For each of six various conditions (Table 1), two independent trajectories of 200 ns were recorded (named the replicas R1 and R2) and corresponding to a total simulation duration of 2.4 μs.
Analysis of MD Trajectories
The root-mean-square deviations (RMSD, Å) of atomic coordinates, their root-mean-square fluctuations (RMSF, Å), as well as distance and angle analysis between atoms along the recorded trajectories were performed using cpptraj (Roe and TE Cheatham, 2013). Angles between CaM α helix axes were calculated using python scripts based on the python MDAnalysis library (Michaud-Agrawal et al., 2011; Gowers et al., 2016), the helices being defined as CaM regions including residues 8-19 (helix I), 31-37 (helix II), 46-53 (helix III), 66-73 (helix IV), 83-92 (helix V), 103-110 (helix VI), 119-127 (helix VII), 139-145 (helix VIII). The axis of an helix spanning residues n to p is defined as a segment connecting the geometric centers of the atoms Cαn and Cαn+2 and of the atoms Cαp and Cαp+2.
The solvent accessible surfaces of residues along the trajectory were calculated using a python script based on the python MDAnalysis library (Michaud-Agrawal et al., 2011; Gowers et al., 2016) and the software FreeSASA (Mitternacht, 2016). The EF catalytic site surface was defined as the sum of solvent accessible surfaces of EF residues H351, K353, S354, K372, R329, K346, L348, D491, D493, H577, G578, T579, D582, N583, E588, F586, and T548. The surface of the SABC pocket was defined as the sum of the solvent accessible surfaces of EF residues A496, P499, I538, E539, P542, S544, S550, W552, Q553, T579, Q581, L625, Y626, Y627, N629, and N709. The surface of hydrophobic patches are defined according to Yang et al. (2004). The N-CaM patch is formed by the N-CaM residues A10, F12, A15, L18, F19, L32, M36, L39, M51, V55, M71, M72, and M76. The C-CaM patch is formed by the C-CaM residues I85, A88, V91, F92, L105, M109, L112, L116, M124, F141, M144, M145, and A147. The accessible surface was calculated using the Lee-Richards algorithm (Lee and Richards, 1971) with a probe radius of 1.4 Å.
Cavities of the EF/CaM complex were detected using the software mkgridXf (Monet et al., 2019). The cavities are delimited between two surfaces: the inner and out surfaces determined by rolling probes of radii 1.4 and 8 Å on the protein atoms. In addition, allosteric pockets were predicted using the Web server of the PARS approach (Panjkovich and Daura, 2014) (bioinf.uab.cat/cgi-bin/pars-cgi/pars.pl).
Results
The Removal of Co-factors Destabilizes the Organization of the EF/CaM Complex
The evolution of coordinate root-mean-square deviations (RMSD, Å) with respect to the initial conformations of chains A (EF) and D (CaM) in the structure 1PK0 calculated along the trajectories, displays quite similar trends, with a plateau attained in most of the cases, after 50 ns, and located between 4 and 6 Å (Figure 2). The reproducibility of the replicas of a given trajectory has been further analyzed by realizing a clustering on each replica. This clustering was performed using a self-organizing map approach, described in the Supplementary Material. RMSD coordinates were calculated between the representative conformations extracted from clustering by comparing them two by two (Supplementary Figure 1). The average RMSD values between replicas of the same trajectory (yellow cells) are larger than the average RMSD values within each replicas (gray cells), but are mostly smaller than the average RMSD between different trajectories. Interestingly, EF_ade_Mg_CaM_Ca, which corresponds to the full system, displays the smallest RMSD of 3.9 Å between the replicas.
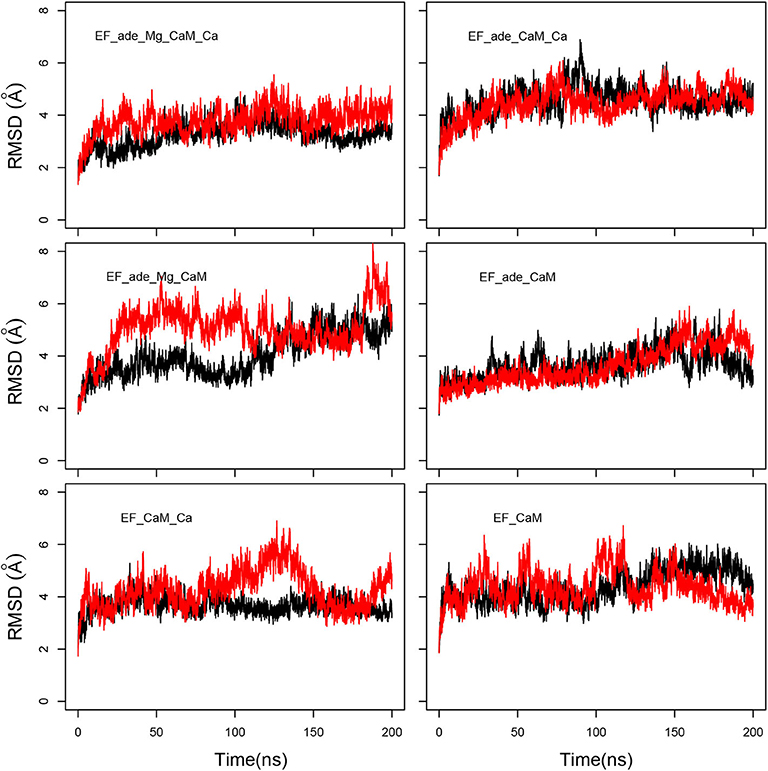
Figure 2. Coordinate root-mean-square deviations (RMSD: Å) of the backbone heavy atoms of EF and CaM with respect to the PDB structure 1PK0, calculated along all trajectories. For each trajectory, the black and red curves correspond to the two replicas R1 and R2.
The coordinate root-mean-square fluctuations (RMSF, Å) (Figure 3) display similar profiles for all trajectories. Unsurprisingly, a certain variability is observed for the peak of fluctuations on the loop (residues 675-695) missing in the initial X-ray crystallographic structure and modeled when preparing the system for molecular dynamics simulation, as described in section 2. Globally, the N-CaM region fluctuates more than the C-CaM region, loaded with Ca2+ ions.
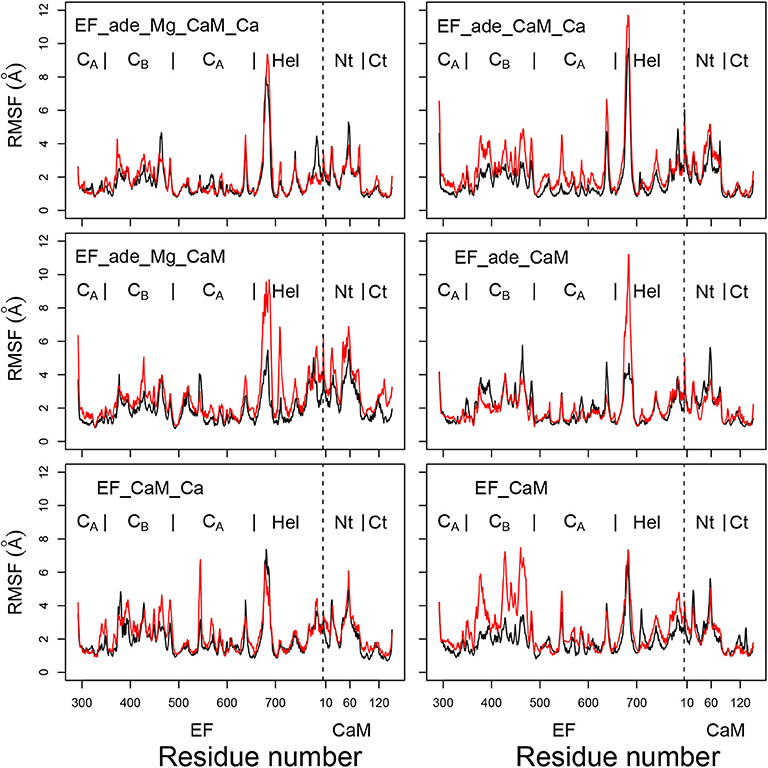
Figure 3. Coordinate root-mean-square fluctuations (RMSF: Å) of the backbone heavy atoms of the complex EF/CaM, each frame being superimposed on the chains A and D of the PDB entry 1PK0. For each trajectory, the black and red curves correspond to replicas R1 and R2. The N terminal residue of CaM is indicated by a vertical dashed line, the EF and CaM regions are labeled on the top of each plot. The N-CaM and C-CaM regions are labeled Nt and Ct for sake of clarity.
Interestingly, the removal of ions does not increase much the mobility provided that the ligand adefovir is still present (trajectory EF_ade_CaM). By contrast, the removal of one type of ion in the presence of the ligand (trajectories EF_ade_CaM_Ca and EF_ade_Mg_CaM) or of the ions and the ligand (trajectory EF_CaM) increases the internal mobility of EF and produces a shift between the replicas. The trajectory EF_CaM_Ca, corresponding to the active toxin ready to interact with adefovir, has an internal mobility similar to that of EF_ade_Mg_CaM_Ca. The similarity of internal mobility for these two EF/CaM complexes mirrors their functional correspondence.
The global shape of the EF/CaM complex was analyzed by monitoring the gyration radius of the complex as well as the bending angle of the central α helix of CaM defined as the angle between the axes of helices IV and V (Figure 4). The gyration radius mainly samples values in the 19–22 Å range, with the exception of EF_ade_Mg_CaM in which the gyration radius vary in the 18–21 Å range (Figure 4, x-axis). Removal of Magnesium (EF_ade_CaM_Ca) or of Calcium (EF_ade_Mg_CaM) ions in the presence of adefovir induces an increase in the range of variations. On the other hand, the removal of the ligand makes it possible to maintain a narrow distribution of values, but shifts the radius of gyration to smaller values, around 19 Å. Thus both ligand and ions have an influence on the complex expansion.
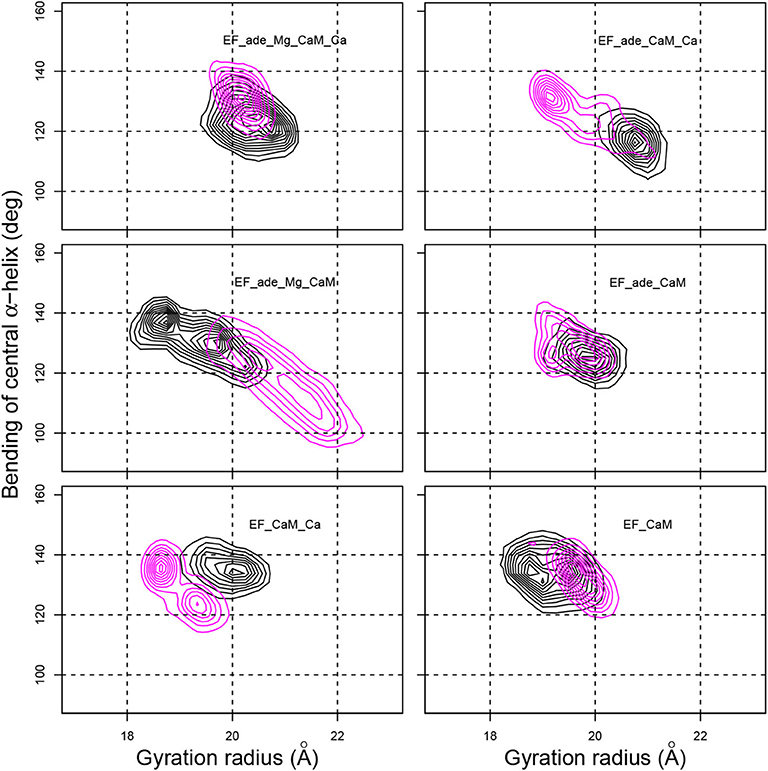
Figure 4. Contour plots describing the variation of the gyration radius (Å) with respect to the bending angle of the CaM central α-helix (deg) determined as the angles between axes of α helices IV (residues 66-73) and V (residues 83-92). The contour lines describe the joint probability distribution of these two parameters. For each trajectory, the black and magenta contours correspond to replicas R1 and R2.
The bending of the central α helix of CaM, monitored as the angle between axes of α helices IV and V (Figure 4, y-axis), is relatively stable around 130° for the full system EF_ade_Mg_CaM_Ca as well as for EF_CaM_Ca and EF_CaM. But, the systems EF_ade_CaM_Ca and EF_ade_Mg_CaM, in which the adefovir is present and only one ion type is conserved show large drifts of angle toward smaller angles down to 100° or larger angles up to 140°. Furthermore, the 2D contour plot describing the joint probability distribution of the gyration radius and the bending angle (Figure 4) reveals a strong correlation between the variations of these two parameters for systems EF_ade_CaM_Ca and EF_ade_Mg_CaM.
The drifts in the bending angle of the central α helix is a sign of a destabilization of the EF/CaM complex. Indeed, CaM displays in the EF/CaM complex a relatively unusual extended conformation (Yamniuk and Vogel, 2004). It was highlighted in Laine et al. (2008) using normal mode analysis of different trajectories recorded on EF/CaM that an exact fit of the extended conformation of CaM to the EF structure is required for the complex stability. Indeed, in the EF/CaM complex, the extended structure of CaM is used to push away the helical domain from the remaining part of EF. The variation of bending angle in CaM central helix has a direct influence on the extension of the conformation of CaM and therefore on its adjustment to the activated EF. On the other hand, the variation of gyration radius of the whole complex corresponds to a major perturbation and perturbs the catalytic site and catalytic activity of EF. Thus the correlation observed between the gyration radius and the bending angle (Figure 4) proves that the fit of extended CaM to the complex EF/CaM has an influence on the EF function.
Overall, the removal of ions induces perturbations in the EF/CaM complex, which displays important conformational changes highlighted by variations of the gyration radius. These perturbations are visible through the atomic fluctuations as well as the correlated variations of gyration radius and CaM central α helix bending. The bending of the central helix α of CaM, due to the local environment, is related to the radius of gyration, describing the general shape of the complex, thus highlighting a long-distance effect.
CaM Conformation Inside the EF/CaM Complex Conserves Features of the Isolated CaM
The CaM conformation will be analyzed and compared to the literature (Crivici and Ikura, 1995) information in order to assess the fitting of CaM to the interaction with EF. CaM is an extremely flexible protein (Bertini et al., 2004; Anthis et al., 2011), its conformation being strongly modulated by the loading of Calcium ions (Finn B.E. et al., 1995; Zhang et al., 1995; Komeiji et al., 2002). This allows CaM to bind various target proteins and peptides involved in the signaling processes (Ikura et al., 1992).
In CaM, the EF-hand domains are helix-loop-helix motifs responsible for Calcium binding. The Calcium ions bound to the C-CaM lobe, are coordinated by the carbonyl oxygen of residue Y99 and side chain carbonyl groups of residues D93, D95, and E104 in the EF-hand 3, and by the carbonyl oxygen of residue Q135 and side chain carbonyl groups of residues D131, D133, and E140 in the EF-hand 4. The average coordination distances reveal that the ions keep similar coordination geometry along all trajectories (Supplementary Table 1). Side chain atoms Oδ from residues D93, D95 and residues D131, D133 show weaker coordination than the other coordinated residues.
It is well-known from the literature that the presence of Calcium ions has a strong influence on the conformation of the isolated CaM. The angles between the α helices of EF hands in CaM increase, as well as the accessible surfaces of hydrophobic patches, upon Calcium loading (Finn B.E. et al., 1995; Zhang et al., 1995; Yamniuk and Vogel, 2004). In addition, in the absence of Calcium ions, the central α helix is more disordered (Barbato et al., 1992; Komeiji et al., 2002). These variations of CaM conformation in the presence of Calcium ions allows a better interaction of CaM with peptides involved in Calcium signaling (Ikura et al., 1992; Crivici and Ikura, 1995).
Using as definition of the hydrophobic patches the residues previously listed in section 2, the surfaces of hydrophobic patches of N-CaM and C-CaM (Figure 5) display quite different trends. The C-CaM patch, corresponding to EF-hands loaded with ions Ca2+, displays profiles mostly concentrated around 200 Å2, with some replica displaying few jumps up to 900 Å2. By contrast, the N-CaM patch show much more diversity spanning a range of 200–600 Å2. Similar trends have been observed for accessible surfaces of methionines in previous simulations of the literature (Yang et al., 2004), with a cumulative exposed surface of N-CaM Met of about 26 Å2 in apo-form and 88 Å2 with Calcium, whereas the C-CaM methionines displayed cumulative exposed surfaces of 45Å2 in apo-form and 124 Å2 with Calcium (Table 4 of Yang et al., 2004). The paradoxical behavior of the C-CaM patch which is blocked at a smaller accessible surface value than the N-CaM patch can be explained by the presence of the CA region of EF which blocks the motions of C-CaM, as C-CaM is inserted between helical domain and CA. At the contrary, one side of N-CaM interacts with the helical domain, whereas the opposite side of N-CaM is free, which allows more mobility of the N-CaM patch. The variations of hydrophobic patches in the complex EF/CaM are not similar to those described for the isolated CaM. Indeed, in the isolated CaM, the variations of hydrophobic patches favor the CaM interaction with signaling peptides, but this aspect is not relevant in the case of EF/CaM interaction.
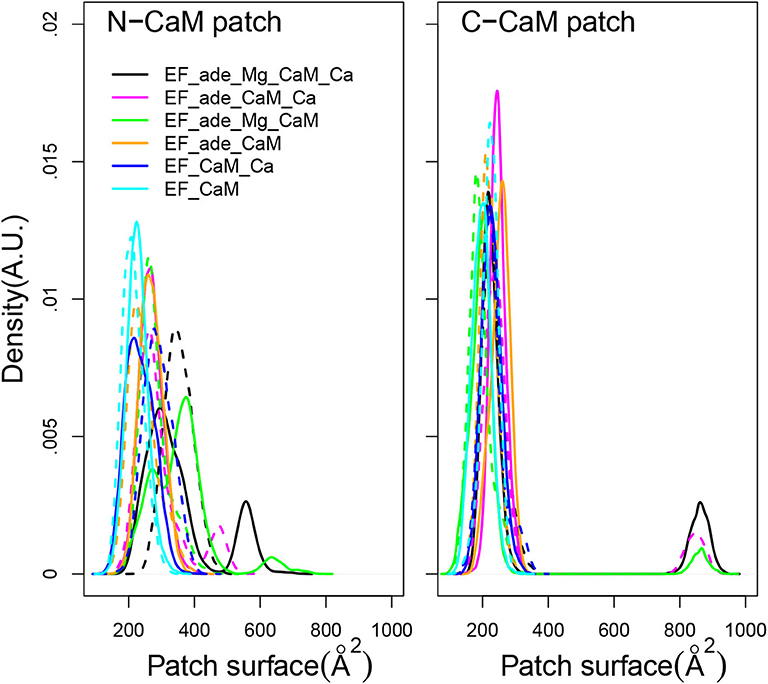
Figure 5. Distribution of accessible surface (Å2) of the hydrophobic patch of N-CaM and C-CaM. The N-CaM patch is defined by the residues A10, F12, A15, L18, F19, L32, M36, L39, M51, V55, M71, M72, M76. The C-CaM patch is defined by the residues I85, A88, V91, F92, L105, M109, L112, L116, M124, F141, M144, M145, A147. For each trajectory, the plain and dashed curves correspond to replicas R1 and R2.
In isolated CaM, EF hands show a trend to open when CaM is loaded with calcium (Finn B.E. et al., 1995; Zhang et al., 1995). Similarly, in previous MD simulations of the EF/CaM complex (Laine et al., 2008), the C-CaM EF-hands, loaded with Ca2+, display more open α helices than the N-CaM EF-hands. Such behavior is also observed in the present simulations (Figure 6). In the present work, the EF-hands 3 and 4, located in C-CaM loaded with Ca2+ ions, display quite stable values around, respectively 80 and 90°, corresponding to open conformations. The EF-hand 4 fluctuates slightly more than the EF-hand 3, specially for some trajectories in which Calcium or Magnesium ions are absent (trajectories EF_ade_CaM and EF_ade_Mg_CaM). By contrast, the angles of EF-hands 1 and 2, located in N-CaM, display much wider variations among trajectories. The angle of EF-hand 1 is located in the 40–80° range for most of the trajectories, corresponding to conformations of the hand oscillating between closed and semi-open configurations. The angle of EF-hand 2 display the largest variations in the range 20–80°. For EF_ade_Mg_CaM trajectories (green curves), the EF-hand 2 explores open conformations with angles larger than 80° and, for one replica of EF_ade_Mg_CaM_Ca (black curves), EF_ade_CaM (yellow curves), and EF_CaM (cyan curves), displays equilibrium between closed and semi-open conformations. These EF-hands are located in the N-CaM lobe, which is not loaded with Calcium ions and interacts also in a much less intricate way with EF as only one side of N-CaM interacts with EF helical domain. For these two reasons, the angles between the two α helices are much more variable between the different conditions of simulations as well as between replicas of a given condition. In addition, the EF-hand 2 shows greater variability than the EF-hand 1, because it is farther away from the helical domain.
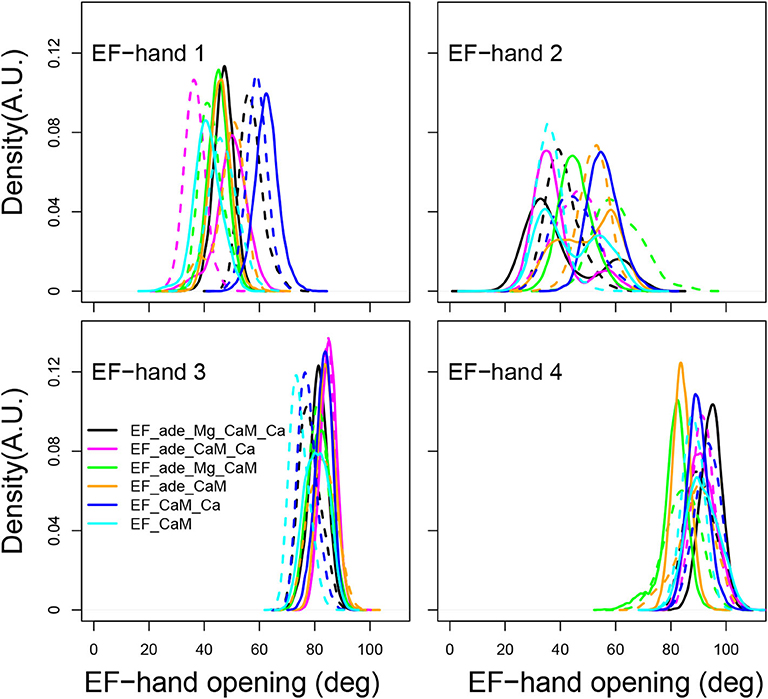
Figure 6. Angle of the EF-hands (deg) calculated between axes of α helices including residues 8-19 (helix I), 31-37 (helix II), 46-53 (helix III), 66-73 (helix IV), 83-92 (helix V), 103-110 (helix VI), 119-127 (helix VII), 139-145 (helix VIII). The angle of EF-hand 1 is the angle between helices I and II. The angle of EF-hand 2 is the angle between helices III and IV. The angle of EF-hand 3 is the angle between helices V and VI. The angle of EF-hand 4 is the angle between helices VII and VIII.
The overview of the CaM conformations reveals that the EF hands of N-CaM, which are not loaded with calcium ions, show much more heterogeneity in conformations, and populate conformations corresponding to closed and semi-open EF hand configurations. Otherwise, the overall conformations of CaM as well as the coordination of calcium are not strikingly modified among the trajectories recorded here.
A Network of Amino-Acid Interactions Connect the EF Catalytic Site With CaM
The EF activity has been investigated according to the accessible surface of the catalytic site, calculated as the sum of solvent accessible surfaces of residues H351, K353, S354, K372, R329, K346, L348, D491, D493, H577, G578, T579, D582, N583, E588, F586, and T548. This accessible surface varies in the 400–1,200 Å2 range (Figure 7, left). This range of values agrees with the average catalytic surfaces of EF previously observed in MD studies (Laine et al., 2008), as: 928 Å2 in the complex with 2 Calcium-loaded CaM, 866 Å2 in the complex with the 4 Calcium-loaded CaM and 501 Å2 in the complex with the apo CaM. Noticeably, in the presence of adefovir (black, yellow, magenta, and green curves) the surfaces are smaller around 400–800 Å2. This corresponds to a more closed catalytic site, in agreement with the inhibitory effect of adefovir. Removal of ion Mg2+ or removal of ions Ca2+ and Mg2+ in the presence of adefovir (magenta and yellow curves) induces a certain shift toward larger values, but the largest shifts toward the 800–1,200 Å2 range, is observed if adefovir is removed (cyan and blue curves). The trajectories EF_CaM_Ca (blue curves) corresponding to the activated EF display the most open catalytic site, which supports the use of accessible surface as an estimator of the EF catalytic activity.
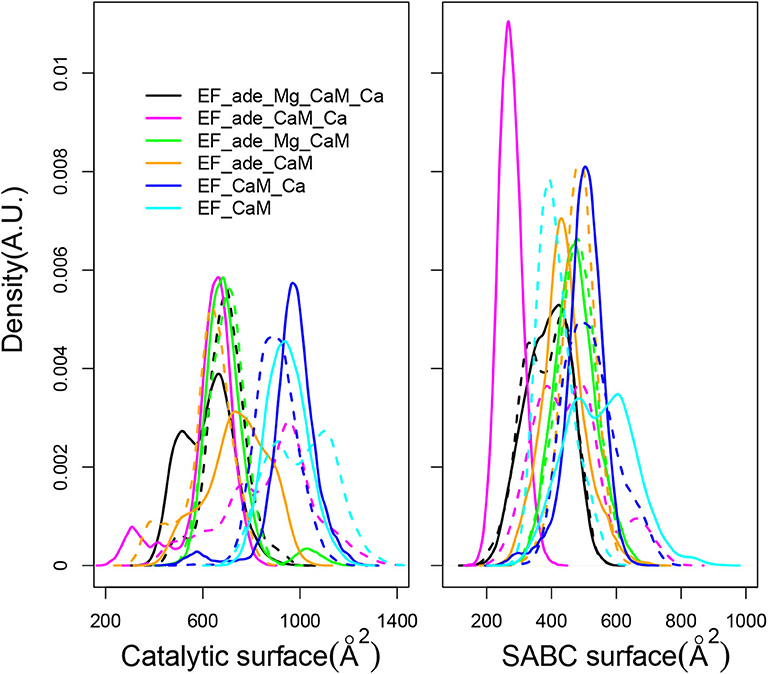
Figure 7. (Left) Distribution of accessible catalytic surface (Å2) of EF, calculated as the sum of the accessible surfaces of residues H351, K353, S354, K372, R329, K346, L348, D491, D493, H577, G578, T579, D582, N583, E588, F586, T548 of EF. (Right) Distribution of accessible surface (Å2) of the pocket SABC, calculated as the sum of the accessible surfaces of residues A496, P499, I538, E539, P542, S544, S550, W552, Q553, T579, Q581, L625, Y626, Y627, N629, and N709 of EF. For each trajectory, the plain and dashed curves correspond to replicas R1 and R2.
The two following aspects concerning the interface between CaM and EF have been analyzed: (i) the accessible surface of the pocket SABC, (ii) the variation of interactions along a residue network spanning from the catalytic site to CaM.
The SABC pocket, previously used for the virtual screening having conducted to the discovery of thiophen ureoacids (Laine et al., 2010a), is formed by residues, A496, P499, I538, E539, P542, S544, S550, W552, Q553, T579, Q581, L625, Y626, Y627, N629, and N709, belonging to the three switches A, B, and C (Drum et al., 2002). The accessible surface of the SABC pocket (Figure 7, right) varies in a much smaller range of 200–800 Å2 than the catalytic pocket. Although the two pockets are defined by a similar number of residues, large differences are nonetheless observed for pocket SABC, sign of significant reorganizations in this region, resulting in some cases in the disappearance of a large accessible surface.
Initial analysis of the X-ray crystallographic structure 1PK0 (Shen et al., 2004b) has revealed a network of hydrogen bonds connecting adefovir and residues from catalytic site with EF residues at the EF/CaM interface and residues from CaM (Figure 1B). This network displays hydrogen bond and stacking interactions which have been monitored along trajectories (Supplementary Table 2). The contacts involve the residues T519, T548, Q553, G578, D582, N583 starting from the catalytic site and expanding to CaM. These residues are located in the switches A (residues 502-551), B (residues 578-591), and C (residues 630-659) (Figure 1B). Interestingly, in the X-ray structures of EF (Drum et al., 2002), these switches undergo a major reorganization between the inactive state and the active state of EF.
Overall, the proportion of formed interactions strongly decreases as soon as ions are removed from the system. In particular, the interactions involving ion Mg2+ are strongly reduced. In the initial X-ray crystallographic structure (PDB entry: 1PK0), the ion Yb3+ is penta-coordinated by three atoms from adefovir (O1-EMA, P3-EMA, O2-EMA) and two atoms from EF (Nϵ2-H577, O-Y492). In the MD trajectories, only the contact between Mg2+ and Nϵ2-H577 is stable along the trajectories EF_ade_CaM_Ca and EF_ade_Mg_CaM (Supplementary Table 2) and only three contacts are still present in the trajectory EF_ade_Mg_CaM_Ca: the ones with O2-ade and Nϵ2-H577 at a significant level and the one with O-Y492 at a negligible frequency. This loss of contacts could be due to the reduction of the charge and of the van der Waals radius between ions Yb3+ and Mg2+.
Among the interactions between adefovir and protein present in the structure 1PK0, only three (hydrogen bonds ade-H6/O-T548, ade-H7/O-T579, and stacking ade/N583) are still present along the trajectory EF_ade_Mg_CaM_Ca. Among them, the stacking between the indole part of adefovir and the aliphatic part of N583 is the only interaction significantly present along all trajectories (Supplementary Table 2). Nevertheless, as soon as the ions are removed from the system, the interaction frequency is reduced in one replica of EF_ade_Mg_CaM (B), EF_ade_CaM_Ca (C), and in all replicas of EF_ade_CaM (D). The adefovir hydrogen bonds conserved with protein mainly involve protons of the amine groups on the indole part. The contacts involving the phosphate group P1 in the structure 1PK0 are completely lost along all trajectories. This destabilization of the adefovir/protein contact and Magnesium contacts as soon as the ion Yb3+ is replaced by the ion Mg2+ could support an artifactual character of the structure 1PK0, in which the stability of adefovir in the catalytic site was obtained by the presence of the non-biological ion Yb3+.
The hydrogen bond and stacking interactions involving EF and CaM residues are reduced between trajectories EF_ade_Mg_CaM_Ca (A) and EF_ade_Mg_CaM (B) and between trajectories EF_ade_CaM_Ca (C) and EF_ade_CaM (D), when the ions Ca2+ are removed from the system. Overall, the removal of Ca2+ ions has more influence to reduce the contact stability as the removal of Mg2+. Indeed, six interactions decrease under a formation percentage of 10% if Ca2+ ions are removed, whereas no interaction decreases below this percentage in the absence of Mg2+. Interestingly, this influence is visible for hydrogen bonds established between the side chain guanidino group of R630 from EF and the side chain carboxyl groups of residues E84 and E87 from CaM, for the hydrogen bond between the sidechains of R540 from EF and the carboxyl groups of E87 from CaM, and also for the stacking between F628 from EF and R90 from CaM. Noticeably, since the CaM residues E84, E87, and R90 are located at the C terminal part of the α helix V, just before the EF-hand 3 in C-CaM, the presence or absence of Ca2+ ions in this lobe has a direct effect on the interaction EF/CaM.
Analysis of the EF/CaM interface, as well as the interactions within the catalytic site, highlight the influence of the variation in the composition of the system on the accessible surface of the catalytic site, impacting the enzymatic activity. In addition, a network of interactions between EF and CaM residues detected in the initial X-ray crystallographic structure, undergo strong destabilization when co-factors are removed: this network could be considered as a plausible communication path for allosteric correlation between CaM and the EF catalytic site.
Analysis of Cavities Deformation to Detect Allosteric Pockets
In this section, we investigate the possibility to use the cavity tracking implemented in the software mkgridXf (Monet et al., 2019) along EF MD trajectories in order to predict allosteric sites in the EF/CaM complex. This approach is motivated by the following reasons. As already quoted in the introduction, several approaches for prediction of allosteric sites are based on a measure of the deformation of the protein described by an elastic network (Panjkovich and Daura, 2014; Guarnera and Berezovsky, 2016) or described by a normal mode perturbation (Greener and Sternberg, 2015). Also, a recent analysis of a large set of protein structures containing ligands showed (Alfayate et al., 2019) that the binding sites of allosteric ligands display larger deformations. Similarly, several bioinformatics approaches predict allosteric pockets as the ones on which ligand binding induces the largest variations in protein structures (Panjkovich and Daura, 2014; Guarnera and Berezovsky, 2019). Allostery has been thus repeatedly associated to larger local or global deformability. Beside, cavity tracking of mkgridXf (Monet et al., 2019) along MD trajectories made possible to correlate deformations of individual cavities to the principal components of the proteins global motions (Desdouits et al., 2015). The association of the observation made by Desdouits et al. (2015) with the literature approaches conducted us to investigate in the present work on the reliability of analyzing the cavity deformation to predict allosteric sites.
A systematic analysis and tracking of the cavities present in the complex was performed along trajectories using mkgridXf (Desdouits et al., 2015; Monet et al., 2019). The cavities were determined by rolling probes as described in section 2. Each cavity was tracked along MD trajectories using a description based on a consensus list of protein atoms delineating the cavities (Monet et al., 2019).
From each trajectory, only proteins EF and CaM have been kept, water molecules, ions and adefovir being removed. One frame every 40 was kept over the time interval 120–200ns of the trajectories EF_ade_CaM_Ca, EF_ade_CaM, EF_ade_Mg_CaM_Ca, EF_ade_Mg_CaM, EF_CaM_Ca and EF_CaM, and then concatenated. The two trajectory replicas series were then analyzed independently with mkgridXf in order to probe the reproducibility of the cavity analyses.
The deformations of protein cavities have been monitored through the variations of their volumes. The volumes of each cavity averaged along each trajectory are plotted as points along the cavity index, the points being colored according to the trajectory (Figure 8). For most of the cavities, the volumes are smaller than 100Å3 for all trajectories. Few of them (indexes #5, #64, #83, #97, #130, #136, #140) display larger volumes up to 2,500Å3 as well as large variations among the various trajectory conditions. The consensus residues defining each of these cavities have been determined using a cutoff of 2.5 on the residue score and are listed in Supplementary Table 3.
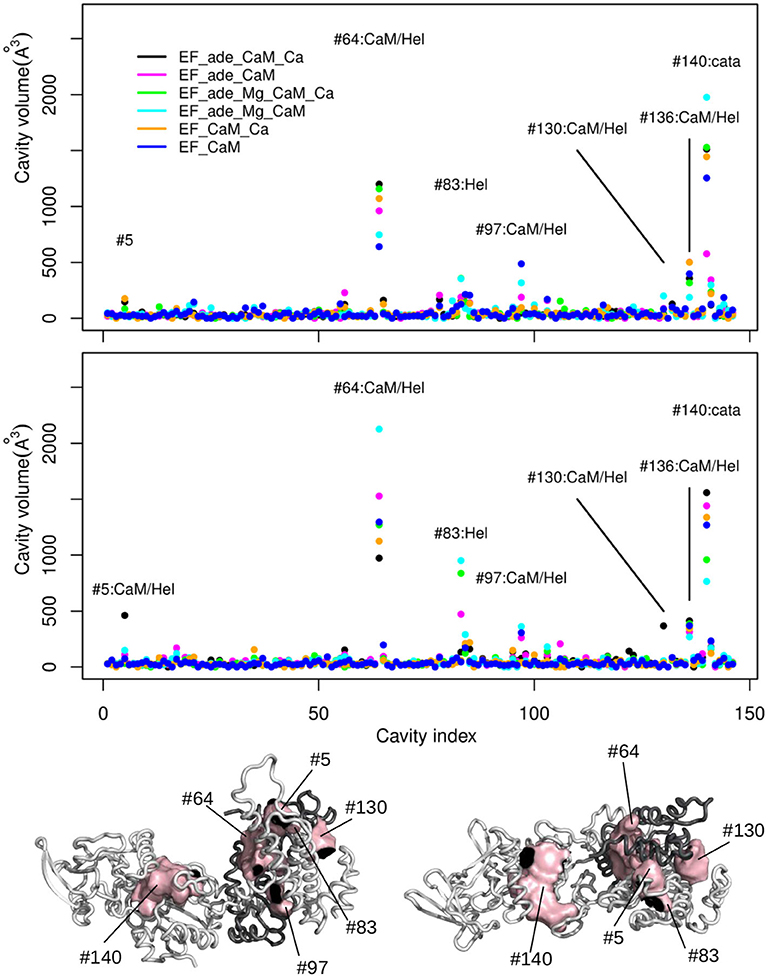
Figure 8. (Top) Averaged volumes (Å3) of the cavities detected by mkgridXf plotted along the cavity index. The two plots correspond to the two replicas series of the trajectories. The points are colored according to the trajectory on which the volume was averaged: EF_ade_CaM_Ca (black), EF_ade_CaM (magenta), EF_ade_Mg_CaM_Ca (green), EF_ade_Mg_CaM (cyan), EF_CaM_Ca (orange), and EF_CaM (blue). The cavities for which at least one volume larger than 250 Å3 has been observed, are labeled with the cavity number and annotated according to the cavity location: Hel, helical domain; cata, catalytic site; Hel/CaM, interaction interface between helical domain and CaM. (Bottom) Opposite views of the complex EF/CaM with CaM colored in dark gray. The cavities labeled on the plots are drawn in surfaces and colored in pink. CaM is colored in dark gray.
For both replicas, the cavity #140, located inside the catalytic site, is among the most variable cavities. Other very variable cavities are located at the interface between different CaM and EF regions. The CaM regions are the EF-hand 1 (#5, #130), the EF-hand 3 (#136), the EF-hand 4 (#97), and the central α-helix (#64). The EF regions are the helical region (#5, #64, #83, #97, #130) and the region CA (#136). Two cavities located at the interface between the EF-hands and the region CA (#97 and #136) display smaller volumes. According to the rationale exposed at the beginning of the section and which we explore on the EF/CaM complex, the “variable cavities” cited above and located at the interface between CaM and different EF regions are allosteric cavity candidates.
In order to probe this proposition, we compared the approach proposed here to current approaches in the literature. The initial conformation of the EF/CaM complex was thus processed with different web servers able to predict druggable or allosteric pockets (Figure 9). The servers PARS (Panjkovich and Daura, 2014), Deepsite (Jiménez et al., 2017), FTMap (Kozakov et al., 2015), POCASA (Yu et al., 2010), and CavityPlus (Xu et al., 2018) were used. Globally, the mkgridXf cavities 140 and 64, located respectively in the catalytic site and at the EF/CaM interface, correspond to predicted druggable pockets. The cavity 130, located in the helical domain, is present in some of the predicted sets of druggable pockets. Then, the server CavityPlus allows to identify the location of allosteric sites, using the CorrSite method (Ma et al., 2016). Using the catalytic site as the orthosteric site, the corresponding allosteric pockets predicted by CavityPlus correspond to the mkgridXf cavities 64, 130, and 83, located at the EF/CaM interface and in the helical domain of EF. To summarize, the set of mkgridXf cavities with large volume variation contain druggable pockets, and three of the mkgridXf cavities are predicted to be allosteric pockets with respect to the catalytic site. This last result supports the existence of an allosteric communication between the EF/CaM interface and the catalytic site.
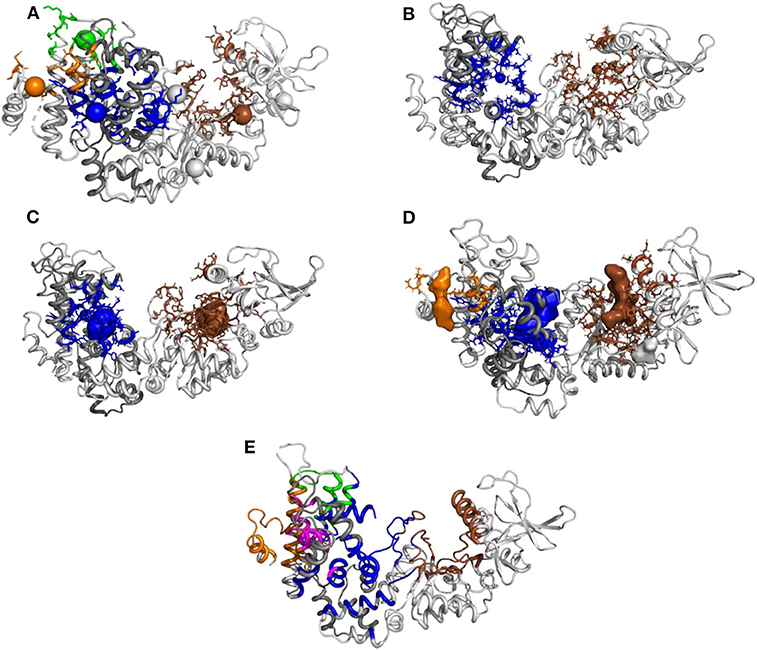
Figure 9. Prediction of pockets druggability or allostery on the initial EF/CaM structure 1PK0 using several methods: (A) PARS (bioinf.uab.cat/cgi-bin/pars-cgi/pars.pl), prediction of the druggable pockets, three of them correspond to mkgridXf cavities: 64 (blue), 130 (orange), and 140 (brown). (B) Deepsite (www.playmolecule.com/deepsite), prediction of two druggable pockets, displaying scores of 0.999 and corresponding to mkgridXf cavities: 64 (blue) and 140 (brown). (C) FTMap (ftsite.bu.edu), prediction of two druggable pockets, corresponding to mkgridXf cavities: 64 (blue) and 140 (brown). (D) POCASA (altair.sci.hokudai.ac.jp/g6/Research/POCASA_e.html), prediction of five druggable pockets, two of them corresponding to the mkgridXf cavity 140 (brown), and two others to the mkgridXf cavities: 64 (blue) and 130 (orange). (E) CavityPlus (www.pkumdl.cn:8000/cavityplus/index.php), prediction of the allosteric pockets influenced by the orthosteric pocket located in the catalytic site (brown). Four allosteric pockets are predicted with the corresponding scores: Cavity1 (3.36), Cavity5 (1.50), Cavity10 (0.75), Cavity4 (0.70). These cavities correspond to the mkgridXf cavities: 64 (blue), 130 (orange/magenta), 83 (green).
As described in the introduction, a theoretical frame for detection of allostery has been developed during the last 5 years: the structure-based statistical mechanical model of allostery (SBSMMA) (Guarnera and Berezovsky, 2019), based on a description of the protein as an elastic network between Cα. The effect of ligand is implicitly modeled through an additional energetic term added to the harmonic energy of the elastic network. The initial EF/CaM complex conformation has been processed on the AlloSigMA server (allosigma.bii.a-star.edu.sg/home) (Tan et al., 2020) implementing the SBSMMA model. The energy values, describing the allosteric communication between protein residues have been plotted for all residues involved in the mkgridXf cavities 5, 64, 83, 97, 130, 136, and 140 (Figure 10). The probe residues sample the cavity residues (filled triangles) and, for all cavities except 140, positive values describing a free energy change are observed for several residues located in the catalytic site (filled rectangle). The AlloSigMA results thus agree with an allosteric communication between mkgridXf cavities 5, 64, 83, 97, 130, 136, and the catalytic site.
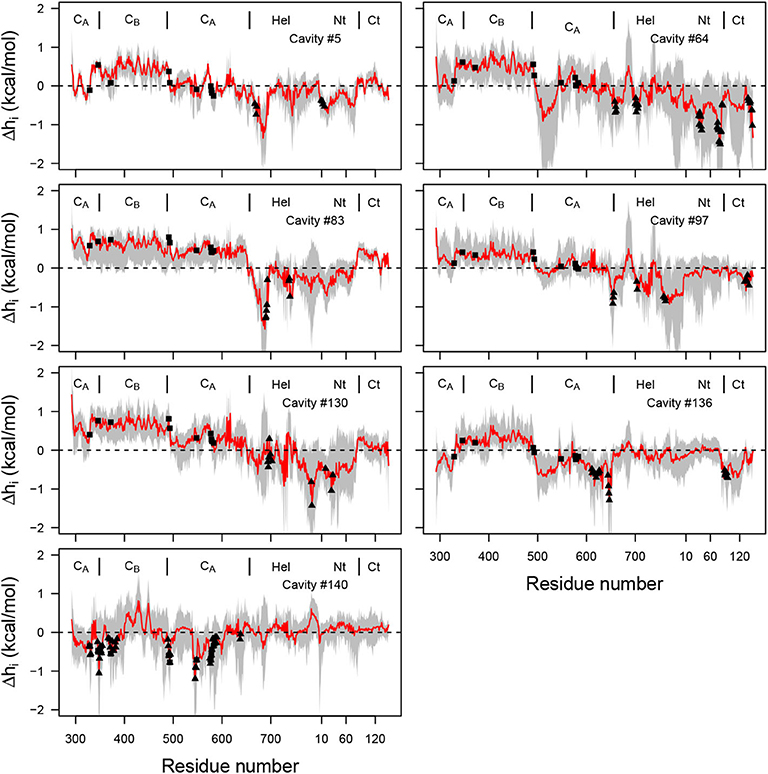
Figure 10. Plot of free energy (kcal/mol) profile, where the probe residue m samples the residues defining each of the selected cavities (Supplementary Table 3), and i samples all residues of the complex (x-axis). The average free energy profile is plotted in red with range of values drawn in gray. The residues defining the cavity (Supplementary Table 3) are shown with filled triangles, and the residues 329, 346, 372, 577, 491, 493, 548, 578, 579, 583 of the catalytic site are shown with filled rectangles. The dashed line corresponds to the zero energy value.
The allosteric communication demonstrated by the variability of cavity volumes as well as by the energetics of the elastic network, is also supported by the variation of the network of interactions described in the previous section between the catalytic site and the helix V of CaM. This network is a plausible candidate for a communication path within the EF/CaM structure.
The cavities present in the EF/CaM complex were tracked along MD trajectories recorded with various perturbation conditions related to functional aspects of EF activity. In that way, the EF/CaM interface has been pointed out as a region containing pockets allosteric with respect to the orthosteric catalytic site. The targeting of these pockets by virtual screening has higher chances to conduct to the discovery of allosteric ligands.
Discussion
In the present work, MD trajectories were recorded from the 1PK0 crystallographic structure of the EF/CaM complex, in the presence of various sets of co-factors: ions Ca2+ and Mg2+ and ligand adefovir.
The main finding from the comparison of trajectories is that the removal of ions has a strong effect on the conformations of the complex, at local and global levels. Indeed, the removal of Mg2+ ion destabilizes the interactions between EF and adefovir, but also affects contacts between EF and CaM. Similarly, the removal of Ca2+ ions destabilizes the interaction of EF with CaM, but also the geometry of the catalytic site and the EF/adefovir interactions even in the presence of ion Mg2+. This distant influence of ions agrees with the existence of a network of hydrogen bonds and stacking interactions which connects the catalytic pocket with the EF/CaM interface and which is destabilized if co-factors are removed. Noticeably a similar network of hydrogen bonds has been observed and validated using MD and mutagenesis (Selwa et al., 2014) in the adenylyl cyclase (AC) toxin from Bordetella pertussis.
Another observation is that the replacement of the ion Yb3+, observed in the initial X-ray crystallographic structure 1PK0 (Shen et al., 2004b), by the more biologically relevant Mg2+ ion induces a destabilization of numerous contacts between adefovir, ion and residues of the catalytic pocket. Consequently, the establishment of interactions due to the presence of Yb3+ ion could have enforced the binding of adefovir inhibitor to the catalytic site or induced the specific conformation of adefovir in the site. Previous computational analyses (Martínez et al., 2009, 2011) already highlighted the artifactual character of some ions observed in the catalytic site of various EF X-ray crystallographic structures.
The analysis of CaM conformations in the EF/CaM revealed that the removal of ions Ca2+ induces an unfitting of the conformation of CaM to its position in the complex as it is visible by the CaM central helix bending. The angles of the EF hands also show greater variations in N-CaM than in C-CaM, which could be related to a weaker interaction between EF and N-CaM.
The tracking of mkgridXf cavities in the EF/CaM complex along MD trajectories revealed large variations of cavity volumes in two regions: (i) the catalytic site and (ii) the interface between EF and CaM. The analysis of initial EF/CaM complex structure in the frame of the model SBSMMA (Guarnera and Berezovsky, 2019) has shown that the residues located in the mkgridXf cavities at the interface between EF and CaM, display allosteric communication with residues in the catalytic site. The procedure followed in the present manuscript has several points in common with the structure-based statistical mechanical model of allostery (SBSMMA). Indeed, SBSMMA states that the allostery can be quantitatively demonstrated using a model of elastic network which is deformed when the protein undergoes transition between unperturbed and perturbed states. In the present work, the unperturbed state is the MD trajectories recorded on the EF/CaM complex in presence of all co-factors, and the perturbed states are the MD trajectories recorded when one or more co-factors have been removed. In the frame of SBSMMA, the deformable cavities located at the interface between CaM and EF qualify them as being related in an allosteric way to the catalytic site and thus to the catalytic function of EF. Consequently, ligands designed to bind such cavities could have an allosteric effect on the catalytic activity of EF. In that respect, one should note that an inhibitor of EF, the compound 10506-2A, has been claimed to bind to the helical region (Lee et al., 2004).
During the last decade, many approaches have been developed for detecting pockets susceptible to bind allosteric ligands, and allosteric paths through protein structures (Daily and Gray, 2009; Mitternacht and Berezovsky, 2011; Bowman and Geissler, 2012; Panjkovich and Daura, 2014; Greener and Sternberg, 2015; Clarke et al., 2016; Guarnera and Berezovsky, 2016; Pfleger et al., 2017; Song et al., 2017; Huang et al., 2018; Abrusan and Marsh, 2019). These approaches are mostly based on a graph description of protein structures. The graphs are then analyzed either from the point of view of protein rigidity and graph theory, or from a more physical point of view of normal mode or elastic network analysis. In the present analysis, we decided to focus on the protein cavities. The relationship found here between the variability of mkgridXf cavity volumes and protein long distance communication is not surprising since such correlation has been observed previously (Desdouits et al., 2015) between mkgridXf cavities deformation and protein functional motions.
The proposition of using the volume variability of cavities for detection of allosteric communication has been only used here on the EF/CaM system. It is obvious that the application on a unique system does not constitute a general proof of concept. Nevertheless, use of cavities tracking along MD trajectories presents some advantages with respect to methods based on the modeling of protein via an elastic interaction network (Panjkovich and Daura, 2014; Guarnera and Berezovsky, 2016). Indeed, by contrast with the network where only one atom (generally Cα) per residues is included in the calculation, the cavity calculation and tracking take information about all atoms into account, as well as their mutual interactions and their interaction with the solvent and co-factors. Moreover, the model for internal dynamics of the complex is more realistic than the quadratic energy surface of the elastic network model. Finally, perturbing the system by removing co-factors, as ions, highly involved in the EF function, makes the observation of protein deformation more specifically related to the inhibition of EF function. However, all these improvements are accessible at the cost of a very intense computational effort.
Data Availability Statement
The raw data supporting the conclusions of this article will be made available by the authors, without undue reservation.
Author Contributions
IP, PG, AB, and TM designed the study. PG, AB, and TM wrote the manuscript. IP, DM, and TM recorded the trajectories and performed the analyses. All authors contributed to the article and approved the submitted version.
Conflict of Interest
The authors declare that the research was conducted in the absence of any commercial or financial relationships that could be construed as a potential conflict of interest.
Acknowledgments
IP thanks DGA for Ph.D. financial support (grant 2017033) and Ecole Doctorale ED515 complexité du vivant. Authors thank CNRS and Institut Pasteur for recurrent funding. This work was also supported by the INCEPTION project ANR-16-CONV-0005.
Supplementary Material
The Supplementary Material for this article can be found online at: https://www.frontiersin.org/articles/10.3389/fmolb.2020.586544/full#supplementary-material
References
Abrusan, G., and Marsh, J. A. (2019). Ligand-binding-site structure shapes allosteric signal transduction and the evolution of allostery in protein complexes. Mol. Biol. Evol. 36, 1711–1727. doi: 10.1093/molbev/msz093
Aguirre, C., Cala, O., and Krimm, I. (2015). Overview of probing protein-ligand interactions using NMR. Curr. Protoc. Protein Sci. 81, 1–17. doi: 10.1002/0471140864.ps1718s81
Alfayate, A., Rodriguez Caceres, C., Gomes Dos Santos, H., and Bastolla, U. (2019). Predicted dynamical couplings of protein residues characterize catalysis, transport and allostery. Bioinformatics 35, 4971–4978. doi: 10.1093/bioinformatics/btz301
Andersen, H. (1983). Rattle: a “velocity” version of the shake algorithm for molecular dynamics calculations. J. Comp. Phys. 52, 24–34. doi: 10.1016/0021-9991(83)90014-1
Anthis, N. J., Doucleff, M., and Clore, G. M. (2011). Transient, sparsely populated compact states of apo and calcium-loaded calmodulin probed by paramagnetic relaxation enhancement: interplay of conformational selection and induced fit. J. Am. Chem. Soc. 133, 18966–18974. doi: 10.1021/ja2082813
Barbato, G., Ikura, M., Kay, L. E., Pastor, R. W., and Bax, A. (1992). Backbone dynamics of calmodulin studied by 15N relaxation using inverse detected two-dimensional NMR spectroscopy: the central helix is flexible. Biochemistry 31, 5269–5278. doi: 10.1021/bi00138a005
Beglov, D., Hall, D. R., Wakefield, A. E., Luo, L., Allen, K. N., Kozakov, D., et al. (2018). Exploring the structural origins of cryptic sites on proteins. Proc. Natl. Acad. Sci. U.S.A. 115, E3416–E3425. doi: 10.1073/pnas.1711490115
Bertini, I., Del Bianco, C., Gelis, I., Katsaros, N., Luchinat, C., Parigi, G., et al. (2004). Experimentally exploring the conformational space sampled by domain reorientation in calmodulin. Proc. Natl. Acad. Sci. U.S.A. 101, 6841–6846. doi: 10.1073/pnas.0308641101
Best, R., Zhu, X., Shim, J., Lopes, P., Mittal, J., Feig, M., et al. (2012). Optimization of the additive CHARMM all-atom protein force field targeting improved sampling of the backbone phi, psi and side-chain chi1 and chi2 dihedral angles. J. Chem. Theor. Comput. 8, 3257–3273. doi: 10.1021/ct300400x
Bowman, G. R., and Geissler, P. L. (2012). Equilibrium fluctuations of a single folded protein reveal a multitude of potential cryptic allosteric sites. Proc. Natl. Acad. Sci. U.S.A. 109, 11681–11686. doi: 10.1073/pnas.1209309109
Chen, V. B., Arendall, W. B., Headd, J. J., Keedy, D. A., Immormino, R. M., Kapral, G. J., et al. (2010). MolProbity: all-atom structure validation for macromolecular crystallography. Acta Crystallogr. D Biol. Crystallogr. 66(Pt 1), 12–21. doi: 10.1107/S0907444909042073
Chen, Z., Moayeri, M., Zhao, H., Crown, D., Leppla, S. H., and Purcell, R. H. (2009). Potent neutralization of anthrax edema toxin by a humanized monoclonal antibody that competes with calmodulin for edema factor binding. Proc. Natl. Acad. Sci. U.S.A. 106, 13487–13492. doi: 10.1073/pnas.0906581106
Cimermancic, P., Weinkam, P., Rettenmaier, T. J., Bichmann, L., Keedy, D. A., Woldeyes, R. A., et al. (2016). CryptoSite: expanding the druggable proteome by characterization and prediction of cryptic binding sites. J. Mol. Biol. 428, 709–719. doi: 10.1016/j.jmb.2016.01.029
Clarke, D., Sethi, A., Li, S., Kumar, S., Chang, R. W. F., Chen, J., et al. (2016). Identifying allosteric hotspots with dynamics: application to inter- and intra-species conservation. Structure 24, 826–837. doi: 10.1016/j.str.2016.03.008
Comitani, F., and Gervasio, F. L. (2018). Exploring cryptic pockets formation in targets of pharmaceutical interest with SWISH. J. Chem. Theory Comput. 14, 3321–3331. doi: 10.1021/acs.jctc.8b00263
Crivici, A., and Ikura, M. (1995). Molecular and structural basis of target recognition by calmodulin. Annu Rev. Biophys. Biomol. Struct. 24, 85–116. doi: 10.1146/annurev.bb.24.060195.000505
Daily, M. D., and Gray, J. J. (2009). Allosteric communication occurs via networks of tertiary and quaternary motions in proteins. PLoS Comput. Biol. 5:e1000293. doi: 10.1371/journal.pcbi.1000293
Darden, T., York, D., and Pedersen, L. (1993). Particle Mesh Ewald and an N.log(N) method for Ewald sums in large systems. J. Chem. Phys. 98, 3684–3690. doi: 10.1063/1.464397
Deredge, D. J., Huang, W., Hui, C., Matsumura, H., Yue, Z., Moënne-Loccoz, P., et al. (2017). Ligand-induced allostery in the interaction of the Pseudomonas aeruginosa heme binding protein with heme oxygenase. Proc. Natl. Acad. Sci. U.S.A. 114, 3421–3426. doi: 10.1073/pnas.1606931114
Desdouits, N., Nilges, M., and Blondel, A. (2015). Principal Component Analysis reveals correlation of cavities evolution and functional motions in proteins. J. Mol. Graph. Model. 55, 13–24. doi: 10.1016/j.jmgm.2014.10.011
Drum, C., Shen, Y., Rice, P., Bohm, A., and Tang, W. (2001). Crystallization and preliminary X-ray study of the edema factor exotoxin adenylyl cyclase domain from Bacillus anthracis in the presence of its activator, calmodulin. Acta Crystallogr. D Biol. Crystallogr. 57, 1881–1884. doi: 10.1107/S0907444901014937
Drum, C., Yan, S., Bard, J., Shen, Y., Lu, D., Soelaiman, S., et al. (2002). Structural basis for the activation of anthrax adenylyl cyclase exotoxin by calmodulin. Nature 415, 396–402. doi: 10.1038/415396a
Drum, C., Yan, S., Sarac, R., Mabuchi, Y., Beckingham, K., Bohm, A., et al. (2000). An extended conformation of calmodulin induces interactions between the structural domains of adenylyl cyclase from Bacillus anthracis to promote catalysis. J. Biol. Chem. 275, 36334–36340. doi: 10.1074/jbc.M004778200
Feng, C., Roy, A., and Post, C. B. (2018). Entropic allostery dominates the phosphorylation-dependent regulation of Syk tyrosine kinase release from immunoreceptor tyrosine-based activation motifs. Protein Sci. 27, 1780–1796. doi: 10.1002/pro.3489
Finn, B. E., Evenäs, J., Drakenberg, T., Waltho, J. P., Thulin, E., and Forsén, S. (1995). Calcium-induced structural changes and domain autonomy in calmodulin. Nat. Struct. Biol. 2, 777–783. doi: 10.1038/nsb0995-777
Fischer, E. S., Park, E., Eck, M. J., and Thomä, N. H. (2016). SPLINTS: small-molecule protein ligand interface stabilizers. Curr. Opin. Struct. Biol. 37, 115–122. doi: 10.1016/j.sbi.2016.01.004
Geduhn, J., Dove, S., Shen, Y., Tang, W. J., Konig, B., and Seifert, R. (2011). Bis-halogen-anthraniloyl-substituted nucleoside 5'-triphosphates as potent and selective inhibitors of Bordetella pertussis adenylyl cyclase toxin. J. Pharmacol. Exp. Ther. 336, 104–115. doi: 10.1124/jpet.110.174219
Ghanakota, P., DasGupta, D., and Carlson, H. A. (2019). Free energies and entropies of binding sites identified by MixMD cosolvent simulations. J. Chem. Inf. Model. 59, 2035–2045. doi: 10.1021/acs.jcim.8b00925
Ghode, A., Gross, L., Tee, W., Guarnera, E., Berezovsky, I., Biondi, R., et al. (2020). Synergistic allostery in multiligand-protein interactions. Biophys. J. 119, 1833–1848. doi: 10.1016/j.bpj.2020.09.019
Goodey, N. M., and Benkovic, S. J. (2008). Allosteric regulation and catalysis emerge via a common route. Nat. Chem. Biol. 4, 474–482. doi: 10.1038/nchembio.98
Gowers, R., Linke, M., Barnoud, J., Reddy, T., Melo, M., Seyler, S., et al. (2016). “MDAnalysis: a Python package for the rapid analysis of molecular dynamics simulations,” in Proceedings of the 15th Python in Science Conference, Vol. 32 (Austin, TX), 102–109. doi: 10.25080/Majora-629e541a-00e
Greener, J. G., and Sternberg, M. J. (2015). AlloPred: prediction of allosteric pockets on proteins using normal mode perturbation analysis. BMC Bioinformatics 16:335. doi: 10.1186/s12859-015-0771-1
Guarnera, E., and Berezovsky, I. N. (2016). Structure-based statistical mechanical model accounts for the causality and energetics of allosteric communication. PLoS Comput. Biol. 12:e1004678. doi: 10.1371/journal.pcbi.1004678
Guarnera, E., and Berezovsky, I. N. (2019). Toward comprehensive allosteric control over protein activity. Structure 27, 866–878. doi: 10.1016/j.str.2019.01.014
Guo, Q., Jureller, J., Warren, J., Solomaha, E., Florián, J., and Tang, W. (2008). Protein-protein docking and analysis reveal that two homologous bacterial adenylyl cyclase toxins interact with calmodulin differently. J. Biol. Chem. 283, 23836–23845. doi: 10.1074/jbc.M802168200
Guo, Q., Shen, Y., Zhukovskaya, N. L., Florian, J., and Tang, W. J. (2004). Structural and kinetic analyses of the interaction of anthrax adenylyl cyclase toxin with reaction products cAMP and pyrophosphate. J. Biol. Chem. 279, 29427–29435. doi: 10.1074/jbc.M402689200
Gur, M., Madura, J. D., and Bahar, I. (2013). Global transitions of proteins explored by a multiscale hybrid methodology: application to adenylate kinase. Biophys. J. 105, 1643–1652. doi: 10.1016/j.bpj.2013.07.058
Huang, M., Song, K., Liu, X., Lu, S., Shen, Q., Wang, R., et al. (2018). AlloFinder: a strategy for allosteric modulator discovery and allosterome analyses. Nucleic Acids Res. 46, W451–W458. doi: 10.1093/nar/gky374
Huang, S. Y. (2014). Search strategies and evaluation in protein-protein docking: principles, advances and challenges. Drug Discov. Today 19, 1081–1096. doi: 10.1016/j.drudis.2014.02.005
Ikura, M., Clore, G. M., Gronenborn, A. M., Zhu, G., Klee, C. B., and Bax, A. (1992). Solution structure of a calmodulin-target peptide complex by multidimensional NMR. Science 256, 632–638. doi: 10.1126/science.1585175
Jiménez, J., Doerr, S., Martínez-Rosell, G., Rose, A. S., and De Fabritiis, G. (2017). DeepSite: protein-binding site predictor using 3D-convolutional neural networks. Bioinformatics 33, 3036–3042. doi: 10.1093/bioinformatics/btx350
Jo, S., Cheng, X., Lee, J., Kim, S., Park, S. J., Patel, D. S., et al. (2017). CHARMM-GUI 10 years for biomolecular modeling and simulation. J. Comput. Chem. 38, 1114–1124. doi: 10.1002/jcc.24660
Jorgensen, W., Chandrasekhar, J., Madura, J., Impey, R., and Klein, M. (1983). Comparison of simple potential functions for simulating liquid water. J. Chem. Phys. 79, 926–935. doi: 10.1063/1.445869
Kim, S., Lee, J., Jo, S., Brooks, C. L., Lee, H. S., and Im, W. (2017). CHARMM-GUI ligand reader and modeler for CHARMM force field generation of small molecules. J. Comput. Chem. 38, 1879–1886. doi: 10.1002/jcc.24829
Komeiji, Y., Ueno, Y., and Uebayasi, M. (2002). Molecular dynamics simulations revealed Ca(2+)-dependent conformational change of Calmodulin. FEBS Lett. 521, 133–139. doi: 10.1016/S0014-5793(02)02853-3
Koshland, D. E., Némethy, G., and Filmer, D. (1966). Comparison of experimental binding data and theoretical models in proteins containing subunits. Biochemistry 5, 365–385. doi: 10.1021/bi00865a047
Kozakov, D., Grove, L. E., Hall, D. R., Bohnuud, T., Mottarella, S. E., Luo, L., et al. (2015). The FTMap family of web servers for determining and characterizing ligand-binding hot spots of proteins. Nat. Protoc. 10, 733–755. doi: 10.1038/nprot.2015.043
Kuenemann, M. A., Sperandio, O., Labbé, C. M., Lagorce, D., Miteva, M. A., and Villoutreix, B. O. (2015). In silico design of low molecular weight protein-protein interaction inhibitors: overall concept and recent advances. Prog. Biophys. Mol. Biol. 119, 20–32. doi: 10.1016/j.pbiomolbio.2015.02.006
Laine, E., Blondel, A., and Malliavin, T. (2009). Dynamics and energetics: a consensus analysis of the impact of calcium on EF-CaM protein complex. Biophys. J. 96, 1249–1263. doi: 10.1016/j.bpj.2008.10.055
Laine, E., Goncalves, C., Karst, J., Lesnard, A., Rault, S., Tang, W., et al. (2010a). Use of allostery to identify inhibitors of calmodulin- induced activation of Bacillus anthracis Edema Factor. Proc. Natl. Acad. Sci. U.S.A. 107, 11277–11282. doi: 10.1073/pnas.0914611107
Laine, E., Ladant, L. M. D., Malliavin, T., and Blondel, A. (2012). Molecular motions as a drug target: mechanistic simulations of anthrax toxin edema factor function led to the discovery of novel allosteric inhibitors. Toxins 4, 580–604. doi: 10.3390/toxins4080580
Laine, E., Martínez, L., Blondel, A., and Malliavin, T. (2010b). Activation of the edema factor of Bacillus anthracis by calmodulin: evidence of an interplay between the EF-calmodulin interaction and calcium binding. Biophys. J. 99, 2264–2272. doi: 10.1016/j.bpj.2010.07.044
Laine, E., Yoneda, J., Blondel, A., and Malliavin, T. (2008). The conformational plasticity of calmodulin upon calcium complexation gives a model of its interaction with the oedema factor of Bacillus anthracis. Proteins 71, 1813–1829. doi: 10.1002/prot.21862
Lee, B., and Richards, F. M. (1971). The interpretation of protein structures: estimation of static accessibility. J. Mol. Biol. 55, 379–400. doi: 10.1016/0022-2836(71)90324-X
Lee, J., Cheng, X., Swails, J. M., Yeom, M. S., Eastman, P. K., Lemkul, J. A., et al. (2016). CHARMM-GUI input generator for NAMD, GROMACS, AMBER, OpenMM, and CHARMM/OpenMM simulations using the CHARMM36 additive force field. J. Chem. Theory Comput. 12, 405–413. doi: 10.1021/acs.jctc.5b00935
Lee, Y. S., Bergson, P., He, W. S., Mrksich, M., and Tang, W. J. (2004). Discovery of a small molecule that inhibits the interaction of anthrax edema factor with its cellular activator, calmodulin. Chem. Biol. 11, 1139–1146. doi: 10.1016/j.chembiol.2004.05.020
Liu, J., and Nussinov, R. (2016). Allostery: an overview of its history, concepts, methods, and applications. PLoS Comput. Biol. 12:e1004966. doi: 10.1371/journal.pcbi.1004966
Ma, X., Meng, H., and Lai, L. (2016). Motions of allosteric and orthosteric ligand-binding sites in proteins are highly correlated. J. Chem. Inf. Model. 56, 1725–1733. doi: 10.1021/acs.jcim.6b00039
MacKerell, A., Bashford, D., Bellott, M., Dunbrack, R., Evanseck, J., Field, M., et al. (1998). All-atom empirical potential for molecular modeling and dynamics studies of proteins. J. Phys. Chem. B 102, 3586–3616. doi: 10.1021/jp973084f
MacKerell, A., Feig, M., and Brooks, C. (2004). Extending the treatment of backbone energetics in protein force fields and limitations of gas-phase quantum mechanics in reproducing protein conformational distributions in molecular dynamics simulations. J. Comp. Chem. 25, 1400–1415. doi: 10.1002/jcc.20065
Martínez, L., Laine, E., Malliavin, T., Nilges, M., and Blondel, A. (2009). ATP conformations and ion binding modes in the active site of anthrax edema factor: a computational analysis. Proteins 77, 971–983. doi: 10.1002/prot.22523
Martínez, L., Malliavin, T., and Blondel, A. (2011). Mechanism of reactant and product dissociation from the anthrax edema factor: a locally enhanced sampling and steered molecular dynamics study. Proteins. 79, 1649–1661. doi: 10.1002/prot.22991
Martinez-Rosell, G., Lovera, S., Sands, Z. A., and De Fabritiis, G. (2020). PlayMolecule crypticscout: predicting protein cryptic sites using mixed-solvent molecular simulations. J. Chem. Inf. Model. 60, 2314–2324. doi: 10.1021/acs.jcim.9b01209
Michaud-Agrawal, N., Denning, E., Woolf, T., and Beckstein, O. (2011). MDAnalysis: a toolkit for the analysis of molecular dynamics simulations. J. Comput. Chem. 32, 2319–2327. doi: 10.1002/jcc.21787
Mitternacht, S. (2016). FreeSASA: An open source C library for solvent accessible surface area calculation. F1000Research 5:189. doi: 10.12688/f1000research.7931.1
Mitternacht, S., and Berezovsky, I. N. (2011). Binding leverage as a molecular basis for allosteric regulation. PLoS Comput. Biol. 7:e1002148. doi: 10.1371/journal.pcbi.1002148
Monet, D., Desdouits, N., Nilges, M., and Blondel, A. (2019). mkgridXf: consistent identification of plausible binding sites despite the elusive nature of cavities and grooves in protein dynamics. J. Chem. Inf. Model. 59, 3506–3518. doi: 10.1021/acs.jcim.9b00103
Monod, J., Wyman, J., and Changeux, J. P. (1965). On the nature of allosteric transitions: a plausible model. J. Mol. Biol. 12, 88–118. doi: 10.1016/S0022-2836(65)80285-6
Morelli, X., Bourgeas, R., and Roche, P. (2011). Chemical and structural lessons from recent successes in protein-protein interaction inhibition (2P2I). Curr. Opin. Chem. Biol. 15, 475–481. doi: 10.1016/j.cbpa.2011.05.024
Ni, D., Liu, N., and Sheng, C. (2019). Allosteric modulators of protein-protein interactions (PPIs). Adv. Exp. Med. Biol. 1163, 313–334. doi: 10.1007/978-981-13-8719-7_13
Nussinov, R., and Tsai, C. J. (2013). Allostery in disease and in drug discovery. Cell 153, 293–305. doi: 10.1016/j.cell.2013.03.034
Panjkovich, A., and Daura, X. (2014). PARS: a web server for the prediction of Protein Allosteric and Regulatory Sites. Bioinformatics 30, 1314–1315. doi: 10.1093/bioinformatics/btu002
Pfleger, C., Minges, A., Boehm, M., McClendon, C. L., Torella, R., and Gohlke, H. (2017). Ensemble- and rigidity theory-based perturbation approach to analyze dynamic allostery. J. Chem. Theory Comput. 13, 6343–6357. doi: 10.1021/acs.jctc.7b00529
Phillips, J., Braun, R., Wang, W., Gumbart, J., Tajkhorshid, E., Villa, E., et al. (2005). Scalable molecular dynamics with NAMD. J. Comput. Chem. 26, 1781–1802. doi: 10.1002/jcc.20289
Raman, A. S., White, K. I., and Ranganathan, R. (2016). Origins of allostery and evolvability in proteins: a case study. Cell 166, 468–480. doi: 10.1016/j.cell.2016.05.047
Roe, D., and TE Cheatham, I. (2013). PTRAJ and CPPTRAJ: software for processing and analysis of molecular dynamics trajectory data. J. Chem. Theory Comput. 9, 3084–3095. doi: 10.1021/ct400341p
Ryckaert, J., Ciccotti, G., and Berendsen, H. (1977). Numerical integration of the cartesian equations of motion of a system with constraints and Molecular dynamics of n-alkanes. J. Comput. Phys. 23, 327–341. doi: 10.1016/0021-9991(77)90098-5
Selwa, E., Davi, M., Chenal, A., Sotomayor-Pérez, A., Ladant, D., and Malliavin, T. (2014). Allosteric activation of Bordetella pertussis adenylyl cyclase by calmodulin: molecular dynamics and mutagenesis studies. J. Biol. Chem. 289, 21131–21141. doi: 10.1074/jbc.M113.530410
Shen, Y., Guo, Q., Zhukovskaya, N. L., Drum, C. L., Bohm, A., and Tang, W. J. (2004a). Structure of anthrax edema factor-calmodulin-adenosine 5'-(alpha,beta-methylene)-triphosphate complex reveals an alternative mode of ATP binding to the catalytic site. Biochem. Biophys. Res. Commun. 317, 309–314. doi: 10.1016/j.bbrc.2004.03.046
Shen, Y., Lee, Y., Soelaiman, S., Bergson, P., Lu, D., Chen, A., et al. (2002). Physiological calcium concentrations regulate calmodulin binding and catalysis of adenylyl cyclase exotoxins. EMBO J. 21, 6721–6732. doi: 10.1093/emboj/cdf681
Shen, Y., Zhukovskaya, N. L., Guo, Q., Florian, J., and Tang, W. J. (2005). Calcium-independent calmodulin binding and two-metal-ion catalytic mechanism of anthrax edema factor. EMBO J. 24, 929–941. doi: 10.1038/sj.emboj.7600574
Shen, Y., Zhukovskaya, N. L., Zimmer, M. I., Soelaiman, S., Bergson, P., Wang, C. R., et al. (2004b). Selective inhibition of anthrax edema factor by adefovir, a drug for chronic hepatitis B virus infection. Proc. Natl. Acad. Sci. U.S.A. 101, 3242–3247. doi: 10.1073/pnas.0306552101
Shin, W. H., Christoffer, C. W., and Kihara, D. (2017). In silico structure-based approaches to discover protein-protein interaction-targeting drugs. Methods 131, 22–32. doi: 10.1016/j.ymeth.2017.08.006
Soelaiman, S., Wei, B. Q., Bergson, P., Lee, Y. S., Shen, Y., Mrksich, M., et al. (2003). Structure-based inhibitor discovery against adenylyl cyclase toxins from pathogenic bacteria that cause anthrax and whooping cough. J. Biol. Chem. 278, 25990–25997. doi: 10.1074/jbc.M301232200
Song, K., Liu, X., Huang, W., Lu, S., Shen, Q., Zhang, L., et al. (2017). Improved method for the identification and validation of allosteric sites. J. Chem. Inf. Model. 57, 2358–2363. doi: 10.1021/acs.jcim.7b00014
Sun, Z., Wakefield, A. E., Kolossvary, I., Beglov, D., and Vajda, S. (2020). Structure-based analysis of cryptic-site opening. Structure 28, 223–235. doi: 10.1016/j.str.2019.11.007
Taha, H., Dove, S., Geduhn, J., Konig, B., Shen, Y., Tang, W. J., et al. (2012). Inhibition of the adenylyl cyclase toxin, edema factor, from Bacillus anthracis by a series of 18 mono- and bis-(M)ANT-substituted nucleoside 5'-triphosphates. Naunyn Schmiedebergs Arch. Pharmacol. 385, 57–68. doi: 10.1007/s00210-011-0688-9
Taha, H. M., Schmidt, J., Gottle, M., Suryanarayana, S., Shen, Y., Tang, W. J., et al. (2009). Molecular analysis of the interaction of anthrax adenylyl cyclase toxin, edema factor, with 2'(3')-O-(N-(methyl)anthraniloyl)-substituted purine and pyrimidine nucleotides. Mol. Pharmacol. 75, 693–703. doi: 10.1124/mol.108.052340
Tan, Z. W., Guarnera, E., Tee, W. V., and Berezovsky, I. N. (2020). AlloSigMA 2: paving the way to designing allosteric effectors and to exploring allosteric effects of mutations. Nucleic Acids Res. 48, W116–W124. doi: 10.1093/nar/gkaa338
Tschammer, N. (2016). Allosteric modulators of the class A G protein coupled receptors. Adv. Exp. Med. Biol. 917, 185–207. doi: 10.1007/978-3-319-32805-8_9
Tuffery, P., and Derreumaux, P. (2012). Flexibility and binding affinity in protein-ligand, protein-protein and multi-component protein interactions: limitations of current computational approaches. J. R. Soc. Interface 9, 20–33. doi: 10.1098/rsif.2011.0584
Ulmer, T., Soelaiman, S., Li, S., Klee, C., Tang, W., and Bax, A. (2003). Calcium dependence of the interaction between calmodulin and anthrax edema factor. J. Biol. Chem. 278, 29261–29266. doi: 10.1074/jbc.M302837200
Vajda, S., Beglov, D., Wakefield, A. E., Egbert, M., and Whitty, A. (2018). Cryptic binding sites on proteins: definition, detection, and druggability. Curr. Opin. Chem. Biol. 44, 1–8. doi: 10.1016/j.cbpa.2018.05.003
van den Bedem, H., Bhabha, G., Yang, K., Wright, P. E., and Fraser, J. S. (2013). Automated identification of functional dynamic contact networks from X-ray crystallography. Nat. Methods 10, 896–902. doi: 10.1038/nmeth.2592
Wodak, S. J., Paci, E., Dokholyan, N. V., Berezovsky, I. N., Horovitz, A., Li, J., et al. (2019). Allostery in its many disguises: from theory to applications. Structure 27, 566–578. doi: 10.1016/j.str.2019.01.003
Xu, Y., Wang, S., Hu, Q., Gao, S., Ma, X., Zhang, W., et al. (2018). CavityPlus: a web server for protein cavity detection with pharmacophore modelling, allosteric site identification and covalent ligand binding ability prediction. Nucleic Acids Res. 46, W374–W379. doi: 10.1093/nar/gky380
Yamniuk, A. P., and Vogel, H. J. (2004). Calmodulin's flexibility allows for promiscuity in its interactions with target proteins and peptides. Mol. Biotechnol. 27, 33–57. doi: 10.1385/MB:27:1:33
Yang, C., Jas, G., and Kuczera, K. (2004). Structure, dynamics and interaction with kinase targets: computer simulations of calmodulin. Biochim. Biophys. Acta 1697, 289–300. doi: 10.1016/j.bbapap.2003.11.032
Yu, J., Zhou, Y., Tanaka, I., and Yao, M. (2010). Roll: a new algorithm for the detection of protein pockets and cavities with a rolling probe sphere. Bioinformatics 26, 46–52. doi: 10.1093/bioinformatics/btp599
Zhang, J., and Nussinov, R. (ed.). (2019). “Protein allostery in drug discovery,” in Advances in Experimental Medicine and Biology, eds Zhang and Nussinov (Springer). doi: 10.1007/978-981-13-8719-7. Available online at: https://www.springer.com/gp/book/9789811387180
Zhang, M., Tanaka, T., and Ikura, M. (1995). Calcium-induced conformational transition revealed by the solution structure of apo calmodulin. Nat. Struct. Biol. 2, 758–767. doi: 10.1038/nsb0995-758
Keywords: protein-protein interaction, Bacillus anthracis, virulence factor, Cavity detection, allostery
Citation: Pitard I, Monet D, Goossens PL, Blondel A and Malliavin TE (2020) Analyzing In Silico the Relationship Between the Activation of the Edema Factor and Its Interaction With Calmodulin. Front. Mol. Biosci. 7:586544. doi: 10.3389/fmolb.2020.586544
Received: 23 July 2020; Accepted: 02 November 2020;
Published: 04 December 2020.
Edited by:
Agnel Praveen Joseph, Science and Technology Facilities Council, United KingdomReviewed by:
Sony Malhotra, Birkbeck, University of London, United KingdomIgor N. Berezovsky, Bioinformatics Institute (A*STAR), Singapore
Copyright © 2020 Pitard, Monet, Goossens, Blondel and Malliavin. This is an open-access article distributed under the terms of the Creative Commons Attribution License (CC BY). The use, distribution or reproduction in other forums is permitted, provided the original author(s) and the copyright owner(s) are credited and that the original publication in this journal is cited, in accordance with accepted academic practice. No use, distribution or reproduction is permitted which does not comply with these terms.
*Correspondence: Thérèse E. Malliavin, therese.malliavin@pasteur.fr