 Dominique F. Leitner1,2,3
 Evgeny Kanshin4,5
 Arline Faustin2,6Manon Thierry2,3Daniel Friedman1,3Sasha Devore1,3Beatrix Ueberheide2,4,5Orrin Devinsky1,3*
 Thomas Wisniewski2,3,6,7*
- 1Comprehensive Epilepsy Center, New York University Grossman School of Medicine, New York, NY, United States
- 2Center for Cognitive Neurology, Department of Neurology, New York University Grossman School of Medicine, New York, NY, United States
- 3Department of Neurology, New York University Grossman School of Medicine, New York, NY, United States
- 4Proteomics Laboratory, Division of Advanced Research Technologies, New York University Grossman School of Medicine, New York, NY, United States
- 5Department of Biochemistry and Molecular Pharmacology, New York University Grossman School of Medicine, New York, NY, United States
- 6Department of Pathology, New York University Grossman School of Medicine, New York, NY, United States
- 7Department of Psychiatry, New York University Grossman School of Medicine, New York, NY, United States
Introduction: Alzheimer's disease (AD) and epilepsy are reciprocally related. Among sporadic AD patients, clinical seizures occur in 10–22% and subclinical epileptiform abnormalities occur in 22–54%. Cognitive deficits, especially short-term memory impairments, occur in most epilepsy patients. Common neurophysiological and molecular mechanisms occur in AD and epilepsy. The choroid plexus undergoes pathological changes in aging, AD, and epilepsy, including decreased CSF turnover, amyloid beta (Aβ), and tau accumulation due to impaired clearance and disrupted CSF amino acid homeostasis. This pathology may contribute to synaptic dysfunction in AD and epilepsy.
Methods: We evaluated control (n = 8), severe AD (n = 8; A3, B3, C3 neuropathology), and epilepsy autopsy cases (n = 12) using laser capture microdissection (LCM) followed by label-free quantitative mass spectrometry on the choroid plexus adjacent to the hippocampus at the lateral geniculate nucleus level.
Results: Proteomics identified 2,459 proteins in the choroid plexus. At a 5% false discovery rate (FDR), 616 proteins were differentially expressed in AD vs. control, 1 protein in epilepsy vs. control, and 438 proteins in AD vs. epilepsy. There was more variability in the epilepsy group across syndromes. The top 20 signaling pathways associated with differentially expressed proteins in AD vs. control included cell metabolism pathways; activated fatty acid beta-oxidation (p = 2.00 x 10⁻⁷, z = 3.00), and inhibited glycolysis (p = 1.00 x 10⁻¹², z = −3.46). For AD vs. epilepsy, the altered pathways included cell metabolism pathways, activated complement system (p = 5.62 x 10⁻⁵, z = 2.00), and pathogen-induced cytokine storm (p = 2.19 x 10⁻², z = 3.61). Of the 617 altered proteins in AD and epilepsy vs. controls, 497 (81%) were positively correlated (p < 0.0001, R2 = 0.27).
Discussion: We found altered signaling pathways in the choroid plexus of severe AD cases and many correlated changes in the protein expression of cell metabolism pathways in AD and epilepsy cases. The shared molecular mechanisms should be investigated further to distinguish primary pathogenic changes from the secondary ones. These mechanisms could inform novel therapeutic strategies to prevent disease progression or restore normal function. A focus on dual-diagnosed AD/epilepsy cases, specific epilepsy syndromes, such as temporal lobe epilepsy, and changes across different severity levels in AD and epilepsy would add to our understanding.
Introduction
Alzheimer's disease (AD) and epilepsy are reciprocally related: AD increases the risk of late-onset seizures, and epilepsy increases the risk of cognitive impairment (1–10), suggesting common molecular mechanisms. Seizures occur in 10–22% of sporadic AD (sAD) patients, subclinical epileptiform abnormalities in 22–54% of AD patients, (11–17) and cognitive deficits occur in up to 80% of epilepsy patients (1–3, 18). Non-convulsive seizures and subclinical electroencephalography (EEG) abnormalities are common and underrecognized in AD patients and may accelerate structural and cognitive disorders (4, 14, 15, 17, 19). In AD patients with epileptiform activity, the Mini-Mental State Examination (MMSE) score decreased faster compared to AD patients without epileptiform activity (15). Furthermore, anti-seizure medications [ASMs; e.g., levetiracetam (LEV)] decreased neuronal hyperexcitability and improved cognition in animal models and in patients with mild cognitive impairment (MCI) and are being investigated in ongoing studies for AD (20–24). Cognitive deficits are common in patients with chronic epilepsy, particularly in temporal lobe epilepsy (TLE), and late-onset epilepsy (8, 9, 18, 25, 26). Epilepsy patients had a faster MMSE decline than non-epilepsy patients (27), a 2-fold increased dementia risk when compared to controls (28), and a 3-fold increased dementia incidence in late-onset epilepsy when compared to non-epilepsy patients (9). Cognitive deficits and epileptiform activity are linked with amyloid beta (Aβ) and tau pathology in AD and epilepsy (3, 19, 25, 29, 30). Cognitive performance was impaired with altered cerebrospinal fluid (CSF) Aβ42 and EEG abnormalities in patients with late-onset epilepsy of unknown etiology and MCI when compared to MCI patients without epilepsy (26). Furthermore, some patients with late-onset epilepsy of unknown etiology develop pathogenic levels of AD biomarkers Aβ42 and tau that indicate an ongoing neurodegeneration process and a risk factor for AD (31). Compared to AD patients without seizures, those with seizures had increased Aβ and tau pathology via mTOR activation in the temporal cortex (32). An mTOR inhibitor improved cognition and ameliorated AD pathology in a 5xTg AD model (32), highlighting the therapeutic potential of exploring the pathways involved in the bidirectional relationship between AD and seizures.
The choroid plexus is impacted in both AD and epilepsy. It is the primary source for CSF production and is essential in the maintenance and function of the brain (33). This region undergoes age-related pathological changes (e.g., altered volume, epithelial atrophy, thickened basement membrane, and stroma fibrosis) that decrease CSF turnover (33–36). Aβ accumulation in the choroid plexus results from mitochondrial deficits, oxidative stress, and cytoskeletal dysregulation (34, 37–39). These pathogenic changes alter nutrient and ion secretion, impairing brain homeostasis (33, 35, 40). In epilepsy, choroid plexus and hippocampal inflammation occur ipsilateral to the seizure focus (41). CSF amino acid homeostasis is disrupted in epilepsy patients and animal epilepsy models (42–45).
We and others have identified AD protein changes in multiple brain regions over the disease course (46). These include glial proteins (47), Aβ, and tau levels that correlate with spliceosome activity (48–50), synaptic dysfunction (51, 52), and tau interacting proteins involved in ubiquitination and phagosome maturation (29, 53). In epilepsy, we identified protein changes associated with increased translation and decreased oxidative phosphorylation and synaptogenesis (54). The molecular mechanisms in the choroid plexus of AD and epilepsy are not well-understood. Limited proteomic studies in AD choroid plexus (55) and CSF revealed protein changes in CSF, indicating altered astrocyte/microglial and sugar metabolism (56), neuroinflammation, cerebrovascular dysfunction, and apoptosis (57, 58). There are no proteomics studies in human epilepsy choroid plexus. With most AD clinical trials failing (59–66) and drug-resistant epilepsy rates stable for decades (67, 68), proteomics approaches may reveal unbiased comprehensive datasets to identify shared druggable protein targets. Identifying these mechanisms can inform therapeutic strategies to improve network function, limit disease progression, and potentially reverse functional and pathological changes.
Materials and methods
Brain tissue
Specimens were acquired under protocols with Institutional Review Board (IRB) approval at NYU Grossman School of Medicine, including autopsy tissues from the North American SUDEP Registry (NASR) at NYU CEC, NYU ADRC, and NYU Center for Biospecimen Research and Development (CBRD)/Department of Pathology. For epilepsy cases (n = 12), the inclusion criteria were those cases with temporal lobe epilepsy or likely temporal lobe involved epilepsy as determined from the review of available medical records, as well as additional epilepsy cases that were age-matched to the other groups and enrolled in NASR. For AD cases (n = 8), the inclusion criteria were those cases with severe AD pathology as indicated by the neuropathology score A3B3C3 (69) and part of the NYU ADRC, which allowed for age matching to the other groups. Control cases (n = 8) were selected to include those cases with no known significant neurology or neuropathology. Cases were further selected to include those that were age-matched and with hippocampal sections available at the level of the lateral geniculate nucleus (LGN) with adjacent choroid plexus present. The sample size was informed by ours and other prior studies (47, 49, 52, 54, 56, 70, 71). Case history is summarized in Table 1 and detailed in Supplementary Table 1.
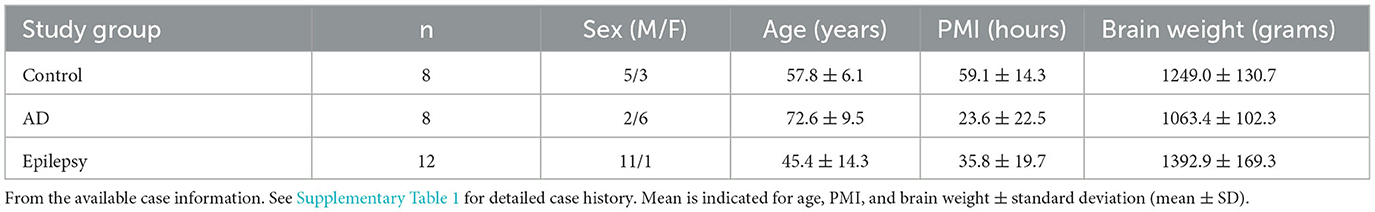
Table 1. Case history summary.
Laser capture microdissection
Formalin-fixed, paraffin-embedded (FFPE) tissue was cut into 8 μg sections from autopsy hippocampal tissue at the level of the LGN with adjacent choroid plexus onto LCM PET membrane slides (54, 70, 72, 73) and stained with cresyl violet (74) for the localization of choroid plexus. Microdissected samples were collected at a consistent area per case of 3 mm2 into LC-MS grade water (Thermo Fisher Scientific) with the Leica LMD6500 LCM system. Samples were stored at −80°C until further processing. The schematic overview in Figure 1 was partially generated with Biorender.com.
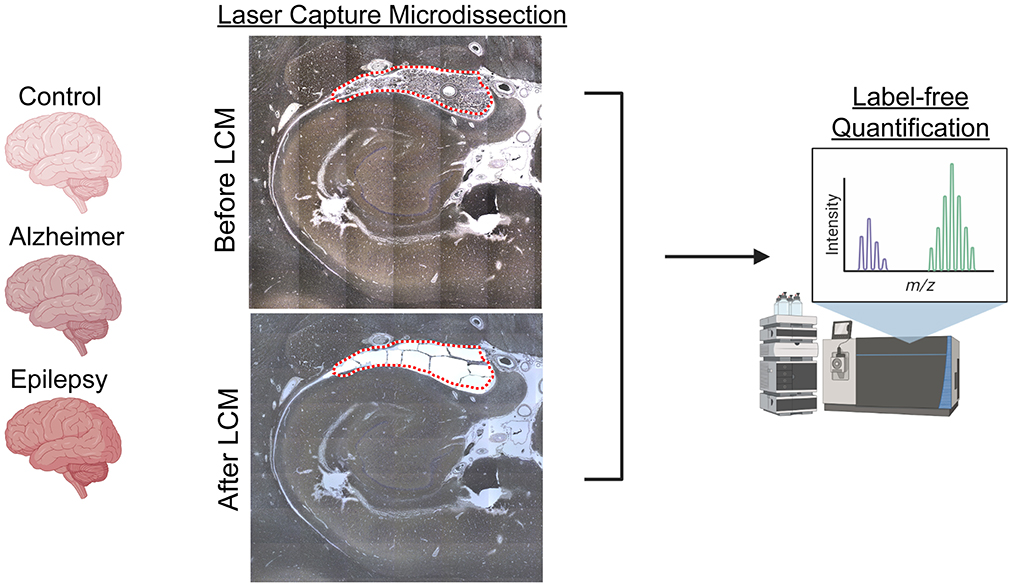
Figure 1. LCM and schematic approach overview. Choroid plexus (3 mm2), adjacent to the hippocampus at the level of LGN, was microdissected by LCM from FFPE autopsy brain tissue from control (n = 8), AD (n = 8), and epilepsy (n = 12) cases. Proteins were quantified by label-free quantitative mass spectrometry to identify protein differences.
Label-free quantitative mass spectrometry LFQ-MS
Protein extraction and digestion
LCM-excised tissue samples were solubilized and digested using the SPEED sample prep workflow (75). In brief, tissue sections were incubated in 10 μl of LC-MS grade trifluoroacetic acid (TFA) for 5 min at 73°C. TFA was neutralized by 10x dilution (v:v) with 2M TRIS containing 10 mM Tris (2-carboxyethyl) phosphine TCEP and 20 mM chloroacetic acid (CAA) and incubated at 95°C for 10 min. For enzymatic digestion, samples were diluted 6x (v:v) with water containing 1 μg of sequencing-grade trypsin. Digestion was carried out at 37°C overnight and halted by acidification to 2% of TFA.
LC-MS/MS
LC separation was performed online on an Evosep One (Evosep) LC utilizing Dr. Maisch ReproSil-Pur 120 C18 AQ, 1.9-μm bead (150 μm ID, 15 cm long, cat# EV-1106) analytical column. Peptides were gradient eluted from the column directly into an Orbitrap HFX mass spectrometer using the 88-min extended Evosep method (SPD15) at a flow rate of 220 nl/min. The mass spectrometer was operated in data-independent acquisition (DIA) mode (76) acquiring MS/MS fragmentation across 22 m/z windows after every MS full-scan event.
High-resolution full MS spectra were acquired with a resolution of 120,000, an AGC target of 3e6, with a maximum ion injection time of 60 ms, and a scan range of 350 to 1650 m/z. Following each full MS scan, 22 data-independent HCD MS/MS scans were acquired at a resolution of 30,000, an AGC target of 3e6, and a stepped normalized collision energy (NCE) of 22.5, 25, and 27.5.
Data analysis
MS data were analyzed using the Spectronaut® software (https://biognosys.com/shop/spectronaut) and searched in direct DIA mode against the homo sapiens UniProt database (http://www.uniprot.org/). The database search used the integrated search engine Pulsar. For searching, enzyme specificity was set to trypsin with two or fewer missed cleavages. Oxidation of methionine was searched as a variable modification, and carbamidomethylation of cysteines was searched as a fixed modification. The false discovery rate (FDR) for peptide, protein, and site identification was set to 1%. Protein quantification was done on the MS/MS level using the three most intense fragment ions per precursor. Subsequent data analysis used Perseus (77) (http://www.perseus-framework.org/), R environment (http://www.r-project.org/), or Prism GraphPad for statistical computing and graphics. Raw data are available on the MassIVE server (https://massive.ucsd.edu/) under accession MSV000091370.
The protein expression matrix (n = 2,498) was filtered to remove the proteins that were non-human, common lab contaminants, and those proteins observed in less than half of all the three groups (n = 2,459). For principal component analysis (PCA), missing values were imputed from the normal distribution with a width of 0.3 and a downshift of 1.8 (relative to measured protein intensity distribution) in Perseus (77). Unpaired t-tests were performed in Perseus v. 1.6.2.3 (77) to detect significant changes in protein expression. A comparison of the significant proteins common to each pairwise comparison was evaluated by a Venn diagram generated from InteractiVenn (78). Cell-type annotations for each protein were evaluated in comparison to a reference choroid plexus dataset (79), as we have similarly done previously in other brain regions with enrichment evaluated by a Fisher's exact test (54, 70, 71, 73, 80, 81). The signaling pathways associated with the differentially expressed proteins were assessed by Ingenuity Pathway Analysis (IPA, Qiagen). All detected proteins were included in the dataset for each pairwise comparison, including the UniProtID, fold change, and p-value. Core analysis was performed in each brain region for proteins at an FDR of < 5%. Pathways were considered enriched at a p-value of overlap of < 0.05 and to be activated/inhibited as a result of combined protein fold changes in a pathway as reflected by a |z-score| of ≥2. Correlation analyses were performed by Pearson's correlation in GraphPad Prism. Data were also compared to previous AD studies and recently compiled in our NeuroPro database v1.12 (https://neuropro.biomedical.hosting/) (82). To identify basement membrane proteins (by cell component GO term), 616 proteins in AD vs. control were evaluated by STRING v11.5 (https://string-db.org/).
Immunohistochemistry
Immunohistochemistry was performed to validate the protein of interest, transmembrane protein 106B (TMEM106B) (52, 73, 83, 84). The FFPE sections (8 μm) were deparaffinized and rehydrated in a series of xylenes and ethanol dilutions. A heat-induced antigen retrieval was performed with 10 mM sodium citrate, 0.05% Triton-X 100; pH 6. Blocking with 10% normal donkey serum was followed by a TMEM106B primary antibody (1:100, Sigma HPA058342) and AQP1 (1:100, Santa Cruz sc-25287) overnight at 4°C. Sections were incubated with donkey anti-rabbit Alexa-Fluor 647 and Alexa-Fluor 488 secondary antibodies (1:500, Thermo Fisher Scientific, Invitrogen), counterstained with DAPI (Sigma D9542), and coverslipped.
Whole-slide scanning was performed at × 20 magnification with a Leica Aperio Versa 8 microscope using the same settings for each slide. There were three to four images at × 10 magnification collected for each case (n = 5 control, n = 5 AD, n = 5 epilepsy). Images were analyzed using Fiji ImageJ to compare the average amount of TMEM106B positive area among the groups. The same binary threshold was used for all images to determine the number of TMEM106B positive pixels in each image, which was reported as a percentage of the total image area. A Mann–Whitney U-test was performed for statistical analysis; a p-value of < 0.05 was considered significant.
Results
Protein differential expression
Protein differential expression analysis was evaluated in control (n = 8), AD (n = 8), and epilepsy cases (n = 12) from the autopsy brain tissue with LFQ-MS in the microdissected choroid plexus (Table 1, Figure 1, Supplementary Table 1). LFQ-MS identified 2,459 proteins in the choroid plexus of the cases analyzed, detected in at least 50% of the cases in any of the groups. PCA showed significant segregation of AD cases from control (p < 0.0001) and epilepsy (p < 0.0001) cases in PCA1 (Figures 2A–C). There was more variability in the epilepsy group that included various syndromes. In addition to the disease group, sex contributed to some differences observed on the PCA (p = 0.023), while age did not (p = 0.89) as observed by a multiple variable linear regression analysis (Supplementary Table 2).
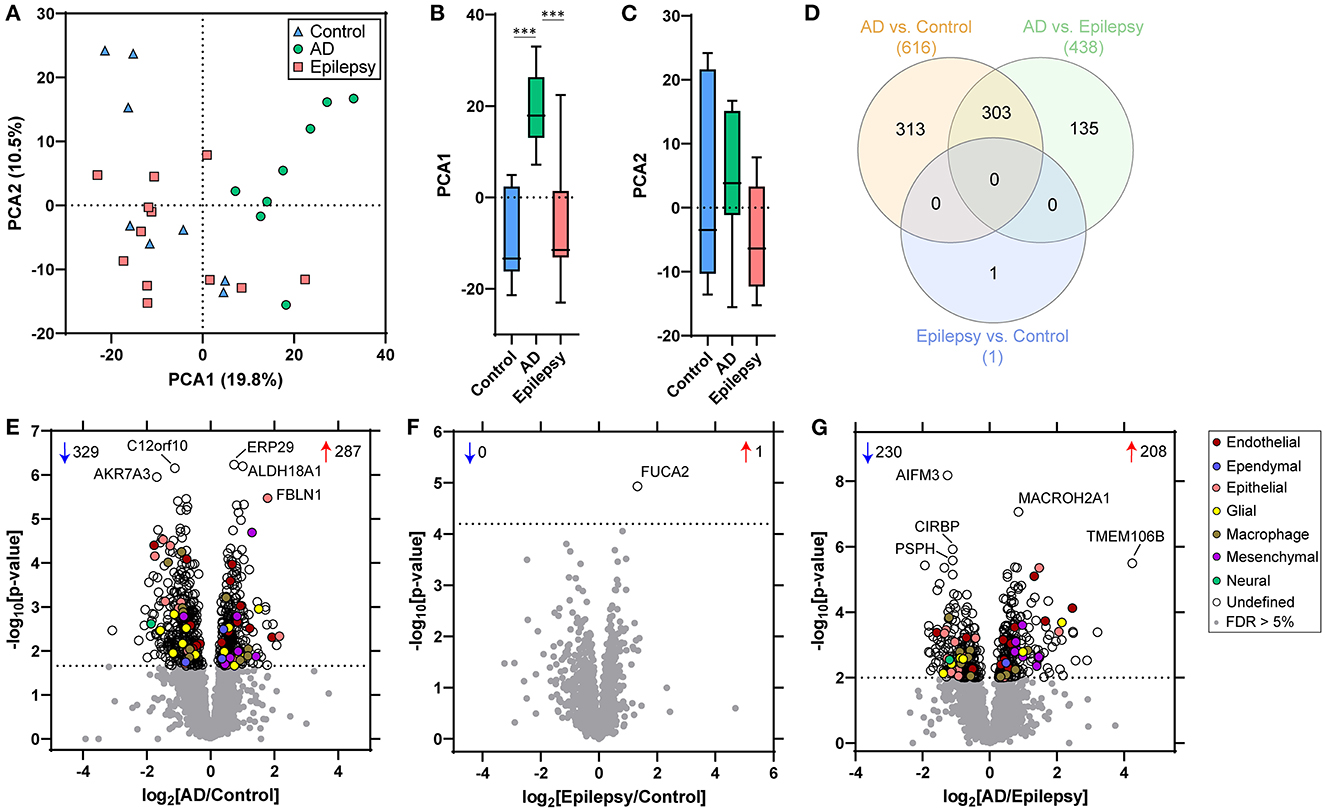
Figure 2. PCA and proteomic differences in the choroid plexus of control, epilepsy, and AD patients. (A) Principal component analysis (PCA) shows the distribution of control (n = 8), AD with A3, B3, C3 neuropathology (n = 8), and epilepsy (n = 12) for the 2,459 proteins detected in choroid plexus. (B, C) There is a segregation of AD from control (p < 0.0001) and epilepsy (p < 0.0001) in PCA1, but no segregation in PCA2 (one-way ANOVA with post-hoc Tukey's test). (D) Differential expression analysis for each pairwise comparison is indicated, as well as an overlap in the number of significant proteins, at a 5% false discovery rate (FDR; dotted line) when comparing (E) AD vs. control (616 proteins), (F) epilepsy vs. control (1 protein), and (G) AD vs. epilepsy (438 proteins). Annotations include the number of significantly increased (red arrows) and decreased (blue arrows) proteins. The top five altered proteins are annotated by gene name, and choroid plexus cell-type annotations for each significant protein are indicated.
With an unpaired t-test followed by permutation-based FDR at 5%, there were significant differences between AD and control cases in 616 proteins, between epilepsy and control cases in 1 protein, and between AD and epilepsy cases in 438 proteins (Figures 2D–G, Supplementary Table 3). There were 303 proteins different in AD when compared to both control and epilepsy cases (Figure 2D). The top 20 most significant proteins altered in the AD vs. control and AD vs. epilepsy pairwise comparisons are summarized in Tables 2, 3. For epilepsy vs. control, the differentially expressed protein FUCA2 (alpha-L-fucosidase 2) was increased by 2.5-fold (p = 1.17 x 10⁻⁵). There were trending differences (p < 0.05, FDR >5%) in epilepsy vs. control for 216 proteins (Supplementary Table 3).
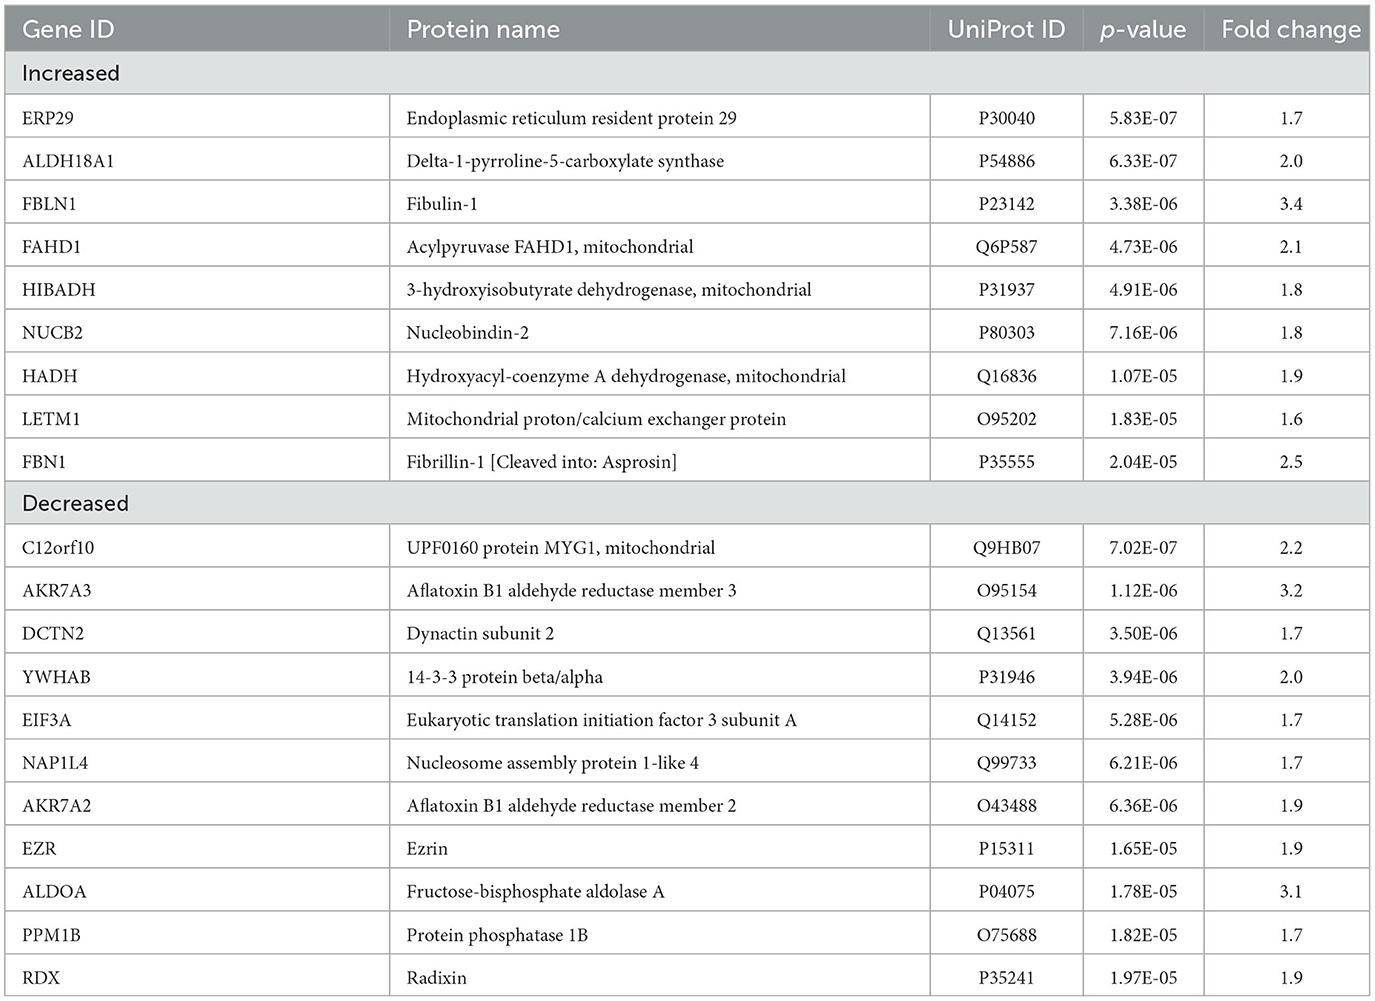
Table 2. Top 20 significant proteins in AD vs. control.
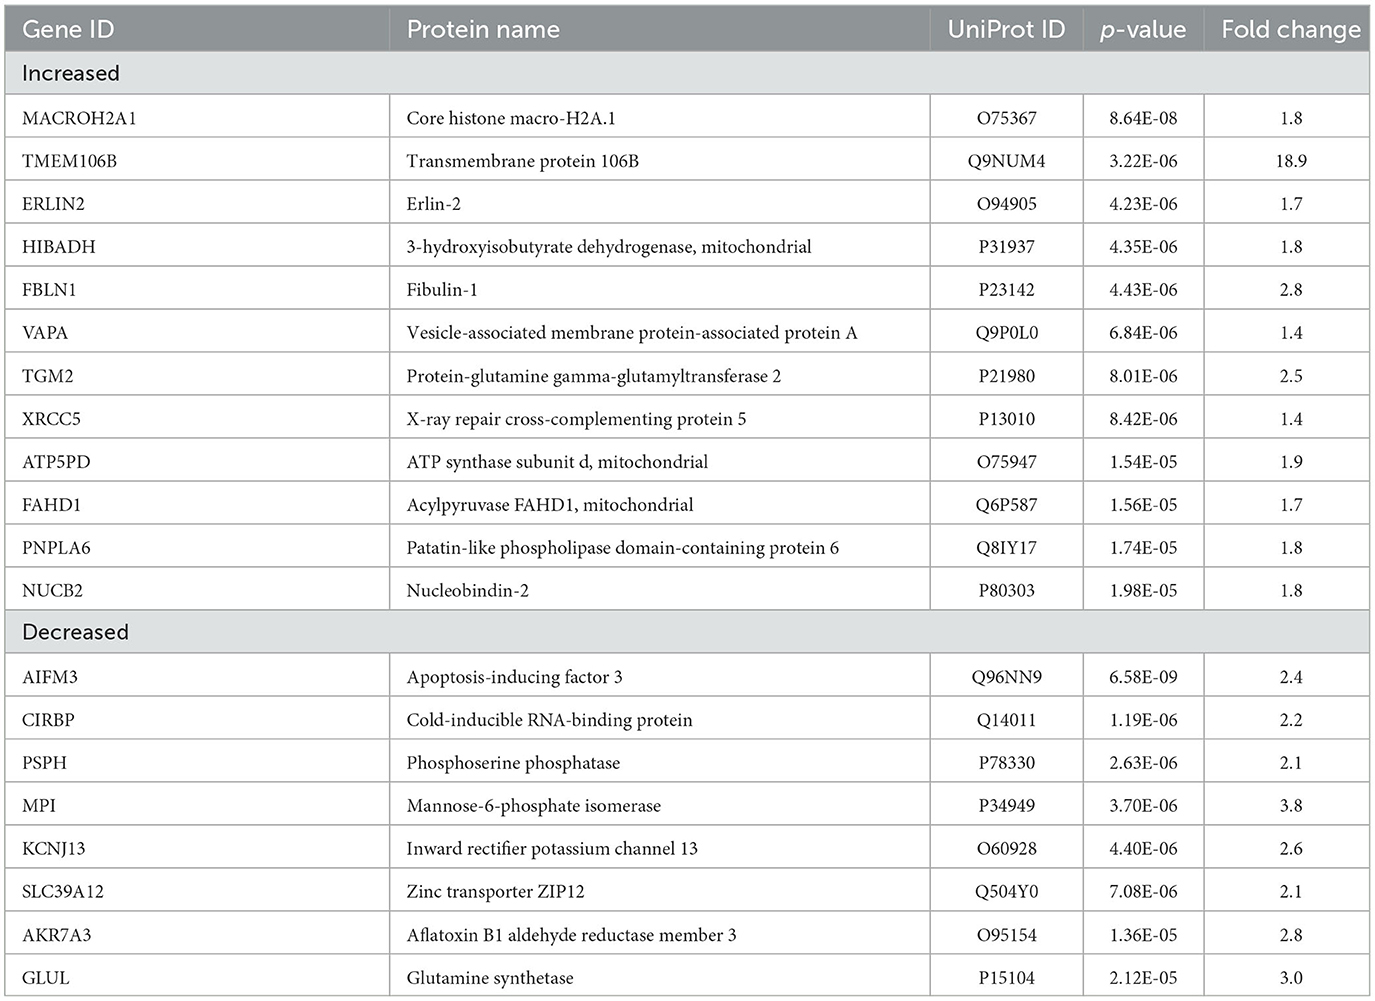
Table 3. Top 20 significant proteins in AD vs. epilepsy.
After cell-type annotation of proteins, most proteins were “undefined” and likely expressed by multiple cell types, or their association is unknown (Figures 2, 3, Supplementary Table 3). After “undefined,” the most abundant annotation for significant proteins was for endothelial proteins (2.4%, 15 proteins) in AD vs. control and both endothelial and epithelial proteins (3.2%, 14 proteins each) in AD vs. epilepsy. Cell-type enrichment analysis (Fisher's exact test) indicated that glial proteins (1.9%, 12 proteins) were trending in enrichment (p = 0.051) in AD vs. control, and endothelial proteins were enriched (p = 0.031) in AD vs. epilepsy (Figure 3).
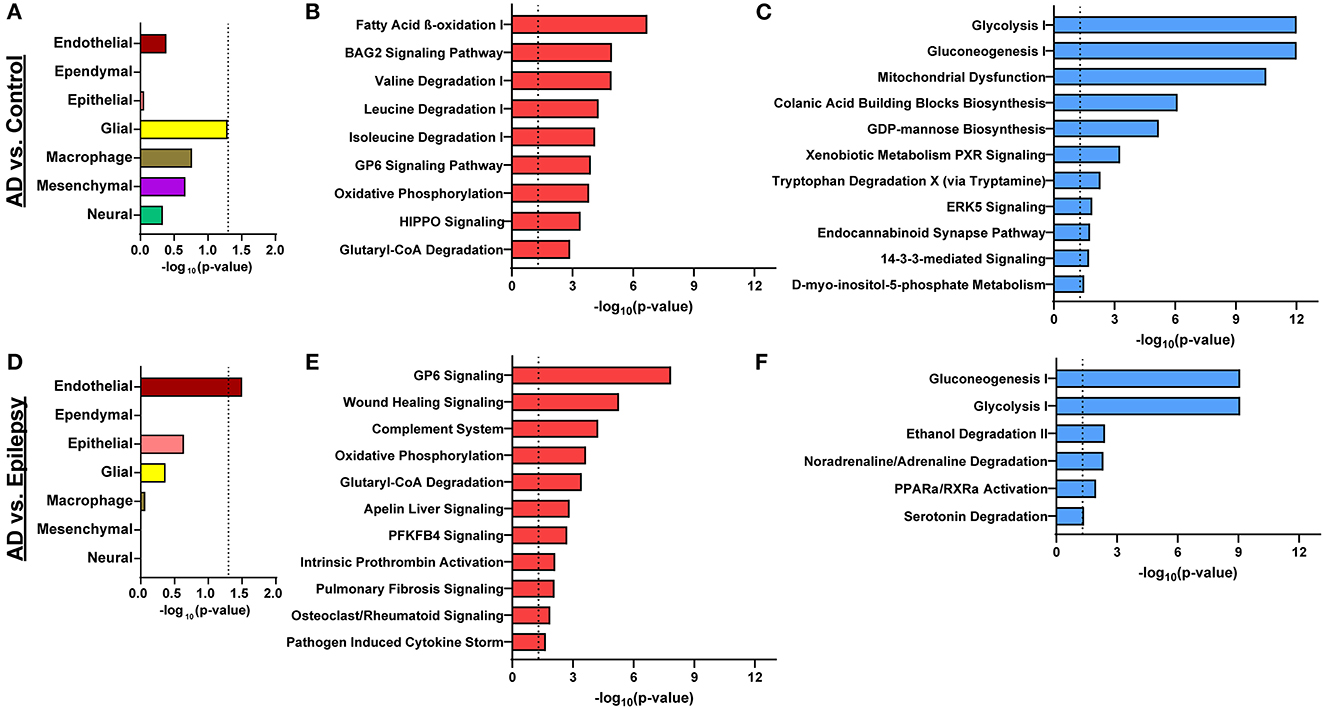
Figure 3. Cell-type enrichment and signaling pathways associated with proteomics differences. (A) Cell-type annotation analysis of differentially expressed proteins in AD vs. control by Fisher's exact test indicates a trend in enrichment (p = 0.051) for glial proteins. (B, C) For AD vs. control, the 616 differentially expressed proteins are significantly associated with 9 activated pathways (red) and 11 inhibited pathways (blue; p-value of overlap < 0.05, z-score ≥ |2|). (D) Cell-type enrichment analysis for differentially expressed proteins in AD vs. epilepsy indicates enrichment for endothelial cell proteins (p = 0.031). (E, F) For AD vs. epilepsy, the 438 differentially expressed proteins are significantly associated with 11 activated pathways and 6 inhibited pathways. The dotted lines indicate p = 0.05.
Pathway analysis
In AD vs. control (Figures 3B, C), pathway analysis of the significantly altered proteins identified 142 signaling pathways associated with the 616 proteins (p-value of overlap < 0.05); 20 of these pathways were significantly impacted by fold change as reflected by the z-score (|z| ≥ 2; Supplementary Table 4). Top signaling pathways were associated with cell metabolism, including activated fatty acid beta-oxidation (p = 2.00 x 10⁻⁷, z = 3.00) and inhibited glycolysis (p = 1.00 x 10⁻¹², z = −3.46; Figure 4). Three branched-chain amino acid degradation pathways were activated: valine degradation I (p = 1.17 x 10⁻⁵, z = 2.45), leucine degradation I (p = 5.13 x 10⁻⁵, z = 2.00), and isoleucine degradation I (p = 7.59 x 10⁻⁵, z = 2.24). There was BAG2 signaling activation (p = 1.12 x 10⁻⁵, z = 2.00) with several decreased proteasome proteins, as well as 14-3-3-mediated signaling inhibition (p = 1.82 x 10⁻², z = −2.12).
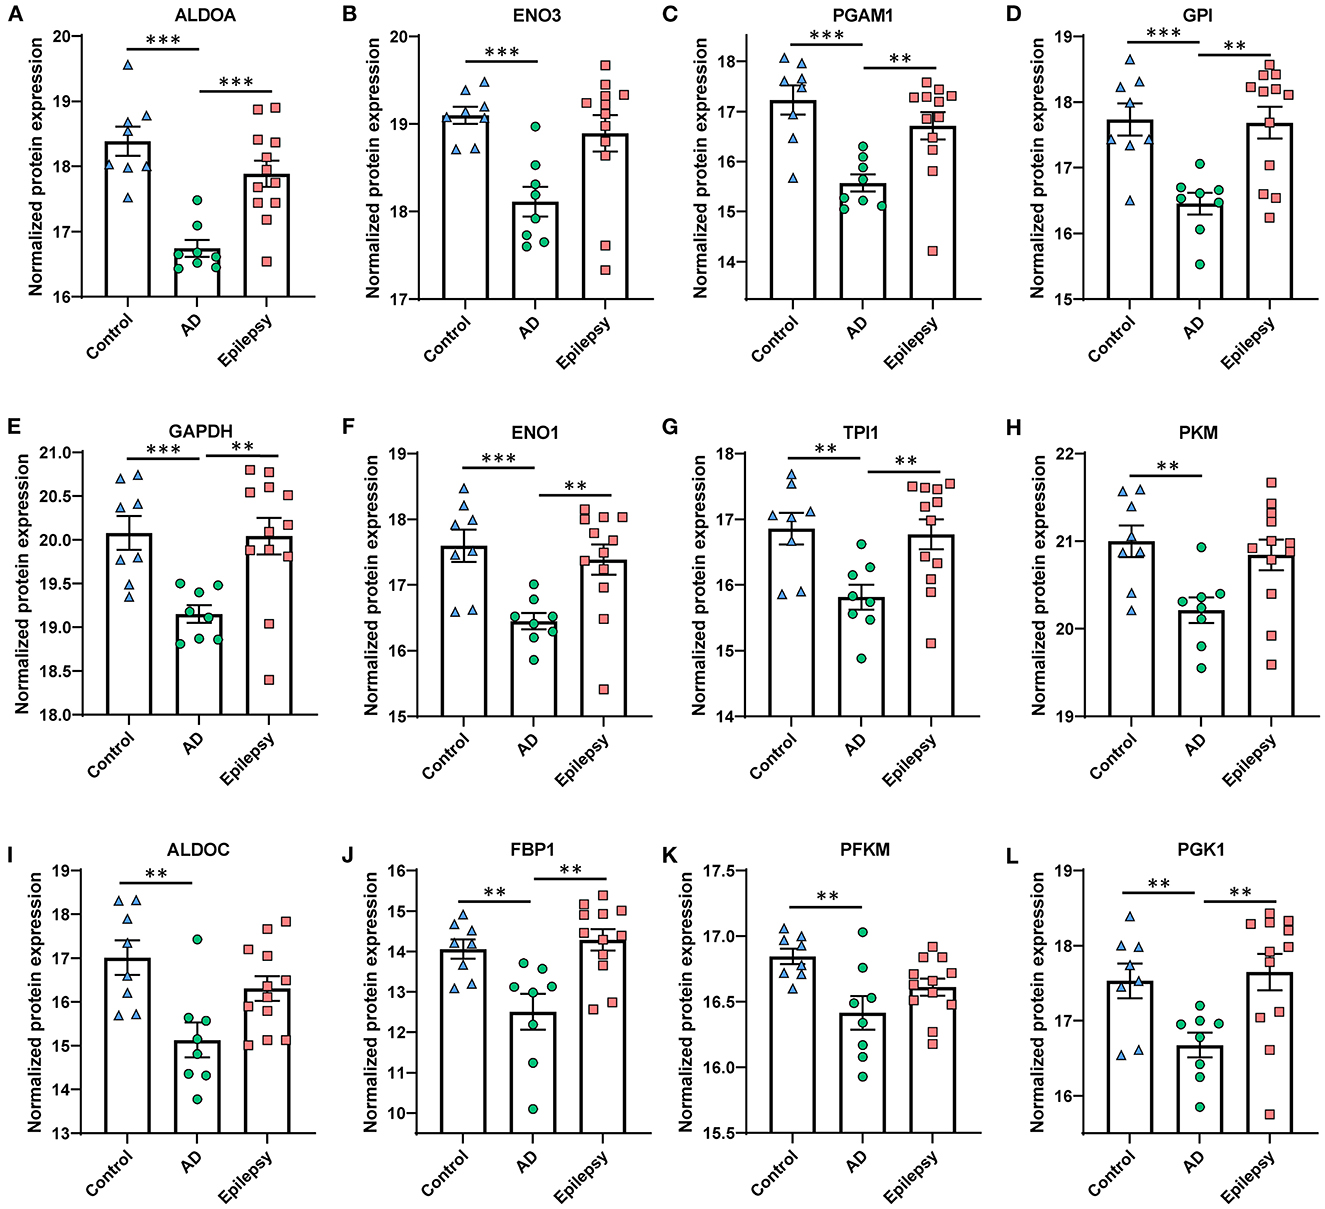
Figure 4. Proteins in AD vs. control associated with the top altered pathway, glycolysis inhibition. The glycolysis signaling pathway was the most significantly altered and was the most affected by the fold change of proteins in AD vs. control (p = 1.00 x 10⁻¹², z = −3.46). (A–L) The proteins are depicted by order of decreasing significance. Those proteins that are significant at 5% FDR are indicated for all pairwise comparisons, with the p-values as indicated. ***p < 0.001, **p < 0.01. Error bars indicate SEM.
In AD vs. epilepsy (Figures 3E, F), pathway analysis of the significantly altered proteins identified 137 signaling pathways associated with the 438 proteins (p-value of overlap < 0.05) and 17 pathways were significantly impacted by fold change as reflected by the z-score (|z| ≥ 2; Supplementary Table 5). The top 20 signaling pathways similar to AD vs. control included five pathways associated with cell metabolism (gluconeogenesis I, glycolysis I, oxidative phosphorylation, and glutaryl-CoA degradation) and the GP6 signaling pathway that is related to platelet activation and thrombus formation. Unique to AD vs. epilepsy, there were two activated inflammation signaling pathways: complement system (p = 5.62 x 10⁻⁵, z = 2.00) and pathogen-induced cytokine storm (p = 2.19 x 10⁻², z = 3.61).
In epilepsy vs. control, there were no pathways associated with the one altered protein FUCA2. Pathways associated with the 216 trending proteins at a p-value of < 0.05 with an FDR of >5% are detailed in Supplementary Table 6.
TMEM106B validation and localization
TMEM106B (Q9NUM4) was among the top 20 most significantly altered proteins when comparing AD vs. epilepsy (Table 3) with the highest fold change at an 18.9-fold increase (p = 3.22 x 10⁻⁶) and was a top protein candidate for validation with cell and regional localization. For AD vs. control by LFQ-MS, there was a 3.5-fold increase (p = 0.04, not significant at 5% FDR). By immunohistochemistry, TMEM106B was predominantly localized in epithelial cells at the basal membrane (Figure 5). The epithelial cell marker in the choroid plexus, aquaporin 1 (AQP1), was evaluated for colocalization and was present in the apical membrane of epithelial cells. Validation of the LFQ-MS findings in five cases per group with the semiquantification of immunohistochemistry similarly showed the same trends for TMEM106B, with a 3.9-fold increase in AD vs. epilepsy (p = 0.095) and a 5.0-fold increase in AD vs. control (p = 0.095).
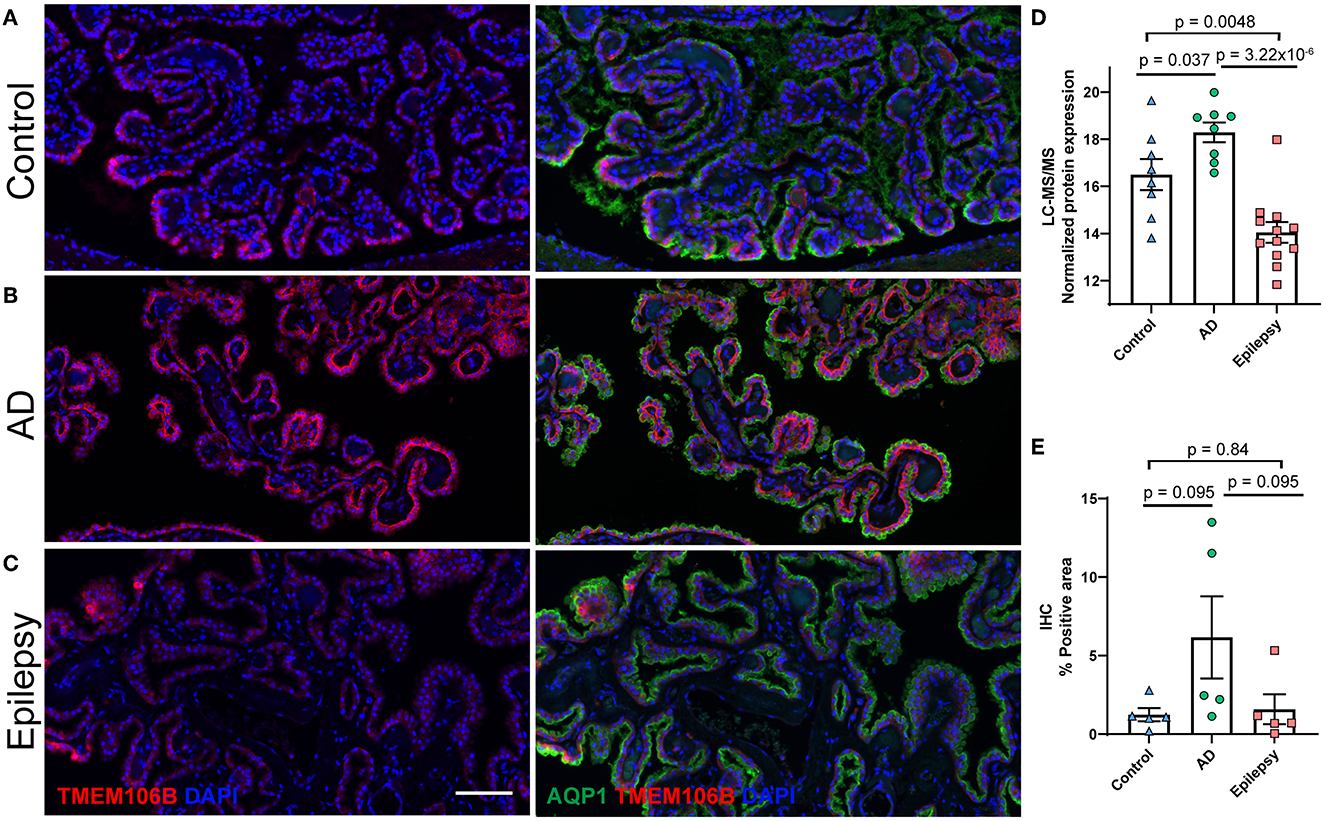
Figure 5. Protein candidate TMEM106B histological localization and quantification. Representative images from the (A) control, (B) AD, and (C) epilepsy groups of TMEM106B (red) localized in the basal membrane and epithelial marker AQP1 (green) in the apical membrane of epithelial cells of the choroid plexus adjacent to the hippocampus at the level of LGN. (D) TMEM106B quantification by LFQ-MS in control (n = 8), AD (n = 8), and epilepsy cases (n = 12). As determined by Student's two-tailed t-test with permutation correction at a 5% FDR, for AD vs. epilepsy, there was an 18.9-fold increase (p = 3.22 x 10⁻⁶, FDR <5%), for AD vs. control, there was a 3.5-fold increase (p = 0.037, FDR >5%), and for epilepsy vs. control, there was a 5.5-fold decrease (p = 0.0048, FDR >5%). (E) Immunohistochemistry from five cases/group shows using semiquantitative analysis that TMEM106B expression follows a similar trend observed in LFQ-MS, AD vs. epilepsy (3.9-fold increase, p = 0.095), AD vs. control (5.0-fold increase, p = 0.095), and epilepsy vs. control (1.3-fold increase, p = 0.84) by the Mann–Whitney U-test. Scale bar 100 um. Error bars indicate SEM.
AD and epilepsy correlation analysis
Although few proteomic differences in epilepsy vs. control reached the 5% FDR, 617 proteins altered in AD and epilepsy vs. controls had a positive correlation in expression levels (p < 0.0001, R2 = 0.27, Figure 6A). There were 81% (497/617) of proteins changing in the same direction and 19% (120/617) of proteins changing in the opposite direction, indicating that many protein changes in AD also trend in epilepsy cases but do not reach significance in these cohorts. The top 10 pathways associated with these proteins were specified by those up in both disease groups, down in both, or changing in the opposite direction (Figures 6B–E, Supplementary Tables 7–10).
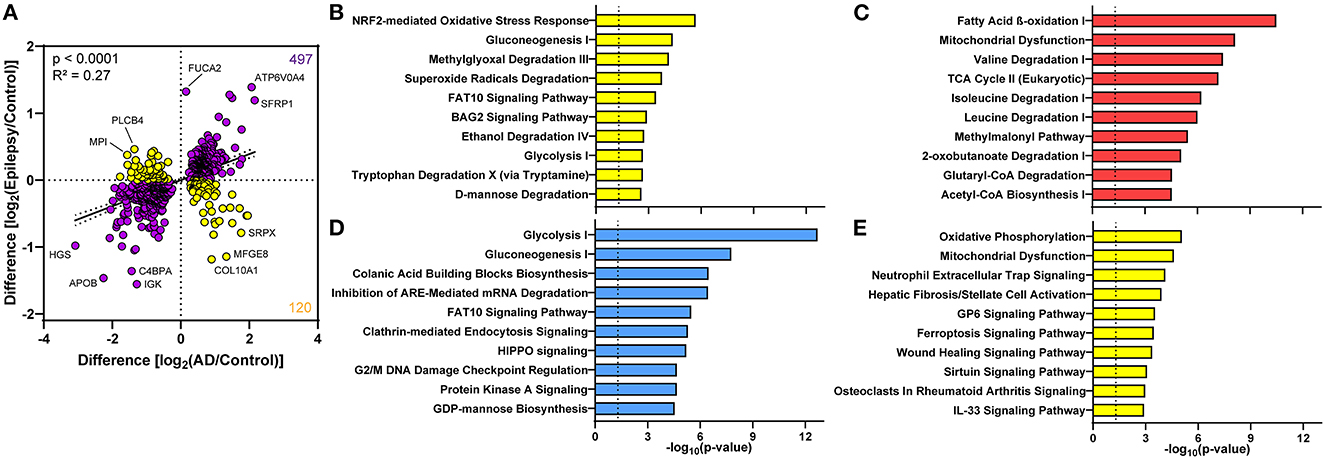
Figure 6. Proteomic differences in the choroid plexus of AD and epilepsy cases positively correlate. (A) Of the 617 altered proteins in AD and epilepsy cases when compared to controls, 497/617 (81%) changed in the same direction (purple) and 120/617 (19%) in the opposite direction (yellow) with an overall positive correlation (p < 0.0001, R2 = 0.27). Several of the proteins with the highest fold change are annotated by the gene name. The top 10 signaling pathways associated with the proteins in each quadrant from the correlation show those pathways (B) down in AD and up in epilepsy, (C) up in both AD and epilepsy, (D) down in both AD and epilepsy, and (E) up in AD and down in epilepsy.
Comparison to other AD studies
We compared the choroid plexus protein differences in AD vs. control to AD-related proteomics studies in our NeuroPro database (82) that compiles results from 38 other proteomics studies, with multiple brain regions, subtypes of disease progression, and types of pathology. There was an overlap of the identified proteins from the choroid plexus with 525 confirmed from previous studies and 91 unique proteins via proteomics to the choroid plexus (Supplementary Tables 11, 12). Of the 525 confirmed proteins, 114 proteins were altered in AD when compared to controls from 9 other brain regions in previous studies. Among the 91 unique proteins by proteomics to choroid plexus, there were several increased collagen and aldehyde dehydrogenase proteins.
Discussion
We identified protein differences in the choroid plexus of AD cases with severe neuropathology when compared to control and epilepsy cases, with top significant pathways related to activated fatty acid beta-oxidation and inhibited glycolysis. The protein differences in the AD group correlated with the same trends in epilepsy when compared to control cases, with more variability in the epilepsy group.
AD vs. control
We identified pathways associated with altered cell energy metabolism indicating a shift from glucose-mediated energy production to fatty acid beta-oxidation activation and glycolysis inhibition, coupled with activated branched-chain amino acid degradation. This shift was further reflected by trends in ketogenic pathways, with mild activation of ketolysis (p = 8.41 x 10⁻⁵, z = 1.00) and ketogenesis (p = 1.29 x 10⁻⁴, z = 1.00). There was oxidative phosphorylation activation, with many increased proteins in complex I (NDUF proteins), as well as complexes II and V. The elevated abundance of these mitochondrial proteins may indicate increased expression or mitochondrial biogenesis that occurs with ketosis (85). Brain imaging studies found hypometabolism in AD patients consistent with low glucose in some brain regions (86). We detected the glucose transporter GLUT1 (SLC2A1) (87) altered in some cells in an AD mouse model (88), but this was not different from controls in the choroid plexus. Future studies should evaluate this further in specific choroid plexus cell types and correlate with neighboring brain tissues and CSF protein levels, as well as clinical variables such as disease progression. Evaluating how these altered pathways may impact ketosis induction may provide insights into the mechanisms of cognitive dysfunction and resilience (89–92).
Other altered pathways associated with AD include BAG2 and 14-3-3 signaling. In the current study, BAG2 signaling activation included nine decreased proteasome proteins and two increased heat shock proteins. This pathway is associated with multiple functions such as cytoskeleton maintenance, including proteasome-independent phosphorylated tau degradation (93). We detected total tau (MAPT) in most cases (n = 7 control, n = 2 AD, n = 9 epilepsy), but this was not different among the groups. Regarding proteasome proteins, we detected a number of these proteins, but those that were significant were all decreased and associated with this pathway. Previous studies have shown that proteasome proteins tend to be increased in AD when compared to controls in other brain regions when searched in our NeuroPro database (82). Follow-up studies should evaluate this finding in choroid plexus to determine whether these decreased proteins are associated with the dysfunction of protein clearance, altered in specific cell types, or present in another insoluble fraction for example. Additionally, 14-3-3-mediated signaling was inhibited with decreased 14-3-3 proteins (YWHAB, YWHAE, YWHAG, YWHAQ, and YWHAZ). The proteins in this pathway are also associated with multiple cellular functions, and in AD, they colocalize with neurofibrillary tau tangles and are increased in CSF, with correlations to clinical variables (94, 95). Evidence suggests that 14-3-3 proteins are decreased in the frontal cortex tissue, as well as in some studies from our NeuroPro database in most brain regions and in a limited choroid plexus proteomics study (55, 82, 96).
Proteomics analyses in human AD choroid plexus have been limited to less sensitive approaches (55), and transcriptomic studies have been limited to two RNA microarray analyses (97, 98). In the first RNA microarray study, choroid plexus epithelial cells were microdissected from AD and controls with differences related to increased oxidative stress and protein ubiquitin pathways and decreased glutathione-mediated detoxification and urea cycle pathways (99). In the second RNA microarray study, bulk AD choroid plexus were compared to controls with differences related to upregulated metabolic and immune-related pathways and downregulated methionine degradation and protein translation (98). We identified trends in these signaling pathways (p-value of overlap < 0.05, z-score n.s.), including mTOR signaling (98), methionine degradation pathways (98), unfolded protein response (99), protein ubiquitination pathway, (99) urea cycle, (99) and glutathione-mediated detoxification (99). In contrast to previous studies, NRF2 oxidative stress (99) and aldosterone signaling in epithelial cells (99) trended down.
Other altered proteins in aging or AD choroid plexus were identified by non-proteomic studies (33, 35, 100), including basement membrane thickening, decreased clusterin, TTR, LRP2, IGF1, and gelsolin, and increased LRP1 and PGP. We identified 17 proteins associated with the basement membrane (GO cellular component GO:0005604) that were all increased and may be consistent with basement membrane thickening. Clusterin (CLU, also known as APOJ; P10909), an extracellular chaperone that traffics multiple proteins including Aβ in addition to other functions (100), was increased by 2.3-fold (p = 1.42 x 10⁻⁴). LRP1 was detected but not different. LRP2, TTR, PGP, gelsolin, and IGF1 were not detected.
We expected some similarities of proteins when comparing the choroid plexus to other studies evaluating CSF and blood vessel protein expression levels, as the choroid plexus produces CSF and also contains blood vessels. CSF proteomics analyses had identified altered metabolism proteins in AD vs. controls, some differing from the brain tissue (56, 101). Increased glycolysis proteins were identified in CSF, including a top candidate aldolase fructose-bisphosphate A (ALDOA) (101). Whereas, we identified a significant 3.1-fold decrease (p = 1.78 x 10⁻⁵) in ALDOA in the choroid plexus of AD. In a proteomics analysis of Aβ accumulation in blood vessels of cases with cerebral amyloid angiopathy (CAA) in the occipital/parietal lobes, one of the top altered proteins was high-temperature requirement serine peptidase 1 (HTRA1) which is suggested to remove misfolded or mislocalized peptides in an ATP-independent manner (102). From our NeuroPro database, this protein is also increased in a number of other studies in AD from various brain regions (82). Similarly, we identified a 2.8-fold increase in HTRA1 (p = 1.11 x 10⁻³).
Epilepsy vs. control
In the epilepsy vs. control comparison, only one protein (FUCA2) was elevated with many trending proteins in this heterogeneous disease group. In the 216 proteins trending in epilepsy, FUCA1 was also increased and has a similar function to FUCA2 adding fucose to glycoproteins and can be associated with cell migration as suggested from elevation in various tumor types (103). From the pathways associated with trending proteins, there were similarities to those observed in AD when compared to controls that included fatty beta-oxidation and 14-3-3 signaling. There have been no related proteomics or transcriptomics studies in human epilepsy choroid plexus for comparison. It will be of interest in future studies to evaluate larger homogeneous cohorts to identify whether there are additional protein differences, as well as comparison to other AD groups with more mild pathology and AD cases with an epilepsy diagnosis.
AD vs. epilepsy
In the AD vs. epilepsy comparison, most of the protein differences were also found when comparing AD to controls, and so many of the same signaling pathways were identified. Additionally, there was the activation of inflammatory-related pathways such as complement system and pathogen-induced cytokine storm that were associated with a number of complement and collagen proteins. Although there were many differences, the changes in AD also correlated with trends in epilepsy when compared to controls.
TMEM106B was a top protein candidate that was elevated in AD when compared to the epilepsy group. TMEM106B is a type II transmembrane protein that localizes to late endosomes and lysosomes in many cell types, including in both neurons and oligodendrocytes (104). Previous studies have shown that TMEM106B can fibrilize in a similar way as Aβ in AD and that TMEM106B filaments may form in an age-dependent manner (105–107). There was a similar trend for expression levels on LFQ-MS and histology, with differences related to the detection method (i.e., sensitivity and normalization).
The correlation of AD and epilepsy to controls from those proteins significant in at least one pairwise comparison identified a positive correlation, with the majority of proteins changing in the same direction. With these similar trends, as expected, many of the same signaling pathways were identified and were associated with a shift in cellular energy production. Among the top correlated proteins with the highest fold changes, there was increased ATP6V0A4 and decreased APOB. ATP6V0A4 is a vacuolar ATPase (108) and can be involved in several signaling pathways, including those associated with endocytosis. The top pathway associated with ATP6V0A4 (increased by 4.2-fold in AD and by 2.6-fold in epilepsy compared to controls) from the increased proteins in the correlation was the iron homeostasis signaling pathway (p = 3.80 x 10⁻⁴). APOB is an apolipoprotein that transports lipids in plasma and CSF (109) and is also involved in several signaling pathways including endocytosis. APOB is increased in AD CSF and plasma. (109) It is unclear whether these cases have lower APOB levels relative to the many controls with atherosclerosis (110) that were observed on neuropathology and whether these levels reflect those in the adjacent brain tissue or CSF. Some of the top protein differences between AD and epilepsy with the highest fold change from the correlation included increased MFGE8 (milk fat globule EGF and Factor V/VIII domain containing) by 2.5-fold in AD and decreased by 2.2-fold in epilepsy. An increase in AD may be expected as MFGE8 vascular deposition increases with age and it can interact with Aβ (111). As noted above, it will be of interest to evaluate these protein differences further in larger homogeneous epilepsy cohorts, as well as across the AD and epilepsy spectrums of disease. Furthermore, future mechanistic studies will be essential to elucidate the implications of these protein differences, i.e., how the altered signaling pathways directly or indirectly impact CSF production, turnover, and content.
Limitations
Our study had limitations, including a small sample size. Our technique is less sensitive in detecting large membrane proteins, insoluble proteins, and low-abundance proteins (i.e., TTR, AQP1, and APP were not detected). Among the AD and epilepsy disease groups, heterogeneous clinical variables warrant further evaluation in future studies with larger samples, as do genetic risk factors (e.g., APOE, MTOR, APP, and PSEN1). Differences we identified in bulk choroid plexus should be explored with regard to specific cell types.
Conclusion
We identified a shift in cell energy metabolism in the choroid plexus of AD patients with severe neuropathology and similar trends in epilepsy patients. Follow-up studies should evaluate the spectrum of AD and epilepsy, including those cases with dual diagnoses to identify potential molecular drivers of epilepsy and AD. This could empower novel and targeted therapies.
Data availability statement
The datasets presented in this study can be found in online repositories. The names of the repository/repositories and accession number(s) can be found in the article/Supplementary material.
Ethics statement
The studies involving human participants were reviewed and approved by NYU Grossman School of Medicine Institutional Review Board (IRB). The patients/participants provided their written informed consent to participate in this study.
Author contributions
TW, OD, and DL contributed to the conception and design of the manuscript. DL, EK, AF, MT, DF, SD, and BU contributed to data collection. DL and EK performed data analyses. DL wrote the first draft of the manuscript. All authors contributed to the manuscript revision, read, and approved the submitted version.
Funding
This study was supported by NIH grants P30AG066512 and P01AG060882, as well as by Finding a Cure for Epilepsy and Seizures (FACES).
Conflict of interest
DF receives salary support for consulting and clinical trial-related activities performed on behalf of The Epilepsy Study Consortium, a non-profit organization, and receives no personal income for these activities. NYU receives a fixed amount from the Epilepsy Study Consortium toward Dr. DF's salary. Within the past 2 years, The Epilepsy Study Consortium received payments for research services performed by DF from: Biohaven, BioXcell, Cerevel, Cerebral, Epilex, Equilibre, Jannsen, Lundbeck, Praxis, Puretech, Neurocrine, SK Life Science, Supernus, UCB, and Xenon. He has also served as a paid consultant for Neurelis Pharmaceuticals. He has received travel support from the Epilepsy Foundation. He has received research support from NINDS, NSF, and CDC for work unrelated to this study. He holds equity interests in Neuroview Technology. He received royalty income from Oxford University Press.
The remaining authors declare that the research was conducted in the absence of any commercial or financial relationships that could be construed as a potential conflict of interest.
Publisher's note
All claims expressed in this article are solely those of the authors and do not necessarily represent those of their affiliated organizations, or those of the publisher, the editors and the reviewers. Any product that may be evaluated in this article, or claim that may be made by its manufacturer, is not guaranteed or endorsed by the publisher.
Supplementary material
The Supplementary Material for this article can be found online at: https://www.frontiersin.org/articles/10.3389/fneur.2023.1221775/full#supplementary-material
References
1. Mendez M, Lim G. Seizures in elderly patients with dementia: epidemiology and management. Drugs Aging. (2003) 20:791–803. doi: 10.2165/00002512-200320110-00001
2. Born HA. Seizures in Alzheimer's disease. Neuroscience. (2015) 286:251–63. doi: 10.1016/j.neuroscience.2014.11.051
3. Sánchez MP, García-Cabrero AM, Sánchez-Elexpuru G, Burgos DF, Serratosa JM. Tau-induced pathology in epilepsy and dementia: notions from patients and animal models. Int J Mol Sci. (2018) 19:4. doi: 10.3390/ijms19041092
4. Palop JJ, Mucke L. Epilepsy and cognitive impairments in Alzheimer disease. Arch Neurol. (2009) 66:435–40. doi: 10.1001/archneurol.2009.15
5. Rabinowicz AL, Starkstein SE, Leiguarda RC, Coleman AE. Transient epileptic amnesia in dementia: a treatable unrecognized cause of episodic amnestic wandering. Alzheimer Dis Assoc Disord. (2000) 14:231–3. doi: 10.1097/00002093-200010000-00008
6. Sen A, Capelli V, Husain M. Cognition and dementia in older patients with epilepsy. Brain. (2018) 141:1592–608. doi: 10.1093/brain/awy022
7. Miller LA, Galioto R, Tremont G, Davis J, Bryant K, Roth J, et al. Cognitive impairment in older adults with epilepsy: characterization and risk factor analysis. Epilepsy Behav. (2016) 56:113–7. doi: 10.1016/j.yebeh.2016.01.011
8. Kaestner E, Reyes A, Chen A, Rao J, Macari AC, Choi JY, et al. Atrophy and cognitive profiles in older adults with temporal lobe epilepsy are similar to mild cognitive impairment. Brain. (2020) 3:397. doi: 10.1093/brain/awaa397
9. Johnson EL, Krauss GL, Kucharska-Newton A, Albert MS, Brandt J, Walker KA, et al. Dementia in late-onset epilepsy: the atherosclerosis risk in communities study. Neurology. (2020) 95:e3248–e56. doi: 10.1212/WNL.0000000000011080
10. Xu Y, Lavrencic L, Radford K, Booth A, Yoshimura S, Anstey KJ, et al. Systematic review of coexistent epileptic seizures and Alzheimer's disease: Incidence and prevalence. J Am Geriatr Soc. (2021) 69:2011–20. doi: 10.1111/jgs.17101
11. Cortini F, Cantoni C, Villa C. Epileptic seizures in autosomal dominant forms of Alzheimer's disease. Seizure. (2018) 61:4–7. doi: 10.1016/j.seizure.2018.07.015
12. Ezquerra M, Carnero C, Blesa R, Gelpí JL, Ballesta F, Oliva R. A presenilin 1 mutation (Ser169Pro) associated with early-onset AD and myoclonic seizures. Neurology. (1999) 52:566–70. doi: 10.1212/WNL.52.3.566
13. Vöglein J, Willem M, Trambauer J, Schönecker S, Dieterich M, Biskup S, et al. Identification of a rare presenilin 1 single amino acid deletion mutation (F175del) with unusual amyloid-β processing effects. Neurobiol Aging. (2019) 84:241e5–11. doi: 10.1016/j.neurobiolaging.2019.08.034
14. Vossel KA, Beagle AJ, Rabinovici GD, Shu H, Lee SE, Naasan G, et al. Seizures and epileptiform activity in the early stages of Alzheimer disease. JAMA Neurol. (2013) 70:1158–66. doi: 10.1001/jamaneurol.2013.136
15. Vossel KA, Ranasinghe KG, Beagle AJ, Mizuiri D, Honma SM, Dowling AF, et al. Incidence and impact of subclinical epileptiform activity in Alzheimer's disease. Ann Neurol. (2016) 80:858–70. doi: 10.1002/ana.24794
16. Lam AD, Sarkis RA, Pellerin KR, Jing J, Dworetzky BA, Hoch DB, et al. Association of epileptiform abnormalities and seizures in Alzheimer disease. Neurology. (2020) 95:e2259–e70. doi: 10.1212/WNL.0000000000010612
17. Horvath AA, Papp A, Zsuffa J, Szucs A, Luckl J, Radai F, et al. Subclinical epileptiform activity accelerates the progression of Alzheimer's disease: a long-term EEG study. Clin Neurophysiol. (2021) 132:1982–9. doi: 10.1016/j.clinph.2021.03.050
18. Helmstaedter C, Witt JA. Epilepsy and cognition—A bidirectional relationship? Seizure. (2017) 49:83–9. doi: 10.1016/j.seizure.2017.02.017
19. Lam AD, Cole AJ, Cash SS. New approaches to studying silent mesial temporal lobe seizures in Alzheimer's disease. Front Neurol. (2019) 10:959. doi: 10.3389/fneur.2019.00959
20. Sanchez PE, Zhu L, Verret L, Vossel KA, Orr AG, Cirrito JR, et al. Levetiracetam suppresses neuronal network dysfunction and reverses synaptic and cognitive deficits in an Alzheimer's disease model. Proc Natl Acad Sci U S A. (2012) 109:E2895–903. doi: 10.1073/pnas.1121081109
21. Musaeus CS, Shafi MM, Santarnecchi E, Herman ST, Press DZ. Levetiracetam alters oscillatory connectivity in Alzheimer's disease. J Alzheimers Dis. (2017) 58:1065–76. doi: 10.3233/JAD-160742
22. Bakker A, Krauss GL, Albert MS, Speck CL, Jones LR, Stark CE, et al. Reduction of hippocampal hyperactivity improves cognition in amnestic mild cognitive impairment. Neuron. (2012) 74:467–74. doi: 10.1016/j.neuron.2012.03.023
23. Vossel K, Ranasinghe KG, Beagle AJ, La A, Ah Pook K, Castro M, et al. Effect of levetiracetam on cognition in patients with Alzheimer disease with and without epileptiform activity: a randomized clinical trial. JAMA Neurol (. (2021). doi: 10.1001/jamaneurol.2021.3310
24. Sen A, Akinola M, Tai XY, Symmonds M, Davis Jones G, Mura S, et al. An Investigation of Levetiracetam in Alzheimer's Disease (ILiAD): a double-blind, placebo-controlled, randomised crossover proof of concept study. Trials. (2021) 22:508. doi: 10.1186/s13063-021-05404-4
25. Gourmaud S, Shou H, Irwin DJ, Sansalone K, Jacobs LM, Lucas TH, et al. Alzheimer-like amyloid and tau alterations associated with cognitive deficit in temporal lobe epilepsy. Brain. (2020) 143:191–209. doi: 10.1093/brain/awz381
26. Nardi Cesarini E, Babiloni C, Salvadori N, Farotti L, Del Percio C, Pascarelli MT, et al. Late-onset epilepsy with unknown etiology: a pilot study on neuropsychological profile, cerebrospinal fluid biomarkers, and quantitative EEG characteristics. Front Neurol. (2020) 11:199. doi: 10.3389/fneur.2020.00199
27. Choi H, Thacker EL, Longstreth WT, Elkind MSV, Boehme AK. Cognitive decline in older adults with epilepsy: the Cardiovascular Health Study. Epilepsia. (2021) 62:85–97. doi: 10.1111/epi.16748
28. Stefanidou M, Beiser AS, Himali JJ, Peng TJ, Devinsky O, Seshadri S, et al. Bi-directional association between epilepsy and dementia: the Framingham heart study. Neurology. (2020) 95:e3241–e7. doi: 10.1212/WNL.0000000000011077
29. Drummond E, Pires G, MacMurray C, Askenazi M, Nayak S, Bourdon M et al. Phosphorylated tau interactome in the human Alzheimer's disease brain. Brain. (2020) 3:5492. doi: 10.1002/alz.045492
30. Paudel YN, Angelopoulou E, Jones NC, O'Brien TJ, Kwan P, Piperi C, et al. Tau related pathways as a connecting link between epilepsy and Alzheimer's disease. ACS Chem Neurosci. (2019) 10:4199–212. doi: 10.1021/acschemneuro.9b00460
31. Fernandes M, Manfredi N, Aluisantonio L, Franchini F, Chiaravalloti A, Izzi F, et al. Cognitive functioning, cerebrospinal fluid Alzheimer's disease biomarkers and cerebral glucose metabolism in late-onset epilepsy of unknown aetiology: a prospective study. Eur J Neurosci. (2022) 56:5384–96. doi: 10.1111/ejn.15734
32. Gourmaud S, Stewart DA, Irwin DJ, Roberts N, Barbour AJ, Eberwine G, et al. The role of mTORC1 activation in seizure-induced exacerbation of Alzheimer's disease. Brain. (2022) 145:324–39. doi: 10.1093/brain/awab268
33. Benarroch EE. Choroid plexus–CSF system: Recent developments and clinical correlations. Neurology. (2016) 86:286–96. doi: 10.1212/WNL.0000000000002298
34. Krzyzanowska A, Carro E. Pathological alteration in the choroid plexus of Alzheimer's disease: implication for new therapy approaches. Front Pharmacol. (2012) 3:75. doi: 10.3389/fphar.2012.00075
35. Marques F, Sousa JC, Sousa N, Palha JA. Blood-brain-barriers in aging and in Alzheimer's disease. Mol Neurodegener. (2013) 8:38. doi: 10.1186/1750-1326-8-38
36. Choi JD, Moon Y, Kim HJ, Yim Y, Lee S, Moon WJ. Choroid plexus volume and permeability at brain MRI within the alzheimer disease clinical spectrum. Radiology. (2022) 4:212400. doi: 10.1148/radiol.212400
37. Dietrich MO, Spuch C, Antequera D, Rodal I, de Yébenes JG, Molina JA, et al. Megalin mediates the transport of leptin across the blood-CSF barrier. Neurobiol Aging. (2008) 29:902–12. doi: 10.1016/j.neurobiolaging.2007.01.008
38. Perez-Gracia E, Blanco R, Carmona M, Carro E, Ferrer I. Oxidative stress damage and oxidative stress responses in the choroid plexus in Alzheimer's disease. Acta Neuropathol. (2009) 118:497–504. doi: 10.1007/s00401-009-0574-4
39. González-Marrero I, Giménez-Llort L, Johanson CE, Carmona-Calero EM, Castañeyra-Ruiz L, Brito-Armas JM, et al. Choroid plexus dysfunction impairs beta-amyloid clearance in a triple transgenic mouse model of Alzheimer's disease. Front Cell Neurosci. (2015) 9:17. doi: 10.3389/fncel.2015.00017
40. Serot JM, Zmudka J, Jouanny P, A. possible role for CSF turnover and choroid plexus in the pathogenesis of late onset Alzheimer's disease. J Alzheimers Dis. (2012) 30:17–26. doi: 10.3233/JAD-2012-111964
41. Hirvonen J, Kreisl WC, Fujita M, Dustin I, Khan O, Appel S, et al. Increased in vivo expression of an inflammatory marker in temporal lobe epilepsy. J Nucl Med. (2012) 53:234–40. doi: 10.2967/jnumed.111.091694
42. Dolgodilina E, Camargo SM, Roth E, Herzog B, Nunes V, Palacín M, et al. Choroid plexus LAT2 and SNAT3 as partners in CSF amino acid homeostasis maintenance. Fluids Barriers CNS. (2020) 17:17. doi: 10.1186/s12987-020-0178-x
43. Akanuma S, Sakurai T, Tachikawa M, Kubo Y, Hosoya K. Transporter-mediated L-glutamate elimination from cerebrospinal fluid: possible involvement of excitatory amino acid transporters expressed in ependymal cells and choroid plexus epithelial cells. Fluids Barriers CNS. (2015) 12:11. doi: 10.1186/s12987-015-0006-x
44. Rainesalo S, Keränen T, Palmio J, Peltola J, Oja SS, Saransaari P. Plasma and cerebrospinal fluid amino acids in epileptic patients. Neurochem Res. (2004) 29:319–24. doi: 10.1023/B:NERE.0000010461.34920.0c
45. Scheyer RD. Involvement of glutamate in human epileptic activities. Prog Brain Res. (1998) 116:359–69. doi: 10.1016/S0079-6123(08)60448-3
46. Xu J, Patassini S, Rustogi N, Riba-Garcia I, Hale BD, Phillips AM, et al. Regional protein expression in human Alzheimer's brain correlates with disease severity. Commun Biol. (2019) 2:43. doi: 10.1038/s42003-018-0254-9
47. Seyfried NT, Dammer EB, Swarup V, Nandakumar D, Duong DM, Yin L, et al. A multi-network approach identifies protein-specific co-expression in asymptomatic and symptomatic Alzheimer's disease. Cell Syst. (2017) 4:60–72.e4. doi: 10.1016/j.cels.2016.11.006
48. Hales CM, Dammer EB, Deng Q, Duong DM, Gearing M, Troncoso JC, et al. Changes in the detergent-insoluble brain proteome linked to amyloid and tau in Alzheimer's disease progression. Proteomics. (2016) 16:3042–53. doi: 10.1002/pmic.201600057
49. Johnson ECB, Dammer EB, Duong DM, Yin L, Thambisetty M, Troncoso JC, et al. Deep proteomic network analysis of Alzheimer's disease brain reveals alterations in RNA binding proteins and RNA splicing associated with disease. Mol Neurodegener. (2018) 13:52. doi: 10.1186/s13024-018-0282-4
50. Hsieh YC, Guo C, Yalamanchili HK, Abreha M, Al-Ouran R, Li Y, et al. Tau-mediated disruption of the spliceosome triggers cryptic RNA splicing and neurodegeneration in Alzheimer's disease. Cell Rep. (2019) 29:301–16e10. doi: 10.1016/j.celrep.2019.08.104
51. Mendonça CF, Kuras M, Nogueira FCS, Plá I, Hortobágyi T, Csiba L, et al. Proteomic signatures of brain regions affected by tau pathology in early and late stages of Alzheimer's disease. Neurobiol Dis. (2019) 130:104509. doi: 10.1016/j.nbd.2019.104509
52. Drummond E, Nayak S, Faustin A, Pires G, Hickman RA, Askenazi M, et al. Proteomic differences in amyloid plaques in rapidly progressive and sporadic Alzheimer's disease. Acta Neuropathol. (2017) 133:933–54. doi: 10.1007/s00401-017-1691-0
53. Pires G, Ueberheide B, Wisniewski T, Drummond E. Use of affinity purification-mass spectrometry to identify phosphorylated tau interactors in Alzheimer's disease. Methods Mol Biol. (2023) 2561:263–77. doi: 10.1007/978-1-0716-2655-9_14
54. Pires G, Leitner D, Drummond E, Kanshin E, Nayak S, Askenazi M, et al. Proteomic differences in the hippocampus and cortex of epilepsy brain tissue. Brain Commun. (2021) 3:fcab021. doi: 10.1093/braincomms/fcab021
55. Krzyzanowska A, García-Consuegra I, Pascual C, Antequera D, Ferrer I, Carro E. Expression of regulatory proteins in choroid plexus changes in early stages of Alzheimer disease. J Neuropathol Exp Neurol. (2015) 74:359–69. doi: 10.1097/NEN.0000000000000181
56. Johnson ECB, Dammer EB, Duong DM, Ping L, Zhou M, Yin L, et al. Large-scale proteomic analysis of Alzheimer's disease brain and cerebrospinal fluid reveals early changes in energy metabolism associated with microglia and astrocyte activation. Nat Med. (2020) 26:769–80. doi: 10.1038/s41591-020-0815-6
57. Whelan CD, Mattsson N, Nagle MW, Vijayaraghavan S, Hyde C, Janelidze S, et al. Multiplex proteomics identifies novel CSF and plasma biomarkers of early Alzheimer's disease. Acta Neuropathol Commun. (2019) 7:169. doi: 10.1186/s40478-019-0795-2
58. Dammer EB, Ping L, Duong DM, Modeste ES, Seyfried NT, Lah JJ, et al. Multi-platform proteomic analysis of Alzheimer's disease cerebrospinal fluid and plasma reveals network biomarkers associated with proteostasis and the matrisome. Alzheimers Res Ther. (2022) 14:174. doi: 10.1186/s13195-022-01113-5
59. Cummings JL, Morstorf T, Zhong K. Alzheimer's disease drug-development pipeline: few candidates, frequent failures. Alzheimers Res Ther. (2014) 6:37. doi: 10.1186/alzrt269
60. Banik A, Brown RE, Bamburg J, Lahiri DK, Khurana D, Friedland RP, et al. Translation of pre-clinical studies into successful clinical trials for Alzheimer's disease: what are the roadblocks and how can they be overcome? J Alzheimers Dis. (2015) 47:815–43. doi: 10.3233/JAD-150136
61. Schneider LS, Mangialasche F, Andreasen N, Feldman H, Giacobini E, Jones R, et al. Clinical trials and late-stage drug development for Alzheimer's disease: an appraisal from 1984 to 2014. J Intern Med. (2014) 275:251–83. doi: 10.1111/joim.12191
62. Kwon S, Iba M, Kim C, Masliah E. Immunotherapies for aging-related neurodegenerative diseases-emerging perspectives and new targets. Neurotherapeutics. (2020) 17:935–54. doi: 10.1007/s13311-020-00853-2
63. Long JM, Holtzman DM. Alzheimer disease: an update on pathobiology and treatment strategies. Cell. (2019) 179:312–39. doi: 10.1016/j.cell.2019.09.001
64. Reiss AB, Glass AD, Wisniewski T, Wolozin B, Gomolin IH, Pinkhasov A, et al. Alzheimer's disease: many failed trials, so where do we go from here? J Investig Med. (2020) 68:1135–40. doi: 10.1136/jim-2020-001297
65. Wisniewski T, Drummond E. Future horizons in Alzheimer's disease research. Prog Mol Biol Transl Sci. (2019) 168:223–41. doi: 10.1016/bs.pmbts.2019.08.001
66. Kim CK, Lee YR, Ong L, Gold M, Kalali A, Sarkar J. Alzheimer's disease: key insights from two decades of clinical trial failures. J Alzheimers Dis. (2022) 87:83–100. doi: 10.3233/JAD-215699
67. French JA. Refractory epilepsy: clinical overview. Epilepsia. (2007) 48(Suppl 1):3–7. doi: 10.1111/j.1528-1167.2007.00992.x
68. Dalic L, Cook MJ. Managing drug-resistant epilepsy: challenges and solutions. Neuropsychiatr Dis Treat. (2016) 12:2605–16. doi: 10.2147/NDT.S84852
69. Montine TJ, Phelps CH, Beach TG, Bigio EH, Cairns NJ, Dickson DW, et al. National Institute on Aging-Alzheimer's Association guidelines for the neuropathologic assessment of Alzheimer's disease: a practical approach. Acta Neuropathol. (2012) 123:1–11. doi: 10.1007/s00401-011-0910-3
70. Leitner DF, William C, Faustin A, Askenazi M, Kanshin E, Snuderl M, et al. Proteomic differences in hippocampus and cortex of sudden unexplained death in childhood. Acta Neuropathol. (2022) 143:585–99. doi: 10.1007/s00401-022-02414-7
71. Leitner D, Kanshin E, Askenazi M, Faustin A, Friedman D, Devore S, et al. Raphe and ventrolateral medulla proteomics in epilepsy and sudden unexpected death in epilepsy. Brain Commun. (2022) 3:186. doi: 10.1093/braincomms/fcac186
72. Drummond E, Nayak S, Pires G, Ueberheide B, Wisniewski T. Isolation of amyloid plaques and neurofibrillary tangles from archived Alzheimer's disease tissue using laser-capture microdissection for downstream proteomics. Methods Mol Biol. (2018) 1723:319–34. doi: 10.1007/978-1-4939-7558-7_18
73. Leitner DF, Mills JD, Pires G, Faustin A, Drummond E, Kanshin E, et al. Proteomics and transcriptomics of the hippocampus and cortex in SUDEP and high-risk SUDEP patients. Neurology. (2021) 96:e2639–e52. doi: 10.1212/WNL.0000000000011999
74. Drummond E, Nayak S, Ueberheide B, Wisniewski T. Localized proteomics of individual neurons isolated from formalin-fixed, paraffin-embedded tissue sections using laser capture microdissection. Curr Prot Appr Appl Brain Fun. (2017) 4:289–301. doi: 10.1007/978-1-4939-7119-0_18
75. Doellinger J, Schneider A, Hoeller M, Lasch P. Sample preparation by easy extraction and digestion (SPEED)—A universal, rapid, and detergent-free protocol for proteomics based on acid extraction. Mol Cell Proteomics. (2020) 19:209–22. doi: 10.1074/mcp.TIR119.001616
76. Ludwig C, Gillet L, Rosenberger G, Amon S, Collins BC, Aebersold R. Data-independent acquisition-based SWATH-MS for quantitative proteomics: a tutorial. Mol Syst Biol. (2018) 14:e8126. doi: 10.15252/msb.20178126
77. Tyanova S, Temu T, Sinitcyn P, Carlson A, Hein MY, Geiger T, et al. The Perseus computational platform for comprehensive analysis of (prote)omics data. Nat Methods. (2016) 13:731–40. doi: 10.1038/nmeth.3901
78. Heberle H, Meirelles GV, da Silva FR, Telles GP, Minghim R. InteractiVenn: a web-based tool for the analysis of sets through Venn diagrams. BMC Bioinformatics. (2015) 16:169. doi: 10.1186/s12859-015-0611-3
79. Yang AC, Kern F, Losada PM, Agam MR, Maat CA, Schmartz GP, et al. Dysregulation of brain and choroid plexus cell types in severe COVID-19. Nature. (2021) 595:565–71. doi: 10.1038/s41586-021-03710-0
80. Leitner DF, Lin Z, Sawaged Z, Kanshin E, Friedman D, Devore S, et al. Brain molecular mechanisms in Rasmussen encephalitis. Epilepsia. (2023) 64:218–30. doi: 10.1111/epi.17457
81. Leitner DF, Siu Y, Korman A, Lin Z, Kanshin E, Friedman D, et al. Metabolomic, proteomic, and transcriptomic changes in adults with epilepsy on modified atkins diet. Epilepsia. (2023) 3:7540. doi: 10.1111/epi.17540
82. Askenazi M, Kavanagh T, Pires G, Ueberheide B, Wisniewski T, Drummond E. Compilation of all known protein changes in the human Alzheimer's disease brain. bioRxiv. (2023) 4:2023.04.13.536828. doi: 10.1101/2023.04.13.536828
83. Pires G, Leitner D, Drummond EE, Kanshin E, Nayak S, Askenazi M, et al. Proteomic differences in the hippocampus and cortex of epilepsy brain tissue. bioRxiv. (2020) 5:2020.07.21.209163. doi: 10.1101/2020.07.21.209163
84. Leitner DF, Kanshin E, Askenazi M, Siu Y, Friedman D, Devore S, et al. Pilot study evaluating everolimus molecular mechanisms in tuberous sclerosis complex and focal cortical dysplasia. PLoS One. (2022) 17:e0268597. doi: 10.1371/journal.pone.0268597
85. Bough KJ, Wetherington J, Hassel B, Pare JF, Gawryluk JW, Greene JG, et al. Mitochondrial biogenesis in the anticonvulsant mechanism of the ketogenic diet. Ann Neurol. (2006) 60:223–35. doi: 10.1002/ana.20899
86. Cunnane SC, Courchesne-Loyer A, Vandenberghe C, St-Pierre V, Fortier M, Hennebelle M, et al. Can ketones help rescue brain fuel supply in later life? Implications for cognitive health during aging and the treatment of alzheimer's disease. Front Mol Neurosci. (2016) 9:53. doi: 10.3389/fnmol.2016.00053
87. Simpson IA, Carruthers A, Vannucci SJ. Supply and demand in cerebral energy metabolism: the role of nutrient transporters. J Cereb Blood Flow Metab. (2007) 27:1766–91. doi: 10.1038/sj.jcbfm.9600521
88. Winkler EA, Nishida Y, Sagare AP, Rege SV, Bell RD, Perlmutter D, et al. GLUT1 reductions exacerbate Alzheimer's disease vasculo-neuronal dysfunction and degeneration. Nat Neurosci. (2015) 18:521–30. doi: 10.1038/nn.3966
89. Avgerinos KI, Egan JM, Mattson MP, Kapogiannis D. Medium Chain Triglycerides induce mild ketosis and may improve cognition in Alzheimer's disease. A systematic review and meta-analysis of human studies. Ageing Res Rev. (2020) 58:101001. doi: 10.1016/j.arr.2019.101001
90. Giannos P, Prokopidis K, Lidoriki I, Triantafyllidis KK, Kechagias KS, Celoch K, et al. Medium-chain triglycerides may improve memory in non-demented older adults: a systematic review of randomized controlled trials. BMC Geriatr. (2022) 22:817. doi: 10.1186/s12877-022-03521-6
91. Lilamand M, Mouton-Liger F, Di Valentin E, Sànchez Ortiz M, Paquet C. Efficacy and safety of ketone supplementation or ketogenic diets for Alzheimer's disease: a mini review. Front Nutr. (2021) 8:807970. doi: 10.3389/fnut.2021.807970
92. Rusek M, Pluta R, Ułamek-Kozioł M, Czuczwar SJ. Ketogenic diet in Alzheimer's disease. Int J Mol Sci. (2019) 20:3892. doi: 10.3390/ijms20163892
93. Qin L, Guo J, Zheng Q, Zhang H. BAG2 structure, function and involvement in disease. Cell Mol Biol Lett. (2016) 21:18. doi: 10.1186/s11658-016-0020-2
94. Layfield R, Fergusson J, Aitken A, Lowe J, Landon M, Mayer RJ. Neurofibrillary tangles of Alzheimer's disease brains contain 14-3-3 proteins. Neurosci Lett. (1996) 209:57–60. doi: 10.1016/0304-3940(96)12598-2
95. Lu Y. Early increase of cerebrospinal fluid 14-3-3ζ protein in the alzheimer's disease continuum. Front Aging Neurosci. (2022) 14:941927. doi: 10.3389/fnagi.2022.941927
96. Gu Q, Cuevas E, Raymick J, Kanungo J, Sarkar S. Downregulation of 14-3-3 proteins in Alzheimer's disease. Mol Neurobiol. (2020) 57:32–40. doi: 10.1007/s12035-019-01754-y
97. Berg AT, Langfitt J, Shinnar S, Vickrey BG, Sperling MR, Walczak T, et al. How long does it take for partial epilepsy to become intractable? Neurology. (2003) 60:186–90. doi: 10.1212/01.WNL.0000031792.89992.EC
98. Stopa EG, Tanis KQ, Miller MC, Nikonova EV, Podtelezhnikov AA, Finney EM, et al. Comparative transcriptomics of choroid plexus in Alzheimer's disease, frontotemporal dementia and Huntington's disease: implications for CSF homeostasis. Fluids Barriers CNS. (2018) 15:18. doi: 10.1186/s12987-018-0102-9
99. Bergen AA, Kaing S., ten Brink JB, Gorgels TG, Janssen SF, Bank NB. Gene expression and functional annotation of human choroid plexus epithelium failure in Alzheimer's disease. BMC Genomics. (2015) 16:956. doi: 10.1186/s12864-015-2159-z
100. Foster EM, Dangla-Valls A, Lovestone S, Ribe EM, Buckley NJ. Clusterin in Alzheimer's disease: mechanisms, genetics, and lessons from other pathologies. Front Neurosci. (2019) 13:164. doi: 10.3389/fnins.2019.00164
101. Higginbotham L, Ping L, Dammer EB, Duong DM, Zhou M, Gearing M, et al. Integrated proteomics reveals brain-based cerebrospinal fluid biomarkers in asymptomatic and symptomatic Alzheimer's disease. Sci Adv. (2020) 6:9360. doi: 10.1126/sciadv.aaz9360
102. Zellner A, Müller SA, Lindner B, Beaufort N, Rozemuller AJM, Arzberger T, et al. Proteomic profiling in cerebral amyloid angiopathy reveals an overlap with CADASIL highlighting accumulation of HTRA1 and its substrates. Acta Neuropathol Commun. (2022) 10:6. doi: 10.1186/s40478-021-01303-6
103. Zhong A, Chen T, Xing Y, Pan X, Shi M. FUCA2 is a prognostic biomarker and correlated with an immunosuppressive microenvironment in pan-cancer. Front Immunol. (2021) 12:758648. doi: 10.3389/fimmu.2021.758648
104. Feng T, Lacrampe A, Hu F. Physiological and pathological functions of TMEM106B: a gene associated with brain aging and multiple brain disorders. Acta Neuropathol. (2021) 141:327–39. doi: 10.1007/s00401-020-02246-3
105. Schweighauser M, Arseni D, Bacioglu M, Huang M, Lövestam S, Shi Y, et al. Age-dependent formation of TMEM106B amyloid filaments in human brains. Nature. (2022) 605:310–4. doi: 10.1038/s41586-022-04650-z
106. Perneel J, Neumann M, Heeman B, Cheung S, Van den Broeck M, Wynants S, et al. Accumulation of TMEM106B C-terminal fragments in neurodegenerative disease and aging. Acta Neuropathol. (2023) 145:285–302. doi: 10.1007/s00401-022-02531-3
107. Chang A, Xiang X, Wang J, Lee C, Arakhamia T, Simjanoska M, et al. Homotypic fibrillization of TMEM106B across diverse neurodegenerative diseases. Cell. (2022) 185:1346–55. doi: 10.1016/j.cell.2022.02.026
108. Song Q, Meng B, Xu H, Mao Z. The emerging roles of vacuolar-type ATPase-dependent Lysosomal acidification in neurodegenerative diseases. Transl Neurodegener. (2020) 9:17. doi: 10.1186/s40035-020-00196-0
109. Picard C, Nilsson N, Labonté A, Auld D, Rosa-Neto P, Ashton NJ, et al. Apolipoprotein B is a novel marker for early tau pathology in Alzheimer's disease. Alzheimers Dement. (2022) 18:875–87. doi: 10.1002/alz.12442
110. Williams KJ, Wu X. Imbalanced insulin action in chronic over nutrition: Clinical harm, molecular mechanisms, and a way forward. Atherosclerosis. (2016) 247:225–82. doi: 10.1016/j.atherosclerosis.2016.02.004
Keywords: Alzheimer's disease, epilepsy, choroid plexus, proteomics, laser capture microdissection
Citation: Leitner DF, Kanshin E, Faustin A, Thierry M, Friedman D, Devore S, Ueberheide B, Devinsky O and Wisniewski T (2023) Localized proteomic differences in the choroid plexus of Alzheimer's disease and epilepsy patients. Front. Neurol. 14:1221775. doi: 10.3389/fneur.2023.1221775
Received: 12 May 2023; Accepted: 22 June 2023;
Published: 14 July 2023.
Edited by:
Sudeshna Das, Massachusetts General Hospital and Harvard Medical School, United StatesReviewed by:
Dana Niedowicz, University of Kentucky, United StatesMiren Altuna, Fundacion CITA Alzheimer, Spain
Copyright © 2023 Leitner, Kanshin, Faustin, Thierry, Friedman, Devore, Ueberheide, Devinsky and Wisniewski. This is an open-access article distributed under the terms of the Creative Commons Attribution License (CC BY). The use, distribution or reproduction in other forums is permitted, provided the original author(s) and the copyright owner(s) are credited and that the original publication in this journal is cited, in accordance with accepted academic practice. No use, distribution or reproduction is permitted which does not comply with these terms.
*Correspondence: Thomas Wisniewski, Thomas.Wisniewski@nyulangone.org; Orrin Devinsky, Orrin.Devinsky@nyulangone.org