 Natalia Jiménez1,2
 Òscar Reig1,2,3
 Ruth Montalbo1,2Maria Milà-Guasch1Lluis Nadal-Dieste1,3
 Giancarlo Castellano4Juan José Lozano5Iván Victoria1,2,3Albert Font6Alejo Rodriguez-Vida7Joan Carles8Cristina Suárez8Montserrat Domènech9Núria Sala-González10Pedro Luis Fernández11Leonardo Rodríguez-Carunchio12
 Sherley Díaz12
 Aleix Prat1,2,3,13Mercedes Marín-Aguilera1,2,3*
 Begoña Mellado1,2,3,13*
- 1Translational Genomics and Targeted Therapeutics in Solid Tumors Lab, Institut d'Investigacions Biomèdiques August Pi i Sunyer (IDIBAPS), Barcelona, Spain
- 2Translational Genomics and Targeted Therapeutics in Solid Tumors Lab, Fundació Clínic per a la Recerca Biomèdica, Barcelona, Spain
- 3Medical Oncology Department, Hospital Clínic, Barcelona, Spain
- 4Genomic Unit, Institut d'Investigacions Biomèdiques August Pi i Sunyer (IDIBAPS), Barcelona, Spain
- 5Bioinformatics Platform, Centro de Investigación Biomédica en Red de Enfermedades Hepáticas y Digestivas (CIBEREHD), Barcelona, Spain
- 6Medical Oncology Department, Institut Català d'Oncologia, Hospital Germans Trias i Pujol, Badalona, Spain
- 7Medical Oncology Department, Institut Hospital del Mar d’Investigacions Mèdiques (IMIM), Hospital del Mar, Barcelona, Spain
- 8Vall d’Hebron Institute of Oncology, Vall d’Hebron University Hospital, Barcelona, Spain
- 9Medical Oncology Department, Fundació Althaia Manresa, Barcelona, Spain
- 10Oncology Department, Institut Català d’Oncologia, Hospital Universitari Doctor Josep Trueta, Girona, Spain
- 11Department of Pathology, Hospital Germans Trias i Pujol, IGTP and Universidad Autonoma de Barcelona, Badalona, Spain
- 12Department of Pathology, Hospital Clínic, Barcelona, Spain
- 13Department of Medicine, University of Barcelona, Barcelona, Spain
The prostatic tumor cells plasticity is involved in resistance to hormone-therapy, allowing these cells to survive despite androgen receptor inhibition. However, its role in taxanes resistance has not been fully established. Gene expression of plasticity-related phenotypes such as epithelial-mesenchymal transition (EMT), stem cell-like and neuroendocrine (NE) phenotypes was studied in vitro, in silico, in circulating tumor cells (CTCs) (N=22) and in tumor samples (N=117) from taxanes-treated metastatic castration-resistant prostate cancer (mCRPC) patients. Docetaxel (D)-resistant cells presented a more pronounced EMT phenotype than cabazitaxel (CZ)-resistant cells. In silico analysis revealed ESRP1 down-regulation in taxane-exposed mCRPC samples. Cell plasticity-related changes occurred in CTCs after taxanes treatment. Tumor EMT phenotype was associated with lower PSA progression-free survival (PFS) to D (P<0.001), and better to CZ (P=0.002). High ESRP1 expression was independently associated with longer PSA-PFS (P<0.001) and radiologic-PFS (P=0.001) in D and shorter PSA-PFS in the CZ cohort (P=0.041). High SYP expression was independently associated with lower PSA-PFS in D (P=0.003) and overall survival (OS) in CZ (P=0.002), and high EZH2 expression was associated with adverse OS in D-treated patients (P=0.013). In conclusion, EMT profile in primary tumor is differentially associated with D or CZ benefit and NE dedifferentiation correlates with adverse taxanes clinical outcome.
Introduction
Cell plasticity refers to the ability of cancer cells to switch their phenotype in response to environmental conditions, facilitating therapy fail. Specifically in prostate cancer (PC) cell plasticity allows cancer cells to reprogram and survive despite androgen receptor (AR) inhibition, being considered one of the mechanisms involved in androgen deprivation therapy (ADT) resistance (1). Throughout this process, tumor cells may develop epithelial-mesenchymal transition (EMT), and/or evolve towards an stem cell-like (SCL) or neuroendocrine (NE) phenotypes, and it is possible that they acquire mixed or intermediate phenotypes (2, 3).
ADT, novel hormone-therapies consisting in AR signaling inhibitors (ARSI; abiraterone or enzalutamide), and taxanes, chemotherapy agents that act by blocking microtubules depolymerization, are the most used therapies in metastatic PC (4–8). Today, a high percentage of patients with disseminated PC receive novel hormone-therapies at early stages of disease: in combination with ADT in non-castrate PC, in non-metastatic castration-resistant PC or as first-line treatment for metastatic castration-resistant PC (mCRPC). Taxanes are used after ARSI progression but its clinical activity may be eventually compromised by the development of cell plasticity-related phenotypes (9, 10). Furthermore, different degrees of NE dedifferentiation (from pure, mixed or intermediate adenocarcinoma/NE phenotypes) have been observed in biopsies from mCRPC patients who progressed to abiraterone and its presence is associated with an adverse clinical outcome (11). Moreover, no specific clinical strategies are defined based on the presence of these phenotypes and no targeted therapies have demonstrated benefit in mCRPC patients.
On the other hand, although there is growing evidence that tumor cell plasticity is a relevant biological event involved in therapeutic resistance and aggressive evolution of PC, the presence of these cell plasticity related phenotypes already in the primary tumor and its impact in the therapeutic response and clinical outcome has not been fully described.
In the present study we investigated the presence and potential role in predicting tumor evolution of EMT, SCL and NE cell plasticity-related phenotypes in CRPC cell lines, in silico, in circulating tumor cells (CTCs) and in tumor biopsies from mCRPC taxanes-treated patients.
Materials and Methods
Establishment of Taxane-Resistant Cells
DU-145 and PC-3 cells were purchased from American Type Culture Collection (ATCC). They were converted to docetaxel-resistant (DU-145DR and PC-3DR, respectively) and to cabazitaxel-resistant cells (DU-145CZR and PC-3CZR, respectively) by exposing them to an initial dose of 1.3 nM of docetaxel (D) and 0.6 nM of cabazitaxel (CZ), respectively, and culturing surviving cells with stepwise increasing doses in an intermittent regimen until a concentration of 6 nM during one year approximately. A subset of parental cells was cultured alongside the resistant ones as a control. All cell lines were authenticated using Human 9-Marker STR Profile and Interspecies Contamination Test by IDEXX BioAnalytics.
DU-145 and PC-3 cell lines were cultured in RPMI 1640 medium (Gibco, Life Technologies, Paisley, UK) and in F-12K nutrient mixture medium (Gibco), respectively, both supplemented with 10% fetal bovine serum (FBS). D and CZ drugs (MedChem Express, Monmouth Junction, NJ, USA) were dissolved in 10 mM in DMSO. D and CZ-resistant cells were maintained in 2 nM of D or CZ-containing medium, respectively.
Cell Viability Assays
Cells were seeded at a density of 3,000 cells/well in a 96-well microtiter plate. After 24 h, cells were exposed to D or CZ (MedChem Express, Monmouth Junction, NJ, USA) for an additional 72 h. Cell viability was assessed by using Cell Titer 96 Aqueous One Solution Cell Proliferation Assay kit (Promega, Madison, WI, USA) according to instructions protocol.
Cell Adhesion and Proliferation Measurement
Quantitative monitoring of cell adhesion and proliferation was performed using the xCELLigence real-time cell analysis (RTCA) system, which measures the change in electrical impedance expressed as the Cell Index (CI). Experiments were carried out in a RTCA DP Instrument (ACEA Bio-sciences, San Diego, CA, USA) placed in a humidified incubator maintained at 37 °C with 5% CO2 according to manufacturer instructions. Briefly, 50 µl of cell-free medium with 10% FBS was added to the wells of E-16 plates for background impedance detection, then 5,000 cells/well were seeded. Cell Index was monitored for 90 h, the first 4 h every 1 min, then once every 30 min. Monitoring of the cells over the first hours provides adhesion data, while over the subsequent hours provides proliferation data. Each cell line was tested in triplicate. The rate of adhesion and proliferation were determined by calculating the averaged slopes of the curves between two given time points. Data were analyzed by RTCA 2.0 software (ACEA Bio-sciences).
Cell Migration Assay
Cell migration was performed using the Cultrex 96 Well Cell Migration Assay (Trevigen, Gaithersburg, MD, USA) for 24 h and quantified using Calcein-AM according to the manufacturer’s instructions. Each assay was performed in sextuplicate and the experiment was repeated twice, independently.
Western Blot Analysis
Whole-cell extracts were prepared and Western blot analysis performed as described previously (12). Nitrocellulose membranes were blocked, incubated and washed following the Odyssey System (Li-Cor Biosciences, Lincoln, NE, USA) recommendations. Blots were scanned with an Odyssey Infrared Imaging System (Li-Cor Biosciences).
Antibodies used were Aurora A (D3E4Q) (AURKA) (ref. 14475), AXL (C89E7) (ref. 8661), CD44 (156-3C11) (ref. 3570), E-cadherin (CDH1) (ref. 4065), N-cadherin (CDH2) (ref. 4061), N-MYC (D4B2Y) (ref. 51705), Synaptophysin (D35Ea) (SYP) (ref. 5461), Vimentin (R28) (VIM) (ref. 3932), β-Catenin (6B3) (CTNNB1) (ref. 9582) purchased from Cell-Signaling Technology (Leiden, The Netherlands). Actin (ref. A2066), CHGA (ref. AMAb90525), ESRP1 (ref. HPA023719), and Monoclonal Anti-α-Tubulin clone B-5-1-2 (TUB) (ref. T5168) were purchased from Sigma-Aldrich (St. Louis, MO, USA). ZEB1 (H-102) antibody (ref. sc-25388) was purchased from Santa Cruz Biotechnology (Santa Cruz, CA, USA).
RNA Extraction
Total RNA from cell lines and CTCs samples was isolated using the Trizol Reagent (Tri-reagent solution; Invitrogen) according to the manufacturer’s protocol. For microarray hybridizations, RNA from cell lines was purified (from aqueous phase of Trizol lysis) using RNeasy Micro kit (QIAGEN, Hilden, Germany). In case of formalin-fixed paraffin-embedded (FFPE) tumor samples, total RNA was isolated using RecoverAll Total Nucleic Acid Isolation Kit (Invitrogen) according to the manufacturer's instructions. RNA was quantified by NanoDrop Spectrophotometer ND-1000 (Thermo Scientific, Wilmington, MA, USA) and RNA quality for microarrays was assessed using a Bioanalyzer 2100 (Agilent, Santa Clara, CA).
Gene Expression Analysis
One μg of total RNA from cell lines and 0.5 μg from tissue biopsies and CTCs was reverse transcribed using the High Capacity cDNA Archive Kit (Life Technologies), following manufacturer’s instructions. In case of tissues and CTCs samples, cDNA samples were pre-amplified using TaqMan PreAmp Master Mix kit following manufacturer's instructions (Applied Biosystems, Foster City, CA, USA), except that the final reaction volume of the reaction was 12.5 μl.
Real-time quantitative reverse-transcription PCR (qRT-PCR) was performed in duplicate using a StepOne Plus Real-Time PCR system (Applied Biosystems), according to the manufacturer’s recommendations. Data were acquired using Step One Software v2.2.2. Expression values were based on the quantification cycle (Cq) from target genes relative to the Cq of the housekeeping genes GUSB in cell lines and tissue samples and ACTB in CTCs (DCq). Minus DCq values were considered as the expression level in tissue samples. Relative expression with respect to each reference group studied was reported as fold change or log2ratio. Target genes were amplified using commercial primers and probes (Applied Biosystems): ACTB (Hs99999903_m1), AURKA (Hs01582073_m1), AXL (Hs01064444_m1), CD44 (Hs01075861_m1), CDH1 (Hs01023895_m1), CDH2 (Hs00169953_m1), CHGA (Hs00900375_m1), CTNBB1 (Hs00170025_m1), ESRP1 (Hs00214472_m1), EZH2 (Hs00544830_m1), GUSB (Hs99999908_m1), MYCN (Hs00232074_m1), SYP (Hs00300531_m1), TC2N (Hs01120134_m1), TWIST1 (Hs01675818_s1), VIM (Hs00185584_m1), ZEB1 (Hs01566407_m1).
Microarrays Hybridization and Differential Expression Analysis
RNA samples from parental and resistant cell lines were processed using WT PLUS chemistry (Affymetrix, Santa Clara, CA, USA). Fragmented and labelled ss-cDNA was prepared according to Affymetrix WT PLUS Reagent Kit user guide. Following fragmentation and terminal labelling, 5.2 µg of ss-cDNA were hybridized for 16 h at 45 °C on GeneChip Human Gene 2.0 ST Arrays (Affymetrix, Santa Clara, CA, USA). Arrays were washed and stained in the Affymetrix Fluidics Station 450. GeneChips were scanned using the Affymetrix GeneCHip Scanner 3000 System.
Raw expression data from microarrays were normalized using the robust multiarray algorithm (13) with a custom probe set definition that mapped probes to Entrez Gene IDs (hugene20st_Hs_ENTREZG) (14). After this step, a filtering was done to obtain the 5% genes with the lowest coefficient of variation. Finally, to identify differentially expressed genes between the different microarray study groups, we employed LIMMA (15) to estimate moderated t-statistics and to select statistically differentially expressed genes.
Significant genes were selected if they accomplished a fold change (|FC|)≥1.5 and false discovery rate (FDR)<0.05. Differentially expressed genes of resistant versus parental cells were mapped against the Kyoto Encyclopedia of Genes and Genomes (KEGG) pathway database (16) and analysis was performed using clusterProfiler (v3.8.1) R package.
Gene interactions were studied using the Ingenuity Pathway Analysis (IPA) software (QIAGEN).
We defined signatures for epithelial-mesenchymal transition (EMT) (345 EMT-related genes from the dbEMT database (17) plus ESRP1), stem cell-like (SCL) [659 genes from five expression profiles (18–21) using StemChecker online (22)] and neuroendocrine (NE) prostate cancer (NEPC) [70 NE-related genes from the integrated NEPC score (23) plus ASCL1, AURKB, CHGA, and SYP (24)], and tested them in silico in our microarray data. Hierarchical cluster analysis of these signatures was performed using Cluster 3.0 (25) and results were visualized in Java TreeView (26).
Circulating Tumor Cells Enrichment
Blood circulating tumor cells (CTCs) enrichment was performed using the IsoFlux System (Fluxion Biosciences, South San Francisco, CA, USA). Two 10 mL EDTA tubes were collected from patients before taxanes initiation and after three cycles or at progression. One of the tubes was used for CTCs counting with the IsoFlux CTC Enumeration Kit, according to manufacturer’s instructions. CTCs were defined as nucleated cells, morphologically intact, cytokeratin positive and CD45 negative cells. The second EDTA tube was used for gene expression analysis. Briefly, peripheral blood mononuclear cells were isolated by Ficoll (GE Healthcare, Uppsala, Sweden) gradient and IsoFlux Rare Cell Enrichment Kit was used to incubate them with customized anti-epithelial cell adhesion molecule (EPCAM), prostate stem cell antigen (PSCA) and N-cadherin (CDH2)-coated beads for 2 h at 4 °C. Cell-beads complexes were loaded into Isoflux cartridges to be isolated automatically by the instrument. Cells returned by the instrument were stained or total RNA was extracted.
In Silico Analysis in Prostate Cancer
The alteration status of genes involved in EMT, SCL, and NE cell plasticity related phenotypes was studied in an in silico analysis including seven PC studies summing a total of 1,131 samples (23, 27–32) obtained from cBioportal for Cancer Genomics platform (http://cbioportal.org) (33, 34).
RNA-seq data from Abida et al. (35) were also downloaded from cBioportal and analyzed. Boxplots representing log FPKM (Fragments Per Kilobase of exon per Million fragments mapped) were generated by R (v.3.6.3) software.
Patients and Samples
We retrospectively collected tumor samples from patients diagnosed with mCRPC treated with D (75 mg/m2 iv every 3 weeks) or CZ (25 mg/m2 iv every 3 weeks or 10 mg/m2 iv weekly), both in association with prednisone (10 mg/day p.o), with available FFPE tumor tissue from several institutions.
Patients under the same treatment regimen with the possibility of extracting CTCs samples were prospectively included as a part of an ongoing prospective biomarker study in our institution. Blood samples were extracted before starting treatment and after 3 cycles and/or at time of progression
Treatment-response criteria and progressive-disease definitions followed Prostate Cancer Working Group 2 criteria (36).
Statistical Analysis
In vitro experiments data were expressed as mean ± SD and analyzed by Student t-test. All tests were 2-sided and P-values <0.05 were considered significant. Optimal cut-offs for gene expression were assessed using maximally selected log-rank statistics (Maxstat package) (37). PSA progression-free survival (PFS), radiologic-PFS (RX-PFS), and overall survival (OS) were calculated from the date of taxanes initiation to PSA progression, radiologic progression, and death or last follow-up visit, respectively, and were evaluated by log-rank test. Univariate analysis of gene expression levels and other clinical variables was performed by Cox regression; P<0.1 was required for inclusion in multivariate analysis. Test of interaction was performed by entering into proportional hazard models selected multiplicative interaction terms between two binary variables: treatment (D or CZ) and ESRP1 expression (high or low). Changes in gene expression in CTCs samples before and after treatment were analyzed by Wilcoxon signed-rank test. SPSS 12.0 and R (v.3.6.3) softwares were used for statistical analyses.
Results
Phenotypic Characterization of Docetaxel and Cabazitaxel-Resistant Cells
Docetaxel (D) and cabazitaxel (CZ) resistant cell lines (DR and CZR, respectively) were generated from CRPC cell line models DU-145 and PC-3. DU-145DR and PC-3DR cells acquired levels of resistance to D that were 1.5 to 2.1 times higher than their parental cells. The levels of resistance to CZ for DU-145CZR and PC-3CZR were 2.2 to 4.5 times higher than their parental cells (Figure 1A). DR and CZR cells were also resistant to CZ and D, respectively, suggesting the existence of a cross resistance between both agents. Phenotypically, DR differed from CZR cells when compared to parental cells: DR cells were more elongated, with lower adhesion and proliferation, and higher migration rates, while CZR cells were more rounded and similar to parental cells, with similar (DU-145 model) or higher (PC-3 model) adhesion and lower proliferation rates, and without significant differences in migration rate (Figures 1B–E). These patterns suggest that DR cells have more motility abilities than CZR cells.
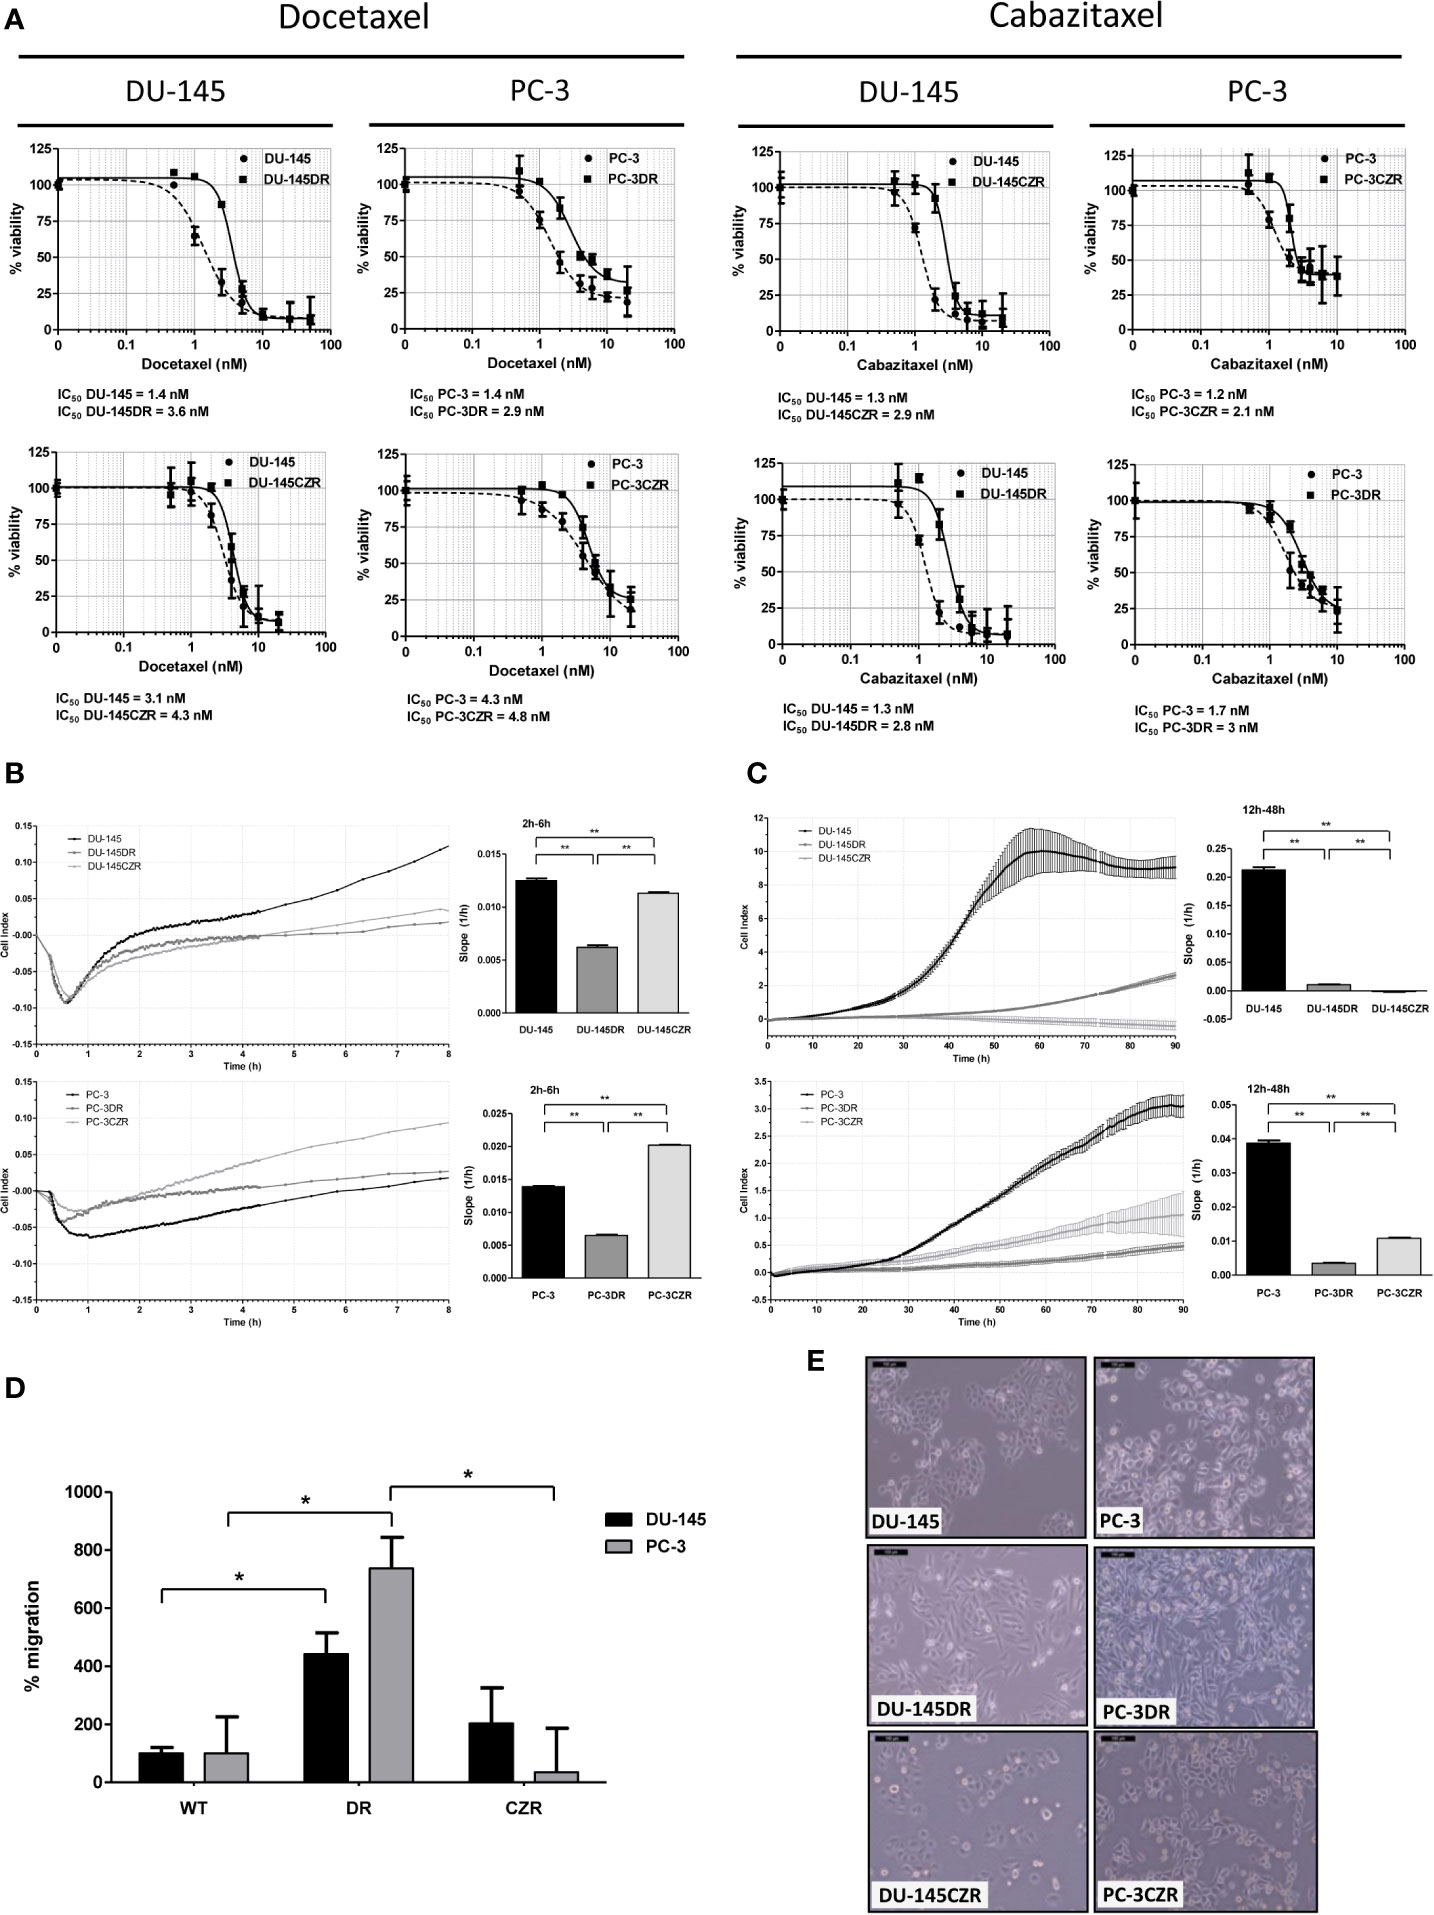
Figure 1 Taxane-resistant cells characterization. (A) Cell-viability assays (MTS) of docetaxel (D) and cabazitaxel (CZ)-treatment in D-resistant (DR) and CZ-resistant (CZR) cells and their respective parental cells (DU-145 and PC-3). IC50 value of each cell line from these MTS assays is indicated. Results are represented as mean of % viability ± SD. Each treatment was carried out in triplicate for 72 h. (B) Cell adhesion curves of parental and resistant cells. Data is plotted as mean of Cell Index. Adhesion rates (bar-graphs) were determined by analyzing the slope of the lines between the 2 h and 6 h interval. (C) Cell proliferation curves of parental and resistant cells. Data is plotted as mean of Cell Index ± SD. Proliferation rates (bar-graphs) were determined by analyzing the slope of the lines between the 12 h and 24 h interval. (D) Migration rate quantification of DR and CZR cells versus their respective parental cells. Results are represented as mean of % migration ± SD. Significant differences are indicated as *P < 0.05 and **P < 0.001 (Student t-test). (E) Light microscopy images (100X) showing the morphology of DR and CZR cells (cultured with 2 nM of D or CZ, respectively) and their respective parental cells.
Differentially Expressed Genes in Taxane-Resistant Versus Parental Cell Lines
We performed cDNA microarrays to study the gene expression changes related to taxanes-acquired resistance in the above characterized cell lines. The microarray data analysis revealed 625 and 147 differentially deregulated genes in DR and CZR versus parental cells (|FC|≥1.5 and FDR<0.05), respectively (Figure 2A and Tables S1 and S2). KEGG pathway enrichment and Ingenuity network analysis showed the relevance of EMT and NFKβ pathway in both D and CZ-resistance, among other deregulated pathways. Of note, ESRP1 appeared highly underexpressed in DR models (Figure S1A–C).
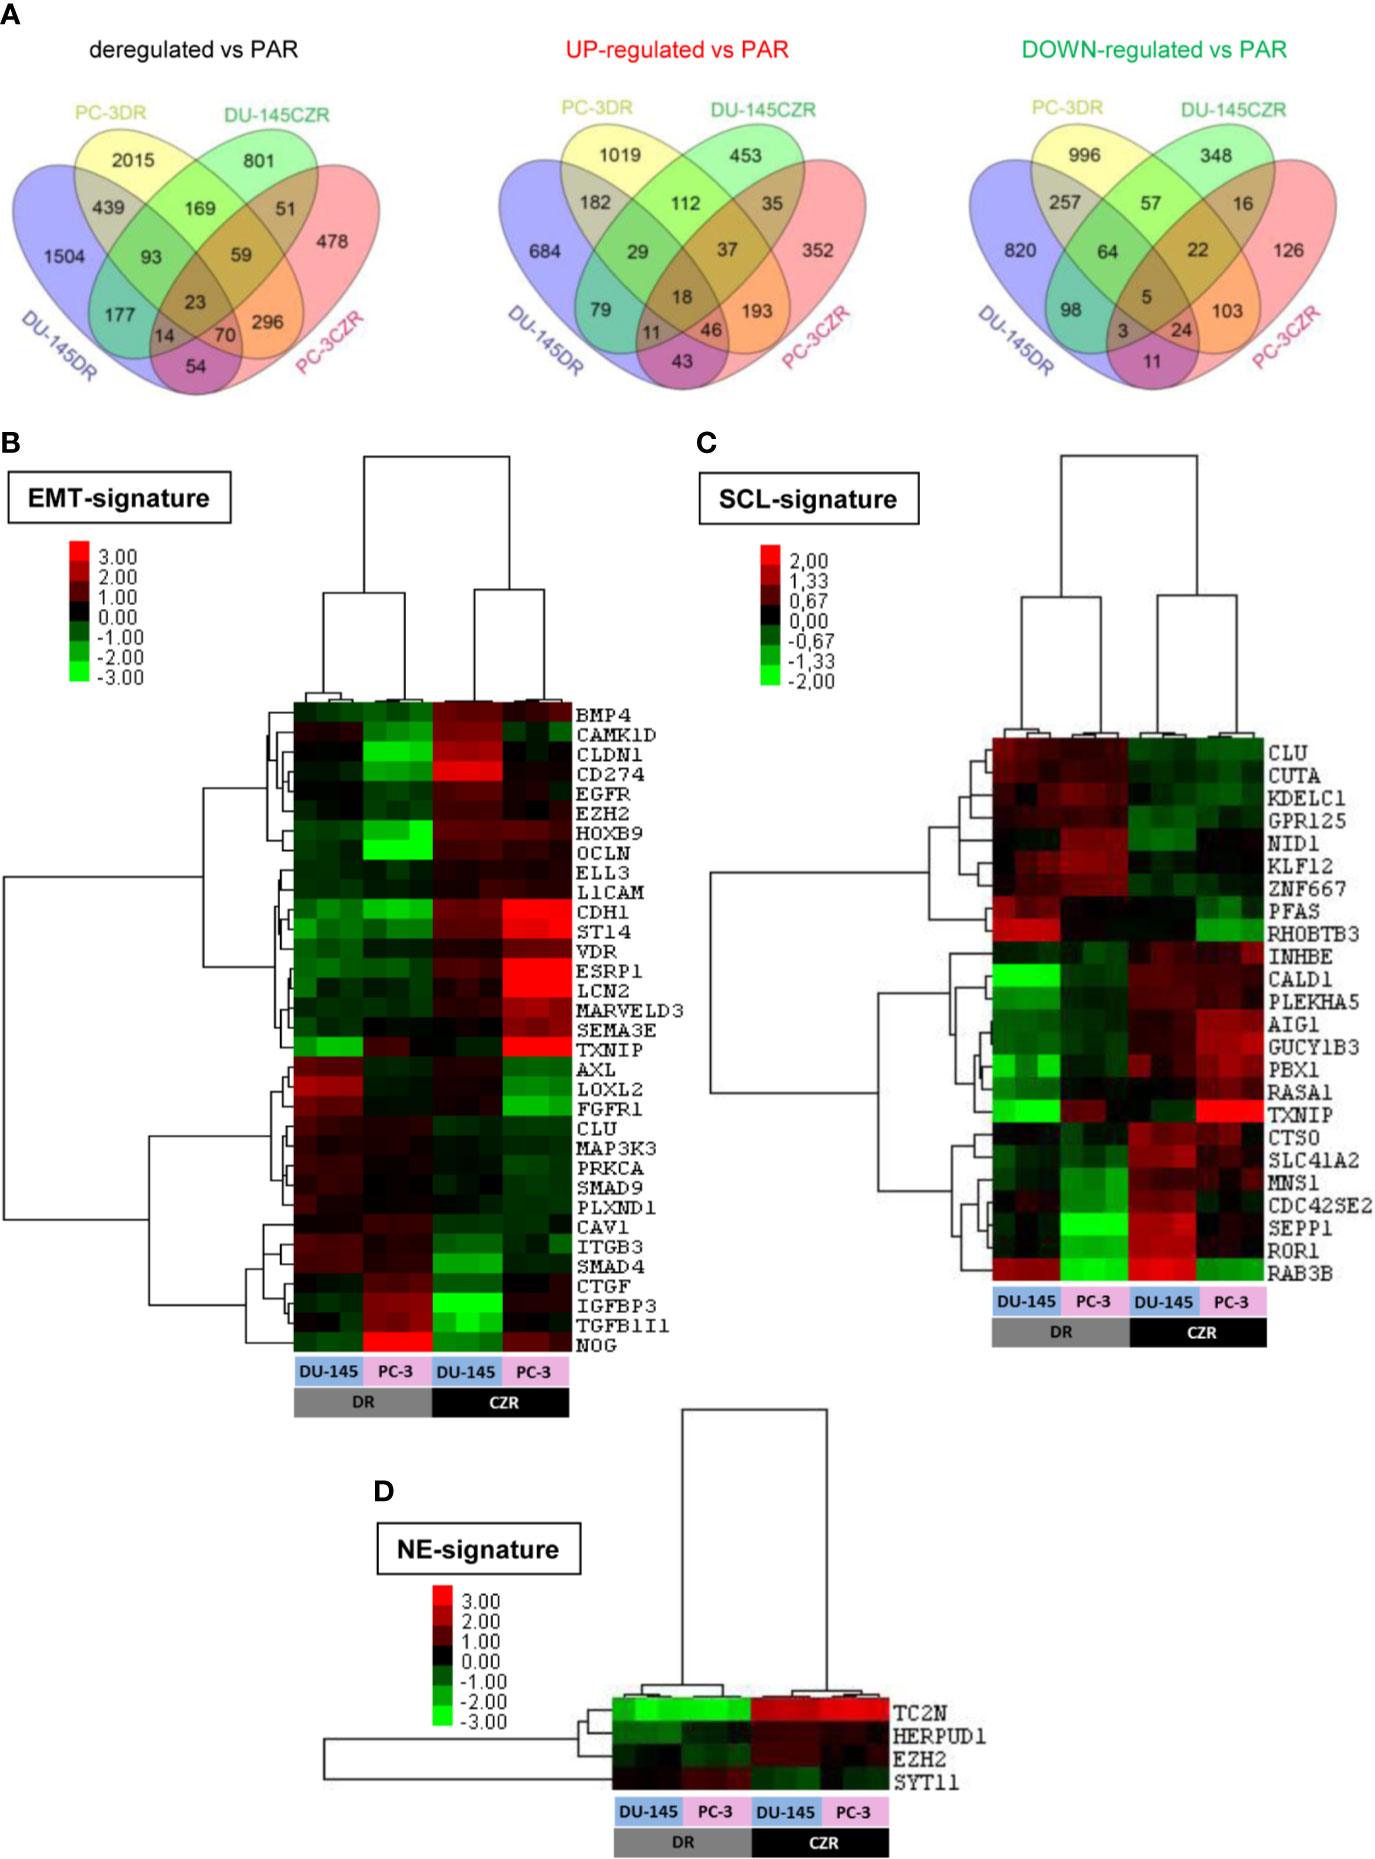
Figure 2 Differentially expressed genes in docetaxel-resistant (DR) and cabazitaxel-resistant (CZR) cell lines from microarray data. (A) Venn Diagram of the differentially expressed genes between DR and CZR cell lines versus their respective parental cells (PAR). (B) Hierarchical clustering expression heatmap for expression values of the epithelial-mesenchymal transition (EMT)-signature in DR and CZR cell lines. (C) Hierarchical clustering expression heatmap for expression values of the neuroendocrine (NE)-signature in DR and CZR cell lines. (D) Hierarchical clustering expression heatmap for expression values of the NE-signature in DR and CZR cell lines.
Twenty-three genes were commonly deregulated in both DR and CZR versus parental cells (|FC|≥1.5 and FDR<0.05) (Figure 2A and Table S3). Among them, ZEB1 and ITGB3 were up-regulated and BMP4 was down-regulated. Ingenuity network analysis showed that the most relevant network had two significant nodes around EGFR and ITGB3 genes and the EMT-related markers, ZEB1 and TRPC1, appeared overexpressed (Figure S1D).
Differential Expression Analysis in CZ Versus D-Resistant Cells
From the microarray data analysis we found 559 genes significantly commonly deregulated in CZR models versus DR models (|FC|≥1.5 and FDR<0.05) (Table S4). ESRP1, TC2N, MPZL2, CDH1, OCLN, and EPCAM were epithelial-related genes overexpressed in CZR respect to DR cell lines, whereas AXL was down-regulated. Ingenuity network analysis centered the most relevant network on CDH1 and EZH2 (Figure S1E).
These results were validated by qRT-PCR and Western Blot. By these techniques it was observed an overall increased expression of mesenchymal markers such as ZEB1 and VIM and a reduced expression of epithelial markers CDH1 and ESRP1 lead by taxanes. This validation supports a more pronounced EMT profile in DR cells (Figure S2).
We defined, based on literature and published gene expression data (as described in Materials and Methods), EMT, SCL, and NE-signatures and tested them in silico in our microarray data. We found 33 EMT, 24 SCL and 4 NE-related genes differentially expressed in CZR versus DR cells (|FC|≥1.5 and FDR<0.05). Hierarchical cluster analysis revealed a different deregulation pattern of EMT (more pronounced in DR cells) and SCL-related genes between D and CZ-resistance and more expression of NE markers in CZR than in DR cells (Figures 2B–D).
Taxanes Dose-Response Experiments
In order to evaluate whether EMT and NE patterns were modifiable in a dose-dependent manner we treated cell lines with increasing doses of taxanes and evaluated EMT and NE gene expression by qRT-PCR. We observed that D and CZ-treatment induced changes in the expression of EMT and NE markers at different degrees. Notably, CZ exposure significantly increased ZEB1 and VIM expression in PC-3 models in a dose-dependent manner, restored ESRP1 expression in DU-145DR model and decreased AXL levels in DR models but not in CZR cells (Figure S3). D and CZ-treatment also increased the expression of NE markers SYP, MYCN (only detected in PC-3 model), and CHGA in a dose-response manner in both resistant models (Figure S4). All together these results confirm the plasticity towards EMT and NE patterns after a short-term drug exposure in vitro.
In Silico Analysis of Cell Plasticity-Related Genes in Prostate Cancer
A subgroup of cell plasticity related genes was selected among those significantly deregulated between CZR and DR cell lines (and validated by qRT-PCR and Western Blot) to be analyzed in silico in seven PC studies obtained from cBioportal: three studies of primary tumors with 333 (30), 240 (31), and 57 samples (32); three studies of metastatic PC with 61 (27), 176 (28), and 150 samples (29); and one study of NEPC with 114 samples (23). ESRP1 gene, one of the most differentially deregulated genes between DR and CZR, was mostly amplified, being this alteration detected in around 5% of primary tumors, 20% of metastatic PC, and in 40% of NEPC. Amplification of ZEB1 (7.9%) and AXL (10.5%), both found in NEPC, were also frequent alterations. Otherwise, CDH1 showed a variety of alterations, but most notably was amplified in NEPC (3.5%) and deleted in primary tumors and in metastatic PC (0.5%–4.5%) (Figure 3A and Table S5).
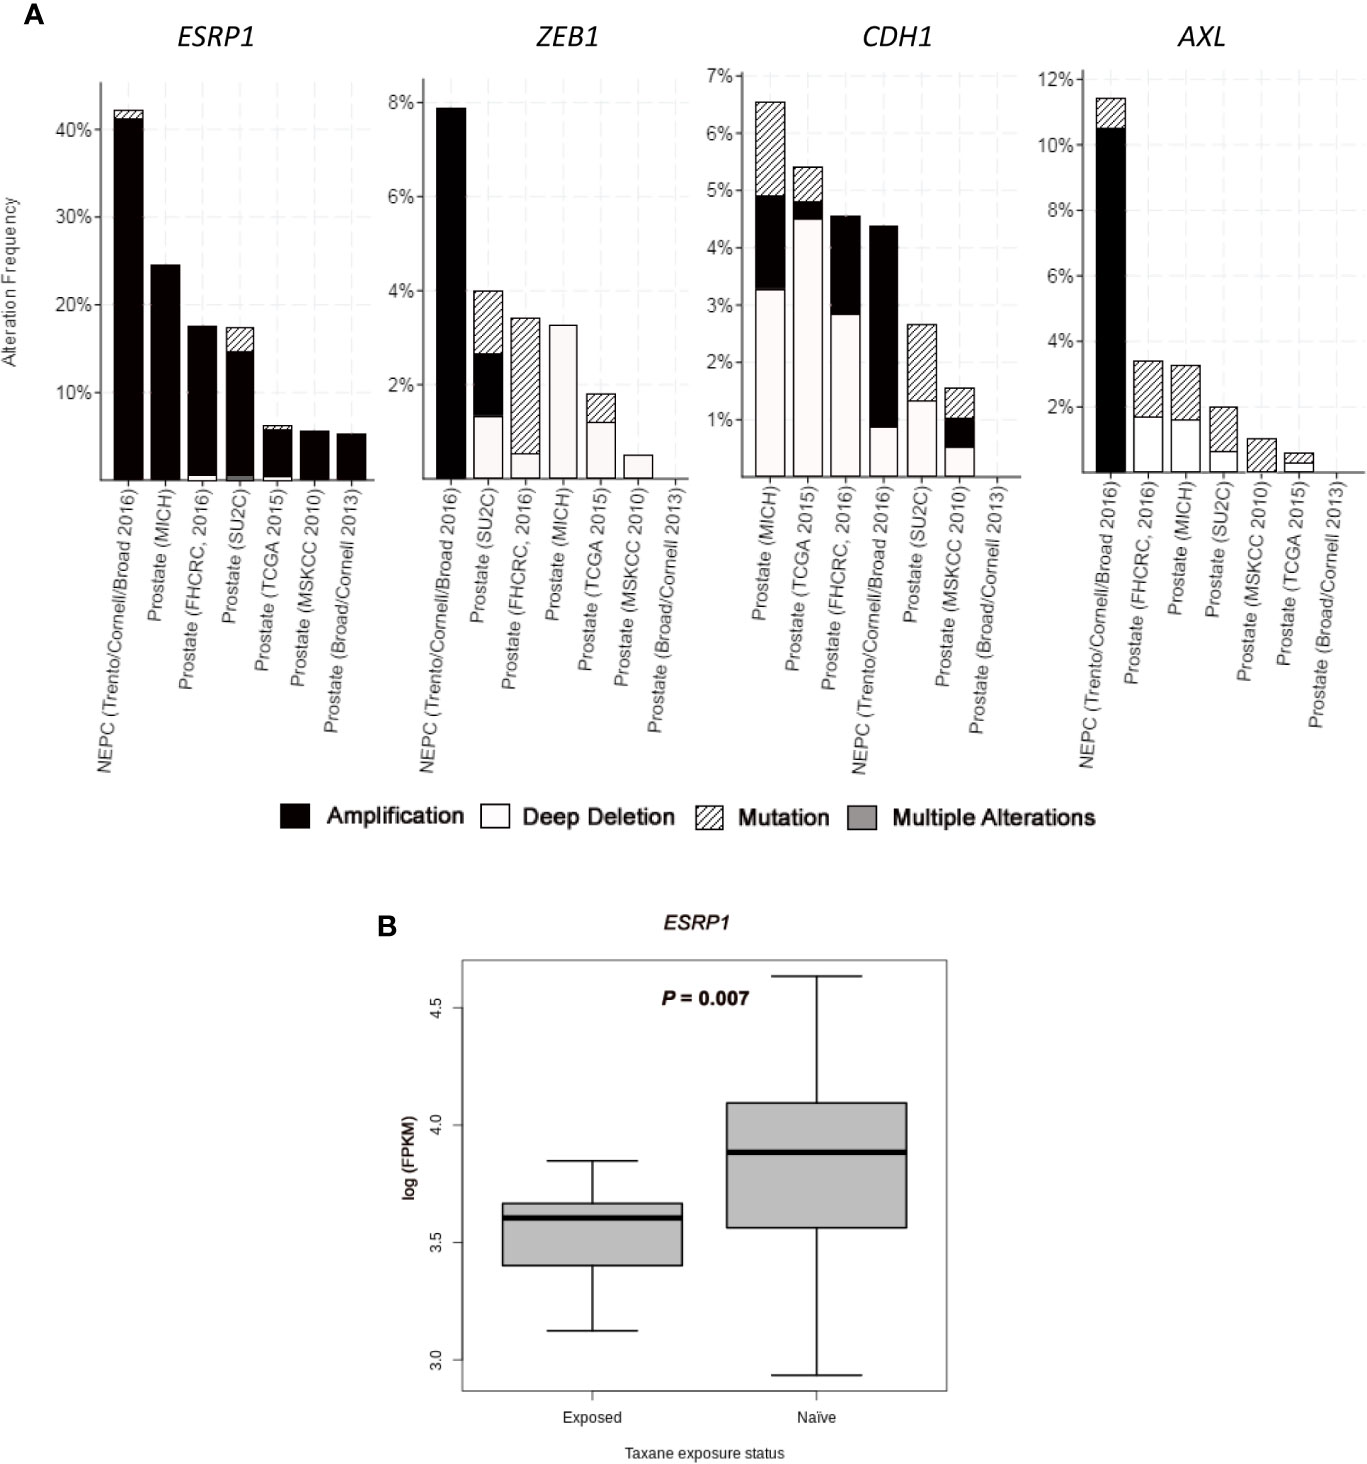
Figure 3 In silico analysis from public datasets. (A) Bar graphs representing alterations’ frequency of cell plasticity related genes in prostate cancer from seven studies (23,27–32) through cBio Cancer Genomics Portal (http://cbioportal.org) platform. (B) Boxplot representing ESRP1 expression (log FPKM (Fragments Per Kilobase of exon per Million fragments mapped)) from RNA-seq data in taxane-naïve versus taxane-exposed mCRPC tumor samples from ARSI-naïve cohort of Abida et al. (35). Welch’s t-test was used for means comparison.
We also investigated gene expression changes in tumors from mCRPC patients treated with taxanes, by using RNA-seq data from the study of Abida et al. (35) Within ARSI-naïve patients, ESRP1 expression was significantly lower in taxane-exposed respect to taxane-naïve patients (P=0.007) (Figure 3B). Median expression value for AXL, VIM, ZEB1, AURKA, EZH2, MYCN, and SYP was higher and for CDH1 was lower in taxane-exposed versus taxane-naïve patients, although these differences were not statistically significant (Figure S5). These results confirm the effect of taxanes in the ESRP1 down-regulation and EMT up-regulation in a clinical sample setting.
Cell Plasticity in CTCs
Beyond the in silico analysis, we wondered whether molecular plasticity changes could be observed in CTCs samples. Then we collected 47 CTCs-enriched blood samples from 22 mCRPC patients, 17 of them with PSA-progression at post-treatment extraction, and performed qRT-PCR analyses. Patients’ characteristics’ are shown in Table 1. Gene expression patterns in CTCs before and after taxanes treatment showed changes in expression levels of all EMT and NE markers, with high intra- and inter-patient heterogeneity (Figures 4A, B and Figure S6). CDH1 expression was significantly higher in post-treatment samples (P=0.034). Response was not correlated with pre-treatment expression values or with the difference obtained from post- and pre-treatment data. However, ZEB1 expression after treatment was higher in patients with PSA-progression compared to the non-progressing patients (P=0.035) pointing out ZEB1 as a potential marker of taxanes resistance in CTCs (Figure 4C).
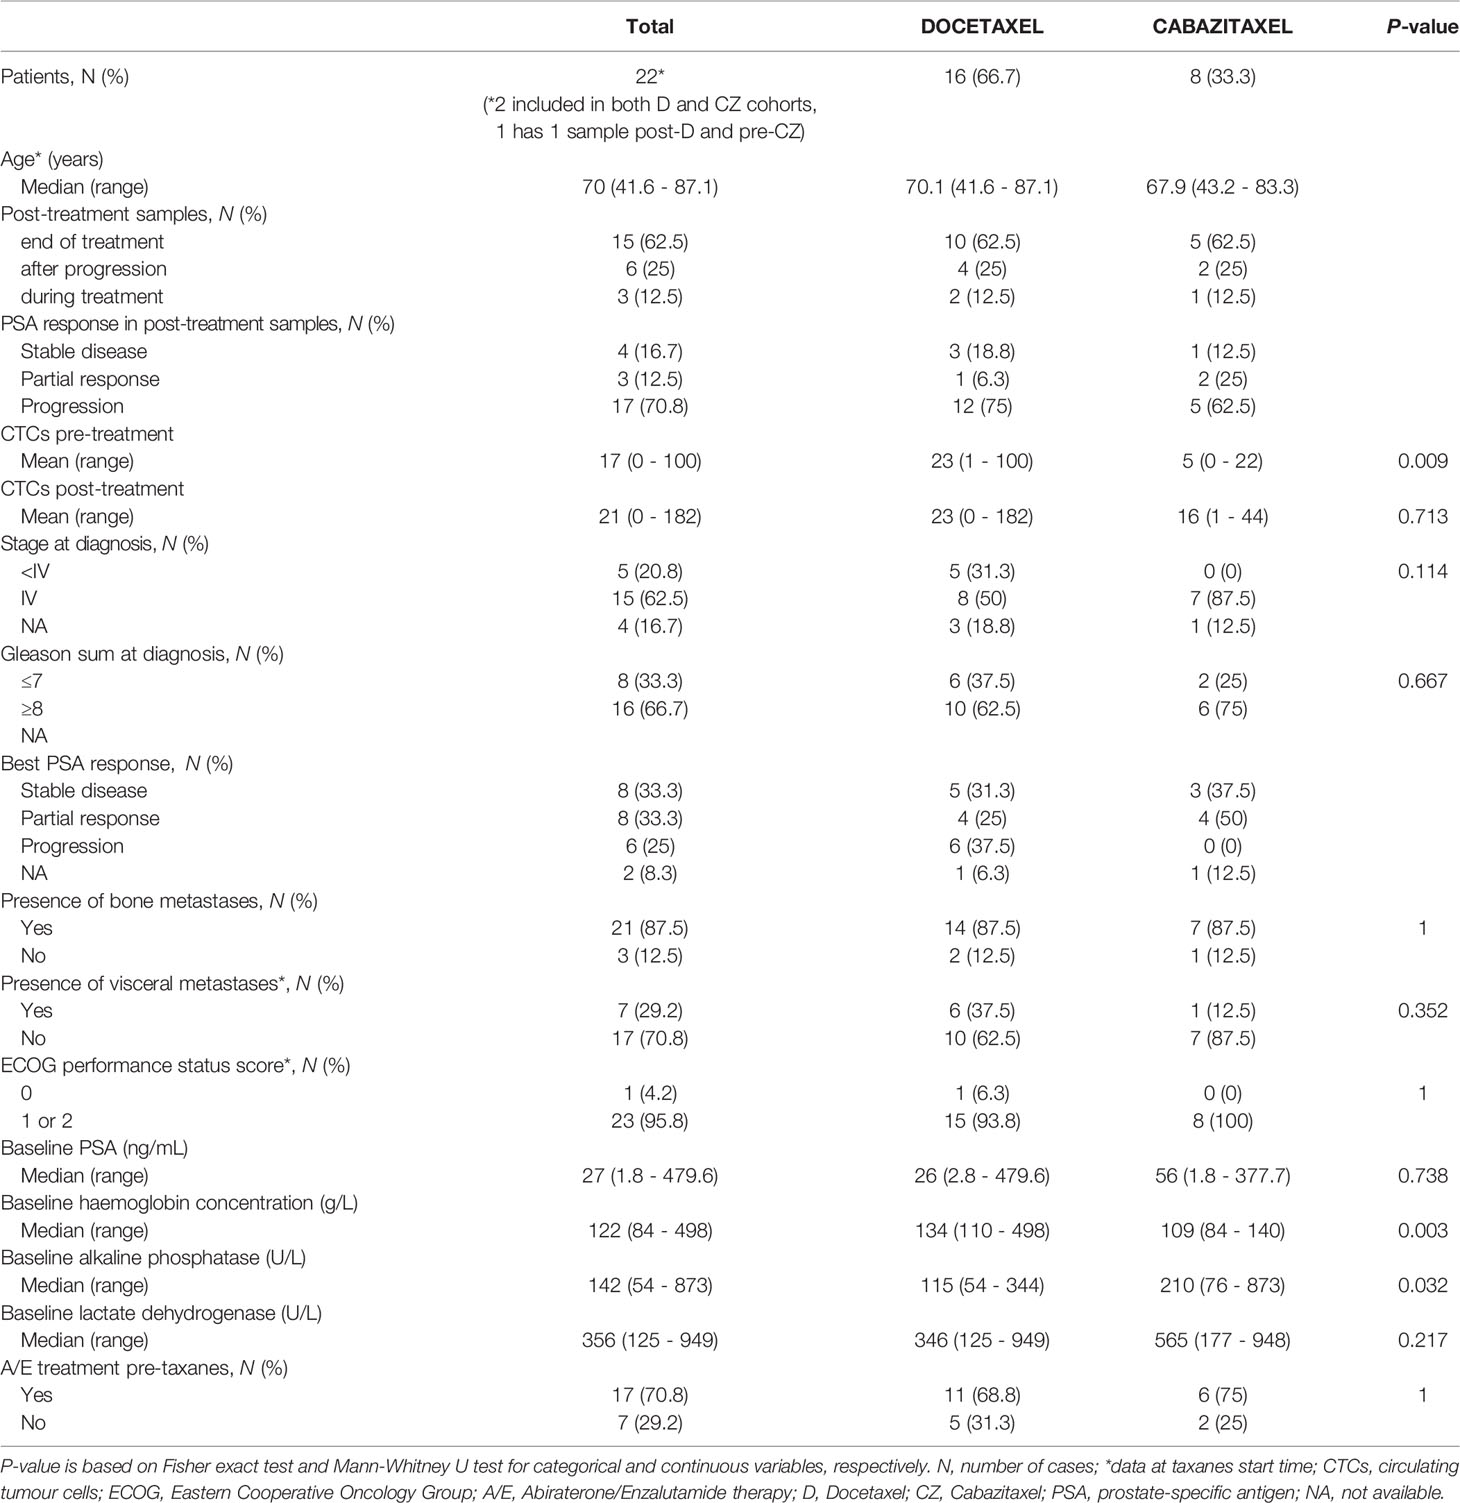
Table 1 Clinical characteristics of patients with CTCs-enriched blood samples.
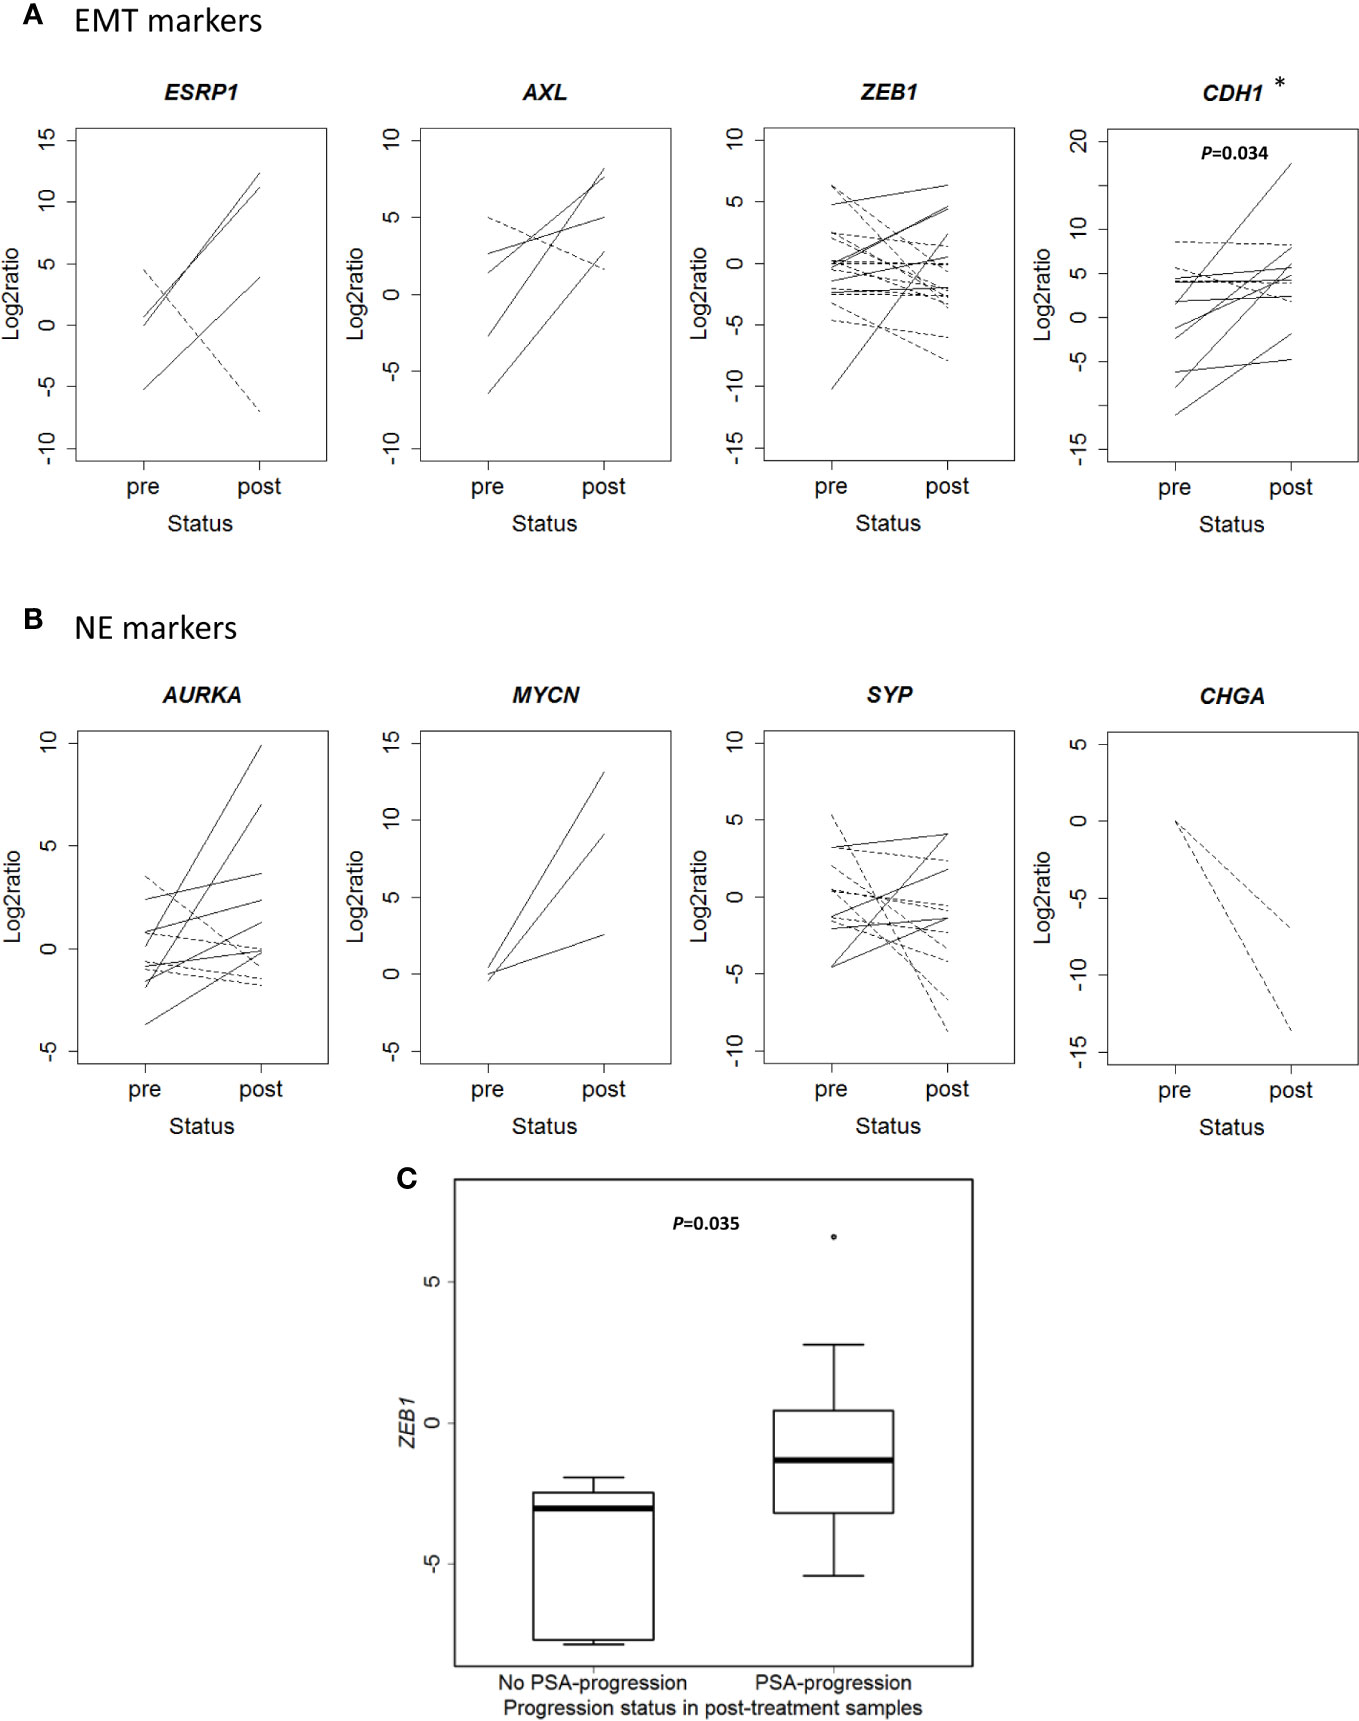
Figure 4 Changes in gene expression markers in circulating tumor cells (CTCs) samples after taxanes treatment by qRT-PCR. (A) Epithelial-mesenchymal transition (EMT) markers expression levels (represented as Log2ratio) before (pre) and after (post) taxanes treatment in CTCs. (B) Neuroendocrine (NE) markers expression levels (represented as Log2ratio) before (pre) and after (post) taxanes treatment in CTCs. Solid lines: overexpression; Dashed lines: underexpression. (C) Boxplot representing ZEB1 expression levels (minus DCq) according to PSA-progression status in post-treatment samples. *P < 0.05.
Cell Plasticity-Related Gene Expression in Non-Castrate Tumor Biopsies and Clinical Outcome
In order to confirm previous results in another cohort of tumor samples, we collected FFPE tumor tissues from taxanes-treated patients from several Spanish institutions and analyzed gene expression by qRT-PCR. A hundred and seventeen patients were included in this study (Table 2). For D-treated patients, median follow-up and PSA-PFS were 21.3 (0.9–90.1) and 7.7 (6.1–9.2) months, respectively; and for CZ-treated patients 12 (1.3–64.9) and 3 (1.7–4.3) months, respectively.
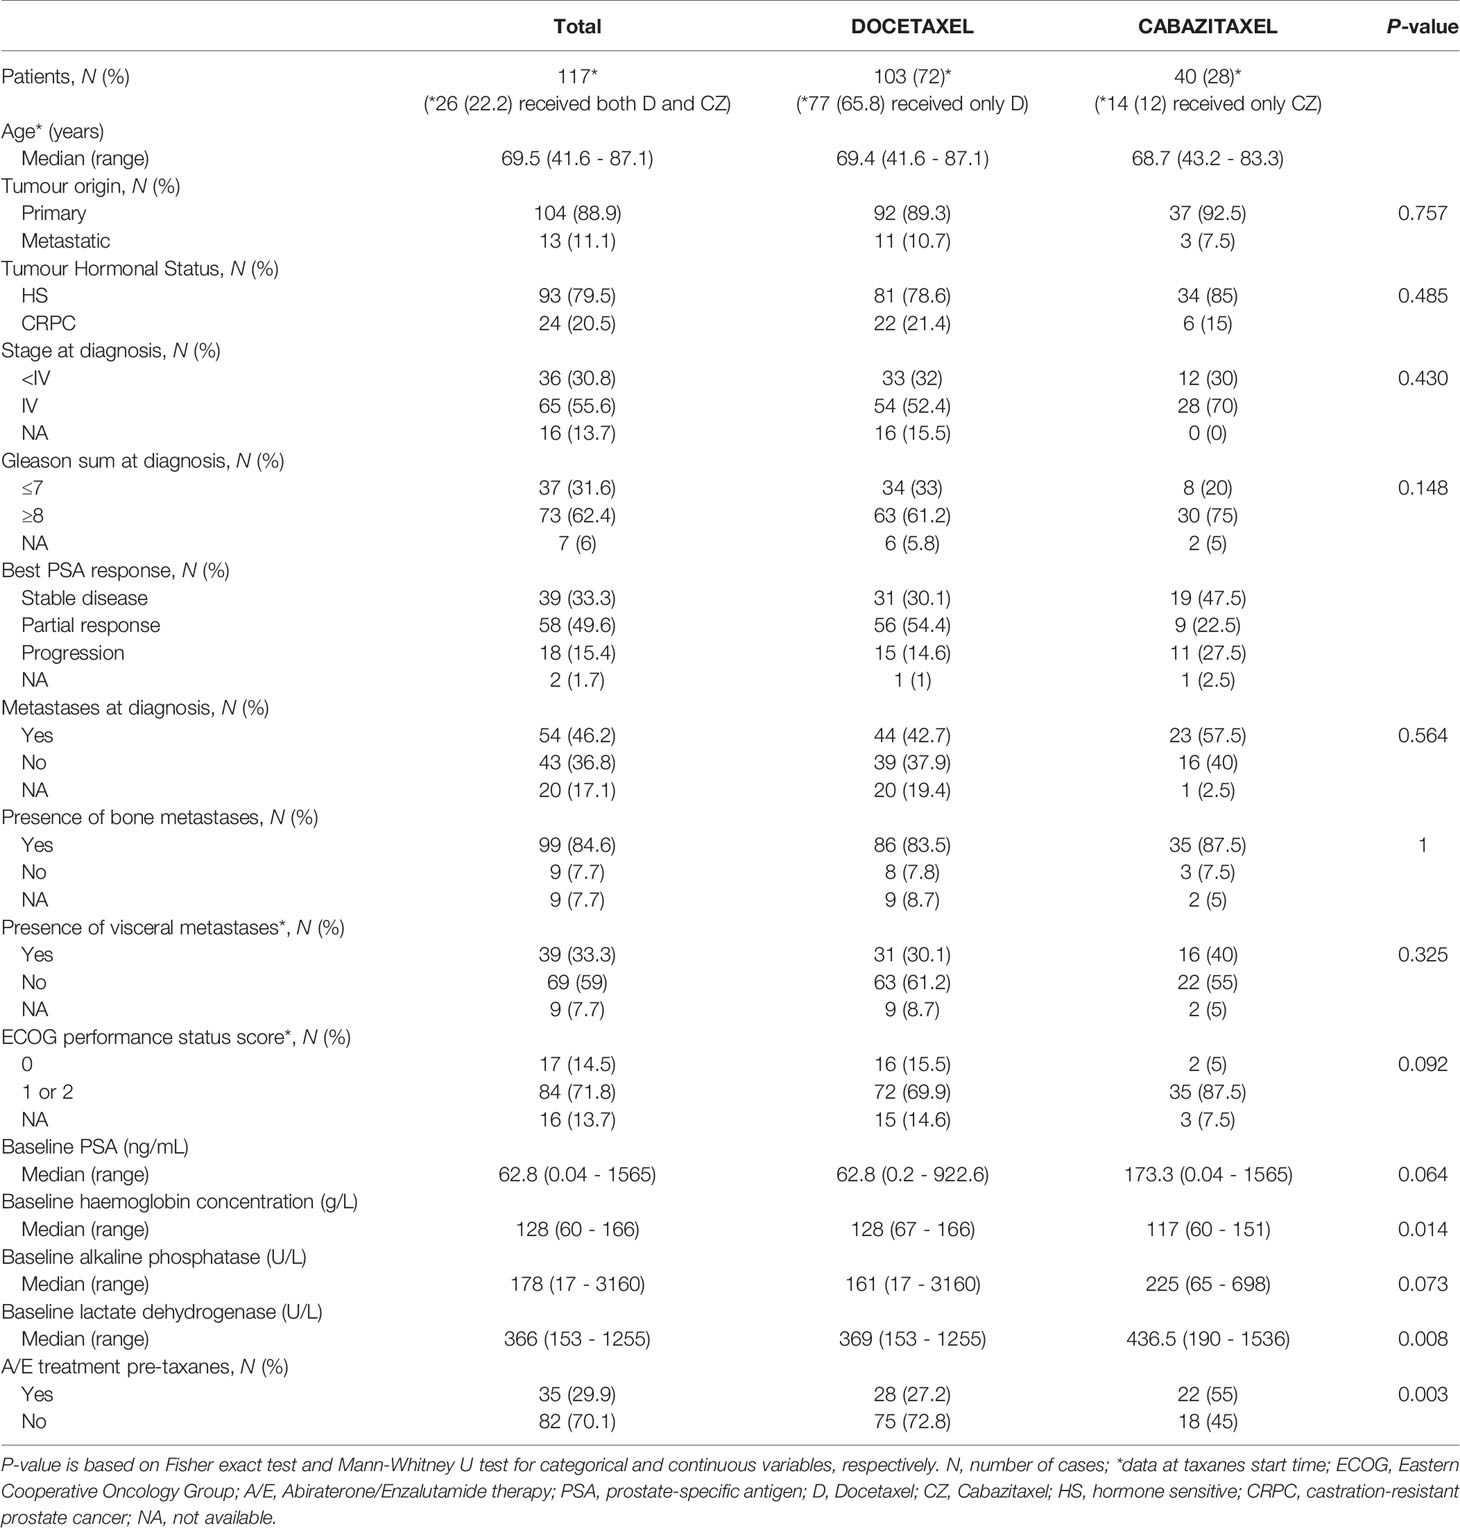
Table 2 Clinical characteristics of patients with FFPE tissue samples.
A gene expression correlation matrix between EMT, SCL, and NE markers (Figure 5) showed significant positive correlation between EMT markers (ZEB1, AXL, VIM, and CDH1), and these with the SCL-marker CD44. Correlation between NE markers was also positive. This fact suggests that EMT, NE and SCL phenotypes may coexist in primary tumors. Significant negative correlation was observed between ESRP1-ZEB1 and ESRP1-AXL (P<0.05) confirming the inverse expression pattern between EMT and ESRP1 expression.
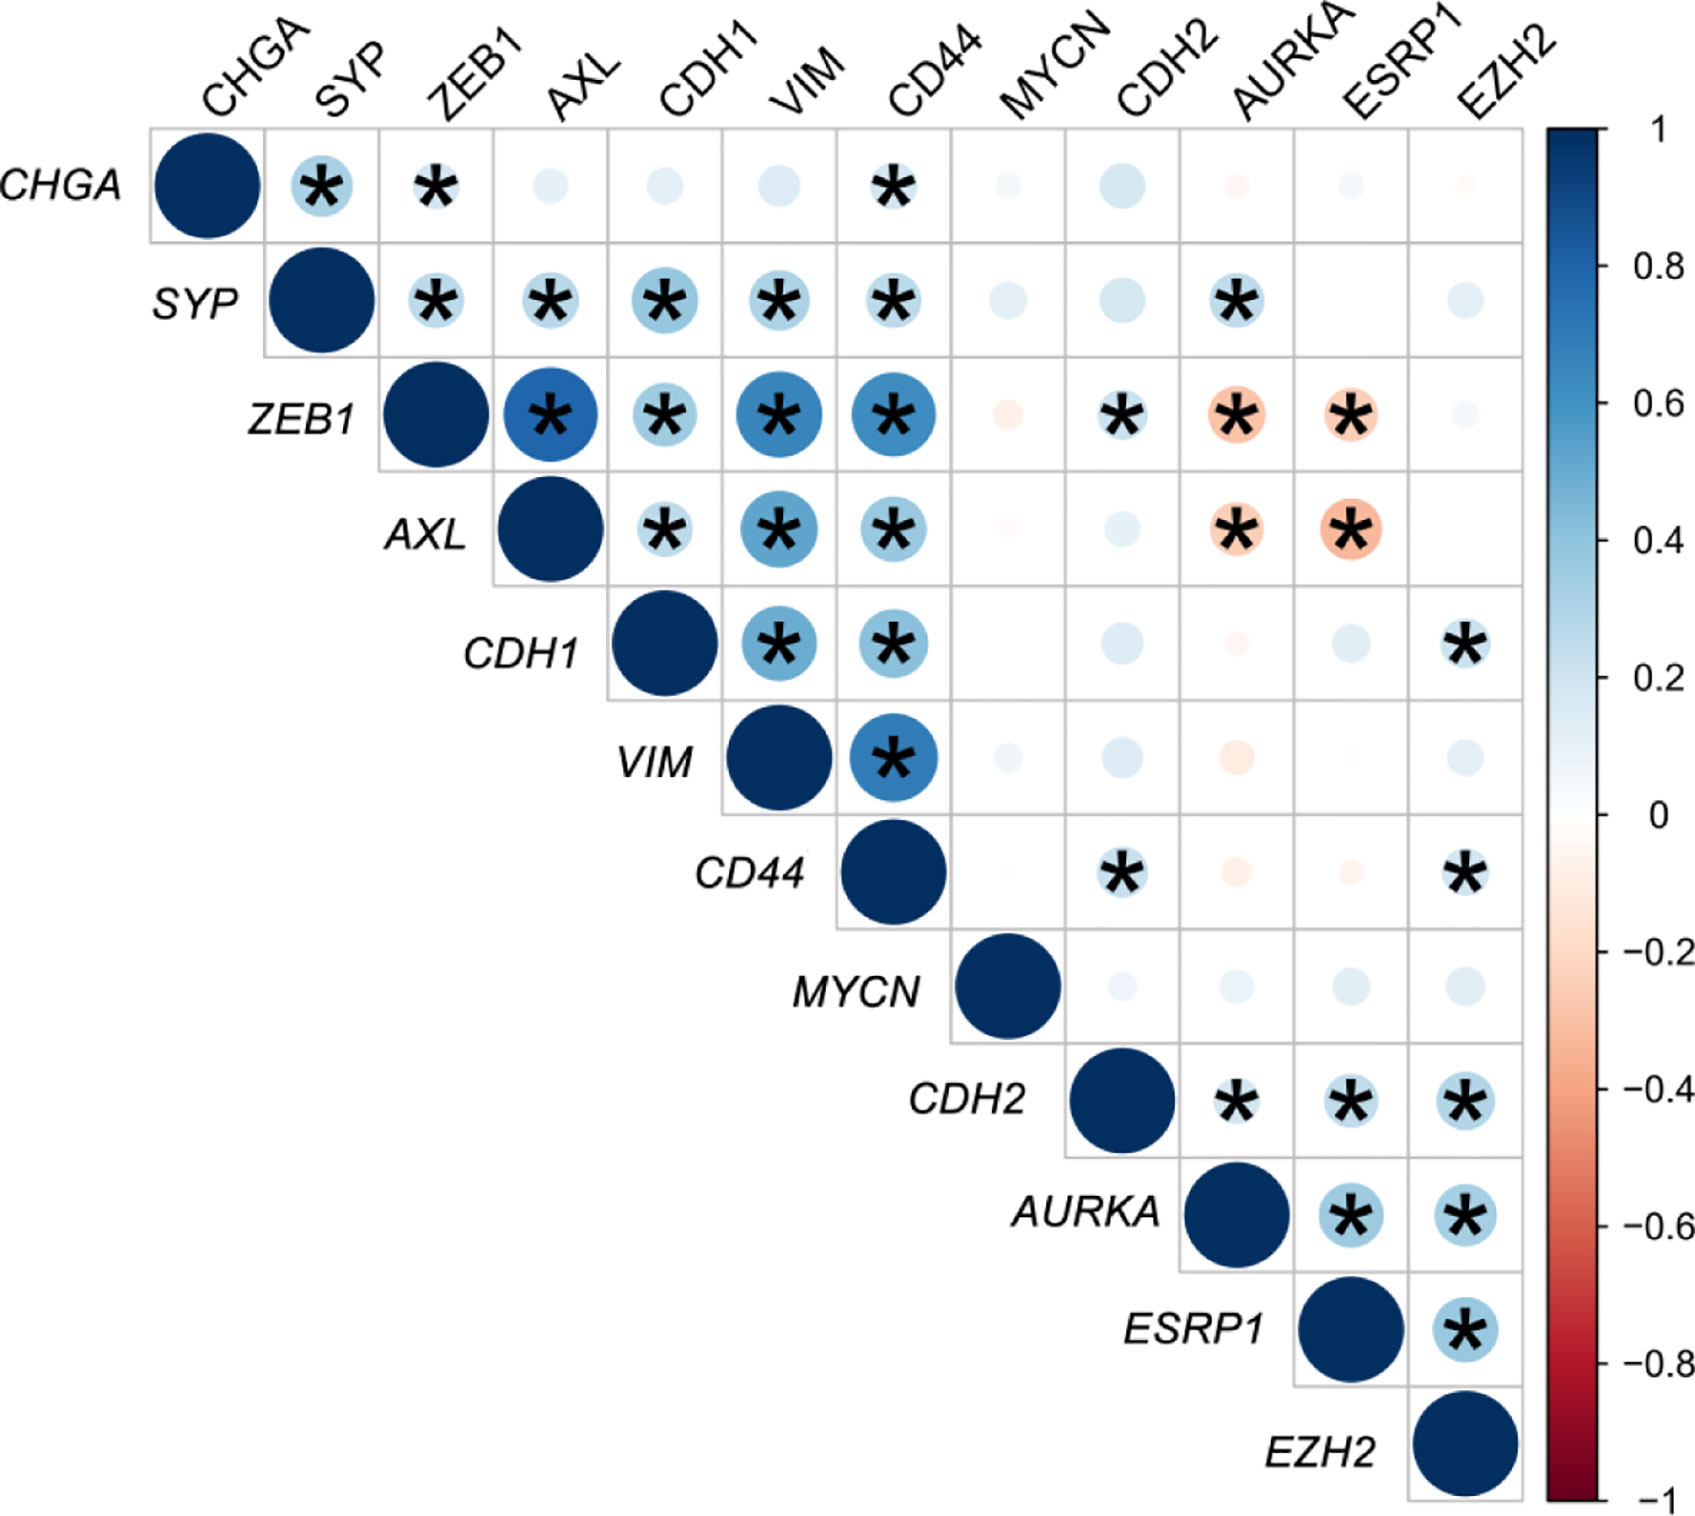
Figure 5 Correlation matrix of epithelial-mesenchymal transition (EMT) and neuroendocrine (NE) cell plasticity related genes in tissue samples. Correlation coefficients (r) between minus DCq values from qRT-PCR data are represented. *P < 0.05.
We observed that high expression of ESRP1 predicted longer PSA-PFS (hazard ratio [HR] 0.4; 95% confidence interval [CI] 0.2–0.6; P<0.001) and RX-PFS (HR 0.5; 95 % CI 0.3–0.8; P=0.008) to D, but conversely shorter PSA-PFS to CZ (HR 2.2; 95 % CI 1–4.6; P=0.038). Moreover, high expression of both ZEB1 (HR 0.4; 95 % CI 0.2–0.8; P=0.014) and AXL (HR 0.3; 95 % CI 0.2–0.8; P=0.008) was associated with a better PSA-PFS to CZ (Figure 6). The association of other EMT markers with PSA-PFS is shown in the Figure S7.
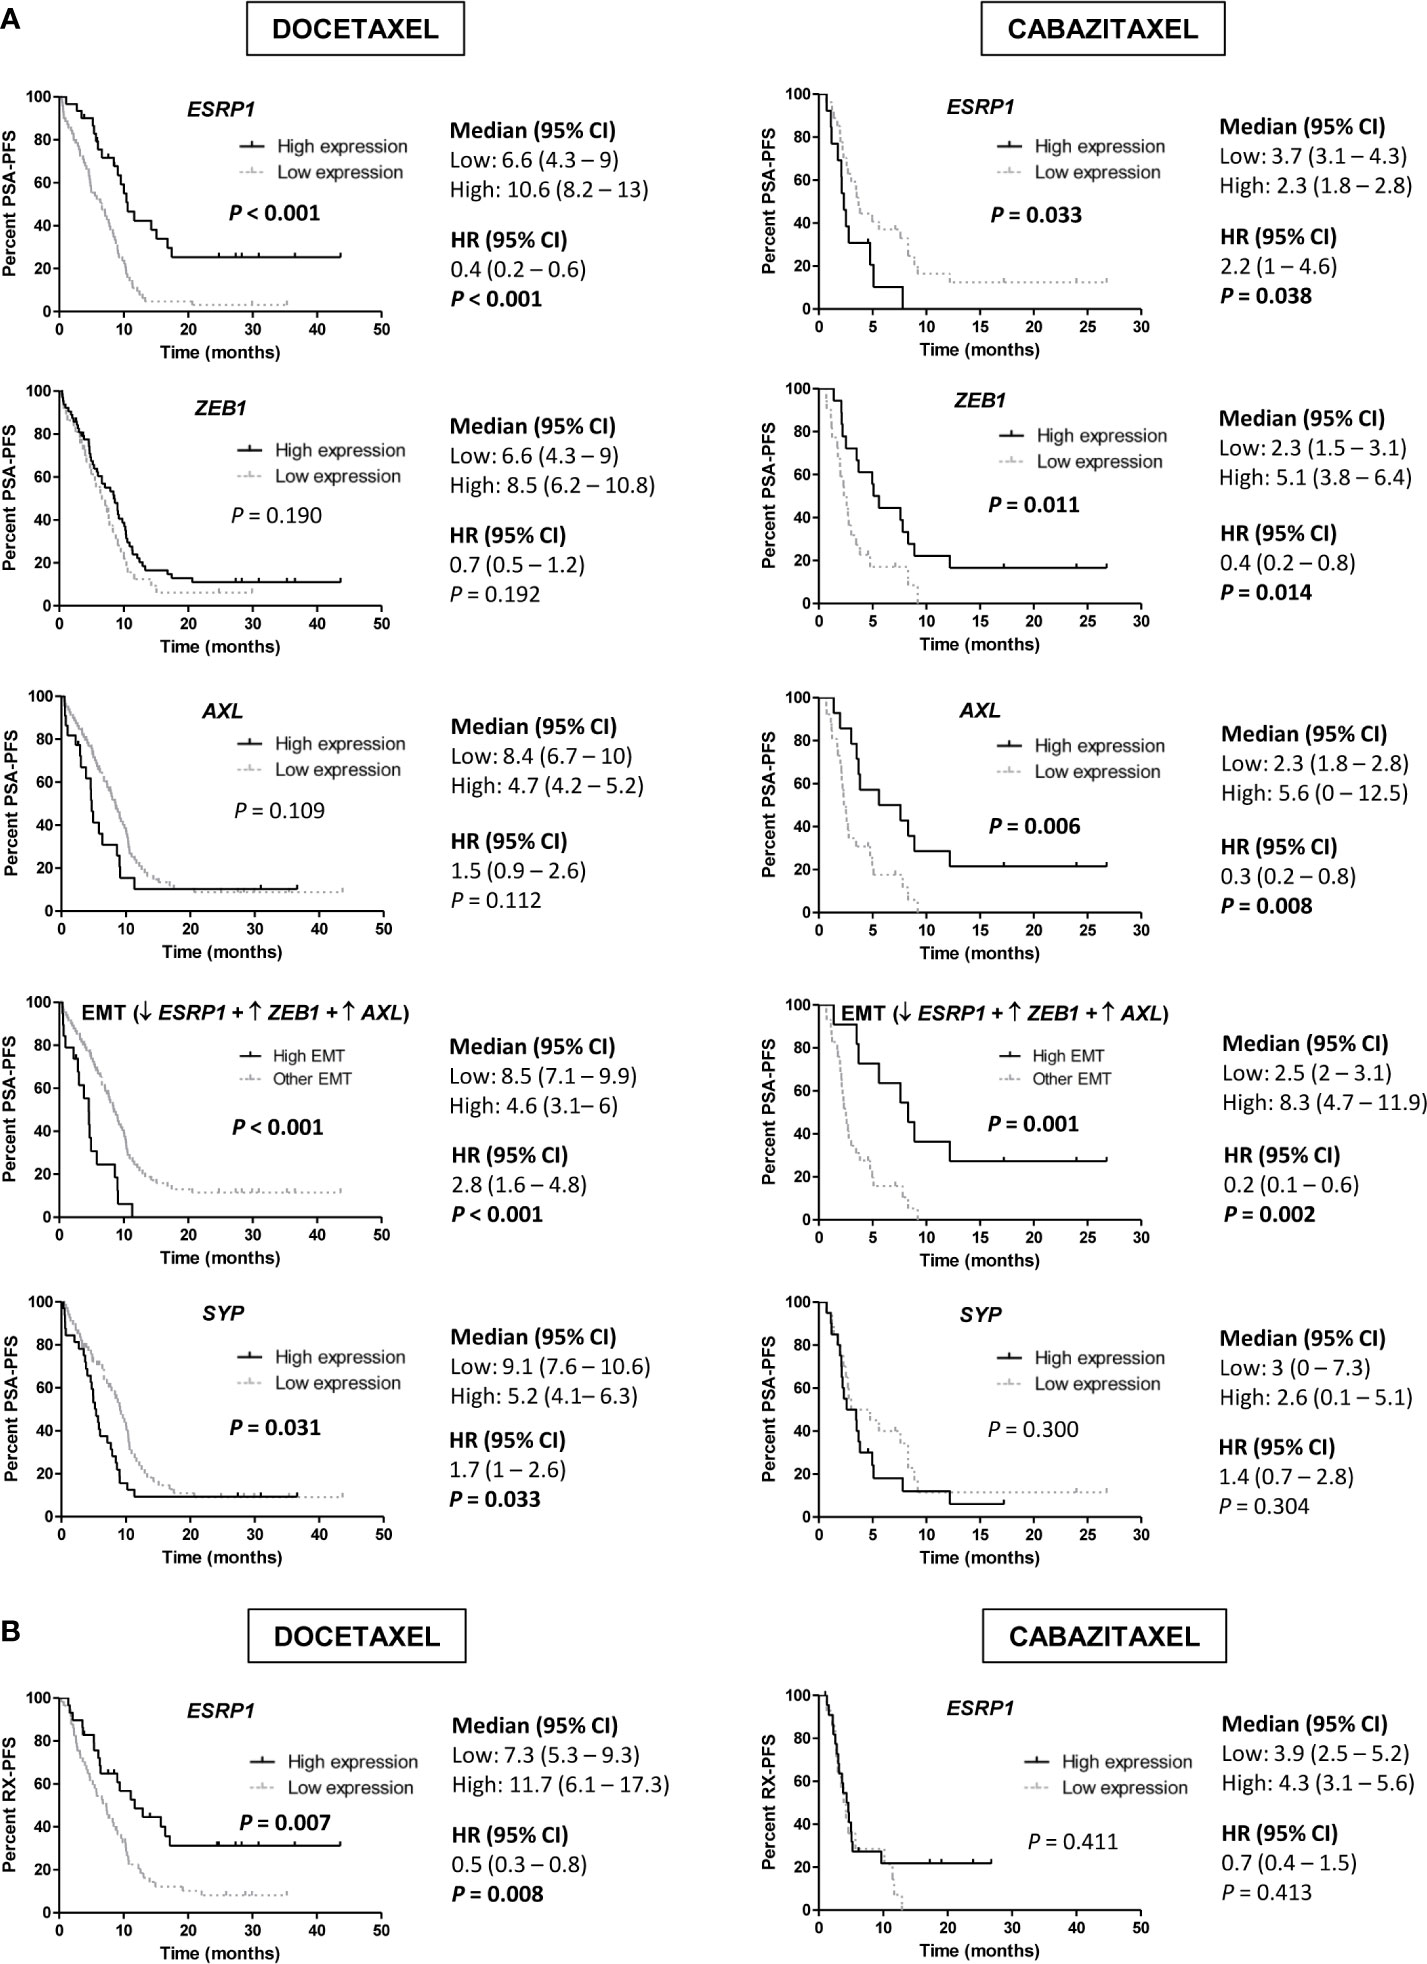
Figure 6 Progression-free survival (PFS) analysis in taxanes-treated patients according to gene expression in tumor samples by qRT-PCR. (A) Kaplan-Meier curves representing PSA-PFS according to epithelial-mesenchymal transition (EMT) markers and SYP gene expression levels. (B) Kaplan-Meier curves representing radiologic-PFS (RX-PFS) according to ESRP1 expression levels. HR, hazard ratio; CI, confidence interval.
Then, we defined a group of patients with high-EMT phenotype (low ESRP1 and high ZEB1 and AXL expression) and compared it with the rest of patients. High-EMT patients showed a better PSA-PFS to CZ (HR 0.2; 95 % CI 0.1–0.6; P=0.002), contrary to D (HR 2.8; 95 % CI 1.6–4.8; P<0.001) (Figure 6A).
In a multivariate analysis, high ESRP1 expression was independently associated with longer PSA-PFS (HR 0.3; 95 % CI 0.2–0.6; P<0.001) and RX-PFS (HR 0.3; 95 % CI 0.2–0.6; P=0.001) in D-treated patients and shorter PSA-PFS in the CZ-cohort (HR 3.1; 95 % CI 1–9.1; P=0.041) (Table S6 and S7). Moreover, there was a significant interaction between ESRP1 expression levels and D or CZ-treatment related to PSA-PFS (P<0.001).
Respect to OS, in the univariate analysis some EMT markers such as ZEB1 for D-treated patients, AXL for CZ-treated patients and VIM for both were associated with a better OS, but none of them was significant in the multivariate analysis (Figure S8).
Regarding NE markers, high expression of SYP was associated with shorter PSA-PFS to D (HR 1.7; 95 % CI 1–2.6; P=0.033). Moreover, high expression of EZH2 for D (19.1 vs 25.9 months; HR 1.8; 95 % CI 1.1–2.8; P=0.013) and SYP for CZ (7.3 vs 18 months; HR 3.7; 95 % CI 1.7–8.1; P=0.001) correlated with lower OS (Figure 7). In a multivariate analysis, high SYP expression was independently associated with shorter PSA-PFS in D-treated patients (HR 2; 95 % CI 1.3–3.3; P=0.003) and worse OS in CZ-treated patients (HR 5.3; 95 % CI 1.8–15.4; P=0.002) (Tables S6 and S8).
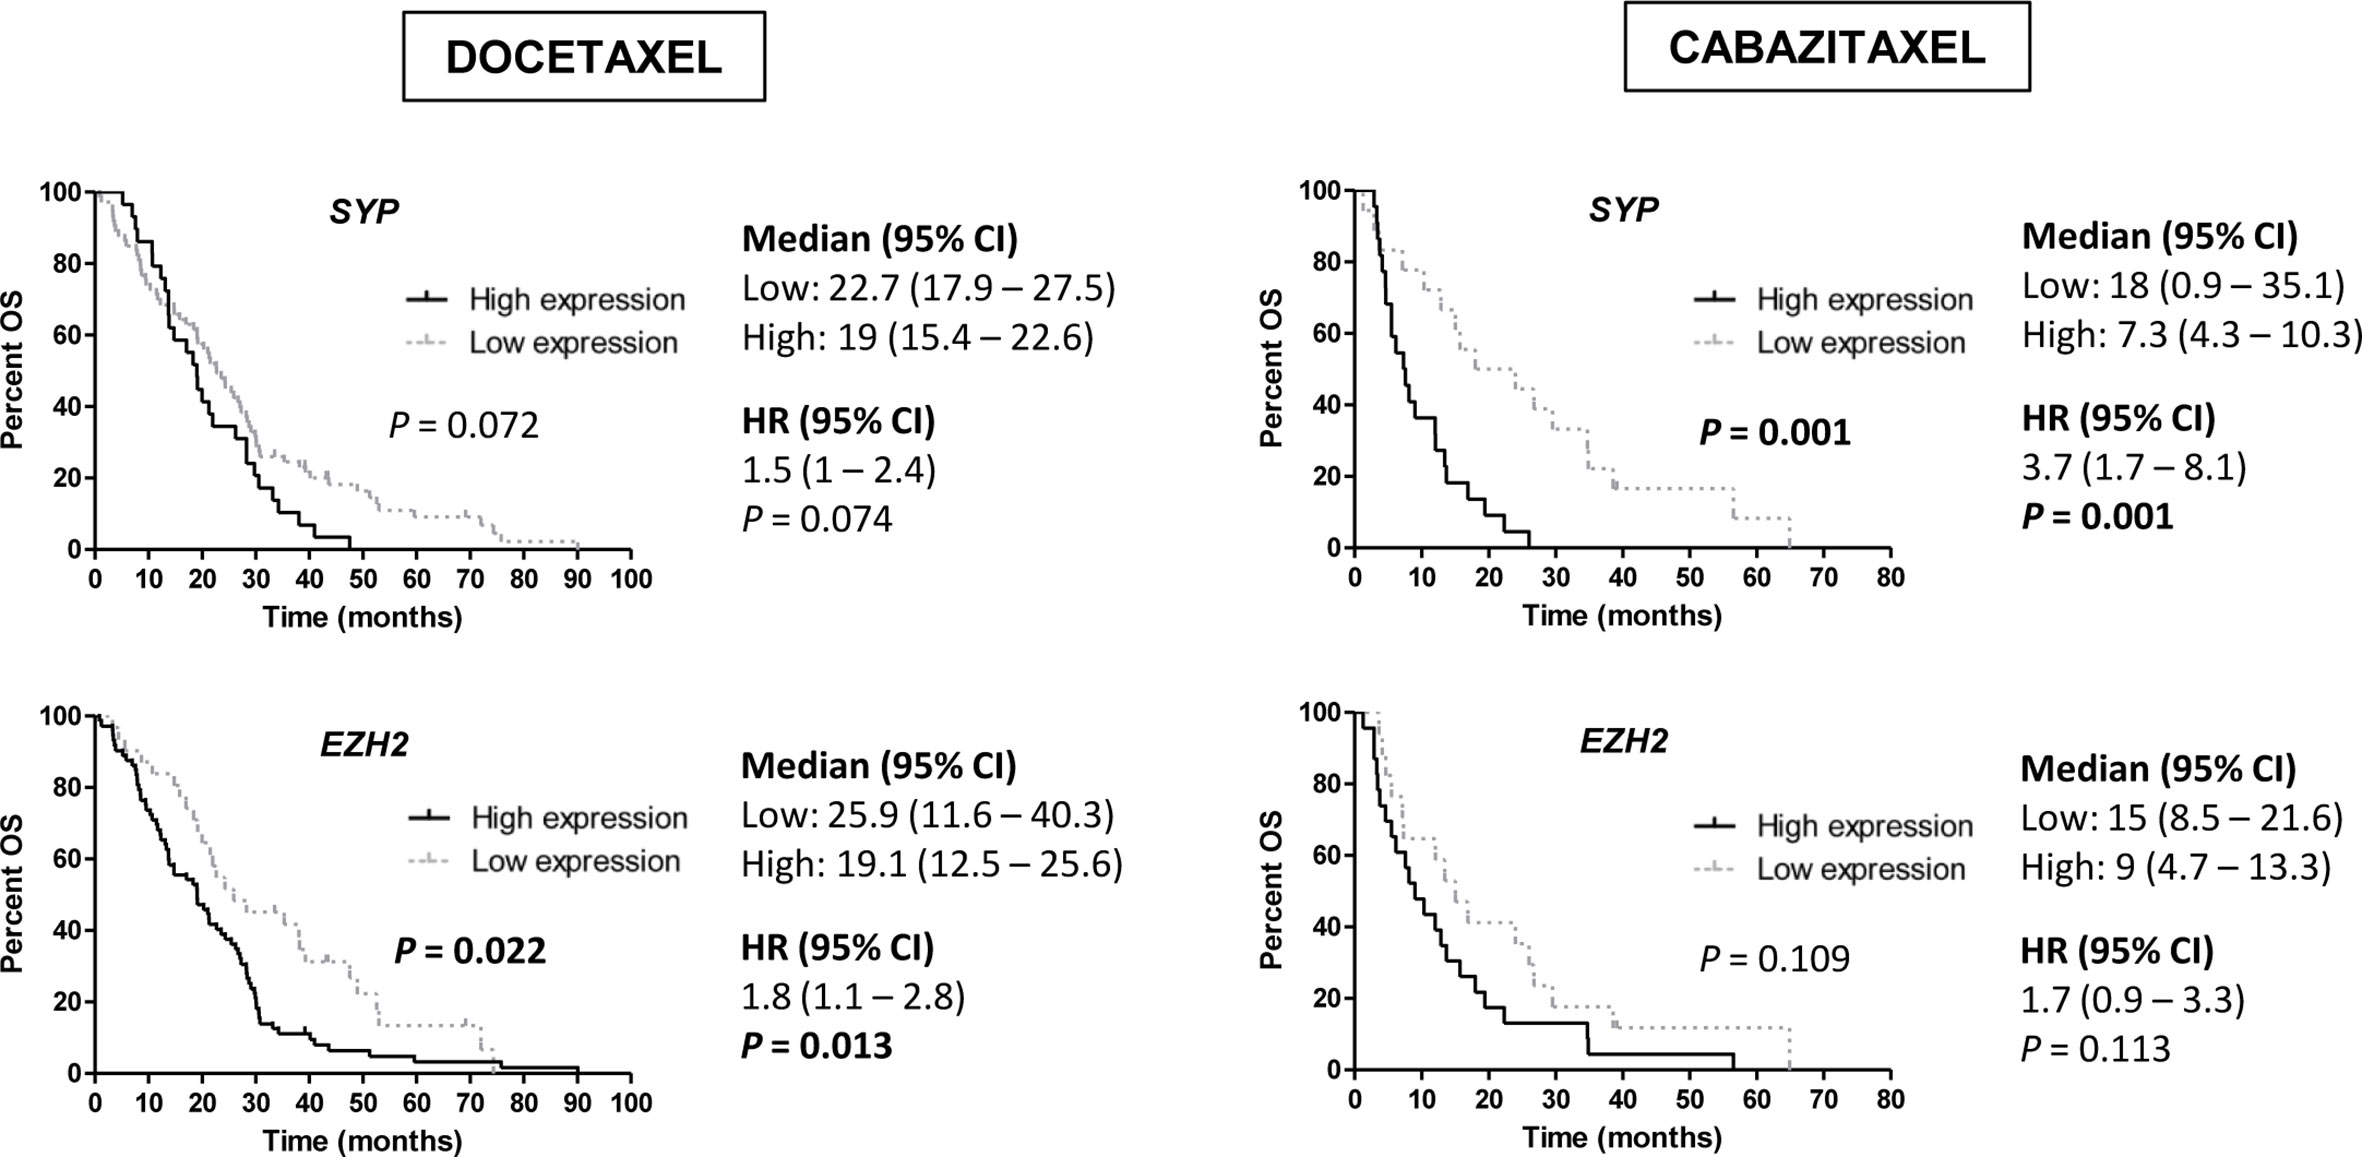
Figure 7 Overall survival (OS) analysis in taxanes-treated patients according to gene expression of neuroendocrine (NE) markers (SYP and EZH2) in tumor samples by qRT-PCR. HR, hazard ratio; CI, confidence interval.
Discussion
In this study we show that changes in cell plasticity-related phenotypes occur after taxane exposure in in vitro models of CRPC, in CRPC biopsies analyzed in silico, and in CTCs from patients with mCRPC treated with taxanes. We observed that this plasticity appears with different patterns for D and CZ treatments. Moreover, we found that the expression of EMT and NE markers in primary tumors predicts clinical outcome to taxanes in the mCRPC setting.
The taxanes D and CZ have shown a survival benefit in mCRPC patients (4–8). Specifically, CZ has shown to be active in patients with progression or low response to D (8, 38) and increases survival in patients who have progressed to prior D and abiraterone or enzalutamide (39), as demonstrated in randomized clinical trials. The fact that CZ is active in these adverse clinical situations supports that it may overcome the resistance to D or to hormone-therapy. The activity of CZ observed in our series in tumors with EMT phenotype (as discussed below) may be a potential explanation.
EMT phenotype has been associated by us and others with intrinsic and acquired resistance to D in CRPC (9, 10). Here, we show that DR and CZR cells have several EMT-deregulated genes when compared with parental cells, supporting the relevance of EMT in both D and CZ-resistances (9, 40, 41). However, EMT features such as elongation, less adhesion and proliferation, and more migration were present in DR cells but not in CZR. Differential expression analysis in CZR versus DR models also revealed a more marked mesenchymal phenotype in DR cells and a more notable epithelial phenotype in CZR cells. These results also suggest that EMT is not a binary state but a transitional process in which cells can undergo a stable intermediate EMT phenotype (42).
It has been described in mice PC models that CZ may revert EMT by redifferentiation of mesenchymal cells into an epithelial phenotype (43). Accordingly, in this work we found that CZ restored ESRP1 expression in DU-145DR cells and decreased AXL levels in DR models. This may suggest a potential explanation of the distinct clinical benefit observed in our series between D and CZ according to EMT phenotype.
There has been recent emerging evidence in the literature about the capacity of androgen suppression and ARSI to induce a NE phenotype (2). However, whether taxanes could also be partly responsible of a NE growing pattern needs to be further explored. Increased levels of the NE markers SYP, MYCN, and CHGA in dose-response experiments with taxanes are a novel observation of this study, reinforcing the hypothesis that chemotherapy could also contribute to the acquisition of a NE phenotype.
ESRP1 expression has been recently considered an independent prognostic biomarker in early PC (44). In silico analyses suggest that ESRP1 could be an important driver in tumor progression and NE differentiation, since its amplification frequency increase from primary tumors to NEPC. In our series we found that ESRP1 expression in tumor positively correlated with NE markers, such as AURKA and EZH2, and negatively with the EMT markers ZEB1 and AXL. ESRP1 mediates alternative splicing of a panel of transcripts involved in maintaining epithelial features, becoming then an important EMT regulator (45). During EMT, direct repression of ESRP1 expression through ZEB1 occurs (46), with subsequent changes in protein isoforms that regulate actin cytoskeleton, cell adhesion, migration and cell polarity, providing cells with mesenchymal characteristics (45). ESRP1 could be also important in regulating other cell plasticity phenotypes, since overlapping between signaling pathways involved in these mechanisms has been described (2).
We also observed changes in EMT and NE markers in mRNA expression after taxanes treatment in CTCs from mCRPC patients. It has been described that the majority of CTCs exhibits an intermediate EMT phenotype with both epithelial and mesenchymal markers (42, 47), thus we considered to use a customized mixture of antibodies (PSCA, EPCAM, and CDH2) in order to capture prostatic CTCs with epithelial and/or mesenchymal characteristics. The high intra and inter-patient heterogeneity observed may be probably translating the complexity to study in patients the cell plasticity process. Of note, ZEB1 post-treatment expression was higher in those patients with PSA-progression at the time of CTCs analysis, supporting the role of EMT in taxane resistance in patients. CDH1 expression was also significantly higher in post-treatment samples. The fact that CDH1 may have a role in CTCs clusters formation (48, 49) contributing to cell migration and spread, could account for this result.
Results from this study also suggest that primary tumor phenotype can affect taxane benefit during CRPC, which may be different between D and CZ. Here we defined an EMT-expression pattern characterized by ESRP1 down-regulation and ZEB1 and AXL overexpression, which correlated with a better PSA-PFS to CZ and poorer to D. This observation reinforces the existence of a different mechanism of action for each taxane, depending on the EMT profile, and the potential role of CZ in the reversion of the EMT phenotype (43). We also found that high ESRP1 expression independently predicted better PSA-PFS to D, but worse to CZ. Moreover, a significant interaction between the type of taxane treatment and ESRP1 levels regarding PSA-PFS was observed. In relation with that, RNA-seq data from Abida et al. (35) supported the in vitro findings regarding the diminishing levels of ESRP1 mRNA after taxanes-exposure. These results agree with the acquisition of EMT phenotypic changes by taxanes treatment. Overall, these data suggest that ESRP1 may be a potential biomarker of taxane sensitivity, although a prospective validation is required.
In our series, EMT was not associated with a lower OS. While the role of EMT in resistance to therapy and progression of the disease is well supported by the literature (50), there are, however, some discrepancies regarding its association with OS (51, 52). These controversies may arise from the heterogeneity of the tumors, the spectrum of EMT phenotypes induced by different treatments and their different implication in metastasis (47), as well as the different methodologies used.
According to NE dedifferentiation, we show that the expression of NE markers in primary tumor is associated with adverse outcome in patients treated with D or CZ. Recently, a randomized phase II trial of CZ vs CZ-Carboplatin in mCRPC patients have shown more activity, PSA-PFS and OS of the combination (53). Thus, the early introduction of carboplatin in patients with NE expression in primary tumors may be explored as a strategy to improve clinical outcome of these patients.
In conclusion, this study supports the role of tumor cell plasticity in clinical outcome of mCRPC patients as well as in primary (when present in primary non-castrate tumors) and acquired resistance to taxanes. The EMT profile expression in primary tumor is differentially associated with D or CZ benefit and NE dedifferentiation is associated with adverse outcome to D or CZ. Further research of this complex process in longer series of patients is needed to validate these results.
Data Availability Statement
The datasets presented in this study can be found in online repositories. The names of the repository/repositories and accession number(s) can be found below: https://www.ncbi.nlm.nih.gov/geo/, GSE158494.
Ethics Statement
The studies involving human participants were reviewed and approved by Ethics Committees of all participating centers: Hospital Clínic, Hospital Germans Trias i Pujol, Hospital del Mar, Vall d’Hebron University Hospital, Fundació Althaia Manresa, and Hospital Universitari Doctor Josep Trueta. The patients/participants provided their written informed consent to participate in this study.
Author Contributions
Study conception and design: NJ, ÒR, MM-A, and BM. Development of methodology: NJ, ÒR, RM, MM-G, LN-D, GC, JL, PF, LR-C, SD, and MM-A. Acquisition of data (acquired and managed patients): ÒR, IV, AF, AR-V, JC, CS, MD, NS-G, AP, and BM. Analysis and interpretation of data: NJ, ÒR, RM, MM-G, LN-D, GC, JL, AP, MM-A, and BM. Manuscript preparation and editing: NJ, ÒR, RM, MM-A, and BM. All authors contributed to the article and approved the submitted version.
Funding
This work was supported by grants from Instituto de Salud Carlos III-Subdirección General de Evaluación y Fomento de la Investigación [PI12/01226, PI15/676 and PI18/714] and co-funded by the European Regional Development Fund (ERDF). Institutional funding from CERCA Programme/Generalitat de Catalunya is gratefully acknowledged. This work was developed at the Centro Esther Koplowitz, Barcelona, Spain.
Conflict of Interest
Authors have provided the following relationships with companies (which may not be related to the subject matter of this manuscript): NJ: travel and accommodation from Sanofi. ÒR: speaker’s bureau from BMS, Ipsen and Pfizer; travel expenses from Ipsen and Pfizer. AF: consulting or advisory role by Roche, Sanofi and Janssen; research funding by Astra-Zeneca, Astellas and Pierre Fabre; travel accommodation expenses from Astra-Zeneca, Roche and Astellas. AR-V: research support from MSD, Pfizer and Takeda; speakers’ bureau honoraria from Astellas, Astra-Zeneca, Bayer, Bristol-Myers Squibb, Janssen, MSD, Pfizer, Roche, Ipsen and Sanofi-Aventis; consultant/advisory board member for Astellas, Bayer, Bristol-Myers Squibb, Janssen, MSD, Pfizer, Ipsen, Clovis and Roche. JC: advisory board from Bayer, Johnson&Johnson, Bristol-Myers Squibb, Atellas Pharma, Pfizer, Sanofi, MSD, Roche, Astra-Zeneca; speakers’ bureau from Bayer, Johnson&Johnson, Asofarma and Astellas. CS: consulting or advisory role from Bristol-Myers Squibb, Ipsen, Sanofi, Pfizer, EUSA Pharma, Astellas, Novartis; speakers’ bureau from Bristol-Myers Squibb, Ipsen, Pfizer, Roche/Genentech, Astra-Zeneca; travel expenses by Bristol-Myers Squibb and Roche. MD: advisory role and speaker honoraria by Roche, Bristol-Myers Squibb, MSD, Sanofi, Pfizer; travel accommodation expenses from Roche, Astellas and Janssen. NS-G: advisory board and accommodation support from Pfizer, Astellas, Bristol-Myers Squibb and Ipsen. AP: lecture fees from Roche, Pfizer, Novartis, Amgen, BMS, Daiichi Sankyo and Nanostring technologies; advisory role/consultancy from Pfizer, Novartis, Amgen, Puma, Oncolytics Biotech, MSD and Lilly; Board Member of Breast International Group, Solti’s Foundation and Actitud frente al cáncer Foundation; research funding from Boehringer, Roche, Pfizer, Nanostring technologies, Novartis, Sysmex Europe GmbH, Medica Scientia Innovation Research, Celgene and Astellas Pharma; financial support for clinical trials from Boehringer, Lilly, Roche, Pfizer, Novartis, Amgen and Daiichi Sankyo. MM-A: travel accommodation from Bristol-Myers Squibb. BM: advisory role from Roche, Sanofi, Janssen, Astellas, Pfizer, Novartis, Bristol-Myers Squibb and Ipsen, research funding from Roche, Bayer and Janssen, and accommodation expenses from Pfizer and Janssen.
The remaining authors declare that the research was conducted in the absence of any commercial or financial relationships that could be construed as a potential conflict of interest.
Acknowledgments
The authors thank Patricia García and the personnel from the Inther Unit of Hospital Clínic for their kind organization of samples collection and Sandra López for her excellent technical assistance. We want to acknowledge MARBiobanc (PT13/0010/0005), integrated in the Spanish National Biobanks Network and in Xarxa de Bancs de tumors de Catalunya, for its collaboration in providing samples. We also thank all patients that agreed to be involved in the study.
Supplementary Material
The Supplementary Material for this article can be found online at: https://www.frontiersin.org/articles/10.3389/fonc.2020.594023/full#supplementary-material
References
1. Blee AM, Huang H. Lineage plasticity-mediated therapy resistance in prostate cancer. Asian J Androl (2019) 21:241–8. doi: 10.4103/aja.aja_41_18
2. Davies AH, Beltran H, Zoubeidi A. Cellular plasticity and the neuroendocrine phenotype in prostate cancer. Nat Rev Urol (2018) 15:271–86. doi: 10.1038/nrurol.2018.22
3. Aggarwal R, Huang J, Alumkal JJ, Zhang L, Feng FY, Thomas GV, et al. Clinical and Genomic Characterization of Treatment-Emergent Small-Cell Neuroendocrine Prostate Cancer: A Multi-institutional Prospective Study. J Clin Oncol (2018) 36:2492–503. doi: 10.1200/JCO.2017.77.6880
4. de Bono JS, Logothetis CJ, Molina A, Fizazi K, North S, Chu L, et al. Abiraterone and Increased Survival in Metastatic Prostate Cancer. New Engl J Med (2011) 364:1995–2005. doi: 10.1056/NEJMoa1014618
5. Scher HI, Fizazi K, Saad F, Taplin M-E, Sternberg CN, Miller K, et al. Increased survival with enzalutamide in prostate cancer after chemotherapy. N Engl J Med (2012) 367:1187–97. doi: 10.1056/NEJMoa1207506
6. Tannock IF, de Wit R, Berry WR, Horti J, Pluzanska A, Chi KN, et al. Docetaxel plus Prednisone or Mitoxantrone plus Prednisone for Advanced Prostate Cancer. New Engl J Med (2004) 351:1502–12. doi: 10.1056/NEJMoa040720
7. Petrylak DP, Tangen CM, Hussain MHA, Lara PN, Jones JA, Taplin ME, et al. Docetaxel and estramustine compared with mitoxantrone and prednisone for advanced refractory prostate cancer. N Engl J Med (2004) 351:1513–20. doi: 10.1056/NEJMoa041318
8. de Bono JS, Oudard S, Ozguroglu M, Hansen S, Machiels J-P, Kocak I, et al. Prednisone plus cabazitaxel or mitoxantrone for metastatic castration-resistant prostate cancer progressing after docetaxel treatment: a randomised open-label trial. Lancet (2010) 376:1147–54. doi: 10.1016/S0140-6736(10)61389-X
9. Marín-Aguilera M, Codony-Servat J, Reig Ò, Lozano JJ, Fernández PL, Pereira MV, et al. Epithelial-to-mesenchymal transition mediates docetaxel resistance and high risk of relapse in prostate cancer. Mol Cancer Ther (2014) 13:1270–84. doi: 10.1158/1535-7163.MCT-13-0775
10. Puhr M, Hoefer J, Schäfer G, Erb HHH, Oh SJ, Klocker H, et al. Epithelial-to-Mesenchymal Transition Leads to Docetaxel Resistance in Prostate Cancer and Is Mediated by Reduced Expression of miR-200c and miR-205. Am J Pathol (2012) 181:2188–201. doi: 10.1016/j.ajpath.2012.08.011
11. Small EJ, Aggarwal RR, Huang J, Sokolov A, Zhang L, Alumkal JJ, et al. Clinical and genomic characterization of metastatic small cell/neuroendocrine prostate cancer (SCNC) and intermediate atypical prostate cancer (IAC): Results from the SU2C/PCF/AACRWest Coast Prostate Cancer Dream Team (WCDT). JCO (2016) 34:5019–9. doi: 10.1200/JCO.2016.34.15_suppl.5019
12. Domingo-Domenech J, Mellado B, Ferrer B, Truan D, Codony-Servat J, Sauleda S, et al. Activation of nuclear factor-κB in human prostate carcinogenesis and association to biochemical relapse. Br J Cancer (2005) 93:1285–94. doi: 10.1038/sj.bjc.6602851
13. Irizarry RA. Summaries of Affymetrix GeneChip probe level data. Nucleic Acids Res (2003) 31:15e–15. doi: 10.1093/nar/gng015
14. Dai M. Evolving gene/transcript definitions significantly alter the interpretation of GeneChip data. Nucleic Acids Res (2005) 33:e175–5. doi: 10.1093/nar/gni179
15. Ritchie ME, Phipson B, Wu D, Hu Y, Law CW, Shi W, et al. limma powers differential expression analyses for RNA-sequencing and microarray studies. Nucleic Acids Res (2015) 43:e47–7. doi: 10.1093/nar/gkv007
16. Aoki-Kinoshita KF, Kanehisa M. Gene Annotation and Pathway Mapping in KEGG. In: Bergman NH, editor. Comparative Genomics Methods In Molecular BiologyTM. Totowa, NJ: Humana Press (2007). p. 71–91. doi: 10.1007/978-1-59745-515-2_6
17. Zhao M, Kong L, Liu Y, Qu H. dbEMT: an epithelial-mesenchymal transition associated gene resource. Sci Rep (2015) 5:11459. doi: 10.1038/srep11459
18. Huang T-S, Hsieh J-Y, Wu Y-H, Jen C-H, Tsuang Y-H, Chiou S-H, et al. Functional Network Reconstruction Reveals Somatic Stemness Genetic Maps and Dedifferentiation-Like Transcriptome Reprogramming Induced by GATA2. Stem Cells (2008) 26:1186–201. doi: 10.1634/stemcells.2007-0821
19. Pece S, Tosoni D, Confalonieri S, Mazzarol G, Vecchi M, Ronzoni S, et al. Biological and Molecular Heterogeneity of Breast Cancers Correlates with Their Cancer Stem Cell Content. Cell (2010) 140:62–73. doi: 10.1016/j.cell.2009.12.007
20. Palmer NP, Schmid PR, Berger B, Kohane IS. A gene expression profile of stem cell pluripotentiality and differentiation is conserved across diverse solid and hematopoietic cancers. Genome Biol (2012) 13:R71. doi: 10.1186/gb-2012-13-8-r71
21. Shats I, Gatza ML, Chang JT, Mori S, Wang J, Rich J, et al. Using a Stem Cell-Based Signature to Guide Therapeutic Selection in Cancer. Cancer Res (2011) 71:1772–80. doi: 10.1158/0008-5472.CAN-10-1735
22. Pinto JP, Kalathur RK, Oliveira DV, Barata T, Machado RSR, Machado S, et al. StemChecker: a web-based tool to discover and explore stemness signatures in gene sets. Nucleic Acids Res (2015) 43:W72–7. doi: 10.1093/nar/gkv529
23. Beltran H, Prandi D, Mosquera JM, Benelli M, Puca L, Cyrta J, et al. Divergent clonal evolution of castration-resistant neuroendocrine prostate cancer. Nat Med (2016) 22:298–305. doi: 10.1038/nm.4045
24. Beltran H, Wyatt AW, Chedgy EC, Donoghue A, Annala M, Warner EW, et al. Impact of Therapy on Genomics and Transcriptomics in High-Risk Prostate Cancer Treated with Neoadjuvant Docetaxel and Androgen Deprivation Therapy. Clin Cancer Res (2017) 23:6802–11. doi: 10.1158/1078-0432.CCR-17-1034
25. Eisen MB, Spellman PT, Brown PO, Botstein D. Cluster analysis and display of genome-wide expression patterns. Proc Natl Acad Sci (1998) 95:14863–8. doi: 10.1073/pnas.95.25.14863
26. Saldanha AJ. Java Treeview–extensible visualization of microarray data. Bioinformatics (2004) 20:3246–8. doi: 10.1093/bioinformatics/bth349
27. Grasso CS, Wu Y-M, Robinson DR, Cao X, Dhanasekaran SM, Khan AP, et al. The mutational landscape of lethal castration-resistant prostate cancer. Nature (2012) 487:239–43. doi: 10.1038/nature11125
28. Kumar A, Coleman I, Morrissey C, Zhang X, True LD, Gulati R, et al. Substantial interindividual and limited intraindividual genomic diversity among tumors from men with metastatic prostate cancer. Nat Med (2016) 22:369–78. doi: 10.1038/nm.4053
29. Robinson D, Van Allen EM, Wu Y-M, Schultz N, Lonigro RJ, Mosquera J-M, et al. Integrative clinical genomics of advanced prostate cancer. Cell (2015) 161:1215–28. doi: 10.1016/j.cell.2015.05.001
30. Cancer Genome Atlas Research Network. The Molecular Taxonomy of Primary Prostate Cancer. Cell (2015) 163:1011–25. doi: 10.1016/j.cell.2015.10.025
31. Taylor BS, Schultz N, Hieronymus H, Gopalan A, Xiao Y, Carver BS, et al. Integrative genomic profiling of human prostate cancer. Cancer Cell (2010) 18:11–22. doi: 10.1016/j.ccr.2010.05.026
32. Baca SC, Prandi D, Lawrence MS, Mosquera JM, Romanel A, Drier Y, et al. Punctuated evolution of prostate cancer genomes. Cell (2013) 153:666–77. doi: 10.1016/j.cell.2013.03.021
33. Gao J, Aksoy BA, Dogrusoz U, Dresdner G, Gross B, Sumer SO, et al. Integrative analysis of complex cancer genomics and clinical profiles using the cBioPortal. Sci Signal (2013) 6:pl1. doi: 10.1126/scisignal.2004088
34. Cerami E, Gao J, Dogrusoz U, Gross BE, Sumer SO, Aksoy BA, et al. The cBio Cancer Genomics Portal: An Open Platform for Exploring Multidimensional Cancer Genomics Data: Figure1. Cancer Discovery (2012) 2:401–4. doi: 10.1158/2159-8290.CD-12-0095
35. Abida W, Cyrta J, Heller G, Prandi D, Armenia J, Coleman I, et al. Genomic correlates of clinical outcome in advanced prostate cancer. PNAS (2019) 116:11428–36. doi: 10.1073/pnas.1902651116
36. Scher HI, Halabi S, Tannock I, Morris M, Sternberg CN, Carducci MA, et al. Design and end points of clinical trials for patients with progressive prostate cancer and castrate levels of testosterone: recommendations of the Prostate Cancer Clinical Trials Working Group. J Clin Oncol (2008) 26:1148–59. doi: 10.1200/JCO.2007.12.4487
37. Hothorn T, Lausen B. On the exact distribution of maximally selected rank statistics. Comput Stat Data Anal (2003) 43:121–37. doi: 10.1016/S0167-9473(02)00225-6
38. Antonarakis ES, Tagawa ST, Galletti G, Worroll D, Ballman K, Vanhuyse M, et al. Randomized, Noncomparative, Phase II Trial of Early Switch From Docetaxel to Cabazitaxel or Vice Versa, With Integrated Biomarker Analysis, in Men With Chemotherapy-Naïve, Metastatic, Castration-Resistant Prostate Cancer. J Clin Oncol (2017) 35:3181–8. doi: 10.1200/JCO.2017.72.4138
39. de Wit R, de Bono J, Sternberg CN, Fizazi K, Tombal B, Wülfing C, et al. Cabazitaxel versus Abiraterone or Enzalutamide in Metastatic Prostate Cancer. New Engl J Med (2019) 381:2506–18. doi: 10.1056/NEJMoa1911206
40. Craene BD, Berx G. Regulatory networks defining EMT during cancer initiation and progression. Nat Rev Cancer (2013) 13:97–110. doi: 10.1038/nrc3447
41. Codony-Servat J, Marín-Aguilera M, Visa L, García-Albéniz X, Pineda E, Fernández PL, et al. Nuclear factor-kappa B and interleukin-6 related docetaxel resistance in castration-resistant prostate cancer. Prostate (2013) 73:512–21. doi: 10.1002/pros.22591
42. Nieto MA, Huang RY-J, Jackson RA, Thiery JP. EMT: 2016. Cell (2016) 166:21–45. doi: 10.1016/j.cell.2016.06.028
43. Martin SK, Pu H, Penticuff JC, Cao Z, Horbinski C, Kyprianou N. Multinucleation and Mesenchymal-to-Epithelial Transition Alleviate Resistance to Combined Cabazitaxel and Antiandrogen Therapy in Advanced Prostate Cancer. Cancer Res (2016) 76:912–26. doi: 10.1158/0008-5472.CAN-15-2078
44. Gerhauser C, Favero F, Risch T, Simon R, Feuerbach L, Assenov Y, et al. Molecular Evolution of Early-Onset Prostate Cancer Identifies Molecular Risk Markers and Clinical Trajectories. Cancer Cell (2018) 34:996–1011.e8. doi: 10.1016/j.ccell.2018.10.016
45. Warzecha CC, Carstens RP. Complex changes in alternative pre-mRNA splicing play a central role in the epithelial-to-mesenchymal transition (EMT). Semin Cancer Biol (2012) 22:417–27. doi: 10.1016/j.semcancer.2012.04.003
46. Horiguchi K, Sakamoto K, Koinuma D, Semba K, Inoue A, Inoue S, et al. TGF-B drives epithelial-mesenchymal transition through EF1-mediated downregulation of ESRP. Oncogene (2012) 31:3190–201. doi: 10.1038/onc.2011.493
47. Lu W, Kang Y. Epithelial-Mesenchymal Plasticity in Cancer Progression and Metastasis. Dev Cell (2019) 49:361–74. doi: 10.1016/j.devcel.2019.04.010
48. Aceto N, Bardia A, Miyamoto DT, Donaldson MC, Wittner BS, Spencer JA, et al. Circulating tumor cell clusters are oligoclonal precursors of breast cancer metastasis. Cell (2014) 158:1110–22. doi: 10.1016/j.cell.2014.07.013
49. Friedl P, Mayor R. Tuning Collective Cell Migration by Cell–Cell Junction Regulation. Cold Spring Harb Perspect Biol (2017) 9:a029199. doi: 10.1101/cshperspect.a029199
50. Williams ED, Gao D, Redfern A, Thompson EW. Controversies around epithelial-mesenchymal plasticity in cancer metastasis. Nat Rev Cancer (2019) 19:716–32. doi: 10.1038/s41568-019-0213-x
51. Santamaria PG, Moreno-Bueno G, Portillo F, Cano A. EMT: Present and future in clinical oncology. Mol Oncol (2017) 11:718–38. doi: 10.1002/1878-0261.12091
52. George JT, Jolly MK, Xu S, Somarelli JA, Levine H. Survival Outcomes in Cancer Patients Predicted by a Partial EMT Gene Expression Scoring Metric. Cancer Res (2017) 77:6415–28. doi: 10.1158/0008-5472.CAN-16-3521
Keywords: cell plasticity, EMT—epithelial-mesenchymal transition, neuroendocrine, castration-resistant prostate cancer, docetaxel, cabazitaxel, taxanes resistance
Citation: Jiménez N, Reig Ò, Montalbo R, Milà-Guasch M, Nadal-Dieste L, Castellano G, Lozano JJ, Victoria I, Font A, Rodriguez-Vida A, Carles J, Suárez C, Domènech M, Sala-González N, Fernández PL, Rodríguez-Carunchio L, Díaz S, Prat A, Marín-Aguilera M and Mellado B (2020) Cell Plasticity-Related Phenotypes and Taxanes Resistance in Castration-Resistant Prostate Cancer. Front. Oncol. 10:594023. doi: 10.3389/fonc.2020.594023
Received: 12 August 2020; Accepted: 05 October 2020;
Published: 02 November 2020.
Edited by:
Fred Saad, University of Montreal Hospital Centre (CRCHUM), CanadaReviewed by:
Eugenio Zoni, University of Bern, SwitzerlandLeena Latonen, University of Eastern Finland, Finland
Copyright © 2020 Jiménez, Reig, Montalbo, Milà-Guasch, Nadal-Dieste, Castellano, Lozano, Victoria, Font, Rodriguez-Vida, Carles, Suárez, Domènech, Sala-González, Fernández, Rodríguez-Carunchio, Díaz, Prat, Marín-Aguilera and Mellado. This is an open-access article distributed under the terms of the Creative Commons Attribution License (CC BY). The use, distribution or reproduction in other forums is permitted, provided the original author(s) and the copyright owner(s) are credited and that the original publication in this journal is cited, in accordance with accepted academic practice. No use, distribution or reproduction is permitted which does not comply with these terms.
*Correspondence: Begoña Mellado, bmellado@clinic.cat; Mercedes Marín-Aguilera, mmarin1@clinic.cat