 Shaohua Xu
 Ruihuan Gao1
 Chunhua Luo
 Song-Mei Liu
- 1Department of Clinical Laboratory, Center for Gene Diagnosis & Program of Clinical Laboratory, Zhongnan Hospital of Wuhan University, Wuhan, China
- 2The First College of Clinical Medical Science, Three Gorges University, Hubei, China
Background: Primary liver cancer is still the most common lethal malignancy. The N-myc downstream-regulated gene family (NDRG1–4) is a group of multifunctional proteins associated with carcinogenesis. However, systematic evaluation of the diagnostic and prognostic values of NDRG1 or NDRG2 expression in liver cancer is poorly investigated.
Method: The gene expression matrix of liver hepatocellular carcinoma (LIHC) was comprehensively analyzed by the “limma” and “Dseq2” R packages. The Gene Ontology (GO) and Gene Set Enrichment Analysis (GSEA) were used to identify the biological functional differences. A single-sample GSEA (ssGSEA) was conducted to quantify the extent of immune cell infiltration. Finally, the clinical and prognostic information of LIHC patients was systematically investigated using Kaplan–Meier analysis and logistic and Cox regression analysis.
Results: Compared with normal tissues, NDRG1 expression was higher, whereas NDRG2 expression was lower in tumor tissues (P <0.001). The area under the receiver operator characteristic curve (AUROC) of NDRG1 and NDRG2 for LIHC was 0.715 and 0.799, respectively. Kaplan–Meier analysis revealed that NDRG1 and NDRG2 were independent clinical prognostic biomarkers for the overall survival (OS, P = 0.001 and 2.9e−06), progression-free interval (PFI, P = 0.028 and 0.005) and disease-specific survival (DSS, P = 0.027 and P <0.001). The C-indexes and calibration plots of the nomogram suggest that NDRG1 and NDRG2 have an effective predictive performance for OS (C-index: 0.676), DSS (C-index: 0.741) and PFI (C-index: 0.630) of liver cancer patients. The mutation rate of NDRG1 in liver cancer reached up to 14%, and DNA methylation levels of NDRG1 and NDRG2 promoters correlated significantly with clinical prognosis.
Conclusions: The mRNA expression and DNA methylation of NDRG superfamily members have the potential for LIHC diagnosis and prognosis via integrative analysis from multiple cohorts.
Introduction
Primary liver cancer is the fourth leading cause of cancer-related deaths worldwide, characterized by an insidious onset and a low rate of early diagnosis (1). In China, liver hepatocellular carcinoma (LIHC) is the most common type of primary liver cancer and typically results from chronic hepatitis B virus infection (2). Despite the recent advances in diagnostic and therapy, the 5-year relative survival rate of LIHC remains to be only 12% (3). Currently, LIHC contributes to over half of the new deaths, and it is predicted to rise continuously in the next decade (4). Therefore, identifying potential biomarkers that improve diagnostic accuracy and prognostic prediction is critical.
Increasing evidence indicates that disturbance of proto-oncogenes and tumor suppressor genes results in hepatocarcinogenesis, which is a complicated pathophysiological process (5). Viral infection and metabolic stress induce genetic and epigenetic alterations through cell cycle turnover and the inflammatory environment (6). The N-myc downstream-regulated gene (NDRG1–4) family, a hypoxia-associated protein, has been involved in cell proliferation and differentiation, stress responses, tumor progression, and metastasis (7–9). NDRG1 is involved in cellular skeleton modification and organ development and can be induced by hypoxia and DNA damage (7, 10). NDRG2 is highly expressed in dendritic cells and maintains activated leukocyte adhesion (11). Moreover, NDRG3 could promote cell growth and angiogenesis and participate in the lactate-dependent hypoxia signaling pathway (12). NDRG4 is exclusively expressed in the embryonic stage and regulates the proliferation and growth of nerve cells and cardiomyocytes (13). Of note, abnormal expression of NDRG1 or NDRG2 has been found in different cancer types, such as in esophageal cancer, colorectal cancer, breast cancer, prostate cancer, and hepatocellular carcinoma, and is significantly associated with poor prognosis (10, 14–16). Existing data indicate that NDRG1 is upregulated and NDRG2 is downregulated in LIHC. However, a few studies focused on the diagnostic and prognostic values of NDRG1 or NDRG2 in LIHC, and their potential mechanisms in LIHC remain unknown.
Here, the diagnostic and prognostic significance of NDRG1 and NDRG2 were systematically identified in LIHC using RNA-seq data from the TCGA database. We first comprehensively analyzed the gene expression matrix of LIHC and then applied bioinformatics methods (namely, Gene Ontology (GO) terms, Kyoto Encyclopedia of Genes and Genomes (KEGG) pathway analysis, and Gene Set Enrichment Analysis (GSEA)) to explore the underlying biological mechanism. Secondly, we analyzed DNA mutation and methylation in NDRG1 or NDRG2, and explored the relevance between immune cells and NDRG1 or NDRG2 expression by the single sample GSEA (ssGSEA). Moreover, clinical and follow-up information of LIHC patients were used for Kaplan–Meier analysis, and logistic and Cox regression analysis. Finally, we plotted a nomogram for the prognosis prediction of the patients. Taken together, this study revealed that NDRG1 or NDRG2 could be a potential diagnostic and prognostic biomarker for LIHC.
Materials and Methods
Data Source
RNA-seq data for pan-cancer analysis were retrieved from the UCSC XENA (https://xenabrowser.net/datapages/) (17, 18). The mRNA expression datasets (GSE14520, GSE25097, and GSE36376) were obtained from the GEO database (https://www.ncbi.nlm.nih.gov/geo/) to further validate the results of pan-cancer analysis in LIHC patients. Meanwhile, we also collected the data for NDRG1 and NDRG2 protein expression from the Human Protein Atlas (HPA) (https://www.proteinatlas.org/). The mRNA expression matrix file of TCGA-LIHC and the corresponding clinical data were collected from the TCGA website (https://portal.gdc.cancer.gov/repository), and level-3 HTSeq-FPKM data were transformed into TPM (transcripts per million reads) for subsequent analyses. A total of 371 patient information was used, while unavailable or unknown clinical information was excluded.
Clinical Specimen Collection, RNA isolation, and qPCR
Thirty-two pairs of fresh-frozen tissues (LIHC tissues and their adjacent tissues) were collected from the Zhongnan Hospital of Wuhan University with informed consent and approval from the hospital ethics committee. cDNA was synthesized from total RNA using the PrimeScript RT Reagent Kit (Vazyme, R333-01, China). The SYBR Prime Script RT-PCR kit (Vazyme, Q712-02, China) was used for qPCR on a CFX96 Connect Real-Time System (Bio-Rad, America). The primer sequences were as follows: NDRG1-F, 5′-GAAGTGGTCCACACCTACCG-3′; NDRG1-R, 5′-GTCCGCCATCTTGAGGAGAG-3′; NDRG2-F, 5′-GCCCAGCGATCCTTACCTAC-3′; NDRG2-R, 5′-TGCAAGCTGGTCCAGAGATG-3′; GAPDH-F, 5′-GGAGCGAGATCCCTCCAAAAT-3′; and GAPDH-R, 5′-GGCTGTTGTCATACTTCTCATGG-3′.
Identification of the NDRG1 and NDRG2 Expression Profile
The raw expression profiles from GEO datasets were preprocessed by R software (version 4.0.5) and differentially analyzed by running the “limma” R package (version 3.46.0). Gene expression data of LIHC case samples were stratified into high- and low-expression groups based on the median expression of NDRG1 and NDRG2, respectively. The expression analysis between high- and low-expression groups was performed using the “DESeq2” R package (19) (version 3.18.1; http://www.Rproject.org). Genes with the threshold for | log2FoldChange | >0.5 and adjusted P <0.05 were regarded as statistically significant.
Functional Annotation and Enrichment Analysis
R package ClusterProfiler (version 3.14.3) was applied to GO term analysis, KEGG pathway analysis, and GSEA to elucidate the function and pathway differences between the high- and low-expression groups (20, 21). Here, the curated gene sets (c2.cp.v7.2.symbols.gmt) from MSigDB Collections were selected as reference gene sets for GSEA. A permutation test with 1,000 iterations was used to identify pathways that had changed significantly. Significant pathway enrichment was identified by a false discovery rate (FDR) <0.25 and P-value <0.05.
Single-Sample GSEA (ssGSEA) for Immune Infiltration Analysis
The ssGSEA was conducted using the GSVA R package (3.6.3) to quantify the tumor immune infiltration levels in 24 types of immune cells (22) and the marker of which was obtained from a previous study (23). Next, Spearman’s correlation analysis was conducted to evaluate the associations of NDRG1 and NDRG2 expression with immune cell infiltration, and the Wilcoxon rank-sum test was used to investigate the enrichment scores of immune infiltration levels between high- and low-NDRG1 and NDRG2 expression groups.
DNA Mutations and Methylation Analysis
The cBio Cancer Genomics Portal (http://cbioportal.org) was applied to analyze NDRG family alterations in the TCGA-LIHC sample, which is an interactive exploration website of multidimensional cancer genomic datasets (24). The DNA CpG methylation of NDRG1 and NDRG2 in TCGA was also analyzed by MethSurv (https://biit.cs.ut.ee/methsurv/) to explore the relevance between the CpG methylation level and prognostic values (25).
Statistical Analysis
The R software (version 4.0.5) was used for all statistical analysis and graphical plotting. Scatter plot analysis was performed using the Wilcoxon rank-sum test. Non-parametric survival analysis was performed by the Kaplan–Meier method and log-rank test. Correlation analysis was evaluated using the Spearman’s coefficient. The Wilcoxon signed rank test, Kruskal–Wallis test, and Chi-Squared test were used to assess the clinicopathological features between high- and low-expression groups. The diagnostic performance of NDRG1 or NDRG2 expression was tested by the Area Under the Receiver Operator Characteristic Curve (AUROC). Univariate and multivariate analyses using Cox proportional hazard modeling were performed to estimate the death risk. Unless stated otherwise, P <0.05 (two-sided) was considered statistically significant.
Results
NDRG1 Was Upregulated and NDRG2 Was Downregulated in LIHC
We used pan-cancer RNA-seq data from the UCSC XENA to evaluate the mRNA expression levels of NDRG1 and NDRG2 in diverse human cancers. As shown in Figure 1A, the mRNA expression of NDRG1 and NDRG2 was found to be significantly different (P <0.001) in almost all tumor types, including LIHC. To further verify the above results, we performed common differential expression gene analysis among the three selected GEO datasets (GSE14520, GSE25097, and GSE3637), and NDRG1 and NDRG2 were found to be two of the 843 overlapping genes (|log2FoldChange| >0.5, Padj <0.05) (Figure 1B). As shown in Figures 1C, D, the results from GSE14520 showed that NDRG1 mRNA was highly expressed in LIHC tissues compared to the adjacent normal tissues (p <0.001), and NDRG2 mRNA was markedly downregulated in LIHC tissues (P <0.001).
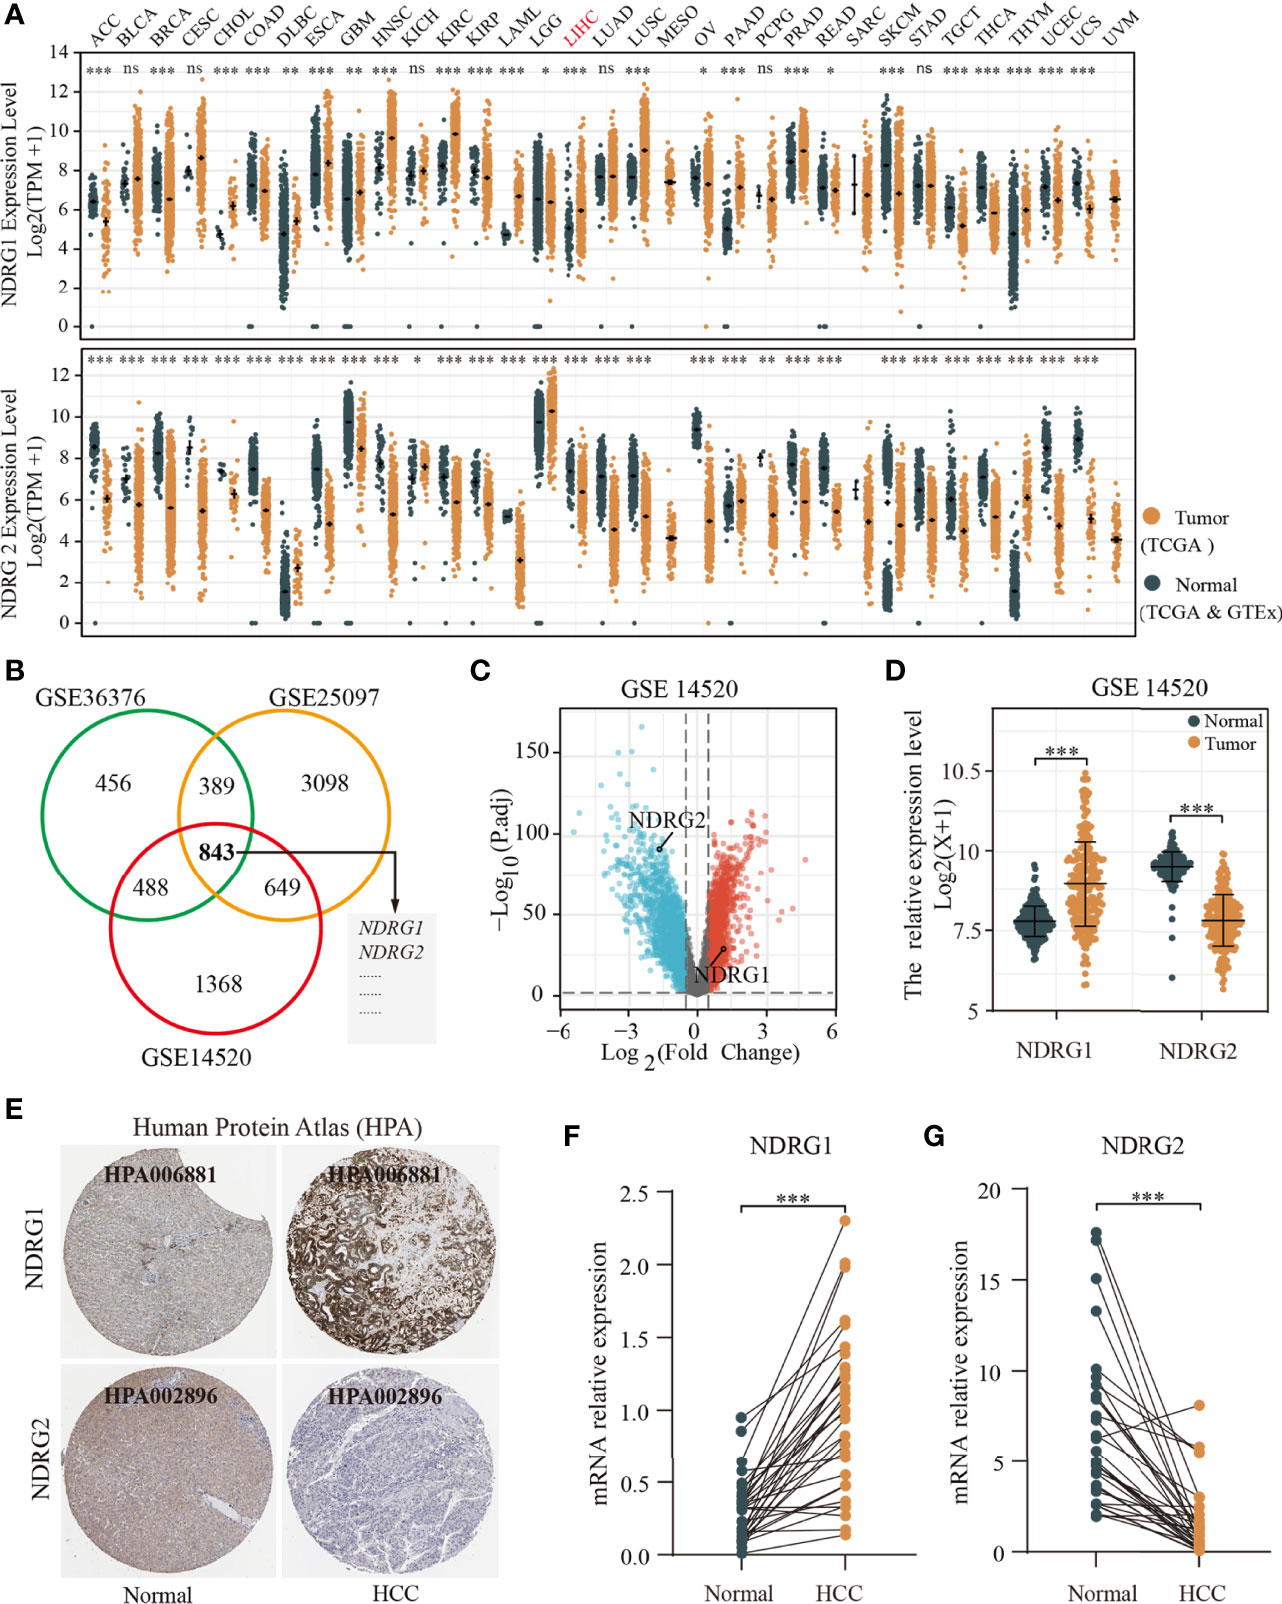
Figure 1 Differential mRNA expression profiles of NDRG1 or NDRG2 in different cancer types. (A) The expression levels of NDRG1 and NDRG2 in different cancer types were analyzed based on the TCGA database. (B) Venn plots of DEGs (| log2FoldChange>0.5 and adjusted P <0.05) identified in three GEO databases. (C) The volcano plots for all the coding genes obtained in the GSE14520 database. Red and blue dots represent up-regulated DEGs and down-regulated DEGs, respectively. (D) The scatter diagram of NDRG1 and NDRG2 mRNA expression levels in GSE14520 database. (E) The protein expression of NDRG1 and NDRG2 in LIHC was obtained from the Human Protein Atlas (HPA, https://www.proteinatlas.org/). (F, G) The expression levels of NDRG1 and NDRG2 were obtained by qPCR assay in liver carcinoma and para-carcinoma tissues. *P < 0.05; **P < 0.01; ***P < 0.001. ns, no significance.
To further validate NDRG1 and NDRG2 protein expression in LIHC, we analyzed the NDRG1 and NDRG2 expression profiles in the HPA database (Figure 1E). The immunohistochemical staining from HPA also showed that NDRG1 and NDRG2 proteins were expressed in a pattern consistent with the mRNA-level changes in LIHC tissues. At the experimental level, we analyzed NDRG1 and NDRG2 mRNA expression by qPCR in 32 pairs of LIHC tissues (Figures 1F, G). The qPCR results again indicated the high expression of NDRG1 (P <0.001) and low expression of NDRG2 (P <0.001) in LIHC tissues.
DNA Mutation and Methylation of NDRG1 or NDRG2 for LIHC Prognosis
Next, we analyzed the mutation frequencies of NDRG1 or NDRG2 in TCGA-LIHC using the cBioPortal online tool. As shown in Figure 2A, a high mutation rate of NDRG1 (up to 14%) was observed in LIHC patients, while other NDRG family genes (NDRG2, NDRG3, and NDRG4) were rarely mutated (less than 2%). Moreover, we analyzed the DNA methylation levels of NDRG1 and NDRG2 (Figures 2B, C) and the prognostic values (Figure 2D) of single CpG in TCGA-LIHC via MethSurv©2017. As a result, they showed that cg15393676 in NDRG1 (Figure 2B), and cg16409562 and cg04359602 in NDRG2 (Figure 2C) showed the highest methylation in their promoter regions. The DNA methylation level has been negatively correlated with the gene expression level. As shown in Figure 2D, LIHC patients with hypermethylation in NDRG1 and hypomethylation in NDRG2 could have a better clinical prognosis, which supported our mRNA expression results.
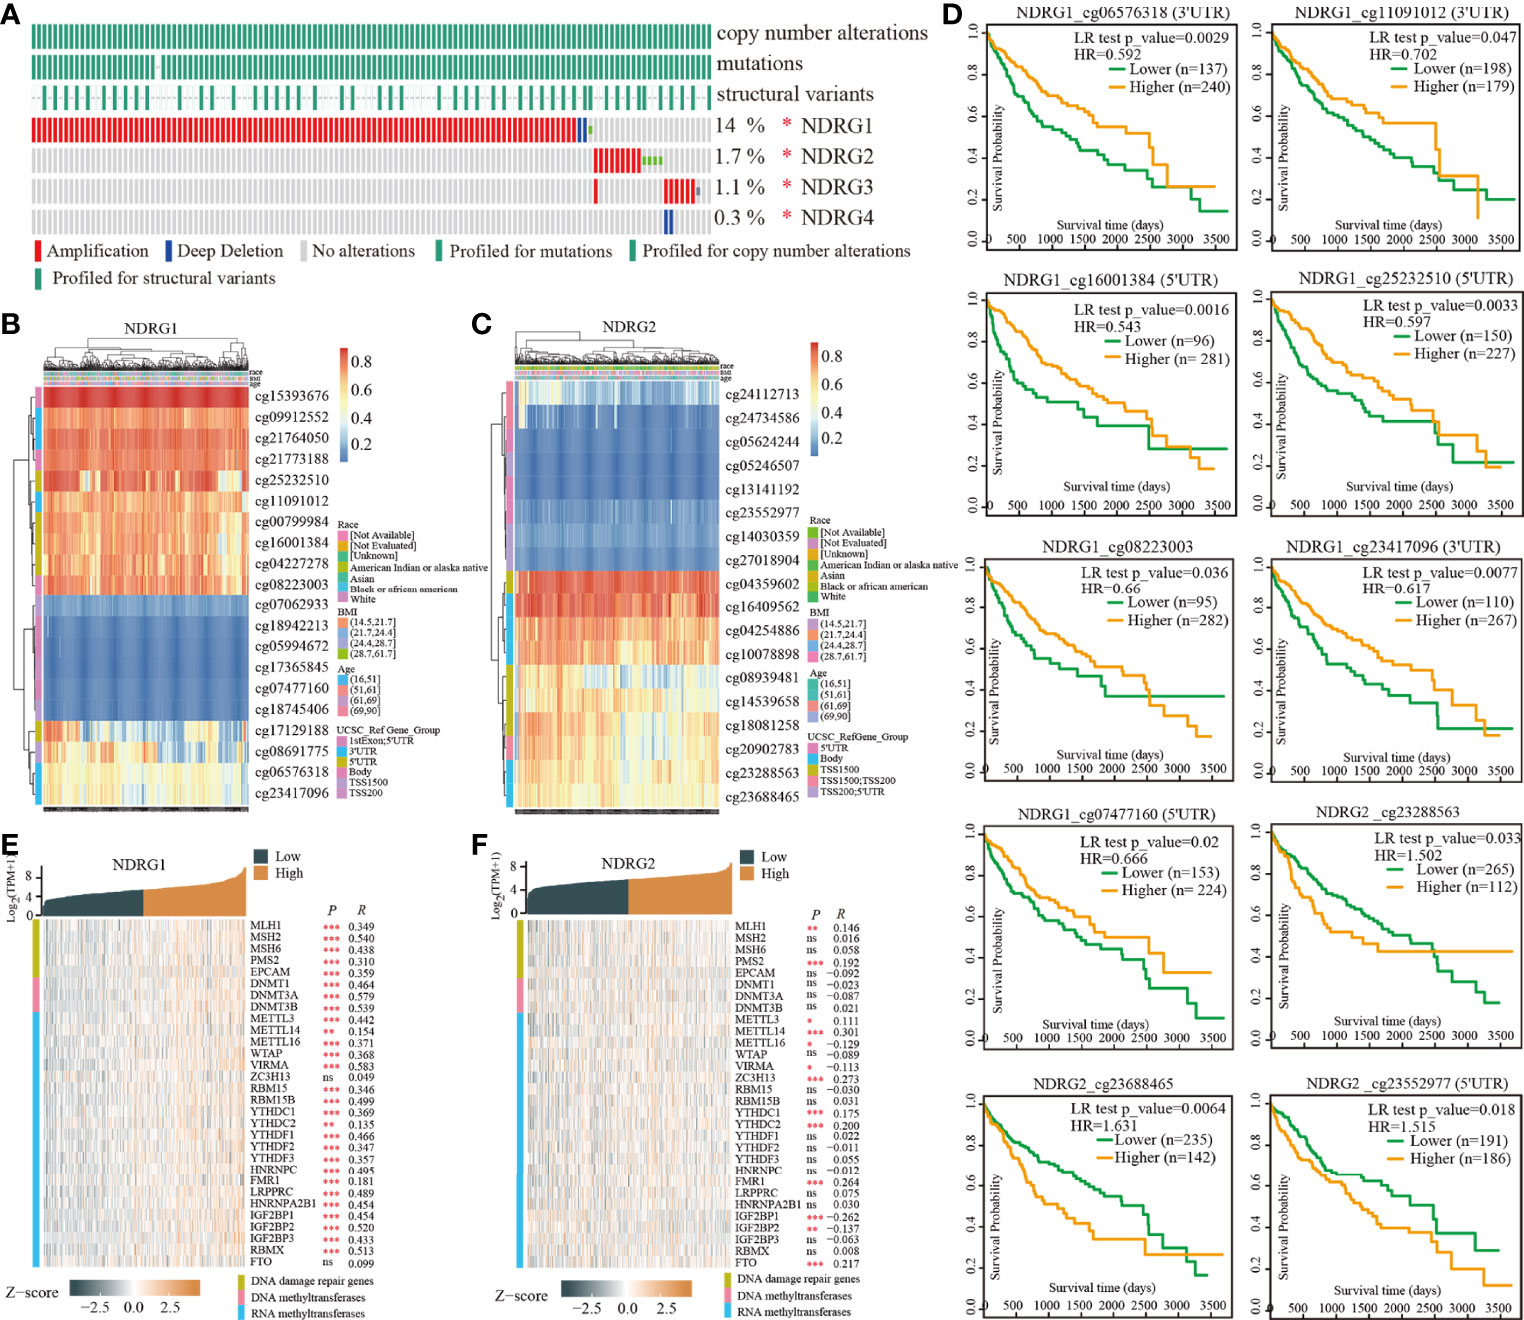
Figure 2 The analysis of DNA mutation and methylation of NDRG1 or NDRG2. (A) The overview of DNA mutation of the NDRGs family genes, mapped by cBioPortal (http://www.cbioportal.org/). (B, C) The DNA methylation clustered expression of NDRG1 and NDRG2 by using MethSurv©2017 (https://biit.cs.ut.ee/methsurv/). Red to blue represents a high to low expression. (D) The significantly prognostic values of the promoter CpGs in NDRG1 and NDRG2 obtained from MethSurv©2017. (E, F) The heatmaps of NDRG1 and NDRG2 expression in relation to DNA repair genes and methyltransferases. *P < 0.05, **P < 0.01, ***P < 0.001. NS, no significance.
Furthermore, we explored the relationship between the expression of NDRG1 or NDRG2 and DNA repair and methyltransferase genes. As shown in Figure 2E, NDRG1 expression has a strong positive correlation with DNA repair genes and methyltransferase genes in LIHC. As shown in Figure 2F, we found that NDRG2 expression has a markable positive correlation with only a few RNA methyltransferase genes and DNA repair genes, but not with DNA methyltransferase in LIHC. This suggests that NDRG1 may indirectly affect the development and progression of LIHC by regulating epigenetic status.
NDRG1- or NDRG2-Related Differentially Expressed Genes
The enrolled 371 LIHC tumor samples from the TCGA dataset were stratified into high- and low-expression groups according to NDRG1 or NDRG2 median values (cut-off value of 50%), respectively. The identified differentially expressed genes (DEGs) (|log2FoldChange| >0.5, Padj <0.05) between different cohorts were illustrated by the volcano plot. A total of 3,547 genes (2,322 upregulated and 1,225 downregulated) were identified as DEGs in the high-NDRG1 group (Figure 3A), and 3,216 genes (1,204 upregulated and 2,012 downregulated) in the high-NDRG2 group (Figure 3B). As shown in Figure 3C, 1,345 overlapping DEGs were found between the NDRG1 and NDRG2 groups based on the TCGA-LIHC dataset.
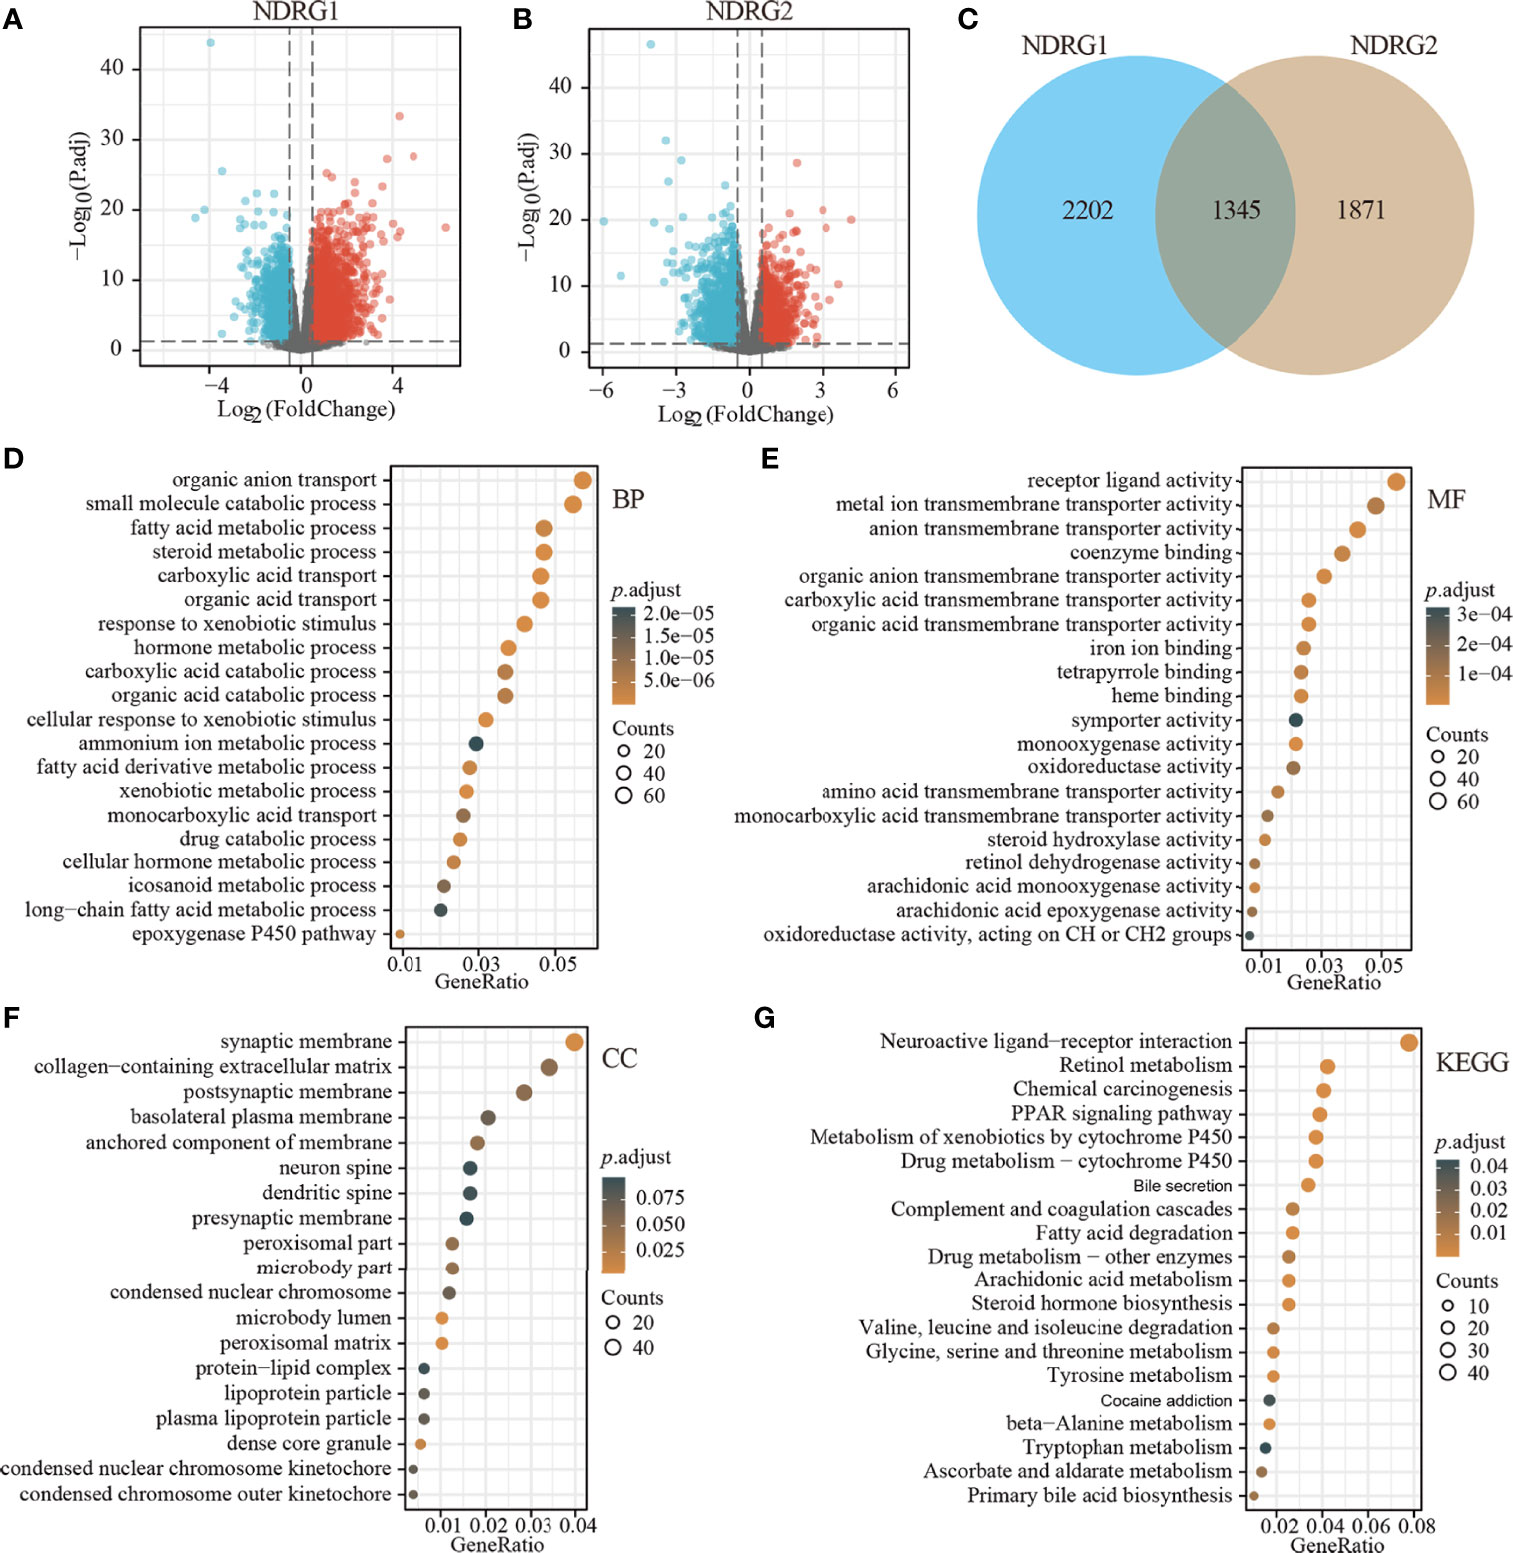
Figure 3 Identification of DEGs in LIHC tissues with low- and high-expressed NDRG1 and NDRG2 groups. (A, B) Volcano plot of DEGs between low- and high-NDRG1 and NDRG2 expression groups based on the TCGA & GTEx datasets. (C) Venn diagram of the identified DEGs between low- and high-NDRG1 and NDRG2 expression groups. (D–G) The plots for the results of enriched GO terms and KEGG pathway analysis using the “ClusterProfiler” R package. The x-axis represents the proportion of DEGs, and different circle sizes represent the number of DEGs.
To predict the function of NDRG1- and NDRG2-related DEGs, we conducted GO and KEGG pathway analysis using 1,345 overlapping DEGs by the “ClusterProfiler” R package (version 3.14.3). As shown in Figures 3D–G, we found that NDRG1- and NDRG2-related DEGs were involved in many biological processes, namely, retinol metabolism, bile secretion, fatty acid degradation, chemical carcinogenesis, amino acid metabolism, PPAR signaling pathway, and the cytochrome p450 pathway.
NDRG1- or NDRG2-Related Signaling Pathways
To identify NDRG1- and NDRG2-related signaling pathways, the GSEA was then conducted between low- and high-expression groups, based on significant differences (P-value <0.05, FDR <0.25) in the enrichment of the MSigDB Collection [c2.cp.v7.2.symbols.gmt (curated)]. Here, the most significant enrichment was selected according to the Normalized Enrichment Score (NES). As shown in Figure 4, GSEA results showed that the NDRG1-related signaling pathway is involved in the PLK1 pathway, complement cascade, complement and coagulation cascades, and fatty acid metabolism (Figure 4A), while the NDRG2-related signaling pathway is involved in fatty acid metabolism, oxidation by cytochrome p450, retinol metabolism, and eukaryotic translation elongation (Figure 4B).
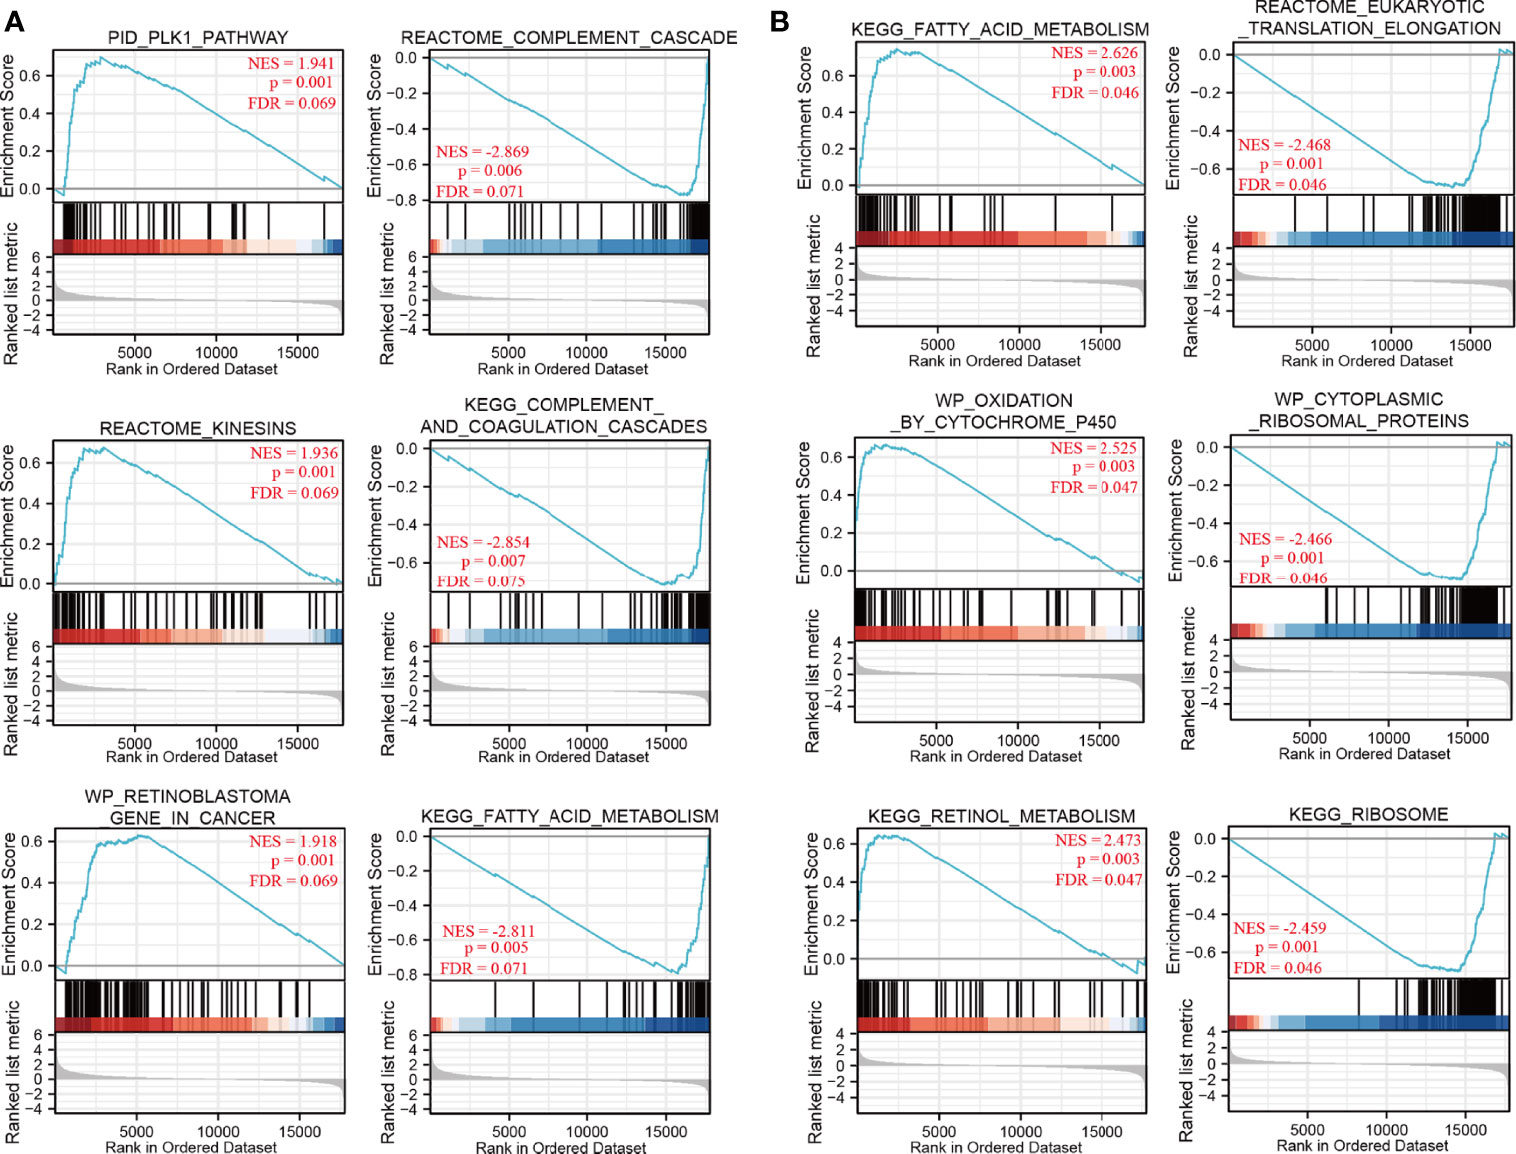
Figure 4 The gene set enrichment analysis of NDRG1 and NDRG2. (A, B) Representative enrichment plots from GSEA. Several pathways and biological processes were differentially enriched in NDRG1 and NDRG2-related hepatocellular carcinoma. NES, normalized enrichment score; p.adj, adjusted P-value; FDR, false discovery rate.
Correlation Between NDRG1 or NDRG2 Expression and Immune Infiltration
The tissue microenvironment is vital for tumor cells. Therefore, we first assessed the infiltration of 24 types of immune cells in LIHC using the ssGSEA method from the R package “GSVA”, and subsequently evaluated the relationship between NDRG1 or NDRG2 mRNA expression and immune cell infiltration by Spearman’s analysis. As shown in Figure 5, T helper cell 2 (Th2) (r = 0.366, P <0.001), follicular helper T cells (TFH) (r = 0.211, P <0.001), and NK CD56 bright cells (r = 0.202, P <0.001) showed a positive correlation with NDRG1 expression, while dendritic cells (DC) (r = −0.285, P <0.001), cytotoxic cells (r = −0.218, P <0.001), and pre-dendritic cells (pDC) (r = −0.233, P <0.001) showed a negative correlation with NDRG1 expression (Figures 5A, C). The expression of NDRG2 was negatively correlated with TFH (r = −0.261, P <0.001), Th2 cells (r = −0.250, P <0.001), NK CD56 bright cells (r = −0.240, P <0.001), and positively correlated with T helper cell 17 (Th17) (r = 0.206, P <0.001) and NK cells (r = 0.147, P <0.004) (Figures 5B, D).
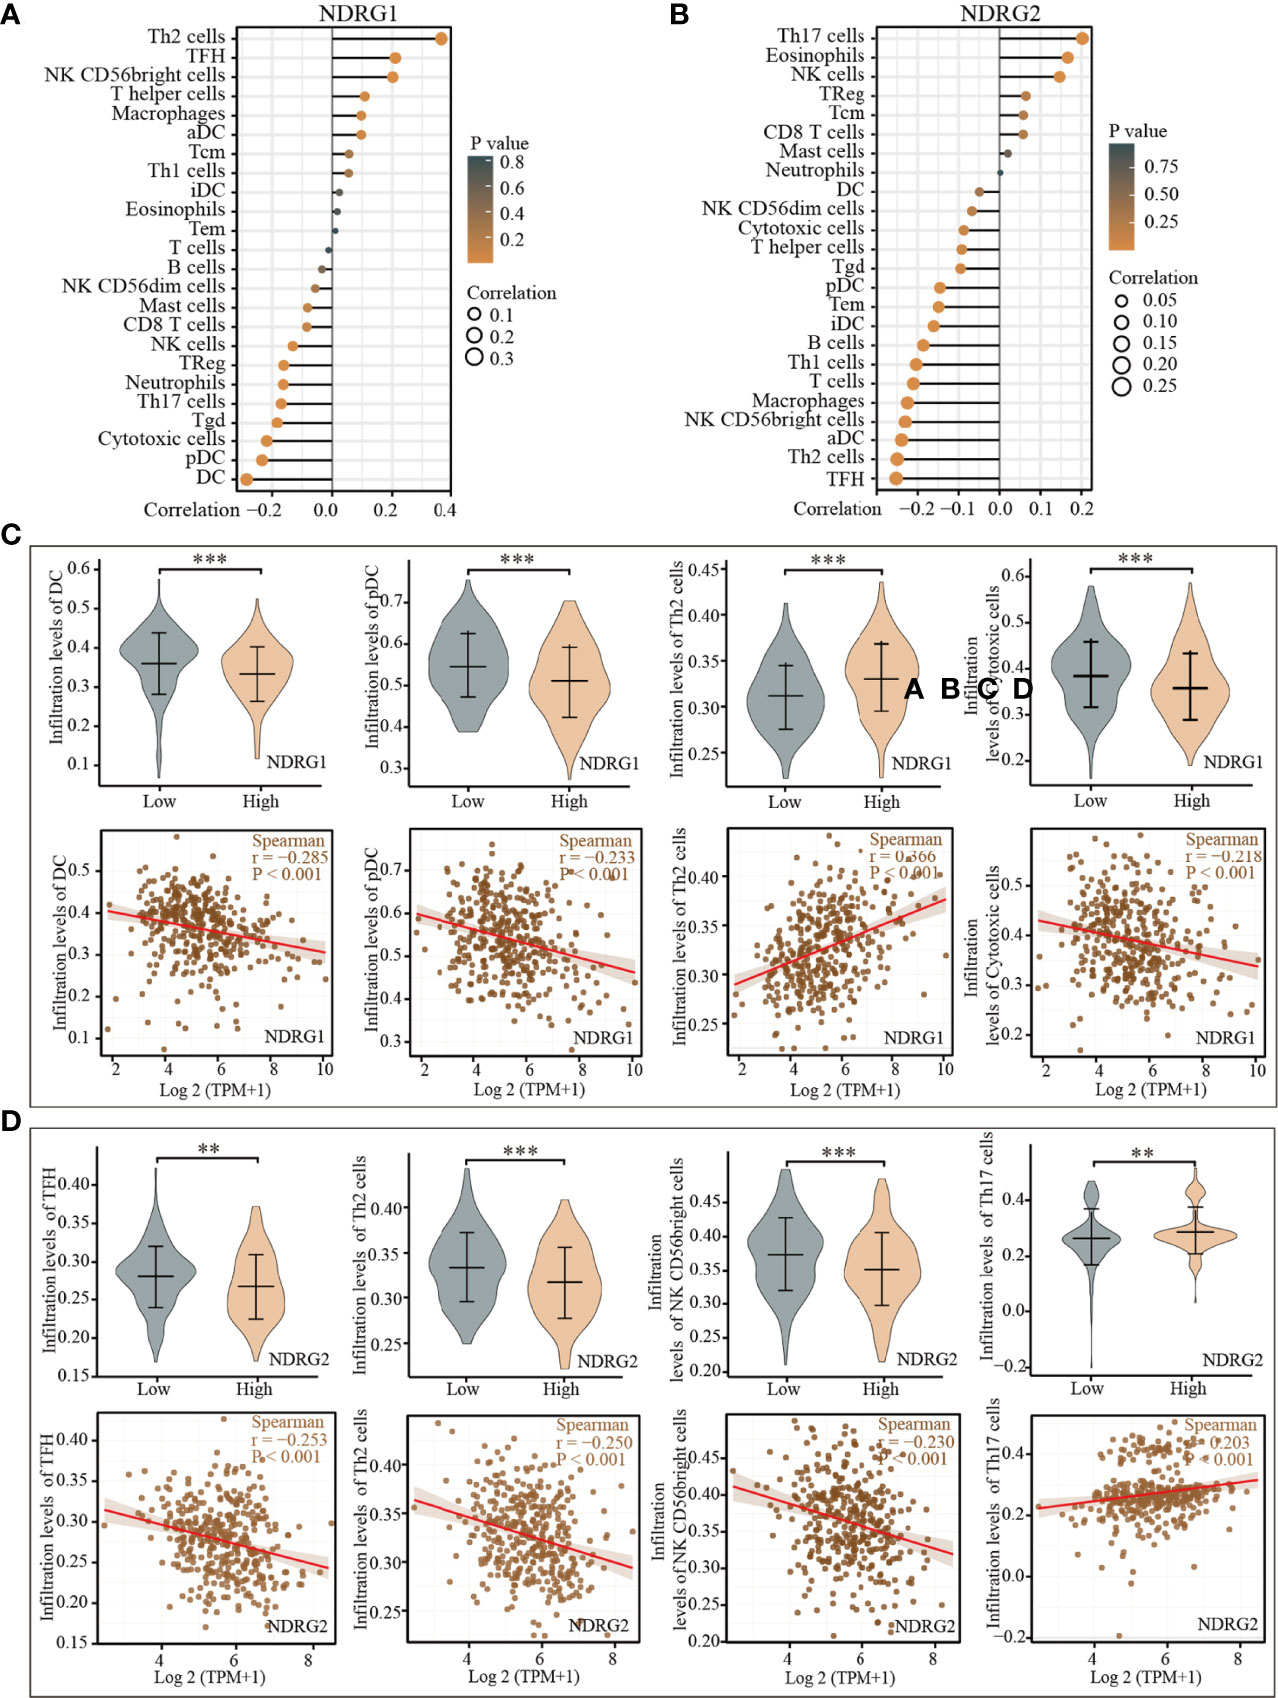
Figure 5 Correlation of the expression of NDRG1 or NDRG2 with immune infiltration. (A, B) The forest plots showed the correlations of NDRG1 or NDRG2 expression with immune infiltration in 24 types of immune cells. The size of the dots shows the absolute values of Spearman’s correlation coefficient. (C, D) Violin plots and scatter plots showing the difference and relevance of representative immune cells infiltration level. **P < 0.01; ***P < 0.001.
Correlation Between NDRG1 or NDRG2 Expression and Clinicopathological Characteristics
The clinicopathological characteristics of LIHC patients with differential NDRG1 and NDRG2 expression are listed in Table 1. There was a significant difference in the distribution of BMI (P = 0.018), T stages (P = 0.031), pathologic stages (P = 0.016), residual tumor (P = 0.008), and histological grade (P = 0.027) between the high- and low-NDRG1 groups. We also further evaluated the correlation between NDRG1 or NDRG2 expression and clinicopathological characteristics by logistic regression analysis (Table 2). As a result, we found markedly positive correlations of NDRG1 expression with clinical T stage (P = 0.004), histological grade (P = 0.005), and AFP concentration (P <0.001).
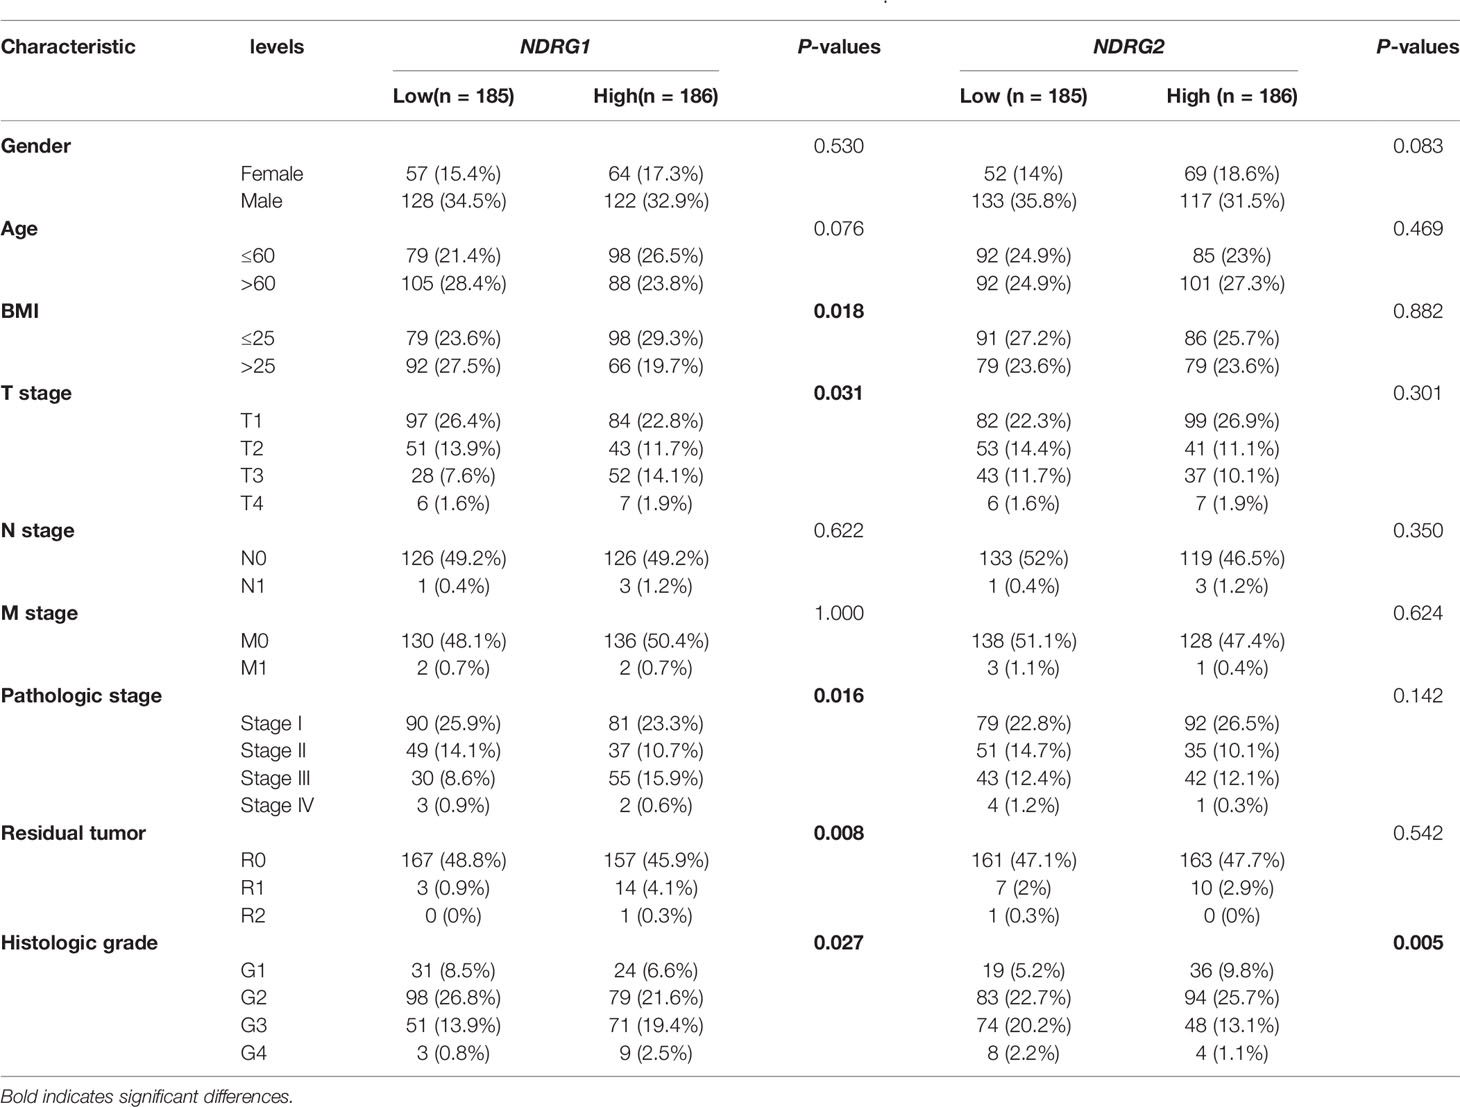
Table 1 Demographics and tumor characteristics based on the expression of NDRG1 and NDRG2.
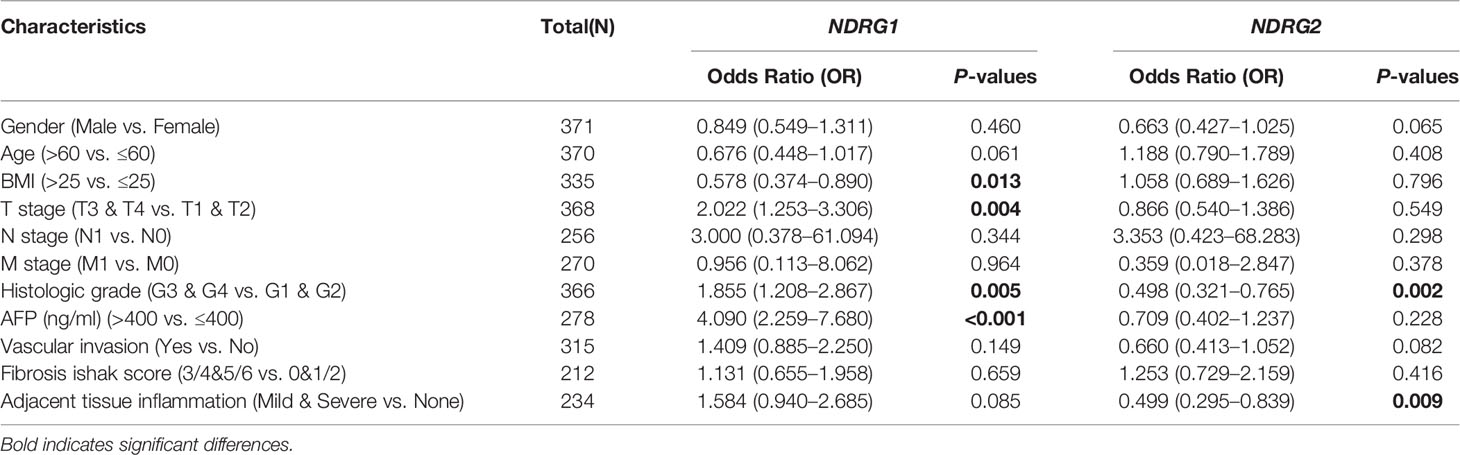
Table 2 Correlation between NDRG1 or NDRG2 expression and clinicopathological characteristics in LIHC patients by logistic regression analysis.
Diagnosis and Prognosis Values of NDRG1 or NDRG2 for LIHC
As shown in Figure 6A, the AUROC of NDRG1 and NDRG2 is 0.715 and 0.799, respectively. The results of AUROC indicated that the expression of NDRG1 or NDRG2 had high sensitivity and specificity for LIHC diagnosis. Next, Kaplan–Meier (K–M) analysis was performed to verify the prediction of NDRG1 or NDRG2 on clinical outcomes. As shown in Figures 6B–E, overall survival [OS, hazard ratio (HR): 1.75, P = 0.0013], disease-specific survival (DSS, HR: 1.64, P = 0.027), progression-free interval (PFI, HR: 1.39, P = 0.028), and risk-free survival (RFS, HR: 1.34, P = 0.095) for LIHC patients with high-NDRG1 expression were statistically worse than those patients with the low-NDRG1 expression. In contrast, OS (HR: 0.43, P = 2.9e−06), DSS (HR: 0.59, P = 0.00046), PFI (HR: 0.63, P = 0.0054), and RFS (HR: 0.42, P = 0.00014) for high-NDRG2 expression groups were all statistically better than those of the low-NDRG2 expression group (Figures 6F–I).
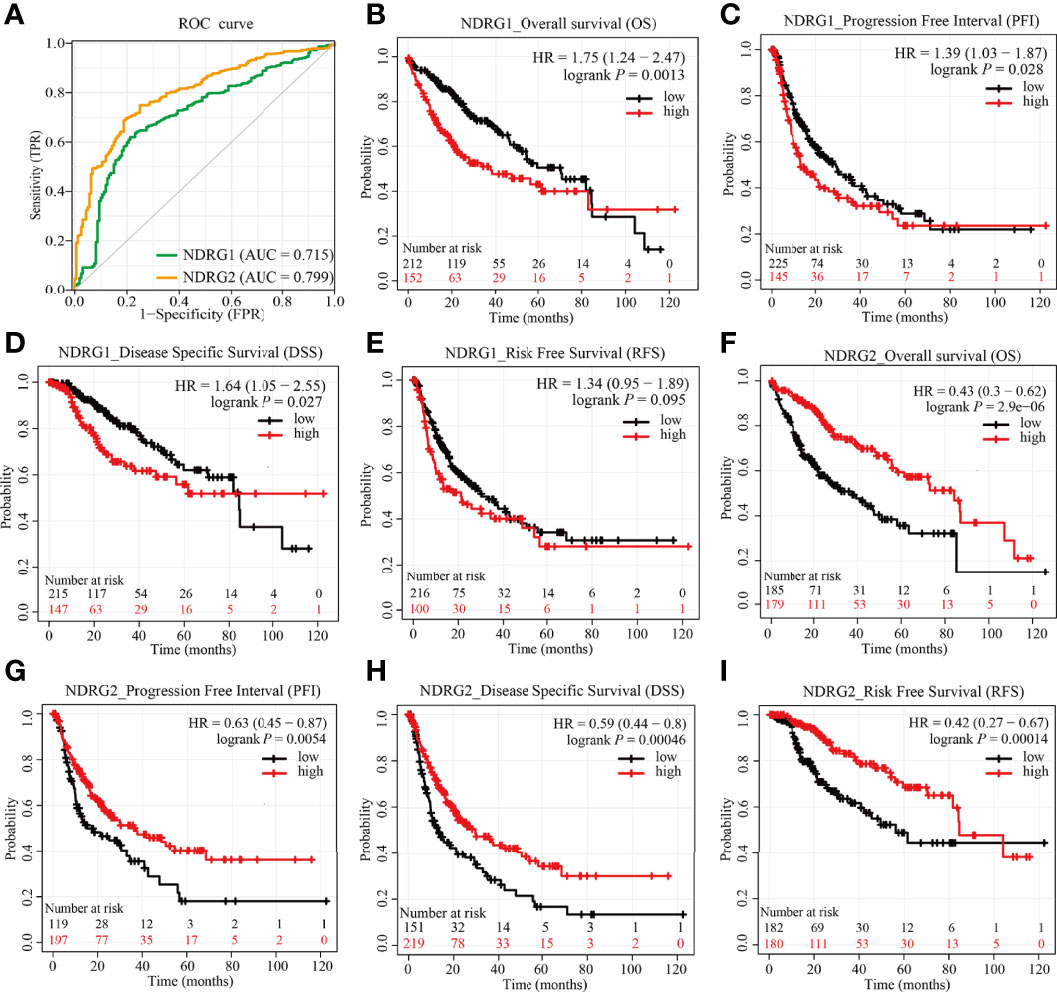
Figure 6 Predictive values of NDRG1 or NDRG2 for diagnosis and prognosis in LIHC. (A) AUROC analysis evaluating the diagnosis performance of NDRG1 or NDRG2 for LIHC between tumor and normal tissue. (B–E) Kaplan–Meier (KM) survival curves comparing NDRG1-high and -low patients with hepatocellular carcinoma. (F–I) KM survival curves of OS, PFI, DSS, and RFS between high and low expression groups of NDRG2 in LIHC.
Subsequently, we constructed a prognostic nomogram using multivariate Cox regression analysis and validated the efficiency of the nomogram by drawing a calibration curve. As shown in Figures 7A–C, tumor TNM stage and age, as well as the expression level of NDRG1 or NDRG2, were included in the nomogram to predict OS (C-index: 0.676, Figure 7A), DSS (C-index: 0.741, Figure 7B) and PFI (C-index: 0.630, Figure 7C). The calibration curves showed the desired predictive performance of these nomograms of 1-, 3-, and 5-year clinical outcomes (Figures 7D–F).
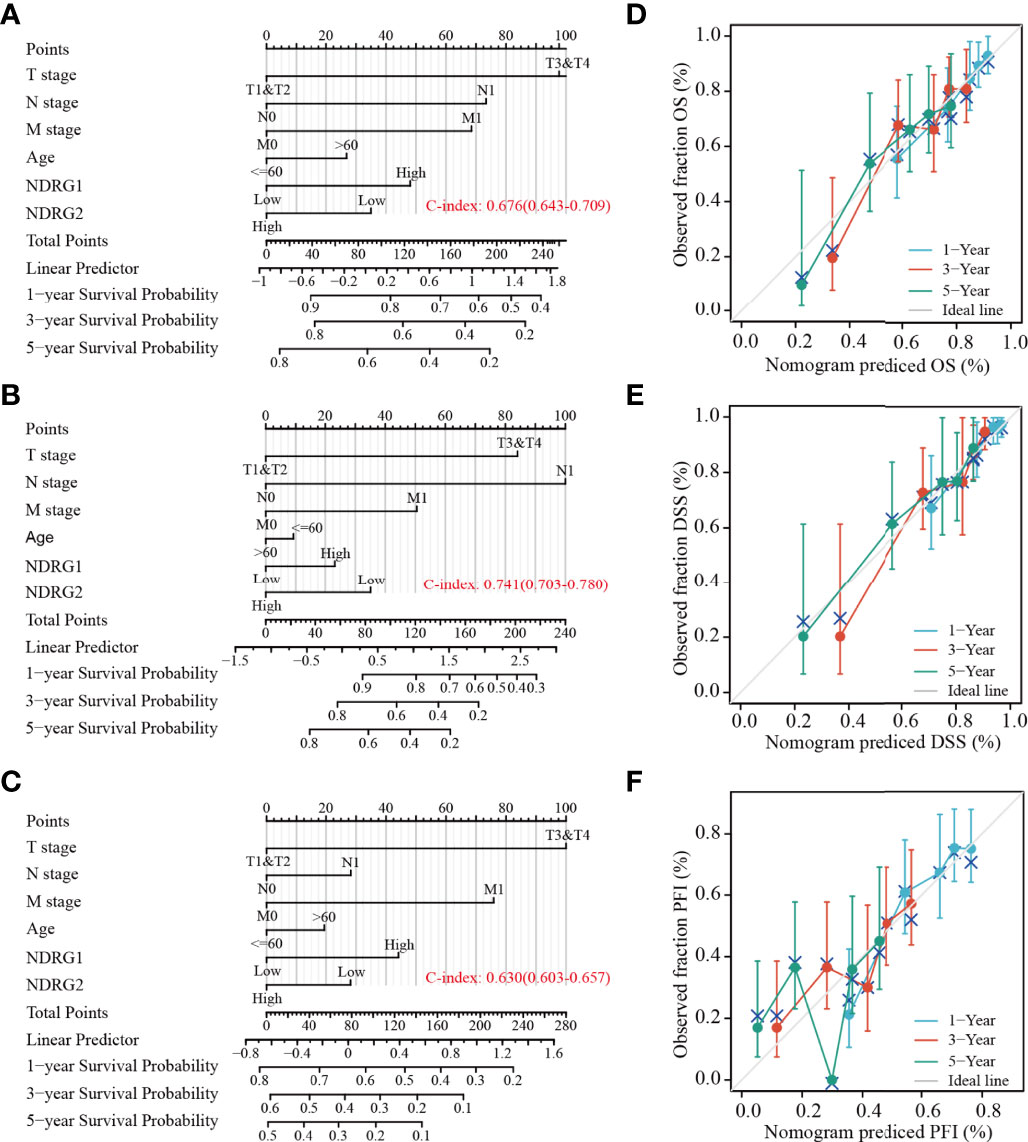
Figure 7 Construction and calibration of nomograms based on NDRG1 or NDRG2 expression. (A–C) Risk scoring models for 1-, 3-, and 5-year overall survival (OS), disease-specific survival (DSS), and progression-free interval (PFI). (D–F) Calibration diagrams validating the efficiency of nomograms for OS, DSS, and PFI.
Predictive Values of NDRG1 or NDRG2 For Clinicopathological Subgroups of LIHC
The LIHC patients were further divided into different clinicopathological subgroups according to sex, age, clinical TNM stage, and vascular invasion. Next, we also performed Cox regression analyses on each subgroup to assess the prognostic performance of NDRG1 (Table 3) or NDRG2 (Table 4) expression on OS, DSS, and PFI. As shown in Table 3, NDRG1 was a significant risk factor for OS in male patients (HR = 1.97, P = 0.003), patients aged above 60 (HR = 1.78, P = 0.014), patients at N0 stage (HR = 1.55, P = 0.048), patients at M0 stage (HR = 1.60, P = 0.034), patients with vascular invasion (HR = 2.19, P = 0.028), and patients with tumor (HR = 1.58, P = 0.048). NDRG1 was also a significant risk factor for DSS in patients with tumors (HR = 1.58, P = 0.048), and for PFI in females (HR = 2.55, P = 0.008), patients at T stage I–II (HR = 1.48, P = 0.034), and patients at N1 stage (HR = 1.44, P = 0.044).
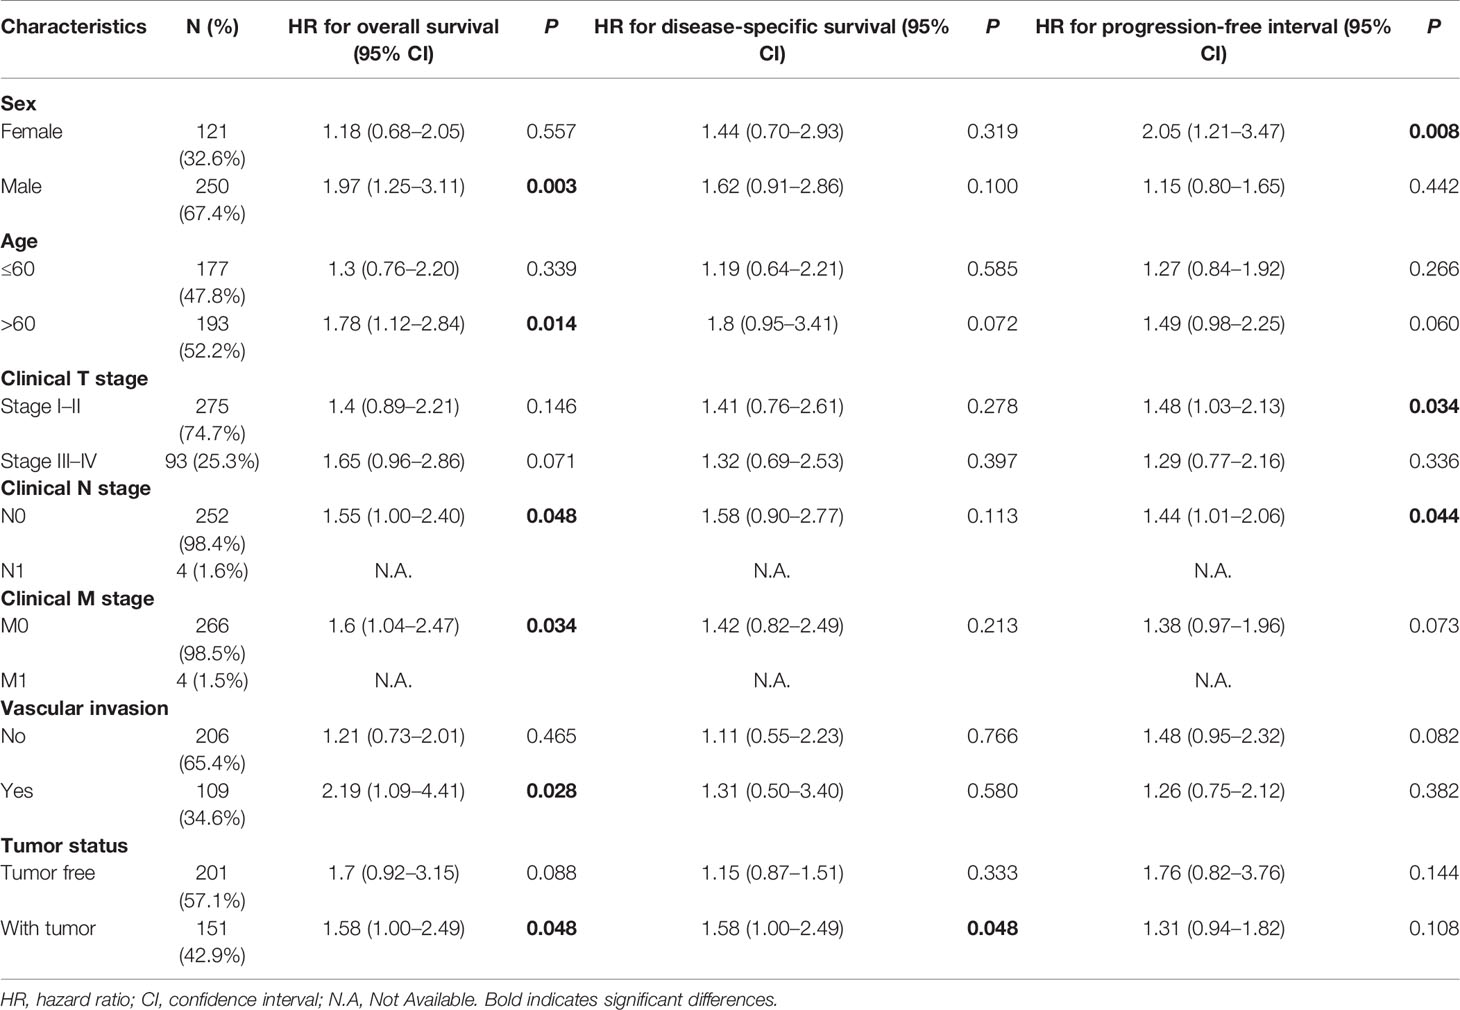
Table 3 Prognostic performance of NDRG1 on clinical prognosis in various liver cancer patient subgroups by Cox regression analysis.
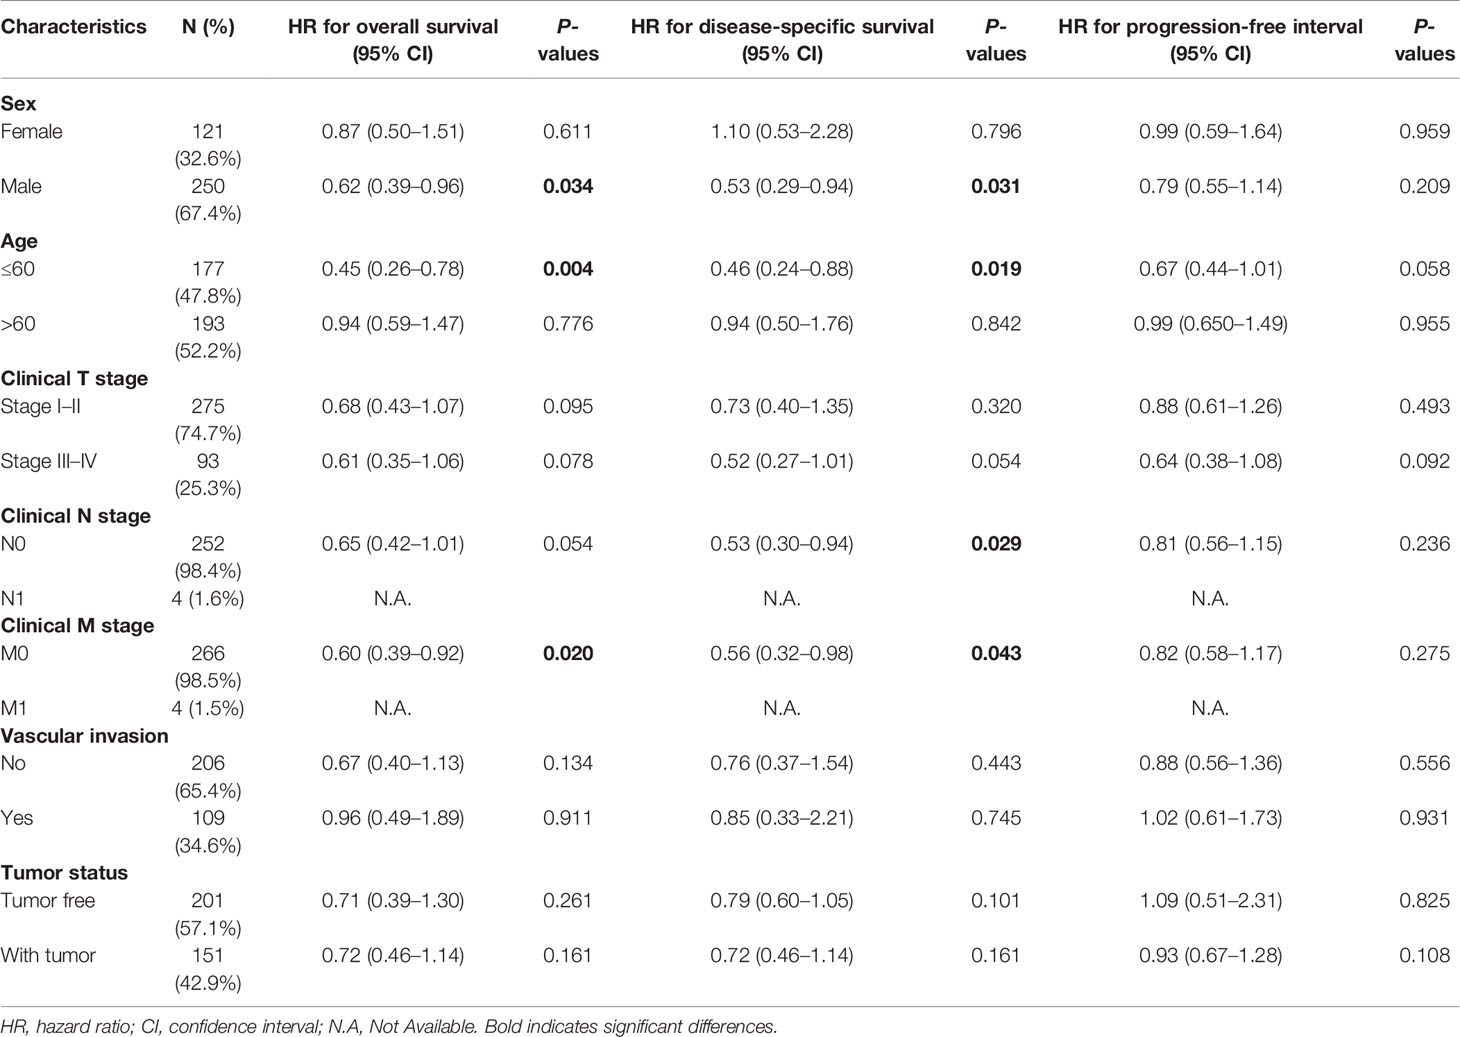
Table 4 Prognostic performance of NDRG2 on clinical prognosis in various liver cancer patient subgroups by Cox regression analysis.
As shown in Table 4, NDRG2 was a significant favorable factor for OS in male patients (HR = 0.62, P = 0.034), patients aged below 60 (HR = 0.45, P = 0.004), and patients at M0 stage (HR = 0.60, P = 0.020). Similar observations occurred for DSS in male patients (HR = 0.53, P = 0.031), patients aged below 60 (HR = 0.46, P = 0.019), patients at the N0 stage (HR = 0.53, P = 0.029), and patients at the M0 stage (HR = 0.56, P = 0.043). All the results demonstrated significantly better clinical outcomes in the low-NDRG1 or high-NDRG2 expression groups.
Discussion
To date, clinical outcomes of LIHC are far from satisfactory owing to the lack of efficient indicators and effective treatment (26). Therefore, it is crucial to find potential biomarkers for predicting clinical prognosis and guiding individualized treatment. Many cancers have been reported to have the N-myc downstream-regulated gene (NDRG1–4) family. To our knowledge, the expression levels of NDRG family members and their potential prognostic values in LIHC have not been fully explored. Hence, we focused on the expression and prognostic values of NDRG1 and NDRG2 in LIHC by analyzing datasets from the TCGA and GEO.
Here, the data analysis from UCSC XENA indicated that the NDRG1 expression had a significant increase in LIHC tumor tissues compared to normal tissues (P <0.001). The same result can be found in the GEO database (GSE14520, GSE25097, and GSE36376), the HPA database, and our experiment validation (qPCR). NDRG1 is a member of the NDRG superfamily and has been found to be involved in embryonic development (7), cellular vesicle transportation (27), and membrane protein circulation (28). NDRG1 is strongly upregulated under hypoxic conditions, and this condition is prevalent in solid tumors (29). Previous studies suggested that NDRG1 could inhibit proliferation and induce apoptosis of cancer cells by regulating Bcl-2 and Ca2+-associated proteins (30, 31) and epithelial–mesenchymal transition (EMT) (32). Another study indicated that the encoded protein of NDRG1 is necessary for p53-mediated caspase activation and apoptosis (33). However, NDRG1 protein is expressed at low levels in normal tissues while NDRG1 mRNA is ubiquitously over-expressed in various human cancers. In other words, the regulation mechanism involved in NDRG1 is somewhat complex, governed by hypoxia-inducible factor 1 alpha (HIF-1α)- and p53-dependent pathways (29), which makes the NDRG1 gene potentially an important biomarker for tumor progression.
Furthermore, Kaplan–Meier analysis showed that high NDRG1 expression correlates significantly with poor clinical outcomes in LIHC patients, which was consistent with previous research (34). Our results suggest that NDRG1 is an independent risk factor for LIHC and could act as an oncogene to accelerate LIHC progression. However, previous studies revealed that the expression of NDRG1 decreased in esophageal (16), colorectal (35), and breast cancers (10), and was correlated with poor clinical outcomes. This contradictory result may be tumor type-specific, further emphasizing that NDRG1 is involved in complex biological processes. In contrast to NDRG1, NDRG2 expression was reduced significantly in LIHC, and the downregulation of NDRG2 was associated with poor prognosis, which was consistent with previous studies (9, 14). Past research has also shown that the NDRG2 expression has a significant decrease in gastric (36), pancreatic (14), and breast cancers (15). Our results showed that NDRG2 might act as an antioncogene to suppress the LIHC progression.
Different types of mutations can greatly increase the risk of developing certain cancers. Interestingly, we found that the NDRG1 gene has a mutation frequency of up to 14% in LIHC patients, while the other NDRG family members have a mutation frequency of less than 2%. DNA methylation is a common epigenetic phenotype that exists in almost all types of human cancers (37), and its occurrence in the promoter region often results in gene silencing (38). In this study, the methylation of NDRG1 and NDRG2 was related to the clinical prognosis of LIHC patients, and patients with hypomethylated NDRG1 or hypermethylated NDRG2 had worse OS. Of note, their mRNA expression was consistent with DNA methylation levels for clinical prognosis. Therefore, the promoter methylation status and mRNA levels of NDRG1 and NDRG2 can be used as independent predictors of LIHC patients.
The tumor microenvironment (TME), composed of diverse cell populations in a complex matrix, plays a crucial role in the occurrence and progression of tumors. Tumor-associated fibroblasts in TME contribute to the progression of LIHC by secreting various growth factors and cytokines (39). Tumor-associated immune cells in TME could be divided into tumor-antagonizing and tumor-promoting immune cells (40). In this study, we observed that NDRG1 and NDRG2 expression were negatively associated with most of the immune infiltration cells in LIHC, namely, DCs, macrophages, and neutrophils. As is known to all, DCs are the most effective antigen-presenting cells, which can activate CD8+ T cells and then initiate anti-tumor immunity (41). In the following immune response, neutrophils and macrophages work together against tumors (42). Therefore, the upregulation of NDRG1 or downregulation of NDRG2 seemed to suppress tumor immunity, assist cancer cells to escape from immune elimination, and finally promote tumorigenesis. Meanwhile, NDRG1 mRNA level was positively associated with Th2 cell infiltration level, and NDRG2 expression was positively correlated with Th17 and NK cell infiltration level. These results indicate that NDRG1 and NDRG2 may play vital roles in tumor infiltration immunity. Here, we observed the correlations between immune cell infiltration and the expression of NDRG1 and NDRG2. However, there remains a gap to be filled between NDRG1 and NDRG2 in LIHC cancer and various types of immune cells.
The clinical significance of NDRG1 and NDRG2 is another concern. Our AUROC provided strong evidence that NDRG1 or NDRG2 could be biomarkers for LIHC diagnosis and prognosis. Further Cox regression analysis and nomograms further demonstrated that NDRG1 or NDRG2 had promising performance for evaluating clinical outcomes. Patients with higher NDRG1 or lower NDRG2 levels had worse OS, PFI, and DSS. In particular, the prognostic value of NDRG1 or NDRG2 was better when considering gender, age, and clinical TNM stages (Figure 7). As a result, NDRG1 or NDRG2 could be a promising biomarker for poor prognosis prediction. Our findings are consistent with previous reports that NDRG1 plays a role in promoting tumorigenesis in liver, kidney, and esophageal cancers (43). In contrast, evidence has elucidated that NDRG1 is associated with anti-oncogenic and anti-metastatic effects in breast, prostate, colorectum, and pancreatic cancers (44). The inconsistent results might be that NDRG1 is potentially involved in many biological processes and the bi-directional crosstalk and may not play one single role. The pleiotropy of NDRG1 may reflect the heterogeneity of signal transduction in different tumor cell-types. Nowadays, the multi-omics approach (45) and the emerging single-cell studies (46) provide a new perspective on identifying biomarkers for clinical diagnosis and tumor typing.
In short, the mRNA expression and DNA methylation of NDRG superfamily members (NDRG1 and NDRG2) show the potential for LIHC diagnosis and prognosis via integrative analysis from multiple cohorts. Considering the multiple mechanisms of the NDRG family, more experiments and a larger sample size will be needed to demonstrate and validate our bioinformatics results for future clinical application.
Data Availability Statement
The original contributions presented in the study are included in the article/supplementary material. Further inquiries can be directed to the corresponding author.
Ethics Statement
The studies involving human participants were reviewed and approved by The hospital ethics committee, Zhongnan Hospital of Wuhan University. The patients/participants provided their written informed consent to participate in this study. Written informed consent was obtained from the individual(s) for the publication of any potentially identifiable images or data included in this article.
Author Contributions
S-ML and SX conceived and designed the experiments. SX, YZho, YY, and RG analyzed data and drafted the original manuscript. YZha and RG performed the experiments. S-ML, CL and QL critically revised the manuscript. All authors listed have made a substantial, direct, and intellectual contribution to the work and approved it for publication.
Funding
This work was supported by the National Natural Science Foundation of China (81772276) and the Hubei Provincial Natural Science Fund for Creative Research Groups (2019CFA018).
Conflict of Interest
The authors declare that the research was conducted in the absence of any commercial or financial relationships that could be construed as a potential conflict of interest.
Publisher’s Note
All claims expressed in this article are solely those of the authors and do not necessarily represent those of their affiliated organizations, or those of the publisher, the editors and the reviewers. Any product that may be evaluated in this article, or claim that may be made by its manufacturer, is not guaranteed or endorsed by the publisher.
References
1. Bray F, Ferlay J, Soerjomataram I, Siegel RL, Torre LA, Jemal A. Global Cancer Statistics 2018: GLOBOCAN Estimates of Incidence and Mortality Worldwide for 36 Cancers in 185 Countries. CA Cancer J Clin (2018) 68(6):394–424. doi: 10.3322/caac.21492
2. Yu LX, Schwabe RF. The Gut Microbiome and Liver Cancer: Mechanisms and Clinical Translation. Nat Rev Gastroenterol Hepatol (2017) 14(9):527–39. doi: 10.1038/nrgastro.2017.72
3. Njei B, Rotman Y, Ditah I, Lim JK. Emerging Trends in Hepatocellular Carcinoma Incidence and Mortality. Hepatology (2015) 61(1):191–9. doi: 10.1002/hep.27388
4. Mokdad AA, Hester CA, Singal AG, Yopp AC. Management of Hepatocellular in the United States. Chin Clin Oncol (2017) 6(2):21. doi: 10.21037/cco.2017.04.04
5. Boyault S, Rickman DS, de Reynies A, Balabaud C, Rebouissou S, Jeannot E, et al. Transcriptome Classification of HCC is Related to Gene Alterations and to New Therapeutic Targets. Hepatology (2007) 45(1):42–52. doi: 10.1002/hep.21467
6. El-Serag HB. Epidemiology of Viral Hepatitis and Hepatocellular Carcinoma. Gastroenterology (2012) 142(6):1264–73.e1. doi: 10.1053/j.gastro.2011.12.061
7. Melotte V, Qu X, Ongenaert M, van Criekinge W, de Bruine AP, Baldwin HS, et al. The N-Myc Downstream Regulated Gene (NDRG) Family: Diverse Functions, Multiple Applications. FASEB J (2010) 24(11):4153–66. doi: 10.1096/fj.09-151464
8. Sun J, Zhang D, Bae DH, Sahni S, Jansson P, Zheng Y, et al. Metastasis Suppressor, NDRG1, Mediates its Activity Through Signaling Pathways and Molecular Motors. Carcinogenesis (2013) 34(9):1943–54. doi: 10.1093/carcin/bgt163
9. Lee DC, Kang YK, Kim WH, Jang YJ, Kim DJ, Park IY, et al. Functional and Clinical Evidence for NDRG2 as a Candidate Suppressor of Liver Cancer Metastasis. Cancer Res (2008) 68(11):4210–20. doi: 10.1158/0008-5472
10. Kovacevic Z, Richardson DR. The Metastasis Suppressor, Ndrg-1: A New Ally in the Fight Against Cancer. Carcinogenesis (2006) 27(12):2355–66. doi: 10.1093/carcin/bgl146
11. Choi SC, Kim KD, Kim JT, Kim JW, Lee HG, Kim JM, et al. Expression of Human NDRG2 by Myeloid Dendritic Cells Inhibits Down-Regulation of Activated Leukocyte Cell Adhesion Molecule (ALCAM) and Contributes to Maintenance of T Cell Stimulatory Activity. J Leukoc Biol (2008) 83(1):89–98. doi: 10.1189/jlb.0507300
12. Park KC, Lee DC, Yeom YI. NDRG3-Mediated Lactate Signaling in Hypoxia. BMB Rep (2015) 48(6):301–2. doi: 10.5483/bmbrep.2015.48.6.080
13. Qu X, Jia H, Garrity DM, Tompkins K, Batts L, Appel B, et al. Ndrg4 is Required for Normal Myocyte Proliferation During Early Cardiac Development in Zebrafish. Dev Biol (2008) 317(2):486–96. doi: 10.1016/j.ydbio.2008.02.044
14. Hu XL, Liu XP, Lin SX, Deng YC, Liu N, Li X, et al. NDRG2 Expression and Mutation in Human Liver and Pancreatic Cancers. World J Gastroenterol (2004) 10(23):3518–21. doi: 10.3748/wjg.v10.i23.3518
15. Lorentzen A, Lewinsky RH, Bornholdt J, Vogel LK, Mitchelmore C. Expression Profile of the N-Myc Downstream Regulated Gene 2 (NDRG2) in Human Cancers With Focus on Breast Cancer. BMC Cancer (2011) 11:14. doi: 10.1186/1471-2407-11-14
16. Ando T, Ishiguro H, Kimura M, Mitsui A, Kurehara H, Sugito N, et al. Decreased Expression of NDRG1 is Correlated With Tumor Progression and Poor Prognosis in Patients With Esophageal Squamous Cell Carcinoma. Dis Esophagus (2006) 19(6):454–8. doi: 10.1111/j.1442-2050.2006.00618.x
17. Goldman MJ, Craft B, Hastie M, Repecka K, McDade F, Kamath A, et al. Visualizing and Interpreting Cancer Genomics Data via the Xena Platform. Nat Biotechnol (2020) 38(6):675–8. doi: 10.1038/s41587-020-0546-8
18. Vivian J, Rao AA, Nothaft FA, Ketchum C, Armstrong J, Novak A, et al. Toil Enables Reproducible, Open Source, Big Biomedical Data Analyses. Nat Biotechnol (2017) 35(4):314–6. doi: 10.1038/nbt.3772
19. Love MI, Huber W, Anders S. Moderated Estimation of Fold Change and Dispersion for RNA-Seq Data With Deseq2. Genome Biol (2014) 15(12):550. doi: 10.1186/s13059-014-0550-8
20. Yu G, Wang LG, Han Y, He QY. Clusterprofiler: An R Package for Comparing Biological Themes Among Gene Clusters. OMICS (2012) 16(5):284–7. doi: 10.1089/omi.2011.0118
21. Subramanian A, Tamayo P, Mootha VK, Mukherjee S, Ebert BL, Gillette MA, et al. Gene Set Enrichment Analysis: A Knowledge-Based Approach for Interpreting Genome-Wide Expression Profiles. Proc Natl Acad Sci U S A (2005) 102(43):15545–50. doi: 10.1073/pnas.0506580102
22. Hanzelmann S, Castelo R, Guinney J. GSVA: Gene Set Variation Analysis for Microarray and RNA-Seq Data. BMC Bioinf (2013) 14:7. doi: 10.1186/1471-2105-14-7
23. Bindea G, Mlecnik B, Tosolini M, Kirilovsky A, Waldner M, Obenauf AC, et al. Spatiotemporal Dynamics of Intratumoral Immune Cells Reveal the Immune Landscape in Human Cancer. Immunity (2013) 39(4):782–95. doi: 10.1016/j.immuni.2013.10.003
24. Gao J, Aksoy BA, Dogrusoz U, Dresdner G, Gross B, Sumer SO, et al. Integrative Analysis of Complex Cancer Genomics and Clinical Profiles Using the Cbioportal. Sci Signal (2013) 6(269):l1. doi: 10.1126/scisignal.2004088
25. Modhukur V, Iljasenko T, Metsalu T, Lokk K, Laisk-Podar T, Vilo J. MethSurv: A Web Tool to Perform Multivariable Survival Analysis Using DNA Methylation Data. Epigenomics (2018) 10(3):277–88. doi: 10.2217/epi-2017-0118
26. Yang JD, Hainaut P, Gores GJ, Amadou A, Plymoth A, Roberts LR. A Global View of Hepatocellular Carcinoma: Trends, Risk, Prevention and Management. Nat Rev Gastroenterol Hepatol (2019) 16(10):589–604. doi: 10.1038/s41575-019-0186-y
27. Askautrud HA, Gjernes E, Gunnes G, Sletten M, Ross DT, Borresen-Dale AL, et al. Global Gene Expression Analysis Reveals a Link Between NDRG1 and Vesicle Transport. PLoS One (2014) 9(1):e87268. doi: 10.1371/journal.pone.0087268
28. Pietiainen V, Vassilev B, Blom T, Wang W, Nelson J, Bittman R, et al. NDRG1 Functions in LDL Receptor Trafficking by Regulating Endosomal Recycling and Degradation. J Cell Sci (2013) 126(Pt 17):3961–71. doi: 10.1242/jcs.128132
29. Ellen TP, Ke Q, Zhang P, Costa M. NDRG1, a Growth and Cancer Related Gene: Regulation of Gene Expression and Function in Normal and Disease States. Carcinogenesis (2008) 29(1):2–8. doi: 10.1093/carcin/bgm200
30. Yang X, Zhu F, Yu C, Lu J, Zhang L, Lv Y, et al. N-Myc Downstream-Regulated Gene 1 Promotes Oxaliplatin-Triggered Apoptosis in Colorectal Cancer Cells via Enhancing the Ubiquitination of Bcl-2. Oncotarget (2017) 8(29):47709–24. doi: 10.18632/oncotarget.17711
31. Kawahara A, Akiba J, Hattori S, Yamaguchi T, Abe H, Taira T, et al. Nuclear Expression of N-Myc Downstream Regulated Gene 1/Ca(2+)-Associated Protein 43 is Closely Correlated With Tumor Angiogenesis and Poor Survival in Patients With Gastric Cancer. Exp Ther Med (2011) 2(3):471–9. doi: 10.3892/etm.2011.222
32. Chen Z, Zhang D, Yue F, Zheng M, Kovacevic Z, Richardson DR. The Iron Chelators Dp44mT and DFO Inhibit TGF-Beta-Induced Epithelial-Mesenchymal Transition via Up-Regulation of N-Myc Downstream-Regulated Gene 1 (NDRG1). J Biol Chem (2012) 287(21):17016–28. doi: 10.1074/jbc.M112.350470
33. Stein S, Thomas EK, Herzog B, Westfall MD, Rocheleau JV, Jackson RS 2nd, et al. NDRG1 is Necessary for P53-Dependent Apoptosis. J Biol Chem (2004) 279(47):48930–40. doi: 10.1074/jbc.M400386200
34. Cheng J, Xie HY, Xu X, Wu J, Wei X, Su R, et al. NDRG1 as a Biomarker for Metastasis, Recurrence and of Poor Prognosis in Hepatocellular Carcinoma. Cancer Lett (2011) 310(1):35–45. doi: 10.1016/j.canlet.2011.06.001
35. Mao Z, Sun J, Feng B, Ma J, Zang L, Dong F, et al. The Metastasis Suppressor, N-Myc Downregulated Gene 1 (NDRG1), is a Prognostic Biomarker for Human Colorectal Cancer. PLoS One (2013) 8(7):e68206. doi: 10.1371/journal.pone.0068206
36. Choi SC, Yoon SR, Park YP, Song EY, Kim JW, Kim WH, et al. Expression of NDRG2 is Related to Tumor Progression and Survival of Gastric Cancer Patients Through Fas-Mediated Cell Death. Exp Mol Med (2007) 39(6):705–14. doi: 10.1038/emm.2007.77
37. Klutstein M, Nejman D, Greenfield R, Cedar H. DNA Methylation in Cancer and Aging. Cancer Res (2016) 76(12):3446–50. doi: 10.1158/0008-5472.CAN-15-3278
38. Yamashita K, Hosoda K, Nishizawa N, Katoh H, Watanabe M. Epigenetic Biomarkers of Promoter DNA Methylation in the New Era of Cancer Treatment. Cancer Sci (2018) 109(12):3695–706. doi: 10.1111/cas.13812
39. Zhang J, Gu C, Song Q, Zhu M, Xu Y, Xiao M, et al. Identifying Cancer-Associated Fibroblasts as Emerging Targets for Hepatocellular Carcinoma. Cell Biosci (2020) 10(1):127. doi: 10.1186/s13578-020-00488-y
40. Lei X, Lei Y, Li JK, Du WX, Li RG, Yang J, et al. Immune Cells Within the Tumor Microenvironment: Biological Functions and Roles in Cancer Immunotherapy. Cancer Lett (2020) 470:126–33. doi: 10.1016/j.canlet.2019.11.009
41. Fu C, Jiang A. Dendritic Cells and CD8 T Cell Immunity in Tumor Microenvironment. Front Immunol (2018) 9:3059. doi: 10.3389/fimmu.2018.03059
42. Qu X, Tang Y, Hua S. Immunological Approaches Towards Cancer and Inflammation: A Cross Talk. Front Immunol (2018) 9:563. doi: 10.3389/fimmu.2018.00563
43. Fang BA, Kovacevic Z, Park KC, Kalinowski DS, Jansson PJ, Lane DJ, et al. Molecular Functions of the Iron-Regulated Metastasis Suppressor, NDRG1, and its Potential as a Molecular Target for Cancer Therapy. Biochim Biophys Acta (2014) 1845(1):1–19. doi: 10.1016/j.bbcan.2013.11.002
44. Bae DH, Jansson PJ, Huang ML, Kovacevic Z, Kalinowski D, Lee CS, et al. The Role of NDRG1 in the Pathology and Potential Treatment of Human Cancers. J Clin Pathol (2013) 66(11):911–7. doi: 10.1136/jclinpath-2013-201692
45. Su J, Song Q, Qasem S, O'Neill S, Lee J, Furdui CM, et al. Multi-Omics Analysis of Brain Metastasis Outcomes Following Craniotomy. Front Oncol (2020) 10:615472. doi: 10.3389/fonc.2020.615472
Keywords: LIHC, prognosis, NDRG1, NDRG2, hepatocellular carcinoma, methylation, Kaplan–Meier
Citation: Xu S, Gao R, Zhou Y, Yang Y, Zhang Y, Li Q, Luo C and Liu S-M (2022) Clinical Diagnostic and Prognostic Potential of NDRG1 and NDRG2 in Hepatocellular Carcinoma Patients. Front. Oncol. 12:862216. doi: 10.3389/fonc.2022.862216
Received: 25 January 2022; Accepted: 11 May 2022;
Published: 20 June 2022.
Edited by:
Ondrej Slaby, Central European Institute of Technology (CEITEC), CzechiaReviewed by:
Qianqian Song, Wake Forest School of Medicine, United StatesJungshan Chang, Taipei Medical University, Taiwan
Copyright © 2022 Xu, Gao, Zhou, Yang, Zhang, Li, Luo and Liu. This is an open-access article distributed under the terms of the Creative Commons Attribution License (CC BY). The use, distribution or reproduction in other forums is permitted, provided the original author(s) and the copyright owner(s) are credited and that the original publication in this journal is cited, in accordance with accepted academic practice. No use, distribution or reproduction is permitted which does not comply with these terms.
*Correspondence: Song-Mei Liu, smliu@whu.edu.cn