 J. E. Zhang1
 Kathrin Klein2,3
 Andrea L. Jorgensen4
 Ben Francis4
 Ana Alfirevic1Stephane Bourgeois5Panagiotis Deloukas5,6,7
 Ulrich M. Zanger2,3
 Munir Pirmohamed1*
- 1Wolfson Centre for Personalized Medicine, Department of Molecular and Clinical Pharmacology, The University of Liverpool, Liverpool, United Kingdom
- 2Dr. Margarete Fischer-Bosch Institute of Clinical Pharmacology, Stuttgart, Germany
- 3Department of Clinical Pharmacology, University of Tuebingen, Tuebingen, Germany
- 4Department of Biostatistics, The University of Liverpool, Liverpool, United Kingdom
- 5William Harvey Research Institute, Barts and the London School of Medicine and Dentistry, Queen Mary University of London, London, United Kingdom
- 6Wellcome Trust Sanger Institute, Cambridge, United Kingdom
- 7Princess Al-Jawhara Al-Brahim Centre of Excellence in Research of Hereditary Disorders, King Abdulaziz University, Jeddah, Saudi Arabia
Genetic polymorphisms in the gene encoding cytochrome P450 (CYP) 4F2, a vitamin K oxidase, affect stable warfarin dose requirements and time to therapeutic INR. CYP4F2 is part of the CYP4F gene cluster, which is highly polymorphic and exhibits a high degree of linkage disequilibrium, making it difficult to define causal variants. Our objective was to examine the effect of genetic variability in the CYP4F gene cluster on expression of the individual CYP4F genes and warfarin response. mRNA levels of the CYP4F gene cluster were quantified in human liver samples (n = 149) obtained from a well-characterized liver bank and fine mapping of the CYP4F gene cluster encompassing CYP4F2, CYP4F11, and CYP4F12 was performed. Genome-wide association study (GWAS) data from a prospective cohort of warfarin-treated patients (n = 711) was also analyzed for genetic variations across the CYP4F gene cluster. In addition, SNP-gene expression in human liver tissues and interactions between CYP4F genes were explored in silico using publicly available data repositories. We found that SNPs in CYP4F2, CYP4F11, and CYP4F12 were associated with mRNA expression in the CYP4F gene cluster. In particular, CYP4F2 rs2108622 was associated with increased CYP4F2 expression while CYP4F11 rs1060467 was associated with decreased CYP4F2 expression. Interestingly, these CYP4F2 and CYP4F11 SNPs showed similar effects with warfarin stable dose where CYP4F11 rs1060467 was associated with a reduction in daily warfarin dose requirement (∼1 mg/day, Pc = 0.017), an effect opposite to that previously reported with CYP4F2 (rs2108622). However, inclusion of either or both of these SNPs in a pharmacogenetic algorithm consisting of age, body mass index (BMI), gender, baseline clotting factor II level, CYP2C9∗2 rs1799853, CYP2C9∗3 rs1057910, and VKORC1 rs9923231 improved warfarin dose variability only by 0.5–0.7% with an improvement in dose prediction accuracy of ∼1–2%. Although there is complex regulation across the CYP4F gene cluster, the opposing effects between the two SNPs in the CYP4F gene cluster appear to compensate for each other and their effect on warfarin dose requirement is unlikely to be clinically significant.
Introduction
The CYP4F gene subfamily comprises six members, namely CYP4F2 (Kikuta et al., 1993), CYP4F3 (CYP4F3A and CYP4F3B) (Kikuta et al., 1998), CYP4F8 (Bylund et al., 2000), CYP4F11 (Cui et al., 2000), CYP4F12 (Bylund et al., 2001; Hashizume et al., 2001), and CYP4F22 (Lefevre et al., 2006). Structurally, these six CYP4F genes are largely similar, with more than 65% amino acid sequence homology. To date, studies have focused on CYP4F2, CYP4F3, CYP4F8, CYP4F11, and CYP4F12 while little is known about the expression and function of CYP4F22. The splice sites of CYP4F2, CYP4F3, CYP4F8, CYP4F11, and CYP4F12 are almost identical, suggesting that this cluster of five genes may have evolved by gene duplication (Bylund et al., 1999, 2001; Kikuta et al., 1999; Cui et al., 2000).
CYP4F2, CYP4F3, CYP4F8, CYP4F11, and CYP4F12 reside together on chromosome 19p13.1-2, spanning over 320 kb (Supplementary Figure 1). These five members of the CYP4F subfamily are all expressed in the liver and are known for their roles in the metabolism of both endogenous and exogenous compounds. They are involved in the catabolism of substrates such as arachidonic acid and its oxygenated derivatives (eicosanoids) such as leukotrienes, prostaglandins (PGs), lipoxins, and hydroxyeicosatetraenoic acids (HETEs) (Kikuta et al., 1999; Bylund et al., 2000, 2001; Hashizume et al., 2001, 2002; Kalsotra et al., 2004), and they also catalyze the metabolism of many drugs. For example, CYP4F2 has also been implicated in the ω-hydroxylation of the tocopherol phytyl side chain in the first step of vitamin E inactivation (Sontag and Parker, 2002). In addition, CYP4F2 and CYP4F3B have been shown to catalyze the initial O-demethylation of the anti-parasitic prodrug pafuramidine by human liver and intestinal microsomes (Wang et al., 2006, 2007). CYP4F2 has also been reported to be a vitamin K oxidase and plays a role in warfarin response (McDonald et al., 2009). CYP4F11 is known to be active in the metabolism of several drugs including erythromycin, benzphetamine, ethylmorphine, chlorpromazine, and imipramine (Kalsotra et al., 2004). More recently, a study has reported that CYP4F11 functions as a vitamin K ω-hydroxylase (Edson et al., 2013). CYP4F12 has been reported to be involved in the conversion of the antihistaminic prodrug ebastine to the active drug carebastine by hydroxylation (Hashizume et al., 2001, 2002).
Warfarin is one of the most widely used oral anticoagulants worldwide with proven efficacy in conditions characterized by thromboembolism including atrial fibrillation, deep vein thrombosis, pulmonary embolism, or heart valve prostheses. Despite its efficacy, warfarin is often among the top three drugs that lead to hospitalization from adverse drug reactions (Budnitz et al., 2007; Wysowski et al., 2007), owing to its narrow therapeutic window and large inter-individual variability in dose response. Combinations of both non-genetic and genetic factors influence the inter-individual variability in warfarin therapeutic dose requirements. Genetic factors, in particular, single nucleotide polymorphisms (SNPs) in two genes responsible for warfarin pharmacokinetics and pharmacodynamics – cytochrome P450 2C9 (CYP2C9) and vitamin K epoxide reductase complex 1 (VKORC1) – have repeatedly been found to be significantly associated with warfarin responsiveness, explaining approximately 15 and 25% of dose variability (Aithal et al., 1999; Yuan et al., 2005; Gage et al., 2008; Wadelius et al., 2009; Schwanhausser et al., 2011), respectively. Candidate gene(s) and GWAS studies have shown that the CYP4F2 functional variant, rs2108622, accounts for a small proportion of the variability in warfarin dose requirement (1–7%) (Caldwell et al., 2008; Borgiani et al., 2009; Takeuchi et al., 2009; Pautas et al., 2010). However, some studies have not found an association between rs2108622 and warfarin stable dose (Zhang et al., 2009; Perini et al., 2010). A functional study utilizing human liver tissues did not find any association between rs2108622 and CYP4F2 mRNA but observed a significant association between the rs2108622 variant TT genotype and lower microsomal CYP4F2 protein concentration and reduced vitamin K1 oxidation, consistent with its function as a vitamin K1 oxidase in catalyzing the ω-hydroxylation of vitamin K1 phytyl side chain (McDonald et al., 2009).
We have previously performed fine mapping of the CYP4F2 region to determine the influence of CYP4F2 SNPs and haplotypes on various warfarin response outcomes (Zhang et al., 2009). We found an association between rs2189784, a SNP in strong linkage disequilibrium (LD) with rs2108622, with time to achieve therapeutic International Normalized Ratio (INR), but not with stable dose. Given the high degree of homology and LD across the CYP4F gene cluster (Supplementary Figure 1), we have undertaken a genotype–phenotype assessment utilizing a well-characterized liver bank and a prospective patient cohort who were followed up for 6 months from the time of intake of warfarin (as summarized in Supplementary Figure 2). In silico analysis was also performed to investigate additional SNP-gene associations and the interactions between the CYP4F genes.
Materials and Methods
Study Populations
Written informed consent in accordance with the Declaration of Helsinki was obtained from all patients recruited to the following cohorts.
Liver Surgery Cohort
Blood and liver tissue samples were collected from 149 Caucasian patients undergoing liver surgery at the Department of General, Visceral, and Transplantation Surgery, Campus Virchow, University Medical Centre Charité, Humboldt University, Berlin, Germany, as described previously (Gomes et al., 2009). Normal liver tissues were obtained from adjacent regions of surgically removed liver tumors or metastases or hepatic tissue respected for other reasons. All liver tissue samples were certified to be free of malignant cells by pathological examination. None of these samples were from patients with hepatitis, or cirrhosis, or from those who had chronic alcohol abuse. Clinical patient documentation for all samples included age, gender, medical diagnosis, pre-surgical medication, alcohol use, and smoking. The study was approved by the Research Ethics Committees of the Medical Faculties of the Charité, Humboldt University, Berlin, and of the University of Tuebingen, Tuebingen, Germany.
Warfarin-Treated Patient Cohort
Thousand patients starting warfarin therapy were recruited prospectively at two hospitals in Liverpool, United Kingdom (Royal Liverpool and Broadgreen University Hospitals Trust and University Hospital Aintree). The main indications for warfarin therapy were treatment of venous thromboembolism and prophylaxis against systemic emboli in patients with atrial fibrillation. The study was approved by the Birmingham South Research Ethics Committee, United Kingdom.
Determination of CYP4F2, CYP4F8, CYP4F11, and CYP4F12 mRNA Expression Levels in Human Liver
RNA was extracted from the human liver tissue (n = 149) using TRIzol® reagent (Invitrogen, Paisley, United Kingdom) with subsequent RNA clean-up using QIAGEN RNeasy-Mini Kit with on-column DNase treatment. All RNA preparations were of high quality with RNA integrity number (RIN) >7, as measured on the Agilent Bioanalyzer (Nano-Lab Chip Kit, Agilent Technologies, Waldbronn, Germany). Levels of gene expression of over 48,000 mRNA transcripts were assessed by the Human-WG6v2 Expression BeadChip (Illumina, Eindhoven, The Netherlands) as previously described (Schroder et al., 2013). Pre-processing and quality control of the expression data was conducted using the Illumina BeadStudio, version 3.0 (Illumina, San Diego, CA, United States) and the various steps involved are detailed in Schroder et al. (2013). Probe signal intensities corresponding to 15,439 unique genes remain after all pre-processing steps and the data set was log2 transformed. Probe sequences for CYP4F2, CYP4F8, CYP4F11, and CYP4F12 were confirmed to be specific and expression data were extracted. CYP4F3 and CYP4F22 were not further analyzed due to ambiguous probe or gene annotation.
Liver Surgery Cohort: CYP4F2, CYP4F11, CYP4F12 SNP Selection, Genotyping, and Haplotype Analysis
Genomic DNA from the liver surgery patients (n = 149) was extracted from whole blood using the QIAamp DNA Mini Kit (QIAGEN GmbH, Hilden, Germany) according to the manufacturer’s instructions.
Eighty genetic polymorphisms in the CYP4F2 gene were selected as previously reported (Zhang et al., 2009). SNPs encompassing CYP4F11 and CYP4F12 across the chromosomal 19p13.11 region were chosen on the basis of their functionality, coverage in the CEU population (Utah residents with ancestry from northern and western Europe) available on HapMap data release 27, NCBI build 36 assembly, minor allele frequency (MAF > 1%) and block-tagging ability (r2 ≥ 0.8). A total of 130 SNPs in the CYP4F11 and CYP4F12 region were successfully designed and subdivided into six multiplex assays using Sequenom’s online Human GenoTyping Tools1. Primer sequences are available on request. All SNPs were genotyped using the Sequenom MassARRAY iPLEXTM platform (Sequenom, Hamburg, Germany) in accordance with the manufacturer’s instructions. To ensure data quality, 10% DNA replicates and 8 negative controls (water) were included per 384-well plate during genotyping. Markers which deviated from Hardy–Weinberg equilibrium (HWE, P < 0.001) (n = 10), those with less than 90% call rate (n = 27), and those which were monomorphic (n = 26), were excluded from downstream analysis (see Supplementary Table 1).
The pattern of pairwise LD between the SNPs was visualized using the program HaploView version 4.2 (Barrett et al., 2005). Haplotype blocks were defined using the default algorithm by Gabriel et al. (2002) in HaploView. The most probable combinations of haplotype-pairs at each block were inferred using the program PHASE version 2.1.1 (Stephens et al., 2001; Stephens and Scheet, 2005). Any individuals with a haplotype-pair probability of <90% (n = 11) for at least one haplotype block were excluded from tests of association. Within a haplotype block, haplotypes with frequencies <1% were grouped together as a single covariate for analysis.
Warfarin-Treated Patient Cohort: Genome-Wide Genotyping and Imputation
Genomic DNA was extracted from whole blood using the standard phenol–chloroform method. Genome-wide genotyping was performed using the Illumina Human610-Quad BeadChip (Illumina, San Diego, CA, United States) at the Wellcome Trust Sanger Institute, United Kingdom. Of the 1000 patients recruited, genome-wide genotype data were available for 752 individuals as previously described (Bourgeois et al., 2016). All quality control measures were performed using PLINK (Purcell et al., 2007). All SNPs with a genotyping success rate <95%, HWE threshold of P < 0.0001 and those with MAF <1% were excluded from the dataset. Cryptic relatedness was assessed between individuals and one individual from each pair with an estimated identity by descent (IBD) >0.1875 (i.e., halfway between the expected IBD for third- and second-degree relatives) was removed. Subjects with genotyping success rate <95% were also removed. Principle component analysis was performed to assess genetic markers for ethnicity. Only individuals with genetically matching ethnicity were included into the association analysis (n = 711).
For the purpose of this study, genotype data for SNPs across CYP4F2, CYP4F11, and CYP4F12 were extracted (n = 80) for downstream analyses. After pre-phasing via SHAPEIT (Delaneau et al., 2012), imputation of genotypes at additional SNPs throughout the region encompassing CYP4F2, CYP4F11, and CYP4F12 (chr19:15–17 Mb, B36) was carried out using IMPUTE2 (Howie et al., 2009) with the reference genotype data from the European 1000 Genomes Phase I data set (release date June 2014). Imputed variants with an information score <0.8, MAF <1%, HWE <0.0001 and genotyping success rate <95% were excluded using QCTool, leaving a total of 1400 SNPs harboring the CYP4F12-CYP4F2-CYP4F11 genomic region.
Statistical Analysis
Statistical analyses were conducted with the software package SPSS, version 18. For each univariate test of association, two tests were performed, one making no assumption on the mode of inheritance while the other assumed an additive mode of inheritance. The minimum P-value is referred to in each analysis.
All P-values from the genotype–phenotype association tests undertaken in the functional and clinical studies were independently adjusted for multiple testing using false discovery rate (FDR) (Benjamini et al., 2001) in the genetics package of R, version 3.1.22. FDR-corrected P-values are denoted as Pc-values and values <0.05 were regarded as statistically significant.
The proportion of variability explained by the genetic covariates was calculated using Nagelkerke’s R2 statistic (Nagelkerke, 1991).
Liver mRNA Analysis
Relationships between each of the phenotypic parameters evaluated were examined by Spearman correlation analysis. The mRNA levels of the four CYP4F genes were not normally distributed. To enable the use of parametric statistical tests, the expression data were natural log transformed. To evaluate the association of each SNP or haplotype with mRNA expression levels, one-way analysis of variance (ANOVA) and univariate linear regression were conducted.
Warfarin Outcome Analysis
Warfarin stable dose was defined as an unchanged daily dose at three or more consecutive clinic visits where INR measurements were within the individual’s target range (Jorgensen et al., 2009; Zhang et al., 2009). As the distribution of stable dose was skewed, the outcome was log transformed to achieve normal distribution. To test for the association of SNPs with warfarin stable dose, ANOVA and univariate linear regression were employed. Conditional analysis was conducted by including the SNP of interest into the linear regression model as a covariate. Dosing algorithms were built by incorporating significant (P ≤ 0.05) clinical and genetic variables from the univariate analyses into the multiple linear regression models. Supplementary Table 3 reports the significant results of the univariate analyses. To assess the predictive accuracy of the dosing algorithms, the mean absolute error was determined by calculating the average of the difference between the predicted and actual stable doses. The percentage of predicted dose which fell within 20% of the actual maintenance dose was also calculated.
In Silico Analysis to Identify SNPs Associated with mRNA Expression
Putative expression quantitative trait loci (eQTLs) in the CYP4F gene cluster were identified using the eQTL browser3, a database that summarizes results from large-scale studies which identified eQTLs in the liver (Schadt et al., 2008), brain (Myers et al., 2007), fibroblasts (Dimas et al., 2009), T-cells (Dimas et al., 2009), monocytes (Zeller et al., 2010), and lymphoblastoid cell lines (Stranger et al., 2007; Veyrieras et al., 2008; Dimas et al., 2009; Montgomery et al., 2010; Pickrell et al., 2010).
Network Building to Evaluate Interaction between CYP4F2, CYP4F11, and CYP4F12
The interactions between CYP4F2, CYP4F11, and CYP4F12 were visualized in MetaCoreTM (GeneGo, Inc., St. Joseph, MI, United States), an interactive database derived from manually curated literature publications on proteins and small molecules of biological relevance in humans. Results are discussed in the Supplementary Material (Supplementary Figure 3, Supplementary Results, and Supplementary Discussion).
Results
Correlation between Hepatic CYP4F mRNA Expression Levels
The mRNA levels of the four CYP4F genes that were detected by specific probes varied considerably between individuals, ranging from an expression ratio of 2 for CYP4F8 to an expression ratio of 37 for CYP4F12 (Table 1). Significant correlations among the four CYP4F genes are depicted in Figure 1. CYP4F11 and CYP4F12 mRNA showed significant albeit not very strong correlations with CYP4F2 mRNA (rs = 0.25 and 0.384, respectively, P < 0.01; Figures 1A,B) and with each other (rs = 0.3, P < 0.001; Figure 1D). CYP4F8 expression was not significantly correlated to any of the others.
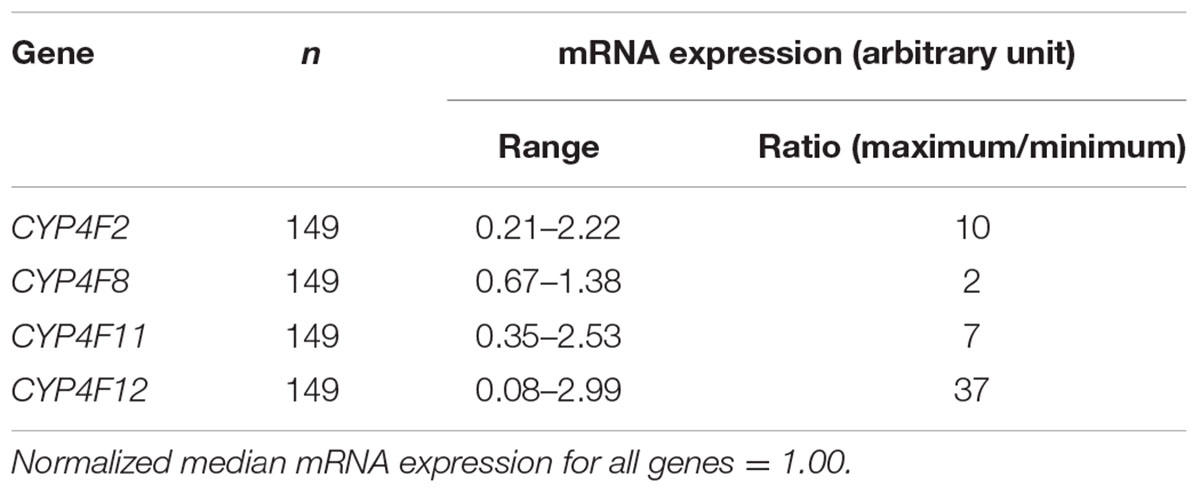
TABLE 1. Variability of mRNA expression in the CYP4F gene cluster.
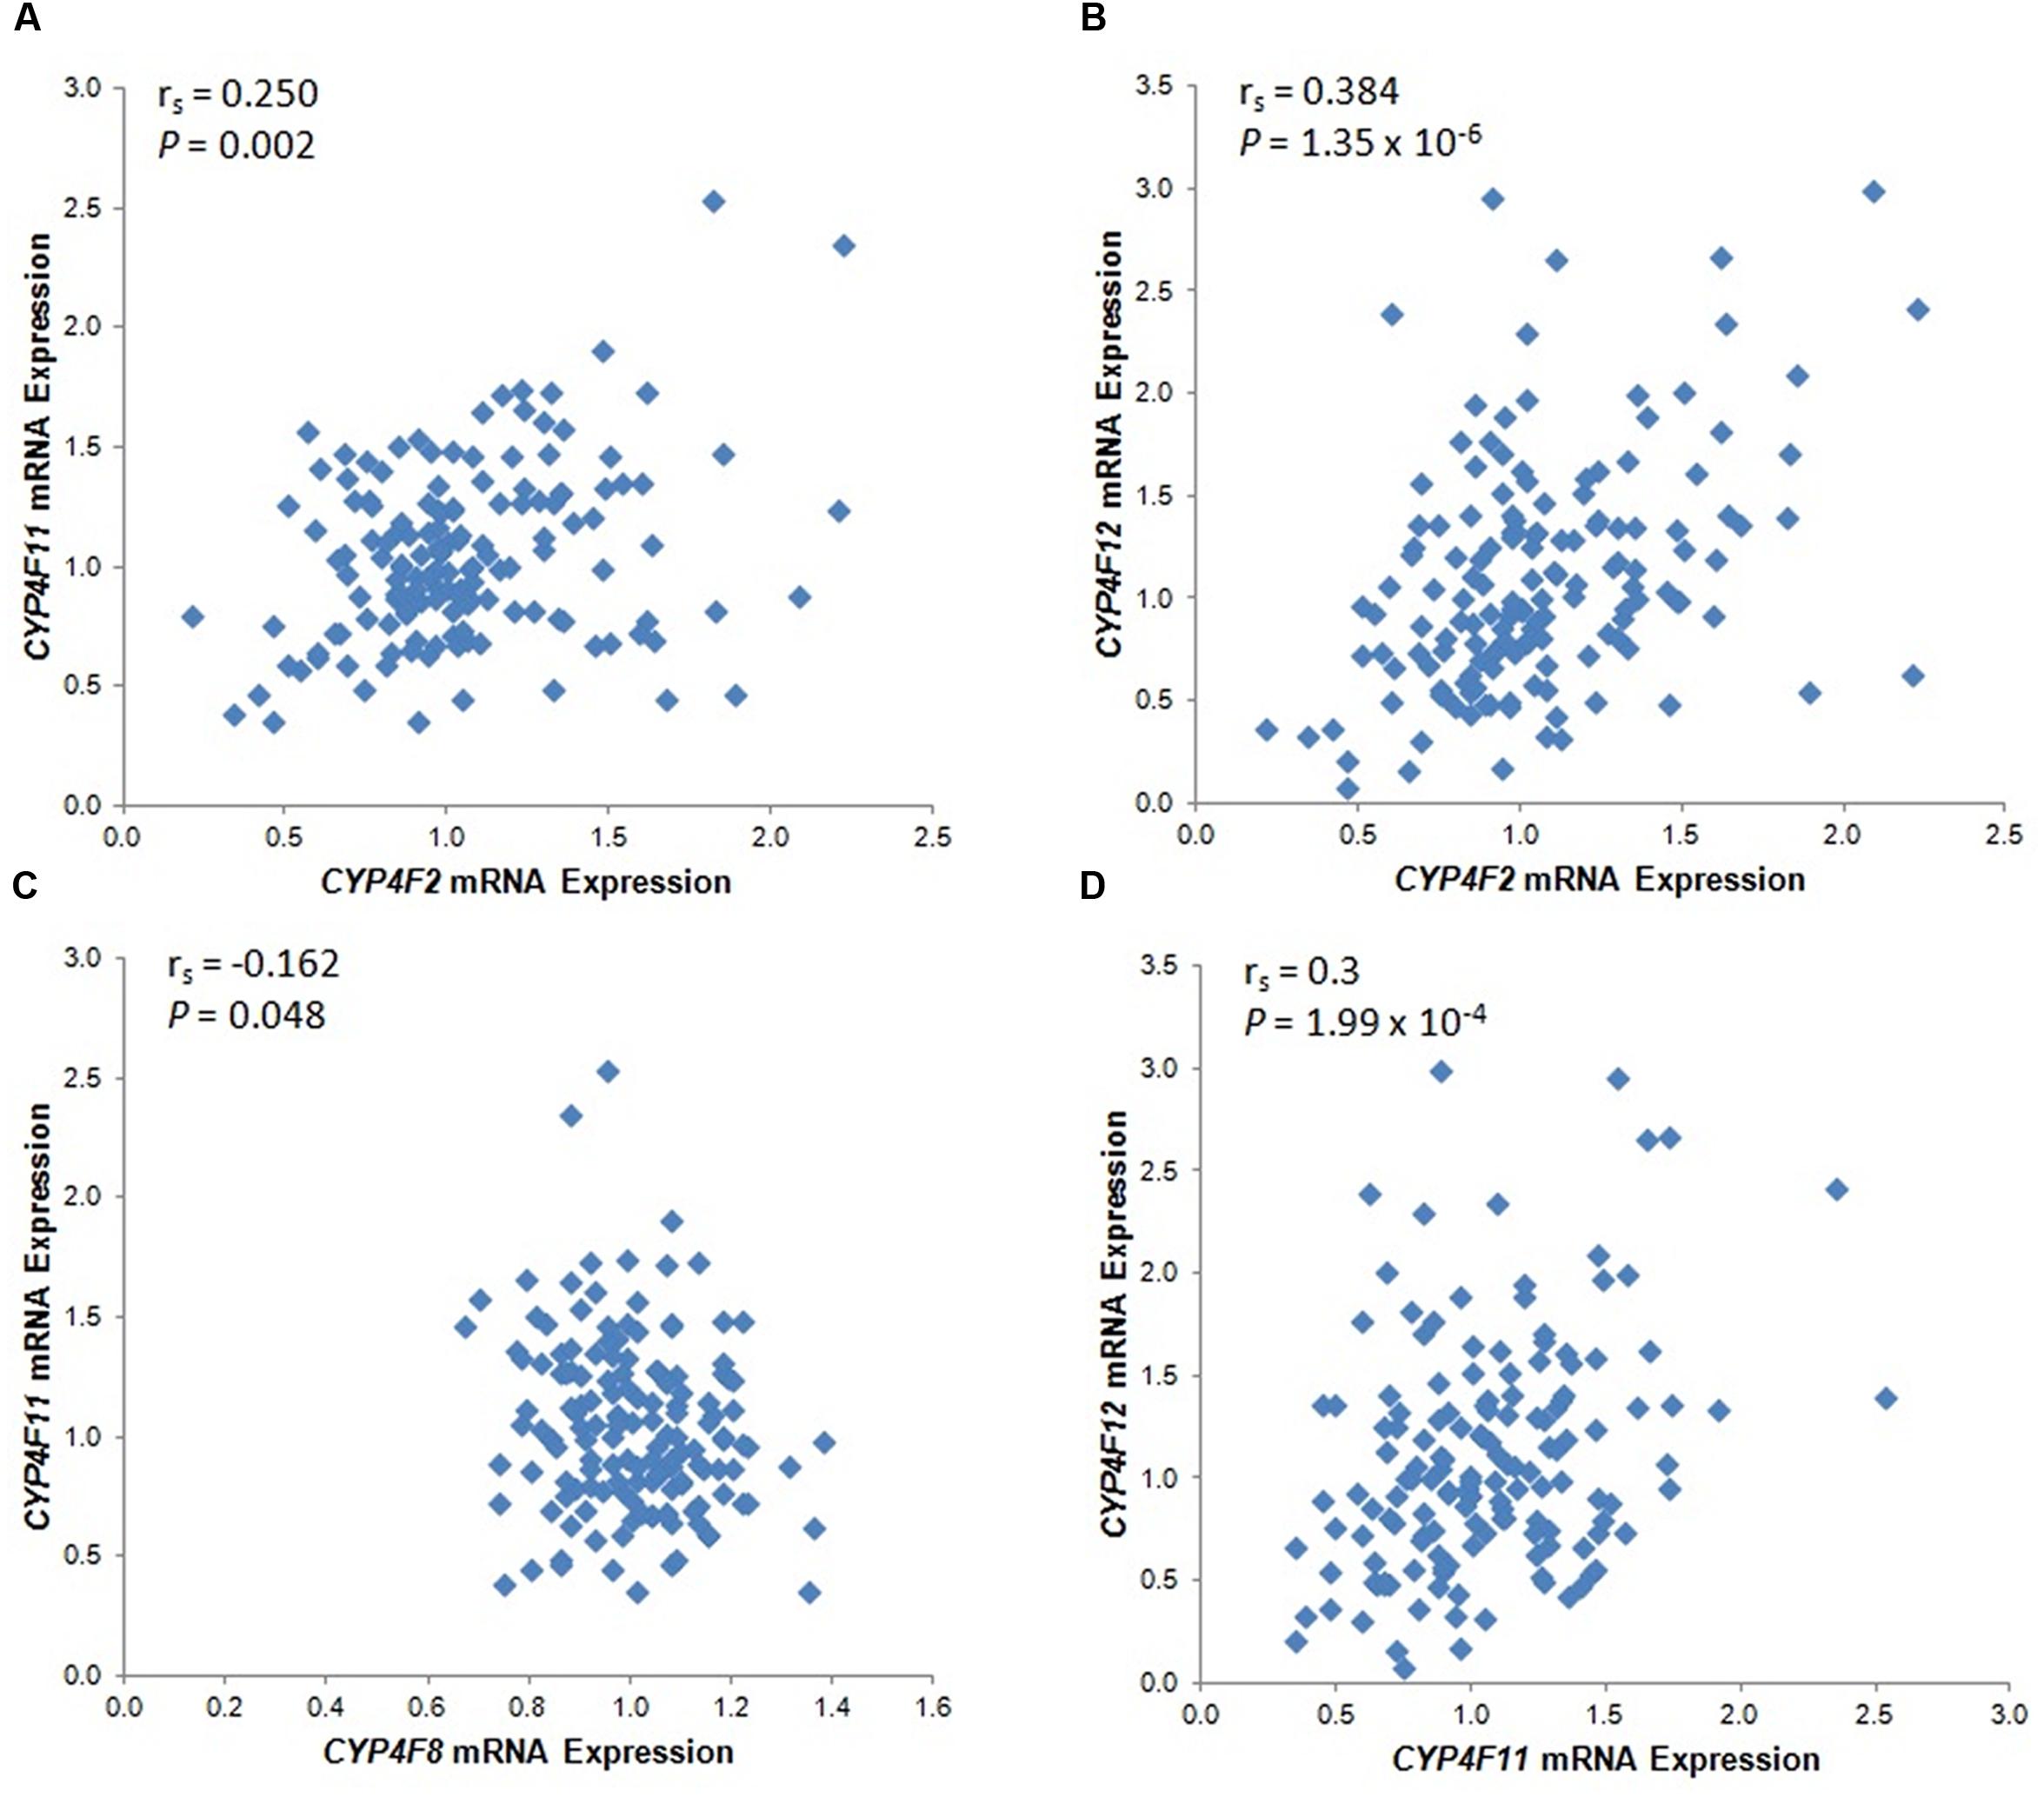
FIGURE 1. Statistically significant CYP4F mRNA correlations in 149 Caucasian human liver tissues. (A) CYP4F2 vs. CYP4F11; (B) CYP4F2 vs. CYP4F12; (C) CYP4F8 vs. CYP4F11; (D) CYP4F11 vs. CYP4F12. vs., versus. The Spearman’s rho correlation coefficient (rs) and P-value for each comparison are given. Log2 transformed expression data are presented.
Genotype–Phenotype Correlation between CYP4F2 Variants and Hepatic mRNA Expression of the CYP4F Gene Cluster
Associations between CYP4F2 variants and hepatic mRNA expression of the CYP4F gene cluster are summarized in Table 2. Contrary to a previous report (McDonald et al., 2009), we found a significant association between rs2108622 and liver CYP4F2 mRNA expression (Figure 2C), with subjects homozygous for the rs2108622 minor T allele showing greater CYP4F2 expression compared to subjects homozygous for the major C allele (TT = 1.47 ± 0.29, CC = 0.97 ± 0.31, Pc = 1.72 × 10⁻³, R2 = 12.6%). Moreover, several other CYP4F2 variants were also associated with significantly higher CYP4F2 expression including rs2189784 (Pc = 0.030, R2 = 7.9%, Figure 2A), a SNP located 29 kb downstream of the CYP4F2 gene.
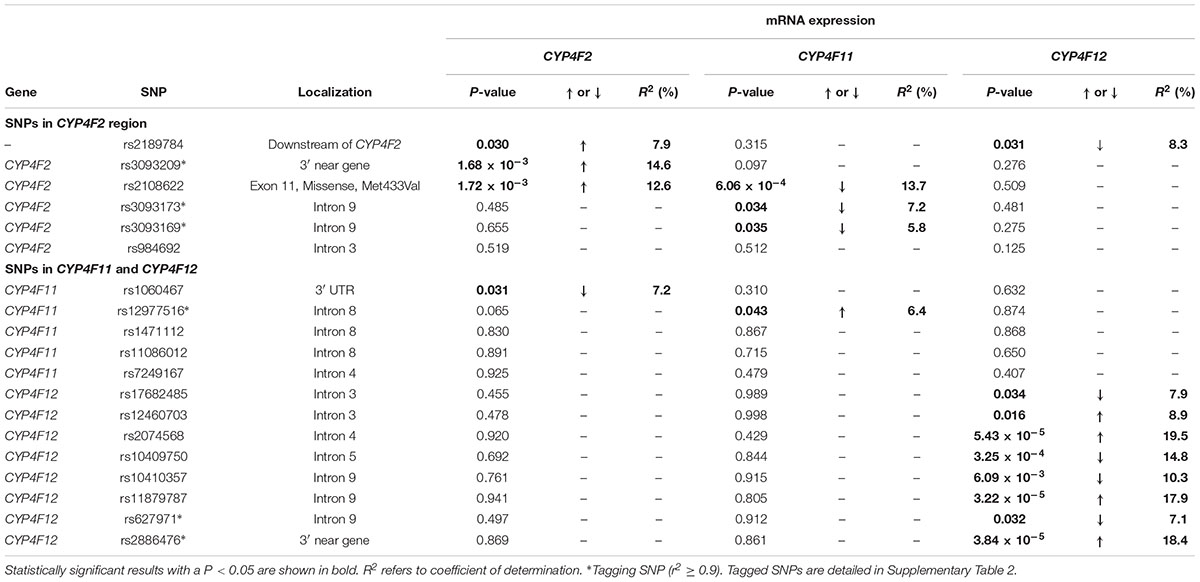
TABLE 2. Genotype–phenotype correlation of CYP4F2, CYP4F11, and CYP4F12 SNPs and hepatic mRNA expression.
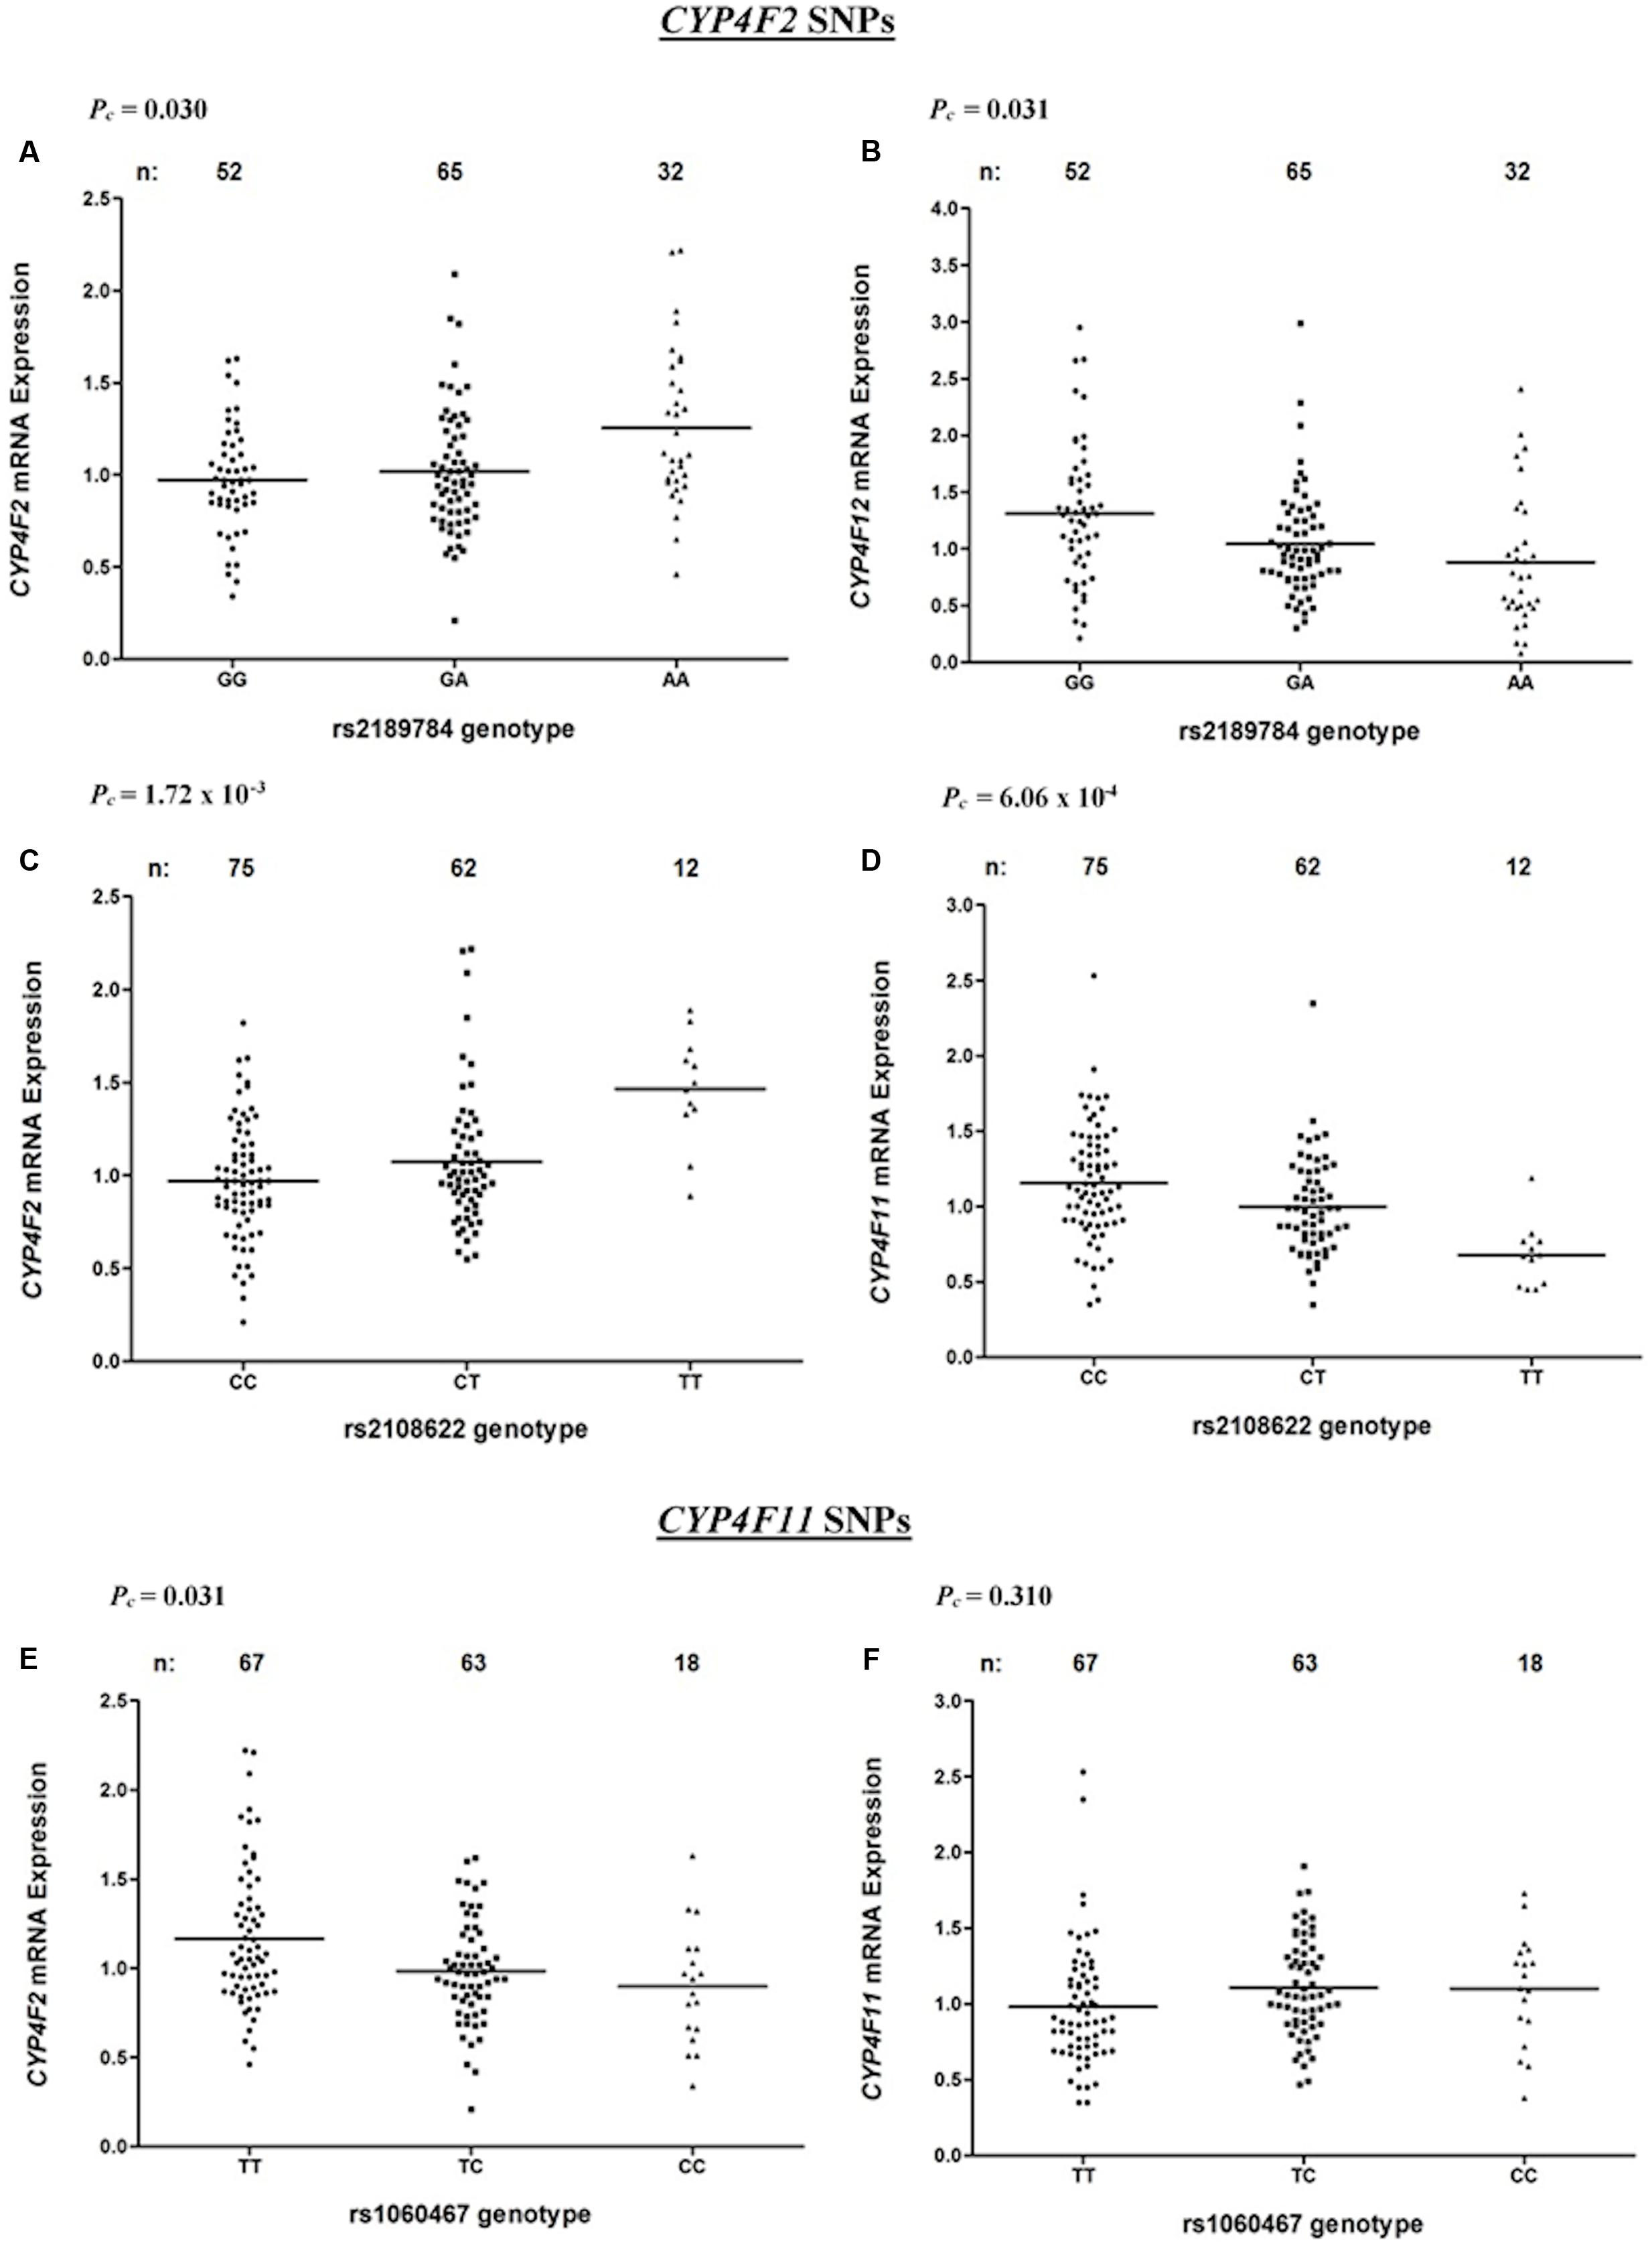
FIGURE 2. Levels of CYP4F2, CYP4F11, CYP4F12 mRNA in normal liver tissue donated from 149 patients in relation to corresponding SNPs across the CYP4F2-CYP4F11 locus. (A,B) rs2189784; (C,D) rs2108622; (E,F) rs1060467. FDR-corrected P-values (Pc) are shown in the upper left corner. Each dot represents an individual and the solid lines represent the mean values.
Interestingly, in addition to being associated with increased CYP4F2 mRNA expression, rs2108622 demonstrated a significant association with decreased CYP4F11 mRNA levels (Pc = 6.06 × 10⁻⁴, R2 = 13.7%, Figure 2D) while rs2189784 was significantly associated with lower levels of CYP4F12 mRNA expression (Pc = 0.031, R2 = 8.3%, Figure 2B). No associations were found between CYP4F2 variants and CYP4F8 mRNA expression (data not shown).
Genotype–Phenotype Correlation between CYP4F11 and CYP4F12 SNPs and Hepatic mRNA Expression of the CYP4F Gene Cluster
Looking at the region encompassing the CYP4F gene cluster on HapMap database (Supplementary Figure 1), high LD is seen in the CYP4F12-CYP4F2-CYP4F11 locus, suggesting that SNPs across the CYP4F11 and CYP4F12 regions could be associated with mRNA expression of CYP4F2 and possibly other CYP4F gene cluster members. To examine the genetic contribution of variants in CYP4F11 and CYP4F12 on the hepatic mRNA expression of the CYP4F gene cluster, fine mapping of the CYP4F11 and CYP4F12 gene regions was conducted and significant associations are summarized in Table 2.
rs1060467, a genetic variant located in the 3′ untranslated region (UTR) of CYP4F11 demonstrated a significant association with decreased CYP4F2 mRNA expression (Pc = 0.031, R2 = 7.2%, Figure 2E); whilst an opposite trend for increasing CYP4F11 mRNA expression was observed which was not statistically significant after FDR (Pc = 0.310, Figure 2F).
Eight SNPs spanning CYP4F12 were significantly associated with CYP4F12 mRNA expression. No significant association with CYP4F8 mRNA expression was observed with any SNPs in the CYP4F11 or CYP4F12 region (data not shown).
Association of Haplotypes in the CYP4F12-CYP4F2-CYP4F11 Region on Hepatic mRNA Expression of the CYP4F Gene Cluster
To explore the complex genetic architecture of CYP4F locus containing CYP4F2, CYP4F11 and CYP4F12, haplotypes across these three genes were constructed based on the genotype data. Ten haplotype blocks were identified as shown in Figure 3, with details of haplotypes inferred and their estimated frequencies. Effects of CYP4F2, CYP4F11, and CYP4F12 haplotypes on hepatic mRNA expression of the CYP4F gene cluster were evaluated and significant associations are reported in Table 3.
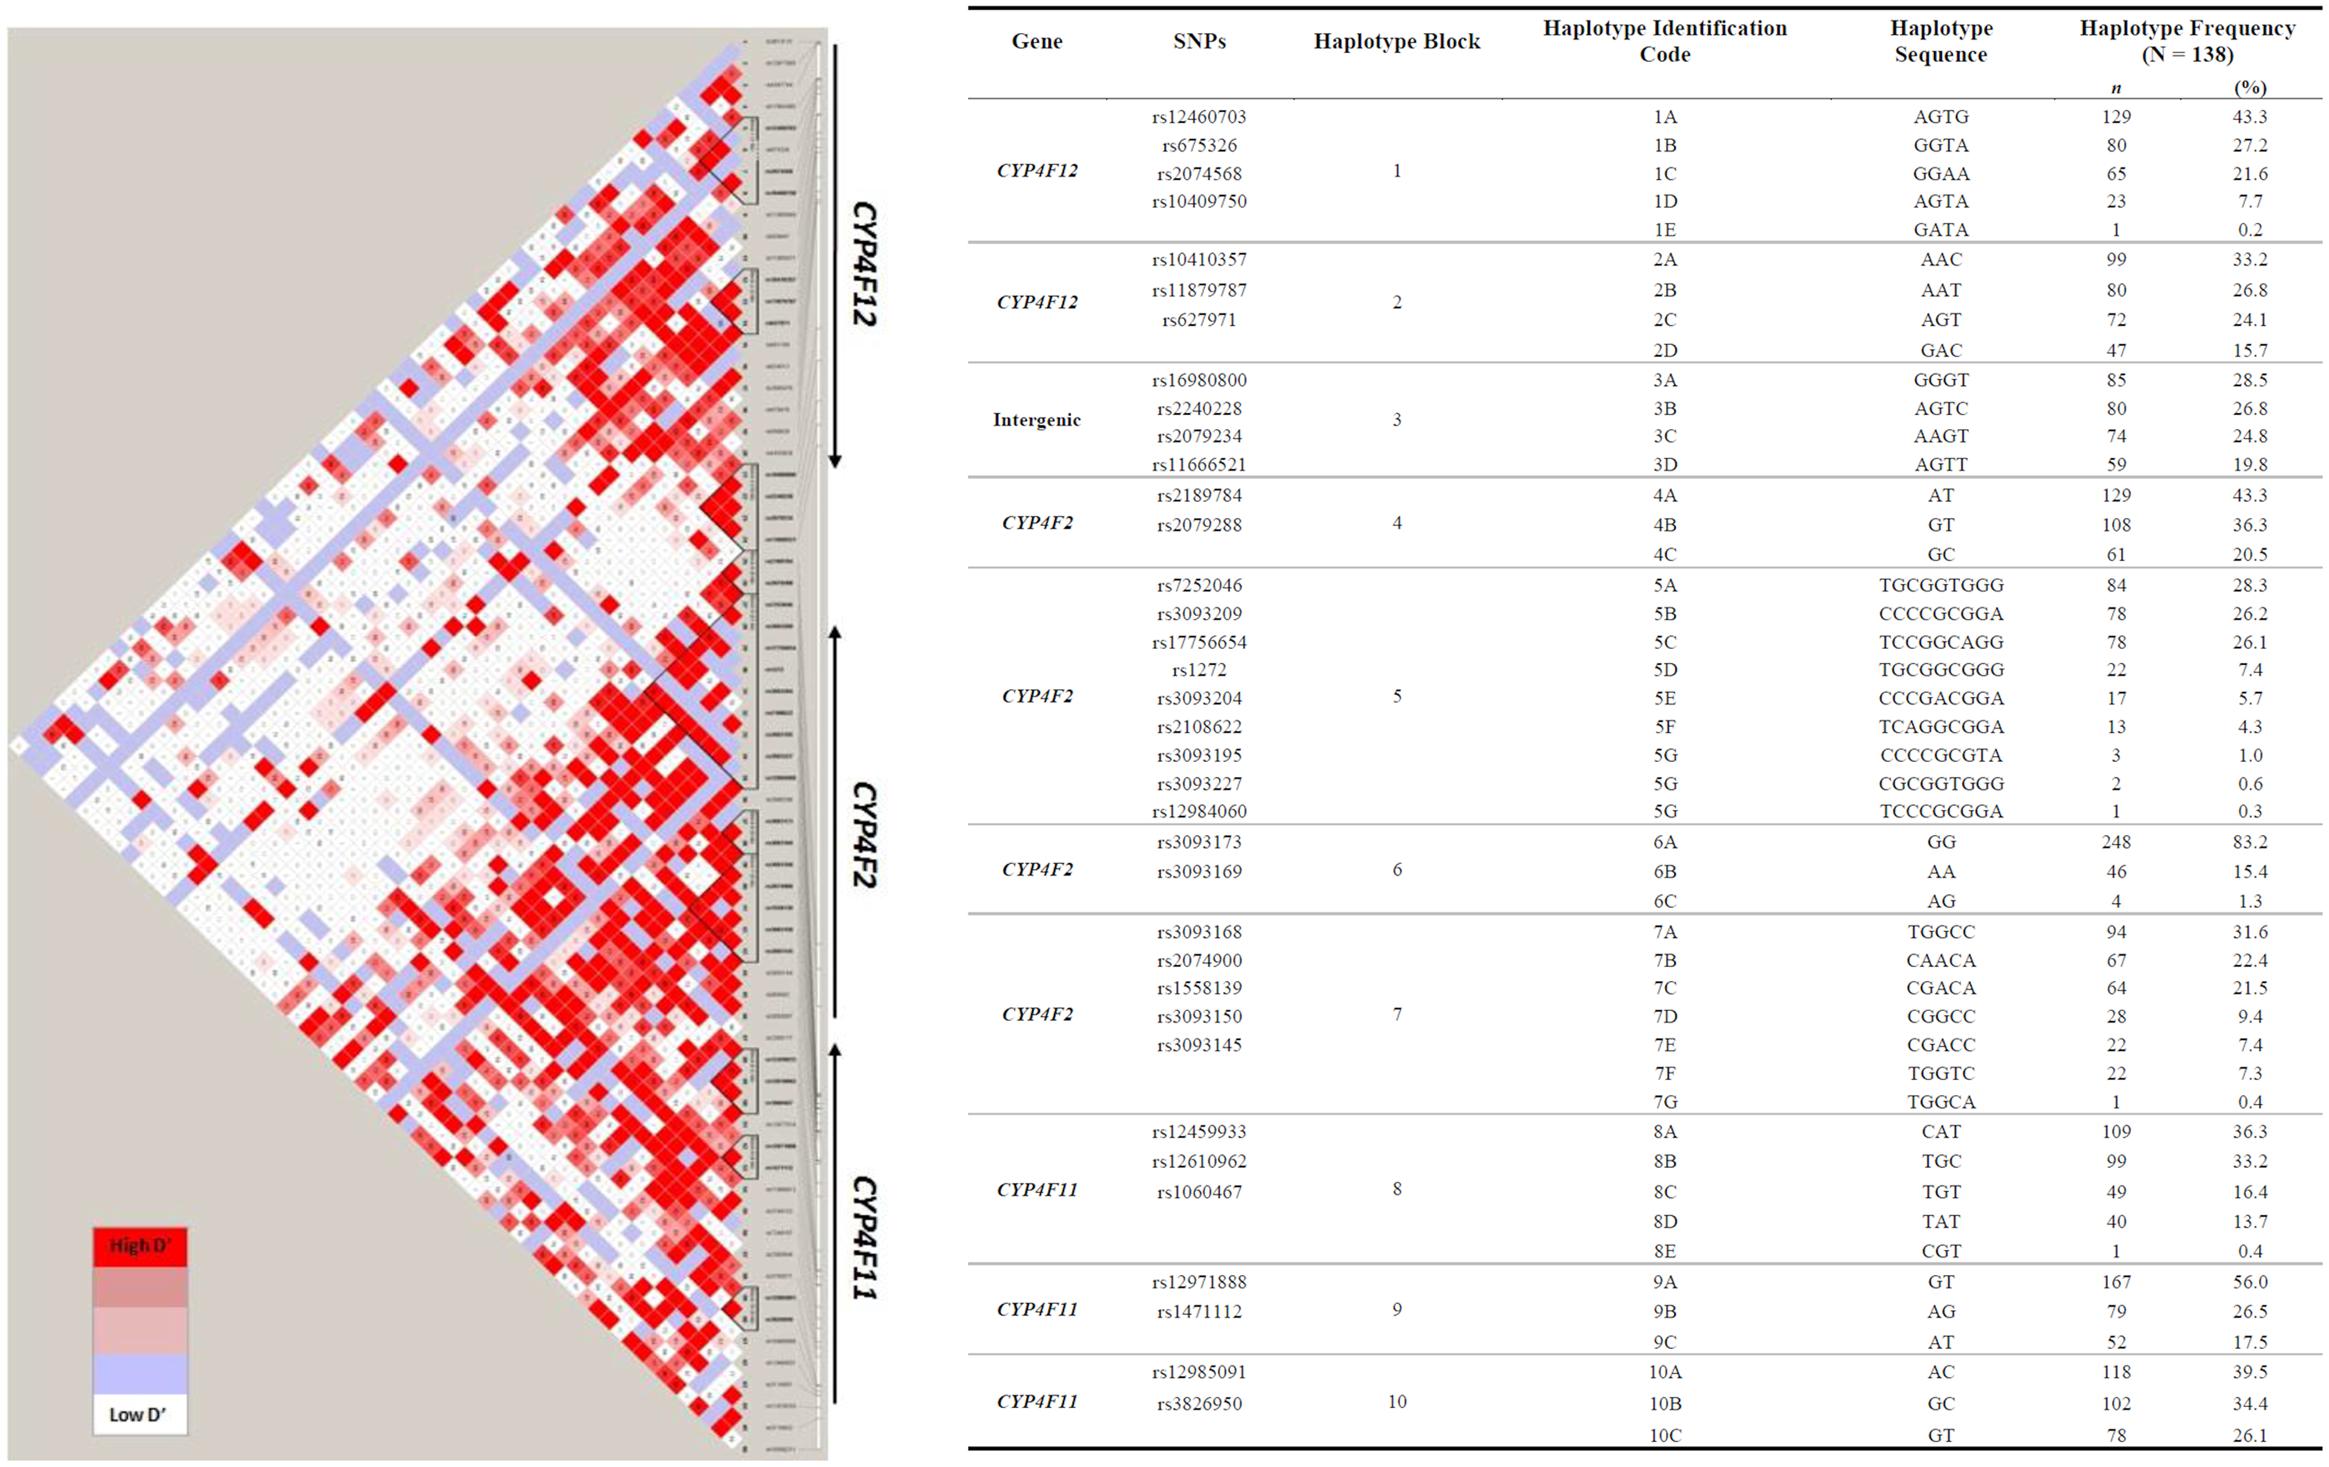
FIGURE 3. Pairwise LD among polymorphisms in the region of CYP4F12-CYP4F2-CYP4F11 genes in 149 Caucasian samples (r2 ≥ 0.9). The left panel shows 10 distinct haplotype blocks defined by the confidence interval algorithm in HaploView 4.2 and the strength of LD is shown in increasing shades of gray, as depicted by the bars. The right panel details the haplotypes sequences and their frequencies inferred by PHASE 2.1.
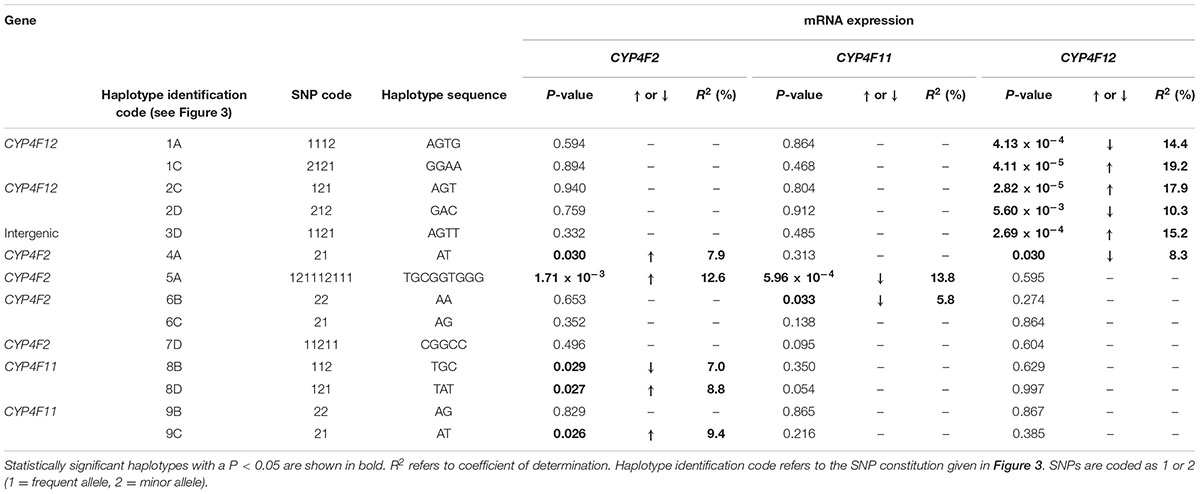
TABLE 3. Genotype–phenotype correlation of CYP4F2, CYP4F11, and CYP4F12 haplotypes and hepatic mRNA expression.
Haplotype 4A harboring the sequence ‘AT’ with a frequency of 43.3% was associated with a significant increase in hepatic CYP4F2 (Pc = 0.030, R2 = 7.9%; Figure 4A) and reduced CYP4F12 (Pc = 0.030, R2 = 8.3%; Figure 4B) mRNA expression, mirroring the effect of rs2189784. Corresponding to the effect of rs2108622, haplotype 5A ‘TGCGGTGGG’ (frequency = 28.3%) was significantly associated with increased CYP4F2 (Pc = 1.71 × 10⁻³, R2 = 12.6%; Figure 4C) and decreased CYP4F11 (Pc = 5.96 × 10⁻⁴, R2 = 13.8%; Figure 4D) mRNA expression. Resembling the effect of rs1060467, haplotype 8B (sequence ‘TGC,’ frequency = 33.2%) was associated with down-regulation of CYP4F2 (Pc = 0.029, R2 = 7.0%; Figure 4E) and showed a non-significant up-regulating effect on CYP4F11 (Pc = 0.350; Figure 4F) mRNA expression.
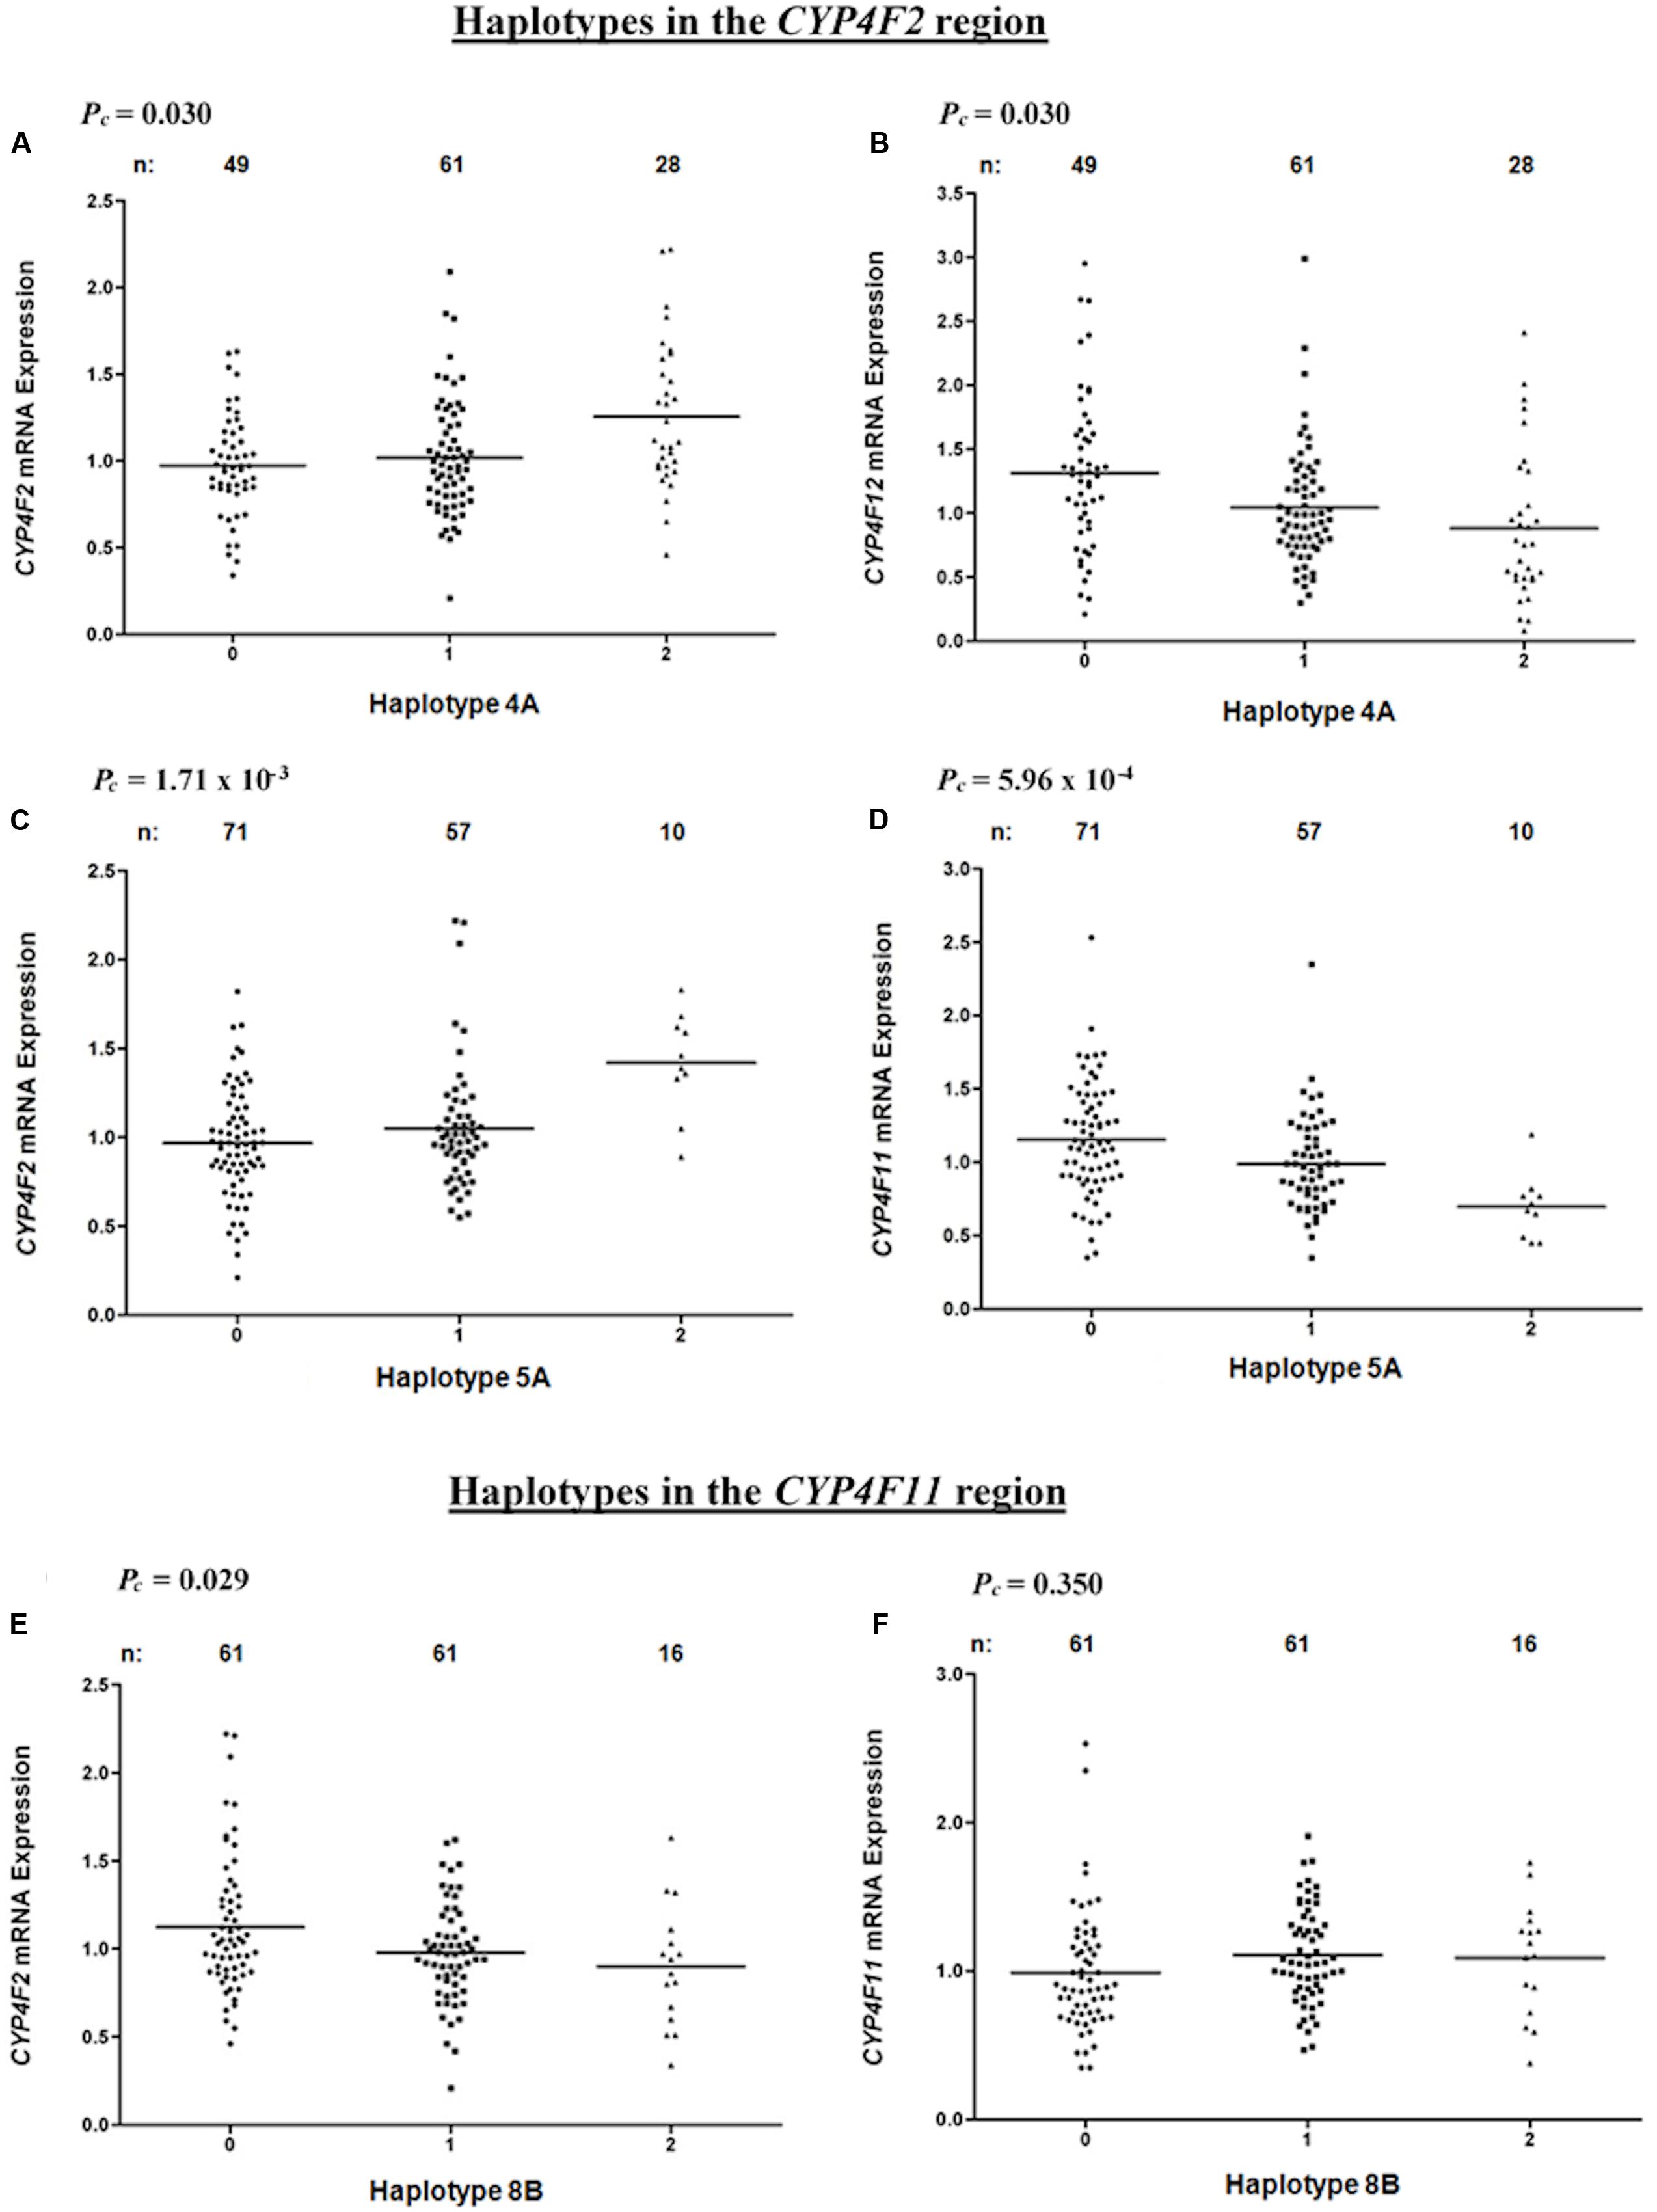
FIGURE 4. Levels of hepatic CYP4F2, CYP4F11, CYP4F12 mRNA in normal liver tissue donated from 149 patients in relation to haplotypes across the CYP4F2-CYP4F11 locus. (A,B) Haplotype 4A harboring sequence ‘AT’; (C,D) Haplotype 5A harboring sequence ‘TGCGGTGGG’; (E,F) Haplotype 8B harboring sequence ‘TGC.’ FDR-corrected P-values (Pc) are shown in the upper left corner. Each dot represents an individual and the solid lines represent the mean values.
Competing Effects of CYP4F11 rs1060467 and CYP4F2 rs2108622 on Warfarin Stable Dose
Linkage disequilibrium analysis of genotypes in our 149 livers revealed that CYP4F11 rs1060467 and CYP4F2 rs2108622 were moderately correlated with LD estimates of r2/D′ = 0.21/1.00. To assess the roles of rs1060467 and rs2108622 in warfarin response, we tested their association with the clinical outcome of warfarin stable dose in our prospective cohort of warfarin-treated patients (n = 711). Demographics of the 711 patients are summarized in Table 4. Among the 711 patients investigated, 345 achieved warfarin stable dose. Figure 5A illustrates warfarin stable dose established in patients, stratified by CYP4F11 rs1060467 genotype. Patients with a C allele exhibited reduced stable dose requirements (mg/day: TT = 4.6 ± 0.2, TC = 3.9 ± 0.1, CC = 3.8 ± 0.2; Pc = 0.017). The proportion of warfarin dose variability explained by rs1060467 was 2.6%. Conversely, as depicted in Figure 5B, patients carrying the CYP4F2 rs2108622 T allele showed increased warfarin stable dose requirements (mg/day: CC = 3.7 ± 0.1, CT = 4.3 ± 0.2, TT = 5.3 ± 0.4; Pc = 0.003) and rs2108622 accounted for 4.3% of warfarin dose variance.
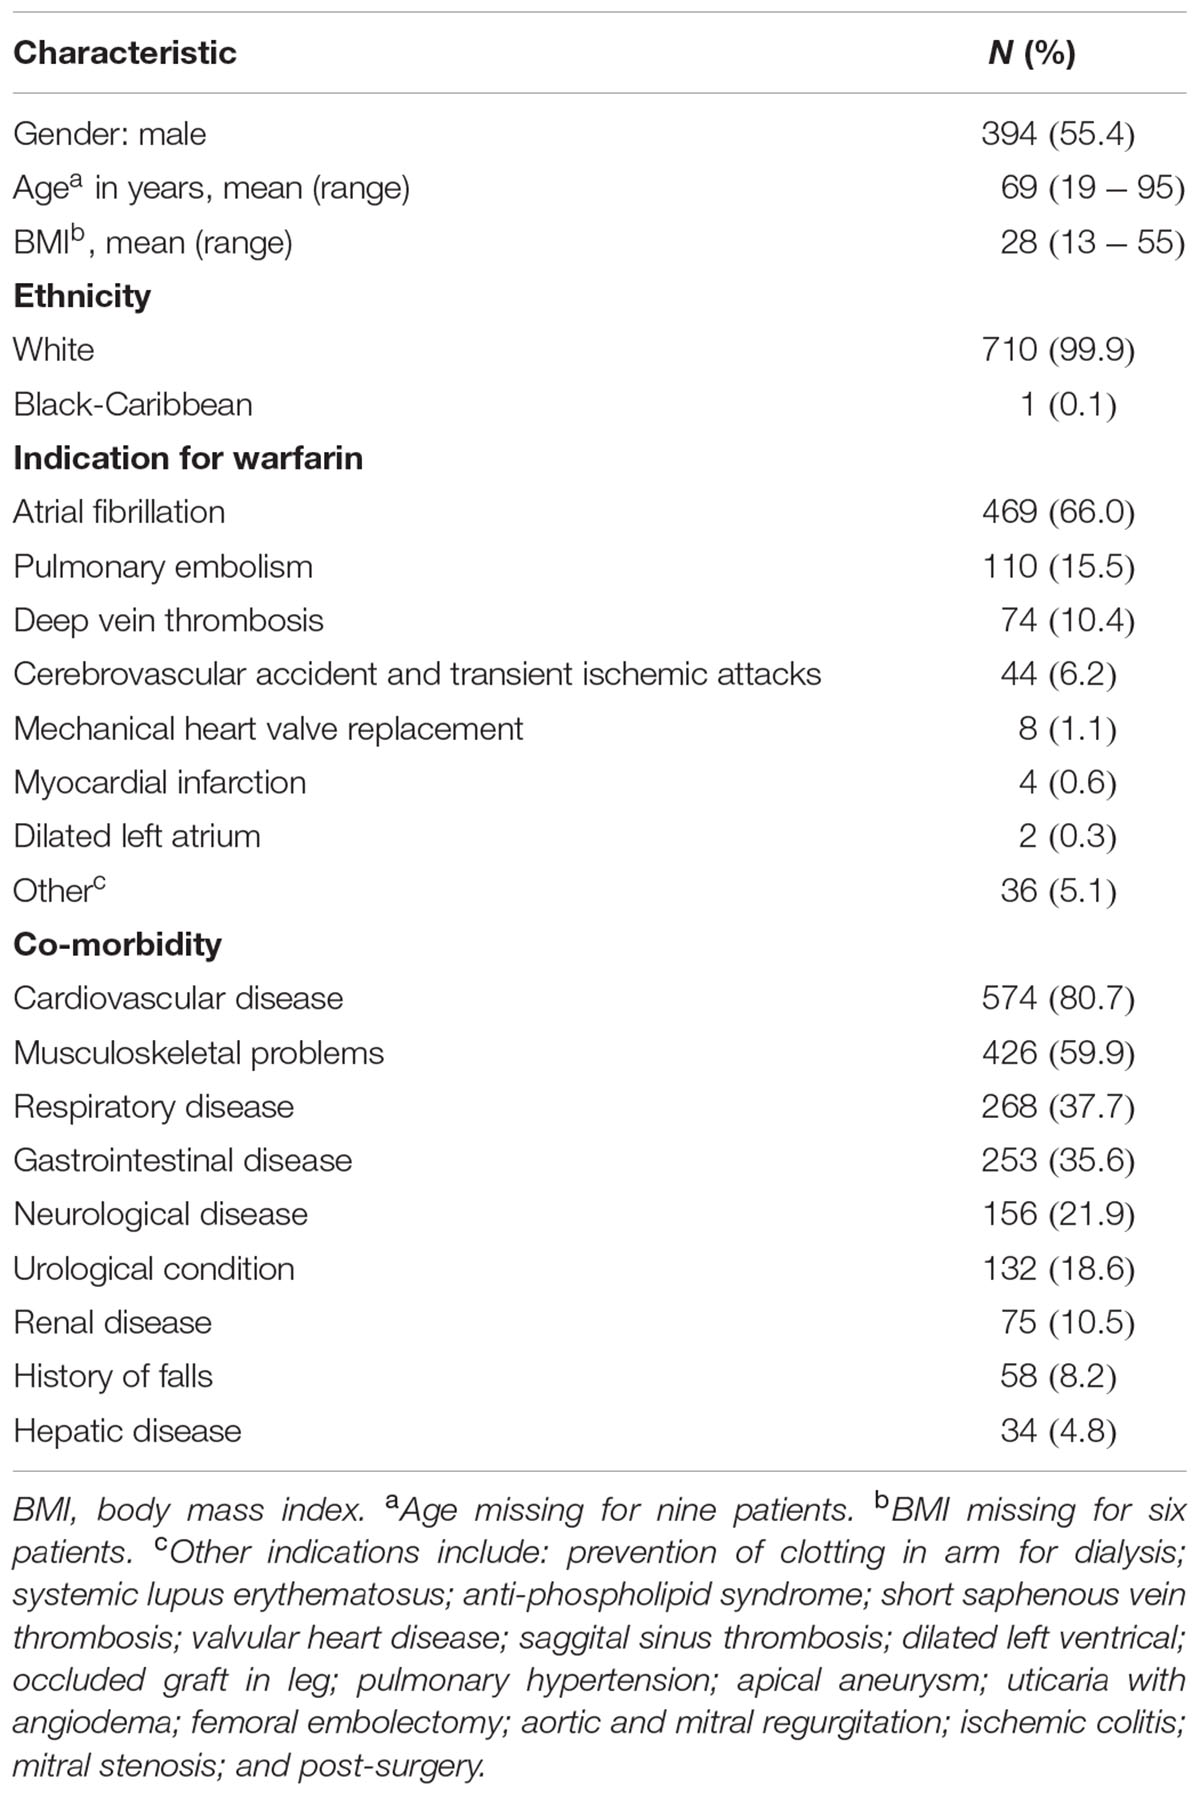
TABLE 4. Clinical profile of 711 warfarin patients.
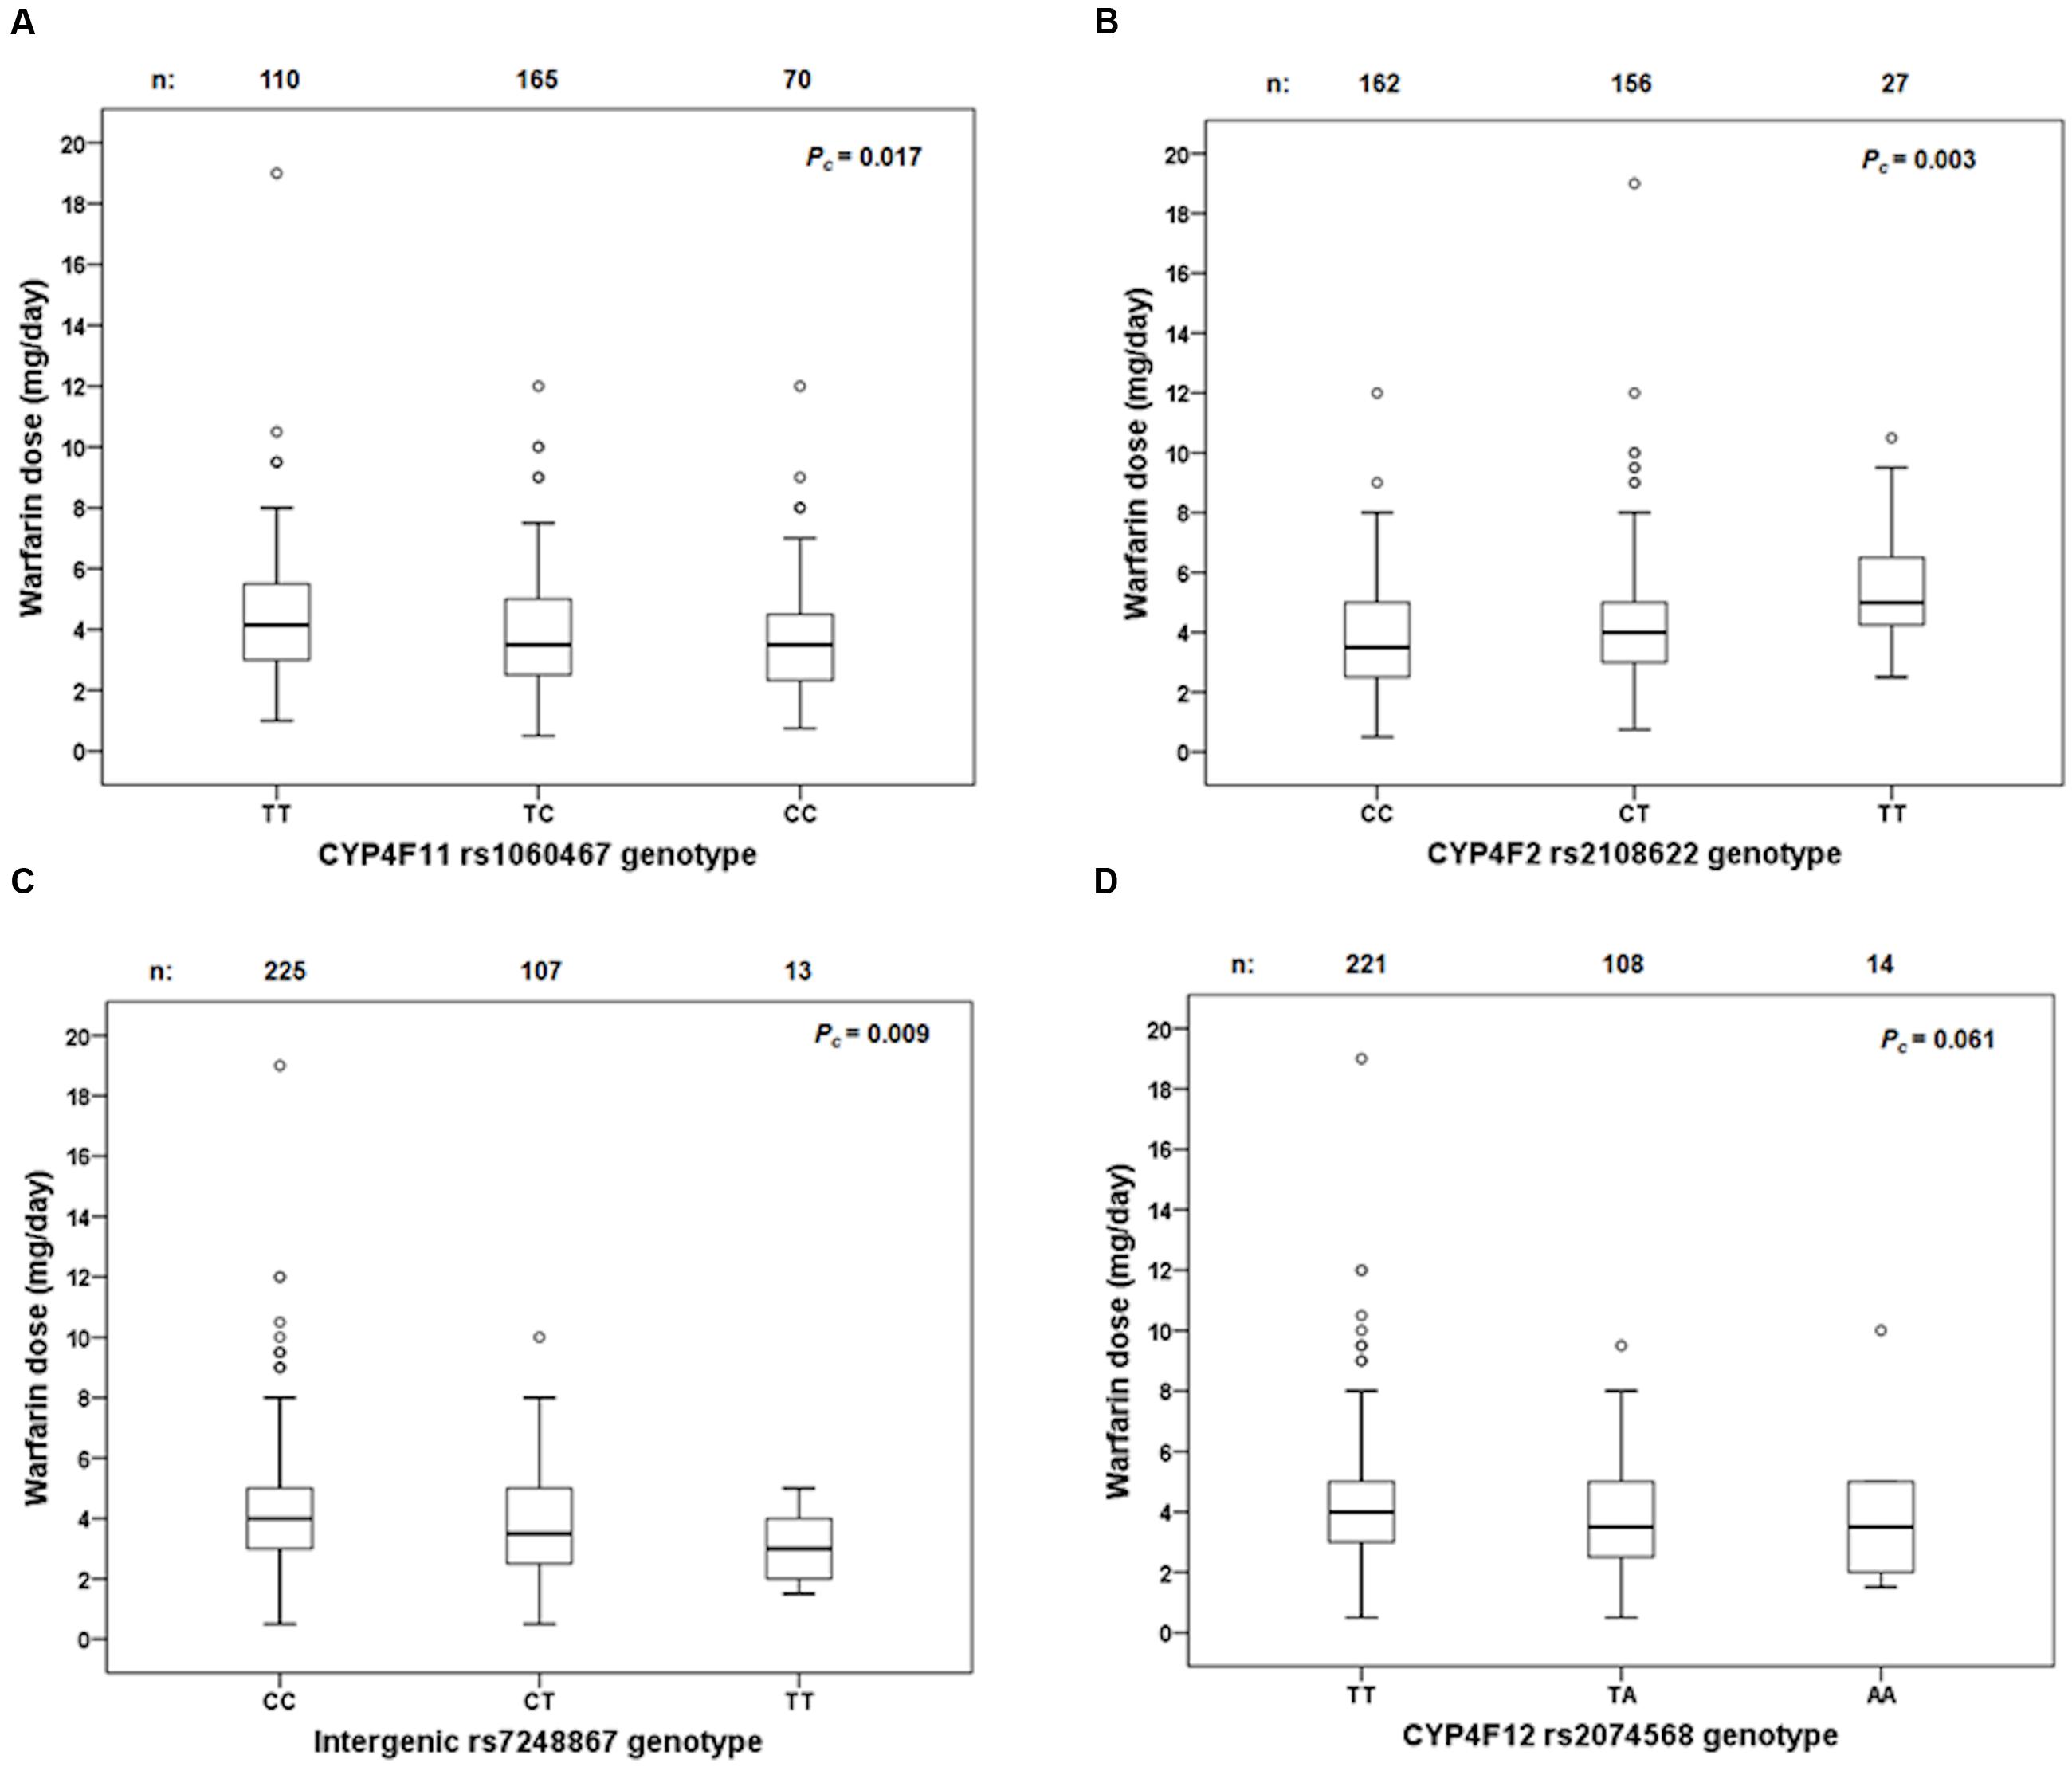
FIGURE 5. Box and whisker plots showing the distribution of stable warfarin daily doses based on genotype groups in (A) CYP4F11 rs1060467; (B) CYP4F2 rs2108622; (C) intergenic rs7248867; (D) CYP4F12 rs2074568. Boxes represent 25th–75th percentiles of warfarin doses, whiskers represent 5th–95th percentiles, and solid lines represent median dose in each group. Open dots represent outliers. FDR-corrected P-values (Pc) are shown on the upper right corner. Out of the 711 patients recruited prospectively, 345 achieved warfarin stable dose.
By segregating the patients according to their haplotypes for CYP4F2 rs2108622 and CYP4F11 rs1060467 as illustrated in Table 5, it can be seen that there were small dose changes in patients carrying haplotypes consisting of CYP4F2 rs2108622 wild-type genotype and CYP4F11 rs1060467 variant genotype and vice versa.
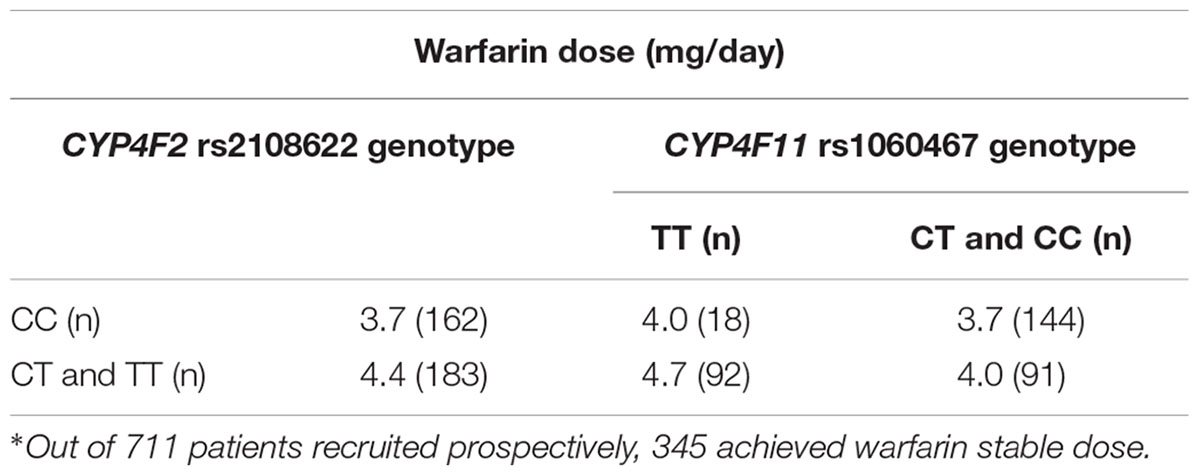
TABLE 5. Relationship between CYP4F2 and CYP4F11 SNPs and stable warfarin dose requirement∗.
Imputation and Conditional Analysis
To explore the presence of additional signals at the CYP4F loci, genotype imputations were carried out across the 380 kb genomic region encompassing the CYP4F12-CYP4F2-CYP4F11 region. Although additional SNPs showed significant associations with warfarin stable dose, the associations with CYP4F2 rs2108622 and CYP4F11 rs1060467 remained the most significant among all the CYP4F2 and CYP4F11 SNPs, respectively.
We also performed conditional analyses to evaluate the independence of association between CYP4F2 rs2108622 and CYP4F11 rs1060467. When we conditioned on CYP4F11 rs1060467, a reduction in both magnitude and significance was seen with the association of warfarin stable dose with CYP4F2 rs2108622 (βinitial = 0.078, βconditional = 0.063, Pcinitial = 0.003, Pcconditional = 0.05). When we conditioned on CYP4F2 rs2108622, the association of warfarin stable dose with CYP4F11 rs1060467 disappeared (Pcinitial = 0.017, Pcconditional = 0.418). These results suggest that CYP4F2 rs2108622 can explain the association signal for CYP4F11 rs1060467 or vice versa.
Warfarin Dose Prediction Algorithms
To assess whether the inclusion of CYP4F2 rs2108622 and/or CYP4F11 rs1060467 improves warfarin dose predictive accuracy, we developed a clinical algorithm and several pharmacogenetic algorithms as shown in Table 6. The clinical algorithm included four predictors which were found significant in the univariate analyses: age, BMI, gender and baseline clotting factor II level, which explained 15.7% of warfarin dose variability. The pharmacogenetic algorithm included CYP2C9∗2 rs1799853, CYP2C9∗3 rs1507910, and VKORC1 rs9923231 genotypes in addition to the clinical factors and accounted for a 32.3% increase in warfarin dose variability, with a marked improvement in dose prediction accuracy. The addition of CYP4F2 rs2108622 or CYP4F11 rs1060467 to the pharmacogenetic algorithm explained a further 0.5–0.7% in warfarin dose variability with a modest increase in prediction accuracy (∼1% decrease in MAE and 1.2% increase in the number of predicted dose which fell within ±20% of the observed warfarin dose). When both rs2108622 and rs1060467 were incorporated into the pharmacogenetic algorithm, there was a modest increase in the number of predicted doses which fell within ±20% of the observed warfarin dose (∼2%).
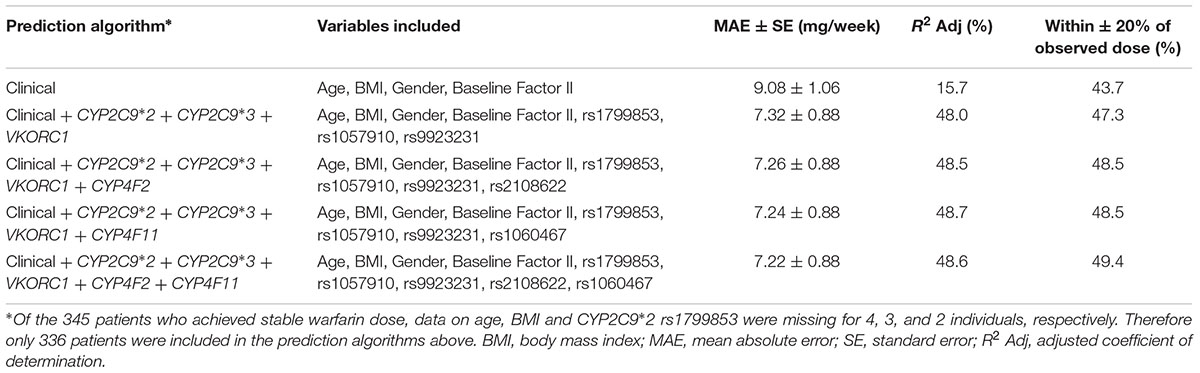
TABLE 6. Comparison of predicted stable warfarin doses to actual stable warfarin doses using different prediction algorithms.
In Silico Genotype–Phenotype Analysis
To explore whether the SNP-gene effects observed in our cohort of human livers was also present in other published studies, we assessed eQTLs in the region encompassing CYP4F2, CYP4F11, and CYP4F12 genes using the publicly available eQTL database hosted by the Pritchard laboratories at the University of Chicago. Table 7 outlines the significant SNP-gene associations available on the eQTL database. Of particular interest is the positive association of rs7248867, a SNP located between CYP4F12 and CYP4F2, with CYP4F11 transcript levels in livers from individuals of European descent. Using genotype data available on HapMap, LD analysis revealed that this intergenic SNP is in moderate LD with both rs2189784 (D′ = 1.0, r2 = 0.103) and rs2108622 (D′ = 1.0, r2 = 0.046). rs7248867 also tags several SNPs (using r2 > 0.8) including a CYP4F12 intronic SNP, rs2074568 (D′ = 1.0, r2 = 0.837) which was analyzed in our cohort of 149 individuals who had donated liver samples. rs2074568 showed a significant association with increased hepatic CYP4F12 mRNA expression (Pc = 1.49 × 10⁻⁵) but not with CYP4F11 (P = 0.25) and CYP4F2 (P = 0.537).
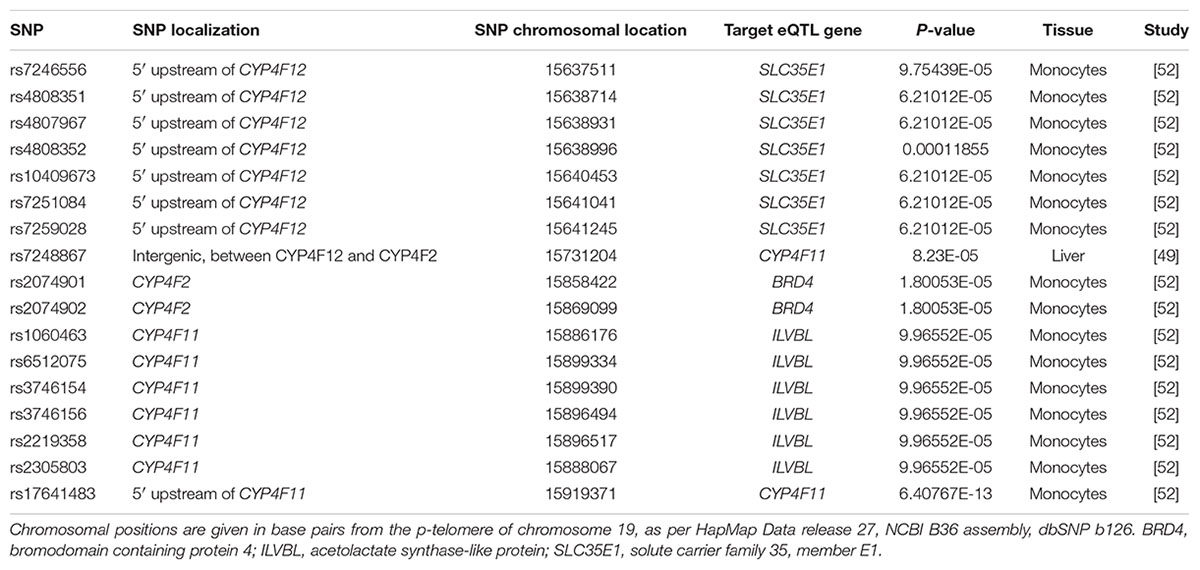
TABLE 7. Expression quantitative trait loci (eQTLs) in the CYP4F12-CYP4F2-CYP4F11 gene cluster region.
Effect of Intergenic rs7248867 and CYP4F12 rs2074568 on Warfarin Stable Dose
Genotypes from the 1000 genomes project were imputed to evaluate the effect of rs7248867 and rs2074568 on warfarin stable dose. As illustrated in Figure 5C, patients carrying the minor rs7248867 T-allele required lower warfarin doses compared to patients carrying the major C-allele (mg/day: CC = 4.3 ± 0.1, CT = 3.7 ± 0.2, TT = 3.2 ± 0.4; Pc = 0.009). The association of rs2074568 was not significant after FDR but showed a recessive effect on warfarin dose requirements (Figure 5D) with the minor A-allele (mg/day: TT = 4.3 ± 0.1, TA = 3.7 ± 0.2, AA = 3.7 ± 0.6; Pc = 0.061).
To assess the independence of these two SNPs to CYP4F2 rs2108622, conditional analyses were performed. When conditioned on rs7248867, the association of CYP4F2 rs2108622 with warfarin stable dose decreased in both magnitude and significance (βinitial = 0.078, βconditional = 0.065, Pcinitial = 0.003, Pcconditional = 0.015). When we conditioned on rs2074568, a reduction in magnitude and significance were also observed with CYP4F2 rs2108622 (βconditional = 0.069, Pcconditional = 0.009). These results suggest that rs7248867 and rs2074568 are correlated with CYP4F2 rs2108622.
Discussion
To elucidate whether the association between genotype and gene expression reflected cis-acting regulatory effects on the CYP4F gene cluster, we conducted a comprehensive investigation looking at the effects of CYP4F2, CYP4F11, and CYP4F12 polymorphisms on the hepatic expression levels of CYP4F2, CYP4F8, CYP4F11, and CYP4F12 mRNA in a Caucasian population. We report for the first time that SNPs and extended haplotypes in CYP4F2, CYP4F11, and CYP4F12 affect the mRNA expression levels of CYP4F2, CYP4F11, and CYP4F12 in human liver tissues and that CYP4F11 plays a role in warfarin response.
Unlike McDonald et al. (2009), our study observed a significant association between the CYP4F2 rs2108622 SNP and an increase in CYP4F2 mRNA expression, explaining over 12% of the variability in CYP4F2 mRNA expression. This may reflect our larger sample size (n = 149) of livers compared with the previous study (McDonald et al., 2009). Consistent with the fact that the CYP4F genes are highly homologous and show extensive LD, our data show that SNPs in one CYP4F gene can have an effect on the expression of another CYP4F gene. In fact, rs2108622 in CYP4F2 was associated with decreased CYP4F11 mRNA expression accounting for nearly 14% of CYP4F11 hepatic mRNA expression. Comparatively, the haplotype harboring this CYP4F2 variant also displayed similar associations. Conversely, a variant in the 3′ UTR of the CYP4F11 region, rs1060467, was associated with decreased CYP4F2 mRNA expression, accounting for 7% of the variability in CYP4F2 mRNA expression. The CYP4F11 haplotype comprising the minor rs1060467 C-allele also had a corresponding recessive effect on CYP4F2 mRNA expression.
Given these mutual genotype–phenotype relationships and the fact that both CYP4F2 and CYP4F11 had been identified as equally efficient vitamin K ω-hydroxylases (Edson et al., 2013), we hypothesized that rs1060467 may play a role in warfarin stable dose. Using our GWAS data previously conducted in 711 prospective patients on warfarin therapy, of which 345 patients achieved warfarin stable dose, rs1060467 explained 2.6% of warfarin dose variability, while rs2108622 accounted for 4.3%, similar to previous reports (Caldwell et al., 2008; Borgiani et al., 2009; Perez-Andreu et al., 2009). Interestingly, the association of rs1060467 with warfarin dose was opposite to that seen with rs2108622, confirming the compensatory effects CYP4F2 and CYP4F11 polymorphisms have on hepatic CYP4F2 mRNA. However, when conditional analyses were performed using SNP rs2108622, the magnitude and significance level for rs1060467 were substantially attenuated, suggesting that rs1060467 and rs2108622 are dependent loci and are both likely to contribute to the same signal at the CYP4F2-CYP4F11 region. Indeed, our pharmacogenetic algorithms incorporating CYP4F11 rs1060467 or CYP4F2 rs2108622 or both CYP4F11 rs1060467 and CYP4F2 rs2108622, explained a similar increase in warfarin dose variability with modest improvement in prediction accuracy (1–2%), indicating that just one of these SNPs can explain the effect on warfarin dose variability. The opposing effects between CYP4F11 rs1060467 and CYP4F2 rs2108622 in the CYP4F gene cluster do not appear to affect warfarin dose requirement.
Our present study also showed a significant association of rs2189784, a SNP located 30 kb downstream of CYP4F2, with differences in mRNA expression of CYP4F2 and CYP4F12. Interestingly, we have previously reported this SNP to play a role in time taken to achieve therapeutic INR in patients on prospective warfarin therapy (Zhang et al., 2009). Likewise, the haplotype containing the minor A-allele of variant rs2189784 (haplotype 4A) was also significantly associated with increasing CYP4F2 and decreasing CYP4F12 mRNA expression. These results suggest that the previously observed association between rs2189784 and time to therapeutic INR (Zhang et al., 2009) may be mediated through an effect on CYP4F2 and CYP4F12 mRNA and SNPs in CYP4F12 may affect CYP4F2 mRNA expression. Evaluation of variants across the CYP4F12 region however, did not show any SNPs to be associated with CYP4F2 mRNA expression.
In silico eQTL analysis provided further insights into the complexity of the regulation of the CYP4F gene cluster. CYP4F11 mRNA expression was associated with an intergenic SNP between CYP4F12 and CYP4F2, rs7248867. This SNP is tagged by a CYP4F12 intronic SNP (rs2074568) genotyped in our study. These two SNPs were however, not present on the GWAS platform. Imputations were therefore performed and a trend for reduced warfarin stable dose was seen with these two SNPs. However, our conditional analyses suggest that the association signals found with rs7248867 and rs2074568 could be explained by CYP4F2 rs2108622.
A limitation of our study is that we did not investigate protein expression levels of the different CYP4F isoforms. The reason for this is that the protein sequences of CYP4F2, CYP4F11 and CYP4F12 share 81–93% similarity (Hirani et al., 2008) and currently available antibodies are likely to exhibit high level of cross-reactivity, decreasing the specificity of protein detection. New technologies such as gene editing could be employed to evaluate the function of these CYP4F genes.
Conclusion
We have effectively examined sequence variations across the three CYP4F genes – CYP4F2, CYP4F11, and CYP4F12 and their effect on mRNA expression. From a clinical perspective, our data show the complexity of gene–gene interactions, where competing effects of different SNPs within the same gene cluster can cancel out the level of CYP4F2 mRNA and warfarin daily doses required to maintain anticoagulation. As a result, the overall effect of SNPs in CYP4F2 and CYP4F11 on warfarin dose variability is very small in our population. However, in other populations with different linkage patterns the influence of CYP4F SNPs may be larger. It is possible that additional variants which are rare and functionally active may be important other than the SNPs genotyped in our study, and resequencing of the CYP4F2, CYP4F11 and CYP4F12 genes in appropriately phenotyped patients on warfarin may help identify these.
Author Contributions
MP, UZ, and PD designed the research study; JZ, KK, and SB performed the experiments; JZ, KK, AJ, BF, AA, SB, and UZ analyzed the results; JZ, KK, AA, UZ, and MP wrote the manuscript; all authors read and approved the final manuscript.
Funding
This work was supported by the UK Department of Health (NHS Chair of Pharmacogenetics) and the Robert Bosch Foundation, Stuttgart, Germany. MP is a NIHR Senior Investigator and wishes to thank the MRC Centre for Drug Safety Science for support.
Conflict of Interest Statement
The authors declare that the research was conducted in the absence of any commercial or financial relationships that could be construed as a potential conflict of interest.
Acknowledgment
We thank the clinicians and research nurses involved in recruiting the patients.
Supplementary Material
The Supplementary Material for this article can be found online at: http://journal.frontiersin.org/article/10.3389/fphar.2017.00323/full#supplementary-material
Footnotes
- ^ https://www.mysequenom.com/Tools
- ^ http://cran.r-project.org/web/packages/genetics/index.html
- ^ http://eqtl.uchicago.edu/cgi-bin/gbrowse/eqtl/
References
Aithal, G. P., Day, C. P., Kesteven, P. J. L., and Daly, A. K. (1999). Association of polymorphisms in the cytochrome P450 CYP2C9 with warfarin dose requirement and risk of bleeding complications. Lancet 353, 717–719. doi: 10.1016/S0140-6736(98)04474-2
Barrett, J. C., Fry, B., Maller, J., and Daly, M. J. (2005). Haploview: analysis and visualization of LD and haplotype maps. Bioinformatics 21, 263–265. doi: 10.1093/bioinformatics/bth457
Benjamini, Y., Drai, D., Elmer, G., Kafkafi, N., and Golani, I. (2001). Controlling the false discovery rate in behavior genetics research. Behav. Brain Res. 125, 279–284. doi: 10.1016/S0166-4328(01)00297-2
Borgiani, P., Ciccacci, C., Forte, V., Sirianni, E., Novelli, L., Bramanti, P., et al. (2009). CYP4F2 genetic variant (rs2108622) significantly contributes to warfarin dosing variability in the Italian population. Pharmacogenomics 10, 261–266. doi: 10.2217/14622416.10.2.261
Bourgeois, S., Jorgensen, A., Zhang, E. J., Hanson, A., Gillman, M. S., Bumpstead, S., et al. (2016). A multi-factorial analysis of response to warfarin in a UK prospective cohort. Genome Med. 8, 2. doi: 10.1186/s13073-015-0255-y
Budnitz, D. S., Shehab, N., Kegler, S. R., and Richards, C. L. (2007). Medication use leading to emergency department visits for adverse drug events in older adults. Ann. Intern. Med. 147, 755–765. doi: 10.7326/0003-4819-147-11-200712040-00006
Bylund, J., Bylund, M., and Oliw, E. H. (2001). cDNA cloning and expression of CYP4F12, a novel human cytochrome P450. Biochem. Biophys. Res. Commun. 280, 892–897. doi: 10.1006/bbrc.2000.4191
Bylund, J., Finnstrom, N., and Oliw, E. H. (1999). Gene expression of a novel cytochrome P450 of the CYP4F subfamily in human seminal vesicles. Biochem. Biophys. Res. Commun. 261, 169–174. doi: 10.1006/bbrc.1999.1011
Bylund, J., Hidestrand, M., Ingelman-Sundberg, M., and Oliw, E. H. (2000). Identification of CYP4F8 in human seminal vesicles as a prominent 19-hydroxylase of prostaglandin endoperoxides. J. Biol. Chem. 275, 21844–21849. doi: 10.1074/jbc.M001712200
Caldwell, M. D., Awad, T., Johnson, J. A., Gage, B. F., Falkowski, M., Gardina, P., et al. (2008). CYP4F2 genetic variant alters required warfarin dose. Blood 111, 4106–4112. doi: 10.1182/blood-2007-11-122010
Cui, X., Nelson, D. R., and Strobel, H. W. (2000). A novel human cytochrome P450 4F isoform (CYP4F11): cDNA cloning, expression, and genomic structural characterization. Genomics 68, 161–166. doi: 10.1006/geno.2000.6276
Delaneau, O., Marchini, J., and Zagury, J. F. (2012). A linear complexity phasing method for thousands of genomes. Nat. Methods 9, 179–181. doi: 10.1038/nmeth.1785
Dimas, A. S., Deutsch, S., Stranger, B. E., Montgomery, S. B., Borel, C., Attar-Cohen, H., et al. (2009). Common regulatory variation impacts gene expression in a cell type-dependent manner. Science 325, 1246–1250. doi: 10.1126/science.1174148
Edson, K. Z., Prasad, B., Unadkat, J. D., Suhara, Y., Okano, T., Guengerich, F. P., et al. (2013). Cytochrome P450-dependent catabolism of vitamin K: omega-hydroxylation catalyzed by human CYP4F2 and CYP4F11. Biochemistry 52, 8276–8285. doi: 10.1021/bi401208m
Gabriel, S. B., Schaffner, S. F., Nguyen, H., Moore, J. M., Roy, J., Blumenstiel, B., et al. (2002). The structure of haplotype blocks in the human genome. Science 296, 2225–2229. doi: 10.1126/science.1069424
Gage, B. F., Eby, C., Johnson, J. A., Deych, E., Rieder, M. J., Ridker, P. M., et al. (2008). Use of pharmacogenetic and clinical factors to predict the therapeutic dose of warfarin. Clin. Pharmacol. Ther. 84, 326–331. doi: 10.1038/clpt.2008.10
Gomes, A. M., Winter, S., Klein, K., Turpeinen, M., Schaeffeler, E., Schwab, M., et al. (2009). Pharmacogenomics of human liver cytochrome P450 oxidoreductase: multifactorial analysis and impact on microsomal drug oxidation. Pharmacogenomics 10, 579–599. doi: 10.2217/pgs.09.7
Hashizume, T., Imaoka, S., Hiroi, T., Terauchi, Y., Fujii, T., Miyazaki, H., et al. (2001). cDNA cloning and expression of a novel cytochrome P450 (CYP4F12) from human small intestine. Biochem. Biophys. Res. Commun. 280, 1135–1141. doi: 10.1006/bbrc.2000.4238
Hashizume, T., Imaoka, S., Mise, M., Terauchi, Y., Fujii, T., Miyazaki, H., et al. (2002). Involvement of CYP2J2 and CYP4F12 in the metabolism of ebastine in human intestinal microsomes. J. Pharmacol. Exp. Ther. 300, 298–304. doi: 10.1124/jpet.300.1.298
Hirani, V., Yarovoy, A., Kozeska, A., Magnusson, R. P., and Lasker, J. M. (2008). Expression of CYP4F2 in human liver and kidney: assessment using targeted peptide antibodies. Arch. Biochem. Biophys. 478, 59–68. doi: 10.1016/j.abb.2008.06.025
Howie, B. N., Donnelly, P., and Marchini, J. (2009). A flexible and accurate genotype imputation method for the next generation of genome-wide association studies. PLoS Genet. 5:e1000529. doi: 10.1371/journal.pgen.1000529
Jorgensen, A. L., Al-Zubiedi, S., Zhang, J. E., Keniry, A., Hanson, A., Hughes, D. A., et al. (2009). Genetic and environmental factors determining clinical outcomes and cost of warfarin therapy: a prospective study. Pharmacogenet. Genom. 19, 800–812. doi: 10.1097/FPC.0b013e3283317ab5
Kalsotra, A., Turman, C. M., Kikuta, Y., and Strobel, H. W. (2004). Expression and characterization of human cytochrome P450 4F11: Putative role in the metabolism of therapeutic drugs and eicosanoids. Toxicol. Appl. Pharmacol. 199, 295–304. doi: 10.1016/j.taap.2003.12.033
Kikuta, Y., Kato, M., Yamashita, Y., Miyauchi, Y., Tanaka, K., Kamada, N., et al. (1998). Human leukotriene B4 omega-hydroxylase (CYP4F3) gene: molecular cloning and chromosomal localization. DNA Cell Biol. 17, 221–230. doi: 10.1089/dna.1998.17.221
Kikuta, Y., Kusunose, E., Endo, K., Yamamoto, S., Sogawa, K., Fujii-Kuriyama, Y., et al. (1993). A novel form of cytochrome P-450 family 4 in human polymorphonuclear leukocytes. cDNA cloning and expression of leukotriene B4 omega-hydroxylase. J. Biol. Chem. 268, 9376–9380.
Kikuta, Y., Miyauchi, Y., Kusunose, E., and Kusunose, M. (1999). Expression and molecular cloning of human liver leukotriene B4 omega-hydroxylase (CYP4F2) gene. DNA Cell Biol. 18, 723–730. doi: 10.1089/104454999315006
Lefevre, C., Bouadjar, B., Ferrand, V., Tadini, G., Megarbane, A., Lathrop, M., et al. (2006). Mutations in a new cytochrome P450 gene in lamellar ichthyosis type 3. Hum. Mol. Genet. 15, 767–776. doi: 10.1093/hmg/ddi491
McDonald, M. G., Rieder, M. J., Nakano, M., Hsia, C. K., and Rettie, A. E. (2009). CYP4F2 is a vitamin K1 oxidase: an explanation for altered warfarin dose in carriers of the V433M variant. Mol. Pharmacol. 75, 1337–1346. doi: 10.1124/mol.109.054833
Montgomery, S. B., Sammeth, M., Gutierrez-Arcelus, M., Lach, R. P., Ingle, C., Nisbett, J., et al. (2010). Transcriptome genetics using second generation sequencing in a Caucasian population. Nature 464, 773–777. doi: 10.1038/nature08903
Myers, A. J., Gibbs, J. R., Webster, J. A., Rohrer, K., Zhao, A., Marlowe, L., et al. (2007). A survey of genetic human cortical gene expression. Nat. Genet. 39, 1494–1499. doi: 10.1038/ng.2007.16
Nagelkerke, N. J. D. (1991). A note on a general definition of the coefficient of determination. Biometrika 78, 691–692. doi: 10.1093/biomet/78.3.691
Pautas, E., Moreau, C., Gouin-Thibault, I., Golmard, J. L., Mahe, I., Legendre, C., et al. (2010). Genetic factors (VKORC1, CYP2C9, EPHX1, and CYP4F2) are predictor variables for warfarin response in very elderly, frail inpatients. Clin. Pharmacol. Ther. 87, 57–64. doi: 10.1038/clpt.2009.178
Perez-Andreu, V., Roldan, V., Anton, A. I., Garcia-Barbera, N., Corral, J., Vicente, V., et al. (2009). Pharmacogenetic relevance of CYP4F2 V433M polymorphism on acenocoumarol therapy. Blood 113, 4977–4979. doi: 10.1182/blood-2008-09-176222
Perini, J. A., Struchiner, C. J., Silva-Assuncao, E., and Suarez-Kurtz, G. (2010). Impact of CYP4F2 rs2108622 on the stable warfarin dose in an admixed patient cohort. Clin. Pharmacol. Ther. 87, 417–420. doi: 10.1038/clpt.2009.307
Pickrell, J. K., Marioni, J. C., Pai, A. A., Degner, J. F., Engelhardt, B. E., Nkadori, E., et al. (2010). Understanding mechanisms underlying human gene expression variation with RNA sequencing. Nature 464, 768–772. doi: 10.1038/nature08872
Purcell, S., Neale, B., Todd-Brown, K., Thomas, L., Ferreira, M. A., Bender, D., et al. (2007). PLINK: a tool set for whole-genome association and population-based linkage analyses. Am. J. Hum. Genet. 81, 559–575. doi: 10.1086/519795
Schadt, E. E., Molony, C., Chudin, E., Hao, K., Yang, X., Lum, P. Y., et al. (2008). Mapping the genetic architecture of gene expression in human liver. PLoS Biol. 6:e107. doi: 10.1371/journal.pbio.0060107
Schroder, A., Klein, K., Winter, S., Schwab, M., Bonin, M., Zell, A., et al. (2013). Genomics of ADME gene expression: mapping expression quantitative trait loci relevant for absorption, distribution, metabolism and excretion of drugs in human liver. Pharmacogenomics J. 13, 12–20. doi: 10.1038/tpj.2011.44
Schwanhausser, B., Busse, D., Li, N., Dittmar, G., Schuchhardt, J., Wolf, J., et al. (2011). Global quantification of mammalian gene expression control. Nature 473, 337–342. doi: 10.1038/nature10098
Sontag, T. J., and Parker, R. S. (2002). Cytochrome P450 omega-hydroxylase pathway of tocopherol catabolism. Novel mechanism of regulation of vitamin E status. J. Biol. Chem. 277, 25290–25296. doi: 10.1074/jbc.M201466200
Stephens, M., and Scheet, P. (2005). Accounting for decay of linkage disequilibrium in haplotype inference and missing-data imputation. Am. J. Hum. Genet. 76, 449–462. doi: 10.1086/428594
Stephens, M., Smith, N. J., and Donnelly, P. (2001). A new statistical method for haplotype reconstruction from population data. Am. J. Hum. Genet. 68, 978–989. doi: 10.1086/319501
Stranger, B. E., Nica, A. C., Forrest, M. S., Dimas, A., Bird, C. P., Beazley, C., et al. (2007). Population genomics of human gene expression. Nat. Genet. 39, 1217–1224. doi: 10.1038/ng2142
Takeuchi, F., McGinnis, R., Bourgeois, S., Barnes, C., Eriksson, N., Soranzo, N., et al. (2009). A genome-wide association study confirms VKORC1, CYP2C9, and CYP4F2 as principal genetic determinants of warfarin dose. PLoS Genet. 5:e1000433. doi: 10.1371/journal.pgen.1000433
Veyrieras, J. B., Kudaravalli, S., Kim, S. Y., Dermitzakis, E. T., Gilad, Y., Stephens, M., et al. (2008). High-resolution mapping of expression-QTLs yields insight into human gene regulation. PLoS Genet. 4:e1000214. doi: 10.1371/journal.pgen.1000214
Wadelius, M., Chen, L. Y., Lindh, J. D., Eriksson, N., Ghori, M. J., Bumpstead, S., et al. (2009). The largest prospective warfarin-treated cohort supports genetic forecasting. Blood 113, 784–792. doi: 10.1182/blood-2008-04-149070
Wang, M. Z., Saulter, J. Y., Usuki, E., Cheung, Y. L., Hall, M., Bridges, A. S., et al. (2006). CYP4F enzymes are the major enzymes in human liver microsomes that catalyze the O-demethylation of the antiparasitic prodrug DB289 [2,5-bis(4-amidinophenyl)furan-bis-O-methylamidoxime]. Drug Metab. Dispos. 34, 1985–1994. doi: 10.1124/dmd.106.010587
Wang, M. Z., Wu, J. Q., Bridges, A. S., Zeldin, D. C., Kornbluth, S., Tidwell, R. R., et al. (2007). Human enteric microsomal CYP4F enzymes O-demethylate the antiparasitic prodrug pafuramidine. Drug Metab. Dispos. 35, 2067–2075. doi: 10.1124/dmd.107.016428
Wysowski, D. K., Nourjah, P., and Swartz, L. (2007). Bleeding complications with warfarin use: a prevalent adverse effect resulting in regulatory action. Arch. Intern. Med. 167, 1414–1419. doi: 10.1001/archinte.167.13.1414
Yuan, H. Y., Chen, J. J., Lee, M. T., Wung, J. C., Chen, Y. F., Charng, M. J., et al. (2005). A novel functional VKORC1 promoter polymorphism is associated with inter-individual and inter-ethnic differences in warfarin sensitivity. Hum. Mol. Genet. 14, 1745–1751. doi: 10.1093/hmg/ddi180
Zeller, T., Wild, P., Szymczak, S., Rotival, M., Schillert, A., Castagne, R., et al. (2010). Genetics and beyond–the transcriptome of human monocytes and disease susceptibility. PLoS ONE 5:e10693. doi: 10.1371/journal.pone.0010693
Keywords: warfarin, pharmacogenetics, mRNA expression, CYP4F2, CYP4F11, CYP4F12
Citation: Zhang JE, Klein K, Jorgensen AL, Francis B, Alfirevic A, Bourgeois S, Deloukas P, Zanger UM and Pirmohamed M (2017) Effect of Genetic Variability in the CYP4F2, CYP4F11, and CYP4F12 Genes on Liver mRNA Levels and Warfarin Response. Front. Pharmacol. 8:323. doi: 10.3389/fphar.2017.00323
Received: 03 February 2017; Accepted: 15 May 2017;
Published: 31 May 2017.
Edited by:
Wanqing Liu, Purdue University, United StatesReviewed by:
Hyunyoung Jeong, University of Illinois at Chicago, United StatesMelih O. Babaoglu, Hacettepe University, Turkey
Copyright © 2017 Zhang, Klein, Jorgensen, Francis, Alfirevic, Bourgeois, Deloukas, Zanger and Pirmohamed. This is an open-access article distributed under the terms of the Creative Commons Attribution License (CC BY). The use, distribution or reproduction in other forums is permitted, provided the original author(s) or licensor are credited and that the original publication in this journal is cited, in accordance with accepted academic practice. No use, distribution or reproduction is permitted which does not comply with these terms.
*Correspondence: Munir Pirmohamed, munirp@liverpool.ac.uk