Mechanical and cracking behavior of porous rock models containing random circular defects under uniaxial compression
 Wenqiang Ma
 Can Cui1
 - 1College of Architecture and Civil Engineering, Xinyang Normal University, Xinyang, China
- 2School of Geographical Sciences, Xinyang Normal University, Xinyang, China
Circular defects are widely distributed in porous rock materials, and the defects greatly affect the mechanical behavior and crack evolution of rock masses. In this paper, numerical models containing random circular defects are constructed based on discrete element method. Then, the uniaxial compressions are numerically performed to reveal the influence of the porosity or size homogeneity of the defects on the mechanical behavior, crack evolution, and acoustic emission (AE) events of the models. The results suggest that a univariant increase in porosity leads to a nonlinear decrease in the peak strength and a linear decrease in the elastic modulus. The number of cracks and AE events decrease with increasing porosity. As the size homogeneity coefficient increases, the peak strengths show a slight linear rise, while the elastic modulus values show a minimal linear downward trend, and the number of cracks and AE events show wave-like increases. The cracks first appear at the location with dense defects, and the cracks initiate from the top and bottom of the circular holes. The crack propagation and intersection modes between two adjacent defects are affected by their positions. These findings provide a reference for the fracture mechanism of rock with random circular defects.
1 Introduction
Rock is a type of heterogeneous material that contains various kinds of flaws and defects (i.e., cracks, fissures, joints, bedding planes, pores, and holes). All these flaws and defects dramatically influence the mechanical responses, deformation behavior, and failure process of the rock material. Numerous experimental and numerical studies have been performed to investigate the influencing law of the flaw size, shape, distribution, and various flaw combinations on the failure behaviors and cracking development of rock or rock-like materials. Linear flaws, such as cracks [1–3], fissures [4, 5], joints [6–8], and bedding planes [9], have been extensively studied by many researchers [10–13]. Nevertheless, the research literature on the influence of pore-like flaws (i.e., circular holes, openings, and pores) on rock failure behavior is relatively limited. Among these studies, rock or rock-like specimens containing a single circular hole or opening were the most common research objects in the laboratory and numerical studies [14–22], as depicted in Figure 1. The variations of the circular hole’s position and size both affect the strength, acoustic emission (AE) characteristics, and fracture propagation of these specimens. Additionally, some rock or rock-like specimens containing double and three circular or rectangular openings have also been viewed as research targets, as depicted in Figure 2, and have been constantly analyzed and discussed by some researchers [15, 16, 23]. Moreover, some combination forms of flaws (i.e., one circular opening and one linear crack [24–26], one circular opening and some regularly arranged linear cracks [27, 28]) are also prefabricated into rock or rock-like specimens to examine their influences on the rock failure process (see Figure 3).
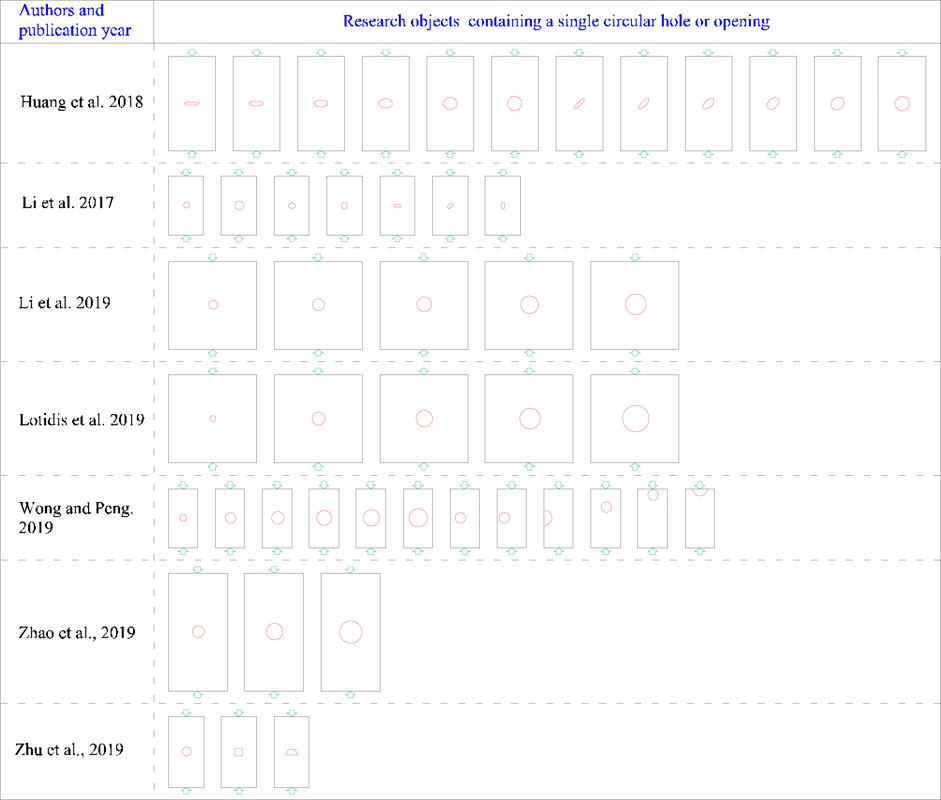
FIGURE 1. Rock or rock-like specimens containing a single circular hole or opening.
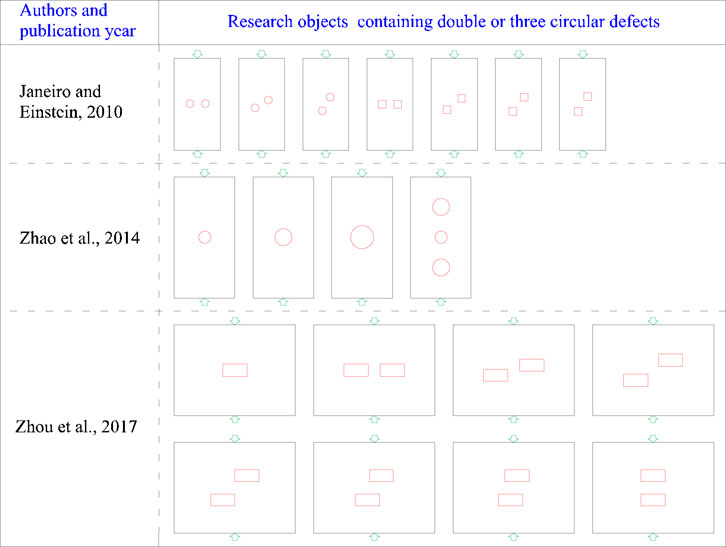
FIGURE 2. Rock or rock-like specimens containing double and three circular or rectangular openings.
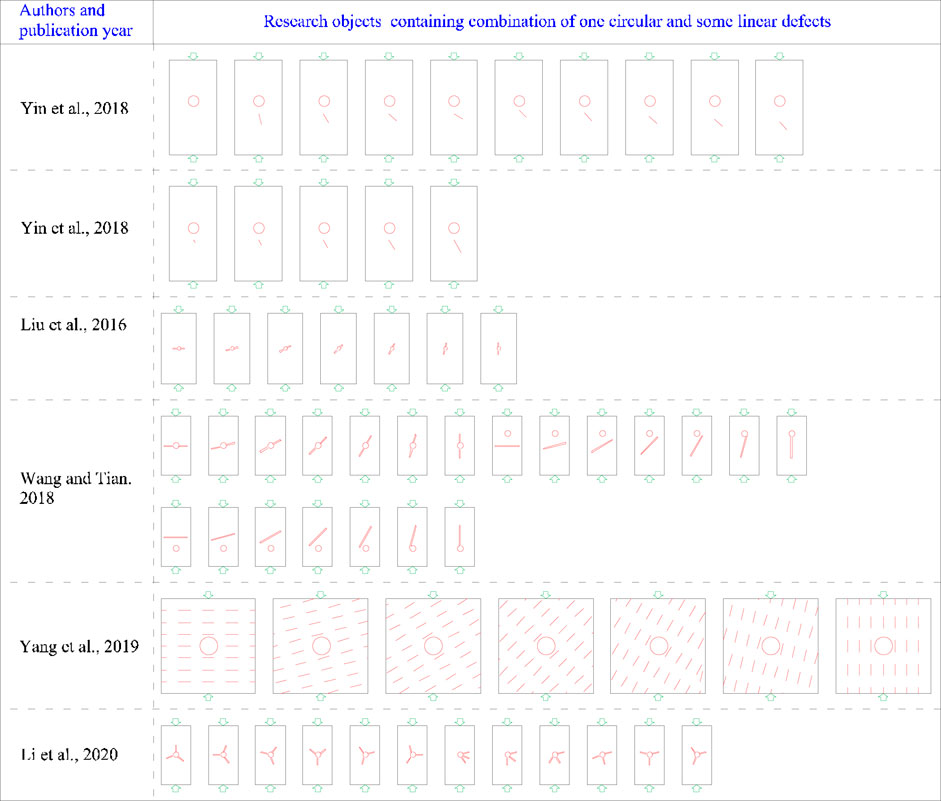
FIGURE 3. Rock or rock-like specimens containing combination of one circular and some linear defects.
However, most circular pores or openings in rock are randomly distributed, and their sizes are not uniform. Recently, increasing attention has been given by scholars to the influence of randomly distributed pores on rock strength, microcracking behavior and failure patterns [29–36], as shown in Figure 4. The related research results indicate that the distribution, size, position, and number of random pores all have influence on the mechanical and failure behavior of rock or rock-like materials. As the random pores have different sizes, how to define the size homogeneity and evaluate the influence of the homogeneity index on rock mechanical behavior, microcracking process, and failure pattern have been key issues worthy of research and discussion.
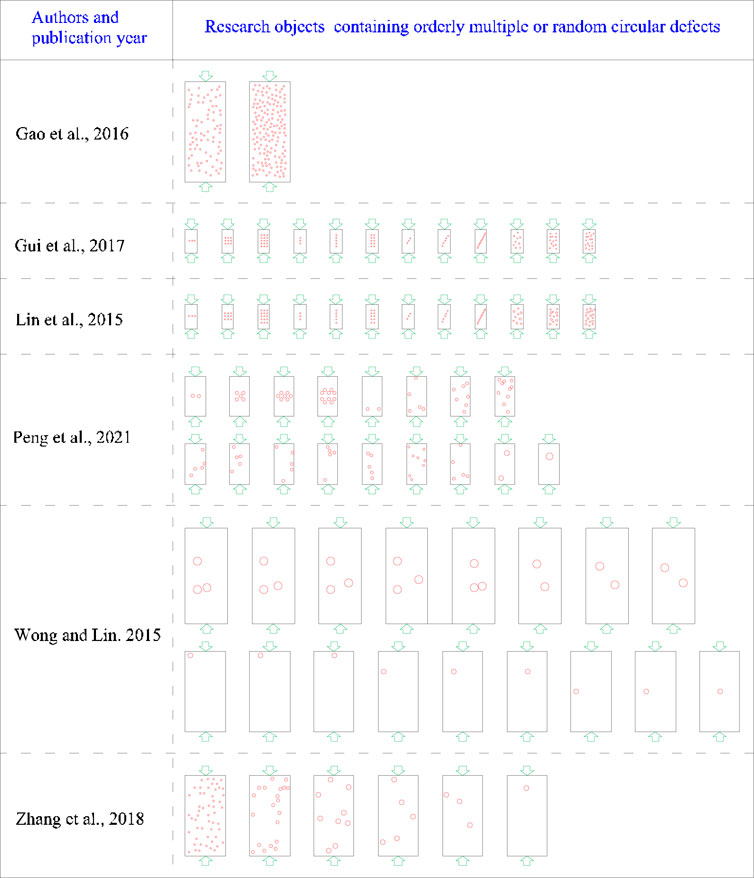
FIGURE 4. Rock or rock-like specimens containing orderly multiple defects or random defects.
Therefore, in this paper, the Weibull distribution function was introduced to define the size homogeneity index of random circular defects in porous rock material. As it is extremely difficult to obtain experimental rock or rock-like specimens containing random circular defects with various sizes in laboratory, numerical simulation praised by many researchers, has been an effective method to implement corresponding studies on rock failure. In this paper, the particle flow code in two dimensions (PFC2D) was used to build numerical models containing random circular defects with various sizes and porosities based on self-compiled FISH programs. Then, a suite of simulations was performed to investigate the influence of defect size homogeneity and porosities on the mechanical behaviors and crack initiation (CI), propagation, and intersection characteristics of porous rock models.
2 Construction of numerical models containing random circular defects
PFC2D is capable of representing grain-scale microstructural features directly by considering the grains in an actual rock as an assembly of discrete particles [37, 38]. This code can capture and reflect crack initiation, propagation, and intersection in rock specimens better than earlier models constructed in the continuous medium software, and it can be computed rapidly and efficiently [2, 39]. Therefore, it is used in this paper to conduct correlational numerical research.
Relevant literature has shown that the Weibull distribution can better reflect the heterogeneity of the mechanical properties of rocks and rock-like materials [40, 41]. The heterogeneity of mechanical properties can be regarded as the influencing effect of flaws with different sizes. Therefore, in this paper, it is assumed that the sizes of the circular defects in the model obey the Weibull distribution, and then the related programs could be compiled through FISH language in PFC software to construct models containing random circular defects with heterogeneous sizes.
2.1 Weibull distribution and its application
From the perspective of statistics and probability theory, the Weibull distribution is a continuous probability distribution, and its probability density function is shown in Eq. 1.
where u is the value of the parameter (radius of the circular defect) satisfying the distribution, u0 is the average value of characteristic parameters, and m is the shape parameter of the Weibull distribution, i.e., the homogeneity coefficient.
Equation 1 reflects the distribution law of the sizes of random circular defects varying with the homogeneity coefficient m. When m is small, the size distribution of random circular defects is discrete, and the heterogeneity degree is high; when m is large, the size distribution of random circular defects is relatively concentrated, indicating that the circular defects are more uniform in size. The Weibull distribution probability density curve of circular defect sizes under various homogeneity coefficients is shown in Figure 5.
FIGURE 5. Weibull distribution probability density of random circular defects with various size homogeneity coefficients.
After integrating the probability density function of the Weibull distribution, the random variable obeying a uniform distribution can be transformed into a variable that obeys the Weibull distribution through the transformation relationship between the uniform distribution and the Weibull distribution. After transformation, if the random variable R obeys the uniform distribution of [0–1], then Y will obey the Weibull distribution (see Eq. 2). According to Eq. 2, a self-compiled program was obtained using the built-in FISH language of PFC software. This program can effectively realize the generation of random circular defects with various sizes in the model.
2.2 Model construction process
The construction process of the whole model requires several steps. In addition to the FISH program in Section 2.1, several other self-compiled programs are also necessary to build the model. The detailed modeling steps are as follows. First, the model dimension is determined, and the four surrounding walls are built. Second, a FISH program is compiled to generate a group of random circular particles. The center positions of these particles obey a uniform distribution, and the radii of these particles follow the Weibull distribution. The area ratio of random particles to the whole model can be controlled by the FISH program to obtain different model porosities. Third, the coordinates, radii, and ID numbers of these random particles were exported to a text document from the model. Fourth, the random particles generated in step 2 were deleted, and much smaller particles were filled into the whole model area. Fifth, the basic information of the random particles stored in step 3 was imported into the model and used to build circular walls. Sixth, the small particles in these circular walls were deleted, and these circular walls were subsequently deleted. Then, the models containing random circular defects were created successfully. A simple modeling process is depicted in Figure 6.
FIGURE 6. Construction process of the models containing random circular defects.
As shown in Figure 6, the numerical model is 50 mm in width and 100 mm in height. The particles are bonded together through many contacts. The particle radii exhibit a uniform distribution between the minimum and maximum radii (see Table 1). The flat joint model (FJM) is chosen as the contact bond model of intact rock to simulate the mechanical behavior between micrograins because it is capable of overcoming the defects, i.e., the lower ratio of compression to tension strength, smaller internal frictional angle and the linear strength envelope, of the parallel bonded model (PBM).
TABLE 1. Summary of the calibrated mesoparameters of the flat-joint model.
2.3 Mesoparameter calibration
The calibrated mesoparameters of the numerical models are summarized in Table 1. This set of mesoparameters has been verified to be capable of reproducing the strength and deformation behavior, as well as the associated crack propagation of rock specimens under various loading conditions [42]. Uniaxial compression simulations of the numerical models containing random circular defects were conducted based on this set of mesoparameters. The influence of the porosity and size homogeneity of random circular defects on rock mechanical characteristics and the associated crack evolution were then analyzed and discussed.
2.4 Numerical simulation scheme
To study the influence of the porosity and the size homogeneity of random circular defects on the mechanical characteristics and microcracking behavior of the rock models, two types of models were constructed based on the method of Section 2.1, as depicted in Figure 7 and Figure 8. The average radius (u0 in Eq. 2) for these models is 2 mm. The two different types of the models both have six groups, and each group has three models. To save space, only one model in each group is listed here. The size homogeneity coefficient of the random circular defects in the first type of model remains an unchanged value of 1.9, but the porosity of the models between groups varies from 5% to 30% in increments of 5% (see Figure 7). The models in the second type have a constant porosity value of 10%, but the size homogeneity coefficients of the defects in the models between groups are designed as a changing list of 1.2, 1.6, 2.0, 4.0, 6.0, and 8.0 (see Figure 8).
FIGURE 7. Numerical models containing random circular defects under different porosities (Group 3#, m = 1.9).(A) p = 5% (B) p = 10% (C) p = 15% (D) p = 20% (E) p = 25% (F) p = 30%.
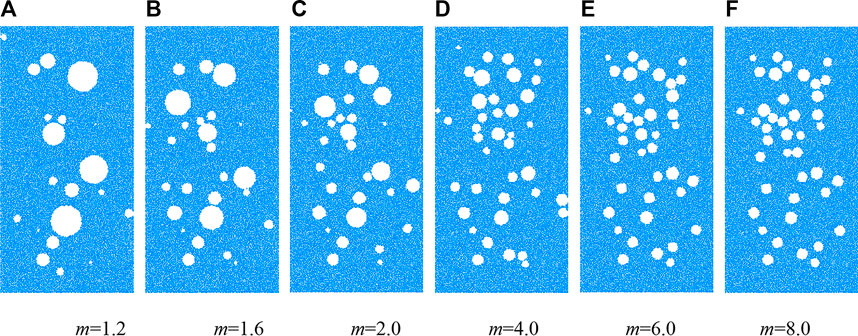
FIGURE 8. Numerical models containing random circular defects with various size homogeneity coefficients (Group 2#, p = 10%).(A) m = 1.2 (B) m = 1.6 (C) m = 2.0 (D) m = 4.0 (E) m = 6.0 (F) m = 8.0.
3 Simulation results
In this section, the influence of the porosity and the size homogeneity of random circular defects on the simulation results, including deformation and strength behavior, crack evolution, and AE event characteristics, are examined and discussed.
3.1 Deformation and strength behaviors
The stress-strain curves of the numerical models containing random circular defects are shown in Figure 9. As the porosity of the random circular defects increases, the post-peak parts of the stress-strain curves change from a steep drop to a gentle one, implying that the models have undergone a deformation transformation from brittle to ductile. The slope of the linear part of the stress-strain curve also decreases with increasing porosity, indicating that the elastic modulus values of these models show a linear decline (see Figure 10A). As shown in Figure 11A, the peak strengths of the models containing circular defects show a nonlinear decline with increasing porosity. These simulation results are in good accordance with the findings simulated in previous studies [30, 33, 34, 36].
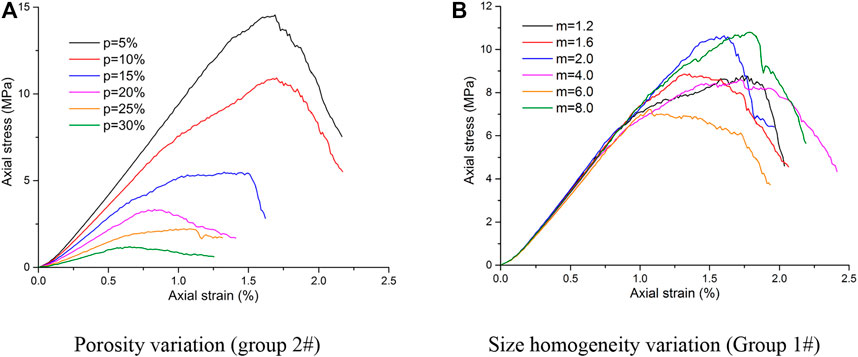
FIGURE 9. Stress-strain curves of the models containing random circular defects.(A) Porosity variation (group 2#) (B) Size homogeneity variation (Group 1#).
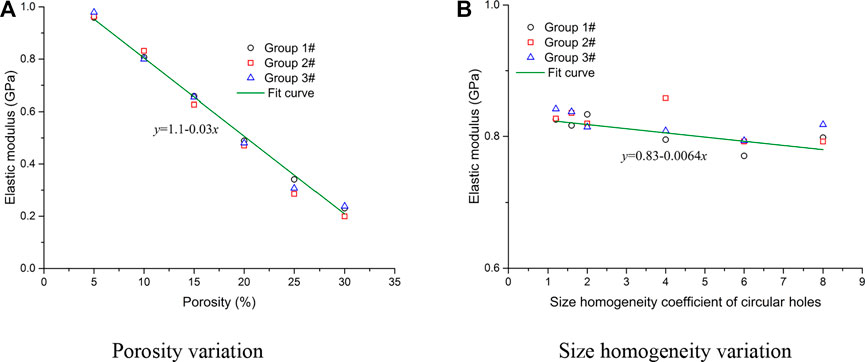
FIGURE 10. Fitting results of the elastic modulus values of the models containing random circular defects.(A) Porosity variation (B) Size homogeneity variation.
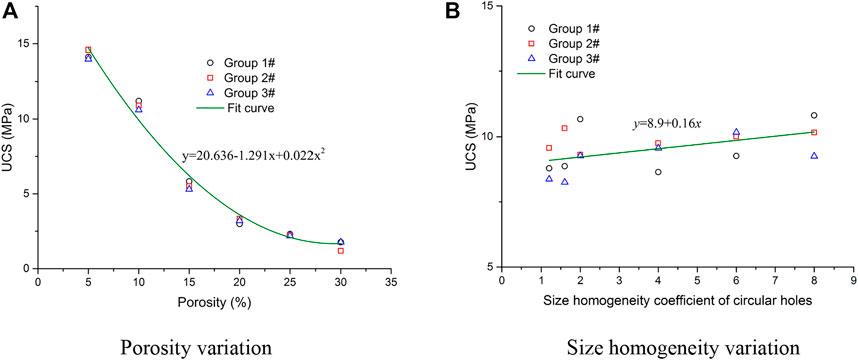
FIGURE 11. Fitting results of the peak strengths of the models containing random circular defects. (A) Porosity variation (B) Size homogeneity variation.
However, it is another changing characteristic for the models containing circular defects with various size homogeneity coefficients. As the size homogeneity coefficient increases (see Figure 9B), the elastic parts of the stress-strain curves coincide with each other, and the fitting results of the elastic modulus show a minimal linear downward trend (see Figure 10B). While the stress-strain curves show obvious fluctuations after entering the yield stage, the fitting results of the peak strengths show a slight linear rise with increasing size homogeneity coefficient of the circular defects (see Figure 11B).
3.2 Crack evolution and AE event characteristics
The failure of rock materials is a progressive process of damage accumulation. This process is often accompanied by crack initiation, propagation, and intersection. The generation of a group of cracks that are close in time and space can send out a series of acoustic signals that can be considered an acoustic emission (AE) event. The failure process of rock is always accompanied by many AE events of different intensity levels. The type, location, and quantity of cracks can be tracked and recorded with time in PFC by compiling FISH programs. In this paper, cracks occurring within a certain strain increment range are regarded as an AE event, and the total crack number at this strain interval is regarded as the AE event intensity level. To obtain the crack evolution law and AE event count during the entire compressive process, several self-compiled FISH programs were embedded into the PFC2D software to record the cumulative counts of the shear cracks, tension cracks, and AE events in the model.
1) Models containing random circular defects with increasing porosity
The variation curves of the crack amount and the AE intensity histograms of the numerical models containing random circular defects with increasing porosity are shown in Figure 12. The crack amount and the AE intensity both decrease with increasing porosity, but the cumulative AE events before the peak stress increase. When the porosity is less than 15%, there is little difference in the number of tensile and shear cracks, and they change in stages. There are more tensile cracks than shear cracks before the peak stress point, and then the number of shear cracks gradually exceeds that of tensile cracks. When the porosity is greater than 20%, the number of tensile cracks is always much greater than that of shear cracks.
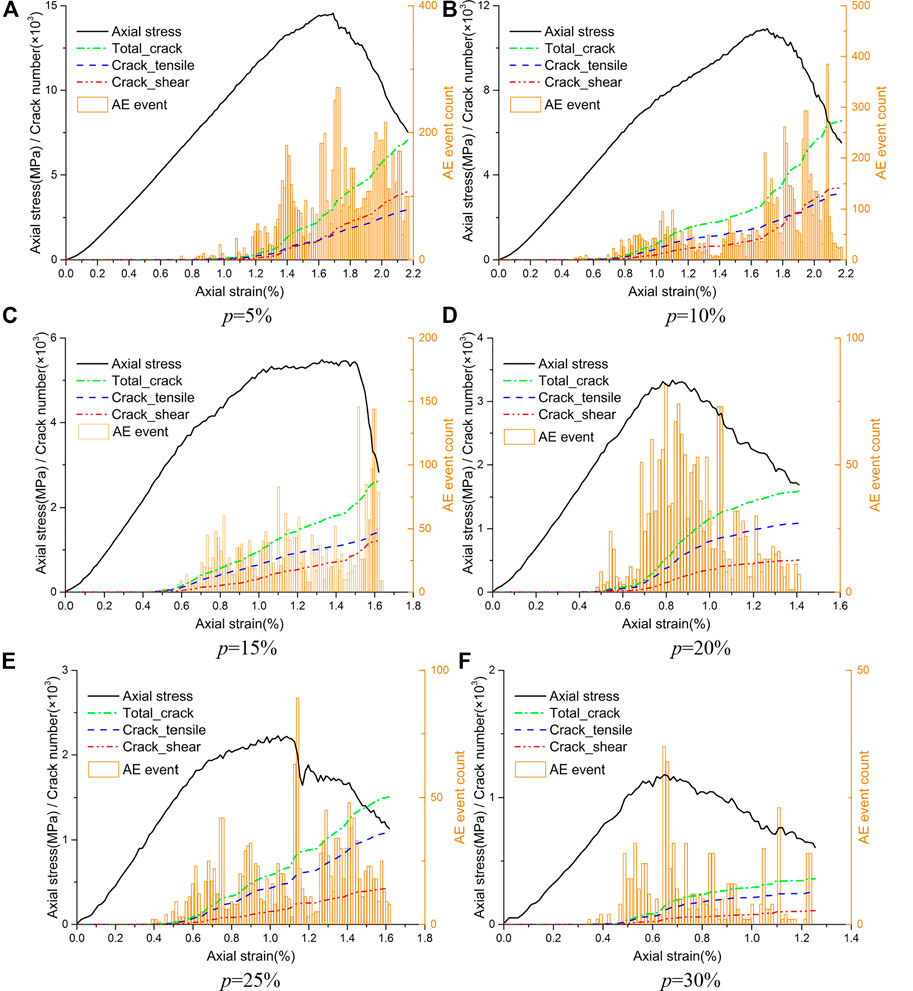
FIGURE 12. Crack development and AE event count of the models with increasing defect porosity. (A) p = 5% (B) p = 10%. (C) p = 15% (D) p = 20%. (E) p = 25% (F) p = 30%.
In addition, the number of tensile cracks, shear cracks and AE event intensities of the models with increasing porosity at peak stress are all extracted and illustrated in Figure 13. The three groups of data all indicate that the tensile crack, shear crack, and AE event intensities at peak stress decrease with increasing porosity.
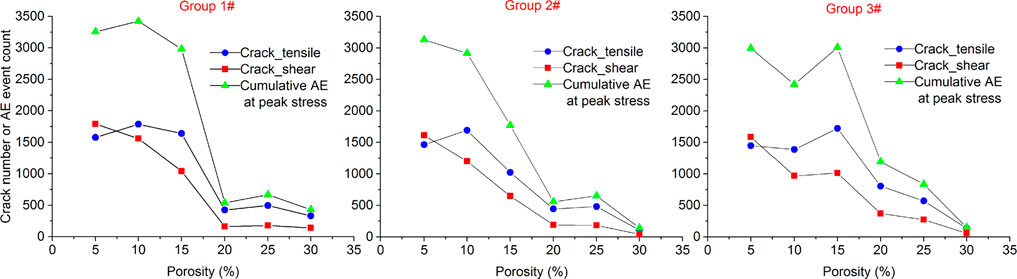
FIGURE 13. Crack number and AE event count of the models at peak stress with increasing defect porosity.
Figure 14 illustrates the crack distribution of the models having different porosities of random circular defects at 60% of the peak stress after failure. The red and blue lines in Figure 14 represent the shear and tensile cracks that occurred in the model under uniaxial compression, respectively. The Arabic numerals that follow the color legends are the numbers of the corresponding cracks. The number of total cracks, shear cracks, and tensile cracks in the failed specimens all decrease with increasing defect porosity. Furthermore, Figure 14 also indicates that the proportion of tensile cracks in the total cracks increases with increasing defect porosity.
2) Models containing random circular defects with various size homogeneity coefficients
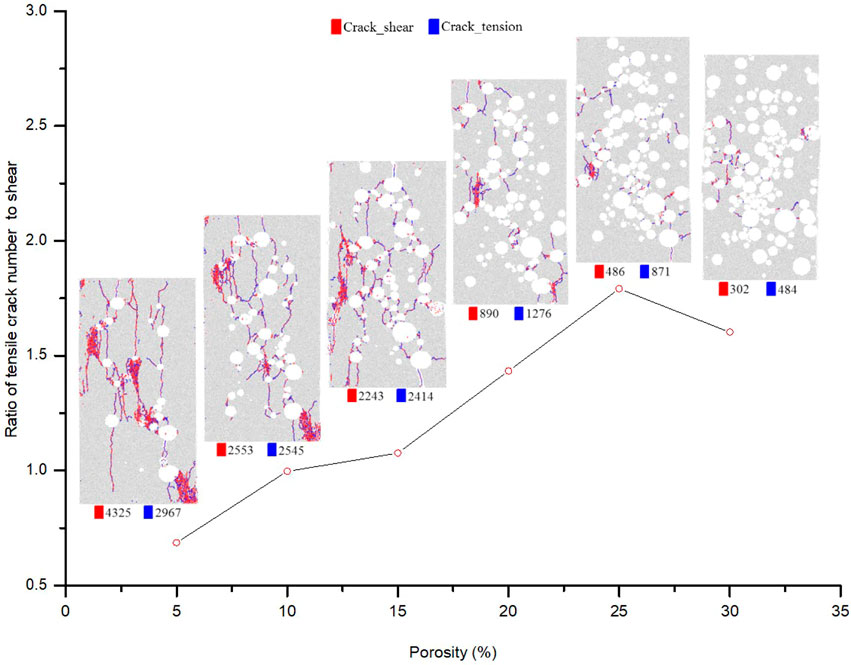
FIGURE 14. Crack distribution of the failure models with increasing defect porosity.
The variation curves of the crack amount and the AE intensity histograms of the numerical models containing random circular defects with increasing size homogeneity coefficient are shown in Figure 15. The crack amount and the AE event intensity increase with increasing size homogeneity of the defects. The AE events after peak stress also increase with increasing size homogeneity of the defects. Tensile cracks are the dominant crack type, especially in the stage before the peak stress.
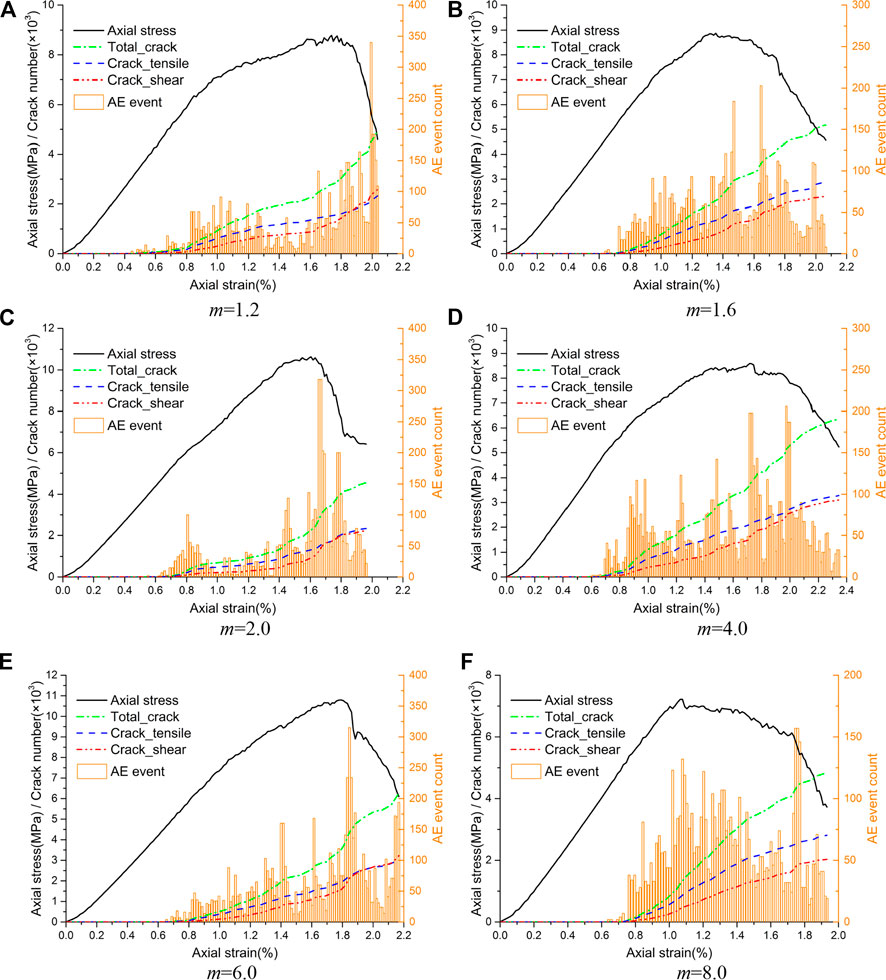
FIGURE 15. Crack development and AE event count of the models with increasing size homogeneity coefficient of the defects. (A) m = 1.2 (B) m = 1.6. (C)m = 2.0 (D) m = 4.0. (E) m = 6.0 (F) m = 8.0.
In addition, the number of tensile cracks, shear cracks, and AE event intensity levels of the models with various size homogeneity coefficients of the defects at peak stress are all extracted and illustrated in Figure 16. Three groups of data indicate that the tensile crack, shear crack and AE event intensity at peak stress all show wave-like increases with increasing size homogeneity of the defects.
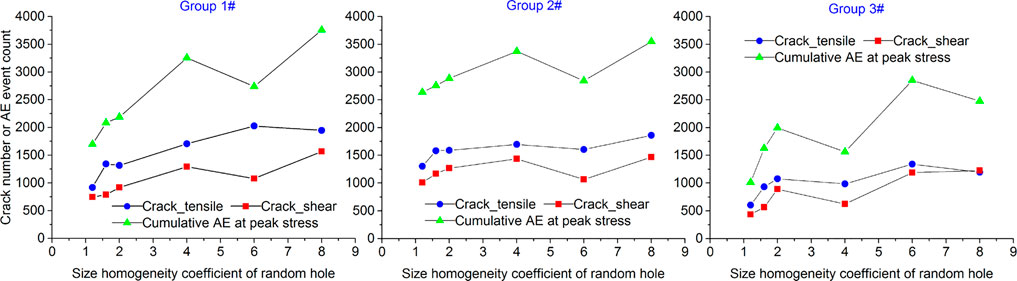
FIGURE 16. Crack number and AE event count at peak stress with increasing size homogeneity coefficient of the defects.
Figure 17 illustrates the crack distribution of the models containing random circular defects with various size homogeneity coefficients at 60% of the peak stress after failure. The number of total cracks, shear cracks, and tensile cracks in the failed models all show wave-like increases with increasing size homogeneity coefficient of the defects. Furthermore, the proportion of tensile cracks in the total cracks also shows a wave-like increase with increasing size homogeneity of the defects.
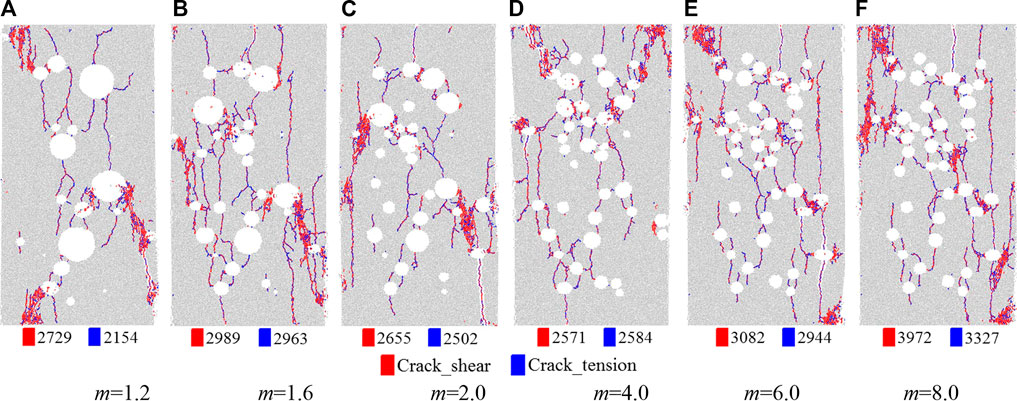
FIGURE 17. Crack distribution of the models with increasing size homogeneity coefficient of the defects (p = 10%). (A) m = 1.2 (B) m = 1.6 (C) m = 2.0 (D) m = 4.0 (E) m = 6.0 (F) m = 8.0.
3.3 Crack initiation, intersection and development characteristics
1) Crack initiation stress of the models containing random circular defects
Natural rock materials usually contain a large number of micropores, microcracks, and other defects. The stiffness degradation and failure of rock are often caused by the initiation and propagation of these defects. To determine the initiation mechanism of rock, we must first clarify the stress level at which the rock begins to crack. In this paper, according to the relevant research literature [43], the CI stress is defined as the axial compressive stress when the number of cracks is 1% of the total cracks at the peak stress. The CI stress values of models containing random circular defects with different porosities and size homogeneity are extracted and made into a scatter diagram, and the fitting results are shown in Figure 18. The CI stress decreases in a quadratic curve with increasing defect porosity, but the decreasing rate gradually slows down. The influence of the size homogeneity coefficients on the CI stress of the models changes exponentially, and the influence is more significant when the homogeneity coefficient is less than 4.
2) Crack initiation, propagation and intersection mechanism
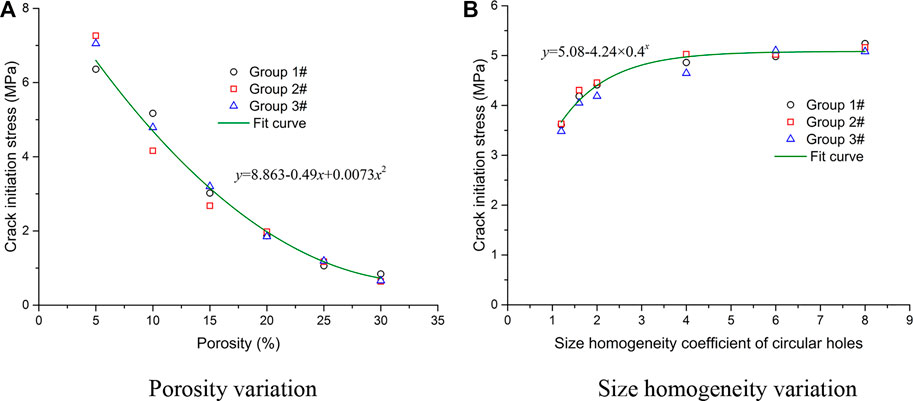
FIGURE 18. Fitting results of the CI stress values of the models containing random circular defects. (A) Porosity variation (B) Size homogeneity variation.
To study the crack initiation, propagation and intersection mechanism of the models containing random circular defects, two models having the same porosity and different size homogeneity coefficients of the defects are selected to analyze the crack propagation characteristics during compression. As shown in Figure 19, tensile cracks are the main crack type during the stage from crack initiation to the peak stress point, and then the number of shear cracks increases rapidly and finally exceeds the number of tensile cracks. After the model reaches the peak strength, its internal structure is destroyed, and the cracks rapidly propagate, intersect, and combine with each other to form macro fracture surfaces. Then, the deformation of rock mainly shows sliding along the macro fracture surfaces, resulting in the rapid growth of shear cracks.
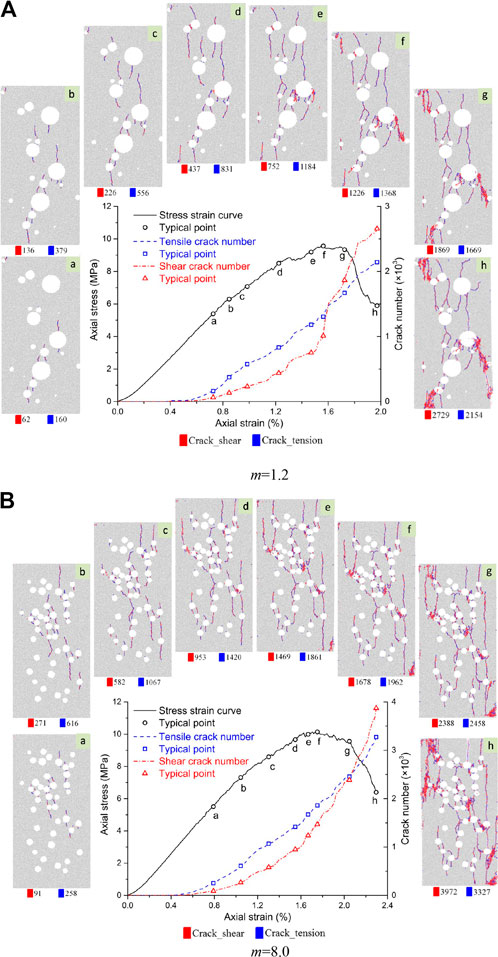
FIGURE 19. Stress-strain curves and crack number evolution of the models containing random circular defects (p = 10%). (A) m = 1.2. (B) m = 8.0.
To observe the progressive propagation process of cracks more intuitively, eight typical points ((a-f) in Figure 19) are selected from crack initiation to final failure of the model, and the crack propagation and distribution corresponding to each point is also displayed simultaneously. The cracks first appear at the location of dense defects, and the crack initiation positions usually start from the top and bottom of the circular defects. The direction of crack initiation and propagation is consistent with the loading direction, and tensile cracks (blue lines) are the main crack type.
When the crack just begins to initiate and propagate, depicted as the red lines in Figure 20, the circular and its cracks is like a bead threaded by a string. Subsequently, the propagation and intersection direction of cracks are affected by the adjacent defects. Two adjacent defects can be regarded as a basic unit to illustrate the crack propagation and intersection after crack initiation. As the circular defects are randomly distributed, the angle (α, see Figure 20) between the loading direction and the centerline of two adjacent defects changes. As depicted in Figures 19, 20, there are three basic modes of crack propagation between two circular defects. The crack propagates along the loading direction after initiation and connects the two defects when α approaches 0°. When α approaches 90°, the cracks of the two adjacent defects only propagate along the initiation direction, and no intersection cracks appear. When
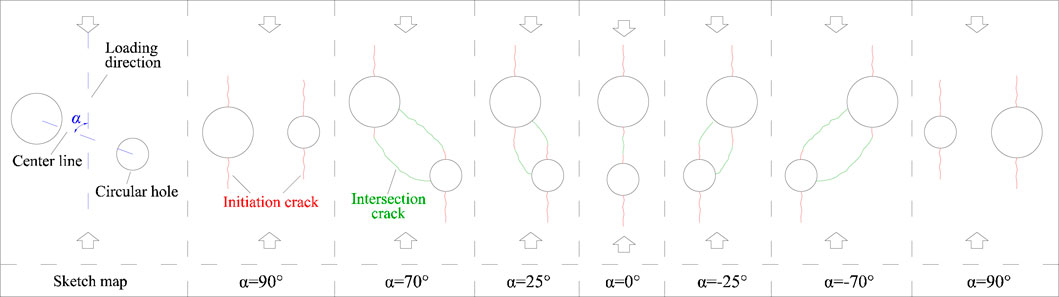
FIGURE 20. Basic crack initiation, propagation, and intersection mode of two adjacent circular defects.
4 Conclusion
The following conclusions can be drawn from numerical simulations of the uniaxial compression of the models containing random circular defects.
1) The porosity of the circular defects significantly affects the strength and deformation properties of the models containing random circular defects. As the porosity increases, the model undergo a deformation transformation from brittle to ductile, and the peak strengths and elastic modulus values show a nonlinear and a linear decline, respectively. However, the size homogeneity of the circular defects has a slight impact on the mechanical behaviors of the models containing random circular defects. As the size homogeneity coefficient increases, the peak strengths show a slight linear rise, while the elastic modulus values show a minimal linear downward trend.
2) Tensile cracks are the dominant crack type, especially in the stage before the peak stress. The porosity of the circular defects significantly affects the crack number, crack type and AE event intensity of the models containing random circular defects. The number of tensile cracks, shear cracks and AE events all decrease with increasing porosity. There is little difference in the number of tensile and shear cracks when the porosity is less than 15%. However, the number of tensile cracks is always much greater than that of shear cracks when the porosity exceeds 20%. The size homogeneity of the circular defects has a certain degree of influence on the crack number, crack type and AE event intensity of the models containing random circular defects. The number of tensile cracks, shear cracks, and AE events all show wave-like increases with increasing size homogeneity of the circular defects. The proportion of tensile cracks in the total cracks of the failure models also shows a wave-like increase with increasing size homogeneity of the circular defects.
3) The porosity and size homogeneity of the random circular defects significantly affect the CI stresses of the models. The CI stress decreases in a quadratic curve with increasing defect porosity, but the decreasing rate gradually slows down. The influence of the size homogeneity coefficients on the CI stresses of the models changes exponentially, and the influence is more significant when the size homogeneity coefficient is less than 4.
4) Tensile cracks are the main crack type during the stage from crack initiation to the peak stress point, and after that, the number of shear cracks increases rapidly and finally exceeds that of tensile cracks. The cracks first appear at the location with dense defects, and the crack initiation positions start from the top and bottom of the circular holes. The direction of crack initiation and propagation is consistent with the loading direction. The propagation and intersection direction of the cracks are significantly affected by adjacent defects. There are three basic modes of crack propagation between the circular defects. When the centerline of two adjacent defects is parallel to the loading direction, the crack propagates along the loading direction after initiation and connects the two holes. When the centerline of two adjacent defects is perpendicular to the loading direction, the cracks only propagate along the initiation direction, and no intersection cracks appear. When the included angle between the centerline and the loading direction is an acute angle, one defect will attract the closer initiation crack of another defect to change its initiation direction, propagate to itself and finally intersect with each other. In addition, a small number of cracks that are not induced by the defects are also found at the corners and edges of the model, and these cracks mostly appear after the peak stress.
Data availability statement
The original contributions presented in the study are included in the article/supplementary material, further inquiries can be directed to the corresponding author.
Author contributions
All authors listed have made a substantial, direct, and intellectual contribution to the work and approved it for publication.
Funding
This research is financially supported by the Science and Technology Project of Henan Province (Grant No. 202102310569), the Nanhu Young Scholars Program of Xinyang Normal University, the Natural Science Foundation of Henan Province (Grant No. 212300410231), the Graduate Student Innovation Fund Project of Xinyang Normal University and the Itasca Consulting Group through its Itasca Education Partnership (IEP) program. The authors gratefully acknowledge the financial or instructional support provided by them.
Conflict of interest
The authors declare that the research was conducted in the absence of any commercial or financial relationships that could be construed as a potential conflict of interest.
Publisher’s note
All claims expressed in this article are solely those of the authors and do not necessarily represent those of their affiliated organizations, or those of the publisher, the editors and the reviewers. Any product that may be evaluated in this article, or claim that may be made by its manufacturer, is not guaranteed or endorsed by the publisher.
References
1. Cheng Y, Jiao YY, Tan F. Numerical and experimental study on the cracking behavior of marble with en-echelon flaws. Rock Mech Rock Eng (2019) 52:4319–38. doi:10.1007/s00603-019-01849-x
2. Huang CC, Yang WD, Duan K, Fang LD, Wang L, Bo CJ. Mechanical behaviors of the brittle rock-like specimens with multi-non-persistent joints under uniaxial compression. Constr Build Mater (2019) 220:426–43. doi:10.1016/j.conbuildmat.2019.05.159
3. Zhao C, Niu JL, Zhang QZ, Zhao CF, Zhou YM. Failure characteristics of rock-like materials with single flaws under uniaxial compression. Bull Eng Geol Environ (2019) 78(1):593–603. doi:10.1007/s10064-018-1379-2
4. Yang SQ, Huang YH. An experimental study on deformation and failure mechanical behavior of granite containing a single fissure under different confining pressures. Environ Earth Sci (2017) 76:364. doi:10.1007/s12665-017-6696-4
5. Huang YH, Yang SQ, Tian WL. Crack coalescence behavior of sandstone specimen containing two pre-existing flaws under different confining pressures. Theor Appl Fracture Mech (2019) 99:118–30. doi:10.1016/j.tafmec.2018.11.013
6. Bahrani N, Kaiser PK. Numerical investigation of the influence of specimen size on the unconfined strength of defected rocks. Comput Geotech (2016) 77:56–67. doi:10.1016/j.compgeo.2016.04.004
7. Farahmand K, Vazaios I, Diederichs MS, Vlachopoulos N. Investigating the scale-dependency of the geometrical and mechanical properties of a moderately jointed rock using a synthetic rock mass (SRM) approach. Comput Geotech (2018) 95:162–79. doi:10.1016/j.compgeo.2017.10.002
8. Chen S, Qiao CS. Composite damage constitutive model of jointed rock mass considering crack propagation length and joint friction effect. Arab J Geosci (2018) 11:283. doi:10.1007/s12517-018-3643-y
9. Chong ZH, Li XH, Hou P. Experimental and numerical study of the effects of layer orientation on the mechanical behavior of shale. Arab J Sci Eng (2019) 44:4725–43. doi:10.1007/s13369-018-3533-3
10. Moomivand H. Effects of orientation, frequency, and number of sets of discontinuities on rock strength under triaxial stresses. Arab J Geosci (2014) 7(12):5345–52. doi:10.1007/s12517-013-1069-0
11. Gao FQ, Kang HP. Effects of pre-existing discontinuities on the residual strength of rock mass - insight from a discrete element method simulation. J Struct Geol (2016) 85:40–50. doi:10.1016/j.jsg.2016.02.010
12. Ma WQ, Wang TX. Numerical study of the influence of joint angle on the failure behavior of randomly and nonpersistently jointed rock mass. Arab J Sci Eng (2020) 45(5):4023–36. doi:10.1007/s13369-020-04361-5
13. Chen LL, Wang ZW, Peng X, Yang JF, Wu PF, Lian HJ. Modeling pressurized fracture propagation with the isogeometric BEM. Geomech Geophys Geo-energ Geo-resour (2021) 7:51. doi:10.1007/s40948-021-00248-3
14. Wong RHC, Lin P, Tang CA. Experimental and numerical study on splitting failure of brittle solids containing single pore under uniaxial compression. Mech Mater (2006) 38:142–59. doi:10.1016/j.mechmat.2005.05.017
15. Janeiro R, Einstein H. Experimental study of the cracking behavior of specimens containing inclusions (under uniaxial compression). Int J Fract (2010) 164:83–102. doi:10.1007/s10704-010-9457-x
16. Zhao XD, Zhang HX, Zhu WC. Fracture evolution around pre-existing cylindrical cavities in brittle rocks under uniaxial compression. Trans Nonferrous Met Soc China (2014) 24:806–15. doi:10.1016/S1003-6326(14)63129-0
17. Liu JP, Li YH, Xu SD, Xu S, Jin CY, Liu ZS. Moment tensor analysis of acoustic emission for cracking mechanisms in rock with a pre-cut circular hole under uniaxial compression. Eng Fract Mech (2015) 135:206–18. doi:10.1016/j.engfracmech.2015.01.006
18. Li DY, Zhu QQ, Zhou ZL, Li XB, Ranjith PG. Fracture analysis of marble specimens with a hole under uniaxial compression by digital image correlation. Eng Fract Mech (2017) 183:109–24. doi:10.1016/j.engfracmech.2017.05.035
19. Huang YH, Yang SQ, Hall MR, Tian WL, Yin PF. Experimental study on uniaxial mechanical properties and crack propagation in sandstone containing a single oval cavity. Arch Civil Mech Eng (2018) 18(4):1359–73. doi:10.1016/j.acme.2018.04.005
20. Li P, Ren FH, Cai MF, Guo QF, Wang HF, Liu K. Investigating the mechanical and acoustic emission characteristics of brittle failure around a circular opening under uniaxial loading. Int J Miner Metall Mater (2019) 26:1217–30. doi:10.1007/s12613-019-1887-5
21. Lotidis MA, Nomikos PP, Sofianos AI. Numerical study of the fracturing process in marble and plaster hollow plate specimens subjected to uniaxial compression. Rock Mech Rock Eng (2019) 52(11):4361–86. doi:10.1007/s00603-019-01884-8
22. Wong LNY, Peng J. Numerical investigation of micro-cracking behavior of brittle rock containing a pore-like flaw under uniaxial compression. Int J Damage Mech (2020) 29:1543–68. doi:10.1177/1056789520914700
23. Zhou Z, Tan LH, Cao WZ, Zhou ZY, Cai X. Fracture evolution and failure behaviour of marble specimens containing rectangular cavities under uniaxial loading. Eng Fract Mech (2017) 187:183–201. doi:10.1016/j.engfracmech.2017.08.029
24. Liu T, Lin BQ, Yang W, Zou QL, Kong J, Yan FZ. Cracking process and stress field evolution in specimen containing combined flaw under uniaxial compression. Rock Mech Rock Eng (2016) 49(8):3095–113. doi:10.1007/s00603-016-0982-4
25. Wang X, Tian LG. Mechanical and crack evolution characteristics of coal–rock under different fracture-hole conditions: A numerical study based on particle flow code. Environ Earth Sci (2018) 77:297. doi:10.1007/s12665-018-7486-3
26. Yin Q, Jing HW, Su HJ. Investigation on mechanical behavior and crack coalescence of sandstone specimens containing fissure-hole combined flaws under uniaxial compression. Geosci J (2018) 22:825–42. doi:10.1007/s12303-017-0081-x
27. Wang XS, Jiang YJ, Li B. Experimental and numerical study on crack propagation and deformation around underground opening in jointed rock masses. Geosci J (2017) 21:291–304. doi:10.1007/s12303-016-0051-8
28. Yang SQ, Yin PF, Zhang YC, Chen M, Zhou XP, Jing HW, et al. Failure behavior and crack evolution mechanism of a non-persistent jointed rock mass containing a circular hole. Int J Rock Mech Min Sci (1997) (2019) 114:101–21. doi:10.1016/j.ijrmms.2018.12.017
29. Tan X, Konietzky H. Numerical study of variation in Biot's coefficient with respect to microstructure of rocks. Tectonophysics (2014) 610:159–71. doi:10.1016/j.tecto.2013.11.014
30. Lin P, Wong RHC, Tang CA. Experimental study of coalescence mechanisms and failure under uniaxial compression of granite containing multiple holes. Int J Rock Mech Min Sci (1997) (2015) 77(4-6):313–27. doi:10.1016/j.ijrmms.2015.04.017
31. Wong RHC, Lin P. Numerical study of stress distribution and crack coalescence mechanisms of a solid containing multiple holes. Int J Rock Mech Min Sci (1997) (2015) 79:41–54. doi:10.1016/j.ijrmms.2015.08.003
32. Bai QS, Tu SH, Zhang C. Dem investigation of the fracture mechanism of rock disc containing hole(s) and its influence on tensile strength. Theor Appl Fracture Mech (2016) 86:197–216. doi:10.1016/j.tafmec.2016.07.005
33. Gao FQ, Stead D, Elmo D. Numerical simulation of microstructure of brittle rock using a grain-breakable distinct element grain-based model. Comput Geotech (2016) 78:203–17. doi:10.1016/j.compgeo.2016.05.019
34. Gui YL, Zhao ZY, Zhang C, Ma SQ. Numerical investigation of the opening effect on the mechanical behaviours in rocks under uniaxial loading using hybrid continuum-discrete element method. Comput Geotech (2017) 90:55–72. doi:10.1016/j.compgeo.2017.05.021
35. Zhang C, Tu SH, Bai QS. Evaluation of pore size and distribution impacts on uniaxial compressive strength of lithophysal rock. Arab J Sci Eng (2018) 43(3):1235–46. doi:10.1007/s13369-017-2810-x
36. Peng J, Wong LNY, Zhang YH. Influence of pore-like flaws on strength and microcracking behavior of crystalline rock. Int J Numer Anal Methods Geomech (2021) 45:521–39. doi:10.1002/nag.3171
37. Jia LC, Chen M, Zhang W, Xu T, Zhou Y, Hou B, et al. Experimental study and numerical modeling of brittle fracture of carbonate rock under uniaxial compression. Mech Res Commun (2013) 50:58–62. doi:10.1016/j.mechrescom.2013.04.002
38. Zhang Q, Zhu HH, Zhang LY, Ding XB. Study of scale effect on intact rock strength using particle flow modeling. Int J Rock Mech Min Sci (1997) (2011) 48(8):1320–8. doi:10.1016/j.ijrmms.2011.09.016
39. Saadat M, Tah A. A numerical approach to investigate the effects of rock texture on the damage and crack propagation of a pre-cracked granite. Comput Geotech (2019) 111:89–111. doi:10.1016/j.compgeo.2019.03.009
40. Tang CA, Liu H, Lee PKK, Tsui Y, Tham LG. Numerical studies of the influence of microstructure on rock failure in uniaxial compression — Part I: Effect of heterogeneity. Int J Rock Mech Min Sci (1997) (2000) 37(4):555–69. doi:10.1016/S1365-1609(99)00121-5
41. Tang CA, Tham LG, Wang SH, Liu H, Li WH. A numerical study of the influence of heterogeneity on the strength characterization of rock under uniaxial tension. Mech Mater (2007) 39(4):326–39. doi:10.1016/j.mechmat.2006.05.006
42. Ma WQ, Wang JT, Li XX, Wang TX. Crack evolution and acoustic emission characteristics of rock specimens containing random joints under uniaxial compression. Acta Geophys (2021) 69:2427–41. doi:10.1007/s11600-021-00686-3
Keywords: porous rock, random circular defects, mechanical behavior, crack evolution, AE event
Citation: Ma W, Cui C and Li X (2022) Mechanical and cracking behavior of porous rock models containing random circular defects under uniaxial compression. Front. Phys. 10:1066555. doi: 10.3389/fphy.2022.1066555
Received: 11 October 2022; Accepted: 02 November 2022;
Published: 17 November 2022.
Edited by:
Leilei Chen, Huanghuai University, ChinaReviewed by:
Haojie Lian, Taiyuan University of Technology, ChinaXiao Wang, Southeast University, China
Copyright © 2022 Ma, Cui and Li. This is an open-access article distributed under the terms of the Creative Commons Attribution License (CC BY). The use, distribution or reproduction in other forums is permitted, provided the original author(s) and the copyright owner(s) are credited and that the original publication in this journal is cited, in accordance with accepted academic practice. No use, distribution or reproduction is permitted which does not comply with these terms.
*Correspondence: Wenqiang Ma, mwq@xynu.edu.cn