Polarized Shack-Hartmann wavefront sensor
 Yanrong Yang
 Linhai Huang4,5
 - 1College of Ophthalmology, Chengdu University of Traditional Chinese Medicine, Chengdu, China
- 2Key Laboratory of Sichuan Province Ophthalmopathy Prevention and Cure and Visual Function Protection with TCM, Chengdu, China
- 3Ineye Hospital of Chengdu University of TCM, Chengdu, China
- 4The Key laboratory of Adaptive Optics, Chinese Academy of Sciences, Chengdu, China
- 5University of Chinese Academy of Science, Beijing, China
Shack-Hartmann wavefront sensor (SHWFS) has been widely used in adaptive optics (AO) systems to detect phase distortion characteristics. In laser communication, target detection, vision optics and other application fields, the performance of SHWFS is affected by bright skylight and scattered light, which restricted the working ability of the AO system severely. Therefore, this paper proposes a new polarized SHWFS (p-SHWFS) based on the principle of polarization imaging, which utilize the difference of state of polarization (SoP) between signal and stray light to improve the image contrast. The p-SHWFS can be composed simply by a micro-lens array and a linear polarization camera. The camera uses four directional polarizing filters at 0°, 135°, 45° and 90° on every four pixels. Thus, the degree of linear polarization (DoLP) and angle of linear polarization (AoLP) for the incident wavefront can be analyzed, and the signal-to-background ratio (SBR) can be improved in some certain depending on the difference of SoP. In this paper, we introduce the basic principle of the p-SHWFS and validate the feasibility and accuracy improvement by numerical simulation and practical experiments. The experimental results show that the p-SHWFS can improve obviously the measurement accuracy under strong stray light when the difference of SoP exists. That may give us some initial reference to reduce the influence of stray light in laser communication, target detection, vision optics and other application fields.
1 Introduction
Adaptive optics (AO) technology can effectively correct the dynamic wavefront distortion in real time [1]. It has been widely used in astronomical observation [2], laser beam purification, retinal high-resolution imaging, laser communication and other fields [3–5]. However, all AO systems applied in these fields would be affected by a bright light from background, backscatter or straylight. Therefore, in order to avoid the effect of the daytime stray light in astronomical observation, so far, almost of astronomical observation are working at night or the other low background or stray light scene. Similarly, in the field of laser communication, the stray light generated from high-power laser transmission will be received by the high-sensitivity detector. During the measurement of ocular aberrations, the signal light scattered from fundus will be mixed with corneal reflex. The bright stray light or corneal reflex which would affect the sensitivity of AO system. Shack-Hartmann wavefront sensor (SHWFS) [6, 7] is one of the most important components of an AO system, which is used to detect the wavefront distortion from the target to observation [8]. Many applications show that the SHWFS can meet a high accuracy and achieve a stable property under the night or the other low background or stray light scene. However, under the bright background light scenes such as the above conditions of daytime stray light and corneal reflex, the signal-to-background ratio (SBR) [9] or signal-to-noise ratio (SNR) of each sub-aperture of SHWFS will be limited obviously, where SBR usually used to indicate the intensity level of the background light. Under ultra-worse condition, one may not find any signal light from the SHWFS, which limit its measurement ability of wavefront aberration. For solving this problem, some authors have proposed several kinds of methods. Beckers [10] applied the active wavefront detection technology based on ultra-narrow band filtering principle to daytime AO system. Gonglewski [11] used the field stop to eliminate the skylight, but this could not effectively solve the impact of bright skylight on wavefront detection in daytime. [12] proposed the method of field shift SHWFS, which could detect the mixed information and skylight separately through a tilt mirror or beam splitting prism. However, this field shift method requires a time-sharing detection or two-way wavefront detection set-up, which increased the complexity of control. On the anther hand, the method can only eliminate the evenly distributed skylight. [13] proposed using polarization filtering technology to suppress polarized background light, but the polarization of skylight is relatively weak, and the filtering method also weaken the target signal. Therefore, this polarization filtering technology only have a limited improvement in detection contrast of the target signal. Huang et al. [14] proposed a new daytime pyramid wavefront sensor (PyWFS) to separate the object signal from background signal to improve the SNR in daylight AO system. The results shown that the new PyWFS approach was practical when SNR is greater than 1.9 but less than 16.9. In fact, these proposed methods have limited improvement on the performance of SHWFS for daytime AO system in terms of hardware. In addition, there are some improvements come from the algorithm of data processing. Li et al. [15] proposed a SHWFS-Neural Network (SHNN) to calculate centroid in SHWFS from the extreme situations such as strong environmental light and noise pollution. The results shown that a False Rate with 50 hidden layer neurons was 6% under the peak SNR of 3. Xu et. al [16] propose a Gaussian modeling centroid extraction algorithm which performs real-time daylight AO closed-loop corrections. This method can provide a lower centroid estimation error under bright sky background conditions. Guo et al. [17] proposed a new wavefront detection method based on linear polarized modulation. The proposed method can reduce the influence of bright skylight, but the rotating polarizer limits the performance of real-time and accuracy. The mentioned methods can improve in some certain the SBR or SNR of the SHWFS, but the performance of the SHWFS cannot meet the requirement under bright stray light.
Based on above methods, we proposed a polarized SHWFS (p-SHWFS) in this paper, which utilize the difference of state of polarization (SoP) between signal and stray light to improve the image contrast. The p-SHWFS can be composed simply by a micro-lens array and a linear polarization camera. The camera uses four directional polarizing filters at 0°, 135°, 45° and 90° on every four pixels. Light passing through these four filters can then be linear interpolated to provide a signal pixel value in polarized dimension. Then, the unpolarized and polarized light can be identified and separated. Thus, the degree of linear polarization (DoLP) and angle of linear polarization (AoLP) for each sub-aperture can be analyzed, and the SBR can be improved in some certain depending on the difference of SoP. In this paper, the basic principle of the proposed p-SHWFS is described, and its performance is also validated by numerical simulation and practical experiments. The experimental results show that the p-SHWFS can improve obviously the measurement accuracy under strong stray light when the difference of SoP exists.
2 Principle and methods
2.1 Principle of p-SHWFS
The p-SHWFS is composed of a lenslet array, a micro linear polarizer array and a pixeled detector, as shown in Figure 1. The wavefront W (x, y) in the circular domain is divided into N sub wavefronts by the lenslet array. Each sub wavefront is modulated by the micro linear polarizer array and imaged on the detector. The micro linear polarizer array is composed of linear polarizing filters placed on every four adjacent pixels of the detector at the directions of 90°, 45°, 135° and 0°, which is called a polarized dimension calculation unit. Light passing through these four filters can then be linearly interpolated to provide a single intensity pixel value with its associated DoLP and AoLP in polarized dimension.
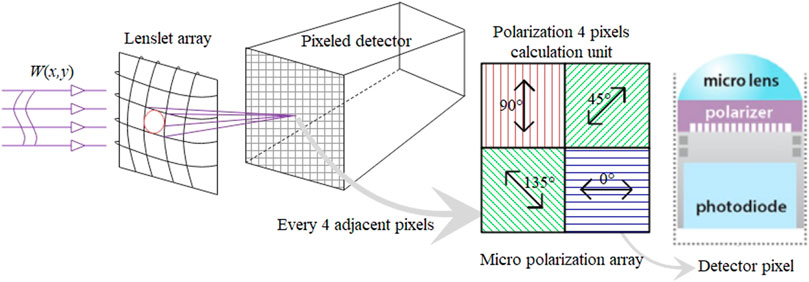
FIGURE 1. P-SHWFS structure and polarization dimension calculation unit [18].
According to the actual application scenario, W (x, y) is a mixture of object and stray light. In the field of astronomical observation, the object light from the Sun or distant stars will become unpolarized, the stray light from sky background will become partially linear polarized. Similarly, in the application of human eye aberrations measurements, there will also exist differences of SoP between fundus scattered lights and corneal reflections. Fortunately, this stray light or corneal reflections can be identified by the polarization signature it carries. Therefore, the difference of SoP in the mixture can be used to eliminate or suppress stray light. In order to illustrate the principle of p-SHWFS, we assume that the incident intensity of the k-th calculation unit is
The mix intensity of every pixel can be captured simultaneously by the p-SHWFS through one exposure. The intensity of the four adjacent pixels in the k-th unit of the detector are
where θ is the polarized direction of
2.2 Data processing method of p-SHWFS
As shown in Figure 1, each pixel value of the polarized image can be calculated from four pixels calculation unit. To simplify, it is assumed that the j-th sub aperture on the detector contains a 2 × 2 units. The sub aperture intensity on the detector can be represented by matrix Dj,
where each rectangle is the calculation unit indicated with the superscripts 1–4. Then the intensities of I0, I135, I45 and I90 at the polarization directions of 0°, 135°, 45° and 90° can be obtained as,
Substitute the difference between polarized components of 0° and 90° directions with
Thus, the DoLP is expressed as IS,
Since the p-SHWFS employs linear polarizers, it can be used to calculate the DoLP and remove the unpolarized components. The AoLP replaced with IA can be expressed as,
In fact, due to the variety of polarization extinction ratio and the quantum efficiency in every pixel, the DoLP errors caused by the polarizer will be exist. However, when calculating the spot centroids, the errors around the spots can be removed by a fixed threshold value. Using I0, I135, I45 and I90, we can calculate the total intensity
Thus, the DoLP, AoLP, and ID will then be one-quarter of the original resolution, or can be interpolated to provide the full resolution similar to traditional bayer pattern display. Combining Eqs 2, 8, it can be seen that the traditional method can only extract the total intensity of light, and cannot effectively eliminate the mixed strong stray light. But using Eq. 6, the unpolarized light can be completely eliminated in the mixed incident wavefront. Thus, the p-SHWFS use the difference of SoP between signal and stray light to improve the imaging contrast in wavefront measurement. Different from the traditional method in wavefront measurement, the p-SHWFS uses DoLP to calculate the spot centroid in the j-th sub aperture as,
where, (xj, yj) is the spot centroid of the j-th sub wavefront,
3 Numerical simulation of p-SHWFS
Parameters of p-SHWFS used in simulation are shown in Table 1.
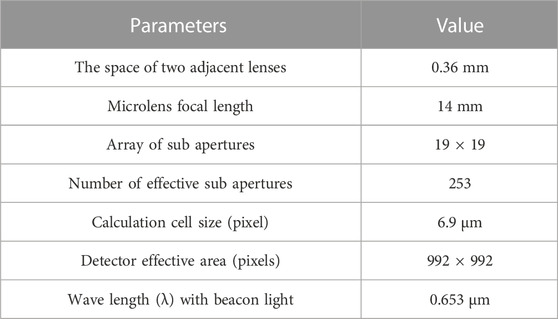
TABLE 1. Structure parameters of p-SHWFS used in simulation.
In order to completely eliminated the effect of unpolarized light on wavefront aberrations measurement, the incident light intensity I (x, y) is generated by numerical method as,
where, (x, y) is the sampling point at the detector. The object and stray light may be partially light. Thus,
The performance of p-SHWFS is affected by the difference of SoP between the signal and the stray light. Thus, in order to quantify the polarization characteristics of
p-SHWFS can remove the
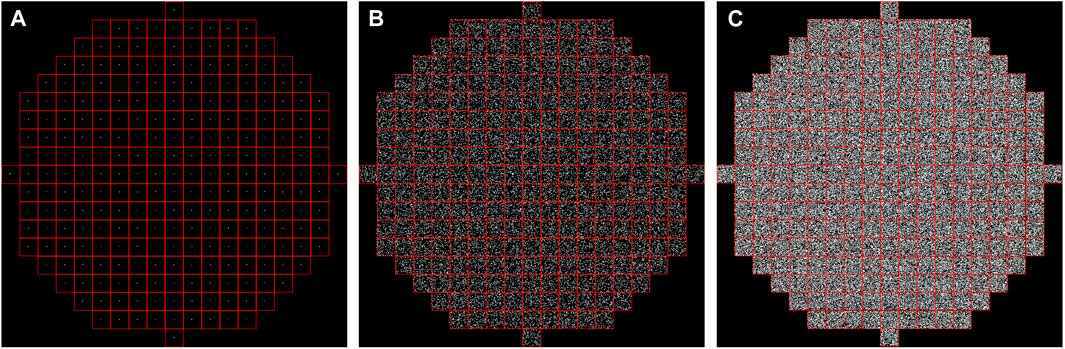
FIGURE 2. The light intensity calculated with the p-SHWFS. (A) no stray light and (B) mixed light with SBR = 6.29 dB and (C) SBR = 15.03 dB.
In order to verify the wavefront measurement ability of p-SHWFS, the target wavefront and aberration components (the first 35 Zernike coefficients) are shown in Figure 3.
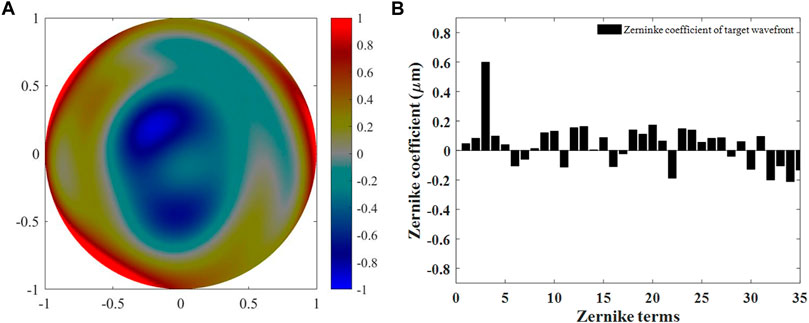
FIGURE 3. Simulated target wave (A) and its Zernike coefficient components (B). All the color bar of the wavefront in this work are in units: μm.
Figures 4A,B show the difference of wavefront measuring accuracy by traditional method and p-SHWFS under the polarization degree P of stray light is zero. It can be seen that the traditional method cannot accurately measure the target wavefront from the bright stray light. While the p-SHWFS can completely eliminate the stray light, as can be derived from Eq. 6. Therefore, under the P of stray light is zero, the RMSE (root mean square error) of Zernike coefficient restored by p-SHWFS is approximately zero (as in Figure 4A, the value of blue line is about 10–14 μm). The RMSE and PV (peak valley) values of the residual wavefront are also zeros (Figure 4B, the values marked with “Δ” and hexagon are approximately 10–13 μm). However, the ability of p-SHWFS to suppress stray light can be affected by uneven extinction ratio of micro polarizer array, detector quantum noise, readout noise and IN(x,y). Limited to space, we only analyzed the influence of IN(x,y) on the measurement accuracy of p-SHWFS.
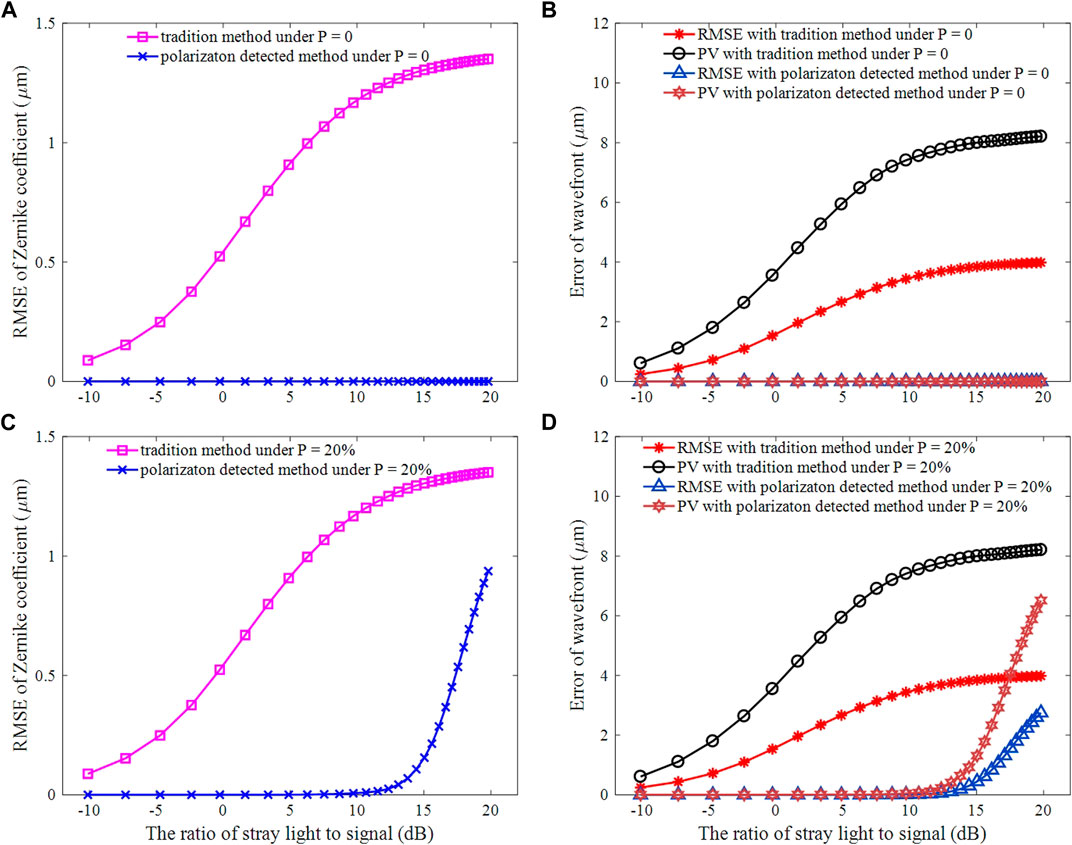
FIGURE 4. The error comparison between traditional method and p-SHWFS. Zernike coefficient error (A) and wavefront error (B) under the stray light with p = 0, Zernike coefficient error (C) and wavefront error (D) under the stray light with p = 20%.
Figures 4C,D show the wavefront measurement accuracy of the traditional method and p-SHWFS under different SBR when p = 20%. The results show that the traditional methods cannot effectively eliminate the stray light, which obviously restrict its wavefront measurement ability. However, the p-SHWFS can effectively eliminate the stray light (p = 20%, SBR ≤12.35 dB). RMSE of the residual wavefront is less than 0.0345 μm (≤0.0528 λ), PV is less than 0.2327 μm (≤0.3564 λ). RMSE of Zernike coefficient ≤0.0251 μm (0.0384 λ). From the results, we can know that the ability of p-SHWFS to eliminate the stray light will declined just when the SBR ≥13.10 dB (p = 20%).
Thus, the p-SHWFS can take advantage of the difference of SoP between the signal and stray light to effectively eliminate the influence of strong stray light on the wavefront detection accuracy.
4 Experimental verification
In order to verify the wavefront detection ability of p-SHWFS, the optical path shown in Figure 5 was built. Where LD is the fiber laser with the wavelength λ= 653 nm. The lenslet array of p-SHWFS is 19 × 19 (lenslet spacing 0.36 mm, the number N of effective sub aperture is 253). The resolution of the detector is 2448 × 2048 (pixel size 3.45 μm, pixel format with polarized mono12, TRI050S-P, LICID Ltd.). The light beam emitted by LD passes through the collimator L and the polarizer Pr. The passing components will become the polarized light IP. A strong stray light IN from an incandescent lamp is transmitted to the p-SHWFS along the optical path. IP and IN are similar to the simulation and also can be explained as in Eq. 10. After passing through the linear polarizing filters of the p-SHWFS, the DoLP (one-quarter of the original 2448 × 2048 pixels) of the incident intensity will only remain the polarized components IP and remove the unpolarized IN. On the contrary, it is still true for the p-SHWFS to remain the unpolarized components IN and remove the polarized components IP, as IN = I—IP.
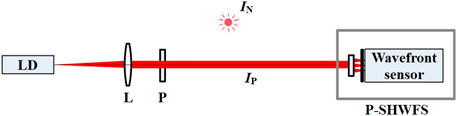
FIGURE 5. Schematic diagram of wavefront detection based on p-SHWFS. L: Lens; Pr: Polarizor; LD: Laser diode. IN: strong stray light.
4.1 Performance measurement of p-SHWFS without stray light
According to the intensities of I0, I135, I45 and I90 at different polarization directions, the total intensity and DoLP can be obtained according to Eqs 8, 6. The calculated total intensity is shown in Figure 6. The traditional method and p-SHWFS should have the same results under without stray light, as shown in Figure 7.
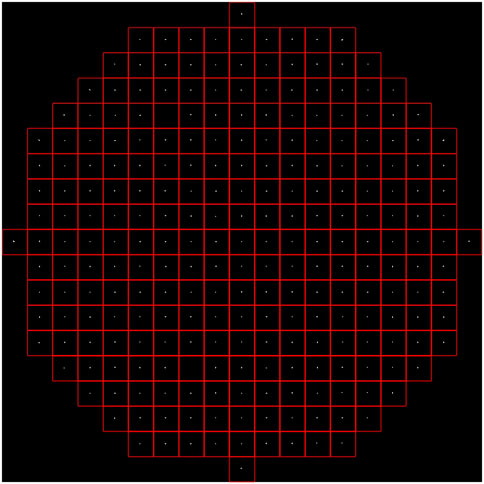
FIGURE 6. The total light intensity obtained by the intensities of I0, I135, I45 and I90 without stray light.
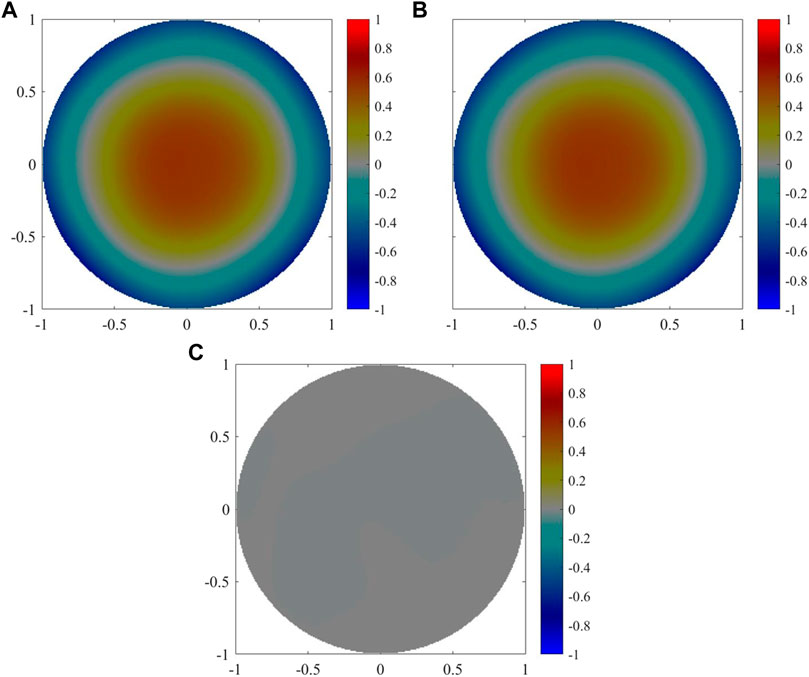
FIGURE 7. Comparison of wavefront detection results between traditional method (A) and p-SHWFS (B) under without stray light, (C) the wavefront residual error between the two methods.
Figures 7A,B show the wavefront detected by the traditional method and p-SHWFS, respectively. The residual wavefront error between the two methods as shown in Figure 7C. The results show that the PV and RMSE of residual wavefront are 0.0058 μm (0.0089λ) and 0.0017 μm (0.0026λ), respectively.
Taking the wavefront measured by the traditional method as the target (Figure 7A), and the target aberration components are shown in Figure 8A. The error of the first 35 Zernike coefficients between the traditional method and p-SHWFS is shown in Figure 8B. It can be seen that the RMSE is 0.0269 μm (0.0412 λ). The errors are mainly tip-tilt terms (first and second Zernike coefficient).
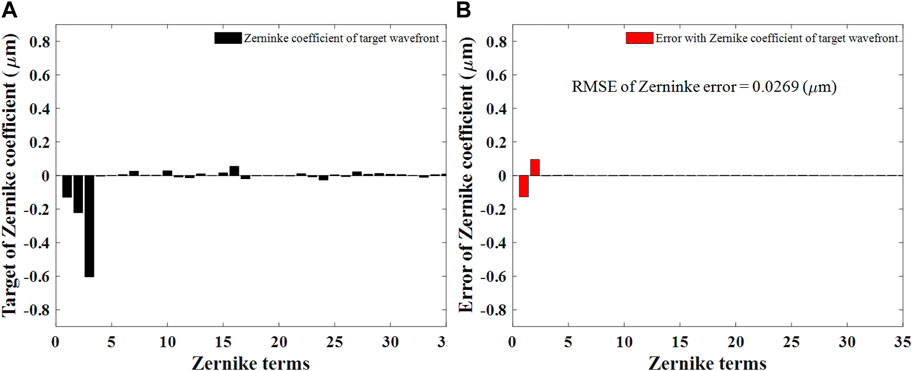
FIGURE 8. The target aberration components of the first 35 Zernike coefficients restored by traditional method (A) and the error between the traditional method and p-SHWFS (B).
Therefore, the wavefront detection results of the p-SHWFS are consistent with the traditional method without stray light. Next, we take Figure 7A, Figure 8A as the target wavefront to study the detection ability of the p-SHWFS under the influence of stray light.
4.2 Performance measurement of p-SHWFS under strong stray light
The source IN (in Figure 5) passes through an attenuator and ground glass to simulate the unpolarized stray light. By changing the intensity of IN, different noise levels of IN1, IN2, IN3 are obtained with the SBR of 12.51 dB, 15.60 dB and 17.04 dB, respectively. As shown in Figures 9A–C are the intensity calculated under the three noise levels. The strong stray light cannot be eliminated by the conventional method based on the total intensity. It would mix or even submerge the signal light. Thus, strong stray light limits the detection accuracy and the ability of traditional SHWFS. For example, Figures 9D–F are wavefront measured results based on the total intensity, and the results obviously deviate from the target wavefront. The wavefront measured by p-SHWFS are shown in Figures 9G,H, (I). Obviously, the results are similar to the target wavefront and not affected by the strong stray light.
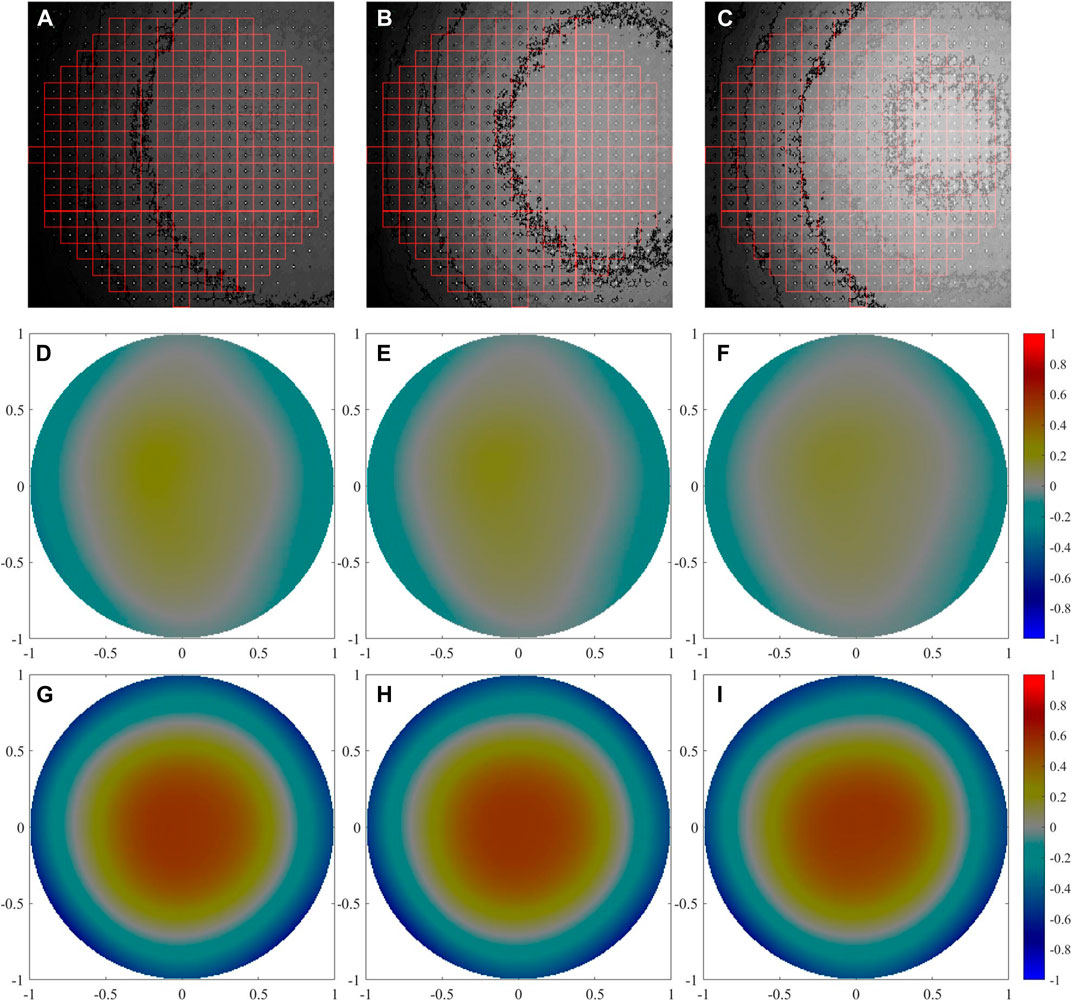
FIGURE 9. (A–C) the total intensity calculated by p-SHWFS under the three noise levels, the wavefront measurement results between traditional method (D–F) and p-SHWFS (G–I) under different noise levels.
The errors of target wavefront measured by the traditional method and p-SHWFS under different stray light are shown in Figure 10. Figure 10A–C are the wavefront residual error of the traditional method, and the PV and RMES of the residual errors are significantly greater than those of the p-SHWFS shown in Figure 10D–F. Therefore, under the influence of strong stray light IN1, IN2, IN3, the target wavefront can be accurately measured based on the p-SHWFS. The PV values of the measurement errors are 0.0128 μm (0.0196 λ), 0.0180 μm (0.0276 λ), 0.0694 μm (0.1063 λ) respectively. RMSE are 0.0031 μm (0.0047 λ), 0.0046 μm (0.0070 λ), 0.0187 μm (0.0286 λ) respectively. It can be seen that the wavefront measurement accuracy of p-SHWFS is the same with the results without stray light (RMSE = 0.0017 μm). In addition, PV is slightly greater than the result without stray light (0.0058 μm). While the RMSE and PV errors of target wavefront measured by the traditional method are obviously large.
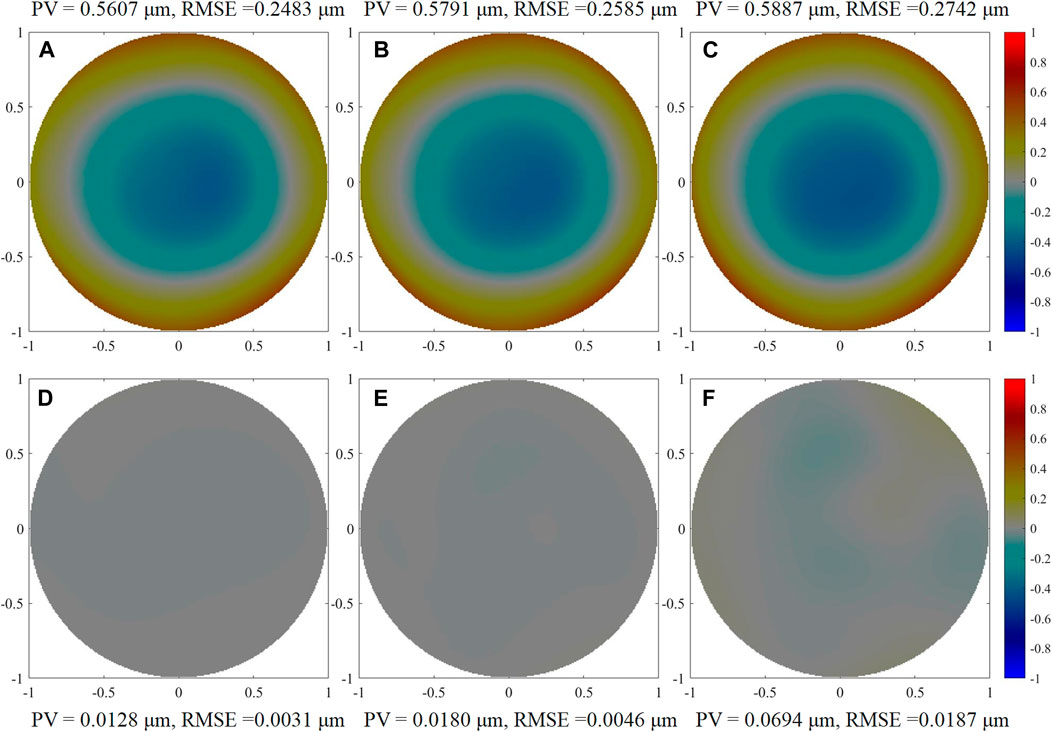
FIGURE 10. The residual error of wavefront measured by the traditional method (A–C) and p-SHWFS (D–F) under different noise levels.
The error of target aberration components restored by the traditional method and p-SHWFS under IN1, IN2, IN3 are shown in Figure 11. It can be seen that the RMSE of p-SHWFS shown in Figure 11D–E are 0.0269 μm, 0.0275 μm and 0.0394 μm. It is obviously smaller than the result of traditional method Figure 11A–C. The restoration error of p-SHWFS is similar to the results without noise (RMSE = 0.0269 μm). Similarly, the main error sources are tip-tilt terms.
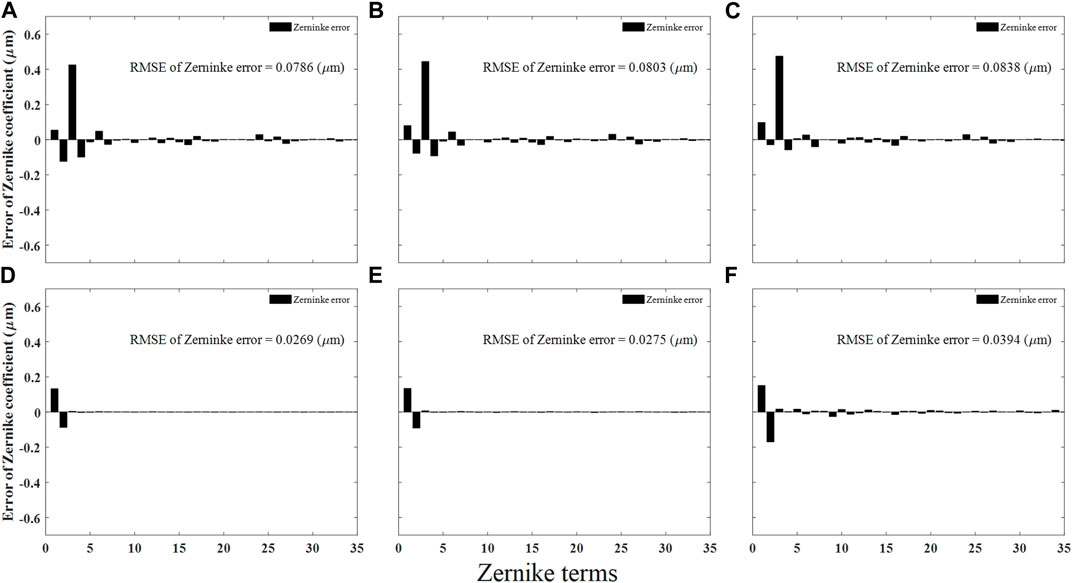
FIGURE 11. Zernike coefficient error restored by traditional method (A–C) and polarization detection method (D–F) under different noise levels.
From the results, we can conclude that the p-SHWFS can effectively suppress the stray light even when the SBR is ≥15.60 dB (IN2, IN3), and the result is better than the simulation (SBR = 13.10 dB, p = 20%). This improvement in suppression the stray light can be attributable to the different polarization degree of the stray light in the experimental system where P ≠ 20%. Therefore, the experimental and simulation results show that the p-SHWFS can take full use of the significant difference of SoP between the stray light and the object light in the polarization dimension. It would eliminate the influence of strong stray light on wavefront measurement and wavefront component restoration. It can help to accurately measure wavefront distortion under extreme conditions such as low SNR.
5 Conclusions and discussions
The results in our experiment and simulation have shown that the p-SHWFS would be a promising approach to improve the imaging contrast in AO systems to detect phase distortion characteristics. In order to facilitate the analysis, we used a mathematical model as shown in Eq. 10 to simulate the mixed incident light, where the difference of SoP between the object and the stray light can be modulated by changing the polarization degree of stray light. The simulated results shown that the performance measurement of p-SHWFS can be affected by the polarization degree of the stray light. In the future analysis and experiments, we will further focus on the performance measurement of p-SHWFS under greater polarization degree of partially polarized stray light.
In summary, a new p-SHWFS based on polarization imaging principle is proposed in this paper. The intensity information would be transformed into polarization dimension using micro linear polarizer array at the directions of 0°, 135°, 45° and 90°, so as to take advantage of the significant difference of SoP between stray and object light. The incident mixed light of each sub aperture of p-SHWFS is modulated in four directions to eliminate the interference of stray light. It can improve the SBR and wavefront detection ability under extreme conditions. The feasibility and accuracy of this method have been verified by simulation analysis and experimental system. The experiment results show that the RMSE and PV of wavefront measured by p-SHWFS are ≤0.0070 μm and ≤0.0694 μm under the stray light with SBR are 12.51 dB, 15.60 dB and 17.04 dB. RMSE of Zernike coefficient are less than 0.0394 μm. Compared to the traditional method, the ability of wavefront measurement by the p-SHWFS is obviously improved under the strong stray light when the difference of SoP exists. That may give us some initial reference to reduce the influence of background or stray light in laser communication, target detection, vision optics and other application fields.
Data availability statement
The original contributions presented in the study are included in the article/supplementary material, further inquiries can be directed to the corresponding author.
Author contributions
Conceptualization, NG and YY; Methodology, YY; Software, YY; Validation, YY, LH, and YX; Writing—original draft preparation, YY; Writing—review and editing, YY, LH, NG. All authors have read and agreed to the published version of the manuscript.
Funding
This research was funded by National Natural Science Foundation of China (NSFC), grant number 12022308, 12293031, 12073031 and 61905252. The National Key R&D Program of China, grant number 2021YFC2202204 and 2021YFC2202200.
Conflict of interest
The authors declare that the research was conducted in the absence of any commercial or financial relationships that could be construed as a potential conflict of interest.
Publisher’s note
All claims expressed in this article are solely those of the authors and do not necessarily represent those of their affiliated organizations, or those of the publisher, the editors and the reviewers. Any product that may be evaluated in this article, or claim that may be made by its manufacturer, is not guaranteed or endorsed by the publisher.
References
1. Guo YM, Zhong LB, Min L, Wang JY, Wu Y, Chen KL, et al. Adaptive optics based on machine learning: A review. Opto-electron Adv (2022) 5:200082. doi:10.29026/oea.2022.200082
2. Kim D, Choi H, Brendel T, Quach H, Esparza M, Kang H, et al. Advances in optical engineering for future telescopes. Opto-electron Adv (2021) 4:210040. doi:10.29026/oea.2021.210040
3. Furukawa Y, Takaie Y, Maeda Y, Ohsaki Y, Hasegawa M. Development of one-shot aspheric measurement system with a Shack-Hartmann sensor. Appl Opt (2016) 55(29):8138–44. doi:10.1364/ao.55.008138
4. Tang GM, He YM, Liao Z. Radial Hartmann method for measuring large optical system. Chin J Lasers (2010) 37(3):795–9. doi:10.3788/cjl20103703.0795
5. Wu Y, He JC, Zhou XT, Chu RY. A limitation of Hartmann-Shack system in measuring wavefront aberrations for patients received laser refractive surgery. PLoS One (2015) 10(2):e0117256. doi:10.1371/journal.pone.0117256
6. Noll RJ. Zernike polynomials and atmospheric turbulence. J Opt Soc Am (1976) 66(3):207. doi:10.1364/josa.66.000207
7. Dai FZ, Zheng YZ, Bu Y, Wang XZ. Modal wavefront reconstruction based on Zernike polynomials for lateral shearing interferometry. Appl Opt (2012) 56(1):61–8. doi:10.1364/ao.56.000061
8. Li C, Cai DM, Jia P, Liu JX, Li JJ. Research on reconstruction of atmospheric turbulence wavefront compressed sensing measurement. Opto-Electronic Eng (2018) 45(4):170617.
9. Alam SU, Soni NK, Rao AS, He H, Ren YX, Wong K. Two-photon microscopy with enhanced resolution and signal-to-background ratio using hollow Gaussian beam excitation. Opt Lett (2022) 47(8):2048–51. doi:10.1364/ol.454140
10. Beckers JM, Cacciani A. Using laser beacons for daytime adaptive optics. Exp Astron (2001) 11(2):133–43. doi:10.1023/a:1011140920850
11. Gonglewski JD, Highland RG, Dayton DC, Sandven SS, Rogers SC, BroneADONIS SL. Daylight imaging through atmospheric turbulence. Proc SPIE (1996) 2827:152–61.
12. Li CH, Xian H, Rao CH, Jiang WH. Field-of-view shifted shack-hartmann wavefront sensor for daytime adaptive optics system. Opt Lett (2006) 31(19):2821–3. doi:10.1364/ol.31.002821
13. Zhang RJ, Xian H, Rao CH, Zhang XJ, Zhang A. Study on effect of polarization filter for suppressing sky background light in daytime. Acta Opt Sin (2012) 32(5):0501003. doi:10.3788/aos201232.0501003
14. Huang LS, Wang JL, Chen L, Yuan HF, Li HZ, Yao KN. Visible pyramid wavefront sensing approach for daylight adaptive optics. Opt Express (2022) 30:10833–49. doi:10.1364/oe.449021
15. Li ZQ, Li XY. Centroid computation for Shack-Hartmann wavefront sensor in extreme situations based on artificial neural networks. Opt Express (2018) 26:31675–92. doi:10.1364/oe.26.031675
16. Xu L, Wang JL, Yao KN, Yang LQ. Application of the Gaussian modeling algorithm to a Shack–Hartmann wavefront sensor for daylight adaptive optics. Opt Lett (2021) 46:4196–9. doi:10.1364/ol.434941
17. Guo T, Zhang B, Gu NT, Rao CH, Huang LH, Xu D, et al. Research on polarization Hartmann wavefront detection technology. Opto-electron Eng (2021) 48(7):210076.
18. Huynh TTM, Nguyen TD, Vo M-T, Dao SVT. High dynamic range imaging using A 2x2 camera array with polarizing filters. In: 2019 19th International Symposium on Communications and Information Technologies (ISCIT); 25-27 September 2019; Ho Chi Minh City, Vietnam (2019). p. 183–7.
Keywords: adaptive optics, Shack-Hartmann wavefront sensor (SHWFS), polarization detection method, polarized dimension, polarization imaging
Citation: Yang Y, Huang L, Xiao Y and Gu N (2023) Polarized Shack-Hartmann wavefront sensor. Front. Phys. 11:1091848. doi: 10.3389/fphy.2023.1091848
Received: 07 November 2022; Accepted: 08 February 2023;
Published: 22 February 2023.
Edited by:
Yudong Cui, Zhejiang University, ChinaReviewed by:
Rakesh Kumar Singh, Indian Institute of Technology (BHU), IndiaMaham Aftab, University of Arizona, United States
Jian Bai, Zhejiang University, China
Copyright © 2023 Yang, Huang, Xiao and Gu. This is an open-access article distributed under the terms of the Creative Commons Attribution License (CC BY). The use, distribution or reproduction in other forums is permitted, provided the original author(s) and the copyright owner(s) are credited and that the original publication in this journal is cited, in accordance with accepted academic practice. No use, distribution or reproduction is permitted which does not comply with these terms.
*Correspondence: Naiting Gu, gnt7328@163.com