 Ufuk Olgac1,2
 Vartan Kurtcuoglu1,2,3*
- 1The Interface Group, Institute of Physiology, University of Zurich, Zurich, Switzerland
- 2National Center of Competence in Research, Kidney.CH, Zurich, Switzerland
- 3Zurich Center for Integrative Human Physiology, University of Zurich, Zurich, Switzerland
The aim of this study was to evaluate whether possible preglomerular arterial-to-venous oxygen shunting is affected by the interaction between renal preglomerular carbon dioxide and oxygen transport. We hypothesized that a reverse (venous-to-arterial) shunting of carbon dioxide will increase partial pressure of carbon dioxide and decrease pH in the arteries and thereby lead to increased oxygen offloading and consequent oxygen shunting. To test this hypothesis, we employed a segment-wise three-dimensional computational model of coupled renal oxygen and carbon dioxide transport, wherein coupling is achieved by shifting the oxygen-hemoglobin dissociation curve in dependence of local changes in partial pressure of carbon dioxide and pH. The model suggests that primarily due to the high buffering capacity of blood, there is only marginally increased acidity in the preglomerular vasculature compared to systemic arterial blood caused by carbon dioxide shunting. Furthermore, effects of carbon dioxide transport do not promote but rather impair preglomerular oxygen shunting, as the increase in acidity is higher in the veins compared to that in the arteries. We conclude that while substantial arterial-to-venous oxygen shunting might take place in the postglomerular vasculature, the net amount of oxygen shunted at the preglomerular vasculature appears to be marginal.
Introduction
Hypoxic conditions in the renal cortex or in the medulla may induce tissue damage and contribute to the pathogenesis of acute and chronic kidney diseases (Evans et al., 2008). It is therefore essential to understand the mechanisms that are involved in the regulation of renal oxygenation. We have shown previously that preglomerular arterial-to-venous (AV) oxygen shunting—a mechanism hypothesized to contribute to the regulation of renal oxygenation (Leong et al., 2007; Evans et al., 2008)—is unlikely to be significant (Olgac and Kurtcuoglu, 2015a,b). Since then the question has arisen whether substantial shunting may nevertheless exist, enabled by the influence of preglomerular carbon dioxide dynamics on oxygen transport. Here we hypothesize that reverse, venous-to-arterial (VA) shunting of carbon dioxide will increase arterial partial pressure of carbon dioxide, decrease pH, and thereby lead to augmented oxygen offloading through the Bohr effect (Kilmartin and Rossi-Bernardi, 1973; Dash et al., 2016) and consequent AV oxygen shunting.
Measurements of renal carbon dioxide partial pressure (PCO2) and pH indicate a wide range of values in various structures of the kidney: In the proximal tubule, PCO2 was measured by Sohtell (1979) to be 60.6 mmHg, by DuBose et al. (1979) 65 mmHg, by Maddox et al. (1984) 57.1–62.1 mmHg, and by De Mello Aires et al. (1990) 35.5 mmHg. In stellate vessels, reported values are 33.7 mmHg (Sohtell, 1979), 65 mmHg (DuBose et al., 1979), 57.1 mmHg (Maddox et al., 1984), and 38.9 mmHg (De Mello Aires et al., 1990). pH of 6.7–7.06 was measured by DuBose et al. (1979) in the proximal tubule and of 7.27 in the stellate vessels. These values suggest that, depending on the location within the renal cortex, PCO2 and pH may vary. However, the extent of the deviation of PCO2 and pH from the values of systemic arterial blood is not well known. Similarly, reliable quantitative values of in vivo PCO2 and pH values inside red blood cells (RBCs) traversing the preglomerular vasculature are, to our knowledge, not obtainable experimentally. Since these data are necessary to test our hypothesis, a mathematical modeling approach is warranted.
Renal CO2 trapping through a reverse shunting mechanism was previously hypothesized by Bidani et al. (1984) to occur in the postglomerular vasculature and by Atherton et al. (1988) and Schurek et al. (1990) in the interlobular artery-vein pairs of the preglomerular vasculature. Schurek et al. (1990) further hypothesized that such a mechanism enhances AV oxygen shunting through the Bohr effect. Here we tested this hypothesis incorporating the latest structural data by Ngo et al. (2014) that account for the wrapping of veins around arteries in the preglomerular vasculature. To this end, we extended our previous computational model on renal oxygen transport (Olgac and Kurtcuoglu, 2015a,b) to include carbon dioxide transport. We then coupled oxygen transport to carbon dioxide transport through a function describing the shift of the oxygen-hemoglobin dissociation curve with respect to the local PCO2 and pH as recently described by Dash et al. (2016). The resulting computational model is capable of quantifying PO2, PCO2 and pH as well as fluxes of O2 and CO2 through the vessel walls of wrapped and not-wrapped artery-vein pairs in the preglomerular vasculature. Computations of oxygen transport were performed with a Hill equation with constant P50 as well as a variable P50 in dependence of the local PCO2 and pH.
Methods
Model Domain
The three-dimensional (3D) model domain was previously described in Olgac and Kurtcuoglu (2015a,b). It consists of representative levels corresponding to 11 Strahler orders of the preglomerular vasculature. Each level contains wrapped and not-wrapped artery-vein pairs. The structural information for each level (artery radius, Ra, vein radius, Rv, number of wrapped and not-wrapped vessels, kw and knw, respectively, lumen separation for wrapped and not-wrapped vessels, LSw and LSnw, respectively, and length of vessels, l) is given in Table 1.
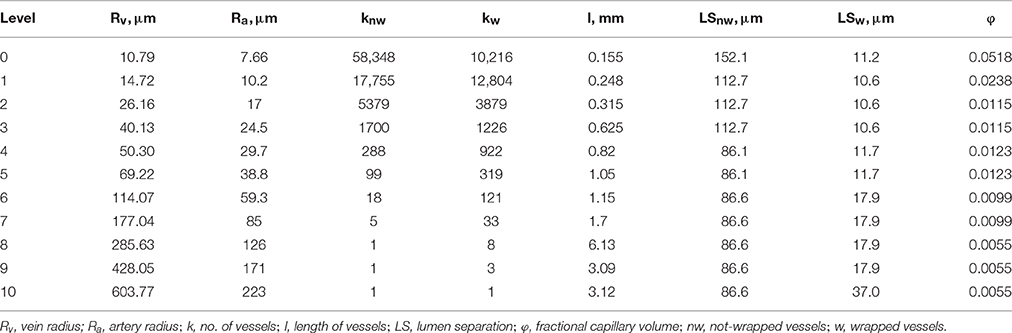
Table 1. Structural information at representative levels.
Mathematical Formulation
Two different sets of equations governing oxygen and carbon dioxide transport dynamics in the renal cortex are solved in the vessels and the tissue. The vessels are composed of a RBC-rich region in the core and a RBC-free region close to the walls. The thickness of the RBC-free region in vessels of each Strahler order is given by , where R is the vessel radius in that order, and RRBC and tRBC are the radius (4 μm) and maximum half thickness (1.3 μm) of a RBC, respectively (Nair et al., 1989). The plasma and RBC velocity profiles and the hematocrit profile in the RBC-rich region, uP(r), uRBC(r) and h(r), respectively, as well as the plasma velocity profile in the RBC-free region, (r), are calculated as explained in Olgac and Kurtcuoglu (2015a) and set on the computational domain prior to solving the governing equations for oxygen and carbon dioxide transport.
Oxygen Transport
For the oxygen transport, we base our calculations on a derivative of our model presented in Olgac and Kurtcuoglu (2015a) where now the variability of P50, i.e., the half saturation oxygen partial pressure, is taken into account. Briefly, in the vessels, blood plasma, and RBCs are axially convected. The plasma carries dissolved oxygen and the RBCs carry dissolved and hemoglobin-bound oxygen. Radial diffusion of dissolved oxygen in the plasma is also accounted for. For a variable P50, in the RBC-rich region, PO2 is governed by
where CHbT, and are the total heme group concentration in RBCs and the solubility of oxygen in plasma and inside the RBC, respectively (see Data Sheet 1 in Supplementary Material for derivation). The permeability of oxygen in plasma is defined as , where is the diffusion coefficient of oxygen in plasma. Note that the second term on the left hand side of Equation 1 vanishes for constant P50, recovering the original equation developed in Olgac and Kurtcuoglu (2015a). In the RBC-free region, plasma free oxygen concentration follows:
The tissue, together with its capillary vessels, is considered a homogeneous structure in which perfusion and consumption are uniform and dependent on the fractional capillary volume, φ. Both diffusion of free oxygen and advection of free and hemoglobin-bound oxygen along the capillaries are taken into account. The homogeneous tissue oxygen partial pressure, PO2, is governed by Salathe (1982) and Olgac and Kurtcuoglu (2015a):
where u, , Hc, and are the advection velocity of oxygen in capillaries, solubility of oxygen in the tissue, hematocrit in the capillaries, oxygen consumption rate in the tissue and capillary source/sink term, respectively. The permeability of oxygen in tissue is defined such that , where is the diffusion coefficient of oxygen in tissue. Details on how the capillary source/sink term is treated are given in Olgac and Kurtcuoglu (2015a). Advection of oxygen in capillaries is only considered in the tissue between the not-wrapped pairs, since the tissue between the wrapped artery-vein pairs is free of capillaries (Ngo et al., 2014).
In Equations (1–3), SO2 is the saturation of hemoglobin with oxygen, which is represented by the Hill equation (Clark et al., 1985):
where n is an empirical constant. Its derivative with respect to PO2 in Equations (1–3) is given by Olgac and Kurtcuoglu (2015a):
Equations (1–3) are solved either with a constant P50 (as was done in (Olgac and Kurtcuoglu, 2015a)) or with a variable P50 that is dependent on local PCO2 and pH. P50 is varied with respect to local PCO2 and pH according to Dash et al. (2016):
where P50, ΔpH and P50, ΔCO2 represent the shifts in P50 with respect to pH and PCO2, respectively, and standard physiological values are denoted with “S,” for which P50, S = 26.8 mmHg, pHS = 7.24 and PCO2, S = 40 mmHg (Dash et al., 2016). Oxygen-hemoglobin dissociation curves under these physiological reference conditions as well as under exemplary acidic and basic conditions are shown in Figure 1.
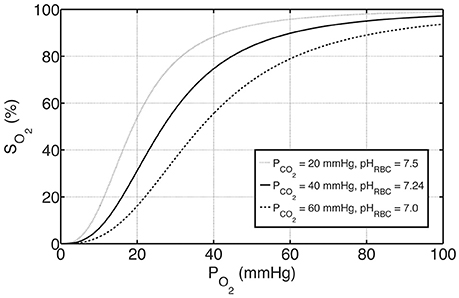
Figure 1. The effects of PCO2 and pH on oxygen-hemoglobin dissociation curve represented by SO2 according to Equations (4) and (6). The solid curve in the middle represents standard physiological conditions with PCO2 = 40 mmHg, pHRBC = 7.24 and P50 = 26.8 mmHg, whereas the curves above and below represent examples of basic and acidic conditions, respectively. For these conditions, P50 is altered with respect to PCO2 and pH by Equation (6a–c).
Carbon Dioxide Transport
For the carbon dioxide transport, we base our calculations on a modified version of the model presented by Huang and Hellums (1994), accounting, next to oxygen, also for the following seven species: CO2, , , , , and , namely carbon dioxide as well as hydrogen, bicarbonate and chloride ions in RBC and in plasma, respectively (see Figure 2). In RBCs, we assume chemical equilibrium for the carbon dioxide hydration/dehydration reaction, whereas in plasma we take the reaction term explicitly into account. We present below the seven governing equations for these species in the RBC-rich region and refer the reader to the Data Sheet 1 in Supplementary Material for their detailed derivation:
where and are the solubility of carbon dioxide in plasma and inside the RBC, respectively. K′RBC and fwater are the apparent dissociation constant for H2CO3 inside RBC and water fraction of RBC volume, respectively. βP and βRBC are the buffering capacity in plasma and in RBC, respectively. Finally, is the surface to volume ratio of an RBC. Equation (8) represents the normal non- titration line in the Davenport diagram with buffering capacity βRBC as slope and b as a constant, which is calculated based on systemic arterial blood values of and pHRBC = 7.24 (Davenport, 1958; Boron and Boulpaep, 2012). The permeability of carbon dioxide in plasma is defined as , where is the diffusion coefficient of carbon dioxide in plasma, whereas , , and are the diffusion coefficients of chloride, hydrogen and bicarbonate ions, respectively. and are the bicarbonate formation rate in plasma and the anion transporter flux through the RBC membrane (see Data Sheet 1 in Supplementary Material for their calculation). In the RBC-free region, plasma carbon dioxide, hydrogen ion, bicarbonate ion and chloride ion concentration follow, respectively:
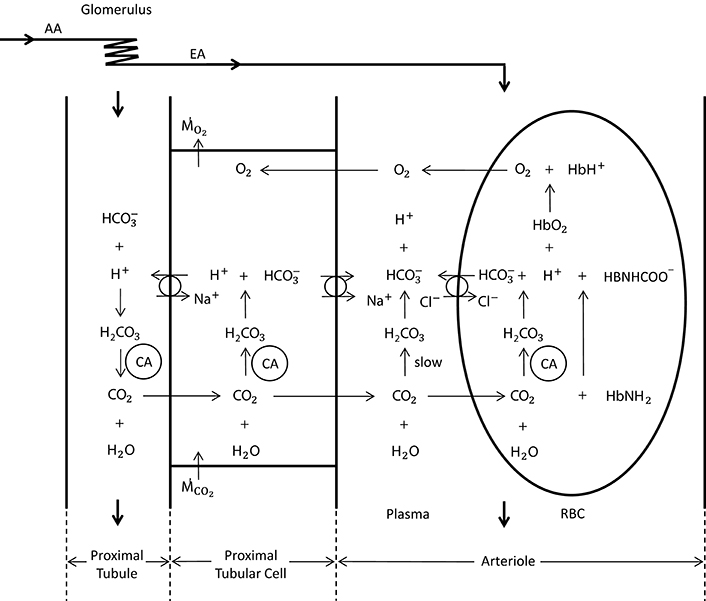
Figure 2. Schematic representation of oxygen and carbon dioxide transport dynamics in the proximal tubule, proximal tubular cell and an arteriole (modified from Bidani et al., 1984; DuBose and Bidani, 1988; Huang and Hellums, 1994). The represented dynamics in the arteriole is also valid in the vessels of the preglomerular vasculature. In the vessels, CO2 is carried as CO2 in plasma and RBC (8%), in plasma and RBC (81%) and hemoglobin bound CO2 (11%) (Huang and Hellums, 1994). The CO2 hydration reaction in plasma is relatively slow, whereas in RBCs it is very fast due to the presence of carbonic anhydrase (CA). The anion transporter on the RBC membrane acts to exchange and Cl− between plasma and RBC. To solve for carbon dioxide transport in vessels, seven species, i.e., CO2, , , , , , and , and their interactions need to be considered. In the proximal tubular cell, oxygen is consumed () and carbon dioxide is produced (). CO2 is rapidly turned into H+ and (due to carbonic anhydrase), for which the H+ is transported into the tubule to reabsorb the tubular in CO2 form. This cyclic mechanism functions to reabsorb the tubular bicarbonate as well as to generate bicarbonate that is transported back to the systemic blood (in opposition to proton excretion into the urine, which is buffered by phosphate, creatinine, urate, etc) to preserve acid—base homeostasis of the blood. The CO2 production in the proximal tubular cell is transported into the arterioles in CO2 and form, for which the ratio is unknown.
The vessel walls are assumed impermeable to hydrogen, bicarbonate and chloride ions, since these require active transport, which is not considered significant in the preglomerular vasculature. Consequently, in the tissue, only carbon dioxide diffusion is considered. The tissue carbon dioxide partial pressure, PCO2, is governed by:
where is the solubility of carbon dioxide in tissue. The permeability of carbon dioxide in tissue is defined as , where is the diffusion coefficient of carbon dioxide in tissue. are the metabolic carbon dioxide production rate in the tissue and capillary carbon dioxide source/sink term, respectively. Here we assume that all CO2 produced in the tissue is taken up by the capillaries, i.e., = , as explained in the next section. All parameters related to oxygen and carbon dioxide transport dynamics are given in Table 2.
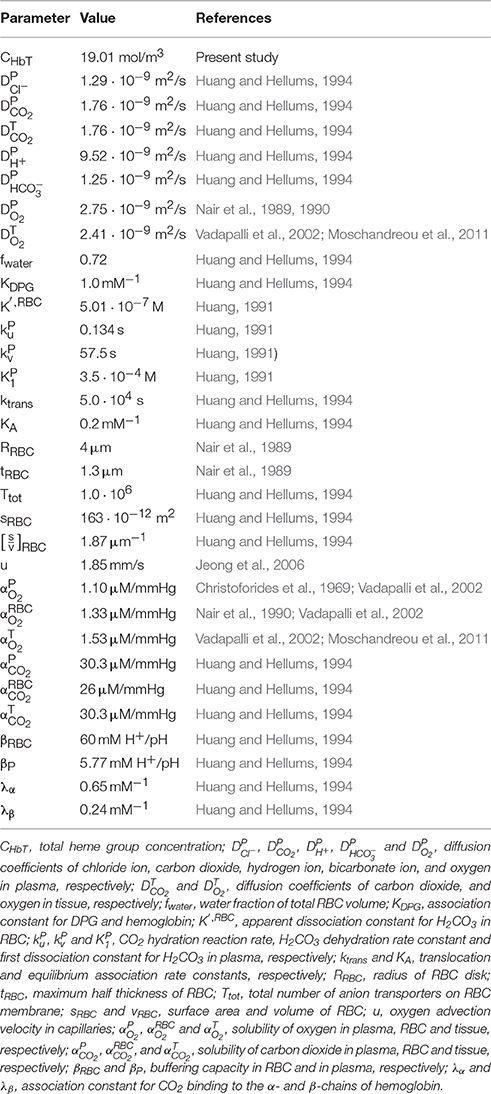
Table 2. Parameters used in the study.
Computational Implementation
Initially, the advection path of oxygen along capillaries, the hematocrit profile and the plasma and RBC velocity profiles are determined as described in Olgac and Kurtcuoglu (2015a) and set on the 3D computational domain. With all flow fields set, Equations (7)–(17) are solved inside the vessels while Equation (18) is solved in the tissue for carbon dioxide transport. The solutions of these two sets of equations are determined concurrently in the 3D computational domain. Once the solutions have been obtained, Equations (1)–(3) are solved in the same 3D domain for oxygen transport either with a constant P50 or with a variable P50 that is dependent on the local PCO2 and pH. The computations are performed in a time-dependent manner using the Euler method for time discretization. The computations are terminated when steady-state is reached, i.e., when temporal changes in the PCO2 and pH profiles (for carbon dioxide transport calculations) and in the PO2 profile (for oxygen transport calculations) at each representative level become negligible. A first order upwind scheme and a second order Gaussian integration scheme with harmonic interpolation for oxygen and carbon dioxide permeability are used for the spatial discretization of divergence and Laplacian terms, respectively. The resulting algebraic system is solved using a pre-conditioned bi-conjugate gradient solver (Ferzinger and Periæ, 1998) in Foam-extend-3.1 (Weller et al., 1998; Jasak et al., 2007). The solution is determined on all representative levels simultaneously. Independence of the reported results from the employed spatial discretization was confirmed as detailed in the Data Sheet 1 in Supplementary Material.
Boundary Conditions
PO2 at the inlet of the renal artery is fixed to PO2, RA. For carbon dioxide transport, at the renal artery inlet, chemical equilibrium of the carbon dioxide hydration/dehydration reaction both in RBC as well as in plasma () and zero flux of bicarbonate and chloride ions over the RBC membrane () are assumed, since the renal artery receives fresh systemic blood from the aorta. The inlet boundary condition (BC) values based on systemic arterial blood are listed in Table 3.
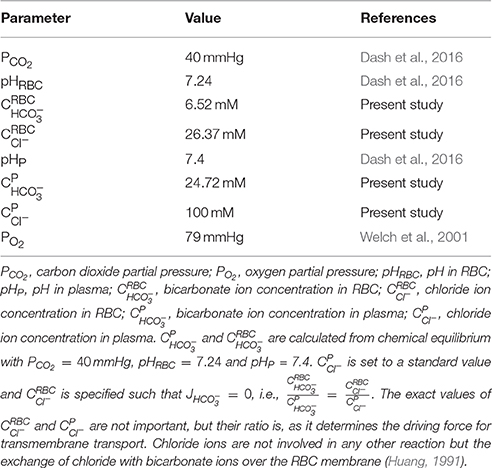
Table 3. Renal artery inlet boundary condition values.
For the rest of the inlet BCs, at each representative level throughout the computations, partial pressure of oxygen at the inlet, PO2, inlet, i, is specified such that the oxygen delivery DO2, inlet, i (see Data Sheet 1 in Supplementary Material for calculation) matches the delivery at the outlet of the previous level:
For carbon dioxide transport, at each representative level throughout the computational domain, partial pressure of carbon dioxide at the inlet, PCO2, inlet, i, hydrogen ion concentration in RBC at the inlet, , and bicarbonate ion concentration in RBC at the inlet, , are specified such that a new chemical equilibrium is established in RBC at the inlet, with carbon dioxide delivery DCO2, inlet, i matching the delivery at the outlet of the previous level:
where DCO2, inlet, i is the sum of deliveries of CO2 in plasma and RBC, hemoglobin-bound CO2 and in RBC (see Data Sheet 1 in Supplementary Material for calculation).
The remaining boundary conditions, i.e., concentration of chloride ion in RBC at the inlet, , concentration of hydrogen ion in plasma at the inlet, , concentration of bicarbonate ion in plasma at the inlet, , and concentration of chloride ion in plasma at the inlet, , are specified such that the delivery Dinlet, i of the respective species (see Data Sheet 1 in Supplementary Material for calculation) matches the delivery at the outlet of the previous level:
The venous return PO2, inlet, v, 0 is specified such that:
where and JO2, c are the medullary oxygen consumption rate and the flux of oxygen between the capillaries and the cortical tissue, respectively.
To set the boundary conditions on the venous return for carbon dioxide transport, we consider the CO2 transport dynamics in the vicinity of a proximal tubular cell as shown in Figure 2. Here we assume that all cortical CO2 production is due to active transport by the tubules, as the contribution of basal metabolism is small [3–18% in the mammalian kidney (Cohen and Kamm, 1981)]. We therefore further assume that all of the CO2 produced in the cortex is taken up by the nearby capillaries and transported to the venous return (thus does not diffuse into arterioles in the vicinity), where CO2 produced in the medulla is added as well. The bicarbonate generation rate required to preserve acid-base homeostasis of the blood is approximately 1 mmol/kg body weight (Boron and Boulpaep, 2012), or 0.19 μmol/min for a Wistar Kyoto (WKY) rat. We neglect this bicarbonate generation, as its rate is much smaller than the overall carbon dioxide production rate (see Table 4). CO2 produced by the proximal tubular cell is transported into the nearby capillaries in both CO2 and bicarbonate form, for which the ratio is unknown. Their ratio on the venous return is also unknown since they are subject to further reactions on the path from the capillaries to the venous return. We therefore consider two extreme conditions on the venous return and assume that the real state lies somewhere between these two conditions (see Data Sheet 1 in Supplementary Material for details):
Condition 1: Balanced CO2 distribution on the venous return. This condition assumes that the total renal CO2 production is distributed into all forms of CO2 on venous return, i.e., CO2 in plasma and RBC, in plasma and RBC, and hemoglobin bound CO2.
Condition 2: Unbalanced CO2 distribution on the venous return. This condition assumes that the total renal CO2 production is distributed into all forms of CO2 except in plasma on venous return.
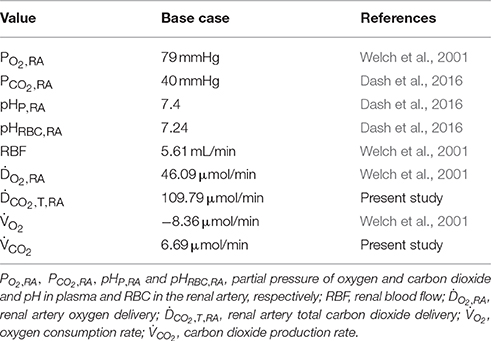
Table 4. Base case values.
The above given BCs ensure for both conditions that total oxygen and carbon dioxide delivery throughout the kidney is conserved, i.e., and (see Figure 3). DCO2, T is the total carbon dioxide delivery, which is the sum of deliveries of CO2 in plasma and RBC, hemoglobin-bound CO2 and in plasma and RBC (see Data Sheet 1 in Supplementary Material for calculation).
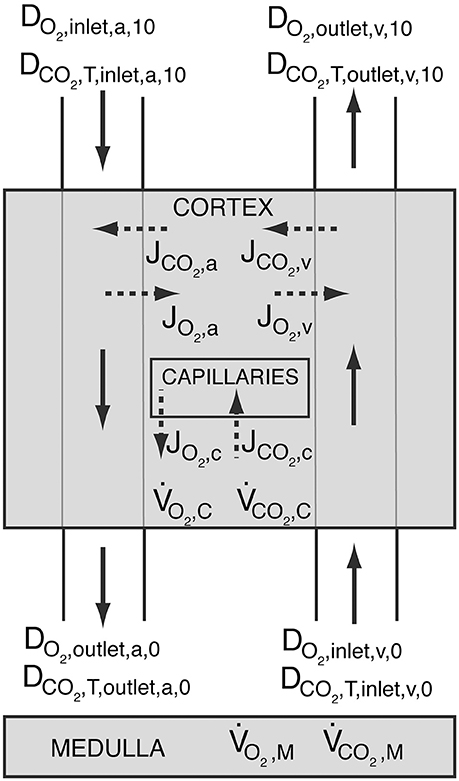
Figure 3. Schematic showing oxygen delivery (DO2) and total carbon dioxide delivery (DCO2, T) throughout the kidney. The shaded regions represent the cortex and the medulla. Solid arrows symbolize blood flow, whereas dashed arrows represent oxygen and carbon dioxide flux. Blood enters the arterial tree at order 10 and exits the explicitly modeled cortical domain at order 0. Blood enters cortical domain again at the venous side at order 0 and exits at order 10. JO2, a, JO2, v and JO2, c, and JCO2, a, JCO2, v and JCO2, c are the oxygen and carbon dioxide fluxes between the arteries and the tissue, the veins and the tissue, and capillaries and the tissue, respectively. Positive values designate flux from vessels to the tissue, whereas negative values stand for oxygen or carbon dioxide transfer from the tissue into the vessels. and are the cortical and medullary oxygen consumption rates, respectively, whereas and are the cortical and medullary carbon dioxide production rates, respectively. All carbon dioxide produced in the cortex is assumed to be taken up by capillaries, i.e., .
As to the outlet BCs, convective flux boundary conditions are imposed on all vessel outlets by setting the diffusive flux to zero. On all lateral surfaces, diffusive flux is set to zero. At the vessel-tissue interfaces, there is continuity of oxygen and carbon dioxide partial pressure and oxygen and carbon dioxide flux such that:
Base Case
The base case is derived from in vivo PO2 measurements with oxygen-sensitive ultramicroelectrodes in normotensive WKY rats as reported by Welch et al. (2001). Relevant values for the base case are summarized in Table 4. Of these, renal blood flow (RBF), oxygen delivery (DO2), oxygen consumption rate () and renal artery PO2 (PO2, RA) are measured values (Welch et al., 2001), renal artery PCO2 (PCO2, RA), pHRBC, RA and pHP, RA are based on systemic arterial blood (Dash et al., 2016), and carbon dioxide delivery (DCO2) is calculated based on these values and the rest of the renal artery inlet boundary conditions presented in Table 3. To set the carbon dioxide production rate in dependence of the oxygen consumption rate, we assume a respiratory quotient (RQ) of 0.8 (Weidemann and Krebs, 1969; Burke et al., 1999; Dash and Bassingthwaighte, 2006). Prescribing the reference renal artery PO2, PO2, RA, on the renal artery inlet, the total heme group concentration is set such that the renal artery oxygen delivery (DO2, inlet, a, 10) matches the values given in Table 4. Hence, the total heme group concentration is set to CHbT = 19.01 mol/m3 for the base case. We set capillary PO2, PO2, c, to an average of afferent arteriole outlet and venous return inlet, i.e., PO2, c = 0.5(PO2, outlet, a, 0 + PO2, inlet, v, 0). See Olgac and Kurtcuoglu (2015a) for details on capillary PO2.
Results
Base Case under Conditions 1 and 2
We first present the output of the model employing two different boundary conditions on the venous return. Condition 1 distributes total renal CO2 production into all forms of CO2 in the venous return, whereas Condition 2 excludes plasma bicarbonate in this distribution. Figures 4A,B demonstrate on the left panel under Condition 1 and on the right panel under Condition 2, arterial, venous and tissue PCO2 as well as plasma and RBC pH profiles, respectively. Condition 1 results in flatter profiles of both PCO2 and pH compared to Condition 2. Under Condition 1, PCO2 increases from 40 mmHg at the inlet of the renal artery (order 10) to 40.8 mmHg at the outlet of the afferent arteriole (order 0). Under Condition 2, the increase is to 42.3 mmHg. On the venous return, under Condition 1, PCO2 = 43.5 mmHg, whereas under Condition 2, PCO2 = 52.8 mmHg. The lower increase in PCO2 under Condition 1 is due to the fact that CO2 production is distributed into all forms of CO2 on the venous return, including the dominant plasma bicarbonate. Conversely, as there is no plasma bicarbonate added to the venous return under Condition 2, the same rate of renal CO2 production results in a higher increase in PCO2. This is also evident in the pH profiles: Under Condition 1, the pH profiles are almost flat with a slight overall decrease in plasma and RBC pH on the venous side due to the increased acidity (added renal CO2 production). Under Condition 2, plasma and RBC pH on the venous return are 7.28 and 7.21, respectively. This increased acidity is again owed to the addition of produced CO2 to the venous return in forms other than plasma bicarbonate. Figure 4C shows for both conditions the flux of carbon dioxide between artery walls and the tissue. As indicated by the negative fluxes, there is venous-to-arterial carbon dioxide shunting under both conditions, with more shunting under Condition 2. Overall, approximately 0.5 and 1.4% of the total renal carbon dioxide delivery is shunted under Conditions 1 & 2, respectively. The larger amount of carbon dioxide shunting under Condition 2 is primarily due to the higher PCO2 gradient between the venous and the arterial sides compared to Condition 1.
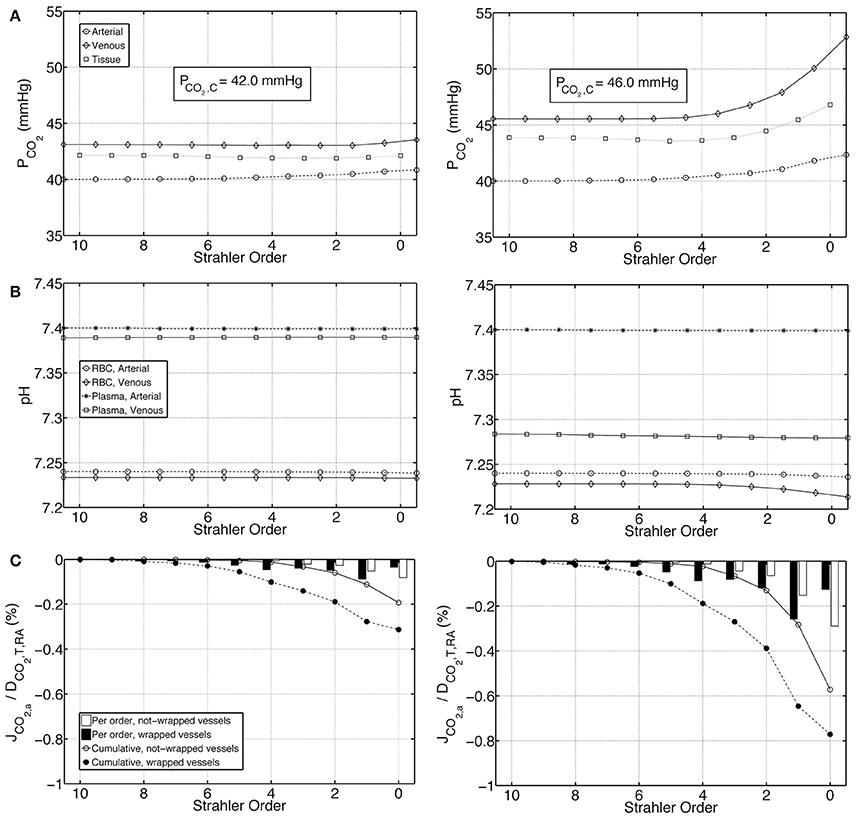
Figure 4. Comparison of results for the base case under Condition 1 (left) and Condition 2 (right). (A) Arterial, venous and tissue partial pressure of carbon dioxide (PCO2) profiles, as well as the average cortical carbon dioxide partial pressure, PCO2, C, (B) Arterial and venous plasma and RBC pH profiles, (C) Carbon dioxide flux across artery walls, JCO2, a, reported as percentage of total renal carbon dioxide delivery, DCO2, T, RA. Cumulative values as well as values for each individual order are shown. Positive flux represents flux from the vessel into the tissue, whereas negative flux denotes the opposite, i.e., negative JCO2, a denotes carbon dioxide shunted to the arterial tree.
The investigated Conditions 1 and 2, i.e., the distribution of total renal CO2 in all forms of CO2 on the venous return and the exclusion of plasma bicarbonate during this distribution, respectively, represent extreme cases. The real state must lie between these two. We therefore estimate the average cortical PCO2, PCO2, C, to be between 42.0 and 46.0 mmHg.
Effects of CO2 Transport on O2 Shunting
We performed O2 transport calculations with a constant P50, and a variable P50 whose dependence on the local PCO2 and pH is given by Equation 6(a)–(c). The O2 transport calculations with variable P50 are based on the PCO2 and pH fields obtained from carbon dioxide transport calculations under Condition 2, because under this condition, the maximum possible increase in PCO2 and decrease in pH in the preglomerular vasculature compared to the systemic arterial blood are reached. In other words, this condition captures the highest possible effect of CO2 transport on O2 transport.
Figures 5A,B show PO2 profiles in arteries, veins and tissue, as well as oxygen fluxes between vein walls and tissue. The PO2 profiles for the constant and variable P50 cases are very similar, with a slight overall increase in PO2 for the variable P50 case due to higher P50 compared to the constant P50 case. For the constant P50 case, cumulatively 0.6% of the total renal oxygen delivery is shunted from the arteries to the veins along wrapped artery-vein pairs, whereas 0.2% of the total renal oxygen delivery is supplied to the tissue by the veins along not-wrapped artery-vein pairs. Hence, for this case, the total preglomerular AV oxygen shunting is 0.4% of the total renal oxygen delivery. Note that these results are slightly different from the ones given in our previous study (Olgac and Kurtcuoglu, 2015b). This is due to the fact that we used P50 = 34 mmHg there compared to P50 = 26.8 mmHg in the current study.
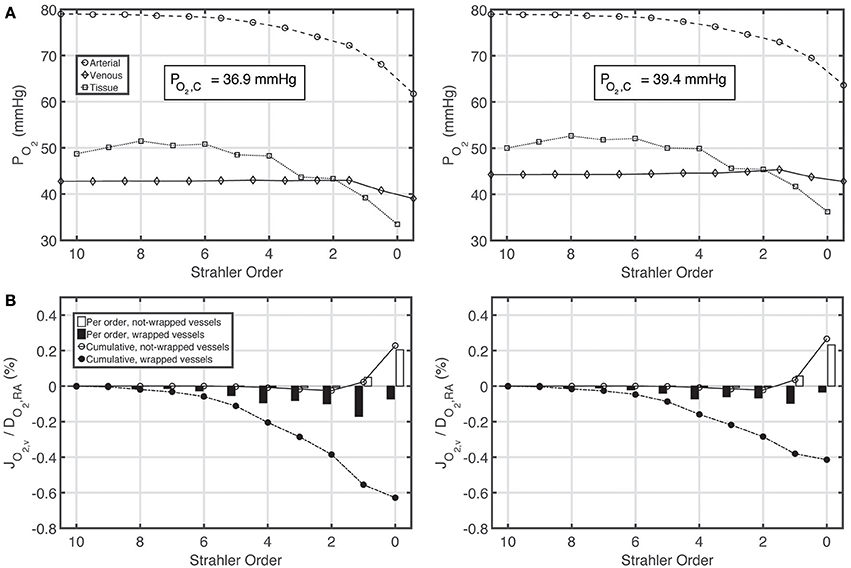
Figure 5. Comparison of results for the base case with constant P50 (left) and variable P50 dependent on the local PCO2 and pH based on Condition 2 (right). (A) Arterial, venous and tissue partial pressure of oxygen (PO2) profiles, and average cortical oxygen partial pressure, PO2, C, (B) Oxygen flux across vein walls, JO2, v, reported as percentage of total renal oxygen delivery, DO2, RA. Cumulative values as well as values for each individual order are shown. Positive flux represents flux from the vessel into the tissue, whereas negative flux denotes the opposite, i.e., negative JO2, v denotes oxygen shunted to the venous tree.
Under variable P50 conditions, oxygen shunting along the wrapped vessels decreases, with overall preglomerular AV oxygen shunting reducing to 0.15% of the total renal oxygen delivery. Hence, CO2 effects do not promote but rather decrease preglomerular AV O2 shunting. This is because the increase in acidity (and hence the decrease in the affinity of hemoglobin to oxygen) is more pronounced on the venous compared to the arterial side.
Effects of Buffering Capacity
To test the influence of buffering capacity, we performed calculations on a modified base case with a 10 fold decrease in plasma and RBC buffering capacities. Figures 6A–C represent, on the left panel under Condition 1 and on the right panel under Condition 2, PCO2, pH and carbon dioxide flux profiles for this modified case. Compared to the base case results presented in Figure 4, under both Conditions 1 & 2, the increase in PCO2 and decrease in pH are more pronounced when the buffering capacity is decreased. PCO2 increases to 42.8 and 46.2 mmHg at the outlet of the afferent arteriole (order 0) under Conditions 1 & 2, respectively. On the venous return, under Condition 1, PCO2 = 49.1 mmHg, whereas under Condition 2, PCO2 = 63.2 mmHg. Furthermore, pH profiles vary more compared to the rather flat profiles in Figure 4. On the venous return, plasma and RBC pH are 7.30 and 7.18, respectively, under Condition 1, compared to 7.20 and 7.10, respectively, under Condition 2. VA CO2 shunting is also increased due to the increased PCO2 gradient between the venous and the arterial side, with 1.2 and 2.4% of the total renal CO2 delivery shunted from the preglomerular veins to the arteries under Conditions 1 & 2, respectively.
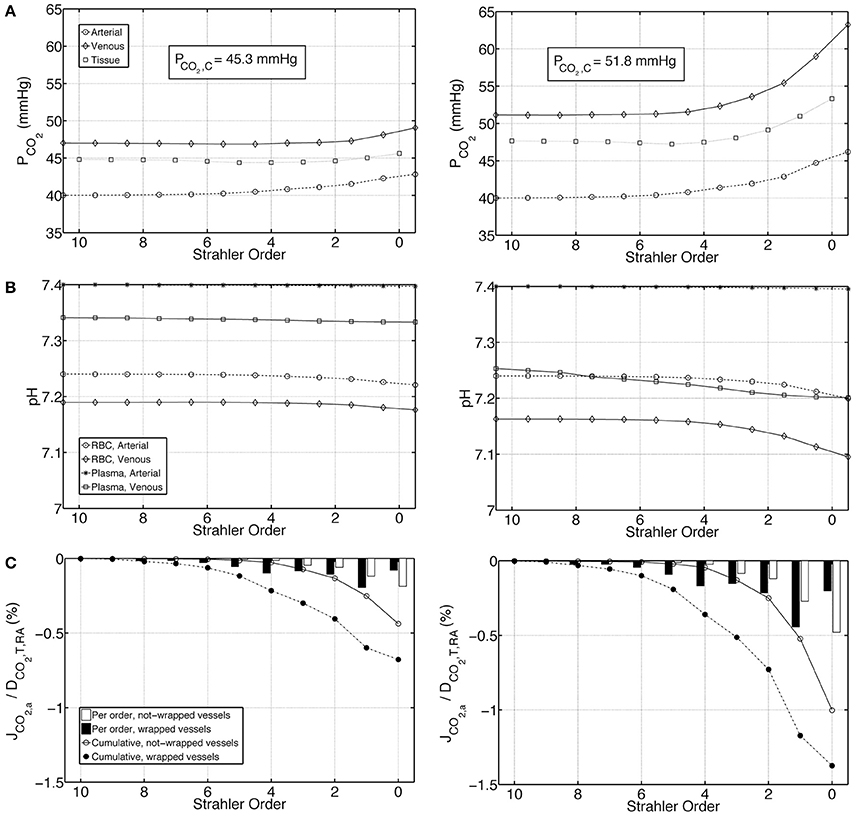
Figure 6. Comparison of results for a case with tenfold decreased plasma and RBC buffering capacity under Condition 1 (left) and Condition 2 (right), (A) Arterial, venous and tissue partial pressure of carbon dioxide (PCO2) profiles, (B) Arterial and venous plasma and RBC pH profiles, (C) Carbon dioxide flux across artery walls, JCO2, a, reported as percentage of total renal carbon dioxide delivery, DCO2, T, RA. Cumulative values as well as values for each individual order are shown. Positive flux represents flux from the vessel into the tissue, whereas negative flux denotes the opposite, i.e., negative JCO2, a denotes carbon dioxide shunted to the arterial tree.
Discussion
We have made the following key observations: 1 Increase in acidity in the preglomerular vasculature compared to systemic arterial blood is marginal. 2 CO2 effects do not promote preglomerular arterial-to-venous O2 shunting but rather impair it. In the following we will discuss these observations.
Marginal Increase in Acidity in the Preglomerular Vasculature
We calculated the PCO2 at the outlet of the afferent arteriole and on the venous return to be in the range of 40.8–42.3 mmHg and 43.5–52.8 mmHg, respectively, for a renal arterial PCO2 of 40 mmHg. Plasma and RBC pH on the venous return decrease to somewhere between 7.28–7.39 and 7.21–7.23, respectively, compared to their systemic arterial values of 7.4 and 7.24, respectively. Taken together, we conclude that the increase in acidity in the preglomerular vasculature is not substantial. The main reason for this is the high buffering capacity of blood. When we lowered the buffering capacity in our model, acidity increased substantially. It should be noted that there may be more pronounced increase in acidity in the postglomerular vasculature, along the peritubular capillary network and/or the vasa recta. Our current model does not include these parts.
Previous modeling studies by Bidani et al. (1984) and Atherton et al. (1988) were based on the proximal tubular PCO2 of 65 mmHg measured by DuBose et al. (1979). They indicated that substantial venous-to-arterial CO2 shunting would be necessary to preserve this PCO2 of 65 mmHg in the renal cortex. Here we calculated average cortical PCO2, PCO2, C, to be between 42.0 and 46.0 mmHg. We further calculated the shunting of CO2 from the veins to the arteries to be approximately between 0.5 and 1.4% of the total renal carbon dioxide delivery. We conclude that just as the increase in acidity, the venous-to-arterial CO2 shunting in the preglomerular vasculature is also only marginal.
CO2 Effects Impair Preglomerular AV O2 Shunting
We observed that when calculations are based on a variable P50 that is dependent on the local PCO2 and pH, the AV O2 shunting decreases. This is mainly because the increase in acidity is higher on the venous side, which leads to a lower affinity of hemoglobin to oxygen compared to the arterial side. This lower affinity on the venous side makes it slightly harder for the oxygen to bind to hemoglobin, diminishing the oxygen transfer from the tissue into the veins, hence decreasing AV O2 shunting. Therefore, our model does not support the hypothesis initially proposed by Schurek et al. (1990) that renal CO2 trapping through a reverse CO2 shunting mechanism may enhance AV O2 shunting through the Bohr effect. The current model thus also confirms our previous findings that preglomerular AV O2 shunting is marginal, and that if substantial renal oxygen shunting exists, it should be along the post-glomerular vasculature, i.e., the peritubular capillary network and/or the vasa recta (Olgac and Kurtcuoglu, 2015a,b).
Limitations of the Model
The main limitation of the model is that the distribution of the different forms of CO2 in the venous return is unknown. To address this, two different conditions representing extreme cases were employed and ranges of values reported. The actual values representing the real state are expected to lie within the given ranges. More accurate calculations would require that CO2 transport dynamics in the peritubular capillary network be taken into account, which would necessitate explicit treatment of the postglomerular vasculature and the tubular system. Modeling bicarbonate reabsorption in this domain would yield an estimate of what fraction of the carbon dioxide produced in the tubular cells reaches the capillaries in bicarbonate and CO2 form, respectively. This fraction is unknown in the current model. Nevertheless, the two conditions employed on the venous return provide solid boundaries for the ranges of PCO2 and pH in the preglomerular vasculature, and the conclusions reached in this study are valid for both conditions.
A further limitation of this computational study is produced by the fact that there are no comparable experimental studies of renal carbon dioxide transport which could be used for validation. The experimental PCO2 and pH measurements referred to in the Introduction section have been performed on tubules and stellate vessels, and can thus not be compared with our results. Quantitative cortical tissue and afferent arteriole PCO2 and pH values have, to our knowledge, not been published. To test the robustness of our conclusions, we performed sensitivity analyses in which we altered renal artery inlet boundary conditions.
First, we established alternative chemical equilibria at the renal artery inlet corresponding to renal artery PCO2 values of 35 mmHg and 45 mmHg, respectively. This accounts for possible variation in renal artery PCO2 in the physiologic range. We calculated maximum PCO2 at the outlet of the afferent arteriole and on the venous return to be 37.1 and 47.1 mmHg, respectively, for renal artery PCO2 of 35 mmHg, and 47.6 and 58.5 mmHg, respectively, for renal artery PCO2 of 45 mmHg (Supplementary Figure 1, Supplementary Table 1). These extreme cases show relative increases in PCO2 in the preglomerular vasculature with respect to renal artery PCO2 that are similar to the base case. Plasma and RBC pH on the venous return decrease to minima of 7.32 and 7.22, respectively, for renal artery PCO2 of 35 mmHg, plasma pH of 7.45 and RBC pH of 7.25 (Supplementary Figure 1, Supplementary Table 1). For the other extreme case with renal artery PCO2 of 45 mmHg, plasma pH of 7.35 and RBC pH of 7.23, we calculated minimum plasma and RBC pH on the venous return to be 7.24 and 7.20, respectively (Supplementary Figure 1, Supplementary Table 1). These relative decreases in pH in the preglomerular vasculature with respect to renal artery pH in the extreme cases are similar to that in the base case. Furthermore, oxygen transport calculations in these extreme cases under variable P50 conditions show impaired AV oxygen shunting compared to under constant P50 conditions, just as it was observed in the base case (Supplementary Figures 2, 3). There, under variable P50 conditions, overall preglomerular oxygen shunting reduced to 0.15% of the total renal oxygen delivery, compared to 0.40% under constant P50 conditions. In the extreme cases, this reduction was to 0.20 and 0.10% of the total renal oxygen delivery for renal arterial PCO2 of 35 mmHg and 45 mmHg, respectively (Supplementary Table 2).
In a second analysis, we altered the renal blood flow rate (RBF) by 30% in either direction. With a 30% decrease in RBF, the increase in acidity in the preglomerular vasculature became more pronounced. We calculated for this case maximum PCO2 at the outlet of the afferent arteriole and on the venous return to be 44.1 and 59.6 mmHg, respectively (Supplementary Figure 4, Supplementary Table 3). Plasma and RBC pH on the venous return decrease to minima of 7.23 and 7.20, respectively. Conversely, with a 30% increase in RBF, the increase in acidity in the preglomerular vasculature became less pronounced with maximum PCO2 of 41.6 and 49.5 mmHg at the outlet of the afferent arteriole and on the venous return, respectively, and minimum plasma and RBC pH on the venous return of 7.31 and 7.22, respectively (Supplementary Figure 4, Supplementary Table 3). In these extreme cases, AV O2 shunting reduced from 0.81% (under constant P50 conditions) to 0.32% (under variable P50 conditions) of the total renal oxygen delivery (with 30% decrease in RBF) and from 0.21% (under constant P50 conditions) to 0.05% (under variable P50 conditions) of the total renal oxygen delivery (with 30% increase in RBF) (Supplementary Figures 5, 6, Supplementary Table 4). In comparison, in the base case, AV O2 shunting reduced from 0.40% (under constant P50 conditions) to 0.15% (under variable P50 conditions) of the total renal oxygen delivery (Supplementary Table 4).
We conclude that our first main observation, namely that increase in acidity in the preglomerular vasculature compared to systemic arterial blood is marginal, is robust unless RBF is substantially reduced. Our second main observation, i.e., that CO2 effects do not promote preglomerular arterial-to-venous O2 shunting but rather impair it, is robust for all investigated nominal and extreme conditions.
Conclusions
Our model suggests that under normal physiologic conditions, the increase in acidity in the preglomerular vasculature compared to systemic arterial blood is marginal, and that venous-to-arterial shunting of carbon dioxide does not promote, but rather impairs preglomerular arterial-to-venous oxygen shunting.
Author Contributions
UO and VK designed this research; UO and VK developed the mathematical model; UO implemented the computational model and performed the computations; UO and VK interpreted results of the computations; UO prepared figures; UO drafted the manuscript; UO and VK edited and revised the manuscript; UO and VK approved final version of the manuscript.
Funding
The financial support of the Swiss National Center of Competence in Research on Control of Homeostasis by the Kidney (NCCR Kindey.CH) is kindly acknowledged.
Conflict of Interest Statement
The authors declare that the research was conducted in the absence of any commercial or financial relationships that could be construed as a potential conflict of interest.
Supplementary Material
The Supplementary Material for this article can be found online at: http://journal.frontiersin.org/article/10.3389/fphys.2016.00482/full#supplementary-material
References
Atherton, L. J., Maddox, D. A., Gennari, F. J., and Deen, W. M. (1988). Analysis of PCO2 variations in the renal cortex. II. Countercurrent exchange. Am. J. Physiol. 255(2 Pt 2), F361–F371.
Bidani, A., Crandall, E. D., and DuBose, T. D. Jr. (1984). Analysis of the determinants of renal cortical Pco2. Am. J. Physiol. 247, F466–F474.
Boron, W. F., and Boulpaep, E. L. (2012). Medical Physiology. Philadelphia, PA: Elsevier Health Sciences.
Burke, T. J., Malhotra, D., and Shapiro, J. I. (1999). Factors maintaining a pH gradient within the Kidney: role of the vasculature architecture. Kidney Int. 56, 1826–1837. doi: 10.1046/j.1523-1755.1999.00738.x
Christoforides, C., Laasberg, L. H., and Hedley-Whyte, J. (1969). Effect of temperature on solubility of O2 in human plasma. J. Appl. Physiol. 26, 56–60.
Clark, A. Jr., Federspiel, W. J., Clark, P. A. A., and Cokelet, G. R. (1985). Oxygen delivery from red-cells. Biophys. J. 47, 171–181. doi: 10.1016/S0006-3495(85)83890-X
Dash, R. K., and Bassingthwaighte, J. B. (2006). Simultaneous blood-tissue exchange of oxygen, carbon dioxide, bicarbonate, and hydrogen ion. Ann. Biomed. Eng. 34, 1129–1148. doi: 10.1007/s10439-005-9066-4
Dash, R. K., Korman, B., and Bassingthwaighte, J. B. (2016). Simple accurate mathematical models of blood HbO2 and HbCO2 dissociation curves at varied physiological conditions: evaluation and comparison with other models. Eur. J. Appl. Physiol. 116, 97–113. doi: 10.1007/s00421-015-3228-3
Davenport, H. W. (1958). The ABC of Acid-base Chemistry: The Elements of Physiological Blood-gas Chemistry for Medical Students and Physicians. Chicago, IL: University of Chicago Press.
De Mello Aires, M., Lopes, M. J., and Malnic, G. (1990). PCO2 in renal cortex. Am. J. Physiol. 259(2 Pt 2), F357–F365.
DuBose, T. D. Jr., and Bidani, A. (1988). Kinetics of Co2 exchange in the Kidney. Ann. Rev. Physiol. 50, 653–667. doi: 10.1146/annurev.ph.50.030188.003253
DuBose, T. D., Pucacco, L. R., Lucci, M. S., and Carter, N. W. (1979). Micropuncture determination of Ph, Pco2, and Total Co2 concentration in accessible structures of the rat renal cortex. J. Clin. Invest. 64, 476–482. doi: 10.1172/JCI109485
Evans, R. G., Gardiner, B. S., Smith, D. W., and O'Connor, P. M. (2008). Intrarenal oxygenation: unique challenges and the biophysical basis of homeostasis. Am. J. Physiol. Renal Physiol. 295, F1259–F1270. doi: 10.1152/ajprenal.90230.2008
Ferzinger, J. H., and Periæ, M. (1998). Computational Methods for Fluid Dynamics. Berlin; Heidelberg; New York, NY: Springer.
Huang, N. S. (1991). Mathematical Simulation of Gas Transport and Acid/Base Regulation by Blood Flowing in Microvessels. PhD, Rice University.
Huang, N. S., and Hellums, J. D. (1994). A theoretical-model for gas-transport and acid/base regulation by blood flowing in microvessels. Microvasc. Res. 48, 364–388. doi: 10.1006/mvre.1994.1062
Jasak, H., Jemcov, A., and Tukovic, Z. (2007). “OpenFOAM: A C++ Library for complex physics simulations,” in International Workshop on Coupled Methods in Numerical Dynamics IUC. Dubrovnik.
Jeong, J. H., Sugii, Y., Minamiyama, M., and Okamoto, K. (2006). Measurement of RBC deformation and velocity in capillaries in vivo. Microvasc. Res. 71, 212–217. doi: 10.1016/j.mvr.2006.02.006
Kilmartin, J. V., and Rossi-Bernardi, L. (1973). Interaction of hemoglobin with hydrogen ions, carbon dioxide, and organic phosphates. Physiol. Rev. 53, 836–890.
Leong, C. L., Anderson, W. P., O'Connor, P. M., and Evans, R. G. (2007). Evidence that renal arterial-venous oxygen shunting contributes to dynamic regulation of renal oxygenation. Am. J. Physiol. Renal Physiol. 292, F1726–F1733. doi: 10.1152/ajprenal.00436.2006
Maddox, D. A., Atherton, L. J., Deen, W. M., and Gennari, F. J. (1984). Proximal Hco3- reabsorption and the determinants of tubular and capillary Pco2 in the Rat. Am. J. Physiol. 247, F73–F81.
Moschandreou, T. E., Ellis, C. G., and Goldman, D. (2011). Influence of tissue metabolism and capillary oxygen supply on arteriolar oxygen transport: a computational model. Math. Biosci. 232, 1–10. doi: 10.1016/j.mbs.2011.03.010
Nair, P. K., Hellums, J. D., and Olson, J. S. (1989). Prediction of oxygen-transport rates in blood flowing in large capillaries. Microvasc. Res. 38, 269–285. doi: 10.1016/0026-2862(89)90005-8
Nair, P. K., Huang, N. S., Hellums, J. D., and Olson, J. S. (1990). A simple-model for prediction of oxygen-transport rates by flowing blood in large capillaries. Microvasc. Res. 39, 203–211. doi: 10.1016/0026-2862(90)90070-8
Ngo, J. P., Kar, S., Kett, M. M., Gardiner, B. S., Pearson, J. T., Smith, D. W., et al. (2014). Vascular geometry and oxygen diffusion in the vicinity of artery-vein pairs in the Kidney. Am. J. Physiol. Renal Physiol. 307, F1111–F1122. doi: 10.1152/ajprenal.00382.2014
Olgac, U., and Kurtcuoglu, V. (2015a). Renal oxygenation: preglomerular vasculature is an unlikely contributor to renal oxygen shunting. Am. J. Physiol. Renal Physiol. 308, F671–F688. doi: 10.1152/ajprenal.00551.2014
Olgac, U., and Kurtcuoglu, V. (2015b). Reply to “Letter to the editor: ‘The plausibility of arterial-to-venous oxygen shunting in the Kidney: it all depends on radial geometry”’. Am. J. Physiol. Renal Physiol. 309, F181–F182. doi: 10.1152/ajprenal.00221.2015
Salathe, E. P. (1982). Mathematical-modeling of oxygen-transport in skeletal-muscle. Math. Biosci. 58, 171–184. doi: 10.1016/0025-5564(82)90071-2
Schurek, H. J., Jost, U., Baumgärtl, H., Bertram, H., and Heckmann, U. (1990). Evidence for a preglomerular oxygen diffusion shunt in rat renal-cortex. Am. J. Physiol. 259, F910–F915.
Sohtell, M. (1979). Co2 along the proximal tubules in the Rat-Kidney. Acta Physiol. Scand. 105, 146–155. doi: 10.1111/j.1748-1716.1979.tb06326.x
Vadapalli, A., Goldman, D., and Popel, A. S. (2002). Calculations of oxygen transport by red blood cells and hemoglobin solutions in capillaries. Artif. Cells Blood Substit. Immobili. Biotechnol. 30, 157–188. doi: 10.1081/BIO-120004338
Weidemann, M. J., and Krebs, H. A. (1969). The fuel of respiration of Rat Kidney cortex. Biochem. J. 112, 149–166. doi: 10.1042/bj1120149
Welch, W. J., Baumgartl, H., Lubbers, D., and Wilcox, C. S. (2001). Nephron pO(2) and renal oxygen usage in the hypertensive Rat Kidney. Kidney Int. 59, 230–237. doi: 10.1046/j.1523-1755.2001.00483.x
Weller, H. G., Tabor, G., Jasak, H., and Fureby, C. (1998). A tensorial approach to computational continuum mechanics using object-oriented techniques. Comput. Phys. 12, 620–631. doi: 10.1063/1.168744
Nomenclature
AV Arterial-to-venous
Carbonic anhydrase activity factor
BC Boundary condition
C Concentration
DP Diffusion coefficient in plasma
DT Diffusion coefficient in tissue
D Delivery
DPG 2,3-Diphosphoglycerate
e Relative error
fwater Water fraction of total RBC volume
h(r) Radial hematocrit profile
Hc Capillary hematocrit
J Flux
K Permeability
KA Equilibrium association rate constant
K′ Apparent dissociation constant for H2CO3
K1 First dissociation constant for H2CO3
KDPG Association constant for DPG and hemoglobin
k Number of vessels
ktrans Translocation rate constant
ku CO2 hydration reaction rate
kv H2CO3 dehydration rate constant
l Length of vessel
LS Lumen separation
Local consumption/production rate
Capillary source/sink
NA Avogadro number
n Empirical constant in Hill equation
P50 Half saturation oxygen partial pressure
P Partial pressure
r Radial location
R Reaction rate
Ra Artery radius
Rv Vein radius
RBC Red blood cell
RRBC Radius of RBC disk
RBF Renal blood flow rate
RQ Respiratory quotient
SO2 Saturation of hemoglobin with oxygen
tRBC Maximum half thickness of RBC
Ttot Total number of anion transporters on RBC membrane
u Oxygen advection velocity in capillaries
u(r) Radial velocity profile in RBC-rich region
u′(r) Radial velocity profile in RBC-free region
Consumption/production rate
VA Venous-to-arterial
WKY Wistar Kyoto rat
z Axial location
α Solubility coefficient
β Buffering capacity
δ Thickness of RBC-free region
λα Association constant for CO2 binding to the α-chain of hemoglobin
λβ Association constant for CO2 binding to the β-chain of hemoglobin
φ Fractional capillary volume
Superscripts and subscripts
a Arterial
AT Anion transporter
c Capillary
C Cortical
Cl− Chloride ion
CO2 Carbon dioxide
H+ Hydrogen ion
HbO2 Heme groups bound to oxygen
HbCO2 Hemoglobin carbamate
HbCO2, T Total hemoglobin bound CO2
O2HbCO2 Oxyhemoglobin carbamate
HbT Total heme groups
Bicarbonate ion
i Representative level
M Medullary
nw Not-wrapped
O2 Oxygen
P Plasma
RA Renal artery
RBC Red blood cell
S Standard physiological
T Tissue
v Venous
w wrapped
Keywords: renal oxygenation, oxygen shunting, carbon dioxide shunting, pH, Bohr effect
Citation: Olgac U and Kurtcuoglu V (2016) The Bohr Effect Is Not a Likely Promoter of Renal Preglomerular Oxygen Shunting. Front. Physiol. 7:482. doi: 10.3389/fphys.2016.00482
Received: 13 July 2016; Accepted: 07 October 2016;
Published: 27 October 2016.
Edited by:
Timothy W. Secomb, University of Arizona, USAReviewed by:
Daniel Goldman, University of Western Ontario, CanadaBrendan Fry, Metropolitan State University of Denver, USA
Copyright © 2016 Olgac and Kurtcuoglu. This is an open-access article distributed under the terms of the Creative Commons Attribution License (CC BY). The use, distribution or reproduction in other forums is permitted, provided the original author(s) or licensor are credited and that the original publication in this journal is cited, in accordance with accepted academic practice. No use, distribution or reproduction is permitted which does not comply with these terms.
*Correspondence: Vartan Kurtcuoglu, vartan.kurtcuoglu@uzh.ch