 Ferran Comas1,2†
 Cristina Martínez1†
 Mònica Sabater1,2Francisco Ortega1,2
 Jessica Latorre1,2
 Francisco Díaz-Sáez3,4
 Julian Aragonés5,6Marta Camps3,4Anna Gumà3,4Wifredo Ricart1,2,7
 José Manuel Fernández-Real1,2,7
 José María Moreno-Navarrete1,2,7*
- 1Department of Diabetes, Endocrinology and Nutrition, Institut d’Investigació Biomèdica de Girona, Girona, Spain
- 2CIBEROBN (CB06/03/010), Instituto de Salud Carlos III, Madrid, Spain
- 3Department of Biochemistry and Molecular Biomedicine, Faculty of Biology, Institute of Biomedicine of the University of Barcelona, Barcelona, Spain
- 4CIBER de Diabetes y Enfermedades Metabólicas Asociadas, Instituto de Salud Carlos III, Madrid, Spain
- 5Research Unit, Hospital of Santa Cristina, Research Institute Princesa, Autonomous University of Madrid, Madrid, Spain
- 6CIBER de Enfermedades Cardiovasculares, Carlos III Health Institute, Madrid, Spain
- 7Department of Medicine, University of Girona, Girona, Spain
Background: Nrg4 expression has been linked to brown adipose tissue activity and browning of white adipocytes in mice. Here, we aimed to investigate whether these observations could be translated to humans by investigating NRG4 mRNA and markers of brown/beige adipocytes in human visceral (VAT) and subcutaneous adipose tissue (SAT). We also studied the possible association of NRG4 with insulin action.
Methods: SAT and VAT NRG4 and markers of brown/beige (UCP1, UCP3, and TMEM26)-related gene expression were analyzed in two independent cohorts (n = 331 and n = 59). Insulin resistance/sensitivity was measured using HOMAIR and glucose infusion rate during euglycemic hyperinsulinemic clamp.
Results: In both cohort 1 and cohort 2, NRG4 and thermogenic/beige-related gene expression were significantly increased in VAT compared to SAT. Adipogenic-related genes followed an opposite pattern. In cohort 1, VAT NRG4 gene expression was positively correlated with BMI and expression of UCP1, UCP3, TMEM26, and negatively with adipogenic (FASN, PPARG, and SLC2A4)- and inflammatory (IL6 and IL8)-related genes. In SAT, NRG4 gene expression was negatively correlated with HOMAIR and positively with UCP1 and TMEM26 gene expression. Multiple linear regression analysis revealed that expression of TMEM26 gene was the best predictor of NRG4 gene expression in both VAT and SAT. Specifically, NRG4 and TMEM26 gene expression was significantly increased in VAT, but not in SAT stromal vascular fraction cells (p < 0.001). In cohort 2, the significant association between NRG4 and TMEM26 gene expression in both VAT and SAT was confirmed, and SAT NRG4 gene expression also was positively correlated with insulin action and the expression of UCP1.
Conclusion: Current findings suggest NRG4 gene expression as a novel marker of beige adipocytes in human adipose tissue.
Introduction
The modulation of brown adipose tissue activity and browning of white adipose tissue has been proposed as a promising therapeutic strategy in the treatment of obesity-associated metabolic disturbances (Wu et al., 2012; Bartelt and Heeren, 2014; Hepler et al., 2017; Rabhi et al., 2018; Zhang S. et al., 2018), with the intention of improving insulin sensitivity (Hepler et al., 2017; Rabhi et al., 2018) and hepatic steatosis (Huang et al., 2017), among others.
Several studies pointed to neuregulins as an important family of ligands that regulate diverse aspects of glucose and lipid metabolism and energy balance. In skeletal muscle cells, recombinant neuregulin administration stimulated glucose uptake in muscle cells (Suárez et al., 2001) in an alternative insulin-independent mechanism, activating PI3K, PDK1, and PKCzeta pathways (Cantó et al., 2004), and promoted glucose and palmitate oxidation, enhancing mitochondrial oxidative capacity (Cantó et al., 2007). In liver, neuregulin 1 (Nrg1) and neuregulin 4 (Nrg4) reduced gluconeogenesis and lipogenesis and increased fatty acid oxidation, improving systemic insulin sensitivity and glucose tolerance (Wang et al., 2014; Ennequin et al., 2015; Ma et al., 2016; Chen et al., 2017; Zhang P. et al., 2018). In fact, the Nrg4/ErbB4 signaling pathway protects hepatocytes from stress-induced cell death, preventing the steatosis to steatohepatitis progression (Guo et al., 2017). In human breast cancer cells, NRG1 binding to ERBB4 activates SREBP-2 and led to increased expression of LDL uptake- and cholesterol biosynthesis-related genes (Haskins et al., 2015). A recent study demonstrated that ErbB4 deletion accelerated the development of obesity, dyslipidemia, hepatic steatosis, hyperglycemia, hyperinsulinemia and insulin resistance after 24 week on a medium-fat diet (Zeng et al., 2018). Nrg4, a specific ligand for ErbB4 involved in neurite growth, administration in 3T3-L1 adipocytes inhibited lipogenesis and induced browning and glucose uptake, but did not exert any effects on adipogenesis and lipolysis (Zeng et al., 2018). In fact, Nrg4 has been proposed as a marker of brown adipose tissue (BAT) activity in mice, being highly expressed in cold-induced BAT activity and white adipose tissue (WAT) browning (Rosell et al., 2014; Wang et al., 2014). NRG4 was expressed in fully differentiated brown adipocytes, but not in preadipocytes, and increased during brown adipocyte differentiation (Rosell et al., 2014; Wang et al., 2014). In vitro experiments showed that brown adipocytes-derived NRG4 might promote the growth of neurites in adipose tissue, increasing sympathetic innervation, enhancing BAT activity and browning of WAT (Rosell et al., 2014). However, Wang et al. (2014) reported that despite the abundant expression of Nrg4 in BAT, it seems dispensable for cold-induced hypothermia response, being Ucp1 and Dio2 induced to similar extent by cold exposure in WT and NRG4KO mice. These findings indicated that Nrg4 did not directly participate in BAT thermogenesis.
Diet-induced obesity led to a significant decreased Nrg4 gene expression in WAT but not BAT (Wang et al., 2014; Ma et al., 2016; Chen et al., 2017) in mice. A recent study also showed that diet-induced non-alcoholic steatohepatitis (NASH) resulted in a significant reduced Nrg4 in both BAT and WAT (Guo et al., 2017). These studies suggested that adipose tissue-derived Nrg4 could exert positive effects on obesity associated metabolic disturbances (Wang et al., 2014; Ma et al., 2016; Chen et al., 2017; Guo et al., 2017), improving glucose tolerance and insulin sensitivity and attenuating adipose tissue and liver inflammation (Wang et al., 2014; Ma et al., 2016; Chen et al., 2017; Guo et al., 2017).
In humans, only one study investigates NRG4 mRNA levels in adipose tissue in association with body fat mass, liver lipid content and glucose tolerance (Wang et al., 2014), but no previous studies investigated the relationship between NRG4 and markers of adipose tissue browning in human adipose tissue. Since previous mice studies demonstrated that NRG4 was a marker of BAT activity and browning of WAT (Rosell et al., 2014; Wang et al., 2014; Ma et al., 2016; Chen et al., 2017), in the present study we aimed to investigate the potential relationship between human adipose tissue NRG4 and markers of brown/beige adipocytes. Furthermore, the impact of adipose tissue NRG4 on human obesity and insulin sensitivity was also evaluated.
Materials and Methods
Human Adipose Tissue Samples
In cohort 1, a group of 331 [155 visceral (VAT) and 176 subcutaneous (SAT) adipose tissues] (Cohort 1) from participants with normal body weight and different degrees of obesity, with body mass index (BMI) within 20 and 68 kg/m2, were analyzed. In a second cohort of morbidly obese (BMI > 35 kg/m2) subjects with different degrees of insulin action [measured using hyperinsulinemic-euglycemic clamp (Moreno-Navarrete et al., 2013)], VAT (n = 34) and SAT (n = 25) samples (Cohort 2) were studied. Altogether these subjects were recruited at the Endocrinology Service of the Hospital of Girona “Dr Josep Trueta.” All subjects were of Caucasian origin and reported that their body weight had been stable for at least 3 months before the study. Subjects were studied in the post-absorptive state. BMI was calculated as weight (in kg) divided by height (in m) squared. They had no systemic disease other than obesity and all were free of any infections in the previous month before the study. Liver diseases (specifically tumoral disease and HCV infection) and thyroid dysfunction were specifically excluded by biochemical work-up. Samples and data from patients included in this study were partially provided by the FATBANK platform promoted by the CIBEROBN and coordinated by the IDIBGI Biobank (Biobank IDIBGI, B.0000872), integrated in the Spanish National Biobanks Network and they were processed following standard operating procedures with the appropriate approval of the Ethics, External Scientific and FATBANK Internal Scientific Committees.
Ethics Statement
This study was carried out in accordance with the recommendations of the ethical committee of the Hospital of Girona “Dr Josep Trueta.” The protocol was approved by the ethical committee of the Hospital of Girona “Dr Josep Trueta.” All subjects gave written informed consent in accordance with the Declaration of Helsinki, after the purpose of the study was explained to them.
AT samples were obtained from SAT and VAT depots during elective surgical procedures (cholecystectomy, surgery of abdominal hernia and gastric bypass surgery). Adipose tissue samples were washed, fragmented and immediately flash-frozen in liquid nitrogen before being stored at -80°C.
The isolation of adipocyte and stromal vascular fraction cells (SVF) was performed from 17 SAT and 20 VAT non-frozen adipose tissue samples. These samples were washed three to four times with phosphate-buffered saline (PBS) and suspended in an equal volume of PBS supplemented with 1% penicillin-streptomycin and 0.1% collagenase type I prewarmed to 37°C. The tissue was placed in a shaking water bath at 37°C with continuous agitation for 60 min and centrifuged for 5 min at 400 g at room temperature. The supernatant, containing mature adipocytes, was recollected. The pellet was identified as the SVF. Isolated mature adipocytes and SVF stored at -80°C for gene expression analysis.
Analytical Methods
Serum glucose concentrations were measured in duplicate by the glucose oxidase method using a Beckman glucose analyser II (Beckman Instruments, Brea, CA, United States). Intraassay and interassay coefficients of variation were less than 4% for all these tests. HDL cholesterol was quantified by a homogeneous enzymatic colorimetric assay through the cholesterol esterase/cholesterol oxidase/peroxidase reaction (Cobas HDLC3). Total serum triglycerides were measured by an enzymatic, colorimetric method with glycerol phosphate oxidase and peroxidase (Cobas TRIGL). We used a Roche Hitachi Cobas c 711 instrument to perform the determinations.
RNA Expression
RNA purification was performed using the RNeasy Lipid Tissue Mini Kit (QIAGEN, Izasa SA, Barcelona, Spain) and the integrity was checked by the Agilent Bioanalyzer (Agilent Technologies, Palo Alto, CA, United States). Gene expression was assessed by real time PCR using a LightCycler® 480 Real-Time PCR System (Roche Diagnostics SL, Barcelona, Spain), using TaqMan® and SYBR green technology suitable for relative genetic expression quantification. The RT-PCR reaction was performed in a final volume of 12 μl. The cycle program consisted of an initial denaturing of 10 min at 95°C then 40 cycles of 15 s denaturizing phase at 95°C and 1 min annealing and extension phase at 60°C. A threshold cycle (Ct value) was obtained for each amplification curve and a ΔCt value was first calculated by subtracting the Ct value for human cyclophilin A (PPIA) RNA from the Ct value for each sample. Fold changes compared with the endogenous control were then determined by calculating 2-ΔCt, so that gene expression results are expressed as expression ratio relative to PPIA gene expression according to the manufacturer’s guidelines. PPIA Ct values in both SAT and VAT were comparable (23.48 ± 0.81 in SAT vs. 23.49 ± 1.28 in VAT, p = 0.9, n = 152). Primer/probe sets used were: neuregulin 4 (NRG4, Hs00163592_m1), fatty acid synthase (FASN, Hs00188012_m1), peroxisome proliferator-activated receptor gamma (PPARG, Hs00234592_m1), solute carrier family 2 (facilitated glucose transporter), member 4 (SLC2A4 or GLUT4, Hs00168966_m1), perilipin 1 (PLIN1, Hs00160173_m1), PPARG coactivator 1 alpha (PPARGC1A, Hs00173304_m1), uncoupling protein 1 (UCP1, Hs01084772_m1), uncoupling protein 3 (UCP3, Hs01106052_m1), transmembrane protein 26 (TMEM26, Hs00415619_m1), interleukin 6 (IL6, Hs00174131_m1), C-X-C motif chemokine ligand 8 (CXCL8 or also named IL8, Hs00174103_m1), and peptidylprolyl isomerase A (cyclophilin A) (4333763, PPIA as endogenous control).
Statistical Analyses
Statistical analyses were performed using the SPSS 12.0 software. Unless otherwise stated, descriptive results of continuous variables are expressed as mean and SD for Gaussian variables or median and interquartile range for non-Gaussian variables. Parameters that did not fulfill normal distribution criteria were log transformed to improve symmetry for subsequent analyses. The relation between variables was analyzed by simple correlation (using Spearman’s and Pearson’s tests) and multiple linear regression analyses. ANOVA and unpaired Student’s t-tests were used to compare clinical variables and gene expression relative to obesity and type 2 diabetes (T2D).
Results
Representative Ct values of analyzed genes were shown in Table 1.
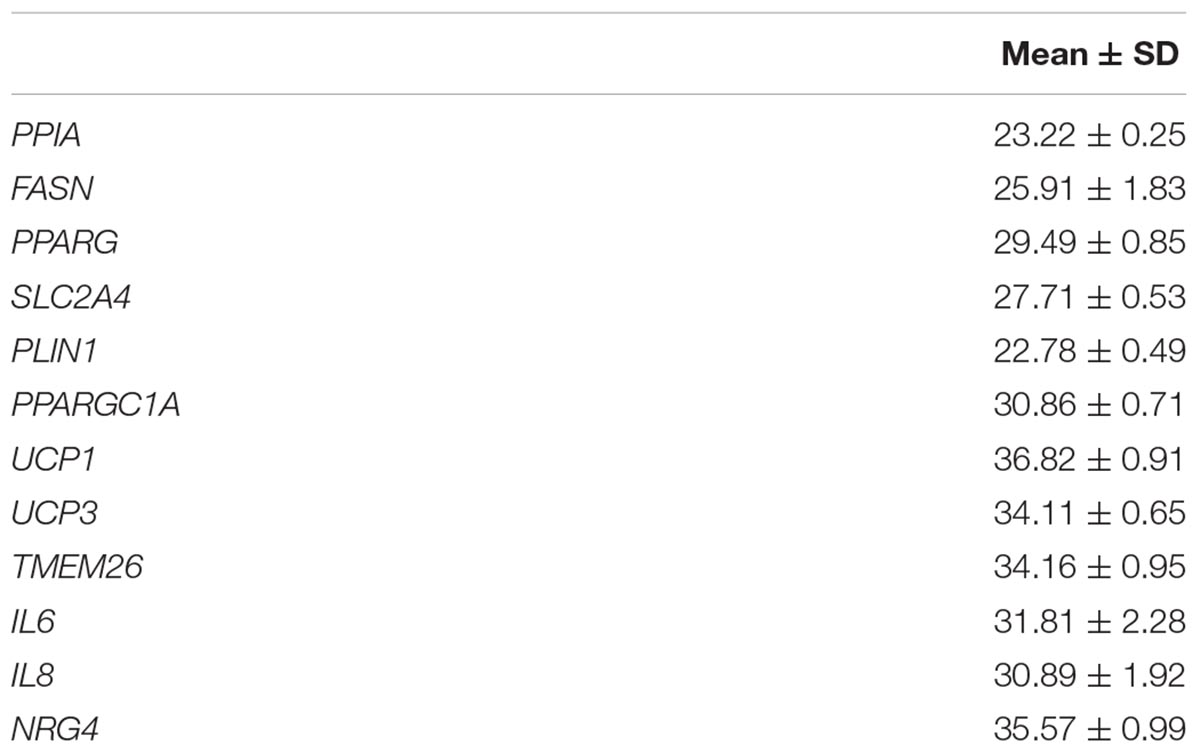
Table 1. Representative Ct values of analyzed genes.
Cohort 1
Anthropometric and clinical data from cohort 1 were detailed in Table 2. Similar to thermogenic/beige-related gene expression, NRG4 was significantly increased in VAT compared to SAT, whereas adipogenesis-related genes followed an opposite gene expression pattern (Figure 1A). In cohort 1, VAT NRG4 gene expression was significantly increased in participants with obesity (Table 2), but no significant differences were found between non-diabetic obese and obese participants with T2D (Table 2). No significant differences were observed on SAT NRG4 gene expression according to obesity or T2D. In VAT, NRG4 gene expression was positively correlated with BMI, and negatively correlated with adipogenic-related genes (FASN, PPARG, and SLC2A4) (Table 3). Interestingly, NRG4 gene expression was significantly positively associated with expression of brown/beige adipocyte activity-related (UCP1, UCP3, and TMEM26) and negatively with inflammatory-related (IL6 and IL8) genes (Table 3 and Figure 2A). In SAT, NRG4 gene expression was negatively correlated with HOMAIR and positively with UCP1 and TMEM26 gene expression (Table 3 and Figure 2B).
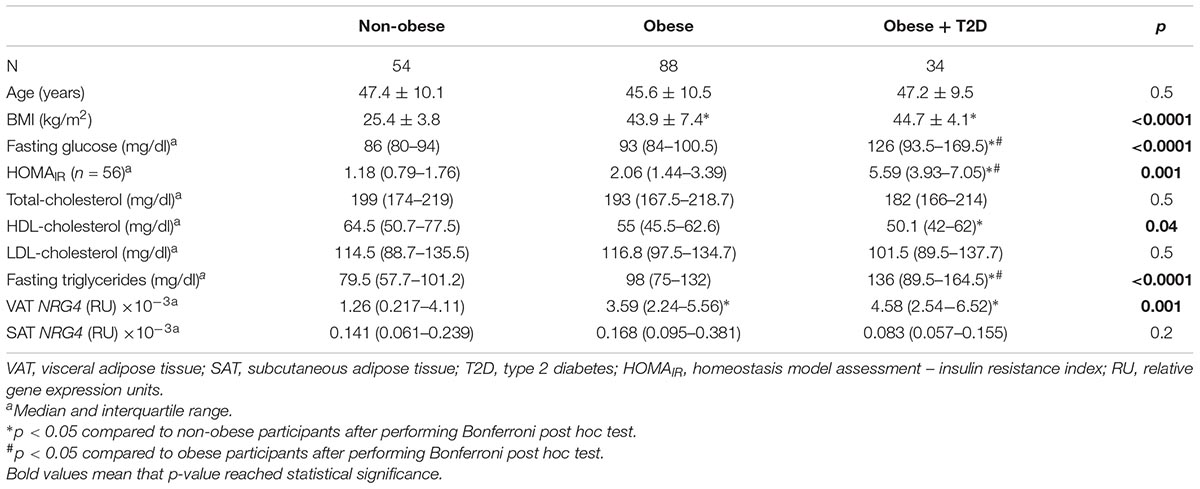
Table 2. Anthropometric and clinical characteristics according to obesity and T2D in cohort 1.
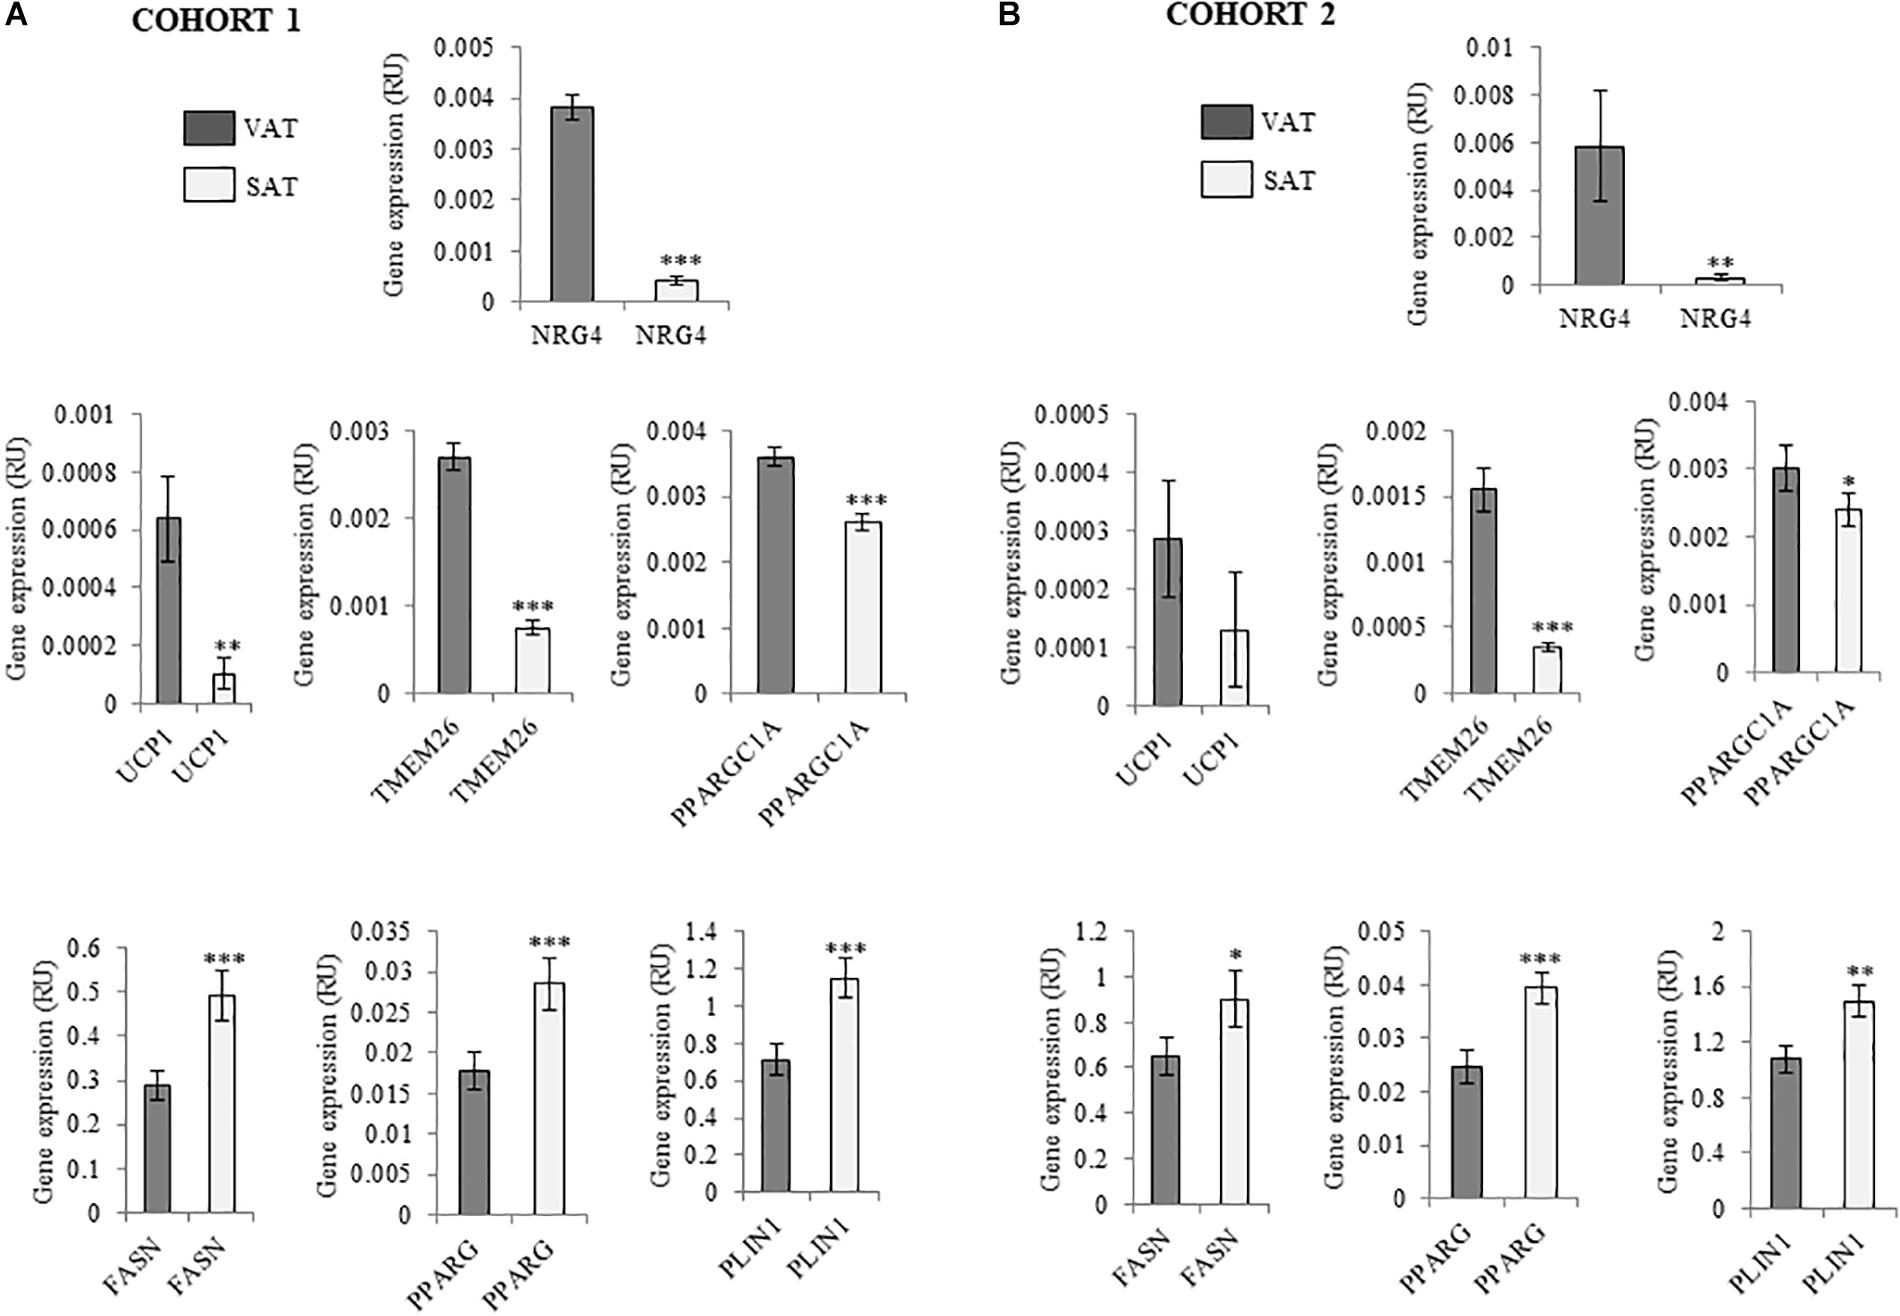
Figure 1. (A,B) Comparison of NRG4, UCP1, TMEM26, PPARGC1A, FASN, PPARG, and PLIN1 gene expression in paired VAT and SAT in cohort 1 (n = 132) (A) and cohort 2 (n = 20) (B). ∗p < 0.05, ∗∗p < 0.01, and ∗∗∗p < 0.001 compared to gene expression in VAT.
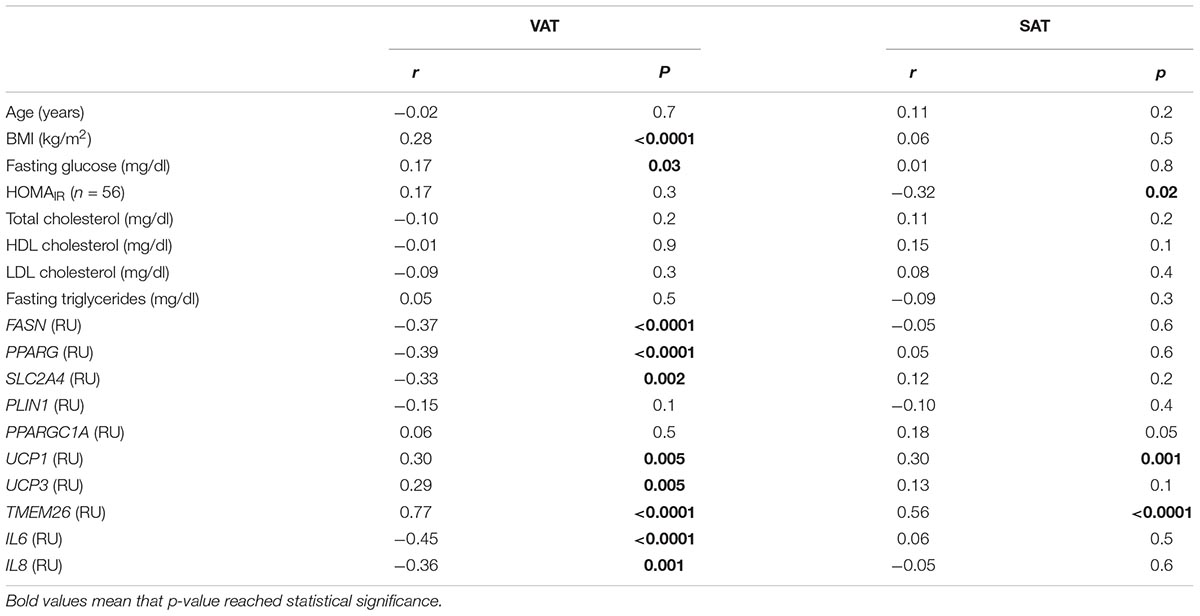
Table 3. Correlation between NRG4 gene expression and anthropometric and clinical characteristics and selected gene expression in SAT (n = 176) and VAT (n = 155) from cohort 1.
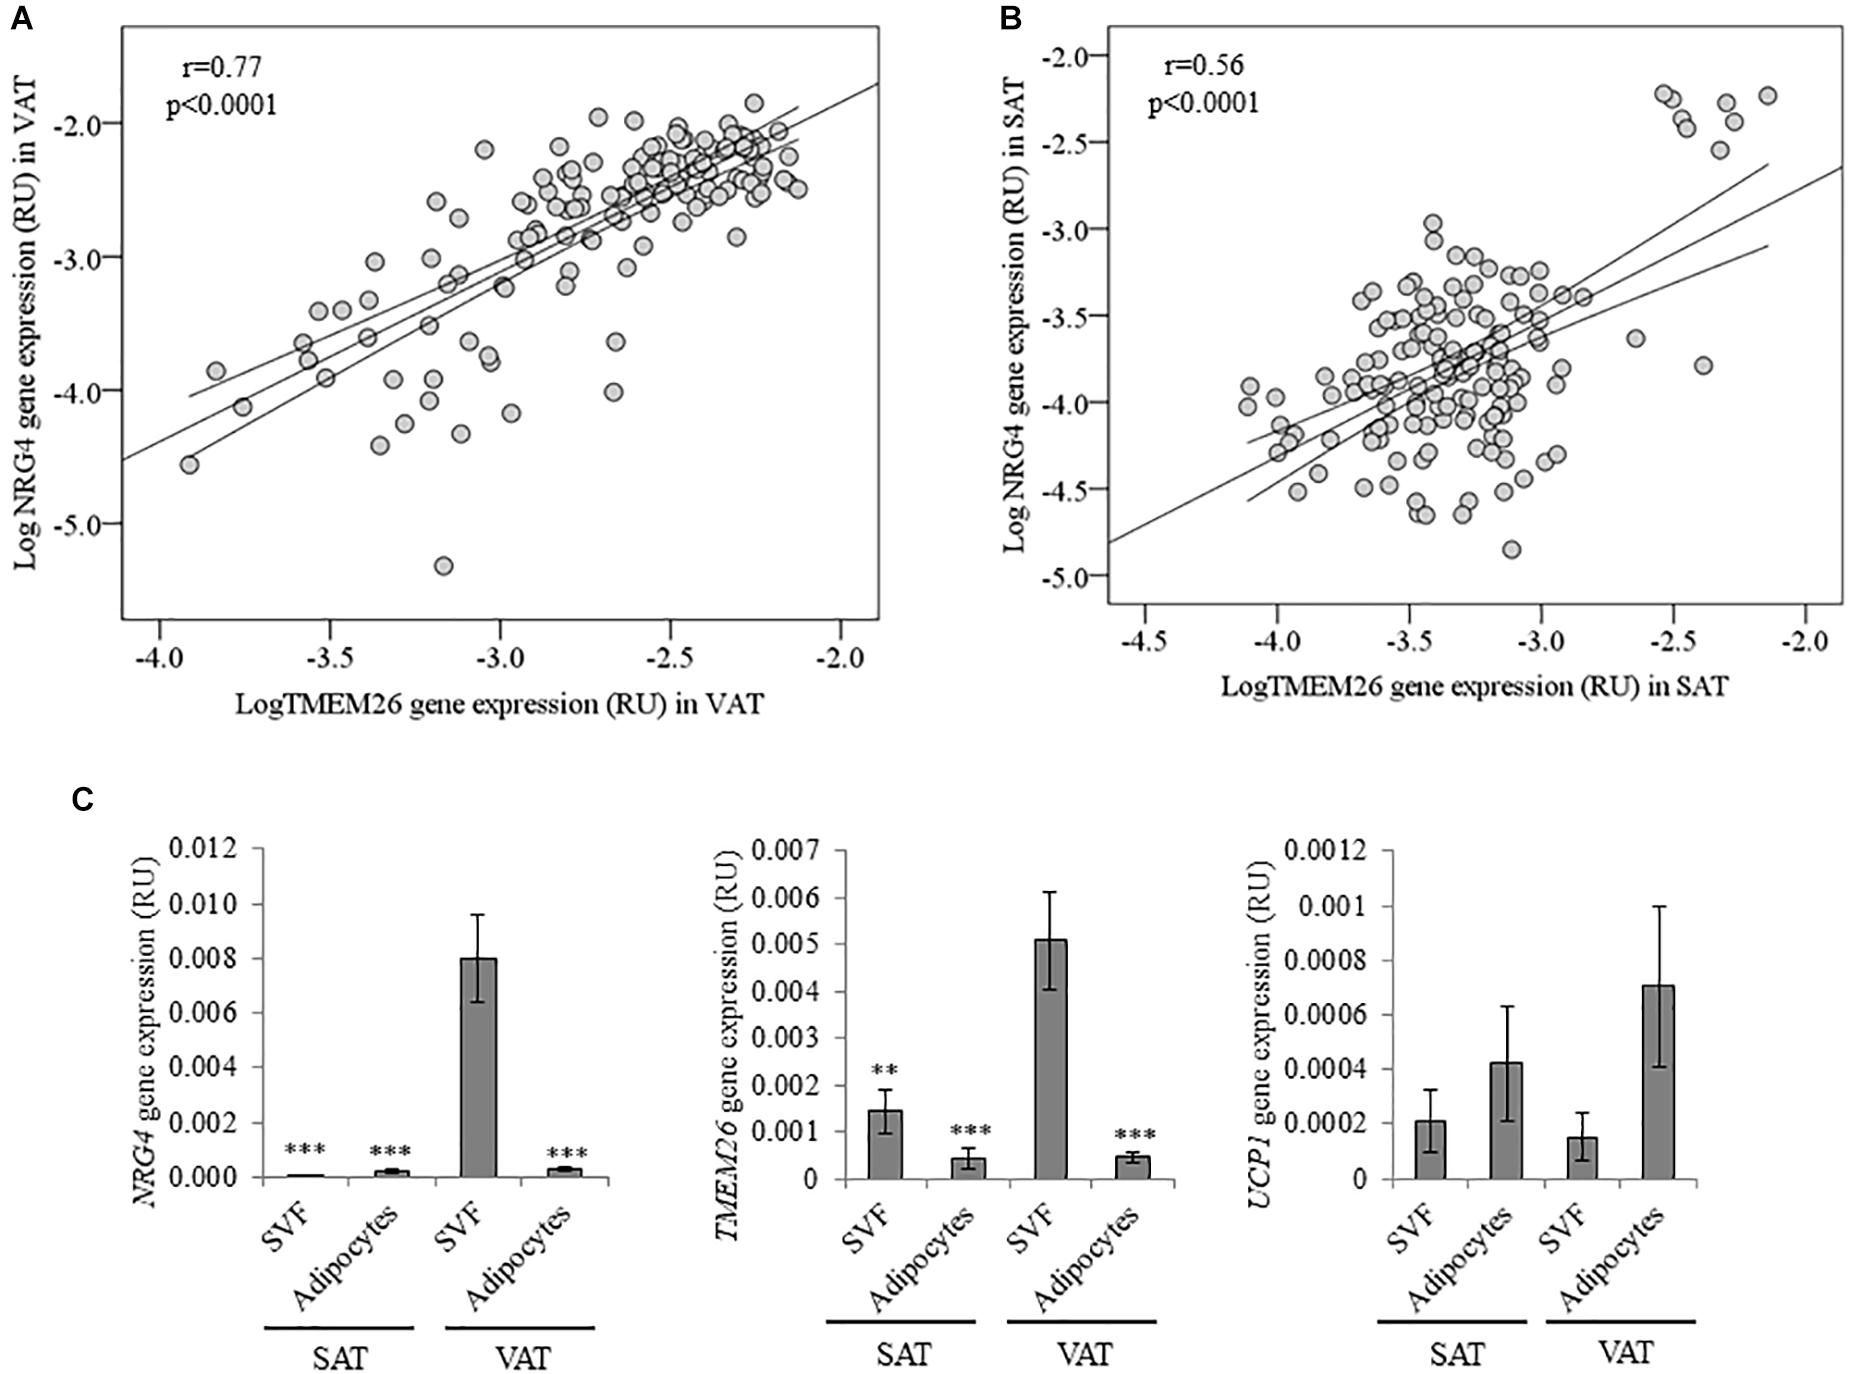
Figure 2. (A,B) Bivariate correlation between NRG4 and TMEM26 gene expression in VAT (A) and SAT (B). (C) NRG4, TMEM26, and UCP1 gene expression in adipose tissue fractions (SVF and adipocytes) in both SAT (n = 17) and VAT (n = 20). ∗∗p < 0.01 and ∗∗∗p < 0.001 compared to gene expression in VAT SVF cells.
In multiple linear regression analysis, TMEM26 (β = 0.58, p < 0.0001; model adjusted R2 = 0.37, p < 0.0001), UCP3 (β = 0.24, p = 0.03; model adjusted R2 = 0.13, p = 0.001), IL6 (β = -0.32, p = 0.01; model adjusted R2 = 0.16, p = 0.001), IL8 (β = -0.36, p = 0.008; model adjusted R2 = 0.17, p < 0.0001), FASN (β = -0.42, p = 0.001, model adjusted R2 = 0.12, p = 0.001) and PPARG (β = -0.38, p = 0.005; model adjusted R2 = 0.11, p = 0.008) significantly contributed to the variance of NRG4 gene expression in VAT after controlling for BMI. In SAT, TMEM26 (β = 0.77, p < 0.0001; model adjusted R2 = 0.61, p < 0.0001) significantly contributed to the variance of NRG4 gene expression after controlling for BMI. Multiple linear regression analysis revealed that expression of TMEM26 gene was the best predictor of NRG4 gene expression in both VAT and SAT.
In addition, correlations between UCP1, a specific marker of brown adipocytes, and clinical and metabolic parameters were also explored. No significant correlation between SAT or VAT UCP1 gene expression and BMI, fasting glucose, HOMAIR, total-, LDL- and HDL-cholesterol, and fasting triglycerides were observed. VAT, but not SAT, UCP1 was positively correlated with SLC2A4 (r = 0.43, p < 0.0001), PPARGC1A (r = 0.36, p = 0.001) and UCP3 (r = 0.31, p = 0.005) gene expression.
In adipose tissue fractions, NRG4 and TMEM26, but not UCP1, gene expression was significantly increased in visceral SVFs compared to visceral adipocytes, subcutaneous SVFs and subcutaneous adipocytes (Figure 2C).
Cohort 2
To examine the findings replication of cohort 1 excluding the effects of obesity, an independent cohort (cohort 2) composed of morbidly subjects with different degrees of insulin action has been analyzed. Anthropometric and clinical data from cohort 2 were detailed in Table 4. Similar to cohort 1, NRG4 and thermogenic/beige- related gene expression was increased in VAT (Figure 1B). No significant differences on SAT or VAT NRG4 gene expression according to glucose tolerance or T2D were found. VAT NRG4 gene expression were associated with expression of TMEM26 gene (Table 5), and SAT NRG4 with insulin sensitivity (M) and expression of SLC2A4, UCP1 and TMEM26 genes (Table 5).
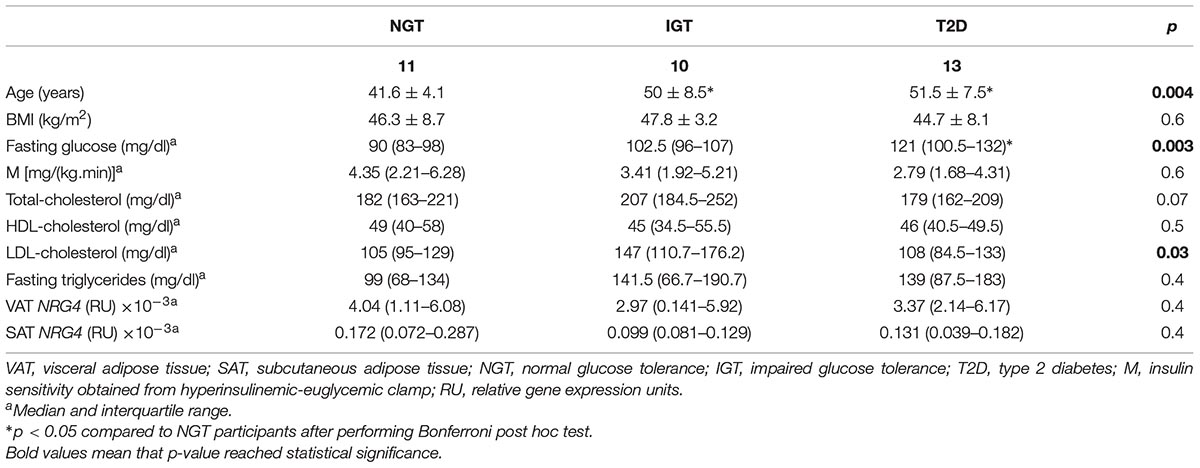
Table 4. Anthropometric and clinical characteristics according to glucose tolerance in cohort 2.
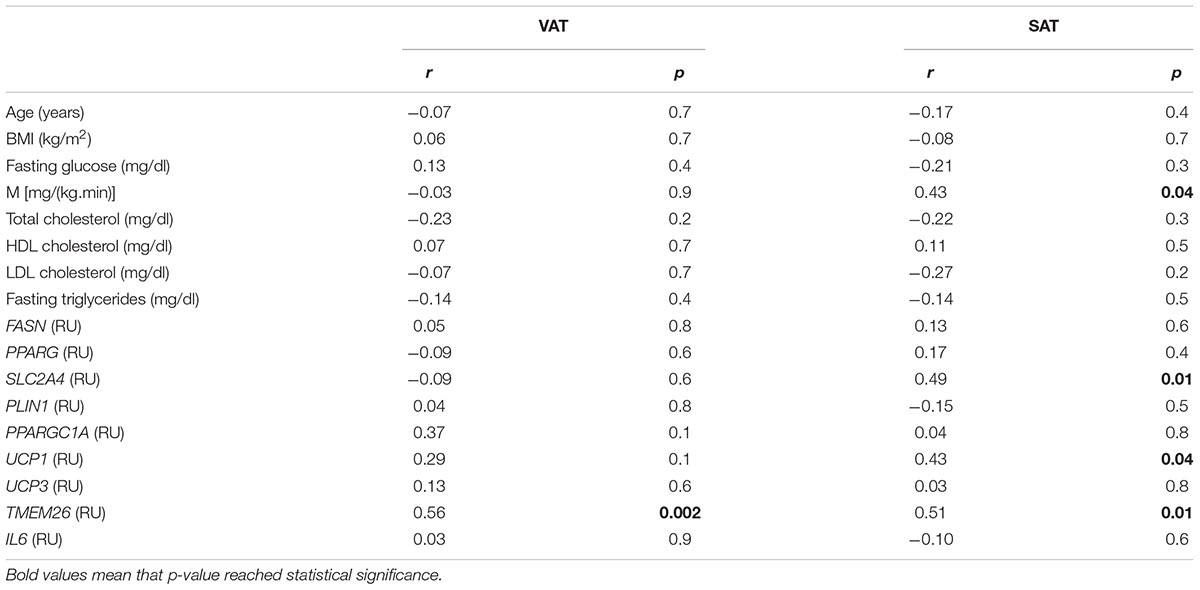
Table 5. Correlation between NRG4 gene expression and anthropometric and clinical characteristics and selected gene expression in SAT (n = 25) and VAT (n = 34) from cohort 2.
Discussion
To the best of our knowledge, this is the first study showing a significant relationship between NRG4 and TMEM26 gene expression in human adipose tissue. Interestingly, this association was found in both VAT and SAT, and validated in a second independent cohort. TMEM26 has been described as a specific marker of brite/beige adipocytes (Wu et al., 2012; Torriani et al., 2016; Finlin et al., 2017). We also found positive associations among NRG4 and markers of thermogenic activity (characteristic of both brown and beige adipocytes) such as expression of UCP1 and UCP3 genes. In addition, VAT NRG4 gene expression was negatively correlated with expression of white lipogenic/adipogenic (FASN and PPARG)- and inflammatory (IL6 and IL8)-related genes, even after controlling for BMI. Since beige adipocytes have less lipogenic capacity compared to white adipocytes (Aziz et al., 2017; Zuriaga et al., 2017), and browning/beiging of adipose tissue protected against visceral adipose tissue inflammation (Wu et al., 2017; Gonzalez-Hurtado et al., 2018), the negative association between NRG4 and white adipogenic/inflammatory genes reinforced NRG4 as a marker of beige adipocytes. In fact, these correlations were only observed in the samples with the highest correlation between NRG4 and TMEM26 (r = 0.77, p < 0.0001). However, the correlations between VAT NRG4 and UCP1, UCP3, lipogenic/adipogenic - and inflammatory-related gene expression were not replicated in morbidly obese participants (cohort 2). Further studies in human adipose tissue should be required to validate these correlations.
Furthermore, in both cohort 1 and 2, similar to beige adipocytes-related genes (TMEM26), NRG4 gene expression was significantly more expressed in VAT, whereas, as expected adipogenic-related genes were more expressed in SAT (Sauma et al., 2007; Moreno-Navarrete et al., 2016; Zuriaga et al., 2017). Contrary to mice, increased pattern of browning gene expression in human VAT compared to SAT has been reported (Zuriaga et al., 2017). Interestingly, NRG4 and TMEM26 gene expression was enriched in SVFs from VAT compared to SVFs from SAT or adipocytes from VAT or SAT. This finding points to a specific population of beige precursor cells in VAT, characterized by increased NRG4 and TMEM26 gene expression, and could explain the increased expression of beige/browning-related genes observed in this fat depot (current data and Zuriaga et al., 2017). Reinforcing this idea, previous studies demonstrated that TMEM26 gene expression was also increased in SVF and decreased in the late stages of beige adipocyte differentiation, and indicated its abundance in the precursors of beige adipocytes (Lee et al., 2015; Garcia et al., 2016).
Altogether these findings indicated NRG4 as an additional marker of beige adipocytes in human adipose tissue, and suggested a possible role of this factor in the development of beige adipocytes in human fat depots. Supporting this hypothesis, Rosell et al. (2014) suggested that NRG4 might promote the growth of neurites in adipose tissue, increasing sympathetic innervation and in consequence, enhancing browning of WAT. Regarding the possible role of NRG4 on thermogenic activity, Wang et al. (2014) demonstrated in Nrg4 deficient mice that Nrg4 did not directly participate in BAT thermogenesis, but Ma et al. (2016) showed that Nrg4 overexpression enhanced BAT activity with an increase of ∼1°C body temperature, and BAT and iWAT thermogenic gene expression. These studies supported a possible role of NRG4 in beiging of human adipose tissue, but contradictory data in relation to its thermogenic activity. Further functional studies in human adipose tissue should be required to confirm the possible role of NRG4 in this process.
Another interesting finding of current study was the positive association between SAT NRG4 gene expression and insulin sensitivity. In a previous study, SAT and VAT NRG4 was significantly decreased in patients with impaired glucose tolerance (IGT) and T2D (Wang et al., 2014), but this study did not evaluate insulin sensitivity. Even tough, no significant differences were found in relation to IGT or T2D, probably due to the relatively low number of adipose tissue samples compared to the previous study (n = 642) (Wang et al., 2014). The current study showed a positive association between SAT NRG4 and insulin sensitivity in both cohort 1 and cohort 2, evaluated by two different methods (HOMAIR in cohort 1 and hyperinsulinemic-euglycemic clamp in cohort 2). In agreement with these findings, mice studies demonstrated that liver and adipose tissue Nrg4 overexpression improved insulin sensitivity and glucose tolerance and prevented HFD-induced hyperinsulinemia (Ma et al., 2016). In fact, two recent studies (López-Soldado et al., 2016; Zhang P. et al., 2018) demonstrated that recombinant neuregulin administration improved glucose tolerance in both control and diabetic rats by enhancing hepatic glucose utilization (López-Soldado et al., 2016) and insulin sensitivity in high fat-fed mice (Zhang P. et al., 2018).
On the other hand, contrary to previous study that demonstrated that SAT NRG4 was negatively correlated with body fat mass (Wang et al., 2014), in the current study no significant association was found between SAT NRG4 and BMI. In cohort 1, VAT NRG4 gene expression was increased in obese compared to non-obese participants, and positively correlated with BMI, but in cohort 2, VAT NRG4 gene expression was not correlated with BMI. Of note, similar NRG4 gene expression values were observed comparing obese participants from cohort 1 vs. those from cohort 2. Strikingly, the positive effects of diet-induced weight loss reducing body fat mass were not associated with expression of brown/beige-related genes (Barquissau et al., 2018). However, additional studies will be necessary to clarify the relationship between human adipose tissue NRG4 and obesity.
A significant limitation of current study was the absence of VAT or SAT NRG4 protein analysis by scarce availability of adipose tissue lysates for protein in the same tissue samples used for RNA analysis. Similar to this, NRG4 protein analysis was not evaluated in recent relevant studies that demonstrated the importance of NRG4 in adipose tissue (Wang et al., 2014; Chen et al., 2017; Guo et al., 2017; Nugroho et al., 2018; Pellegrinelli et al., 2018). Thus, additional studies should be performed to investigate if NRG4 protein follows the same pattern of mRNA expression in human adipose tissue. Interestingly and consistent with current findings, increased NRG4 mRNA and protein release in human beige adipogenesis of mural-like mesenchymal stem cell was more recently reported (Su et al., 2018), indicating that NRG4 gene expression were correlated with NRG4 protein levels and supporting NRG4 participation in beige adipocyte differentiation. However, it is important to note that expression of NRG4 and brown/beige adipose tissue markers (UCP1, UCP3, and TMEM26) were extremely low, suggesting that browning of white adipose tissue in humans may have less relevance than in mice.
In conclusion, all these observations suggest NRG4 gene expression as a novel marker of beige adipocytes in human adipose tissue.
Author Contributions
JF-R and JM-N participated in study design and analysis of data and wrote and edited the manuscript. FC, CM, MS, FO, JL, and FD-S participated in acquisition of data. JA, MC, AG, and WR participated in interpretation of data. FC, CM, MS, FO, JL, FD-S, JA, MC, AG, and WR revised the manuscript critically for important intellectual content. All authors participated in final approval of the version to be published.
Funding
This work was partially supported by research grants PI16/01173 from the Instituto de Salud Carlos III from Spain, FEDER funds and by Fundació Marató de TV3 (201626-30). CIBEROBN Fisiopatología de la Obesidad y Nutrición is an initiative from the Instituto de Salud Carlos III and Fondo Europeo de Desarrollo Regional (FEDER) from Spain.
Conflict of Interest Statement
The authors declare that the research was conducted in the absence of any commercial or financial relationships that could be construed as a potential conflict of interest.
Acknowledgments
We acknowledge the technical assistance of Emili Loshuertos (IdIBGi) and Oscar Rovira (IdIBGi). We also want to particularly acknowledge the patients, the FATBANK platform promoted by the CIBEROBN and the IDIBGI Biobank (Biobanc IDIBGI, B.0000872), integrated in the Spanish National Biobanks Network, for their collaboration and coordination.
References
Aziz, S. A., Wakeling, L. A., Miwa, S., Alberdi, G., Hesketh, J. E., and Ford, D. (2017). Metabolic programming of a beige adipocyte phenotype by genistein. Mol. Nutr. Food. Res. 61:1600574. doi: 10.1002/mnfr.201600574
Barquissau, V., Léger, B., Beuzelin, D., Martins, F., Amri, E. Z., Pisani, D. F., et al. (2018). Caloric restriction and diet-induced weight loss do not induce browning of human subcutaneous white adipose tissue in women and men with obesity. Cell. Rep. 22, 1079–1089. doi: 10.1016/j.celrep.2017.12.102
Bartelt, A., and Heeren, J. (2014). Adipose tissue browning and metabolic health. Nat. Rev. Endocrinol. 10, 24–36. doi: 10.1038/nrendo.2013.204
Cantó, C., Pich, S., Paz, J. C., Sanches, R., Martínez, V., Orpinell, M., et al. (2007). Neuregulins increase mitochondrial oxidative capacity and insulin sensitivity in skeletal muscle cells. Diabetes Metab. Res. Rev. 56, 2185–2193. doi: 10.2337/db06-1726
Cantó, C., Suárez, E., Lizcano, J. M., Griñó, E., Shepherd, P. R., Fryer, L. G., et al. (2004). Neuregulin signaling on glucose transport in muscle cells. J. Biol. Chem. 279, 12260–12268. doi: 10.1074/jbc.M308554200
Chen, Z., Wang, G. X., Ma, S. L., Jung, D. Y., Ha, H., Altamimi, T., et al. (2017). Nrg4 promotes fuel oxidation and a healthy adipokine profile to ameliorate diet-induced metabolic disorders. Mol. Metab. 6, 863–872. doi: 10.1016/j.molmet.2017.03.016
Ennequin, G., Boisseau, N., Caillaud, K., Chavanelle, V., Etienne, M., Li, X., et al. (2015). Neuregulin 1 improves glucose tolerance in db/db mice. PLoS One 10:e0130568. doi: 10.1371/journal.pone.0130568
Finlin, B. S., Zhu, B., Confides, A. L., Westgate, P. M., Harfmann, B. D., Dupont-Versteegden, E. E., et al. (2017). Mast cells promote seasonal white adipose beiging in humans. Diabetes Metab. Res. Rev. 66, 1237–1246. doi: 10.2337/db16-1057
Garcia, R. A., Roemmich, J. N., and Claycombe, K. J. (2016). Evaluation of markers of beige adipocytes in white adipose tissue of the mouse. Nutr. Metab. 13:24. doi: 10.1186/s12986-016-0081-2
Gonzalez-Hurtado, E., Lee, J., Choi, J., and Wolfgang, M. J. (2018). Fatty acid oxidation is required for active and quiescent brown adipose tissue maintenance and thermogenic programing. Mol. Metab. 7, 45–56. doi: 10.1016/j.molmet.2017.11.004
Guo, L., Zhang, P., Chen, Z., Xia, H., Li, S., Zhang, Y., et al. (2017). Hepatic neuregulin 4 signaling defines an endocrine checkpoint for steatosis-to-NASH progression. J. Clin. Invest. 127, 4449–4461. doi: 10.1172/JCI96324
Haskins, J. W., Zhang, S., Means, R. E., Kelleher, J. K., Cline, G. W., Canfrán-Duque, A., et al. (2015). Neuregulin-activated ERBB4 induces the SREBP-2 cholesterol biosynthetic pathway and increases low-density lipoprotein uptake. Sci. Signal. 8:ra111. doi: 10.1126/scisignal.aac5124
Hepler, C., Shao, M., Xia, J. Y., Ghaben, A. L., Pearson, M. J., Vishvanath, L., et al. (2017). Directing visceral white adipocyte precursors to a thermogenic adipocyte fate improves insulin sensitivity in obese mice. eLife 6:e27669. doi: 10.7554/eLife.27669
Huang, L., Pan, D., Chen, Q., Zhu, L. J., Ou, J., Wabitsch, M., et al. (2017). Transcription factor Hlx controls a systematic switch from white to brown fat through Prdm16-mediated co-activation. Nat. Commun. 8:68. doi: 10.1038/s41467-017-00098-2
Lee, M. W., Odegaard, J. I., Mukundan, L., Qiu, Y., Molofsky, A. B., Nussbaum, J. C., et al. (2015). Activated type 2 innate lymphoid cells regulate beige fat biogenesis. Cell 160, 74–87. doi: 10.1016/j.cell.2014.12.011
López-Soldado, I., Niisuke, K., Veiga, C., Adrover, A., Manzano, A., Martínez-Redondo, V., et al. (2016). Neuregulin improves response to glucose tolerance test in control and diabetic rats. Am. J. Physiol. Endocrinol. Metab. 310, E440–E451. doi: 10.1152/ajpendo.00226.2015
Ma, Y., Gao, M., and Liu, D. (2016). Preventing high fat diet-induced obesity and improving insulin sensitivity through neuregulin 4 gene transfer. Sci. Rep. 6:26242. doi: 10.1038/srep26242
Moreno-Navarrete, J. M., Escoté, X., Ortega, F., Serino, M., Campbell, M., Michalski, M. C., et al. (2013). A role for adipocyte-derived lipopolysaccharide-binding protein in inflammation- and obesity-associated adipose tissue dysfunction. Diabetologia 56, 2524–2537. doi: 10.1007/s00125-013-3015-9
Moreno-Navarrete, J. M., Jove, M., Ortega, F., Xifra, G., Ricart, W., Obis, È, et al. (2016). Metabolomics uncovers the role of adipose tissue PDXK in adipogenesis and systemic insulin sensitivity. Diabetologia 59, 822–832. doi: 10.1007/s00125-016-3863-1
Nugroho, D. B., Ikeda, K., Barinda, A. J., Wardhana, D. A., Yagi, K., Miyata, K., et al. (2018). Neuregulin-4 is an angiogenic factor that is critically involved in the maintenance of adipose tissue vasculature. Biochem. Biophys. Res. Commun. 503, 378–384. doi: 10.1016/j.bbrc.2018.06.043
Pellegrinelli, V., Peirce, V. J., Howard, L., Virtue, S., Türei, D., Senzacqua, M., et al. (2018). Adipocyte-secreted BMP8b mediates adrenergic-induced remodeling of the neuro-vascular network in adipose tissue. Nat. Commun. 9:4974. doi: 10.1038/s41467-018-07453-x
Rabhi, N., Hannou, S. A., Gromada, X., Salas, E., Yao, X., Oger, F., et al. (2018). Cdkn2a deficiency promotes adipose tissue browning. Mol. Metab. 8, 65–76. doi: 10.1016/j.molmet.2017.11.012
Rosell, M., Kaforou, M., Frontini, A., Okolo, A., Chan, Y. W., Nikolopoulou, E., et al. (2014). Brown and white adipose tissues: intrinsic differences in gene expression and response to cold exposure in mice. Am. J. Physiol. Endocrinol. Metab. 306, E945–E964. doi: 10.1152/ajpendo.00473.2013
Sauma, L., Franck, N., Paulsson, J. F., Westermark, G. T., Kjølhede, P., Strålfors, P., et al. (2007). Peroxisome proliferator activated receptor gamma activity is low in mature primary human visceral adipocytes. Diabetologia 50, 195–201. doi: 10.1007/s00125-006-0515-x
Su, S., Guntur, A. R., Nguyen, D. C., Fakory, S. S., Doucette, C. C., Leech, C., et al. (2018). A renewable source of human beige adipocytes for development of therapies to treat metabolic syndrome. Cell Rep. 25, 3215.e9–3228.e9. doi: 10.1016/j.celrep.2018.11.037
Suárez, E., Bach, D., Cadefau, J., Palacin, M., Zorzano, A., and Gumá, A. (2001). A novel role of neuregulin in skeletal muscle. Neuregulin stimulates glucose uptake, glucose transporter translocation, and transporter expression in muscle cells. J. Biol. Chem. 276, 18257–18264. doi: 10.1074/jbc.M008100200
Torriani, M., Srinivasa, S., Fitch, K. V., Thomou, T., Wong, K., Petrow, E., et al. (2016). Dysfunctional subcutaneous fat with reduced Dicer and brown adipose tissue gene expression in HIV-infected patients. J. Clin. Endocrinol. Metab. 101, 1225–1234. doi: 10.1210/jc.2015-3993
Wang, G. X., Zhao, X. Y., Meng, Z. X., Kern, M., Dietrich, A., Chen, Z., et al. (2014). The brown fat-enriched secreted factor Nrg4 preserves metabolic homeostasis through attenuation of hepatic lipogenesis. Nat. Med. 20, 1436–1443. doi: 10.1038/nm.3713
Wu, J., Boström, P., Sparks, L. M., Ye, L., Choi, J. H., Giang, A. H., et al. (2012). Beige adipocytes are a distinct type of thermogenic fat cell in mouse and human. Cell 150, 366–376. doi: 10.1016/j.cell.2012.05.016
Wu, W., Shi, F., Liu, D., Ceddia, R. P., Gaffin, R., Wei, W., et al. (2017). Enhancing natriuretic peptide signaling in adipose tissue, but not in muscle, protects against diet-induced obesity and insulin resistance. Sci. Signal. 10:489. doi: 10.1126/scisignal.aam6870
Zeng, F., Wang, Y., Kloepfer, L. A., Wang, S., and Harris, R. C. (2018). ErbB4 deletion predisposes to development of metabolic syndrome in mice. Am. J. Physiol. Endocrinol. Metab. 315, E583–E593. doi: 10.1152/ajpendo.00166.2018
Zhang, P., Kuang, H., He, Y., Idiga, S. O., Li, S., Chen, Z., et al. (2018). NRG1-Fc improves metabolic health via dual hepatic and central action. JCI Insight 3:98522. doi: 10.1172/jci.insight.98522
Zhang, S., Cao, H., Li, Y., Jing, Y., Liu, S., Ye, C., et al. (2018). Metabolic benefits of inhibition of p38α in white adipose tissue in obesity. PLoS Biol. 16:e2004225. doi: 10.1371/journal.pbio.2004225
Keywords: obesity, neuregulin 4, browning, adipose tissue, insulin sensitivity
Citation: Comas F, Martínez C, Sabater M, Ortega F, Latorre J, Díaz-Sáez F, Aragonés J, Camps M, Gumà A, Ricart W, Fernández-Real JM and Moreno-Navarrete JM (2019) Neuregulin 4 Is a Novel Marker of Beige Adipocyte Precursor Cells in Human Adipose Tissue. Front. Physiol. 10:39. doi: 10.3389/fphys.2019.00039
Received: 17 August 2018; Accepted: 14 January 2019;
Published: 31 January 2019.
Edited by:
Paula Oliver, Universidad de les Illes Balears, SpainReviewed by:
Rushita Bagchi, University of Colorado Denver, United StatesYongguo Li, Technische Universität München, Germany
Copyright © 2019 Comas, Martínez, Sabater, Ortega, Latorre, Díaz-Sáez, Aragonés, Camps, Gumà, Ricart, Fernández-Real and Moreno-Navarrete. This is an open-access article distributed under the terms of the Creative Commons Attribution License (CC BY). The use, distribution or reproduction in other forums is permitted, provided the original author(s) and the copyright owner(s) are credited and that the original publication in this journal is cited, in accordance with accepted academic practice. No use, distribution or reproduction is permitted which does not comply with these terms.
*Correspondence: José María Moreno-Navarrete, jmoreno@idibgi.org
†These authors have contributed equally to this work