 Peter Annighöfer
 Dominik Seidel
 Andreas Mölder
 Christian Ammer
- 1Silviculture and Forest Ecology of the Temperate Zones, University of Göttingen, Göttingen, Germany
- 2Department A (Forest Growth), Northwest German Forest Research Institute, Göttingen, Germany
Tree saplings are exposed to a competitive growth environment in which resources are limited and the ability to adapt determines general vitality and specific growth performance. In this study we analyzed the aboveground spatial neighborhood of oak [Quercus petraea (Matt.) Liebl.] and beech (Fagus sylvatica L.) saplings growing in Germany, by using hemispherical photography and terrestrial laser scanning as proxy for the competitive pressure saplings were exposed to. The hemispherical images were used to analyze the light availability and the three-dimensional (3D) point clouds from the laser scanning were used to assess the space and forest structure around the saplings. The aim was to increase the precision with which the biomass allocation, growth, and morphology of the saplings could be predicted by including more detailed information of their environment. The predictive strength of the models was especially increased through direct neighborhood variables (e.g., relative space filling), next to the light availability being the most important predictor variable. The biomass allocation patterns within the more light demanding oak were strongly driven by the space availability around the saplings. Diameter and height growth variables of both species reacted significantly to changes in light availability, and partly also to the neighborhood variables. The leaf morphology [as leaf-area ratio (LAR)] was also driven by light availability and decreased with increasing light availability. However, the branch morphology (as mean branch weight) could not be explained for oak and the model outcome for beech was hard to interpret. The results could show that individuals of the same species perform differently under constant light conditions but differing neighborhoods. Assessing the neighborhood of trees with highly precise measurement devices, like terrestrial laser scanners, proved to be useful. However, the primary response to a dense neighborhood seemed to be coping with a reduction of the lateral light availability aboveground, rather than responding to an increase of competition belowground. The results suggest continuing efforts to increase the precision with which plant environments can be described through innovative and efficient methods, like terrestrial laser scanning.
Introduction
Every plant competes with other plants or organisms for limited resources. The survival and general plant performance is primarily determined by the amount of resources the individual plant can capture. More specifically, the resource availability influences competitive ability (Funk and Vitousek, 2007), primary and secondary growth (Pretzsch et al., 2017), biomass allocation (McConnaughay and Coleman, 1999; Shipley and Meziane, 2002), and plant morphology (Hutchings and de Kroon, 1994; Kimmins, 2004). For saplings growing in the understory of (temperate) forest ecosystems the amount of light is considered to be among the most important resources (Lambers et al., 2008). Aside of its importance, the availability of light is known to influence different species in various ways, especially when considering light demanding or shade tolerant species (Poorter, 1999; Lödige et al., 2014; Annighöfer et al., 2017), resulting in species-specific traits as reaction to varying levels of light (Petriţan et al., 2009; Schall et al., 2012). Several studies were able to measure the light availability and show its effects on the sapling performance (e.g., Beaudet and Messier, 1998; Williams et al., 1999; Drever and Lertzman, 2001; Claveau et al., 2002; Ammer, 2003; Delagrange et al., 2004; Messier and Nikinmaa, 2016; Annighöfer et al., 2017). Plants in general also compete for other resources above- and belowground, including water, nutrients and growing space (Casper and Jackson, 1997; Leuschner and Ellenberg, 2017). Effects of belowground competition on sapling performance induced by mature trees have been shown by exclusionary experimental setups, e.g., root-trenching experiments (Leuschner et al., 2001; Ammer, 2002; Petriţan et al., 2011), even though still comparably little is known about belowground competition.
In addition to directly measuring the availability of resources and relating it to plant performance, or directly measuring the resource uptake by individual plants (e.g., Ehleringer and Dawson, 1992; Silla and Escudero, 2003), a common approach to explain plant performance is to measure the competitive pressure an individual is exposed to (e.g., Wagner et al., 2009; Seidel et al., 2015). For mature trees, several indices exist to quantify the aboveground competitive pressure an individual might be exposed to at its growth site, among which the Hegyi index (Hegyi, 1974) is a widely applied measure. For saplings, however, many of the competition measures are laborious to derive in the field and rarely used (e.g., Elliot and Vose, 1995). Furthermore, many competition indices are strongly focused on the dimensions and competitive interactions of neighboring full-grown trees. In light-limited surroundings the abundance of shrubs, grasses and herbs can generally be considered to play an insignificant role for the performance of mature trees, even though some studies also show their effect on ecosystem traits (Gebhardt et al., 2014). For smaller saplings however, the abundance and density of shrubs, grass and herbs in their direct neighborhood can be expected to have a more severe impact (Löf, 2000; Coll et al., 2003; Harmer et al., 2005), but quantifying these is complicated. So far, these vegetation layers are usually described in view of their cover, e.g., through Braun-Blanquet (1932) and other visual assessments (Wagner and Radosevich, 1991), or their effect is studied by setting up desired levels of competition through planting and weeding or the use of herbicides (Morris et al., 1990, 1993; Jylhä and Hytönen, 2006). Also, depending on the growth form, some species of these vegetation layers might intercept light, but other species with similar biomass but different growth form might more strongly capture nutrients or water, making the competitive environment of saplings rather complex (Elliot and Vose, 1995).
In this study, we explored a novel approach to quantify the forest structure and neighborhood of saplings through spatial analysis of terrestrial laser scans (TLS). The quantifications derived from the TLS were combined with light measurements derived from a fisheye-lens camera. We expected that a detailed quantification of the individual neighborhood and surrounding forest structure, as addition to the light measurements, would increase the precision with which plant characteristics can be predicted (comp. Wagner et al., 2011). This expectation is based on the assumption that the general availability of resources is not only related to canopy density and thus light availability above each sapling (determined by overstorey density and recorded with the camera), but also linked to the direct neighborhood within the immediate lateral proximity of the saplings and overall indices of forest structure (recorded with TLS). Combining this information should result in a more accurate proxy of the competitive pressure the saplings are exposed to, respectively. To follow-up on this expectation we decided to harvest saplings of a shade-tolerant (Fagus sylvatica L.) and a more light-demanding species [Quercus petraea (Matt.) Liebl.] growing along light gradients in the understory of two different Central European temperate forests. Since all individuals of both species had regenerated naturally, we expected their growth, morphology, and biomass allocation to be a result of the resources at their growth site which they could capture.
We hypothesized that (1) traits and general performances (in view of growth and allocation) of saplings could be better predicted by not only using light measurements as explanatory variable, but additionally considering information of the saplings’ immediate neighborhood and the surrounding forest structure. Specific hypotheses concerning biomass allocation, growth and sapling morphology were:
(2) Following the “functional equilibrium hypothesis,” above- and belowground biomass is allocated in the direction of the limiting resource (Brouwer, 1963; Shipley and Meziane, 2002), e.g., increasing light availability or decreasing aboveground neighborhood density result in an increase of the belowground root-mass fraction (RMF) (Hofmann and Ammer, 2008).
(3) Diameter growth increases with increasing light availability (Beaudet and Messier, 1998) and decreasing neighborhood density, whereas height growth increases with increasing light availability (Lüpke, 2004; Lüpke and Hauskeller-Bullerjahn, 2004) but also with increasing neighborhood density.
(4) Mean branch weight increases with increasing light availability and decreases with increasing neighborhood density, especially for shade-intolerant species, like beech (Smith, 1994; Ammer, 2003).
(5) The leaf area ratio (LAR) decreases with increasing light availability and is higher under low light intensities for shade-tolerant species (Poorter and Remkes, 1990; Cornelissen et al., 1996).
Materials and Methods
Study Area
The saplings were collected from two study locations in Germany. The oak saplings originated from the forestry district “Unterlüß” in Lower Saxony (52°50′ N, 10°16′ O). The stand under investigation is managed as high forest system. Parts of the stand have been naturally regenerated through removing overstorey trees and maintaining regularly distributed seed trees (shelterwood). Retained overstorey trees are mainly comprised of sessile oak (Q. petraea) admixed with scattered individuals of Scots pine (Pinus sylvestris L.), Norway spruce [Picea abies (L.) H. Karst.] and European beech (F. sylvatica) trees. The overstorey has an age of about 130–170 years, depending on the species. The Unterlüß study site is situated in the northwest German lowlands at an altitude of approximately 120 m a.s.l. The climate is temperate oceanic, with an average temperature of 8.4°C year-1. The long-term annual precipitation lies around 760 mm year-1 (Gauer and Aldinger, 2005). The trees are growing on rather nutrient-poor sandy soils, moderately moist (on average sufficient water supply for plant growth) during the growing season, with top soil layers occasionally running dry or water pooling in the deeper soil horizons. The general growth site conditions are considered quite suitable for sessile oak.
The beech saplings were collected in stands of the forestry district “Leinefelde” in Thuringia (10.36° E, 51.32° N). The stand is also a high forest, dominated by beech with admixed single pedunculate oak (Quercus robur L.) and sycamore maple (Acer pseudoplatanus L.) trees. The age of the overstorey lies around 130–140 years. Following a mast year and partial target diameter harvest, beech regeneration has established. In winter 2013/2014, additionally six gap cuts (three larger, three smaller gaps, range 500–1170 m2; Seidel et al., 2015) were added to study the natural succession in these gaps in a long term project (not part of this study). The Leinefelde site is located at 450 m a.s.l. in the central German low mountain ranges. The climate is temperate with a tendency toward subcontinentality. The average annual temperature is 8.2°C year-1 and the annual precipitation lies around 680 mm year-1 (Gauer and Aldinger, 2005). The trees are growing on a nutrient-rich clayed-silt soil with sufficient water supply, representing very good growth conditions for beech.
Sapling Collection and Further Field Measurements
Both study sites were divided into systematic grids of 25 × 25 m (Leinfelde) and 18 × 18 m (Unterlüß) with randomized starting points. This grid was chosen to assure covering a variety of light and neighborhood conditions the saplings were growing in. The grid size was derived from the size of the area under regeneration to result in about 50 sampling points. Saplings were collected along the grid points at both sites, by choosing the sapling closest to the grid point, respectively. The only selection criteria were sapling vitality (free of apparent damage) and sapling dimensions (i.e., height and diameter) to assure morphological and age wise comparability of the saplings. If saplings belonged to a regeneration group, the most vital sapling of the group was chosen. Saplings were identified, marked and harvested as whole plants (above- and belowground plant compartments) for further analysis in the laboratory. This resulted in a total of 51 beech saplings in Leinefelde and 44 oak saplings in Unterlüß (Table 1).
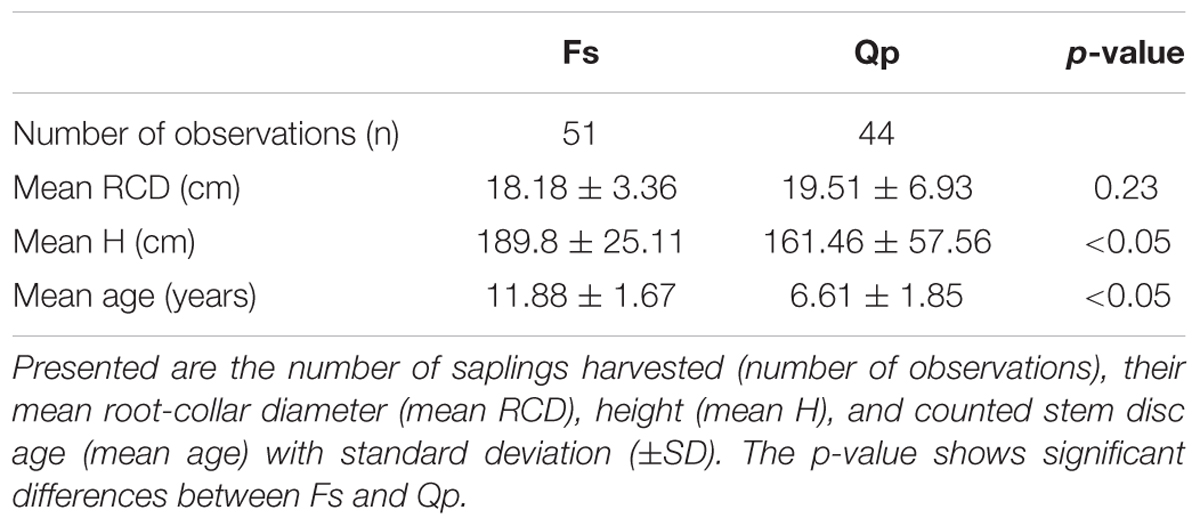
Table 1. Properties and dimensions of the beech (Fs) and oak (Qp) saplings in the year of harvest.
The light environment the saplings were exposed to prior to harvest, was measured at each harvesting location using an automated fisheye lens camera (Solariscope, Behling SOL300, contact: hb.messtechnik@gaia.de). This device calculates measures of light availability (e.g., indirect site factor (ISF), direct site factor, total site factor, openness, gap fraction, and leaf area index) by automatically analyzing hemispherical photographs according to seven threshold values (comp. Pryor, 2010). At each harvesting location one solariscope measurement was conducted at 2 m above ground (comp. Table 1).
Next to the light measurements we assessed the detailed neighborhood conditions and surrounding forest structural conditions of each sapling by taking a TLS at each saplings’ growing position. To ensure capturing the immediate and relevant neighborhood of each sapling each single scan was conducted at 0.8 m above ground, close to 50% of the mean sapling height (comp. Table 1). Scans were captured with the Faro Focus three-dimensional (3D) 120 laser scanner (Faro Technologies Inc., Lake Mary, FL, United States). This terrestrial laser scanner emits 44 Mio laser beams per single scan, which are reflected and received by the instrument, if surrounding objects are hit (comp. Seidel et al., 2015; Ehbrecht et al., 2016). The information stored by the instrument consists of the object’s coordinate in a 3D coordinate system (x, y, z). Since coordinates are dimensionless, they can be converted to voxels (3D pixels) with varying resolution (as presented in Figure 1). Maximum scanning distance of the instrument was 120 m. Resulting 3D point cloud representations of the different forest scenes were processed with FaroScene.
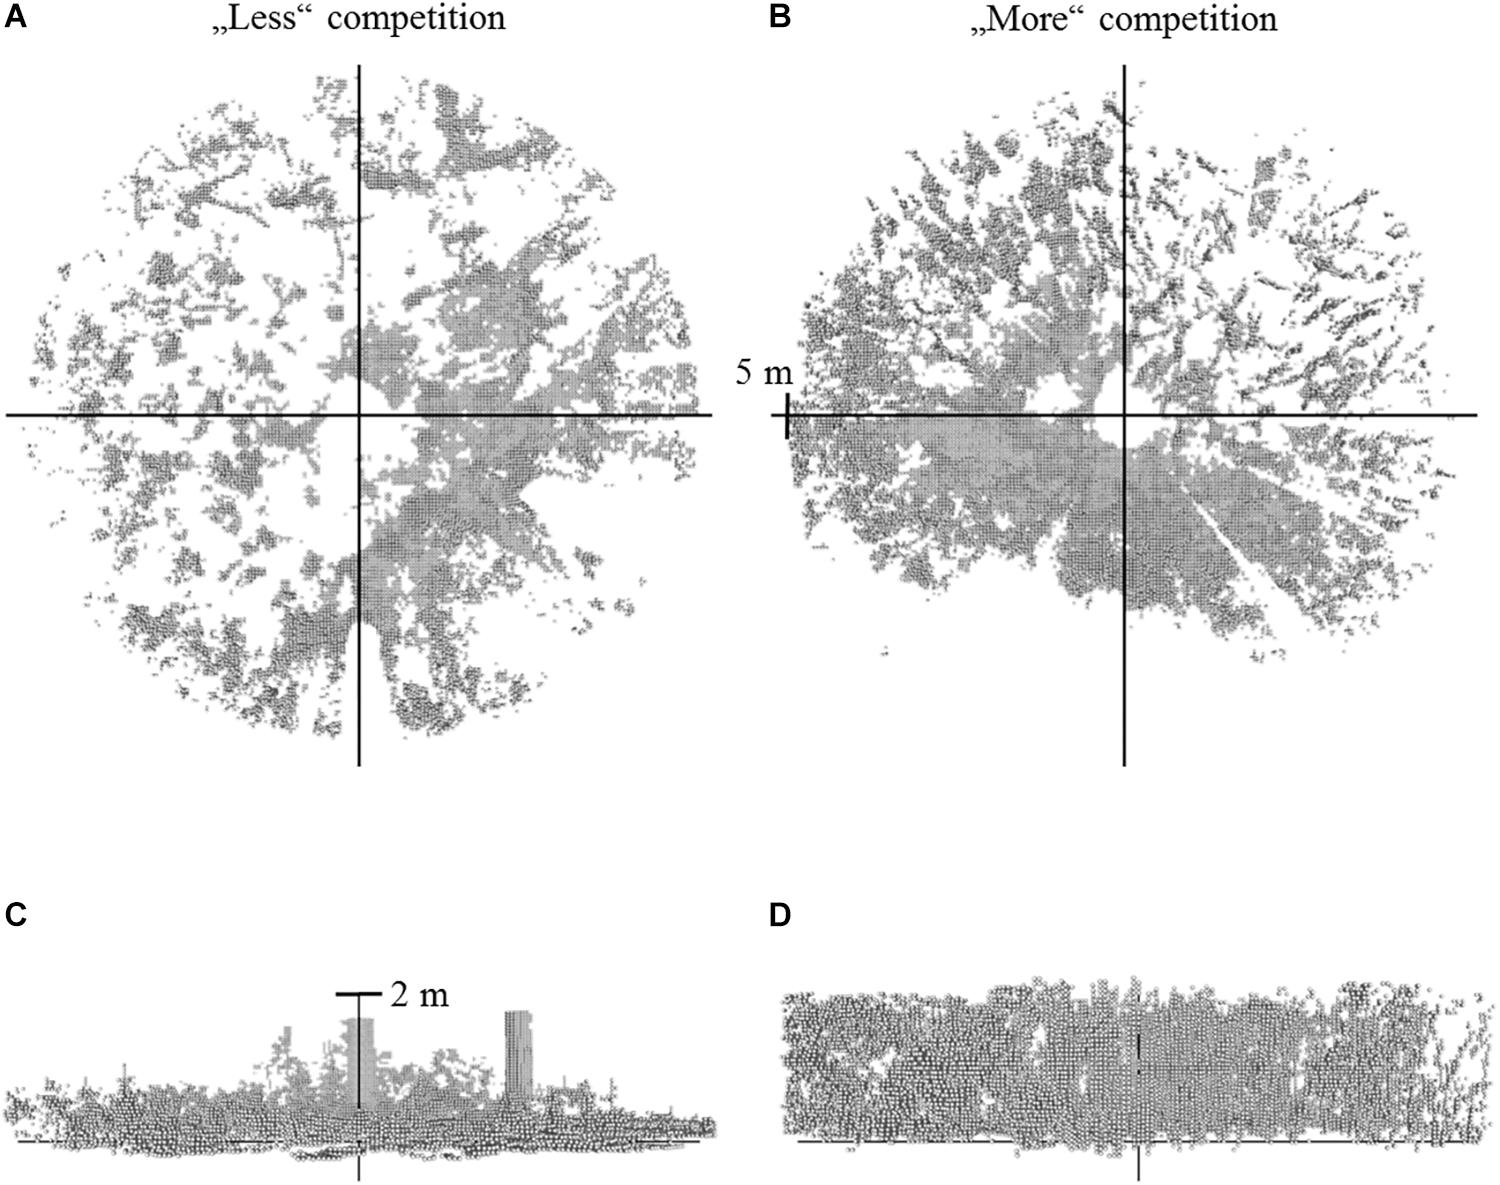
Figure 1. Voxel data (gray) resulting from single scans of two different forest scenes. Left (A,C): situation with less understory vegetation. Right (B,D): situation with more understory vegetation in the vicinity (radius = 5 m) of the sapling (view from top: A,B; view from side: C,D). Two single stems can be made out in the left view from the side (C), whereby the very dense understory vegetation on the right (D) does now allow identifying single objects visually.
Sapling Processing and Laboratory Measurements
The harvested saplings were partitioned according to the plant organs leaves, branches, stems and roots. One random fresh-leaf sample of at least 15 leaves was collected from each sapling. These 15 leaves were scanned on a flatbed scanner (Mustek Systems Inc. A3 2400S) and their leaf area was measured with ImageJ (open source; developer: Wayne Rasband). The branches on each sapling were counted. All plant compartments were then dried in a temperature-controlled oven at 70°C to constant weight and weighed (mg). The random leaf samples were dried separately, allowing to use the ratio of leaf area and dry weight to estimate the total leaf area of each sapling. An age estimation and the annual diameter increment of all saplings was measured by extracting a stem disc from each sapling (5 cm above ground), sanding it, and counting and measuring the annual rings, respectively. Year ring widths were measured in two to four (for stem discs strongly deviating from circularity) directions on scanned images (1200 dpi) of the disks, with a precision of 1/100 mm using the software Lignovision (Rinntech version 1.37). Annual height increment was assessed along each stem by measuring the distance between two consecutive annual internodes on the stem surface. Additionally, the root-collar diameter (RCD) was measured 5 cm above ground (where the stem disc was extracted) and the total height (H) of the sapling was measured along the stem axis by measuring its length.
Data Analysis
Analyzing the Growth Environment – Light Environment
Analyzing the light environment was based on the Solariscope measurements. From the resulting seven threshold-based interpretations of the hemispherical photos from each harvesting location, the operator needs to visually choose the one showing the best distinction between sky and non-sky. Two independent operators underwent this procedure for quality assurance, especially for stand conditions which are well represented by more than one threshold value. The quantification of the light environment was based on the ISF. The ISF quantifies the proportion of indirect or diffuse radiation reaching the measurement point.
Analyzing the Growth Environment – Forest Structure
The forest structure was analyzed by calculating published indices based on the full 3D point clouds or parts of the 3D point clouds created through the TLS (single scans). These indices were the effective number of layers (Ehbrecht et al., 2016), the stand structural complexity index (Ehbrecht et al., 2017), and the so called MeanFrac, which is part of the stand structural complexity index presented in Ehbrecht et al. (2017), but used in isolation here. MeanFrac stands for the mean fractal dimension index, based on McGarigal and Marks (1995). It is defined as the arithmetic mean of perimeter to area ratios of vertical point cloud polygons, similar to what can be seen in Figure 2B. A detailed description of its calculation is presented in Ehbrecht et al. (2017).
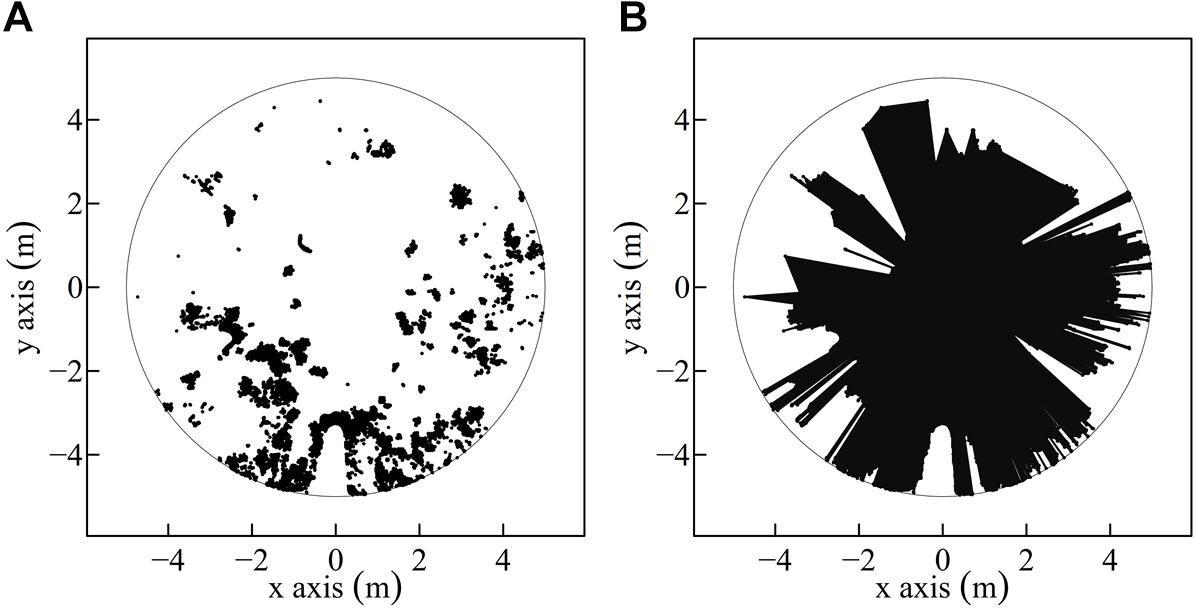
Figure 2. Exemplary understory three-dimensional (3D) point cloud projection onto a two-dimensional (2D) horizontal plane. Transformation of a two-dimensional (2D) point cloud (scatterplot) (A) within a radius of 5 m to a polygon (B) by connecting all points. The polygon area is colored black (B).
Analyzing the Growth Environment – Neighborhood
The 3D point clouds derived from the single scans were further used to analyze the direct neighborhood of the saplings. We assumed that the immediate neighborhood of a sapling was well represented by all elements of neighboring plants located in a cylindrical selection of the point cloud with a radius of 5 m around the target sapling. For separating the neighborhood information from the light measurements (space vs. light), the cylinder was reduced to a height of 2 m, to only include information on the neighborhood not already recorded by hemispherical photography. These point cloud cylinders were further processed and analyzed applying two different approaches:
The first approach was based on creating voxel-models from the 3D point clouds. The voxel size was 125 cm3 (5 cm side length) and voxels served as proxy to calculate a relative space filling value around the individual saplings (Figure 1). An edge length of 5 cm was considered appropriate to maintain the details of the point clouds representing a forest scene, without giving too much weight to single stray points in the original point cloud. Relative filling values were calculated for the full cylinder (radius = 5 m, height = 2 m) and for gradual radius reductions in steps of 1 m by applying the following formula:
[with RFi = relative filling of cylinder with radius i; V_vox = volume of voxel (125 cm3); n_voxi = number of voxels in cylinder with radius i; Ri = radius i of cylinder (with i = 500, 400,…100 cm); H = height of cylinder (200 cm)].
In the second approach, point clouds were not voxeled but each point coordinate was used to span a horizontal polygon, as proxy for the space available around the saplings within the predefined cylinder. Also here resulting polygon areas were calculated for the maximal radius of 5 m and for successive reductions of the radius. To create the polygons, the 3D points within the cylinder were projected onto a two-dimensional (2D) surface, whereas the points below 30 cm height were excluded to reduce the effect of forest ground hits (Figure 2).
Analyzing the Saplings
The effects of light availability, forest structure, and neighborhood on biomass allocation (root, stem, branch, and leaves), increment measurements (height and diameter), and sapling morphology (mean branch weight, LAR) were assessed. Mass fractions of each plant organ were calculated in relation to the total plant mass by applying Eq. 2 for each sapling.
[with MFi = mass fraction of plant organ i (g g-1); BMi = biomass of plant organ i (g); BMT = total biomass of sapling (g), with i = root, stem, branch, and leaf].
Next to absolute diameter and height increment measures (comp. above), the increment measures were also converted to relative values (Eq. 3) for each sapling:
[with Rel_inci = relative increment of i (1/100); Inci = increment of i (cm; 1/100 mm), with i = height, diameter (cm; 1/100 mm)].
The morphology was quantified by using the total number of branches to calculate the mean branch weight (Eq. 4) for each sapling:
[with Mean_BW = mean branch weight (g n-1); B_bm = branch biomass (g); B_n = number of branches].
The morphology was further quantified by calculating the LAR (Eq. 5) for each sapling:
[with LAR = leaf area ratio (cm2 g-1); LA = total leaf area (cm2); BMT = total biomass of sapling (g)].
Statistical Analysis
The comparisons between groups (e.g., Table 1, between “Beech” and “Oak”) were conducted with parametric and non-parametric tests, depending on the data structure. For data that was normally distributed (Shapiro–Wilk test) and had homogenous variances (Fligner–Killeen test of homogeneity of variances) an analysis of variance model (AOV) was used. For data that was not normally distributed or data that had inhomogeneous variances, a non-parametric Kruskal–Wallis rank sum test was applied.
The relationships between response (y) and explanatory (x) variables were analyzed with multiple-regression techniques. Data was separately analyzed for both species. To reduce the total number of predictor variables and especially to reduce variance inflation through collinearity, single predictors were removed from pairs of predictors with R2 > 0.7, in reference to Dormann et al. (2013). The remaining explanatory variables were (1) the ISF, as descriptor for the light environment the saplings were exposed to, (2) the relative filling of the cylinder with 5 m radius (RF_5m) and the (3) horizontal polygon area within a radius of 2 m (PA_2m), as descriptors for the direct neighborhood of the saplings; (4) MeanFrac as descriptor for the complexity of the general forest structure of the stands where the saplings were growing.
The multiple regressions as generalized linear models (GLM) were started as full models, including interactions between the light measure (ISF) and the neighborhood variables (RF_5m and PA_2m) as representatives for competitive interactions in view of different resources. To correct for inhomogeneous standard deviations (non-normally distributed regression residuals, visual verification, Shapiro–Wilk test), logarithmic transformations were applied (McDonald, 2014), wherever necessary. The full models were then simplified through backward selection, starting with non-significant interactions and then subsequently removing single variables with highest p-values until all remaining variables were significant or significant in interactions, controlled through AOV tables (Crawley, 2013). Models were evaluated through residual standard error (RSE), R2 (for models with a single predictor variable) and adjusted R2 (as robust measure against overfitted models with more than a single predictor variable). The relative importance of significant explanatory variables in models with more than one explanatory variable was assessed using the proportional marginal decomposition method and metric proposed by Feldman (2005) and recommended by Groemping (2006). For higher order terms (interactions) variable importance was assessed through R2 partitioning by averaging over orders according to Lindeman et al. (1980) and also as recommended by Groemping (2006).
Significant interactions were visualized in 3D plots. Selected variables comparing the response of beech and oak to one another were visualized through non-linear Generalized Additive Modeling (GAM) techniques (Hastie and Tibshirani, 1990; Wood, 2006). The GAM visualization was used for comparison because no data transformation was required. The effective degrees of freedom (EDF) were limited to a maximum of 3 (number of knots = 4). However, the amount of smoothing was chosen automatically through generalized cross-validation (Cianelli et al., 2004). The data family was set to Gaussian type with an identity-link function (Wood, 2011). The statistical significance of the GAM models was evaluated by considering the p-values tested by an F-test.
The significance level for this study was p < 0.05. All statistical analyzes, model fitting, and graphs were processed and produced using the free software environment R, version 3.4.0 (R Core Team, 2017).
Results
The four predictor variables were able to explain 18 out of 20 response variables (unexplained: branch mass fraction, mean branch weight of oak). For these 18 response variables the model quality varied considerably, with adjusted R2-values ranging from around 0.1 (e.g., stem mass fraction and leaf mass fraction of beech) up to maximum values around 0.5 (absolute diameter increment of oak; absolute and relative diameter increment of beech). A total of 7 out of 18 response variables was explained best by a single variable, which were light availability (ISF, n = 4) and relative space filling (RF_5m, n = 3). All other models had more than one predictor variable, with their relative importance ranging from 0.03 up to 0.52, respectively. The most abundant significant predictors in all models were the light availability (ISF, n = 16, including n = 2 significant interactions), followed by the relative space filling (RF_5m, n = 11, including n = 2 significant interactions). MeanFrac was significant in n = 4 models and the polygon area (PA_2m) was significant in n = 2 models (comp. Table 2).
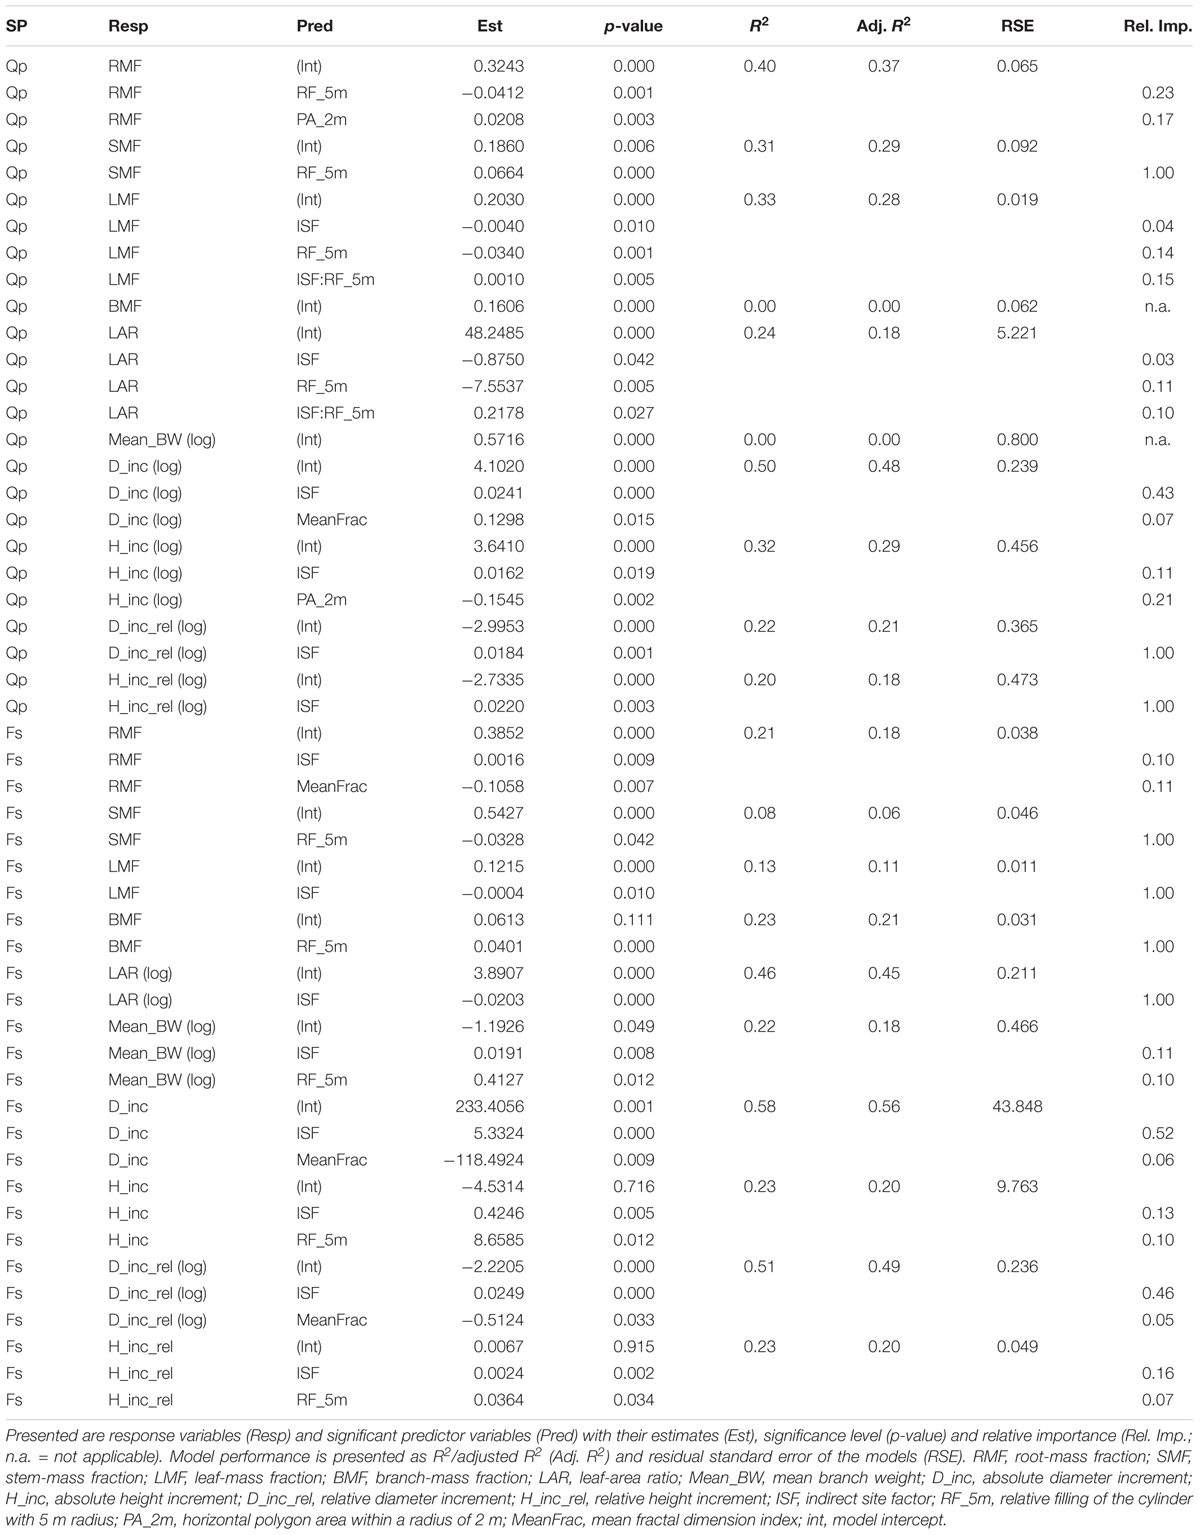
Table 2. Generalized linear model (GLM) performance table for both species (SP), oak (Qp), and beech (Fs).
Biomass Allocation
The RMF of oak was sensitive to neighborhood variables but not to light and forest structure (Table 2). An increase of relative space filling (RF_5m) reduced the RMF, whereas an increase in space (PA_2m) around the sapling increased the RMF. The RMF of the beech saplings did not respond to the neighborhood variables, but only reacted positively to light availability (ISF) and negatively to structural complexity (MeanFrac). The explanatory strength of the model for beech was much lower than for oak (comp. Figure 3A for RF_5m). Stem-mass fraction for oak increased with increasing RF_5m and could nearly not be explained for beech (R2 = 0.08), even though RF_5m was also the significant predictor here (Figure 3B and Table 2). Leaf-mass fraction generally decreased with increasing ISF, whereas it was part of a significant interaction with RF_5m for oak. Figure 4 shows the interaction, as opposed trends. Under low light availability (ISF) and increasing relative space filling (RF_5m), leaf-mass fraction approaches zero. Under low RF_5m and increasing ISF values leaf-mass fraction also decreases. Under high RF_5m and increasing ISF values leaf-mass fraction increases, as also for high ISF and increasing RF_5m. The branch-mass fraction could not be explained for oak, but increased with increasing RF_5m for beech.
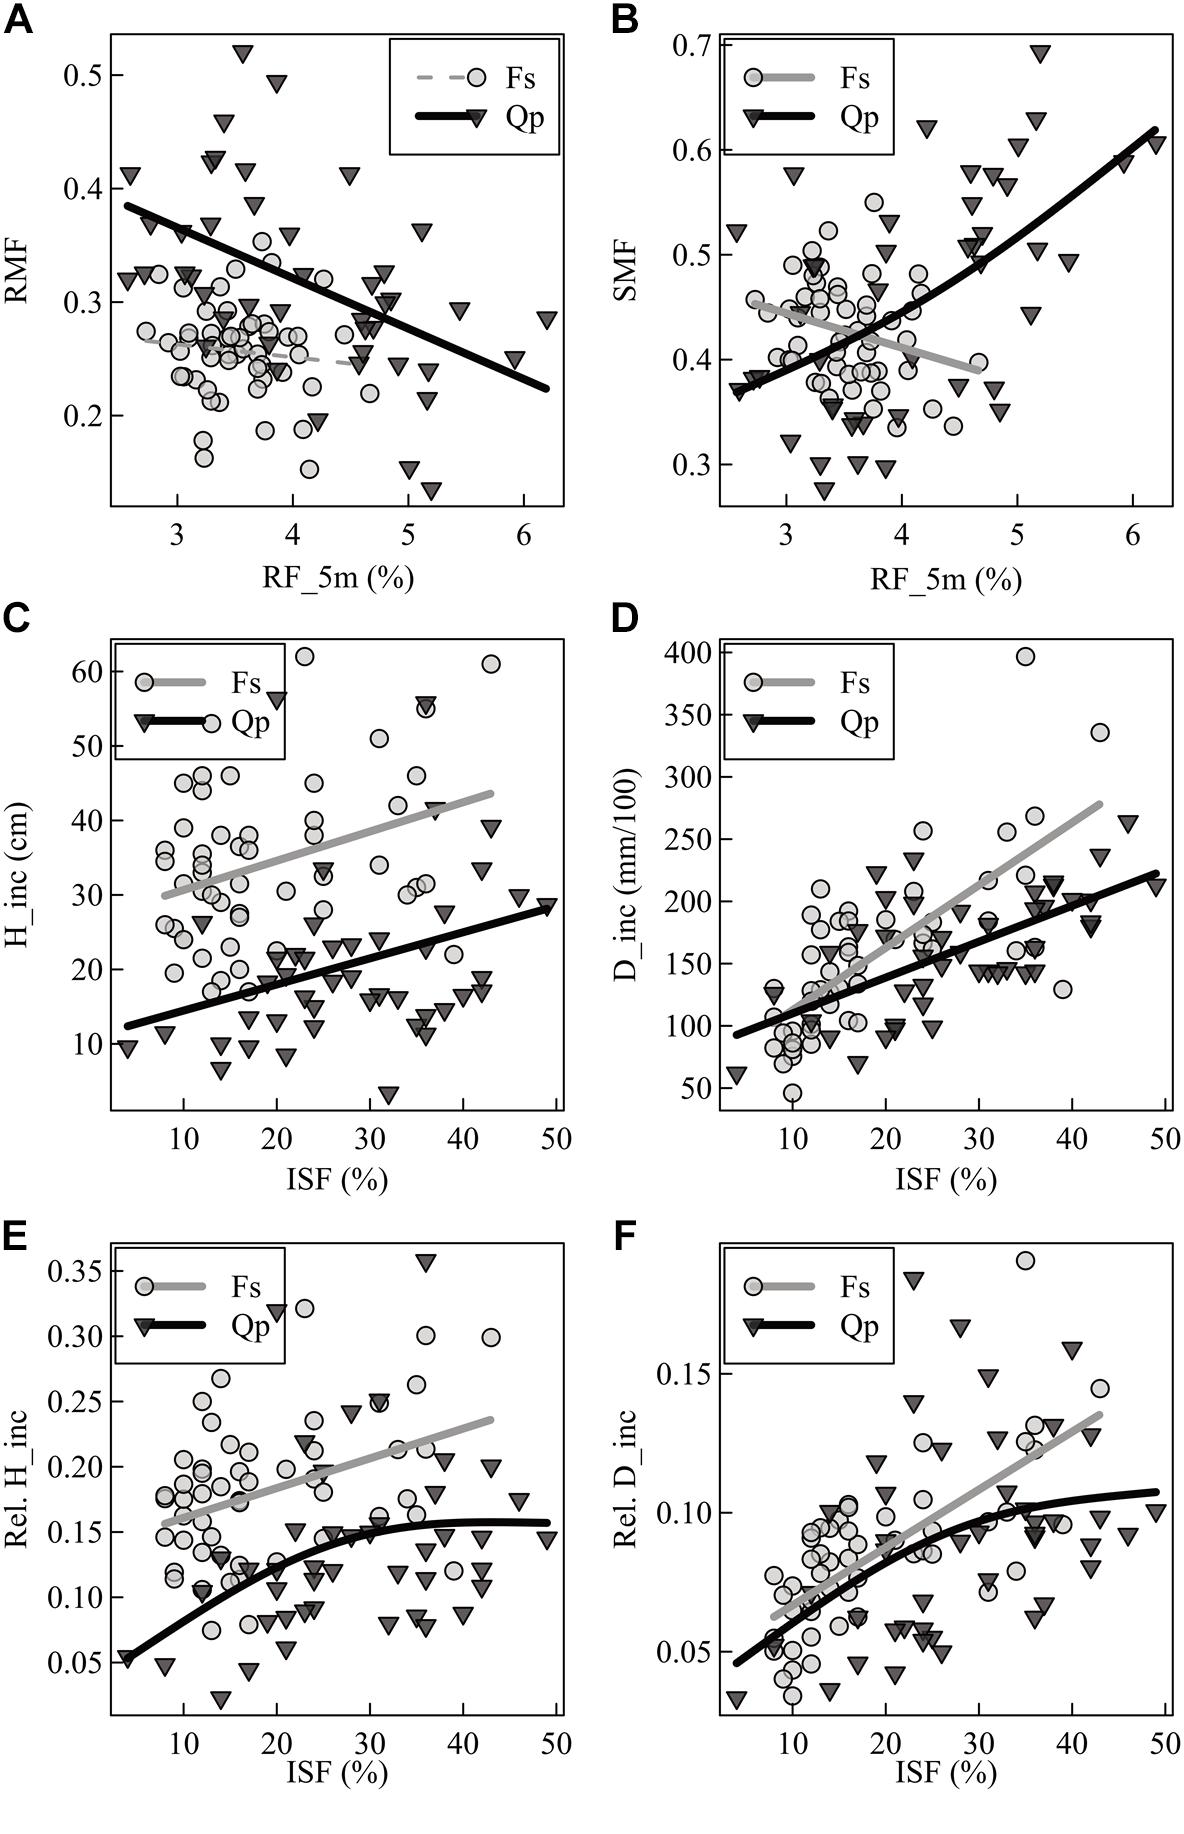
Figure 3. Generalized additive model (GAM) visualization of two selected single predictors (relative space filling = RF_5m; indirect site factor = ISF) of (A) root-mass fraction (RMF), (B) stem-mass fraction (SMF), (C) absolute height increment (H_inc), (D) absolute diameter increment (D_inc), (E) relative height increment (Rel. H_inc), and (F) relative diameter increment (Rel. D_inc) for direct response comparison of beech (Fs) and oak (Qp) saplings. Solid bold lines show significant trends, dotted thin lines show non-significant trends at the level of p < 0.05.
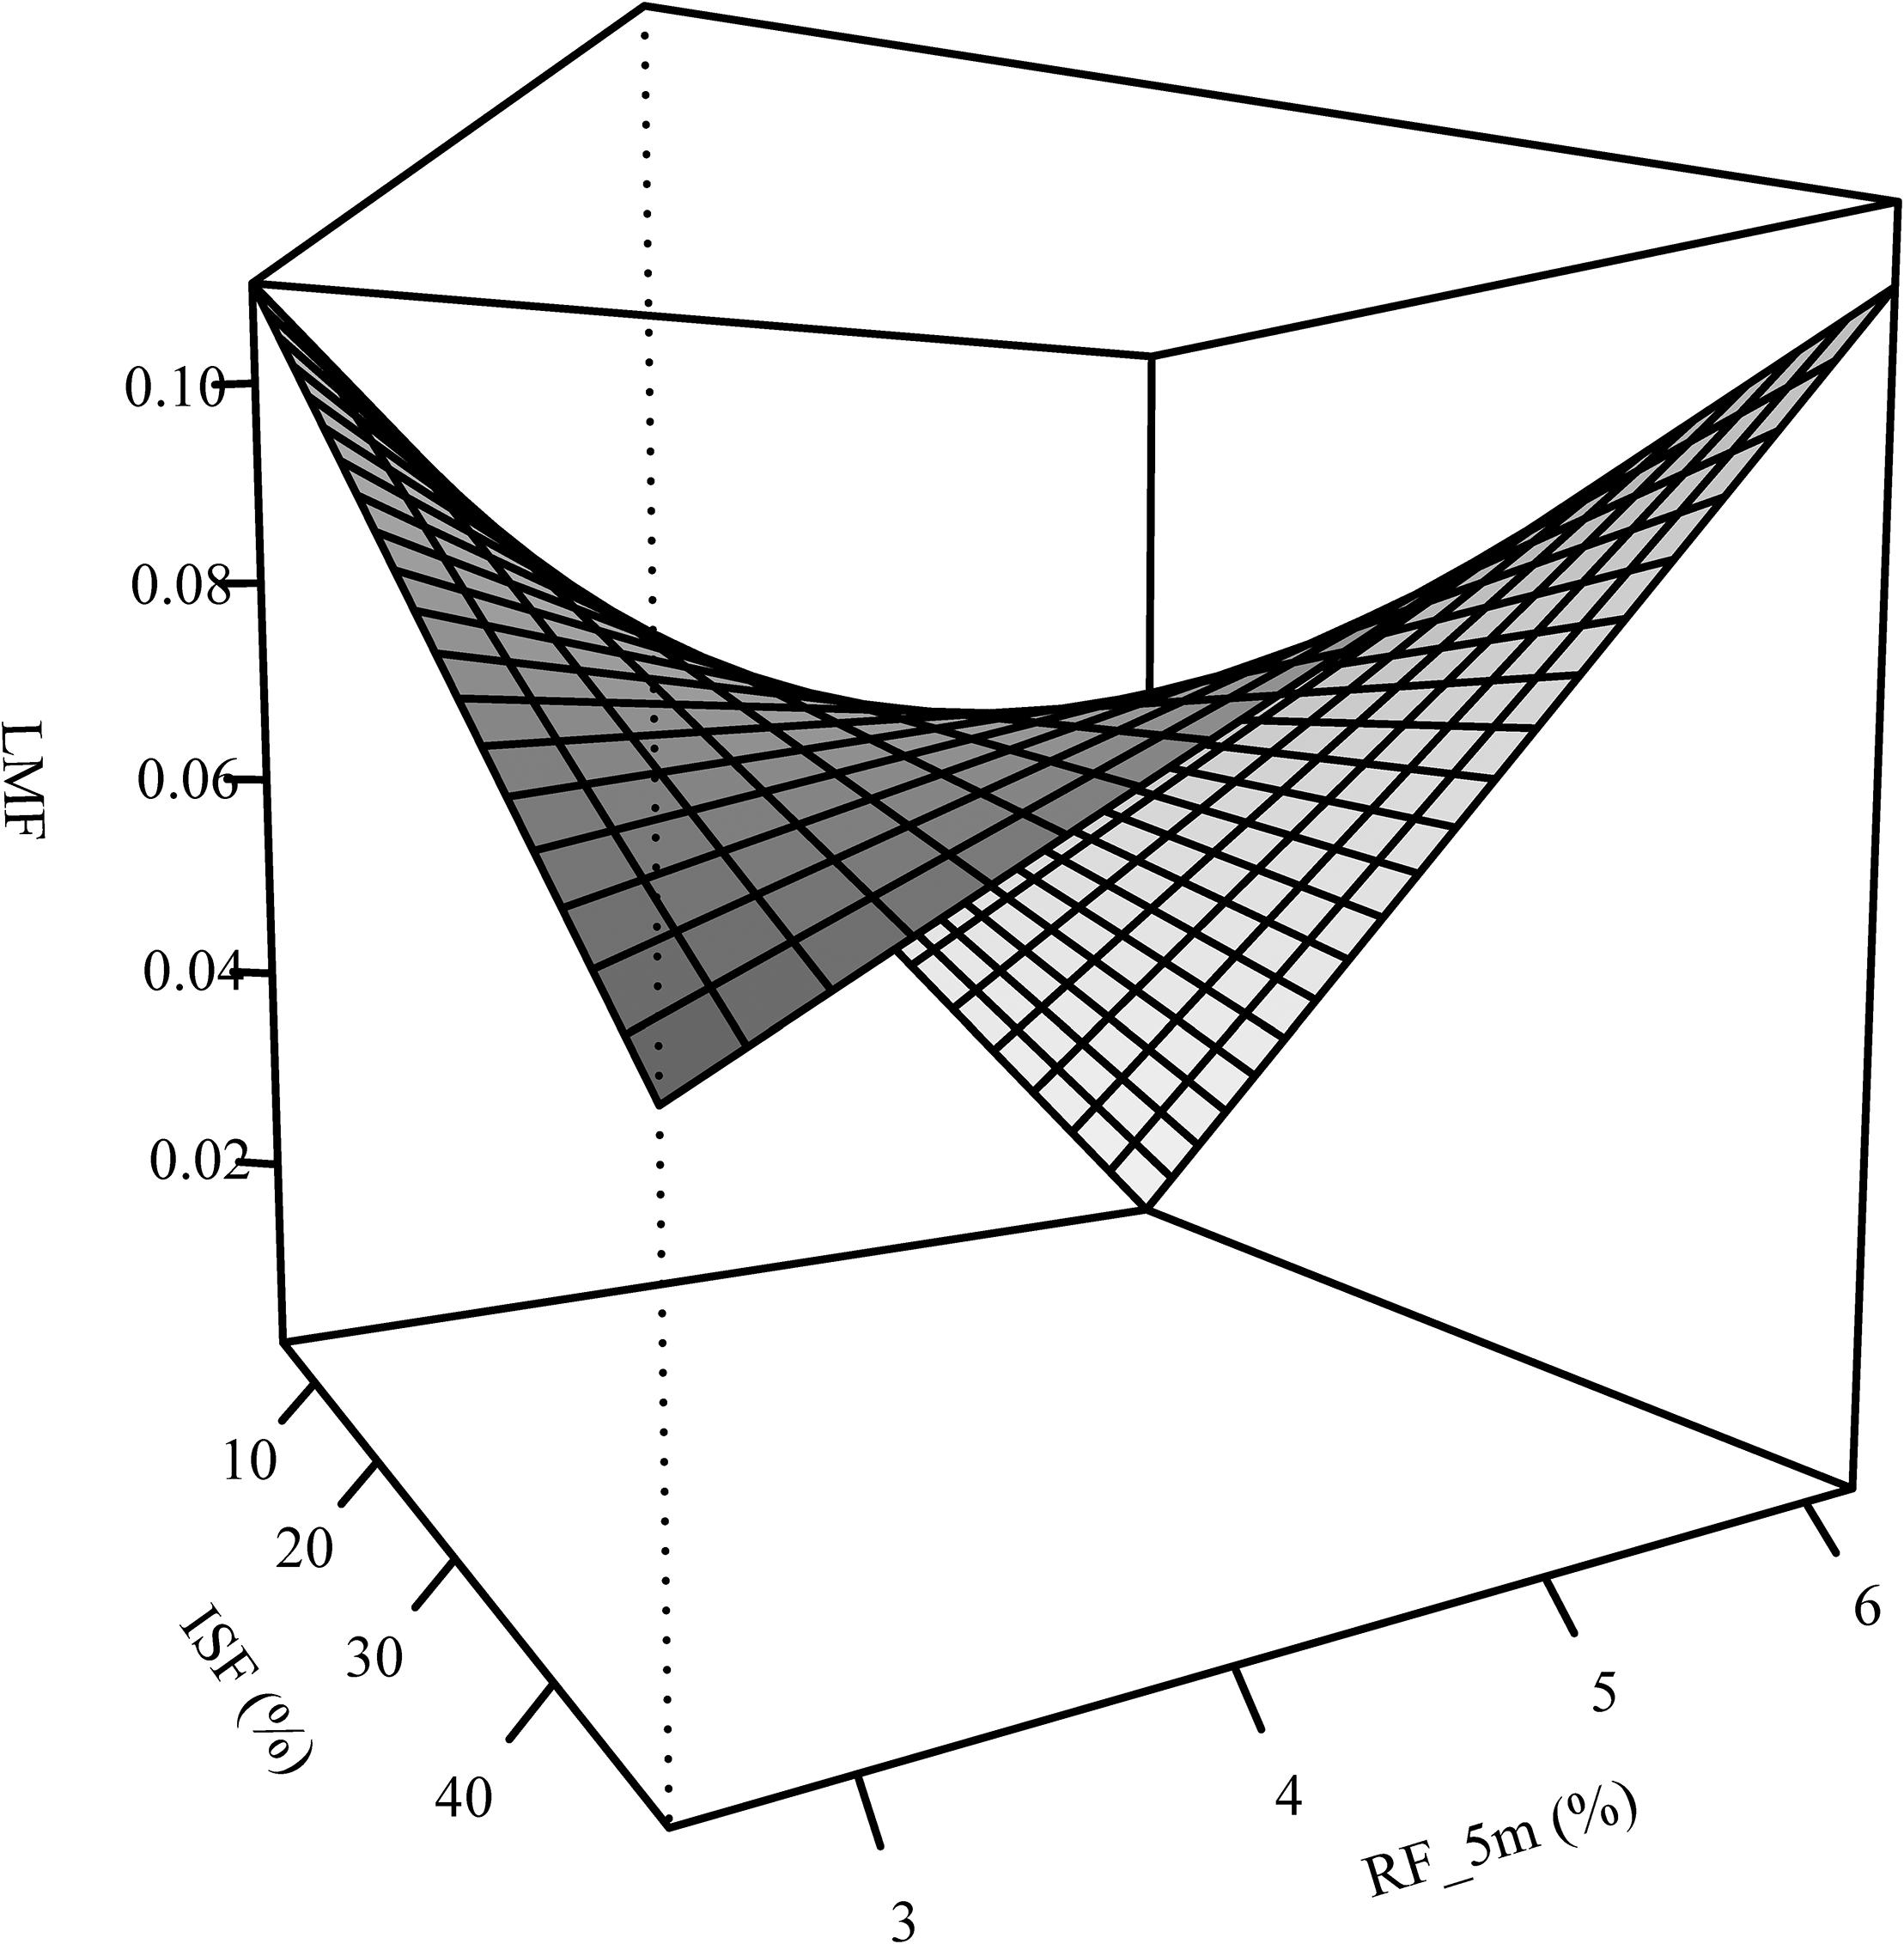
Figure 4. Interaction between light (ISF) and relative filling (RF_5m) as explanatory variables of the leaf-mass fraction (LMF) – analogous to leaf area ratio (LAR) – for the oak saplings.
Increment
The absolute and relative height growth (H_inc and H_inc_rel) for oak and beech saplings increased with increasing light availability (ISF) (Figures 3C,E and Table 2). But absolute height growth was partly more strongly driven by neighborhood. It decreased with increasing polygon area (PA_2m) for oak and increased with increasing relative space filling (RF_5m) for beech (same results for relative height increment of beech). Absolute height increment was higher for beech over the whole light gradient. Absolute and relative diameter increment (D_inc, D_inc_rel) for both species was most strongly driven by light availability and increased with increasing ISF (Figures 3D,F). For beech, also MeanFrac was significant, negatively reacting with increasing diameter growth.
Morphological Traits
The mean branch weight could not be explained by the considered predictor variables for oak. For beech, it increased with light (ISF) and relative space filling (RF_5m), whereas the explanatory strength was also not high for this model.
The LAR of both species decreased with increasing light availability, whereas this trend was explicit for beech, not so for oak (Table 2). The leaf-area ratio (LAR) model for oak contained an interaction term between ISF and RF_5m again and the explanatory strength of the model was not high (Adj. R2 = 0.18). The trend of the interaction was analogous to leaf-mass fraction (Figure 4). It suggests that oak LAR was low when light availability was high and space filling with competing vegetation was low. In contrast, LAR increased if either light availability decreased or if space filling increased.
Discussion and Conclusion
Our study confirmed our major hypothesis that (1) adding explanatory variables, describing the neighborhood of saplings, in addition to light measurements increase the predictive power of tree regeneration trait and performance models. The results showed that more than 50% (11/20) of the models contained more than one predictor variable. Out of all other models with a single predictor variable, light availability was not always the one with the highest explanatory power. Also the relative space filling variable (RF_5m) performed well as single predictor. This finding reflects that plants of the same species perform differently under the same level of light availability, depending on their immediate surrounding (Hofmann and Ammer, 2008). The latter may be determined by intraspecific competitors of the same cohort or by competing vegetation such as grasses or herbs. Such differences in growth environment will inevitable result in different levels of resource depletion (water and nutrients) but also affect other mechanisms that shape plant diversity (morphology), like signaling mechanisms and chemical interactions (comp. Schenk, 2006).
By separating the growth space into a zone above 2 m, in which the light availability was measured, and below 2 m, for which the neighborhood variables were derived, we aimed at getting a more precise proxy of the true competitive pressure a sapling is exposed to. By including the neighborhood we tried to give more weight to the resources other than light, i.e., water and nutrients, by assuming a correlation between above- and belowground competition. However, as in many other temperate forests, light proved to be the dominant driver for sapling performance. On the one side, light is considered to be the decisive factor of plant development (Lambers et al., 2008; Leuschner and Ellenberg, 2017). On the other side, responses to a certain level of light in situ always also reflect a cumulated effect of other factors (Beaudet and Messier, 1998) that vary among the microsites with differing canopy openness and light regimes (Collins et al., 1985). For example, root competition by overstorey trees for belowground resources corresponds to low light availability. Disentangling these two drivers would require experimental approaches such as trenching (e.g., Ammer, 2002; Petriţan et al., 2011).
The general predictive strength of the models (considering all response variables together) did not differ greatly between the two species, as a possible consequence of their shade-tolerance levels (Niinemets, 2006), neither by the mean R2-values of the models, nor by the amount of response variables that could be explained (n = 8 for oak; n = 10 for beech). When looking at the response variables separately, however, a different picture emerged, especially when considering the biomass allocation based on the growth-environment. Here, allocation toward the different plant organs (root, stem, leaves, not for branches) was better explained for oak than for beech (comp. Figures 3A,B and Table 2). So responses of oak seedlings seem to suggest that they are more sensitive to their immediate surrounding in view of allocation patterns.
In general, the findings for oak and beech confirmed our second hypothesis, namely that biomass is invested in the direction of resource limitation, so that increasing light availability or decreasing neighborhood density would result in an increase of RMF. Both species confirmed the hypothesis differently, however. ISF was not significant for oaks but the neighborhood variables were. The oaks reacted quite sensitive to occupied space around them, so reducing RMF when relative space filling (RF_5m) increased and polygon area (PA_2m) decreased. Considering this response of the oak saplings (decreasing RMF), the primary effect of a dense neighborhood seems to be a reduction of the lateral amount of light the oaks receive. This is supported by the increased stem-mass fraction with increasing relative filling (RF_5m). Our results suggest, that young oaks seem to be less sensitive to low overstorey light levels than to reductions in lateral light availability. In this respect, our investigation goes beyond other studies that have not differentiated between the two directions of light. Accordingly, they reported the more general finding that young oaks are sensitive to light availability (Jarvis, 1964; Ziegenhagen and Kausch, 1995; Lüpke and Hauskeller-Bullerjahn, 2004; Annighöfer et al., 2015; Mölder et al., 2019), However, since aboveground biomass is correlated with belowground biomass (e.g., Jackson et al., 1996; Cairns et al., 1997; Litton et al., 2003), an increase of neighborhood density should also lead to an increase in belowground competition for water and nutrients. This would mean that belowground resources might also become limiting with increasing neighborhood density. Following the “functional equilibrium hypothesis” (Brouwer, 1963; Shipley and Meziane, 2002), an increase of RMF to capture the limiting belowground resources could have also been expected (e.g., Pearson et al., 1984; Comeau and Kimmins, 1989). On the contrary, we could not find indications for this effect of neighborhood density. For a light demanding species, like oak, a kind of allocation-prioritization (hierarchical allocation) might come into play. If above- and belowground resources become limiting, biomass might primarily be allocated to the aboveground compartments. This, of course goes at the expense of root biomass and seems to be independent of a simultaneous limitation of belowground resources. Thus, the need to not lose the connection to light, which might be mortal (comp. Messier et al., 1999) and is referred to as “light-seeking strategy” (Beaudet and Messier, 1998), seems to be of higher priority than to develop the rooting system. However, this strategy may be typical for primarily light-limited settings and may be different in water-limited surroundings (Canham et al., 1996; Poorter and Nagel, 2000). McConnaughay and Coleman (1999) studied annual plants and found that biomass allocation did not strongly react to water availability but only to a light and nutrient gradient, which also allows questioning the equality of resource importance for allocation patterns. Presumably, resource importance also changes during ontogeny (Ammer et al., 2008). Interestingly, beech saplings did not react to the neighborhood variables, but to ISF. Their RMF increased and leaf-mass fraction decreased with increasing ISF, which confirmed the second hypothesis. Also a reduced complexity (MeanFrac) of the forest structure around the beech saplings increased the RMF. Apparently the complexity measure is somewhat linked to the light availability (comp. above). Opposite to the oaks, beech saplings showed decreased stem-mass fraction and increased branch-mass fraction with increasing neighborhood density, which stands quite opposite to other studies and meta-analyzes (e.g., Poorter et al., 2012). However, since the SMF model had a low predictive power the finding should be treated cautiously and may be explained by the fact that the gradient of the neighborhood variables was not as large for beech, compared to oak. Aside of a wider gradient, it is also important to mention that the growth site conditions in terms of water and nutrients were considered good for both species. So even with increasing neighborhood densities, the main driver of competition may have been light, because neither water nor nutrients apparently became as limiting.
The third hypothesis (diameter growth increases with increasing light availability) was partly confirmed for oak and beech. The positive trend between light availability and radial growth increment found here has often been reported in literature (e.g., Beaudet and Messier, 1998; Finzi and Canham, 2000; Chan et al., 2003). Expected effects of the neighborhood variables on diameter growth (diameter growth decreases with increasing neighborhood density) could not be found for both species. Neighborhood effects seem to be negligible and superimposed by the high importance of ISF for diameter growth in both cases. However, relative and absolute height growth of both species showed the expected positive relation to ISF (e.g., Collet et al., 1997; Lüpke and Hauskeller-Bullerjahn, 2004), but also to neighborhood (height growth increases with increasing neighborhood density), eventhough the explanatory strength of the models was not as high as for diameter growth. So since a dense neighborhood increased the height growth for both species (negative PA_2m for oak and positive RF_5m for beech), we can conclude for juvenile trees that a reduction of horizontal space paired with maximal vertical light availability significantly promotes height growth.
Aside of promoting juvenile height growth, a further objective of high densities of juvenile trees in forest management is to reduce their branchiness, which was expressed in the fourth hypothesis. It stated that the mean branch weight increases with light availability and space. This was surprisingly not confirmed for oak (no model could be fitted) and only partly for beech. The mean branch weight increased with ISF but also with increasing RF_5m. Latter contradicts with practical experience and scientific publications or textbooks on silviculture (Mäkinen and Hein, 2006; Röhrig et al., 2006; Weidig et al., 2014) and cannot be explained. However, this finding should not be overrated, since the model quality was also rather low.
Finally, in line with many other studies (Popma and Bongers, 1988; Walters et al., 1993; Lusk, 2002), this study confirmed the negative relationship between LAR and ISF as stated in the fifth hypothesis. It also confirmed that the LAR values and absolute slopes were generally higher for the shade tolerant beech. This is explained by the characteristic of shade tolerant species to increase their light interception rates at low light levels, by growing shade-leaves and generally allocating more biomass to their leaves. The increased leaf-mass fraction in combination with a larger leaf area per unit leaf biomass (shade-leaves) leads to a larger leaf area per unit plant mass (LAR) (Poorter, 2001).
Overall our study could only partly disentangle the effects of overstorey tree density from lateral competition by the local neighborhood. This result may be partly due to methodological shortcomings. Maybe the relevant space defined as neighborhood (here height = 2 m, radius = 5 m) should have been kept flexible, because it presumably differs depending on sapling size. We tried to give more weight to the resources water and nutrients, by assuming a stronger correlation between the availability of these resources and the neighborhood recorded by the TLS approach than between their availability and the light environment. Apparently without actual measurements of resource availability (soil moisture, N-availability) a separation is not really possible. Also, increasing the gradient of growth site conditions, especially toward limited conditions, could result in stronger responses to the neighborhood, as opposed to conditions, in which mainly light availability is limiting. A scanner-based point could cannot efficiently discriminate point qualities yet, i.e., a return from a tree trunk with a high DBH or a small DBH, from a branch, a leaf or a blade of grass is simply a return. Current and future approaches combining the information from TLS and photogrammetry or beams widening the range of spectral wavelengths that can be retrieved aim at overcoming this limitation. A continuously improved analysis of growth environments and neighborhoods will further on increase the quality of models predicting traits and characteristics of plants. This should be further elaborated in future studies.
Author Contributions
PA conceived and designed the study and wrote the manuscript with support and substantial contributions from DS, AM, and CA. PA collected the data. PA and DS performed the data analysis. CA supervised the findings of this work. All authors commented on and contributed to the final version of the manuscript and approved it.
Funding
We thank the German Research Foundation (DFG) for funding parts of this research through Grant SE 2383/5-1 provided to DS. The German Federal Environmental Foundation (DBU) funded AM through the QuerCon project (Grant No. DBU 32694), which is also gratefully acknowledged.
Conflict of Interest Statement
CA is currently guest editor of Frontiers in Plant Science hosting the research topic “Woody Plants and Forest Ecosystems in a Complex World – Ecological Interactions and Physiological Functioning Above and Below Ground.”
The remaining authors declare that the research was conducted in the absence of any commercial or financial relationships that could be construed as a potential conflict of interest.
Acknowledgments
Much gratitude is owed to the forestry offices Leinefelde (ThüringenForst) and Unterlüß (Niedersächsische Landesforsten) for allowing us to set up this experiment on their sites. We want to thank Ulrike Westphal and Sarah Hasstedt from Silviculture and Forest Ecology of the Temperate Zones, and two students from the University of Göttingen, for their help with performing the lab work.
References
Ammer, C. (2002). Response of Fagus sylvatica seedlings to root trenching of overstorey Picea abies. Scand. J. For. Res. 17, 408–416. doi: 10.1080/028275802320435423
Ammer, C. (2003). Growth and biomass partitioning of Fagus sylvatica L. and Quercus robur L. seedlings in response to shading and small changes in the R/FR-ratio of radiation. Ann. For. Sci. 60, 163–171. doi: 10.1051/forest:2003009
Ammer, C., Stimm, B., and Mosandl, R. (2008). Ontogenetic variation in the relative influence of light and belowground resources on European beech seedling growth. Tree Physiol. 28, 721–728. doi: 10.1093/treephys/28.5.721
Annighöfer, P., Beckschäfer, P., Vor, T., and Ammer, C. (2015). Regeneration patterns of European oak species (Quercus petraea (Matt.) Liebl., Quercus robur L.) in dependence of environment and neighborhood. PLoS One 10:e0134935. doi: 10.1371/journal.pone.0134935
Annighöfer, P., Petritan, A. M., Petritan, I. C., and Ammer, C. (2017). Disentangling juvenile growth strategies of three shade-tolerant temperate forest tree species responding to a light gradient. For. Ecol. Manag. 391, 115–126. doi: 10.1016/j.foreco.2017.01.010
Beaudet, M., and Messier, C. (1998). Growth and morphological responses of yellow birch, sugar maple, and beech seedlings growing under a natural light gradient. Can. J. For. Res. 28, 1007–1015. doi: 10.1139/x98-077
Braun-Blanquet, J. (1932). Plant Sociology (Transl. G. D. Fuller and H. S. Conrad). New York, NY: McGraw-Hill.
Brouwer, R. (1963). Some aspects of the equilibrium between overground and underground plant parts. Meded. Inst. Biol. Scheikd. Onderzoek Landbouwgewassen 213, 31–39.
Cairns, M. A., Brown, S., Helmer, E. H., and Baumgardner, G. A. (1997). Root biomass allocation in the world’s upland forests. Oecologia 111, 1–11. doi: 10.1007/s004420050201
Canham, C. D., Berkowitz, A. R., Kelly, V. R., Lovett, G. M., Ollinger, S. V., and Schnurr, J. (1996). Biomass allocation and multiple resource limitation in tree seedlings. Can. J. For. Res. 26, 1521–1530. doi: 10.1139/x26-171
Casper, B. B., and Jackson, R. B. (1997). Plant competition underground. Annu. Rev. Ecol. Syst. 28, 545–570. doi: 10.1146/annurev.ecolsys.28.1.545
Chan, S. S., Radosevich, S. R., and Grotta, A. T. (2003). Effects of contrasting light and soil moisture availability on the growth and biomass allocation of douglas-fir and red alder. Can. J. For. Res. 33, 106–117. doi: 10.1139/x02-148
Cianelli, L., Chan, K.-S., Bailey, K. M., and Stenseth, N. C. (2004). Nonadditive effects of the environment on the survival of a large marine fish population. Ecology 85, 3418–3427. doi: 10.1002/ece3.2832
Claveau, Y., Messier, C., Comeau, P. G., and Coates, K. D. (2002). Growth and crown morphological responses of boreal conifer seedlings and saplings with contrasting shade tolerance to a gradient of light and height. Can. J. For. Res. 32, 458–468. doi: 10.1139/x01-220
Coll, L., Balandier, P., Picon-Cochard, C., Prévosto, B., and Curt, T. (2003). Competition for water between beech seedlings and surrounding vegetation in different light and vegetation composition conditions. Ann. For. Sci. 60, 593–600. doi: 10.1051/forest:2003051
Collet, C., Colin, F., and Bernier, F. (1997). Height growth, shoot elongation and branch development of young Quercus petraea grown under different levels of resource availability. Ann. For. Sci. 54, 65–81. doi: 10.1051/forest:19970106
Collins, B. S., Dunne, K. P., and Pickett, S. (1985). “Response of forest herbs to canopy gaps: chapter 12,” in The Ecology of Natural Disturbance and Patch Dynamics, eds S. Pickett and P. S. White (New York, NY: Academic Press), 217–234. doi: 10.1016/b978-0-08-050495-7.50017-x
Comeau, P. G., and Kimmins, J. P. (1989). Above- and below-ground biomass and production of lodgepole pine on sites with differing soil moisture regimes. Can. J. For. Res. 19, 447–454. doi: 10.1139/x89-070
Cornelissen, J. H. C., Diez, P. C., and Hunt, R. (1996). Seedling growth, allocation and leaf attributes in a wide range of woody plant species and types. J. Ecol. 84, 755–765. doi: 10.2307/2261337
Delagrange, S., Messier, C., Lechowicz, M. J., and Dizengremel, P. (2004). Physiological, morphological and allocational plasticity in understory deciduous trees: importance of plant size and light availability. Tree Physiol. 24, 775–784. doi: 10.1093/treephys/24.7.775
Dormann, C. F., Elith, J., Bacher, S., Buchmann, C., Carl, G., Carré, G., et al. (2013). Collinearity: a review of methods to deal with it and a simulation study evaluating their performance. Ecography 36, 27–46. doi: 10.1111/j.1600-0587.2012.07348.x
Drever, C. R., and Lertzman, K. P. (2001). Light-growth responses of coastal Douglas-fir and western redcedar saplings under different regimes of soil moisture and nutrients. Can. J. For. Res. 31, 2124–2133. doi: 10.1139/x01-149
Ehbrecht, M., Schall, P., Ammer, C., and Seidel, D. (2017). Quantifying stand structural complexity and its relationship with forest management, tree species diversity and microclimate. Agric. For. Meteorol. 242, 1–9. doi: 10.1016/j.agrformet.2017.04.012
Ehbrecht, M., Schall, P., Juchheim, J., Ammer, C., and Seidel, D. (2016). Effective number of layers: a new measure for quantifying three-dimensional stand structure based on sampling with terrestrial LiDAR. For. Ecol. Manag. 380, 212–223. doi: 10.1016/j.foreco.2016.09.003
Ehleringer, J. R., and Dawson, T. E. (1992). Water uptake by plants: perspectives from stable isotope composition. Plant Cell Environ. 15, 1073–1082. doi: 10.1111/j.1365-3040.1992.tb01657.x
Elliot, K. J., and Vose, J. M. (1995). Evaluation of the competitive environment for white pine (Pinus strobus L.) seedlings planted on prescribed burn sites in the southern appalachians. Forest Sci. 41, 513–530.
Finzi, A. C., and Canham, C. D. (2000). Sapling growth in response to light and nitrogen availability in a southern New England forest. For. Ecol. Manag. 131, 153–165. doi: 10.1016/S0378-1127(99)00206-6
Funk, J. L., and Vitousek, P. M. (2007). Resource-use efficiency and plant invasion in low-resource systems. Nature 446, 1079–1081. doi: 10.1038/nature05719
Gauer, J., and Aldinger, E. (2005). Waldökologische Naturräume Deutschlands: Forstliche Wuchsgebiete und Wuchsbezirke (Forest ecologically based natural geographic regions of Germany: Forest growth areas and growth districts). Mitt. Ver. forstl. Standortskd. Forstpflanzenzücht. 43, 1–324.
Gebhardt, T., Häberle, K.-H., Matyssek, R., Schulz, C., and Ammer, C. (2014). The more, the better? Water relations of norway spruce stands after progressive thinning. Agric. For. Meteorol. 197, 235–243. doi: 10.1016/j.agrformet.2014.05.013
Groemping, U. (2006). Relative importance for linear regression in R: the package relaimpo. J. Stat. Softw. 17, 1–27.
Harmer, R., Boswell, R., and Robertson, M. (2005). Survival and growth of tree seedlings in relation to changes in the ground flora during natural regeneration of an oak shelterwood. Forestry 78, 21–32. doi: 10.1093/forestry/cpi003
Hastie, T. J., and Tibshirani, R. J. (1990). Generalized Additive Models. Boca Raton: Chapman & Hall.
Hegyi, F. (1974). “A simulation model for managing Jack-pine stands,” in Growth Models for Tree and Stand Simulation, ed. J. Fries (Stockholm: Department of Forest Yield Research), 74–90.
Hofmann, R., and Ammer, C. (2008). Biomass partitioning of beech seedlings under the canopy of spruce. Aust. J. For. Sci. 125, 51–66.
Hutchings, M. J., and de Kroon, H. (1994). Foraging in plants: the role of morphological plasticity in resource acquisition. Adv. Ecol. Res. 25, 159–238. doi: 10.1016/s0065-2504(08)60215-9
Jackson, R. B., Canadell, J., Ehleringer, J. R., Mooney, H. A., Sata, O. E., and Schulze, E. D. (1996). A global analysis of root distributions for terrestrial biomes. Oecologia 108, 389–411. doi: 10.1007/BF00333714
Jarvis, P. G. (1964). The adaptability to light intensity of seedlings of Quercus petraea (Matt.) Liebl. J. Ecol. 52, 545–571. doi: 10.2307/2257848
Jylhä, P., and Hytönen, J. (2006). Effect of vegetation control on the survival and growth of scots pine and Norway spruce planted on former agricultural land. Can. J. For. Res. 36, 2400–2411. doi: 10.1139/x06-053
Kimmins, J. P. (2004). Forest Ecology: A Foundation for Sustainable Forest Management and Environmental Ethics in Forestry. London: Pearson.
Lambers, H., Chapin, F. S., and Pons, T. L. (2008). Plant Physiological Ecology. New York, NY: Springer.
Leuschner, C., and Ellenberg, H. (2017). Ecology of Central European Forests (Vegetation Ecology of Central Europe). Cham: Springer.
Leuschner, C., Hertel, D., Coners, H., and Büttner, V. (2001). Root competition between beech and oak: a hypothesis. Oecologia 126, 276–284. doi: 10.1007/s004420000507
Lindeman, R. H., Merenda, P. F., and Gold, R. Z. (1980). Introduction to Bivariate and Multivariate Analysis. Glenview, IL: Scott, Foresman and Company.
Litton, C. M., Ryan, M. G., Tinker, D. B., and Knight, D. H. (2003). Belowground and aboveground biomass in young postfire lodgepole pine forests of contrasting tree density. Can. J. For. Res. 33, 351–363. doi: 10.1139/X02-181
Lödige, C., Schall, P., and Ammer, C. (2014). How do size and resource availability control aboveground biomass allocation of tree seedlings? Forest Res 3:100123. doi: 10.4172/2168-9776.1000123
Löf, M. (2000). Establishment and growth in seedlings of Fagus sylvatica and Quercus robur: influence of interference from herbaceous vegetation. Can. J. For. Res. 30, 855–864. doi: 10.1139/x99-257
Lüpke, B. v. (2004). “Regeneration of beech-oak-mixed stands in central europe under continuous cover management,” in Proceedings of the 7th International Beech Symposium, IUFRO Research Group 1.10.00, Tehran, 128–134.
Lüpke, B. v., and Hauskeller-Bullerjahn, K. (2004). Beitrag zur Modellierung der Jungwuchsentwicklung am Beispiel von Traubeneichen-Buchen-Mischverjüngungen (A contribution to modelling juvenile growth examplified by mixed oak-beech regeneration). Allg. Forst- u. J.-Ztg. 175, 61–69.
Lusk, C. H. (2002). Leaf area accumulation helps juvenile evergreen trees tolerate shade in a temperate rainforest. Oecologia 132, 188–196. doi: 10.1007/s00442-002-0974-9
Mäkinen, H., and Hein, S. (2006). Effect of wide spacing on increment and branch properties of young Norway spruce. Eur. J. For. Res. 125, 239–248. doi: 10.1007/s10342-006-0115-9
McConnaughay, K. D. M., and Coleman, J. S. (1999). Biomass allocation in plants. Ontogeny or optimality? A test along three resource gradients. Ecology 80, 2581–2593. doi: 10.1890/0012-9658(1999)080[2581:BAIPOO]2.0.CO;2
McGarigal, K., and Marks, B. J. (1995). FRAGSTATS: Spatial Pattern Analysis Program for Quantifying Landscape Structure. Portland, OR: U.S. Department of Agriculture.
Messier, C., Doucet, R., Ruel, J.-C., Claveau, Y., Kelly, C., and Lechowicz, M. J. (1999). Functional ecology of advance regeneration in relation to light in boreal forests. Can. J. For. Res. 29, 812–823. doi: 10.1139/x99-070
Messier, C., and Nikinmaa, E. (2016). Effects of light availability and sapling size on the growth, biomass allocation, and crown morphology of understory sugar maple, yellow birch, and beech. Ecoscience 7, 345–356. doi: 10.1080/11956860.2000.11682604
Mölder, A., Meyer, P., and Nagel, R.-V. (2019). Integrative management to sustain biodiversity and ecological continuity in Central European temperate oak (Quercus robur, Q. petraea) forests: an overview. For. Ecol. Manag. 437, 324–339. doi: 10.1016/j.foreco.2019.01.006
Morris, D. M., MacDonald, G. B., and McClain, K. M. (1990). Evaluation of morphological attributes as response variables to perennial competition for 4-year-old black spruce and jack pine seedlings. Can. J. For. Res. 20, 1696–1703. doi: 10.1139/x90-226
Morris, L. A., Moss, S. A., and Garbett, W. S. (1993). Competitive interference between selected herbaceous and woody plants and Pinus taeda L. during two growing seasons following planting. Forest Sci. 39, 166–187.
Niinemets, Ü. (2006). The controversy over traits conferring shade-tolerance in trees: ontogenetic changes revisited. J. Ecol. 94, 464–470. doi: 10.1111/j.1365-2745.2006.01093.x
Pearson, J. A., Fahey, T. J., and Knight, D. H. (1984). Biomass and leaf area in contrasting lodgepole pine forests. Can. J. For. Res. 14, 259–265. doi: 10.1139/x84-050
Petriţan, A. M., Lüpke, B. v., and Petriţan, I. C. (2009). Influence of light availability on growth, leaf morphology and plant architecture of beech (Fagus sylvatica L.), maple (Acer pseudoplatanus L.) and ash (Fraxinus excelsior L.) saplings. Eur. J. For. Res. 128, 61–74. doi: 10.1007/s10342-008-0239-1
Petriţan, I. C., Lüpke, B. v., and Petriţan, A. M. (2011). Effects of root trenching of overstorey Norway spruce (Picea abies) on growth and biomass of underplanted beech (Fagus sylvatica) and Douglas fir (Pseudotsuga menziesii) saplings. Eur. J. For. Res. 130, 813–828. doi: 10.1007/s10342-010-0473-1
Poorter, H., and Nagel, O. (2000). The role of biomass allocation in the growth response of plants to different levels of light, CO2, nutrients and water: a quantitative review. Funct. Plant Biol. 27:1191. doi: 10.1071/PP99173_CO
Poorter, H., Niklas, K. J., Reich, P. B., Oleksyn, J., Poot, P., and Mommer, L. (2012). Biomass allocation to leaves, stems and roots: meta-analyses of interspecific variation and environmental control. New Phytol. 193, 30–50. doi: 10.1111/j.1469-8137.2011.03952.x
Poorter, H., and Remkes, C. (1990). Leaf area ratio and net assimilation rate of 24 wild species differing in relative growth rate. Oecologia 83, 553–559. doi: 10.1007/BF00317209
Poorter, L. (1999). Growth responses of 15 rain-forest tree species to a light gradient: the elative importance of morphological and physiological traits. Funct. Ecol. 13, 396–410. doi: 10.1046/j.1365-2435.1999.00332.x
Poorter, L. (2001). Light-dependent changes in biomass allocation and their importance for growth of rain forest tree species. Funct. Ecol. 15, 113–123. doi: 10.1046/j.1365-2435.2001.00503.x
Popma, J., and Bongers, F. (1988). The effect of canopy gaps on growth and morphology of seedlings of rain forest species. Oecologia 75, 625–632. doi: 10.1007/BF00776429
Pretzsch, H., Forrester, D. I., and Bauhus, J. (eds) (2017). Mixed-Species Forests: Ecology and Management. Berlin: Springer.
Pryor, D. (2010). Analysis of Light Environments Under Forest Canopies Using an Integrated Digital Hemispherical Image System. Ph.D. dissertation, Staffordshire University, Staffordshire.
R Core Team (2017). R: A Language and Environment for Statistical Computing. Vienna: R Foundation for Statistical Computing.
Röhrig, E., Bartsch, N., and Lüpke, B. v. (2006). Waldbau Auf Ökologischer Grundlage (Silviculture on and ecological basis). Stuttgart: Ulmer.
Schall, P., Lödige, C., Beck, M., and Ammer, C. (2012). Biomass allocation to roots and shoots is more sensitive to shade and drought in European beech than in Norway spruce seedlings. For. Ecol. Manag. 266, 246–253. doi: 10.1016/j.foreco.2011.11.017
Schenk, H. J. (2006). Root competition: beyond resource depletion. J. Ecol. 94, 725–739. doi: 10.1111/j.1365-2745.2006.01124.x
Seidel, D., Hoffmann, N., Ehbrecht, M., Juchheim, J., and Ammer, C. (2015). How neighborhood affects tree diameter increment new insights from terrestrial laser scanning and some methodical considerations. For. Ecol. Manag. 336, 119–128. doi: 10.1016/j.foreco.2014.10.020
Shipley, B., and Meziane, D. (2002). The balanced-growth hypothesis and the allometry of leaf and root biomass allocation. Funct. Ecol. 16, 326–331. doi: 10.1046/j.1365-2435.2002.00626.x
Silla, F., and Escudero, A. (2003). Uptake, demand and internal cycling of nitrogen in saplings of mediterranean Quercus species. Oecologia 136, 28–36. doi: 10.1007/s00442-003-1232-5
Smith, H. (1994). “Sensing the light environment: the functions of the phytochrome family,” in Photomorphogenesis in Plants, eds R. E. Kendrick and G. H. M. Kronenberg (Dordrecht: Springer), 377–416. doi: 10.1007/978-94-011-1884-2_15
Wagner, R. G., and Radosevich, S. R. (1991). Neighborhood predictors of interspecific competition in young Douglas-fir plantations. Can. J. For. Res. 21, 821–828. doi: 10.1139/x91-115
Wagner, S., Fischer, H., and Huth, F. (2011). Canopy effects on vegetation caused by harvesting and regeneration treatments. Eur. J. For. Res. 130, 17–40. doi: 10.1007/s10342-010-0378-z
Wagner, S., Madsen, P., and Ammer, C. (2009). Evaluation of different approaches for modelling individual tree seedling height growth. Trees 23, 701–715. doi: 10.1007/s00468-009-0313-4
Walters, M. B., Kruger, E. L., and Reich, P. B. (1993). Growth, biomass distribution and CO2 exchange of northern hardwood seedlings in high and low light: relationships with successional status and shade tolerance. Oecologia 94, 7–16. doi: 10.1007/BF00317294
Weidig, J., Wagner, S., and Huth, F. (2014). Qualitätsentwicklung von Buchenvoranbauten (Fagus sylvatica L.) im Thüringer Wald nach unplanmäßigem sturmbedingtem Verlust des Fichtenschirms (Quality of advanced planted European beech (Fagus sylvatica L.) in the Thuringian Forest after the unscheduled loss of Norway spruce shelterwood in storms). Forstarchiv 85, 122–133.
Williams, H., Messier, C., and Kneeshaw, D. D. (1999). Effects of light availability and sapling size on the growth and crown morphology of understory douglas-fir and lodgepole pine. Can. J. For. Res. 29, 222–231. doi: 10.1139/x98-189
Wood, S. N. (2006). Generalized Additive Models: an Introduction with R. Boca Raton: Chapman & Hall.
Wood, S. N. (2011). Fast stable restricted maximum likelihood and marginal likelihood estimation of semiparametric generalized linear models. J. R. Stat. Soc. 73, 3–36. doi: 10.1111/j.1467-9868.2010.00749.x
Keywords: biomass allocation, tree morphology, competition, light gradient, spatial analysis, growth environment, terrestrial laser scanning, hemispherical photography
Citation: Annighöfer P, Seidel D, Mölder A and Ammer C (2019) Advanced Aboveground Spatial Analysis as Proxy for the Competitive Environment Affecting Sapling Development. Front. Plant Sci. 10:690. doi: 10.3389/fpls.2019.00690
Received: 08 February 2019; Accepted: 08 May 2019;
Published: 28 May 2019.
Edited by:
Erik T. Nilsen, Virginia Tech, United StatesReviewed by:
Thomas Ting Lei, Ryukoku University, JapanEnrique Andivia, Complutense University of Madrid, Spain
Copyright © 2019 Annighöfer, Seidel, Mölder and Ammer. This is an open-access article distributed under the terms of the Creative Commons Attribution License (CC BY). The use, distribution or reproduction in other forums is permitted, provided the original author(s) and the copyright owner(s) are credited and that the original publication in this journal is cited, in accordance with accepted academic practice. No use, distribution or reproduction is permitted which does not comply with these terms.
*Correspondence: Peter Annighöfer, pannigh@gwdg.de