 Anna Furches1,2†
 David Kainer1†
 Deborah Weighill1,2†Annabel Large1,3,4
 Piet Jones1,2
 Angelica M. Walker1,3,5,6Jonathon Romero1,2
 Joao Gabriel Felipe Machado Gazolla1Wayne Joubert7
 Manesh Shah1Jared Streich1Priya Ranjan1,8Jeremy Schmutz9,10
 Avinash Sreedasyam10
 David Macaya-Sanz11Nan Zhao8
 Madhavi Z. Martin1
 Xiaolan Rao12Richard A. Dixon12
 Stephen DiFazio11
 Timothy J. Tschaplinski1
 Jin-Gui Chen1Gerald A. Tuskan1
 Daniel Jacobson1,2*
- 1Biosciences Division, and The Center for Bioenergy Innovation, Oak Ridge National Laboratory, Oak Ridge, TN, United States
- 2The Bredesen Center for Interdisciplinary Research and Graduate Education, University of Tennessee, Knoxville, TN, United States
- 3Oak Ridge Associated Universities (ORAU), Oak Ridge, TN, United States
- 4Department of Chemical and Biomolecular Engineering, University of Tennessee, Knoxville, TN, United States
- 5Department of Computer Science, Johns Hopkins University, Baltimore, MD, United States
- 6Department of Biology, Johns Hopkins University, Baltimore, MD, United States
- 7Oak Ridge Leadership Computing Facility, Oak Ridge National Laboratory, Oak Ridge, TN, United States
- 8Department of Plant Sciences, The University of Tennessee Institute of Agriculture, University of Tennessee, Knoxville, TN, United States
- 9Joint Genome Institute, Walnut Creek, CA, United States
- 10HudsonAlpha Institute for Biotechnology, Huntsville, AL, United States
- 11Department of Biology, West Virginia University, Morgantown, WV, United States
- 12BioDiscovery Institute and Department of Biological Sciences, University of North Texas, Denton, TX, United States
Understanding the regulatory network controlling cell wall biosynthesis is of great interest in Populus trichocarpa, both because of its status as a model woody perennial and its importance for lignocellulosic products. We searched for genes with putatively unknown roles in regulating cell wall biosynthesis using an extended network-based Lines of Evidence (LOE) pipeline to combine multiple omics data sets in P. trichocarpa, including gene coexpression, gene comethylation, population level pairwise SNP correlations, and two distinct SNP-metabolite Genome Wide Association Study (GWAS) layers. By incorporating validation, ranking, and filtering approaches we produced a list of nine high priority gene candidates for involvement in the regulation of cell wall biosynthesis. We subsequently performed a detailed investigation of candidate gene GROWTH-REGULATING FACTOR 9 (PtGRF9). To investigate the role of PtGRF9 in regulating cell wall biosynthesis, we assessed the genome-wide connections of PtGRF9 and a paralog across data layers with functional enrichment analyses, predictive transcription factor binding site analysis, and an independent comparison to eQTN data. Our findings indicate that PtGRF9 likely affects the cell wall by directly repressing genes involved in cell wall biosynthesis, such as PtCCoAOMT and PtMYB.41, and indirectly by regulating homeobox genes. Furthermore, evidence suggests that PtGRF9 paralogs may act as transcriptional co-regulators that direct the global energy usage of the plant. Using our extended pipeline, we show multiple lines of evidence implicating the involvement of these genes in cell wall regulatory functions and demonstrate the value of this method for prioritizing candidate genes for experimental validation.
Introduction
The biosynthesis and regulation of the plant cell wall has been the subject of a large body of research due to the industrial importance of lignocellulosic biomass, as well as the role of the cell wall in the function of other plant biological systems such as stress response, inter-cellular transport, and disease resistance. For industrially cultivated genera such as Populus, the primary cell wall constituents (i.e., cellulose, lignin, hemicellulose) provide feedstock for downstream products including biofuel, lumber, paper, and advanced lignin products (Sannigrahi et al., 2010; Porth et al., 2013). There is therefore broad interest in understanding the mechanisms that regulate the biosynthesis and modification of the cell wall, both from a yield and composition perspective.
A great variety of biopolymers are synthesized and incorporated into the primary and secondary cell wall, often in response to biotic and abiotic stress, nutrient availability, and developmental and temporal switches, all of which govern the macro-scale form of the plant. A highly complex network of genetic regulation has evolved to control the rate of biosynthesis of cell wall polymers, their intrinsic monomer composition, their transport to and subsequent deposition in the cell wall, and the expansion of the wall under changing intra-cellular conditions. In the model plant Arabidopsis thaliana, Bischoff et al. (2010) estimated that over 1,000 genes encode proteins related to the cell wall, while Cai et al. (2014) predicted a number closer to 3,000 based on clustering of gene co-expression (Bischoff et al., 2010; Cai et al., 2014). Furthermore, Taylor-Teeples et al. (2015) tested a library of 1,664 transcription factors in A. thaliana for interaction with the promoter regions of cell wall biosynthesis genes and found 413 such interactions in root vascular tissue alone (Taylor-Teeples et al., 2015). Studies such as these highlight the immense complexity involved in cell wall regulation, much of which is still to be elucidated.
Due to poplar’s status as a model woody plant and its importance for lignocellulosic products, many studies have investigated the regulatory network of the cell wall and its components in Populus species or in multiple genera in combination with Populus (Ohtani et al., 2011; Puzey et al., 2012; Lu et al., 2013; Porth et al., 2013; Yu et al., 2013; Ko et al., 2014; Wang et al., 2014; Zhong and Ye, 2014; Muchero et al., 2015; Lin et al., 2017; Shi et al., 2017; Xie et al., 2018a). Many of these studies have focused either on characterizing Populus homologs of genes that have been shown to have an effect on the cell wall chemistry or plant growth traits in mutant Arabidopsis lines, or perhaps were shown to be differentially expressed in comparisons of low and high growth genotypes. However, exploring the regulatory network controlling the cell wall in order to find new functional mechanisms is a challenging task due to the number of genes involved, extensive functional redundancy, and the multitude of transcriptional feedback loops. Such complex genetic architecture has contributed to the view that many quantitative traits are actually “omnigenic” (Boyle et al., 2017), such that virtually any expressed gene has a non-zero effect on the core biosynthetic genes at one or more transcriptional, post-transcriptional, post-translational, signaling or protein-protein interaction levels. Fisher (1919) predicted that rather than a few core genes in biosynthetic pathways, the major portion of heritability is explained by a large number of loci across the entire genome that contribute small portions of the trait heritability. Under this omnigenic model, network-theory-based methods provide an elegant approach for mining omics datasets for regulatory relationships. Any biological entity (SNP, gene, protein, metabolite, etc.) can be modeled as a node and any relationship between those entities (association, co-expression, correlation, binding) can be modeled as an edge.
The network approach has been used in several studies of cell wall regulation to date, often focusing on finding clusters of genes that co-express with each other in certain tissues, thus finding putative functional units or networks. For example, Cai et al. (2014) performed co-expression network clustering in Populus and found major sub-clusters enriched for primary cell wall or secondary cell wall genes. Taylor-Teeples et al. (2015) produced networks based on A. thaliana transcription factors and their target binding sites, providing an expanded view of the multi-tiered regulatory system with respect to secondary cell wall (SCW) biosynthesis and xylem development. Yang et al. (2011) used 121 A. thaliana cell wall genes obtained from text mining followed by co-expression neighbor analysis to identify 694 A. thaliana genes and their 817 Populus orthologs as candidate genes for involvement in cell wall functions. Alejandro et al. (2012) identified the ABCG29 genes as transporting monolignol to the cell wall in A. thaliana by first analyzing co-expression networks followed by expression and functional analyses. These methods often produce an extensive list of candidate genes but with little more to support their involvement in cell wall regulation than the clustering or enrichment evidence.
Multi-omic approaches have also been performed, which include more data types to identify candidate genes. Porth et al. (2013) used a network-based multi-omic approach to find relationships between SNP, gene expression, and wood phenotype data from P. trichocarpa. They constructed six phenotypic-centric networks to identify genes that most influenced the expression of their related phenotype. From this study, they were able to identify candidate genes potentially related to cell wall biogenesis. Mizrachi et al. (2017) used a network-based approach to integrate known gene interactions and eQTN data in the form of a connectivity matrix with gene expression data through matrix multiplication in order to identify genes involved in lignin-related traits.
The use of multiple layers of omics data in the identification of candidate genes related to a particular phenotype provides an increased level of confidence and context surrounding the new candidate genes. In this study, we use an extended lines of evidence (LOE) pipeline for jointly mining multiple data layers to produce a curated short list of new candidate genes putatively involved in the regulation of cell-wall-related functions (Figure 1). We use an extensive set of “anchor” genes with documented roles in cell wall biosynthetic and regulatory processes and anchor metabolomic phenotypes measured in a Genome Wide Association Study (GWAS) population of P. trichocarpa. Multi-omic data layers (coexpression, comethylation, pairwise SNP correlation, and two SNP-metabolite GWAS data sets) are probed to find all genes in the genome with network connectivity to the anchor set. A score is calculated for each gene with regards to the amount of evidence that the gene is involved in cell wall regulation and other cell-wall-related processes. The resulting merged LOE network of candidate genes is then subjected to validation, ranking, and filtering methods, as well as post-hoc analyses. The result is a set of 330 high-ranking candidate genes, which we then filter to a subset of regulatory genes not previously discussed in the context of the cell wall biosynthesis.
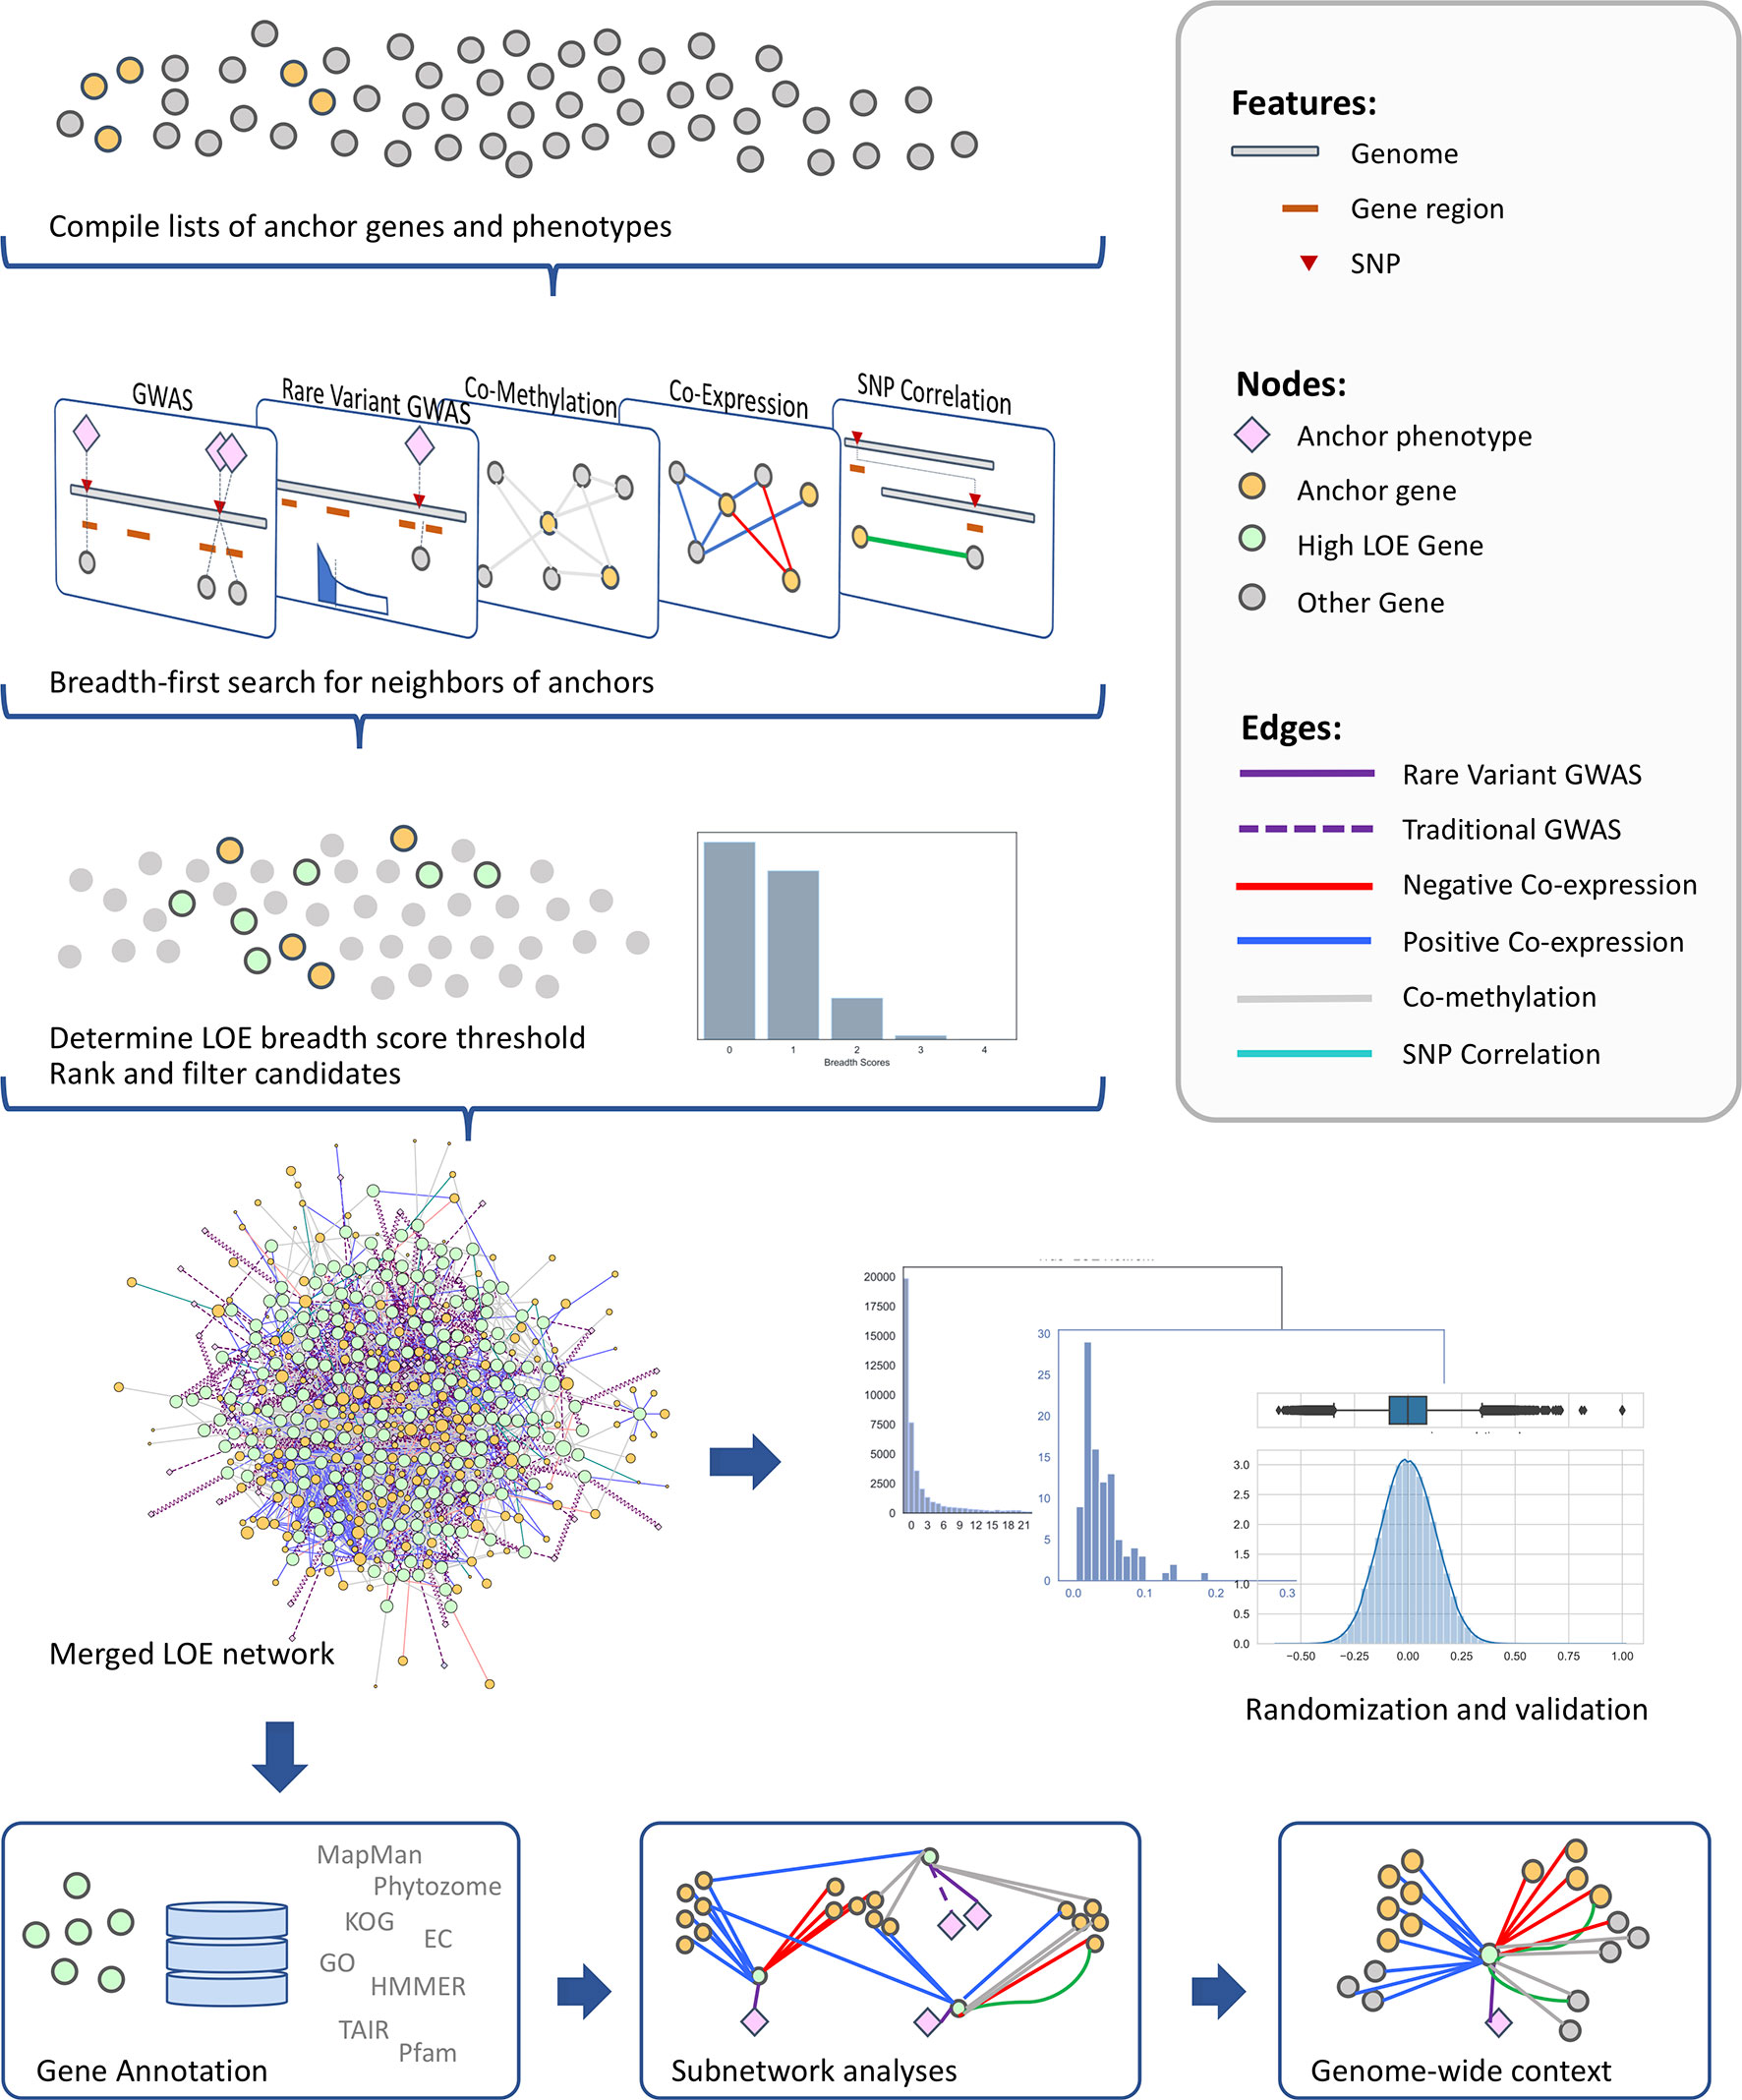
Figure 1 Overview of the method for identifying new candidate genes involved in cell wall regulation through data layering and calculation of LOE scores.
Materials and Methods
This study makes use of various data accumulated for P. trichocarpa that have been used in previous investigations, including SNP data from a GWAS population, foliar metabolites measured in this GWAS population, and DNA methylation data across 10 different P. trichocarpa tissues (Vining et al., 2012), as well as the P. trichocarpa DOE Joint Genome Institute Plant Gene Atlas (Sreedasyam et al, unpublished data; available from phytozome.jgi.doe.gov). Each data set was considered as a separate layer for this study, and integrated though the use of LOE scores. Below, the various layers are described as well as the network analysis methods used to merge layers and identify genes with high connectivity to cell wall systems.
Phenotypes
We made use of metabolite data previously obtained from leaf tissue and analyzed using GC-MS. Details can be found in (Tschaplinski et al., 2012; Li et al., 2012b; Weighill et al., 2018). To prevent spurious associations, we examined each phenotype for the presence of outliers using Median Absolute Deviation (MAD). If a sample’s phenotype was more than six MADs from the population median it was removed from the GWAS for that phenotype.
Genotypes
SNP-based variant data (see DOI 10.13139/OLCF/1411410) were obtained from https://bioenergycenter.org/besc/gwas/ and SNPs were filtered to the top 90% tranche (PASS SNPs) and call rate ≥ 0.5 using Plink (Purcell et al., 2007) and VCFtools (Danecek et al., 2011).
Genome Wide Association Layer
GWAS was performed using a linear mixed model (LMM), implemented in EMMAX (Kang et al., 2010) and leveraging ADIOS v1.13 (Lofstead et al., 2008) for scaling, to estimate the additive effect of each SNP while accounting for population structure and cryptic relatedness between samples. The tested SNPs excluded those with minor allele frequency (MAF) < 0.01, and those with a population call rate above 0.75. In addition, we used linkage disequilibrium (LD) pruning on the main set of SNPs to produce a set of independent SNPs for estimating the genomic relationship matrix, used in the LMM. The resulting p-values were corrected for multi-hypotheses bias by applying the Benjamini-Hochberg approach (Benjamini and Hochberg, 1995) with a false-discovery rate (FDR) cutoff of 0.1.
Rare Variant GWAS Layer
While the GWAS Linear Mixed Model (LMM) tested common and less common SNPs (MAF ≥0.01) individually for significance, rarer SNPs were tested regionally in a joint fashion. Rare SNPs (MAF <0.01) located within a given gene, or in the gene’s 2-kb upstream and downstream flanking regions, were grouped as a region defined by that gene. RVtest (Zhan et al., 2016) was then used to apply the Sequence Kernel Association Test (SKAT) to each of the 41,335 regions defined from P. trichocarpa v3.0 annotations. SKAT tests each SNP in the region individually with an LMM and then forms a combined region score where each component SNP is weighted according to its MAF. Weights were drawn from a beta distribution with default shape parameters (1, 25), which produced a single P-value for the significance of association of each region, which were corrected for multiple testing with an FDR of 0.1.
Co-Expression Layer
A P. trichocarpa gene co-expression network was constructed as described in Weighill et al. (2018). RNA-seq reads from the P. trichocarpa DOE Joint Genome Institute Plant Gene Atlas (Sreedasyam et al., unpublished data; available from phytozome.jgi.doe.gov; see Supplementary Table S1 for sample information) were trimmed using Skewer (Jiang et al., 2014), aligned to the version 3.0 P. trichocarpa reference (Tuskan et al., 2006) using Star (Dobin et al., 2013), and TPM (transcripts per million) values calculated for each gene and each sample. Star mapping was performed using the “–quantMode GeneCounts” option, which directs the program to count the number of reads per gene while performing the mapping. A read is counted if it overlaps one and only one gene. Both ends of the paired-end read are checked for overlaps. The counts coincide with those produced by htseq-count with default parameters. We then calculated the Spearman correlation coefficient between the expression profiles of all pairs of genes using the mcxarray package (Van Dongen, 2008) available from https://micans.org/mcl/index.html. An absolute threshold of 0.85 was applied in order to keep only those gene-gene pairs with strong co-expression.
Co-Methylation Layer
A P. trichocarpa gene co-methylation network was constructed as described in Weighill et al. (2018). MEDIP-Seq reads from the study by Vining et al. (2012) mapped to the P. trichocarpa V3 genome assembly, were obtained from Phytozome (Goodstein et al., 2011; Vining et al., 2012). The number of reads that mapped to each gene for each sample was determined using htseq-count (Anders et al., 2015). These counts were then converted to TPM values for each gene and each sample. Spearman correlation coefficients between the co-methylation profiles of all pairs of genes were then calculated in a manner similar to the co-expression layer, followed by an absolute threshold of 0.95.
Custom Correlation Coefficient Layer
After filtering the SNP set to remove those with MAF <0.01, the custom correlation coefficient (CCC) (Climer et al., 2014) between all pairs of remaining SNPs were calculated using a Parallel GPU implementation of the CCC (Joubert et al., 2017). In order to minimize correlation among SNPs due to linkage disequilibrium, only correlations from SNP pairs greater than 10 kb apart and with a CCC ≥0.7 were retained. SNPs were then mapped to the genes in which they were located, resulting in gene-gene correlations. Significantly correlated SNPs represent co-segregating and interacting cellular components.
Lines of Evidence Scoring and Network Analysis
The LOE method calculates a score for every gene in the genome by quantifying the connectivity of a given gene to anchor genes/phenotypes from the system of interest. Each data layer described above provides one possible line of evidence. For example, if Gene A co-expresses with one or more cell wall anchor genes, then this is counted as one line of evidence for Gene A’s involvement in the cell wall. A list of 295 anchor genes was compiled from the literature (Hao and Mohnen, 2014; Zhong and Ye, 2014; Nakano et al., 2015; Liu et al., 2017; Rao and Dixon, 2018) (Supplementary Table S2). Metabolites that affect cell wall development and composition, such as sugar substrates, lignin precursors, and lignin competitors, were also selected for use as cell wall anchor phenotypes (Supplementary Table S3).
To calculate LOE scores for each gene in the P. trichocarpa genome, each data layer was represented as a network. Each layer consisted of a list of source entities (cell wall anchor genes and phenotypes, or “anchor nodes”), target entities (potential candidate genes, or “target nodes”), and interactions between them (correlations/associations, or “edges”). From each layer’s network, a breadth-first search was used to extract the neighbors of anchor nodes, resulting in a “one-hop” (“1-hop”) network for each layer. LOE scores were calculated as per Weighill et al. (2018). Briefly, the LOE breadth score for a gene is the count of the different layers in which that gene has connections to anchor genes/phenotypes. An LOE depth score—the count of all connections to anchor genes/phenotypes across all data layers—was also calculated for each gene. After scoring, the 1-hop networks from all layers were thresholded based on the distribution of LOE breadth scores, then merged to form the LOE network containing cell wall anchor genes and phenotypes and all genes connected to them via one or more layers (“high LOE genes”). All genes in the merged LOE network were ranked based upon breadth and depth scores and genes with previously documented cell-wall-related roles were removed. Networks were visualized and manipulated with Cytoscape 3.6.1 (Shannon et al., 2003).
Gene Annotation, Functional Enrichment, and Expression Analyses
Functional annotations for P. trichocarpa genes were obtained from JGI Phytozome 12 (Goodstein et al., 2011) and MapMan using the Mercator tool (Lohse et al., 2014). A number of high LOE genes were not annotated in MapMan or Phytozome. To better understand the potential functions of those genes, protein sequences were extracted from the P. trichocarpa v3.1 primary transcript sequence (Tuskan et al., 2006) available from Phytozome and analyzed using HMMER v3.1b2 (Eddy, 1998) to annotate both Pfam v31.0 (Punta et al., 2011) and TIGRfam v15.0 (Haft et al., 2001) domains. Domains were thresholded using an independent E-value of 0.001. GO-term enrichment was performed on selected sets of genes using the BinGO Cytoscape app (Maere et al., 2005) using the Hypergeometric Test as well as Benjamini & Hochberg False Discovery Rate Correction at a significance level of 0.1.
A clustered heatmap of gene expression data was created using the Python (v3.6.2) package seaborn (v0.8.0; https://seaborn.pydata.org/index.html). Prior to analysis, six samples were removed from the data set that were outliers relative to their tissue type and treatment subgroups. Gene expression was normalized across tissues and genes were clustered using a Euclidean distance metric and Ward clustering method.
To assess orthology for a subset of genes during post-hoc analyses in Section 4.4.1, amino acid sequences containing characteristic PFAM domains (http://pfam.xfam.org/) were obtained from UniProt (www.uniprot.org; KNOXI: PF03790 per Mukherjee et al., 2009; POX/BELL: PF07526 per Bellaoui et al., 2001) and reciprocal BLASTp searches were performed against P. trichocarpa and A. thaliana genomes using NCBI’s BLAST (https://blast.ncbi.nlm.nih.gov) with default settings.
Network Validation
Randomizations of Expression and Methylation Data
We assessed whether our coexpression and comethylation networks contain greater biological signal than random networks by performing analyses on multiple randomized expression and methylation datasets. First we generated 100 randomized gene expression data sets by shuffling TPM values within genes across tissues, thereby preserving the observed range of expression for each gene but destroying the associations with tissue samples. We then generated a Spearman coexpression matrix for each random dataset and randomly subsampled 100,000 correlation values from each, resulting in a total pool of 10,000,000 random coexpression samples. We then collected 10,000,000 random subsamples from our observed coexpression data set and compared the distributions of our observed values to those of the shuffled data sets using the Wilcoxon rank-sum test using the Python package SciPy stats module (docs.scipy.org/doc/scipy/reference/generated/scipy.stats.ranksums.html). We also performed this method with the comethylation data layer.
Functional Validation of LOE Network
To assess whether our observed LOE network captured a greater amount of biological function than random networks, we intersected the observed network as well as 100 randomized LOE networks with a GO-term functional network. We first constructed a functional network from GO Biological Process terms whereby genes that share GO terms are connected and are more likely to share biological function than unconnected genes. GO annotations for P. trichocarpa genes were obtained from PlantRegMap (Jin et al., 2017) and we removed any term present in over 1000 genes to avoid generating an overly dense network from highly generic functions. Furthermore, we weighted edges with a score inversely proportional to the number of genes with that GO term, such that between genes due to rarer GO terms were considered more functionally valuable than edges due to broader GO terms. If two genes shared multiple GO terms then we retained only the higher scoring edge. We then generated 100 randomized networks for each input data layer by holding anchor nodes and edges constant and replacing their 1-hop neighbors with gene labels randomly drawn from the genome, thereby ensuring that the size and structure of the randomized networks were comparable to the LOE input networks. For each set of random networks (consisting of one randomized network of each type: comethylation, coexpression, SNP correlation, traditional metabolite-GWAS, and rare variant metabolite-GWAS), LOE scoring and thresholding was performed. Each merged LOE network was then intersected with a GO-term functional network and an intersect score was recorded. The intersect score is calculated by summing the values of the GO-term network edges that are also present in the LOE scored network. We then compared the intersect score of our observed LOE network to the distribution of randomized network intersect scores.
Expression Quantitative Trait Networks
We utilized eQTN data as an independent line of evidence for investigating the putative regulatory roles of the PtGRF9 paralogs. RNAseq sequencing data from (Zhang et al., 2018) were obtained from the NCBI SRA database (SRA numbers: SRP097016–SRP097036; www.ncbi.nlm.nih.gov/sra). Reads were aligned to the Populus trichocarpa v.3.0 reference (Tuskan et al., 2006), using STAR (Dobin et al., 2013). Transcript per million (TPM) counts were then obtained for each genotype, resulting in a genotype-transcript matrix. For each gene transcript we determined outlier values, masking TPM values that exceeded a median absolute deviation from the non-zero median threshold of 5.0. Transcripts that had a non-outlier observed TPM value in more than 20% of the population were retained for further analysis. These expression profiles were then used as phenotypes in a GWAS, using EMMAX (Kang et al., 2010). Single nucleotide polymorphisms (SNPs) data, for the same population of P. trichocarpa genotypes, was obtained from (DOI 10.13139/OLCF/1411410). The SNPs were processed using VCFTOOLS (Danecek et al., 2011) and PLINK (Purcell et al., 2007), selecting for the 90% tranche and a minor allele frequency of 0.01. A hierarchical approach (Peterson et al., 2016) was used to correct for multiple hypotheses bias associated with the number of phenotypes. The procedure involved two rounds of false discovery rate (FDR) corrections, the initial using the Benjamini-Hochberg (Benjamini and Hochberg, 1995) procedure (q1 < 0.1), followed by the Gavrilov-Benjamini-Sarkar stepdown approach (Gavrilov et al., 2009) (q2 < 5.1e-4). SNP to phenotype association that passed the respective thresholds were determined to be statistically significant. 1-hop eQTN networks were then created around the PtGRF9 paralogs.
Results and Discussion
Evaluation of Expression and Methylation Data
The Wilcoxon rank-sum test was used to determine whether the distribution of correlation values differed between our observed data set and values from randomized datasets (Supplementary Figure S1). For both the expression and methylation data sets, the observed distributions were significantly different to random (p < 0.01 for both data types). Our coexpression data layer was thresholded to exclude correlation values below 0.85, resulting in 16,122 values (0.19%) being retained. In our shuffled data set, only 45 values (or 5.25e-04%) were above the 0.85 threshold. Our comethylation data layer was thresholded to exclude correlation values below 0.95, resulting in 87,458 values (0.88%) being retained. In our shuffled data set, only 1,090 values (0.01%) were above the 0.95 threshold.
Construction of LOE Network
The LOE method was used to identify new candidate genes involved in regulating the cell wall in P. trichocarpa by jointly probing five different omics data layers. LOE depth scores were calculated for each gene, indicating the number of lines of evidence within each layer connecting that gene to an input set of cell wall anchor genes and metabolites. An LOE breadth score was also calculated for each gene, indicating the number of types of lines of evidence that connected the gene to input cell-wall-related targets. A merged LOE network was created after determining an appropriate LOE breadth score threshold and taking the union of all thresholded input networks. Threshold criteria dictated that candidate genes have a significant association with one or more metabolites in either the traditional or rare variant data layers as well as a total breadth score of three. We required a minimum of one GWAS association for retention in the merged network because metabolite-GWAS associations represent a measurable cell wall phenotype. A breadth score of three was selected in order to prioritize a small set of genes having strong evidence for involvement in cell-wall-related processes, and the distribution of breadth scores exhibits an inflection point at three (Supplementary Figure S2A). These criteria identified a list of 315 “high LOE genes” as potential candidates for involvement in cell-wall-related functions. Seven high LOE genes had a breadth score of four and 308 had a breadth score of three (Supplementary Figure S2B). Overall, high LOE genes were from a variety of functional categories (Supplementary Figure S3) and 80 of these genes were annotated with potential regulatory functions (Supplementary Table S4).
Candidate Gene Ranking
To prioritize candidates, we created three ranked tiers to which high LOE genes were assigned (Tier 1 is the highest priority, Tier 3 is the lowest priority). Genes were ranked by 1) breadth score and 2) total depth score minus co-methylation depth score. While our co-expression data vectors contain 64 data points per gene (64 tissues and experimental conditions), our co-methylation data vectors contain only 10 data points per gene (10 tissues and experimental conditions), resulting in an increased probability for spurious correlations in the co-methylation data layer. While the distribution of comethylation correlation values (Supplementary Figure S1) was significantly different than random, the shape of the distribution suggests a conservative approach is warranted. In order to avoid upwardly biasing gene rankings, co-methylation data was included in the first stage of the ranking process (overall rank by breadth score) but excluded from the second stage of the ranking process (ranking within breadth score bins by depth score). Genes with an LOE Breadth score of four were included in Tier 1 by default (seven genes). In addition, genes with an LOE Breadth score of three and total depth minus comethylation depth scores of five or greater were included in Tier 1, resulting assignment of 45 genes. Thirty-two genes were assigned to Tier 2 based on a total depth minus comethylation depth score of four. The remaining 238 high LOE genes had total depth minus comethylation depth scores of three or less and were assigned to Tier 3.
Functional Validation of LOE Network
Intersection of the observed thresholded LOE network with the global GO-term functional network resulted in an intersect score of 0.4953, whereas intersect scores for the 100 randomized LOE networks (also thresholded) ranged from 0 to 0.3701 (Figure 2A). Intersection of the observed LOE network with the cell wall-specific GO-term network resulted in a score of 0.4806; intersect scores for the 100 randomized networks ranged from 0 to 0.3470 (Figure 2B). These results imply that our observed LOE network captures a greater amount of biological signal than the randomized LOE networks.
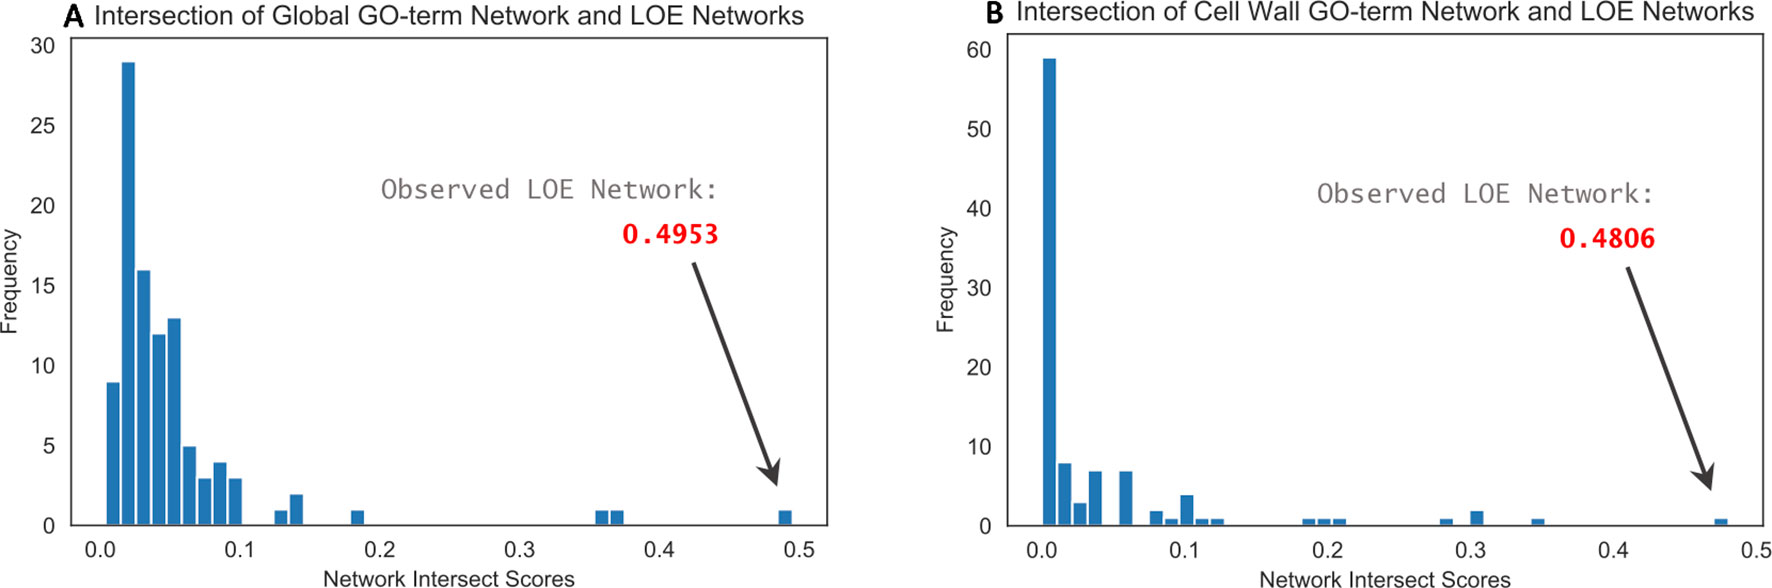
Figure 2 Histograms of network intersect scores calculated by intersecting the observed and randomized LOE networks with GO-term functional networks. (A) Intersection with the global GO-term functional network resulted in a score of 0.4953 for the observed LOE network; intersect scores for randomized networks were ≤0.3701. (B) Intersection with the cell wall-specific GO-term functional network resulted in a score of 0.4806 for the observed LOE network; intersect scores for randomized networks were ≤0.3470.
Literature Evidence
Recovering genes for which cell-wall-related functions have been previously reported is an important internal validation for the LOE method. We performed an extensive literature review to find evidence of previously validated genes in our results set. Forty-four genes were recovered with previous validation regarding cell-wall-related functions in P. trichocarpa, Arabidopsis, or other plant species and for which there is evidence of orthology in P. trichocarpa (see Supplementary Table S5). Fifteen of these high LOE genes were also in our anchor gene list. Genes with prior evidence of cell-wall-related functions were removed from our merged LOE network in order to present researchers with “new” candidate genes: 14 from Tier 1, four from Tier 2, and 11 from Tier 3; 17 of these genes are represented in Figure 3. However, the literature review process was not as thorough for Tiers 2 or 3, thus it is possible that some of the remaining genes in these tiers have prior connections to cell wall processes. The full ranked and filtered high LOE gene list can be found in Supplementary Table 6. For the remainder of the manuscript, we focus on Tier 1 genes.
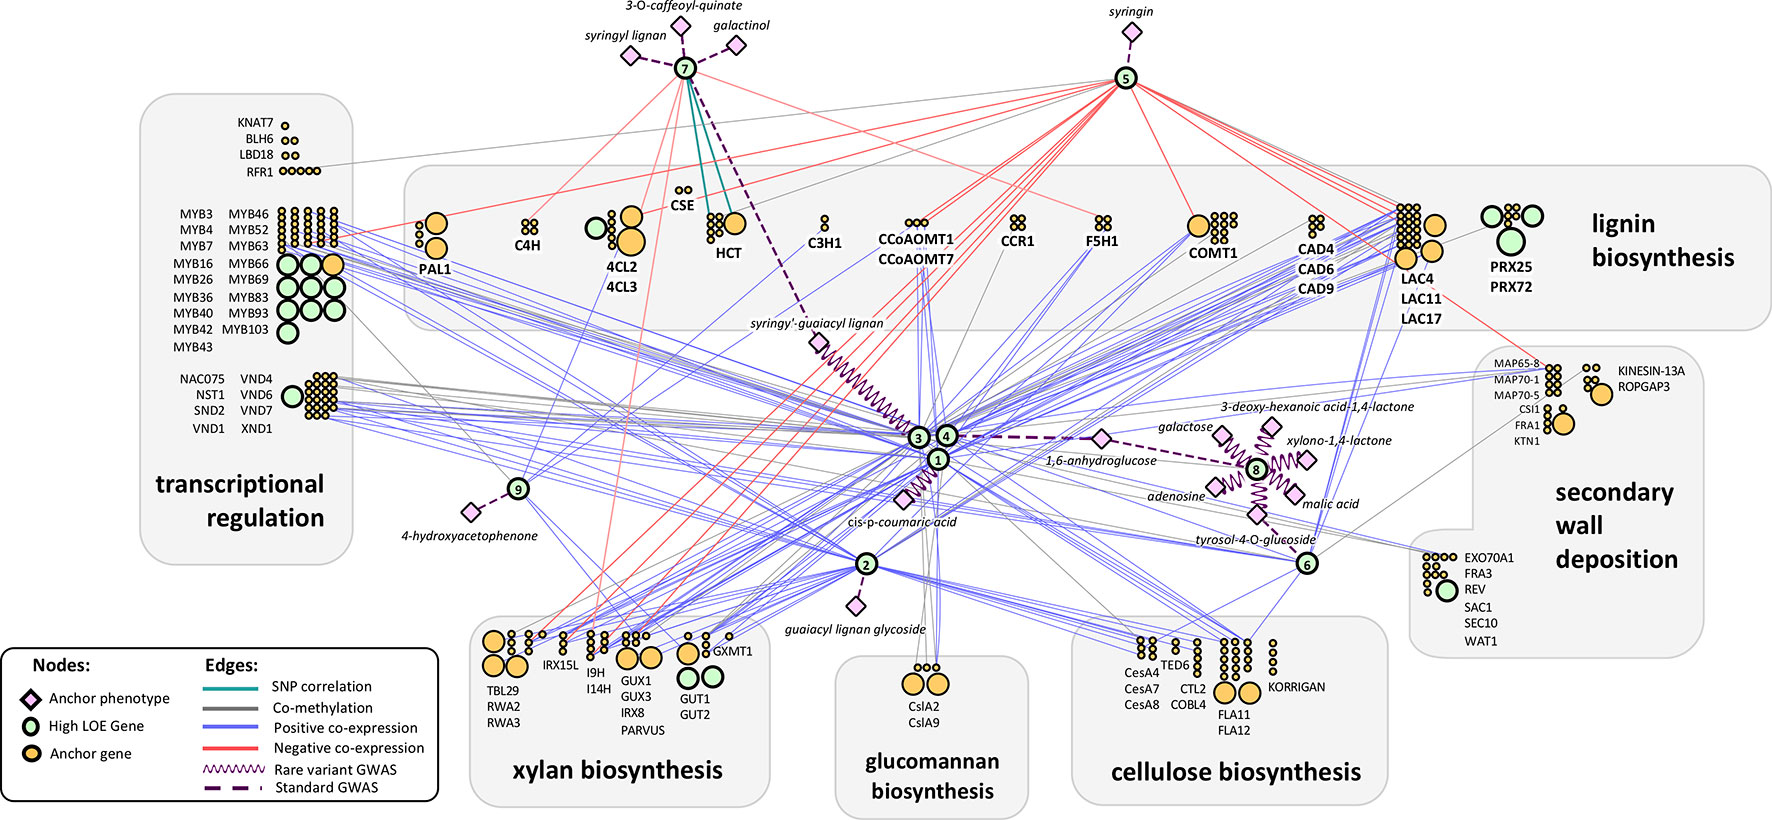
Figure 3 Tier 1 high LOE genes with regulatory annotations in the context of the LOE network arranged to highlight each gene’s connection to lignin/cell wall biosynthesis pathways. Orange and green circles represent cell wall anchor genes and high LOE genes, respectively. Numbers within high LOE genes (green circles) indicate an entry within Table 1. Green circles that do not contain numbers represent a subset of the high LOE genes that were filtered from the final results set due to having prior evidence of cell-wall-related functions in the literature. The size of circles corresponds to their LOE breadth score. Gene symbols are Arabidopsis Best-hit matches.
A notable example of a high LOE gene with prior evidence of a cell wall regulatory role is IQ-domain 10 calcium-signaling gene PtIQD10 (Potri.011G096500). PtIQD10 has a breadth score of three and a depth score of 48, including rare variant metabolite-GWAS associations with syringin, coniferin, and xylulose, and significant coexpression and comethylation with 41 cell wall anchor genes (Supplementary Table S5, Supplementary Figure S4, and Supplementary Table S6). The Arabidopsis ortholog AtIQD10 (AT3G15050; orthology with PtIQD10 and P. deltoidesPdIQD10 supported by phylogenetic analysis in Badmi et al., 2018) is differentially expressed in Arabidopsis lines overexpressing the transcription factor SECONDARY WALL-ASSOCIATED NAC DOMAIN PROTEIN 2 (AtSND2) (Hussey et al., 2011). Hussey et al. (2011) hypothesize AtIQD10 activates AtSND1 NAC, followed by activation of SND2, MYBs, and cell wall polymerization functions. Consistent with this model, orthologs of these genes are present in the PtIQD10 one-hop neighborhood (Supplementary Figure S4). Additional evidence has recently been observed in P. trichocarpa congeners. An ortholog of PtIQD10 in the P. alba x P. glandulosa hybrid “84k” is differentially expressed during the transition between primary and secondary growth phases in stems (Li et al., 2017). In addition, P. deltoides ortholog PdIQD10 has higher expression levels in tension-stressed xylem tissues and secondary walled cells, and RNAi repression of PdIQD10 results in altered phenotypes such as increased cellulose, wall glucose content, plant height, stem count, and stem density (Badmi et al., 2018; Macaya-Sanz et al., 2017). PdIQD10 is coexpressed with secondary cell wall related genes such as SUSY, CESAs, and KOR (Badmi et al., 2018), orthologs of which are present in our PtIQD10 subnetwork (Potri.018G103900 cellulose synthase/PdCesA7-B/AtCESA7 and Potri.004G059600 PtCESA.2/PdCESA8-B/AtCESA8; see Supplementary Table S7 for the PtIQD10 one-hop subnetwork node information for Supplementary Figure S4).
In another example of a high LOE gene with prior evidence of a cell-wall-related role, Porth et al. (2013) found that a SNP in an exostosin family protein gene (Potri.019G044600) involved in xylogalacturonan biosynthesis was correlated with xylose (hemicellulose) content. In yet another example, Pomiès et al. (2017) found a berberine bridge enzyme gene (Potri.011G161500) with orthology to AtEDA28/MEE23 (AT2G34790, shown to play a role in lignin monolignol metabolism) was highly up-regulated 72 h after mechanical perturbation of stems as plants modified cell wall properties in response. Another example with growing evidence of cell-wall-related regulatory functions is MADS-box transcription factor PtAGL12 (Du et al., 2009; Du et al., 2011; Weighill et al., 2018; see Supplementary Text S1, Supplementary Figure S5, Supplementary Table S8, and Supplementary Figure S6 for additional evidence regarding the putative role of PtAGL12 in regulating cell wall biosynthesis).
Tier 1: Highest Priority Candidates for Cell Wall Regulation
Tier 1 genes have the strongest evidence of involvement in cell wall related processes (Table 1). Of these, nine genes had regulatory annotations (via MapMan, www.arabidopsis.org, or PFAM; see Supplementary Table S4 for categories considered regulatory). While the remaining 21 genes did not have regulatory annotations, our results suggest they play a role in cell wall biosynthesis.
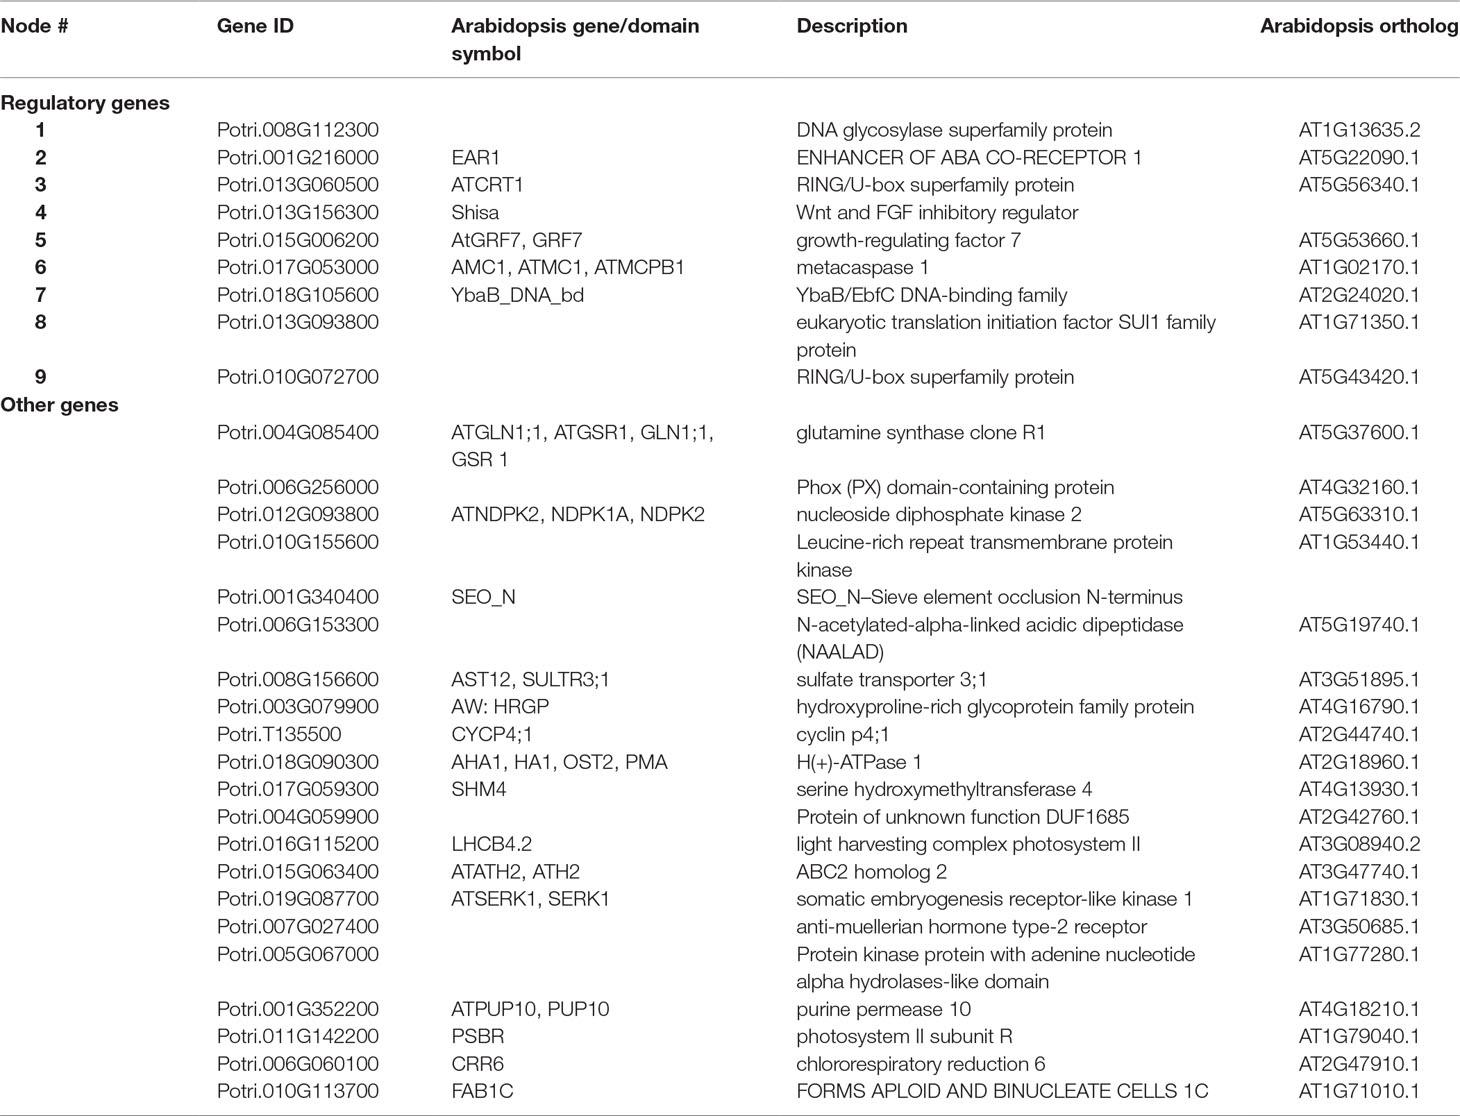
Table 1 Tier 1 high LOE genes. See Supplementary Table S9 for additional score and annotation information.
Among Tier 1 regulatory genes, there were a total of 18 metabolite-GWAS associations, 8 of which were rare variant hits (Figure 3). Potri.013G093800 (Arabidopsis homolog AT1G71350, a eukaryotic translation initiation factor SUI1 family protein) has the highest number of rare variant metabolite-GWAS associations (six) of any high LOE gene as well as the highest number of total combined GWAS edges (seven). Most Tier 1 regulatory genes share edges with cell wall anchor genes from multiple process categories (in Figure 3, gray boxes indicating functional groupings of cell wall anchor genes). On average, Tier 1 genes were connected by multiple edges to four different functional groups, suggesting that Tier 1 genes influence multiple aspects of cell wall biosynthesis. Furthermore, eight Tier 1 regulatory genes shared edges with anchor cell wall transcriptional regulation genes (Figure 3).
Notably, coexpression edges for Tier 1 regulatory genes were either strictly negative for a given gene, or strictly positive, perhaps hinting at the regulatory mechanism of each gene. Two Tier 1 regulatory genes (Potri.015G006200: GROWTH-REGULATING FACTOR 9/PtGRF9 and Potri.018G105600: NUCLEOID-ASSOCIATED PROTEIN YBAB) were negatively coexpressed with cell wall genes and six were positively co-expressed with cell wall genes. The negatively coexpressed genes (Potri.015G006200, Potri.018G105600) did not share any neighbor nodes, however they are both connected to lignin and xylan biosynthesis genes. In contrast, positively coexpressed Tier 1 regulatory genes had a large overlap in neighbor cell wall anchor genes. The overlap was even more pronounced among Potri.008G112300, Potri.001G216000, Potri.013G060500, and Potri.013G156300 despite a complete lack of overlap among metabolite-GWAS edges or MAPMAN functional annotations (Supplementary Table S9).
We conducted an in-depth investigation into the Tier 1 regulatory gene PtGRF9 (Potri.015G006200) to assess support for PtGRF9 playing a regulatory role in cell wall biosynthesis.
GROWTH-REGULATING FACTOR 9: Putative Master Regulator
The transcription factor gene GROWTH-REGULATING FACTOR 9 (PtGRF9/Potri.015G006200) had a breadth score of three and depth score of 17, including 13 negative coexpression edges (the highest negative coexpression depth score in our analysis). PtGRF9 shared nine edges with lignin biosynthesis genes, four edges with xylan biosynthesis genes, two edges with transcriptional regulation genes, and one edge with a secondary cell wall deposition gene.
The P. trichocarpa genome annotation (v3.0; available on https://phytozome.jgi.doe.gov; Tuskan et al., 2006) indicates the best-hit Arabidopsis match for PtGRF9 is AT5G53660 (growth-regulating factor 7, AtGRF7). To assess support for orthology, we performed reciprocal BLASTp searches of amino acid sequences containing the WRC (PF08879) and QLQ (PF08880) domains from A. thaliana and P. trichocarpa (obtained from UniProt; www.uniprot.org) and a phylogenetic analysis (see Supplementary Figure S7). Our results support an orthologous relationship between PtGRF9 and AtGRF7, which is consistent with the phylogenetic analysis of Cao et al. (2016). While investigating support for orthology between PtGRF9 and AtGRF7, we discovered a second AtGRF7 ortholog in the P. trichocarpa genome (Potri.012G022600; hereafter, Potri.015G006200 is referred to as “PtGRF9a” and Potri.012G022600 as “PtGRF9b”; Supplementary Figure S7). PtGRF9b was not present in our set of high LOE genes because it has a breadth score of 2 and was not associated with any cell wall phenotypes through GWAS analyses. Because PtGRF9b had strong positive coexpression with PtGRF9a and shared edges with many cell wall genes, we included PtGRF9b in further analyses.
We constructed genome-wide 1-hop networks around each PtGRF9 paralog across all data layers to assess the functional annotations of nearest neighbors (Figure 4; see Supplementary Table S10 for detailed information about nodes). PtIQD10 is present in the 1-hop network, along with many other genes with documented roles in cell wall processes. PtGRF9a and PtGRF9b are jointly positively co-expressed with 14 genes (one of which is a high LOE gene related to cell wall processes) and are jointly negatively co-expressed with 27 genes (including 7 cell wall anchor genes and 2 high LOE genes), implying an overlap in function. However, the bulk of neighbor genes are unique to each paralog, indicating divergence and perhaps specialization for specific tissues and conditions. GO-term functional enrichment analysis of the negative co-expression nodes in the 1-hop network showed significant enrichment for cell wall biological processes, including lignin biosynthesis, xylan biosynthesis and cell wall organization or biogenesis (Supplementary Table S11). In addition, the metabolite-GWAS association between PtGRF9a and syringin (a monolignol glucoside) indicated this SNP is associated with an allelic effect on syringin concentration (Supplementary Figure S8), further implicating PtGRF9a and PtGRF9b as repressors of secondary cell wall formation.
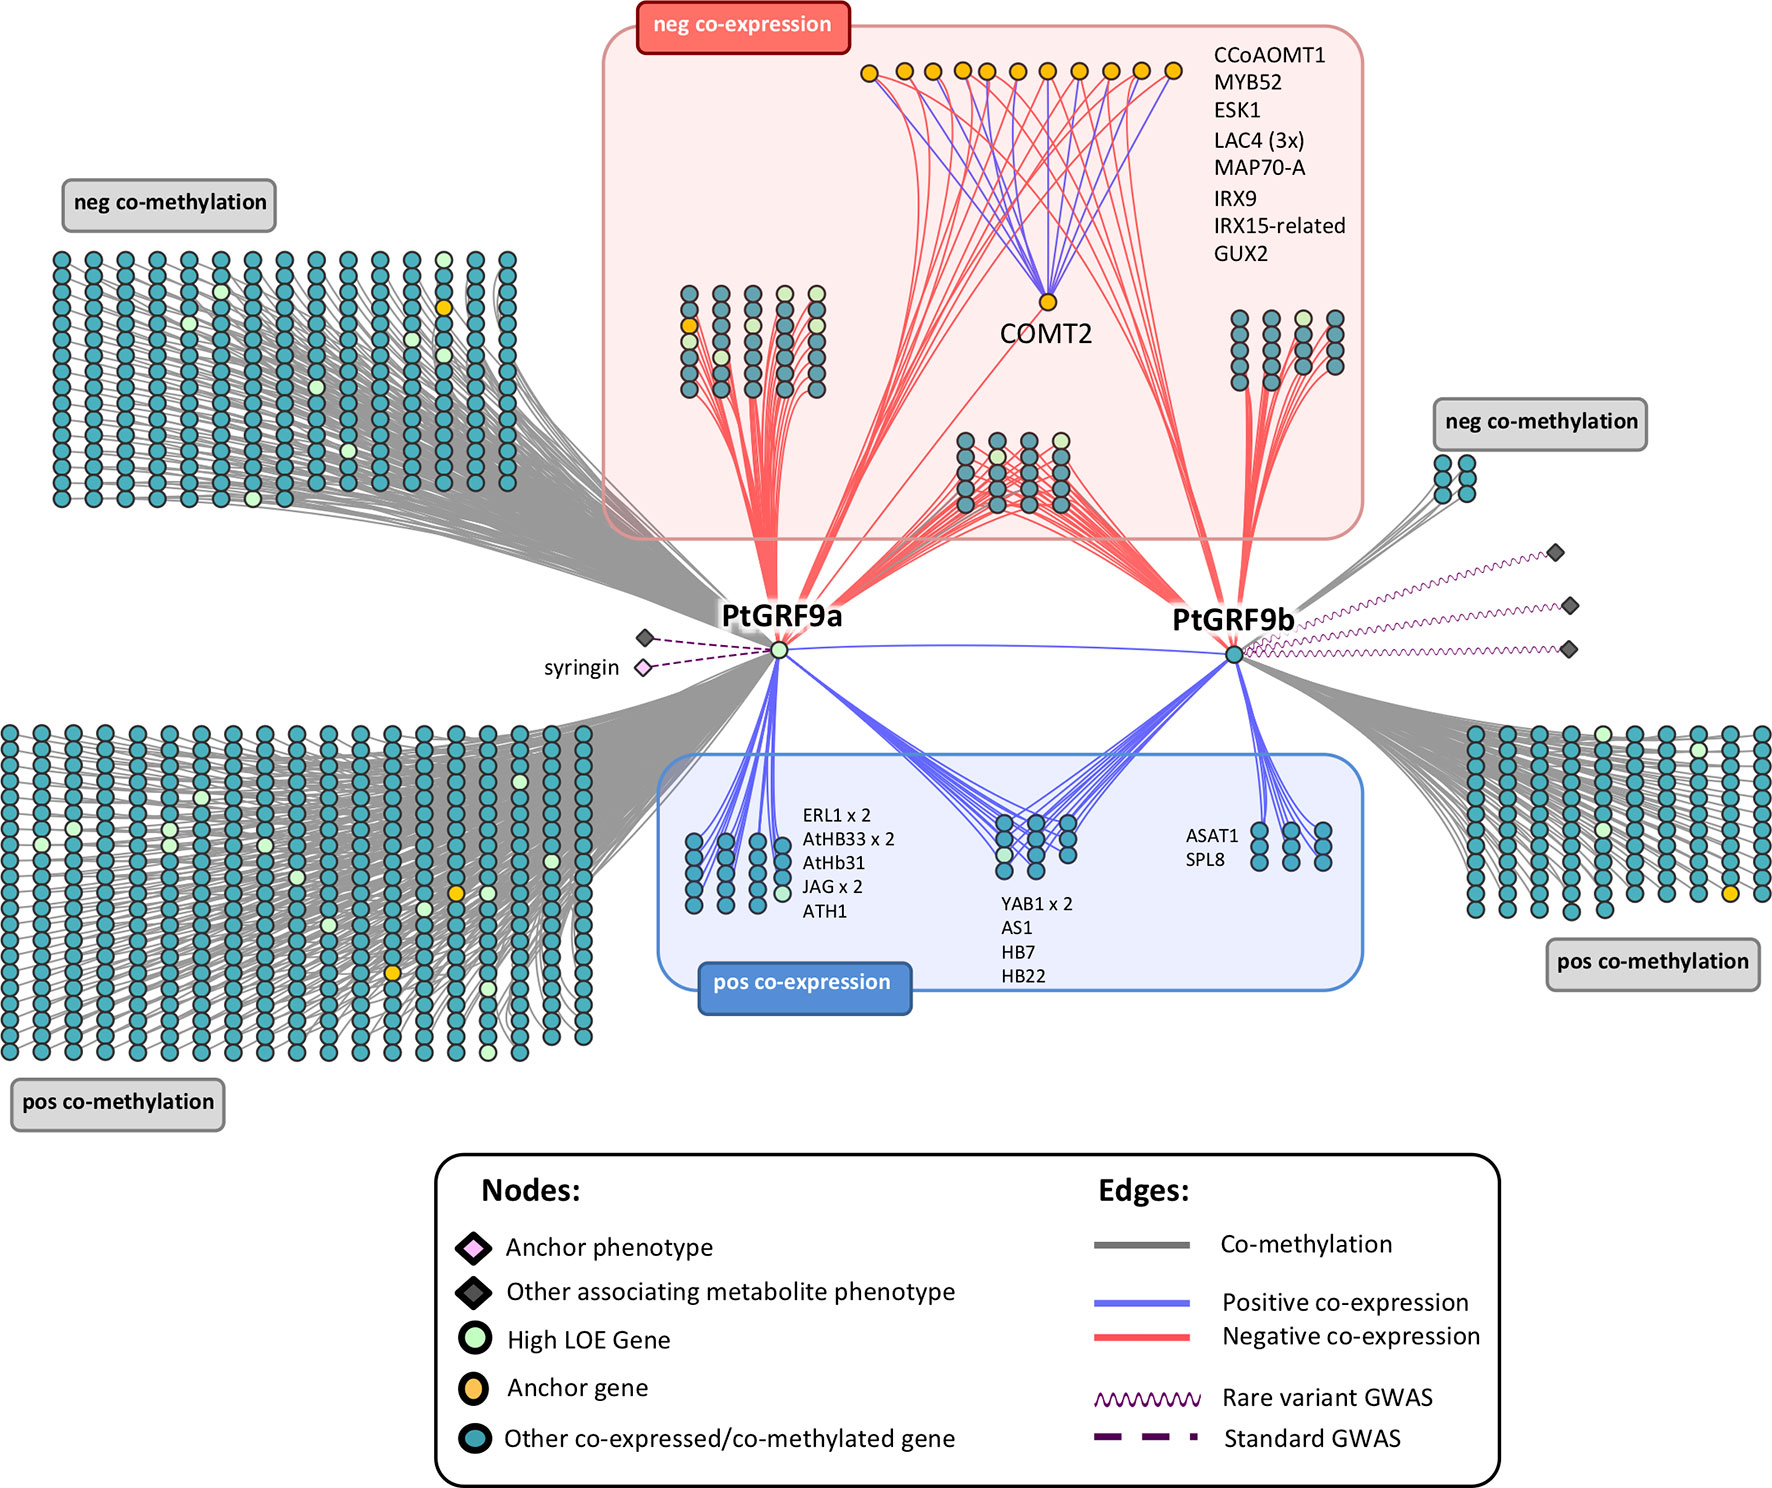
Figure 4 Genome-wide neighborhood of PtGRF9 paralogs in the global input layer networks. Gene symbols are Arabidopsis Best-hit matches. See Supplementary Table S10 for detailed node information; for functional enrichment details, see Supplementary Tables S11 (negatively co-expressed genes) and S12 (positively co-expressed genes).
In Arabidopsis, AtGRF7 is one of nine members of the GRF family of transcription factors (there are 20 GRF homologs in P. trichocarpa) that affect growth via multiple mechanisms (Omidbakhshfard et al., 2015). AtGRF7 has specifically been shown to modulate drought response by repressing DREB2A (Joshi et al., 2016) which ensures that drought response genes normally activated by DREB2A are not expressed under non-drought conditions, thus avoiding reduced growth. In addition to stress response, GRF genes are involved in regulating cell proliferation and differentiation in the shoot apical meristem (SAM). GRF genes therefore impact the elongation of stems, new leaf initiation, and the size and shape of leaves (Gonzalez et al., 2012). The phenotypic penetrance may occur as part of a complex formed with GRF Interacting Factor (GIF1/AN3) proteins (Hoe Kim and Tsukaya, 2015), where the GRF-GIF complex serves as a transcriptional activator, recruits chromatin remodeling complexes, and regulates the meristematic state of a tissue.
GO-term enrichment analysis of the positive coexpression nodes in the PtGRF9 1-hop network was consistent with roles reported in the literature for GRF genes (Supplementary Table S12). The most significantly enriched Biological Process GO terms include specification of axis polarity, shoot system development, shoot system morphogenesis and negative regulation of cell proliferation. Numerous osmotic-stress related genes are also found in the PtGRF9 network (e.g., AHA1/OST2, ERL1, PIP2;2, TIP4;1, and AREB3), reflecting the well-documented relationship between AtGRF7 and drought response. Significant connections between the PtGRF9 paralogs and PtGIF1 or PtDREB2A are not present in our LOE network. On closer inspection of co-expression values across tissues we see that PtGRF9a and PtGIF1 do coexpress strongly in bud and immature leaf, but expression diverges in mature leaf and roots which causes the strength of coexpression to fall just below our 0.85 threshold (Supplementary Figure S9). The case is less clear for PtDREB2A as it shows little expression in most tissues.
Evidence that the PtGRF9 paralogs play roles in regulating growth, defense, stress response, secondary growth, and cell wall biosynthesis suggest that PtGRF9a and PtGRF9b could be transcriptional co-regulators as described by Xie et al. (2018b), acting as master regulators that direct the global allocation of energy within a plant.
Evidence for Regulation of the Cell Wall by PtGRF9
To date, a role for the GRF family in cell wall regulation has not been reported, though it has been noted that cell proliferation and timing of differentiation must require control or delay of secondary cell wall deposition (Mele et al., 2003). Barros et al. (2015) noted that lignin cannot be removed once deposited, thus, specific regulatory mechanisms are required to control lignin biosynthesis and deposition at specific stages during cell differentiation. The contrasting patterns of coexpression between cell wall biosynthesis and meristematic control in our PtGRF9 1-hop network (Figure 4) suggest that it could be involved in such a mechanism. Furthermore, the GWAS association with syringin suggests that allelic variation in PtGRF9a in this population may have an additive effect on the amount of sinapyl alcohol stored or released for cell wall lignification.
Knowledge regarding downstream targets of GRF genes is incomplete (see Omidbakhshfard et al., 2015 for a comprehensive review). AtGRF7 has been shown to repress AtDREB2A by binding to the motif TGTCAGG (Kim et al., 2012). Additionally, the central CAG sub-motif is enriched in the promoter of KNOX genes that are targeted by GRFs (Kuijt et al., 2014). We searched for the complete TGTCAGG motif in the promoter regions of Arabidopsis homologs of the genes that coexpress with PtGRF9a using the online athamap.de tool, revealing two potential AtGRF7 targets in our 1-hop network: caffeoyl coenzyme A O-methyltransferase 1 (AT4G34050/AtCCoAOMT1) and MADS-box transcription factor AtAGL12 (AT1G71692). Both genes are relevant to the cell wall, and P. trichocarpa homologs of these genes are negatively co-expressed with PtGRF9a. To further investigate these genes as potential PtGRF9a targets, we used Analysis of Motif Enrichment (AME) (McLeay and Bailey, 2010), but found no evidence for enrichment of the TGTCAGG motif in the 2-kb upstream or CDS regions of PtCCoAOMT (Potri.001G304800 and Potri.009G099800) or PtAGL12 (Potri.013G102600). Manual examination revealed that the TGTCAGG motif appears inexactly in the upstream regions of PtCCoAOMT1 and PtAGL12 (TGTTCAGG in CCoAOMT1 Potri.009G099800; TGTCAGC in PtCCoAOMT Potri.001G304800 and PtAGL12). Consistent with the findings of Franco-Zorrilla et al. (2014), who show that repressor TFs such as PtGRF9a are more likely than activator TFs to bind downstream of a target gene, we found 27 Populus genes significantly enriched for TGTCAGG in the 1-kb downstream region, including PtMYB41 (Potri.012G039400, a homolog of AtMYB52), which is negatively coexpressed with PtGRF9a. AtMYB52 is a TF known to induce secondary cell wall biosynthesis genes and its repression reduces secondary wall thickening in fibers (Zhong et al., 2008). Furthermore, AtMYB52 overexpression has been linked with drought tolerance (Park et al., 2011). Given the established role of AtGRF7 in drought response, repression of PtMYB41 is a potential avenue for PtGRF9a to regulate both lignification and drought tolerance, although further experimental evidence is required.
Analysis of our 1-hop network suggests that PtGRF9 also affects cell wall biosynthesis by regulating a host of homeobox genes. Twenty homeobox genes were present in the PtGRF9 network, including PtATHB.12 (Potri.001G188800; homolog of AtHB15/AT1G52150), which has been shown to influence secondary wall formation and cambial production of xylem (Schrader, 2004; Cassan-Wang et al., 2013), and PtAGL12 (Du et al., 2009; Du et al., 2011; Weighill et al., 2018) (Supplementary Figure S5). There was also indirect evidence in the PtGRF9 network suggesting PtGRF9 interacts with PtKNOX genes. KNOX genes are involved in meristem maintenance and are downregulated to facilitate lateral primordia development and the differentiation of cambium into xylem and phloem (Hertzberg et al., 2001; Schrader, 2004; Hay and Tsiantis, 2010). GRF genes are involved in specification of primordia cells and have been shown to repress KNOX genes by forming hairpins in targeted regions (Kuijt et al., 2014; Hoe Kim and Tsukaya, 2015). Interactions between AtGRF7 and KNOX genes have yet to be investigated, but the primary motif of the target sequence by which AtGRF7 binds AtDREB2A was shown to be enriched in several KNOX genes, and experiments in rice, barley, and Arabidopsis have confirmed that multiple GRF genes bind these motifs in KNOX genes (Kim et al., 2012; Kuijt et al., 2014). The presence of several genes that exclusively or directly interact with KNOX genes in the 1-hop network strongly implies that PtGRF9 proteins influence the cell wall via interactions with the PtKNOX1 genes PtSTM and PtBP, and likely other PtKNOX genes as well (Supplementary Table S13 and Figure 5). Although KNOX family genes were not present in the PtGRF9 network, this was likely due to highly tissue-specific expression patterns which our coexpression analysis methods were not designed to detect (see Supplementary Figure S10).
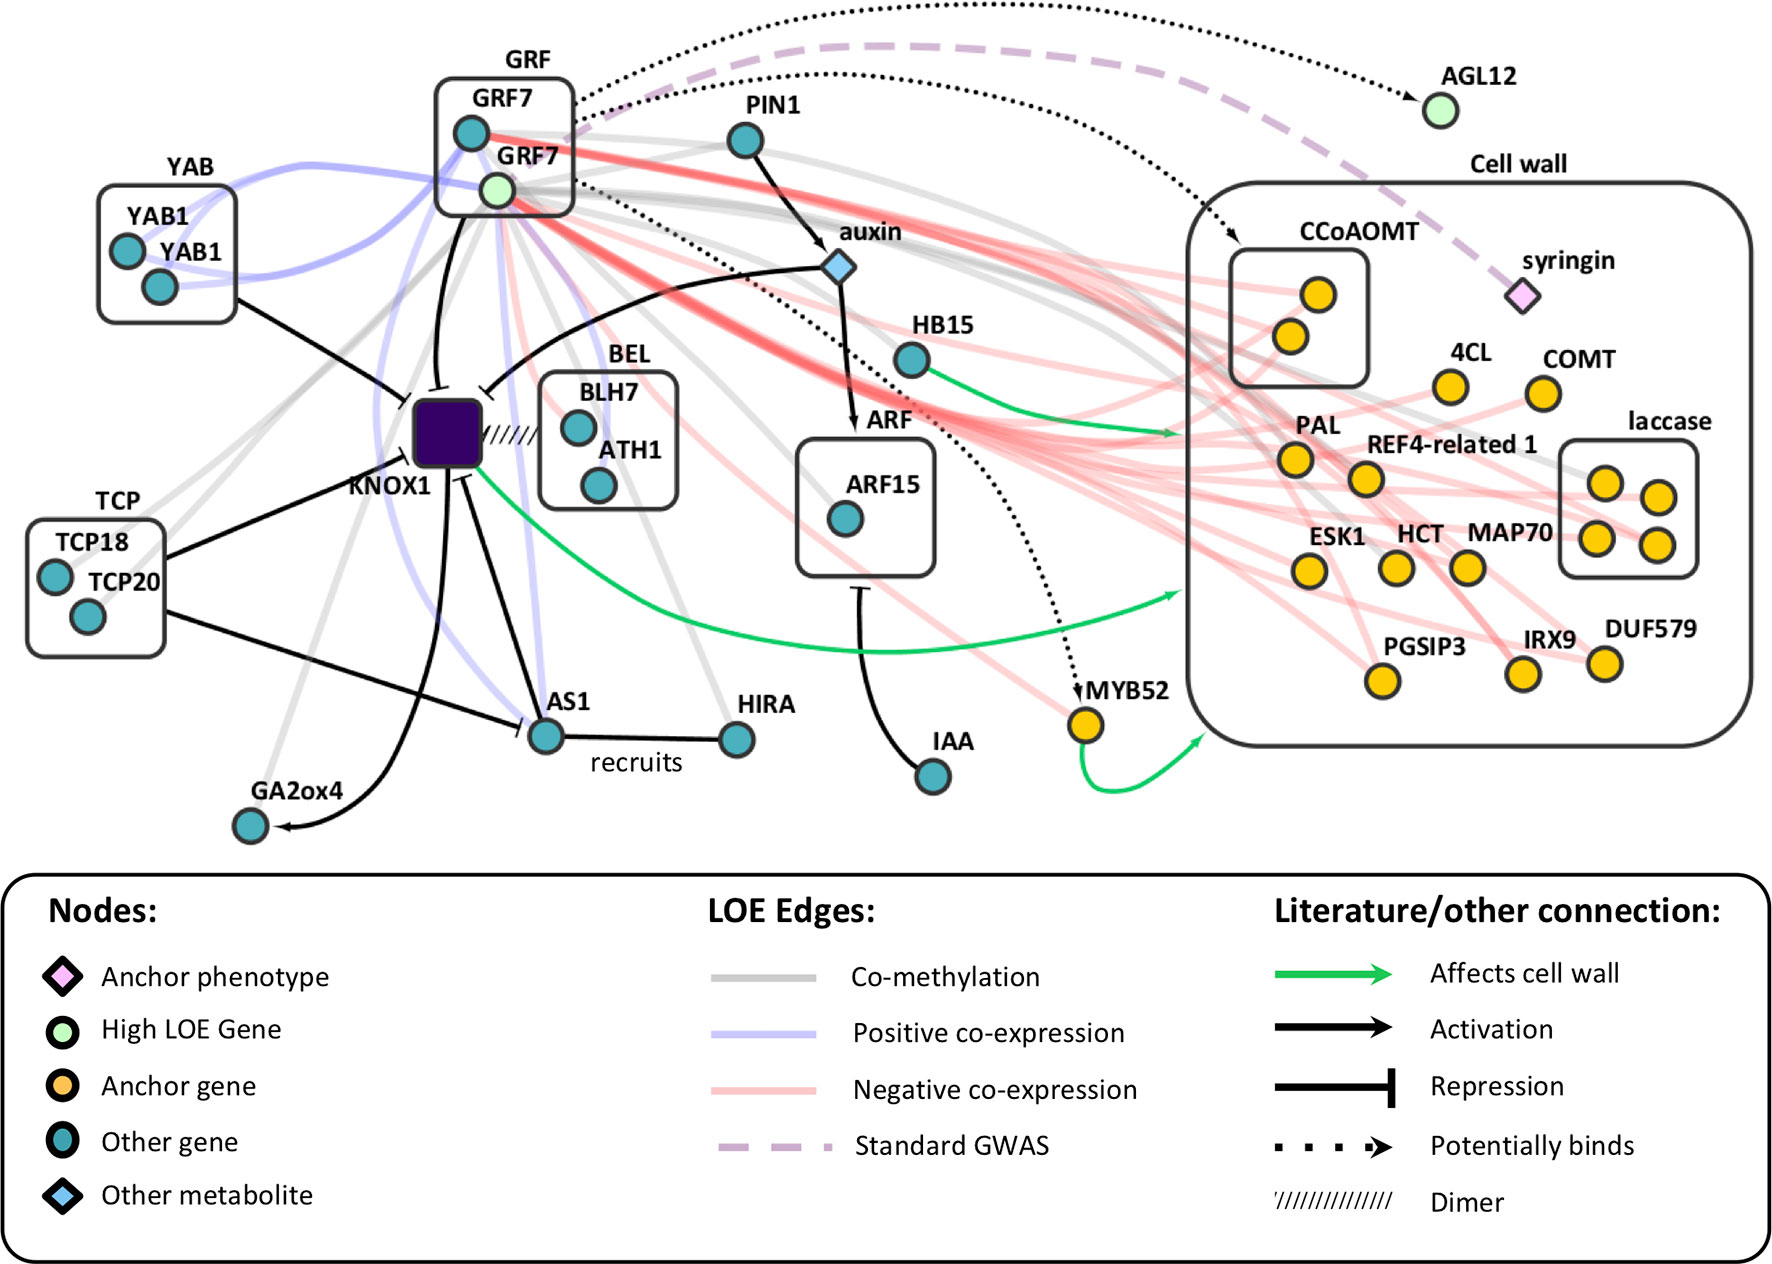
Figure 5 Literature evidence linking AtGRF7 genes to AtKNOX genes and the cell wall, overlaid on LOE edges from the PtGRF9 subnetwork. See Supplementary Table S13 for P. trichocarpa orthologs.
The PtKNOX-associated genes in the PtGRF9 network have documented roles in cell wall and secondary growth phenotypes (Figure 5). SHOOT-MERISTEMLESS (PtSTM) downregulates gibberellic acid levels by repressing gibberellin 20-oxidase (PtGA20ox) biosynthesis genes and upregulating catabolism genes such as PtGA2ox4 (positively co-methylated with PtGRF9a), which inhibits xylem production (Eriksson et al., 2000; Jasinski et al., 2005). Overexpression of PtSTM/ARBORKNOX1 (PtSTM/PtARK1) in P. tremula × P. alba has been shown to inhibit differentiation of leaf primordia, elongation of internodes, and differentiation of secondary vascular cells (Groover et al., 2006). Counterintuitively, overexpression of PtSTM/PtARK1 in secondary meristems also results in upregulation of some lignin biosynthesis genes and increased lignin content. Long-term transcriptional repression of BREVIPEDICELLUS (AtBP), KNOTTED-like 2 from A. thaliana (AtKNAT2) and AtKNAT6 outside the meristem is facilitated by chromatin remodeling carried out by the protein encoded by ASYMMETRIC LEAVES 1 (AtAS1; PtAS1 is positively co-expressed with PtGRF9a and PtGRF9b), which dimerizes with AtAS2 and recruits the histone chaperone protein encoded by AtHIRA (PtHIRA is negatively co-methylated with PtGRF9a) (Guo et al., 2008; Hay and Tsiantis, 2010). AS2 is involved in controlling seasonal lignification in spruce, likely through its role in repressing BP (Jokipii-Lukkari et al., 2018). BP decreases lignin deposition and regulates the localization of lignification by binding the promoters of AtCOMT1, AtCCoAOMT1, laccases, and peroxidases (putative orthologs of which are all negatively co-expressed with PtGRF9a and PtGRF9b) (Mele et al., 2003). The PtGRF9 network includes many of the cell wall biosynthesis-related genes that Mele et al. (2003) found to be differentially expressed in bp mutants, including five putative orthologs (PAL1, OMT1, two CCoAOMT1 paralogs, PME3, and GH9B5; see Supplementary Table S13) and an additional 23 genes belonging to the same families as differentially expressed genes in bp mutants (4CL2, five PMEs, KCS19, four peroxidases, four laccases, ERD4, GAUT4, PUB24, MEE23, ERF1-3, and three R2R3 MYBs: MYB52, MYB93, MYB111). Consistent with these observations in Arabidopsis, overexpression of AtBP/ARBORKNOX2 (AtBP/AtARK2) in P. alba x P. tremula results in downregulation of ABNORMAL FLORAL ORGANS (PtAFO/PtYAB1), PIN-FORMED 1 (PtPIN1), PtAGL12 (all negatively co-expressed with PtGRF9a) and PtGA20ox genes, leading to inhibition of cellular differentiation and division and decreases in biomass (Du et al., 2009). Furthermore, overexpression of PtBP/PtARK2 results in downregulation of cell wall biosynthesis genes, decreased lignin content, reduced phloem fibers, and reduced secondary xylem in stems.
We did not find a connection between the PtGRF9 genes and cell wall anchor genes KNAT7 (Potri.001G112200, a PtKNOX2 gene) and BEL1-like homeodomain 6 genes (PtBLH6, Potri.004G159300 and Potri.009G120800). These genes have well-documented roles in cell wall regulation (Li et al., 2012a; Cassan-Wang et al., 2013). However, the PtGRF9 genes do not appear to be involved in their regulation, perhaps because PtKNOX2 genes are generally more functionally diverse and broadly expressed than PtKNOX1 genes (consistent with expression data in Supplementary Figure S10) (Furumizu et al., 2015). In addition, they are not involved in meristematic maintenance, and in some cases seem to overlap in function with genes that promote differentiation (consistent with what we recovered in our LOE analysis).
PtGRF9 eQTN Network: An Independent Line of Evidence
As a means of independently evaluating support for the hypothesis that PtGRF9 paralogs regulate cell wall biosynthesis, we constructed 1-hop eQTN networks around PtGRF9a and PtGRF9b (Figure 6; detailed node information available in Supplementary Table S14). SNPs in both the PtGRF9a and PtGRF9b 1-hop networks were associated with cell wall expression phenotypes in leaf and xylem tissues, as well as expression phenotypes consistent with the previously documented roles of AtGRF7 and other GRF orthologs in regulating functions such as growth, defense, and stress response. In agreement with the multi-omic 1-hop network described in the section GROWTH-REGULATING FACTOR 9: Putative Master Regulator (Figure 4), the eQTN network indicated each paralog has connectivity with cell-wall-related genes affecting multiple facets of cell wall biosynthesis, including transcriptional regulation, cellulose biosynthesis, lignin biosynthesis, xylan biosynthesis, and secondary cell wall deposition. Also consistent with the multi-omic 1-hop network, the eQTN analysis indicated that despite a low degree of topological overlap between the PtGRF9a and PtGRF9b neighborhoods, the paralogs still largely overlap in function.
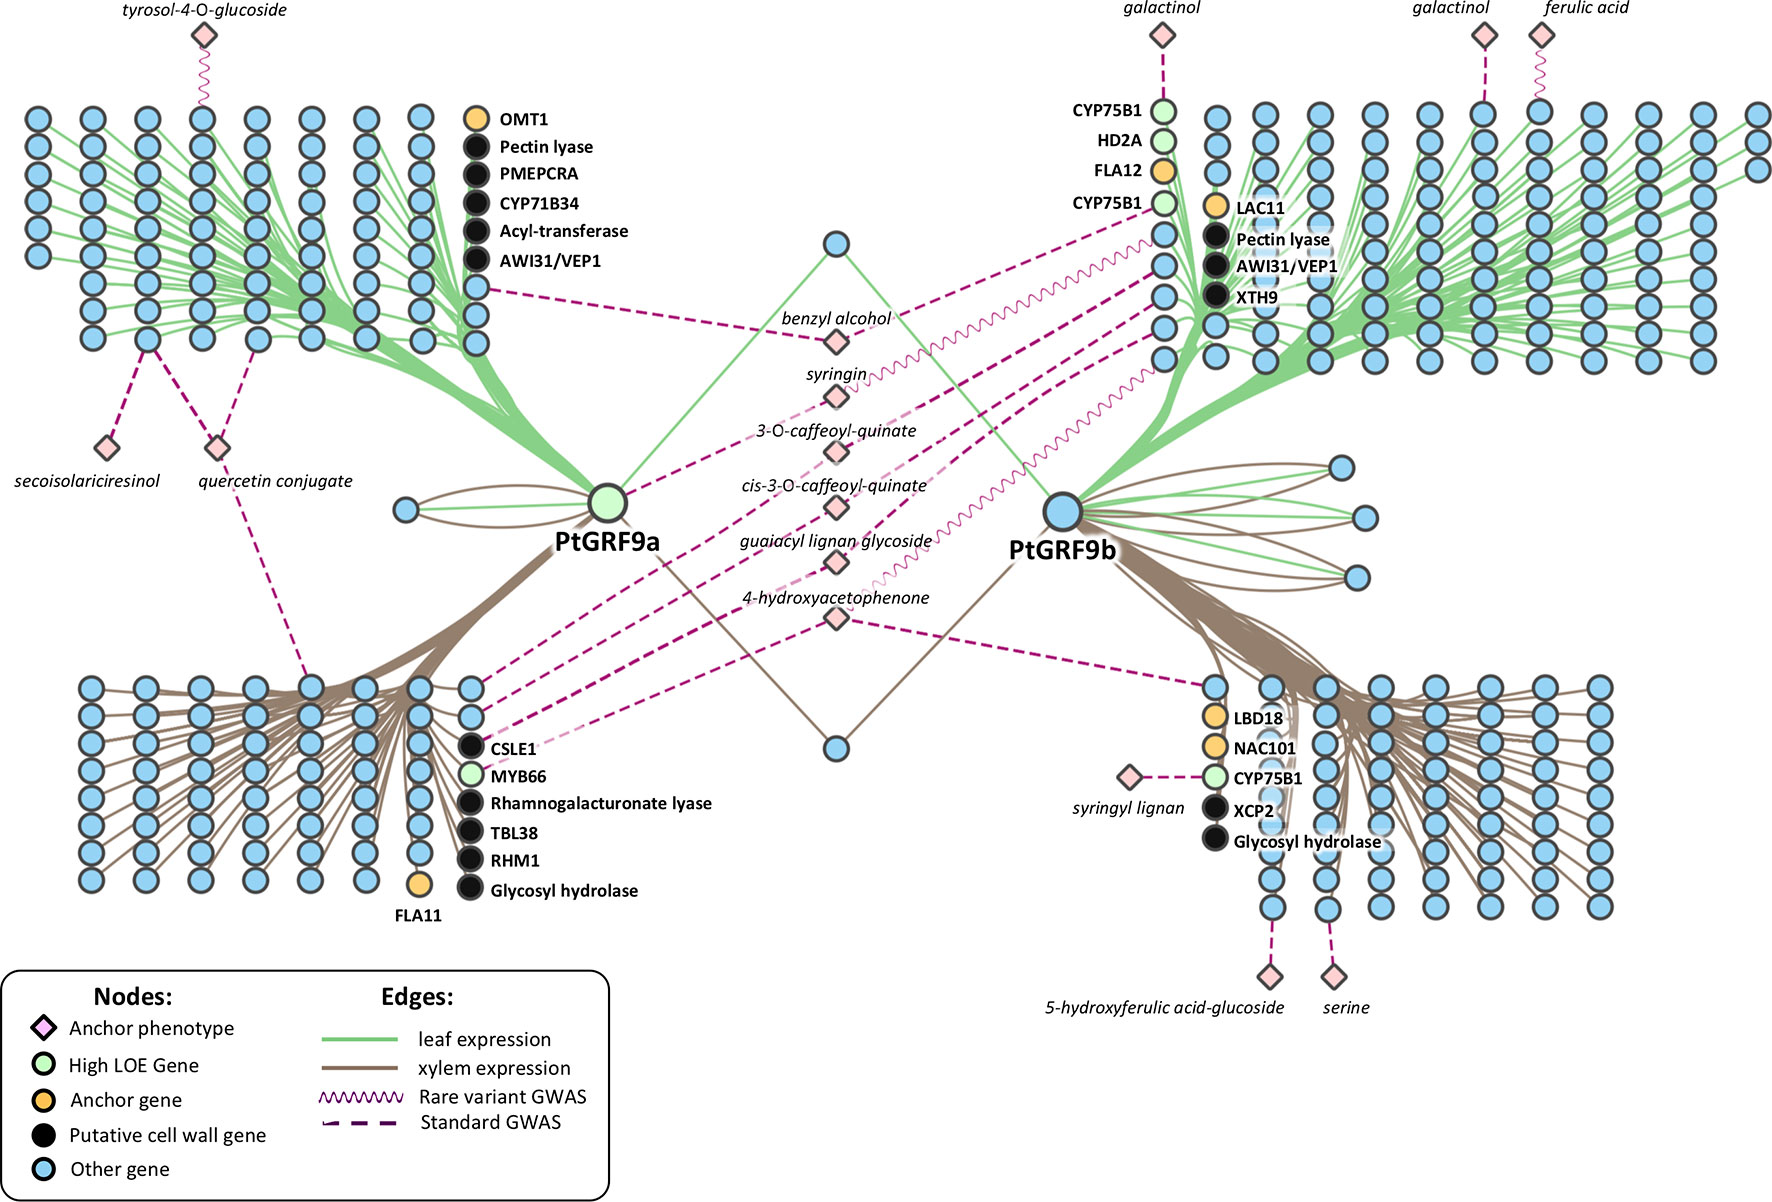
Figure 6 Two-hop network created by merging a 1-hop eQTN network around the PtGRF9 paralogs and 1-hop metabolite-GWAS networks around anchor metabolites. See Supplementary Table S14 for node information.
To gain an understanding of how the PtGRF9 paralogs potentially affect cell wall metabolites, the 1-hop eQTN network was merged with 1-hop anchor metabolite networks generated from traditional and rare variant metabolite-GWAS data layers. Beyond the direct GWAS association of PtGRF9a with syringin, 14 additional anchor metabolites are present in the 2-hop eQTN to metabolite-GWAS network (Figure 6), 6 of which are indirectly associated with both paralogs through various intermediate genes. There appears to be a pattern of segregation regarding metabolite associations between tissue types and PtGRF9 paralogs, perhaps indicating that these genes are diverging to fulfill different tissue-specific regulatory roles.
Future Directions
Our extended network analysis pipeline has provided a short list of putative cell wall regulatory genes to the scientific community for experimental validation. We performed an in-depth investigation of the PtGRF9 paralogs, which are particularly promising candidates for regulation of cell wall biosynthesis and secondary growth. Furthermore, we show the PtGRF9 paralogs are potential transcriptional co-regulators that coordinate the flow of energy among growth, defense, stress response, and lignification, in a manner consistent with the hypothesis of Xie et al. (2018b). The ability to manipulate transcriptional co-regulators such as these via genetic engineering and breeding programs would provide a powerful tool for shaping bioenergy crops.
Incorporating a rare variant metabolite-GWAS data layer in the LOE analysis has proven to be a valuable asset in the identification of new candidate genes. Incorporating a genome-wide eQTN (SNP-to-expression-phenotype GWAS) data layer in future analyses would provide greater clarity regarding the mechanisms through which these genes regulate cell-wall-related functions. Furthermore, DNA affinity purification sequencing (DAP-seq) could provide further support for hypothesized transcription factor binding sites, and thus help elucidate relevant transcription factor regulatory networks. Tissue-specific expression analysis across a GWAS population would allow for increased “tissue level resolution” of the regulatory networks. The extended network analysis pipeline will be a valuable tool to integrate these new layers with the previous networks to produce a holistic model of cell wall regulation.
Data Availability Statement
Populus trichocarpa genome sequence, annotation, and Gene Atlas expression data sets are available on Phytozome (http://phytozome.jgi.doe.gov). P. trichocarpa variant data (DOI 10.13139/OLCF/1411410) is available from https://doi.ccs.ornl.gov/ui/doi/55. Scripts used to calculate LOE scores, create GO-term networks, and calculate weighted intersect scores are available on GitHub: https://github.com/afurches/Cell_Wall_LOE.
Author Contributions
XR and RD provided anchor gene IDs. TT provided anchor metabolite IDs. WJ developed the Parallel GPU CCC application code. DK performed the rare variant GWAS analysis. PJ performed the standard GWAS and outlier analysis and constructed the standard GWAS and eQTN networks. DW calculated methylation TPM values and constructed the observed co-expression, co-methylation and SNP correlation networks and calculated LOE scores for the observed LOE network. AF performed expression and methylation randomizations. JG performed random subsampling. AF calculated correlation values and performed significance tests and performed LOE input layer randomizations, constructed randomized LOE networks, and calculated randomized LOE scores. DK and JR created the GO-term network, and AF calculated GO intersect scores. AF performed candidate ranking, generated the clustered expression heatmap, and performed the phylogenetic analyses. DK performed the functional enrichment and TF-binding analyses. AF created eQTN subnetworks. MS mapped gene expression atlas reads and RNAseq reads and calculated gene expression TPM values. SD and GT led the effort on constructing the GWAS population. TT led the leaf sample collection for GCMS-based metabolomic analysis, identified the peaks, and summarized the metabolomics data. PR did automated extraction of metabolite intensity from GCMS. MM collected the leaf samples and manually extracted the metabolite data. NZ performed leaf sample preparation, extracted, derivatized, and analyzed the metabolites by GCMS. JSch and AS generated the gene expression atlas data. SD and DM-S generated the SNP calls. J-GC provided RNAseq data. AF, AW, DK, and AL performed the in-depth literature searches. AL performed the domain annotation. AF, DK, DW, AL, and JStr wrote the manuscript. All authors edited the manuscript. DJ conceived of and supervised the study, participated in the network analysis, and generated MapMan annotations.
Funding
Funding was provided by The Center for Bioenergy Innovation (CBI), U.S. Department of Energy Bioenergy Research Centers supported by the Office of Biological and Environmental Research in the DOE Office of Science.
An award of computer time was provided by the INCITE program. This research used resources of the Oak Ridge Leadership Computing Facility, which is a DOE Office of Science User Facility supported under Contract DE-AC05-00OR22725. This research also used resources of the Compute and Data Environment for Science (CADES) at the Oak Ridge National Laboratory, which is supported by the Office of Science of the U.S. Department of Energy under Contract No. DE- AC05-00OR22725.
Support for the Poplar GWAS dataset was provided by The BioEnergy Science Center (BESC) and The Center for Bioenergy Innovation (CBI). U.S. Department of Energy Bioenergy Research Centers supported by the Office of Biological and Environmental Research in the DOE Office of Science. The Poplar GWAS Project used resources of the Oak Ridge Leadership Computing Facility and the Compute and Data Environment for Science at Oak Ridge National Laboratory, which is supported by the Office of Science of the U.S. Department of Energy under Contract No. DE-AC05-00OR22725.
The JGI Plant Gene Atlas project conducted by the U.S. Department of Energy Joint Genome Institute was supported by the Office of Science of the U.S. Department of Energy under Contract No. DE-AC02-05CH11231.
AL and AW acknowledge that this project was supported in part by appointments to the Higher Education Research Experiences (HERE) Program at Oak Ridge National Laboratory, administered by the Oak Ridge Institute for Science and Education (ORISE). ORISE is managed by Oak Ridge Associated Universities (ORAU) for the U.S. Department of Energy (DOE).
The work conducted by the U.S. Department of Energy Joint Genome Institute is supported by the Office of Science of the U.S. Department of Energy under Contract No. DE-AC02-05CH11231.
Conflict of Interest
The authors declare that the research was conducted in the absence of any commercial or financial relationships that could be construed as a potential conflict of interest.
Acknowledgments
The authors would like to acknowledge Nancy Engle, David Weston, Ryan Aug, KC Cushman, Lee Gunter, and Sara Jawdy for metabolomics sample collection. We thank the Department of Energy Joint Genome Institute (JGI) and collaborators for prepublication access to the Plant Gene Atlas Data.
Supplementary Material
The Supplementary Material for this article can be found online at: https://www.frontiersin.org/articles/10.3389/fpls.2019.01249/full#supplementary-material
References
Aguilar-Martínez, J. A., Sinha, N. (2013). Analysis of the role of Arabidopsis class I TCP genes AtTCP7, AtTCP8, AtTCP22, and AtTCP23 in leaf development. Front. Plant Sci. 4, 1–13. doi: 10.3389/fpls.2013.00406
Alejandro, S., Lee, Y., Tohge, T., Sudre, D., Osorio, S., Park, J., et al. (2012). AtABCG29 is a monolignol transporter involved in lignin biosynthesis. Curr. Biol. 22, 1207–1212. doi: 10.1016/j.cub.2012.04.064
Anders, S., Pyl, P. T., Huber, W. (2015). HTSeq—a Python framework to work with high-throughput sequencing data. Bioinformatics 31, 166–169. doi: 10.1093/bioinformatics/btu638
Badmi, R., Payyavula, R. S., Bali, G., Guo, H.-B., Jawdy, S. S., Gunter, L. E., et al. (2018). A new calmodulin-binding protein expresses in the context of secondary cell wall biosynthesis and impacts biomass properties in populus. Front. Plant Sci. 9, 1669. doi: 10.3389/fpls.2018.01669
Barros, J., Serk, H., Granlund, I., Pesquet, E. (2015). The cell biology of lignification in higher plants. Ann. Bot. 115, 1053–1074. doi: 10.1093/aob/mcv046
Benjamini, Y., Hochberg, Y. (1995). Controlling the false discovery rate: a practical and powerful approach to multiple testing. J. R. Stat. Soc. Ser. B 57, 289–300. doi: 10.1111/j.2517-6161.1995.tb02031.x
Bellaoui, M., Pidkowich, M. S., Samach, A., Kushalappa, K., Kohalmi, S. E., Modrusan, Z., et al. (2001). The Arabidopsis BELL1 and KNOX TALE homeodomain proteins interact through a domain conserved between plants and animals. Plant Cell 13, 2455–70. doi: 10.1105/tpc.010161
Bischoff, V., Nita, S., Neumetzler, L., Schindelasch, D., Urbain, A., Eshed, R., et al. (2010). TRICHOME BIREFRINGENCE and its homolog AT5G01360 encode plant-specific DUF231 proteins required for cellulose biosynthesis in Arabidopsis. Plant Physiol. 153, 590–602. doi: 10.1104/pp.110.153320
Boyle, E. A., Li, Y. I., Pritchard, J. K. (2017). An expanded view of complex traits: from polygenic to omnigenic. Cell 169, 1177–1186. doi: 10.1016/j.cell.2017.05.038
Cai, B., Li, C.-H., Huang, J. (2014). Systematic identification of cell-wall related genes in Populus based on analysis of functional modules in co-expression network. PLoS One 9, e95176. doi: 10.1371/journal.pone.0095176
Cao, Y., Han, Y., Jin, Q., Lin, Y., Cai, Y. (2016). Comparative genomic analysis of the GRF genes in Chinese pear (Pyrus bretschneideri Rehd), poplar (Populous), grape (Vitis vinifera), Arabidopsis and rice (Oryza sativa). Front. Plant Sci. 7, 1–14. doi: 10.3389/fpls.2016.01750
Cassan-Wang, H., Goué, N., Saidi, M. N., Legay, S., Sivadon, P., Goffner, D., et al. (2013). Identification of novel transcription factors regulating secondary cell wall formation in Arabidopsis. Front. Plant Sci. 4, 1–14. doi: 10.3389/fpls.2013.00189
Climer, S., Yang, W., Fuentes, L., Dávila-Román, V. G., Gu, C. C. (2014). A custom correlation coefficient (CCC) approach for fast identification of multi-SNP association patterns in genome-wide SNPs data. Genet. Epidemiol. 38, 610–621. doi: 10.1002/gepi.21833
Danecek, P., Auton, A., Abecasis, G., Albers, C. A., Banks, E., DePristo, M. A., et al. (2011). The variant call format and VCFtools. Bioinformatics 27, 2156–2158. doi: 10.1093/bioinformatics/btr330
Ding, L., Yan, S., Jiang, L., Zhao, W., Ning, K., Zhao, J., et al. (2015). Hanaba taranu (han) Bridges meristem and organ primordia boundaries through Pinhead, jagged, blade-on-petiole2 and cytokinin oxidase 3 during flower development in Arabidopsis. PLoS Genet. 11, 1–23. doi: 10.1371/journal.pgen.1005479
Dobin, A., Davis, C. A., Schlesinger, F., Drenkow, J., Zaleski, C., Jha, S., et al. (2013). STAR: ultrafast universal RNA-seq aligner. Bioinformatics 29, 15–21. doi: 10.1093/bioinformatics/bts635
Du, J., Mansfield, S. D., Groover, A. T. (2009). The Populus homeobox gene ARBORKNOX2 regulates cell differentiation during secondary growth. Plant J. 60, 1000–1014. doi: 10.1111/j.1365-313X.2009.04017.x
Du, J., Miura, E., Robischon, M., Martinez, C., Groover, A. (2011). The Populus Class III HD ZIP transcription factor POPCORONA affects cell differentiation during secondary growth of woody stems. PLoS One 6, e17458. doi: 10.1371/journal.pone.0017458
Eddy, S. R. (1998). Profile hidden Markov models. Bioinformatics 14, 755–763. doi: 10.1093/bioinformatics/14.9.755
Eriksson, M. E., Israelsson, M., Olsson, O., Moritz, T. (2000). Increased gebberellin biosynthesis in transgenic trees promotes growth, biomass production and xylem fiber length. Nat. Biotechnol. 18, 784–788. doi: 10.1038/77355
Fisher, R. A. (1919). XV.—The correlation between relatives on the supposition of Mendelian inheritance. Trans. R. Soc. Edinburgh 52, 399–433. doi: 10.1017/S0080456800012163
Franco-Zorrilla, J. M., López-Vidriero, I., Carrasco, J. L., Godoy, M., Vera, P., Solano, R. (2014). DNA-binding specificities of plant transcription factors and their potential to define target genes. Proc. Natl. Acad. Sci. 111, 2367–2372. doi: 10.1073/pnas.1316278111
Furumizu, C., Alvarez, J. P., Sakakibara, K., Bowman, J. L. (2015). Antagonistic roles for KNOX1 and KNOX2 genes in patterning the land plant body plan following an ancient gene duplication. PLoS Genet. 11, 1–24. doi: 10.1371/journal.pgen.1004980
Gavrilov, Y., Benjamini, Y., Sarkar, S. K. (2009). An adaptive step-down procedure with proven FDR control under independence. Ann. Stat. 37, 619–629. doi: 10.1214/07-AOS586
Gonzalez, N., Vanhaeren, H., Inzé, D. (2012). Leaf size control: complex coordination of cell division and expansion. Trends Plant Sci. 17, 332–340. doi: 10.1016/j.tplants.2012.02.003
Goodstein, D. M., Shu, S., Howson, R., Neupane, R., Hayes, R. D., Fazo, J., et al. (2011). Phytozome: a comparative platform for green plant genomics. Nucleic Acids Res. 40, D1178–D1186. doi: 10.1093/nar/gkr944
Groover, A. T., Mansfield, S. D., DiFazio, S. P., Dupper, G., Fontana, J. R., Millar, R., et al. (2006). The Populus homeobox gene ARBORKNOX1 reveals overlapping mechanisms regulating the shoot apical meristem and the vascular cambium. Plant Mol. Biol. 61, 917–932. doi: 10.1007/s11103-006-0059-y
Guo, M., Thomas, J., Collins, G., Timmermans, M. C. P. (2008). Direct repression of KNOX loci by the asymmetric leaves1 complex of Arabidopsis. Plant Cell Online 20, 48–58. doi: 10.1105/tpc.107.056127
Haft, D. H., Loftus, B. J., Richardson, D. L., Yang, F., Eisen, J. A., Paulsen, I. T., et al. (2001). TIGRFAMs: a protein family resource for the functional identification of proteins. Nucleic Acids Res. 29, 41–43. doi: 10.1093/nar/29.1.41
Hamant, O., Pautot, V. (2010). Plant development: a tale story. Comptes Rendus Biol. 333, 371–381. doi: 10.1016/j.crvi.2010.01.015
Hao, Z., Mohnen, D. (2014). A review of xylan and lignin biosynthesis: foundation for studying Arabidopsis irregular xylem mutants with pleiotropic phenotypes. Crit. Rev. Biochem. Mol. Biol. 49, 212–241. doi: 10.3109/10409238.2014.889651
Hay, A., Tsiantis, M. (2010). KNOX genes: versatile regulators of plant development and diversity. Development 137, 3153–3165. doi: 10.1242/dev.030049
Hertzberg, M., Aspeborg, H., Schrader, J., Andersson, A., Erlandsson, R., Blomqvist, K., et al. (2001). A transcriptional roadmap to wood formation. Proc. Natl. Acad. Sci. 98, 14732–14737. doi: 10.1073/pnas.261293398
Hoe Kim, J., Tsukaya, H. (2015). Regulation of plant growth and development by the growth-regulating factor and grf-interacting factor duo. J. Exp. Bot. 66, 6093–6107. doi: 10.1093/jxb/erv349
Hussey, S. G., Mizrachi, E., Spokevicius, A. V., Bossinger, G., Berger, D. K., Myburg, A. A. (2011). SND2, a NAC transcription factor gene, regulates genes involved in secondary cell wall development in Arabidopsis fibres and increases fibre cell area in Eucalyptus. BMC Plant Biol. 11, 173. doi: 10.1186/1471-2229-11-173
Jasinski, S., Piazza, P., Craft, J., Hay, A., Woolley, L., Rieu, I., et al. (2005). Knox action in Arabidopsis is mediated by coordinate regulation of cytokinin and gibberellin activities. Curr. Biol. 15, 1560–1565. doi: 10.1016/j.cub.2005.07.023
Jiang, H., Lei, R., Ding, S.-W., Zhu, S. (2014). Skewer: a fast and accurate adapter trimmer for next-generation sequencing paired-end reads. BMC Bioinformatics 15, 182. doi: 10.1186/1471-2105-15-182
Jin, J., Tian, F., Yang, D.-C., Meng, Y.-Q., Kong, L., Luo, J., et al. (2017). PlantTFDB 4.0: toward a central hub for transcription factors and regulatory interactions in plants. Nucleic Acids Res. 45, D1040–D1045. doi: 10.1093/nar/gkw982
Jokipii-Lukkari, S., Delhomme, N., Schiffthaler, B., Mannapperuma, C., Prestele, J., Nilsson, O., et al. (2018). Transcriptional roadmap to seasonal variation in wood formation of Norway spruce. Plant Physiol. 176, 2851–2870. doi: 10.1104/pp.17.01590
Joshi, R., Wani, S. H., Singh, B., Bohra, A., Dar, Z. A., Lone, A. A., et al. (2016). Transcription factors and plants response to drought stress: current understanding and future directions. Front. Plant Sci. 7, 1029. doi: 10.3389/fpls.2016.01029
Joubert, W., Nance, J., Climer, S., Weighill, D., Jacobson, D. (2017). Parallel accelerated custom correlation coefficient calculations for genomics applications. Parallel Comput. 75, 130–145. doi: 10.1016/j.parco.2018.03.009
Kang, H. M., Sul, J. H., Service, S. K., Zaitlen, N. A., Kong, S., Freimer, N. B., et al. (2010). Variance component model to account for sample structure in genome-wide association studies. Nat. Genet. 42, 348–354. doi: 10.1038/ng.548
Kim, J.-S., Mizoi, J., Kidokoro, S., Maruyama, K., Nakajima, J., Nakashima, K., et al. (2012). Arabidopsis growth-regulating factor7 functions as a transcriptional repressor of abscisic acid- and osmotic stress-responsive genes, including DREB2A. Plant Cell 24, 3393–3405. doi: 10.1105/tpc.112.100933
Ko, J.-H., Jeon, H.-W., Kim, W.-C., Kim, J.-Y., Han, K.-H. (2014). The MYB46/MYB83-mediated transcriptional regulatory programme is a gatekeeper of secondary wall biosynthesis. Ann. Bot. 114, 1099–1107. doi: 10.1093/aob/mcu126
Kuijt, S. J. H., Greco, R., Agalou, A., Shao, J., Hoen, C. C. J., Overnas, E., et al. (2014). Interaction between the growth-regulating factor and knotted1-like homeobox families of transcription factors[W]. Plant Physiol. 164, 1952–1966. doi: 10.1104/pp.113.222836
Li, E., Bhargava, A., Qiang, W., Friedmann, M. C., Forneris, N., Savidge, R. A., et al. (2012a). The Class II KNOX gene KNAT7 negatively regulates secondary wall formation in Arabidopsis and is functionally conserved in Populus. New Phytol. 194, 102–115. doi: 10.1111/j.1469-8137.2011.04016.x
Li, H., Yang, Y., Wang, Z., Guo, X., Liu, F., Jiang, J., et al. (2016). BpMADS12 gene role in lignin biosynthesis of Betula platyphylla Suk by transcriptome analysis. J. For. Res. 27, 1111–1120. doi: 10.1007/s11676-016-0229-y
Li, Y., Jin, F., Chao, Q., Wang, B.-C. (2017). Proteomics analysis reveals the molecular mechanism underlying the transition from primary to secondary growth of poplar. J. Plant Physiol. 213, 1–15. doi: 10.1016/j.jplph.2017.02.009
Li, Y., Tschaplinski, T. J., Engle, N. L., Hamilton, C. Y., Rodriguez, M., Liao, J. C., et al. (2012b). Combined inactivation of the Clostridium cellulolyticum lactate and malate dehydrogenase genes substantially increases ethanol yield from cellulose and switchgrass fermentations. Biotechnol. Biofuels 5, 2. doi: 10.1186/1754-6834-5-2
Lin, Y.-C. J., Chen, H., Li, Q., Li, W., Wang, J. P., Shi, R., et al. (2017). Reciprocal cross-regulation of VND and SND multigene TF families for wood formation in Populus trichocarpa. Proc. Natl. Acad. Sci. 114, E9722–E9729. doi: 10.1073/pnas.1714422114
Liu, Y., Wei, M., Hou, C., Lu, T., Liu, L., Wei, H., et al. (2017). Functional characterization of Populus PsnSHN2 in coordinated regulation of secondary wall components in tobacco. Sci. Rep. 7, 1–11. doi: 10.1038/s41598-017-00093-z
Lofstead, J. F., Klasky, S., Schwan, K., Podhorszki, N., Jin, C. (2008). “Flexible IO and integration for scientific codes through the adaptable IO system (ADIOS),” in Proceedings of the 6th international workshop on Challenges of large applications in distributed environments - CLADE ‘08, vol. 15. (New York, New York, USA: ACM Press). doi: 10.1145/1383529.1383533
Lohse, M., Nagel, A., Herter, T., May, P., Schroda, M., Zrenner, R., et al. (2014). Mercator: a fast and simple web server for genome scale functional annotation of plant sequence data. Plant Cell Environ. 37, 1250–1258. doi: 10.1111/pce.12231
Lu, S., Li, Q., Wei, H., Chang, M.-J., Tunlaya-Anukit, S., Kim, H., et al. (2013). Ptr-miR397a is a negative regulator of laccase genes affecting lignin content in Populus trichocarpa. Proc. Natl. Acad. Sci. 110, 10848–10853. doi: 10.1073/pnas.1308936110
Macaya-Sanz, D., Chen, J. G., Kalluri, U. C., Muchero, W., Tschaplinski, T. J., Gunter, L. E., et al. (2017). Agronomic performance of Populus deltoides trees engineered for biofuel production. Biotechnol. Biofuels 10, 253. doi: 10.1186/s13068-017-0934-6
Maere, S., Heymans, K., Kuiper, M. (2005). BiNGO: a Cytoscape plugin to assess overrepresentation of Gene Ontology categories in biological networks. Bioinformatics 21, 3448–3449. doi: 10.1093/bioinformatics/bti551
McLeay, R. C., Bailey, T. L. (2010). Motif enrichment analysis: a unified framework and an evaluation on ChIP data. BMC Bioinformatics 11, 165. doi: 10.1186/1471-2105-11-165
Mele, G., Ori, N., Sato, Y., Hake, S. (2003). The knotted1-like homeobox gene BREVIPEDICELLUS regulates cell differentiation by modulating metabolic pathways. Genes Dev. 17, 2088–2093. doi: 10.1101/gad.1120003
Mizrachi, E., Verbeke, L., Christie, N., Fierro, A. C., Mansfield, S. D., Davis, M. F., et al. (2017). Network-based integration of systems genetics data reveals pathways associated with lignocellulosic biomass accumulation and processing. Proc. Natl. Acad. Sci. 114, 1195–1200. doi: 10.1073/pnas.1620119114
Muchero, W., Guo, J., DiFazio, S. P., Chen, J. G., Ranjan, P., Slavov, G. T., et al. (2015). High-resolution genetic mapping of allelic variants associated with cell wall chemistry in Populus. BMC Genomics 16, 24. doi: 10.1186/s12864-015-1215-z
Mukherjee, K., Brocchieri, L., Bürglin, T. R. (2009). A comprehensive classification and evolutionary analysis of plant homeobox genes. Mol. Biol. Evol. 26, 2775–2794. doi: 10.1093/molbev/msp201
Nakano, Y., Yamaguchi, M., Endo, H., Rejab, N. A., Ohtani, M. (2015). NAC-MYB-based transcriptional regulation of secondary cell wall biosynthesis in land plants. Front. Plant Sci. 6, 1–18. doi: 10.3389/fpls.2015.00288
Ohtani, M., Nishikubo, N., Xu, B., Yamaguchi, M., Mitsuda, N., Goué, N., et al. (2011). A NAC domain protein family contributing to the regulation of wood formation in poplar. Plant J. 67, 499–512. doi: 10.1111/j.1365-313X.2011.04614.x
Omidbakhshfard, M. A., Proost, S., Fujikura, U., Mueller-Roeber, B. (2015). Growth-regulating factors (GRFs): a small transcription factor family with important functions in plant biology. Mol. Plant 8, 998–1010. doi: 10.1016/j.molp.2015.01.013
Park, M. Y., Kang, J. Y., Kim, S. Y. (2011). Overexpression of AtMYB52 confers ABA hypersensitivity and drought tolerance. Mol. Cells 31, 447–454. doi: 10.1007/s10059-011-0300-7
Peterson, C. B., Bogomolov, M., Benjamini, Y., Sabatti, C. (2016). Many phenotypes without many false discoveries: error controlling strategies for multitrait association studies. Genet. Epidemiol. 40, 45–56. doi: 10.1002/gepi.21942
Pomiès, L., Decourteix, M., Franchel, J., Moulia, B., Leblanc-Fournier, N. (2017). Poplar stem transcriptome is massively remodelled in response to single or repeated mechanical stimuli. BMC Genomics 18, 300. doi: 10.1186/s12864-017-3670-1
Porth, I., Klápště, J., Skyba, O., Friedmann, M. C., Hannemann, J., Ehlting, J., et al. (2013). Network analysis reveals the relationship among wood properties, gene expression levels and genotypes of natural Populus trichocarpa accessions. New Phytol. 200, 727–742. doi: 10.1111/nph.12419
Punta, M., Coggill, P. C., Eberhardt, R. Y., Mistry, J., Tate, J., Boursnell, C., et al. (2011). The Pfam protein families database. Nucleic Acids Res. 40, D290–D301. doi: 10.1093/nar/gkr1065
Purcell, S., Neale, B., Todd-Brown, K., Thomas, L., Ferreira, M. A. R., Bender, D., et al. (2007). PLINK: a tool set for whole-genome association and population-based linkage analyses. Am. J. Hum. Genet. 81, 559–575. doi: 10.1086/519795
Puzey, J. R., Karger, A., Axtell, M., Kramer, E. M. (2012). Deep annotation of Populus trichocarpa micrornas from diverse tissue sets. PLoS One 7, e33034. doi: 10.1371/journal.pone.0033034
Rao, X., Dixon, R. A. (2018). Current models for transcriptional regulation of secondary cell wall biosynthesis in grasses. Front. Plant Sci. 9, 399. doi: 10.3389/fpls.2018.00399
Sannigrahi, P., Ragauskas, A. J., Tuskan, G. A. (2010). Poplar as a feedstock for biofuels: a review of compositional characteristics Poulomi. Biofuels Bioprod. Biorefining 4, 209–226. doi: 10.1002/bbb.206
Schrader, J. (2004). A high-resolution transcript profile across the wood-forming meristem of poplar identifies potential regulators of cambial stem cell identity. Plant Cell Online 16, 2278–2292. doi: 10.1105/tpc.104.024190
Shannon, P., Markiel, A., Ozier, O., Baliga, N. S., Wang, J. T., Ramage, D., et al. (2003). Cytoscape: a software environment for integrated models of biomolecular interaction networks. Genome Res. 13, 2498–2504. doi: 10.1101/gr.1239303
Shi, R., Wang, J. P., Lin, Y.-C., Li, Q., Sun, Y.-H., Chen, H., et al. (2017). Tissue and cell-type co-expression networks of transcription factors and wood component genes in Populus trichocarpa. Planta 245, 927–938. doi: 10.1007/s00425-016-2640-1
Taylor-Teeples, M., Lin, L., De Lucas, M., Turco, G., Toal, T. W., Gaudinier, A., et al. (2015). An Arabidopsis gene regulatory network for secondary cell wall synthesis. Nature 517, 571. doi: 10.1038/nature14099
Tschaplinski, T. J., Standaert, R. F., Engle, N. L., Martin, M. Z., Sangha, A. K., Parks, J. M., et al. (2012). Down-regulation of the caffeic acid O-methyltransferase gene in switchgrass reveals a novel monolignol analog. Biotechnol. Biofuels 5, 71. doi: 10.1186/1754-6834-5-71
Tuskan, G. A., Difazio, S., Jansson, S., Bohlmann, J., Grigoriev, I., Hellsten, U., et al. (2006). The genome of black cottonwood, Populus trichocarpa (Torr. & Gray). Science (80-.). 313, 1596–1604. doi: 10.1126/science.1128691
Van Dongen, S. (2008). Graph clustering via a discrete uncoupling process. SIAM J. Matrix Anal. Appl. 30, 121–141. doi: 10.1137/040608635
Vining, K. J., Pomraning, K. R., Wilhelm, L. J., Priest, H. D., Pellegrini, M., Mockler, T. C., et al. (2012). Dynamic DNA cytosine methylation in the Populus trichocarpa genome: tissue-level variation and relationship to gene expression. BMC Genomics 13, 27. doi: 10.1186/1471-2164-13-27
Wang, J., Yan, D. W., Yuan, T. T., Gao, X., Lu, Y. T. (2013). A gain-of-function mutation in IAA8 alters Arabidopsis floral organ development by change of jasmonic acid level. Plant Mol. Biol. 82, 71–83. doi: 10.1007/s11103-013-0039-y
Wang, S., Li, E., Porth, I., Chen, J.-G., Mansfield, S. D., Douglas, C. J. (2014). Regulation of secondary cell wall biosynthesis by poplar R2R3 MYB transcription factor PtrMYB152 in Arabidopsis. Sci. Rep. 4, 5054. doi: 10.1038/srep05054
Weighill, D., Jones, P., Shah, M., Ranjan, P., Muchero, W., Schmutz, J., et al. (2018). Pleiotropic and epistatic network-based discovery: integrated networks for target gene discovery. Front. Energy Res. 6, 30. doi: 10.3389/fenrg.2018.00030
Xie, M., Muchero, W., Bryan, A. C., Yee, K. L., Guo, H., Zhang, J., et al. (2018a). A 5-enolpyruvylshikimate 3-phosphate synthase functions as a transcriptional repressor in Populus. Plant Cell 30, 1645–1660. doi: 10.1105/tpc.18.00168
Xie, M., Zhang, J., Tschaplinski, T. J., Tuskan, G. A., Chen, J.-G., Muchero, W. (2018b). Regulation of lignin biosynthesis and its role in growth-defense tradeoffs. Front. Plant Sci. 9, 1427. doi: 10.3389/fpls.2018.01427
Yang, X., Ye, C.-Y., Bisaria, A., Tuskan, G. A., Kalluri, U. C. (2011). Identification of candidate genes in Arabidopsis and Populus cell wall biosynthesis using text-mining, co-expression network analysis and comparative genomics. Plant Sci. 181, 675–687. doi: 10.1016/j.plantsci.2011.01.020
Yu, L., Chen, H., Sun, J., Li, L. (2013). PtrKOR1 is required for secondary cell wall cellulose biosynthesis in Populus. Tree Physiol. 34, 1289–1300. doi: 10.1093/treephys/tpu020
Zhan, X., Hu, Y., Li, B., Abecasis, G. R., Liu, D. J. (2016). RVTESTS: an efficient and comprehensive tool for rare variant association analysis using sequence data. Bioinformatics 32, 1423–1426. doi: 10.1093/bioinformatics/btw079
Zhang, J., Yang, Y., Zheng, K., Xie, M., Feng, K., Jawdy, S. S., et al. (2018). Genome-wide association studies and expression-based quantitative trait loci analyses reveal roles of HCT2 in caffeoylquinic acid biosynthesis and its regulation by defense-responsive transcription factors in Populus. New Phytol. 220, 502–516. doi: 10.1111/nph.15297
Zhong, R., Lee, C., Zhou, J., McCarthy, R. L., Ye, Z.-H. (2008). A battery of transcription factors involved in the regulation of secondary cell wall biosynthesis in Arabidopsis. Plant Cell Online 20, 2763–2782. doi: 10.1105/tpc.108.061325
Keywords: lines of evidence, cell wall, regulation, Genome Wide Association Study, candidate gene identification, network analysis, multi-omic, Populus trichocarpa
Citation: Furches A, Kainer D, Weighill D, Large A, Jones P, Walker AM, Romero J, Gazolla JGFM, Joubert W, Shah M, Streich J, Ranjan P, Schmutz J, Sreedasyam A, Macaya-Sanz D, Zhao N, Martin MZ, Rao X, Dixon RA, DiFazio S, Tschaplinski TJ, Chen J-G, Tuskan GA and Jacobson D (2019) Finding New Cell Wall Regulatory Genes in Populus trichocarpa Using Multiple Lines of Evidence. Front. Plant Sci. 10:1249. doi: 10.3389/fpls.2019.01249
Received: 15 February 2019; Accepted: 09 September 2019;
Published: 08 October 2019.
Edited by:
Mathew G. Lewsey, La Trobe University, AustraliaReviewed by:
Jennifer R. Bromley, British American Tobacco (United Kingdom), United KingdomAmy Marshall-Colon, University of Illinois at Urbana-Champaign, United States
Copyright © 2019 Furches, Kainer, Weighill, Large, Jones, Walker, Romero, Gazolla, Joubert, Shah, Streich, Ranjan, Schmutz, Sreedasyam, Macaya-Sanz, Zhao, Martin, Rao, Dixon, DiFazio, Tschaplinski, Chen, Tuskan and Jacobson. This is an open-access article distributed under the terms of the Creative Commons Attribution License (CC BY). The use, distribution or reproduction in other forums is permitted, provided the original author(s) and the copyright owner(s) are credited and that the original publication in this journal is cited, in accordance with accepted academic practice. No use, distribution or reproduction is permitted which does not comply with these terms.
*Correspondence: Daniel Jacobson, jacobsonda@ornl.gov
†These authors have contributed equally to this work