 Fizza Fatima1,2
 Brent D. McCallum3
 Curtis J. Pozniak4
 Colin W. Hiebert3
 Curt A. McCartney3
 George Fedak1
 Frank M. You1
 Sylvie Cloutier1,2*
- 1Ottawa Research and Development Centre, Agriculture and Agri-Food Canada, Ottawa, ON, Canada
- 2Department of Biology, University of Ottawa, Ottawa, ON, Canada
- 3Morden Research and Development Centre, Agriculture and Agri-Food Canada, Ottawa, ON, Canada
- 4Crop Development Centre, University of Saskatchewan, Saskatoon, SK, Canada
Leaf rust caused by Puccinia triticina is the most widespread rust disease of wheat. As pathogen populations are constantly evolving, identification of novel sources of resistance is necessary to maintain disease resistance and stay ahead of this plant-pathogen evolutionary arms race. The wild genepool of wheat is a rich source of genetic diversity, accounting for 44% of the Lr genes identified. Here we performed a genome-wide association study (GWAS) on a diverse germplasm of 385 accessions, including 27 different Triticum and Aegilops species. Genetic characterization using the wheat 90 K array and subsequent filtering identified a set of 20,501 single nucleotide polymorphic (SNP) markers. Of those, 9,570 were validated using exome capture and mapped onto the Chinese Spring reference sequence v1.0. Phylogenetic analyses illustrated four major clades, clearly separating the wild species from the T. aestivum and T. turgidum species. GWAS was conducted using eight statistical models for infection types against six leaf rust isolates and leaf rust severity rated in field trials for 3–4 years at 2–3 locations in Canada. Functional annotation of genes containing significant quantitative trait nucleotides (QTNs) identified 96 disease-related loci associated with leaf rust resistance. A total of 21 QTNs were in haplotype blocks or within flanking markers of at least 16 known Lr genes. The remaining significant QTNs were considered loci that putatively harbor new Lr resistance genes. Isolation of these candidate genes will contribute to the elucidation of their role in leaf rust resistance and promote their usefulness in marker-assisted selection and introgression.
Introduction
Triticum aestivum, commonly known as bread wheat, is an allohexaploid (AABBDD) species, created through the sequential hybridization of three grass species: T. urartu (AA), a species (BB) closely related to Aegilops speltoides (SS) and Aegilops tauschii (DD) (McFadden and Sears, 1946). Genetic diversity bottlenecks such as polyploidization, domestication, and natural and artificial selections have reduced diversity in modern wheat, and consequently increased its vulnerability to diseases, pests and environmental stresses (Tanksley and McCouch, 1997).
Leaf rust caused by Puccinia triticina is the most prevalent wheat rust disease, causing tremendous annual yield losses. Puccinia triticina attacks the foliage, covering its surface and thus causing loss of photosynthates, dehydration and early defoliation. Genetic resistance combatting yield losses can be categorized into seedling resistance and adult plant resistance (APR). Typically, seedling resistance is controlled by single major effect genes that confer hypersensitive and other responses, causing necrosis and preventing the pathogen from spreading (Dyck and Kerber, 1985). APR occurs at a post-seedling stage and confers either a race-specific or a quantitative race non-specific response (Dyck and Kerber, 1985; Samborski, 1985).
To date, 66 leaf rust resistance (Lr) genes have been characterized, six of which, namely Lr1 (Cloutier et al., 2007), Lr10 (Feuillet et al., 2003), Lr21 (Huang et al., 2003), Lr22a (Thind et al., 2017), Lr34 (Krattinger et al., 2009) and Lr67 (Moore et al., 2015), have been isolated. The majority of the Lr genes described to date confer seedling-type resistance. Well-known APR genes include the race-specific Lr12 (Dyck et al., 1966) and Lr13 (Dyck et al., 1966) and the race non-specific Lr34 (Dyck, 1977) and Lr67 (Hiebert et al., 2010). Of the 66 Lr genes designated to date, 37 were identified in T. aestivum and T. turgidum and 29 originated from progenitors and other wild relative species such as A. tauschii, A. speltoides, A. neglecta, and A. peregrina, among others (McCallum et al., 2012; USDA, 2017).
The traditional approach for introgressing Lr genes into adapted germplasm is by interspecific crossing a donor line to an adapted line followed by backcrossing. Although many Lr genes have been described, few are utilized by present-day breeders because they have either been overcome by virulence changes in the pathogen populations, are not in an adapted background or suffer from linkage drag. Modern approaches, such as gene cassettes and genome editing may overcome some of the disadvantages of the crossing method and have been proposed to provide long-lasting broad spectrum resistance (Keller et al., 2016; Arora et al., 2019). However, commercialization of transgenic wheat has not received broad acceptance and introgression via crossing remains commonly used.
Identification of novel sources of resistance in the cultivated and the wild genepools of wheat is expected to contribute to broadening and maintaining the genetic base of leaf rust resistance. Array-based SNP genotyping platforms provide fast and cost-effective access to genetic variation in a diverse germplasm. In wheat, the Illumina’s Infinium iSelect and Affimetrix’s Axiom array technologies enable simultaneous genotyping of 9,000 to 819,571 SNP markers (Cavanagh et al., 2013; Winfield et al., 2016). Genome-wide association studies (GWAS) associate such genotypic data to phenotypic data to identify significant marker-trait associations. To date, numerous quantitative trait loci (QTL) associated with leaf rust resistance in elite cultivars and landraces of bread and durum wheat have been discovered (Aoun et al., 2016; Gao et al., 2016; Riaz et al., 2018). These QTL were identified based on traditional single-locus GWAS models whose inherent limitations, such as failure to capture complex traits controlled by multiple loci, are now widely recognized (Segura et al., 2012). Multi-locus GWAS models overcome these drawbacks by performing a multi-dimensional genome scan, and measuring the effects of multiple SNPs simultaneously to identify small-effect loci for complex traits (Wen et al., 2018). As multi-locus association methodologies are recent, few have been reported in wheat and the potential for multi-locus GWAS covering a diverse range of cultivated wheat and wild relatives remains largely untested.
Here, we performed a GWAS for leaf rust severity and reaction types against six P. triticina isolates in a highly diverse germplasm of 385 accessions. The wheat 90 K array was used to capture the genetic variation in cultivated wheats, progenitor species, synthetic hexaploid wheats (SHWs) and wild relatives (Wang et al., 2014). We used one single-locus and seven multi-locus models to identify quantitative trait nucleotides (QTNs) which were mapped on the reference genome, thus validating known loci and identifying new loci to be mined for novel candidate leaf rust resistance genes.
Materials and Methods
Plant Materials
A diverse collection of 385 accessions, encompassing 27 different species of cultivated wheats, SHWs, progenitor species and wild relatives were used in this study (Supplementary Table S1). The AB and ABD genomes are represented by 170 accessions representing T. vavilovii and several subspecies of T. turgidum and T. aestivum as well as 65 primary SHWs. The A, B and D genome progenitors (or their closely related species) and the non-domesticated forms of tetraploid wheat comprised 93 accessions of T. urartu (A), T. monococcum (Am), Ae. tauschii (D), Ae. speltoides (S), as well as T. turgidum ssp. dicoccon and dicoccoides (AB). Another 47 accessions belonged to the following Aegilops species: Ae. bicornis (Sb), Ae. longissima (Sl), Ae. searsii (Ss), Ae. sharonensis (Ssh), Ae. markgrafii (C), Ae. comosa (M), Ae. umbellulata (U), Ae. geniculata (MU), Ae. peregrina (SU), Ae. triuncialis (UC/CU), Ae. columnaris (UM), Ae. cylindrica (DC), Ae. crassa (DM/DDM), Ae. juvenalis (DMU), Ae. biuncialis and Ae. neglecta (UM/UMN). The collection also contained six accessions of T. timopheevii (AtG), five of T. zhukovskyi (GAAm), and one of Haynaldia villosa (V), a related grass species. Overall, the germplasm consisted of 75 diploid, 136 tetraploid, 165 hexaploid and nine accessions that could be either tetraploid or hexaploid. The species names and genome symbols are according to Kimber and Tsunewaki (1988).
Seed Increase
Seeds were planted and grown under controlled conditions at the Ottawa Research and Development Centre (RDC), Agriculture and Agri-Food Canada (AAFC) (Ottawa, Canada). Depending on their growth habit, the seeds were divided into spring and winter panels. For the spring panel, the growth conditions were 20°C/16 h light, and 16°C/8 h dark. The winter panel was grown under the same conditions for approximately three weeks, i.e., the 4–5 leaf stage, at which time they were transferred to a vernalization cabinet (constant 2°C/12 h photoperiod) for ten weeks to trigger meristem differentiation prior to being returned to the original growing conditions. Seeds harvested from all accessions were used for the greenhouse and field experiments described below.
Leaf Rust Race-Specific Response
Consecutive inoculations with six P. triticina isolates were performed for 360 accessions of the panels (Supplementary Table S2). All tests were performed under controlled greenhouse conditions at the Morden RDC, AAFC (Morden, Canada). Briefly, test lines and the Thatcher and Emerson check lines were sown into fiber trays at a rate of approximately 5 seeds per clump and 3 cm between clumps, which were inoculated with individual P. triticina isolates at the two-leaf stage as described by McCallum and Seto-Goh (2006). The isolates tested were 12-3 MBDS, 128-1 MBRJ, 74-2 MGBJ, 11-180-1 TDBG, 06-1-1 TDBG, and 77-2 TJBJ, which represent the prevalent leaf rust race groups across Canada (McCallum et al., 2016). Virulence and avirulence formulas for these isolates are given (Supplementary Table S3). For simplicity, these will be referred to as MBDS, MBRJ, MGBJ, TDBG1, TDBG2, and TJBJ, respectively. Infection type (IT) was rated 12 days post-inoculation using a 0–4 scale (Stakman et al., 1962), where “;” = hypersensitive flecks, “0” = no uredinia or macroscopic sign of infection, “1” = small uredinia with necrosis, “2” = small to medium uredinia with chlorosis, “3” = medium uredinia without chlorosis or necrosis, “4” = large uredinia without chlorosis or necrosis. IT “;” and “0” to “2” were considered resistant, while “3” and “4” were considered susceptible (Long and Kolmer, 1989). The “+” or “−” IT qualifiers indicate larger or smaller than average uredinia, respectively. The “ = ” IT qualifier represents the lower size limit of the uredinia for the IT (Long and Kolmer, 1989). Plants with randomly distributed uredinia of variable sizes, or mesothetic response, were considered resistant and were rated with an “X” IT (Roelfs and Martens, 1988).
For downstream analysis, the IT scores were converted into a 1–9 linear scale, where “0/0;/;” = 1, “;1 = /;1-” = 2, “1-/1/1+” = 3, “;12/1-2-” = 4, “2-/2/2+” = 5, “X” = 6, “3-/3/3+” = 7, “3+4/34” = 8, and “4” = 9 (Supplementary Table S2B). Scores 1–6 were considered resistant and 7–9 susceptible.
Field Leaf Rust Severity
Phenotyping of rust severity was performed in separate field trials for the spring and winter panels. The spring panel included 213 accessions, of which 20 were SHWs, while the remaining were subspecies of T. aestivum and T. turgidum. Trials for the spring panel were carried out in Morden, Manitoba, Canada (2016–2019), Ottawa, Ontario, Canada (2017–2019) and Saskatoon, Saskatchewan, Canada (2019). The winter panel comprised 164 diverse Aegilops and Triticum species, including 115 progenitors and wild relatives, 45 SHWs, and four winter wheat cultivars. Screening for the winter panel was performed in Morden (2017–2019) and in Ottawa (2017 and 2019).
For each panel, year and location, a completely randomized design with two replicates was used, except for the 2016 Morden field trial where a single replicate was used due to the limited seed availability in the first year. For the spring panel, 65 seeds/accession were planted in 1 m-long rows with 20 cm between rows. A mixture of P. triticina isolates was inoculated onto spreader rows of susceptible lines Thatcher, Morocco, and Little Club, planted every six test rows in Morden and every ten in Saskatoon. The mixture of isolates comprised more than 50 different virulence phenotypes representing the P. triticina population in western Canada identified during the annual virulence survey. In Ottawa, infection relied on natural inoculum but used the same interspersed spreader-row design as Morden with the Morocco spreader. Cultivars Thatcher, Roblin and Eurostar were used as checks and five plots of each were randomly distributed across each replicate.
For the winter panel, ten seeds/accession were planted indoors in early March at both Morden and Ottawa RDCs. At the 3–5 leaf stage, the plants were transferred into vernalization chambers as described above. Approximately ten days after planting the spreader-rows, the vernalized plantlets were transplanted as hills in the field. The cultivar Emerson served as a check. At peak infection and prior to senescence, the flag leaves were rated for leaf rust severity using a modified Cobb’s scale (Peterson et al., 1948).
Leaf rust severity ratings across locations and years were modeled using the R package Lme4 (Bates et al., 2014) with the following mixed linear model (MLM) equation: y = lmer(Severity ∼ Location + (1| Genotype) + (1| Year) + (1| Genotype:Location) + (1| Genotype:Year:Location)). In this model, location was considered a fixed effect, while year, genotype and interaction were considered random. The lmerTest package was used to generate an ANOVA-like table for the random effects and calculate P-values from the Satterthwaite’s t-tests for the fixed effect (Kuznetsova et al., 2017). Best linear unbiased predictors (BLUP) estimates, also known as conditional means, were extracted for the random effects to account for environmental deviations and provide more precise estimates of phenotypic values (Supplementary Table S4) (Mi et al., 2011; Wang et al., 2017).
Genotyping and SNP Filtering
Young leaf tissue (75–100 mg) from the germplasm grown in growth chambers was sampled at the 4–5 leaf stage. The DNA was extracted using the DNeasy Plant kit (Qiagen, Valencia, CA, United States) and quantified using the Quant-it PicoGreen kit (Thermo Fisher, Waltham, MA, United States). Genotyping was performed using the wheat 90 K array (Illumina, San Diego, CA, United States) on the iScan instrument (Wang et al., 2014).
Genotype calling was performed for the entire collection using the default genotyping module, and separately for the different ploidy levels using the polyploidy module in GenomeStudio software v2.0.4 (Illumina). The tetraploid and hexaploid sets also included the nine accessions of unknown ploidy. The SNP markers with <80% missing data, <5% minor allele frequency (MAF), and >5% heterozygosity were removed. For the polyploid module, markers with >3 clusters were also removed (Hourcade et al., 2019).
SNP Validation
To validate the filtered SNP dataset, we used an exome dataset obtained from 136 accessions of the panels. First, the position of the SNP markers in the protein coding regions of the Chinese Spring (CS) reference genome v1.0 was obtained by mapping the SNP probe sequences of the wheat Infinium array to “161010_Chinese_Spring_v1.0_gene_sequences_for_exome.fasta” which corresponds to the exome sequence of all the high-confidence annotated genes of the CS reference sequence and their 5 Kb upstream and downstream sequences (Wang et al., 2014; IWGSC, 2018). The SNP probes were aligned to the indexed exome reference sequence using the MEM-BWA algorithm (v0.7.12, http://bio-bwa.sourceforge.net/). As BWA does not accept IUPAC letter codes, two sequences were used for each SNP probe, where one had allele A and the other allele B. Samtools (v1.3, http://samtools.sourceforge.net/) was used to generate and sort the BAM file alignment. The positions of the mapped SNPs were extracted using BBMap (v.38.43 https://sourceforge.net/projects/bbmap/). The mapped SNP probes were filtered using R to remove the misaligned probes, i.e., those for which the A and B allele sequences aligned to different chromosomal positions. The coordinates of the mapped markers were converted to their actual positions on the CS reference genome v1.0 (IWGSC, 2018).
Upon mapping of the SNP markers, the genotyping dataset was re-filtered with the following updated criteria: markers with <80% of χi missing data, <5% MAF, and >5% heterozygosity were removed, where χi is the proportion of each sub-genome represented in the germplasm. This less stringent criterion ensures retention of SNPs from underrepresented sub-genomes. The positions of the filtered SNPs from the wheat 90 K array was compared to the variant call results of the exome-sequence data obtained from 136 of the 385 accessions. The exome sequencing data were obtained using the Nimblegen SeqCap EZ wheat exome design (120426_Wheat_WEC_D02, https://sequencing.roche. com/en/products-solutions/by-category/target-enrichment/shar eddesigns.html). Raw reads were mapped to the same exome reference genome using the BWA-Samtools pipeline, and variant calling was performed using Bcftools (v1.3, https:// samtools.github.io/bcftools/bcftools.html). SNPs common between the filtered wheat 90 K array and the exome capture datasets were identified using Bcftools.
Phylogenetic Relationships, Population Structure and Kinship
To illustrate evolutionary relationships between the species in the collection, the filtered set of SNPs was used to perform a phylogenetic analysis. A maximum likelihood (ML) tree was generated with 1,000 bootstrap iterations using the default parameters of MEGA-CC (Nearest-Neighbor-Interchange heuristic and Tamura-Nei models) (Kumar et al., 2012). The tree was graphically displayed using iTol v3 (Letunic and Bork, 2016). Principal component analyses (PCAs) were performed using the filtered set of SNPs for each ploidy level and the results were displayed using the R package ggbiplot (https://github.com/vqv/ggbiplot).
Population structure analyses were carried out using the R packages LEA (Frichot and François, 2015) and PCAdapt (Luu et al., 2017), as well as the software Admixture v1.3 (Alexander et al., 2009). Both LEA and PCAdapt estimate structure using PCA-based methods. The proportion of variance explained by each PC was graphically illustrated in the form of scree plots. The “knee” in the scree plot (Cattell’s rule) was used to determine the number of sub-populations. Admixture is an ML-based approach which uses cross-validation to approximate the K number of sub-populations (Alexander and Lange, 2011). Cross-validation errors for K = 2–30 were graphically illustrated using R and the value of K was selected using the rule described above. The approximate number of sub-populations was selected based on the congruity between the plots. The SNMF approach in LEA was used to visualize ancestry proportions in the Q matrix through structure plots. The kinship coefficient matrix was generated using Tassel v5.0 (Bradbury et al., 2007).
Genome-Wide Association Analysis
GWAS was conducted for race-specific response and leaf rust severity rated in the field. For the race-specific response, the converted IT scores for each isolate were considered as individual traits. For leaf rust severity, genotypic and location-specific BLUP estimates were used as phenotypic inputs, where the former summarizes the severity ratings across all locations and years, and the latter represents the severity ratings separately for each location.
GWAS was performed using one single-locus and seven multi-locus models. The MLM in Tassel v5.0 (Bradbury et al., 2007) was used for single-locus association analysis. Here, population structure and kinship were accounted for using Tassel-generated Q matrix for K principle components and the Tassel-generated kinship matrix. The P-values were adjusted using the false discovery rate (FDR) (Benjamini and Hochberg, 1995). QTNs with FDR (False discovery rate) -adjusted P-values < 0.05 were considered significant.
Of the seven multi-locus models, the six from the R package mrMLM (Wen et al., 2018) were mrMLM (Wang et al., 2016), FASTmrMLM (Tamba and Zhang, 2018), FASTmrEMMA (Wen et al., 2018), pLARmEB (Wang et al., 2016), pKWmEB (Ren et al., 2018) and ISIS EM-BLASSO (Tamba et al., 2017). As the mrMLM package does not have built-in support for calculating covariates, the Q matrix generated by Admixture and the Tassel-generated kinship matrix were used to account for population structure and kinship, respectively. The seventh multi-locus model, RTM-GWAS, first grouped SNPs into linkage disequilibrium blocks (SNPLDBs) and then utilized a restricted two-stage multi-locus analysis for QTL identification (He et al., 2017). Here, population structure was accounted for by the RTM-generated covariate matrix and kinship and by the Tassel-generated kinship matrix. As with the single-locus MLM, the P-values of QTNs from all the multi-locus models used the same FDR-adjusted threshold. Allelic effect of QTNs was determined using the Kruskal–Wallis statistics to test the phenotypic variation of the associated traits between homozygous alleles.
In silico Annotation of Significant Markers
Because only markers that aligned to the exome sequence of the CS reference genome v1.0 were used for the association analyses, all significant QTNs were within or close to high-confidence annotated genes. Transcript IDs of the genes containing the significant QTNs were used to extract the protein products using EnsemblPlants1 (Kersey et al., 2016; IWGSC, 2018). For significant SNPLDBs detected by RTM-GWAS that contained multiple SNPs, annotation was carried out for the first and last SNP marker of each SNPLDB.
Positioning Lr Genes and QTNs Onto the Wheat Reference Sequence
Sequences coding for the six previously cloned Lr genes were retrieved from GenBank and mapped against the CS reference sequence v1.0 (IWGSC, 2018) using default BLASTn parameters on the GrainGenes website2. Through the same exercise, sequences of flanking or co-segregating markers were also mapped onto the reference genome so that a total of 55 of the 66 Lr genes were positioned (Supplementary Table S5). A physical map of previously cloned or mapped Lr genes was constructed using the R package KaryoploteR (Gel and Serra, 2017). Linkage between the QTNs detected and known Lr genes, or their markers, was determined using haplotype block analysis. The SNP dataset was split into haplotype blocks using the R package gpart (Kim et al., 2019) and pairwise linkage disequilibrium between the SNPs was calculated using Tassel v5.0 (Bradbury et al., 2007). Known Lr genes and QTNs within the same haplotype block were considered linked, while the relationship between those in neighboring blocks was determined by comparing D’ statistics between the blocks.
Results
Race-Specific Resistance
IT response against six P. triticina isolates (MBDS, MBRJ, MGBJ, TDBG1, TDBG2, and TJBJ) was evaluated in the greenhouse for 360 accessions. Of these, 156, 171, 173, 177, 209 and 206 accessions were resistant (IT rating < 3, linear score < 7) to isolates MBDS, MBRJ, MGBJ, TJBJ, TDBG1 and TDBG2, respectively (Supplementary Table S2 and Supplementary Figure S1). The resistant accessions included 85–131 SHW and cultivated species, 44–56 progenitors and 25–32 wild relatives. Overall, a total of 102 accessions were resistant to all six isolates, and another 153 to at least five isolates.
Field Resistance
Phenotypic variation across the different environments was modeled. For both spring and winter panels, the year effect explained the smallest proportion of the variance with 2.1% and 0.31% for each panel, respectively, while the largest proportion was accounted for by the genotype effect with 43.0% and 60.2%, respectively (Supplementary Table S6). The P-values from Satterthwaite’s t-tests were <0.005 for all location effects and the genotype-location interaction explained 16.7% and 21.1% of the variation in the spring and winter panels, respectively. The genotypic and location-specific BLUP estimates were extracted from the models and compared to raw aggregate genotypic and location-specific mean values. A linear relationship was observed between the raw mean values and BLUP estimates (Supplementary Figures S2A,B). However, due to the inherent nature of BLUP estimation to shrink outliers to the mean, the interquartile ranges (Q3-Q1) of location-specific BLUP estimates were smaller than the raw mean values (Supplementary Figures S2C–F).
In the spring panel, 73 accessions were rated resistant (average severity <10%) and 70 were moderately resistant (11–30% average severity) (Supplementary Figure S3A). The majority of the moderately resistant to resistant accessions belonged to the subspecies of T. turgidum (Supplementary Table S7A). In the winter panel, respectively, 90 and 38 accessions were rated resistant and moderately resistant; these included 52 progenitors, 36 wild relatives and 12 SHWs (Supplementary Table S7B and Figure S3B). These distributions, however, standardized, were also reflected in the genotypic BLUP estimates calculated for each panel (Supplementary Figures S3C,D).
SNP Filtering, Mapping and Validation
A total of 27,418 SNPs from the 385 accessions had a call rate > 80%, of these, 20,501 had a MAF >5% and a maximum heterozygosity <5%. Genotype calling and filtering performed separately for the three ploidy levels yielded 34,614 SNPs in the hexaploid, 24,142 in the tetraploid and 15,364 in the diploid datasets. Shared and private SNPs between the three ploidy levels are illustrated (Figure 1A).
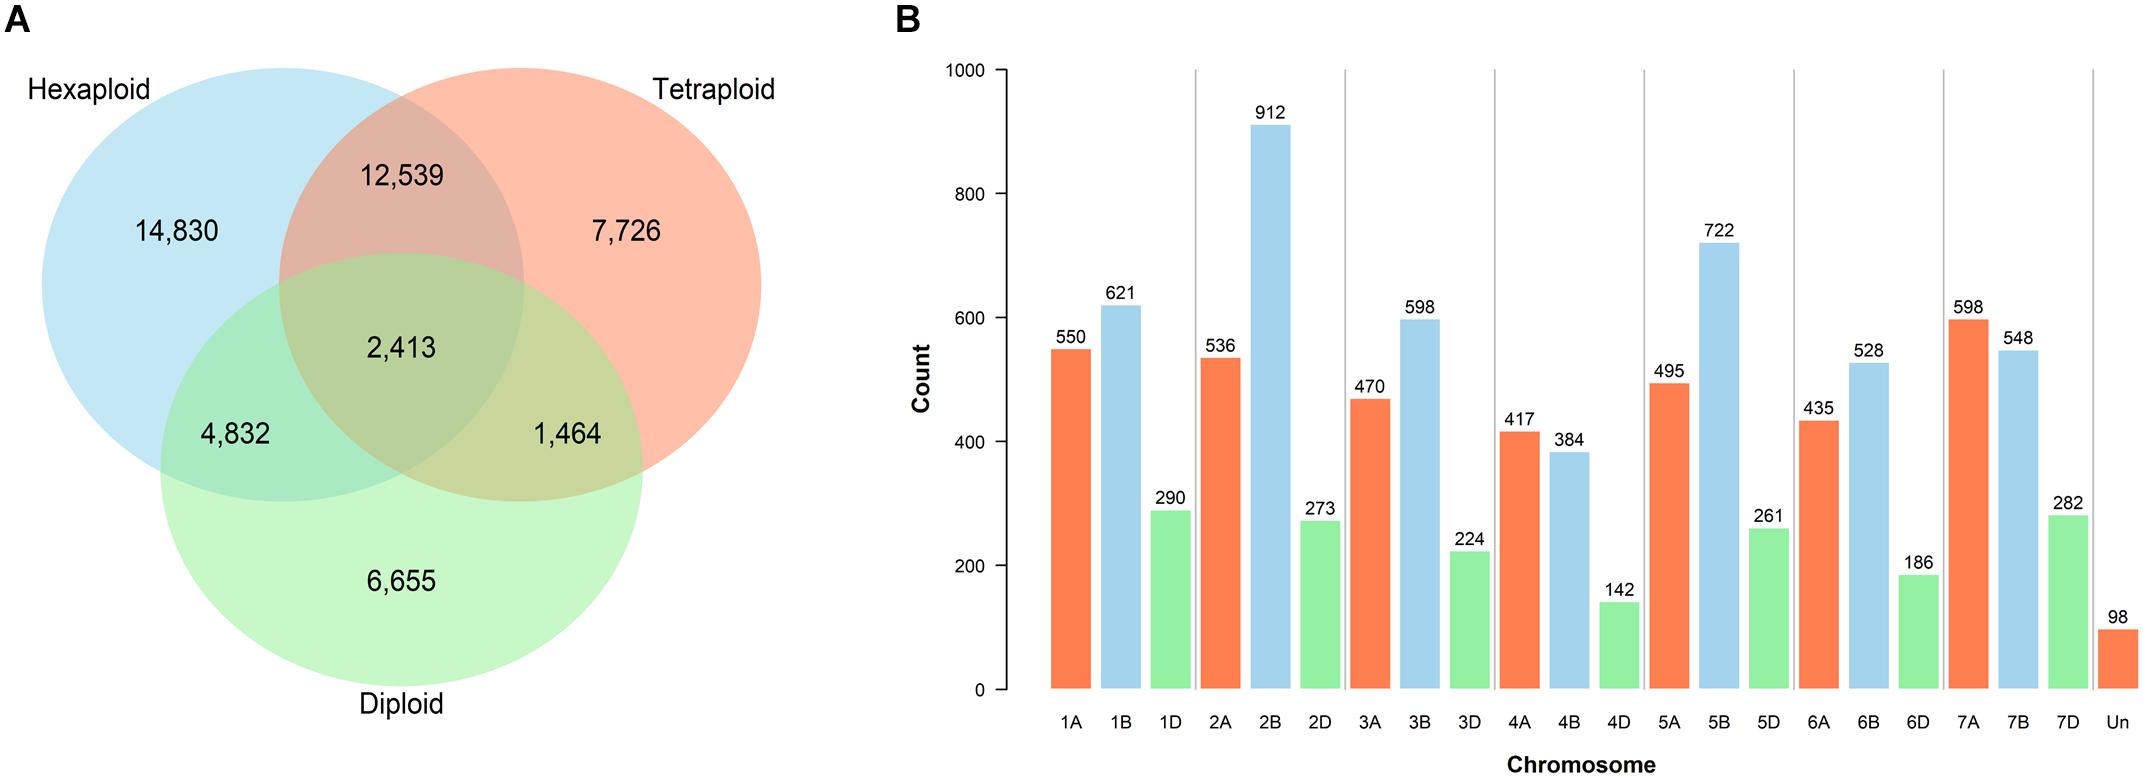
Figure 1. Filtered single nucleotide polymorphism (SNP) markers. (A) Shared SNPs between the hexaploid, tetraploid and diploid datasets. (B) Distribution of 9,570 filtered and validated SNPs across the chromosomes of the CS reference genome v1.0 (IWGSC, 2018).
Mapping was performed to locate the position of the 81,587 SNPs of the wheat Infinium assay on the exome sequence of the CS reference genome v1.0 (IWGSC, 2018). A total of 52,550 SNP marker sequences were successfully mapped, of which 43,013 were retained after filtering out the misaligned probes (Supplementary Table S8). Exome-capture sequencing and subsequent variant calling of 136 accessions identified a subset of 27,852 SNPs which belonged to the 43,013 mapped from the array. Re-filtering of the genotyping dataset from the complete germplasm (call rate > 80% of χi, MAF > 5%, and heterozygosity <5%) positioned 12,627 SNPs on the exome reference genome, including 9,570 that were also called using exome capture. Chromosomal assignments of these 9,570 filtered and mapped SNPs illustrate the uneven distribution across genomes (Figure 1B).
Phylogenetic Relationships and Principal Component Analysis
A ML phylogenetic tree was constructed to illustrate the relationships between the species in the collection. Four main clades were observed (Figure 2). The first consisted of all the Aegilops and non-domesticated Triticum species, where accessions clustered based on their shared sub-genomes. The second and largest clade comprised accessions with the ABD genome: SHWs, T. vavilovii and T. aestivum subspecies. The other two clades were primarily a mixture of T. turgidum subspecies and SHWs. Ancient tetraploid species T. turgidum ssp. dicoccum (emmer wheat) and the non-domesticated T. turgidum ssp. dicoccoides formed one clade, while modern cultivated species, such as T. turgidum ssp. durum and T. turgidum ssp. carthlicum, formed the other. SHWs were distributed between these clades based on their tetraploid parent species.
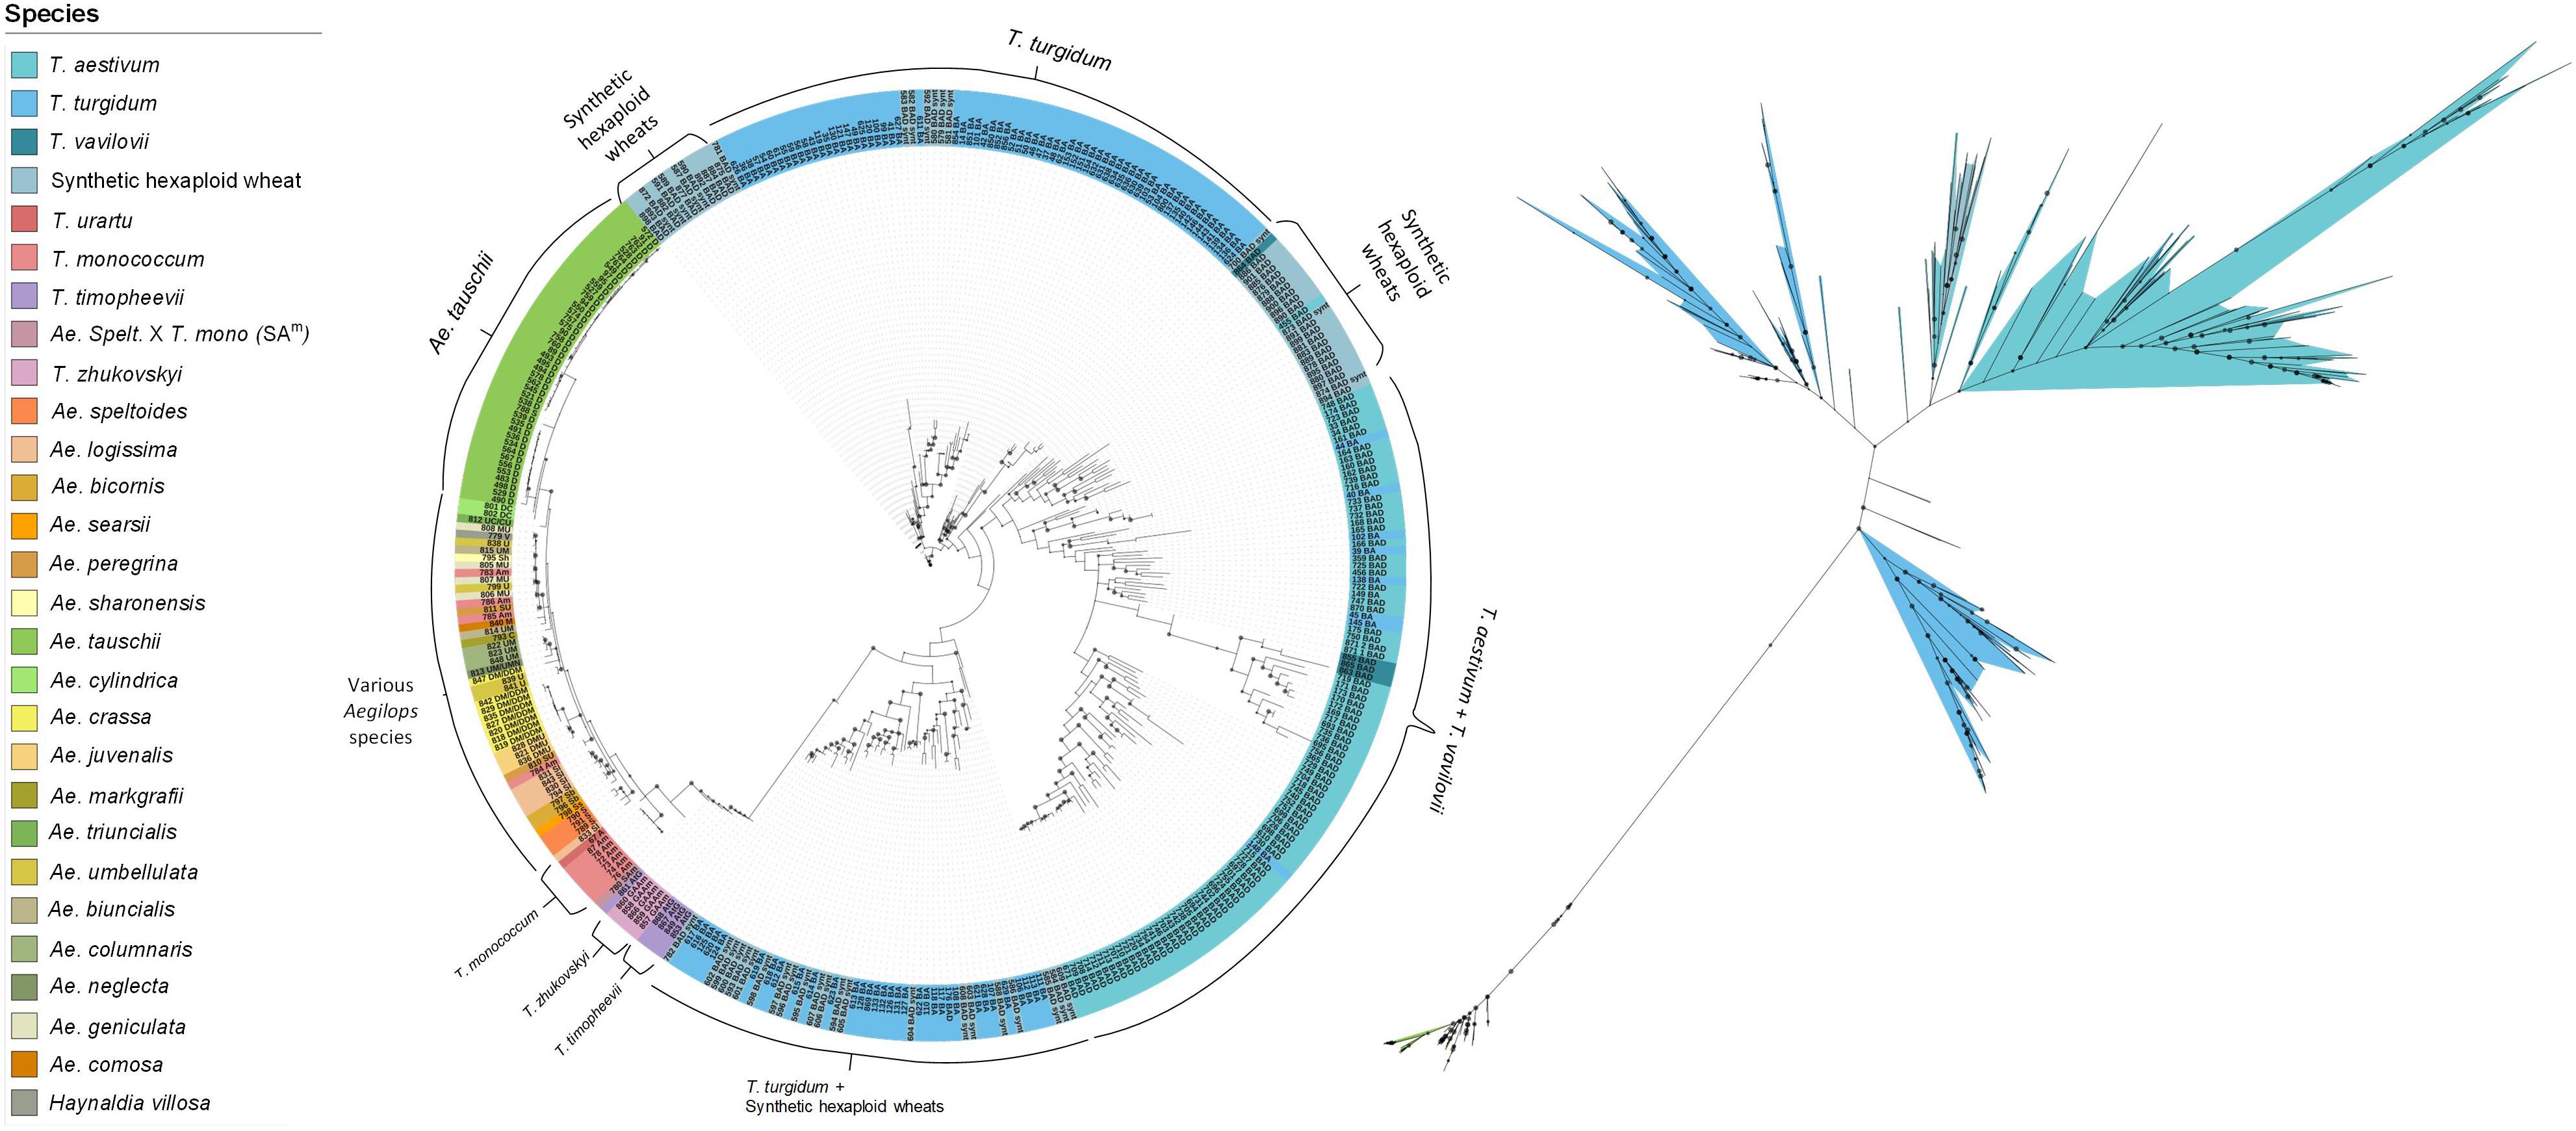
Figure 2. Rooted (left) and unrooted (right) phylogenetic trees illustrating the relationships between species. The tree was generated using the maximum likelihood approach with 1,000 bootstrap iterations. The size of the internal node symbols reflects the bootstrap confidence level and the leaf node labels correspond to the identification number and genome of each accession. The species are color-coded as indicated in the legend.
PCAs were performed to assess the genetic variation at different ploidy levels. In the hexaploid dataset, the first three PCs explained 29.0% of the variation (Figure 3A). Three to four main clusters were observed: the ABD genome species, T. aestivum and T. vavilovii, formed one cluster, Ae. crassa (DM/DDM) and Ae. juvenalis (DMU) formed a second closely related cluster, while Ae. neglecta (UM/UMN) and T. zhukovskyi (GAAm) clustered into two distinct groups. Similarly, in the tetraploid dataset, the first three PCs explained 28.3% of the variation (Figure 3B). Here, T. turgidum subspecies clustered into three groups, while T. timopheevii (AtG), Ae. crassa and Ae. cylindrica (DC) clustered into individual groups. Accessions belonging to species with the U or M sub-genome (Ae. geniculata, Ae. peregrina, Ae. triuncialis, Ae. biuncialis, Ae. columnaris and Ae. neglecta) clustered together. In the diploid dataset, the first three PCs explained 39.9% of the variation. Ae. tauschii (D) accessions clustered into two groups, Ae. speltoides (S) and T. monococcum (Am) clustered separately, and nine other species, each represented by few accessions, all clustered as individual groups (Figure 3C). Eight accessions did not cluster with other individuals of their respective species. They were assumed to have been mis-labeled and were removed from the datasets (Supplementary Table S9).
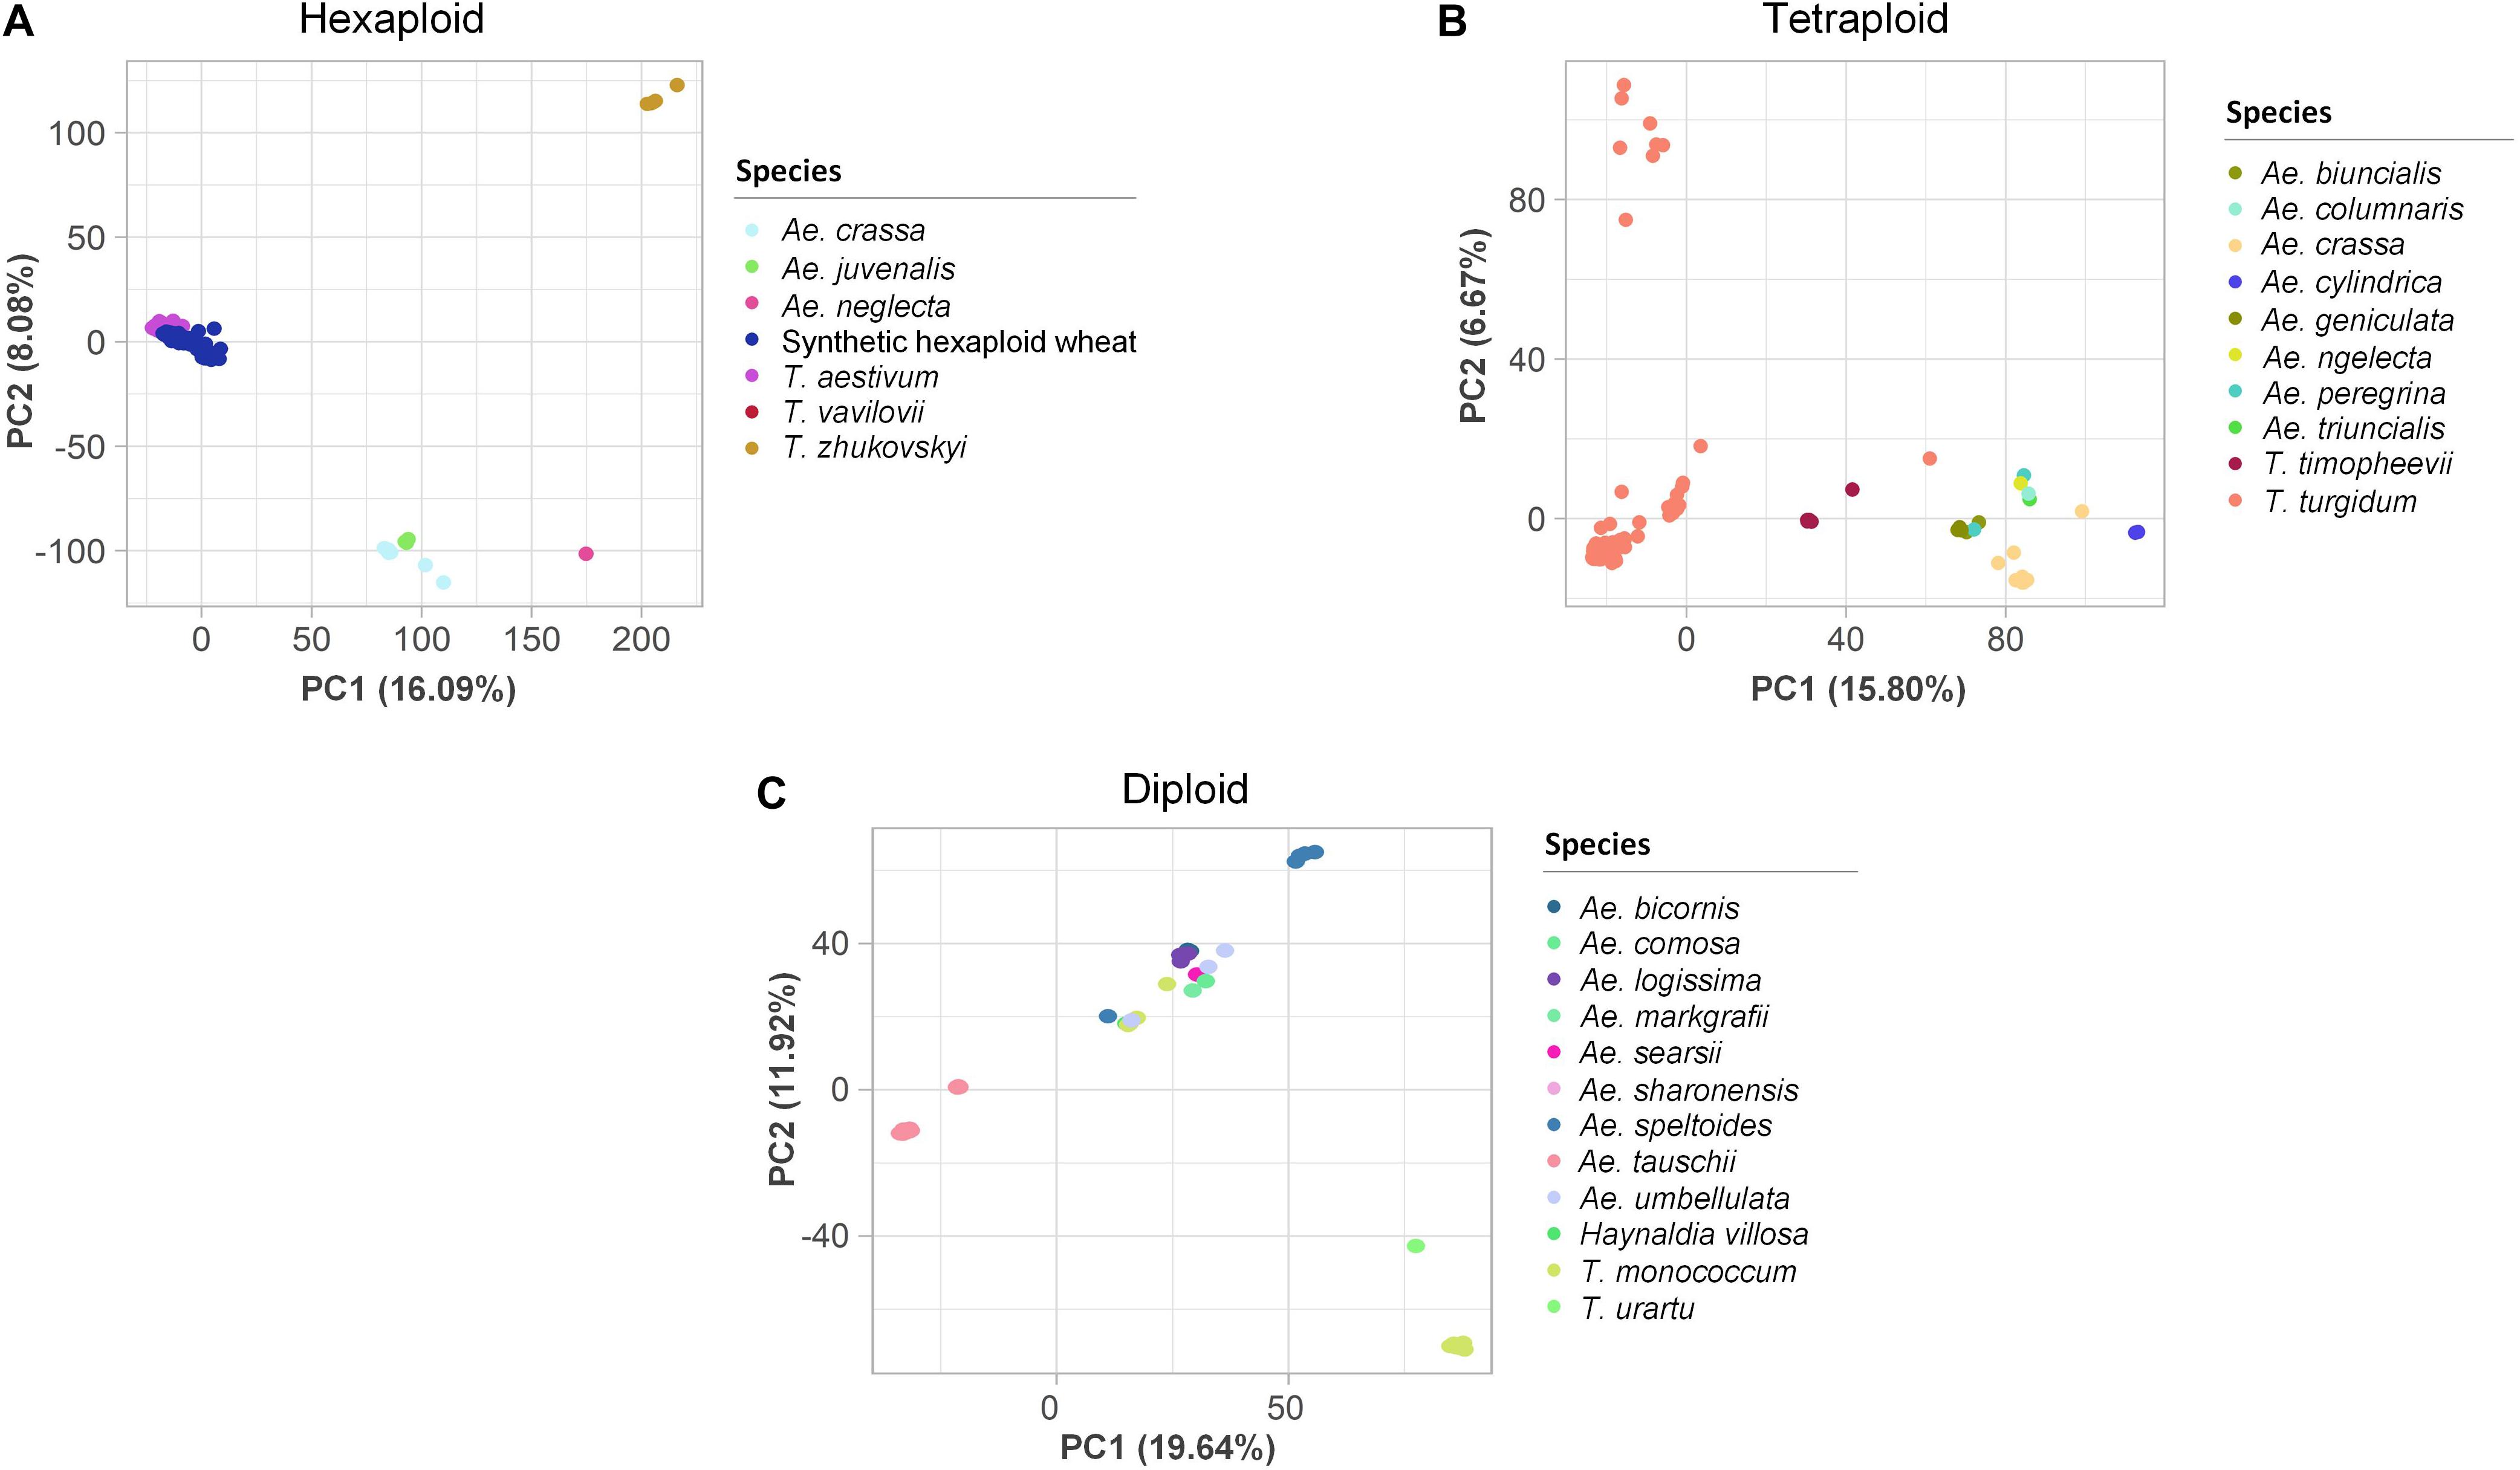
Figure 3. Two-dimensional scatter plots of the first two principal components (PCs) estimated for the (A) hexaploid, (B) tetraploid, and (C) diploid single nucleotide polymorphism datasets. The accessions are colored based on their species. The percentages of the variance explained by each PC are in brackets on the axes.
Genome-Wide Association Analysis
GWAS was performed using IT scores against six P. triticina isolates and the leaf rust severity measured in multiple field environments. For each dataset, the population structure was estimated using three tools and the optimal number of sub-populations was selected based on agreement between methods. For IT scores, K = 8 was selected, and for leaf rust severity, K = 8 and K = 6 were selected for the spring and winter panels, respectively (Supplementary Figures S4, S5).
GWAS was conducted using one single-locus and seven multi-locus models, all of which accounted for kinship and population structure. For IT response, the single-locus MLM identified five QTNs for which the proportion of variance explained (r2) ranged from 6–12% (Supplementary Table S10). Of these, four QTNs were identified for response against the isolate MBDS. The six multi-locus models from mrMLM identified a total of 116 unique QTNs across the genome, of which 32 were identified by more than one model and 23 were associated with more than one isolate (Supplementary Table S10). Of note, markers Tdurum_contig18471_456 and IAAV6025 associated with MBDS and Kukri_c12869_154 associated with TDBG1 had r2 values > 27%, while r2 values ranged from 1–23% for the remaining QTNs. RTM, the seventh multi-locus model, grouped the SNPs into 7,607 SNPLDBs and identified 15 QTL with r2 of 4–15%, including eight that had previously been detected by other multi-locus models (Supplementary Table S10). Of the five QTNs identified by single-locus GWAS, four were identified by at least one of the seven multi-locus models.
GWAS for leaf rust severity was conducted separately for the spring and winter panels. MLM identified five significant QTNs (r2 = 18–24%), all of which were associated with leaf rust severity in Morden and located in the D sub-genome (Supplementary Table S11). In the spring panel, mrMLM identified 85 unique QTNs (r2 = 1–22%) associated with leaf rust severity, of which 30 were identified by more than one model and 57 were location-specific (Supplementary Table S11). In the winter panel, 38 QTNs were identified including 10 by more than one model and one at both Morden and Ottawa locations (Supplementary Table S11). Marker wsnp_Ex_c6548_11355524 on 5B explained the highest proportion of the variance (40%), while r2 of the remaining QTNs ranged from 2–24%. RTM identified 37 QTL in the two panels, including seven that were also identified by other multi-locus models (Supplementary Table S11). Overall, five QTNs associated with leaf rust severity were also associated with race-specific IT response against at least one isolate. The number of QTNs identified by each model, for both, IT response and leaf rust severity, are shown in Table 1. For each phenotypic dataset, the multi-locus model mrMLM identified the highest number of QTNs, while the single-locus model MLM identified the fewest. The eight GWAS models were further compared based on r2, FDR-adjusted P-values and the number of common QTNs (Supplementary Figures S6, S7).
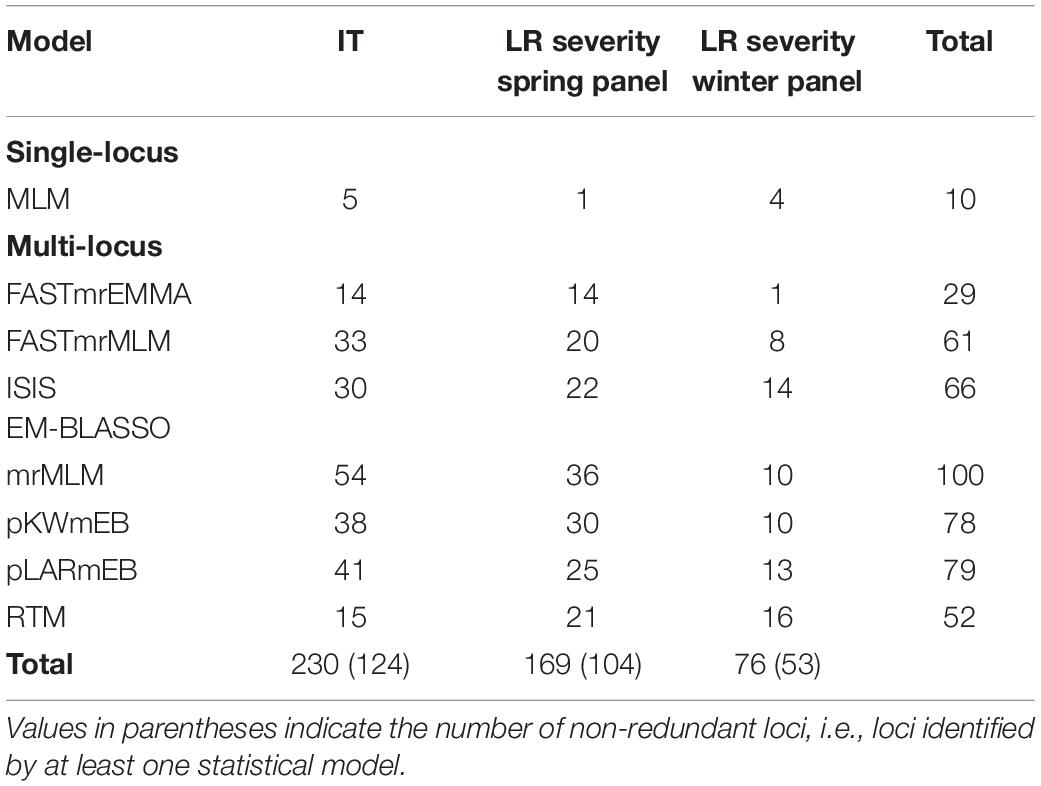
Table 1. Number of QTNs or SNP linkage disequilibrium blocks identified by each statistical model for infection type (IT) and leaf rust (LR) severity.
Functional Annotation
The transcript IDs of the genes within 5 Kb of one or more QTN were extracted along with their functional annotation. Between 79–85% of the QTNs associated with race-specific IT response and leaf rust severity were successfully annotated for gene function (Supplementary Table S12). A total of 46 loci associated with race-specific response and 50 associated with LR severity (37 in the spring panel and 13 in the winter panel) were within 5 Kb of genes coding for known plant disease resistance proteins such as CC-NBS-LRR, F-box-like domain-containing proteins, proteins with kinase domains, zinc finger-types and ABC transporter proteins, among others (Supplementary Table S12). A combined total of 53 QTNs with r2 > 5% were located within plant disease resistance genes (Table 2). For each of these, Kruskal–Wallis tests were performed to test the statistical significance in phenotypic values of the alternate alleles. Significant allele-phenotype differences (P-value < 0.05) were obtained for 35 of the 53 QTNs or SNPLDBs (Table 2), where the favorable alleles came from the domesticated T. aestivum and T. turgidum species as well as the wild relative species (Supplementary Figure S8). Phenotypic variation for 11 of these significant QTNs present within CC-NBS-LRR, ABC-transporter and protein kinase domains are illustrated (Figure 4). Such QTNs were considered strong candidate genes as their function and allelic variation are congruent.
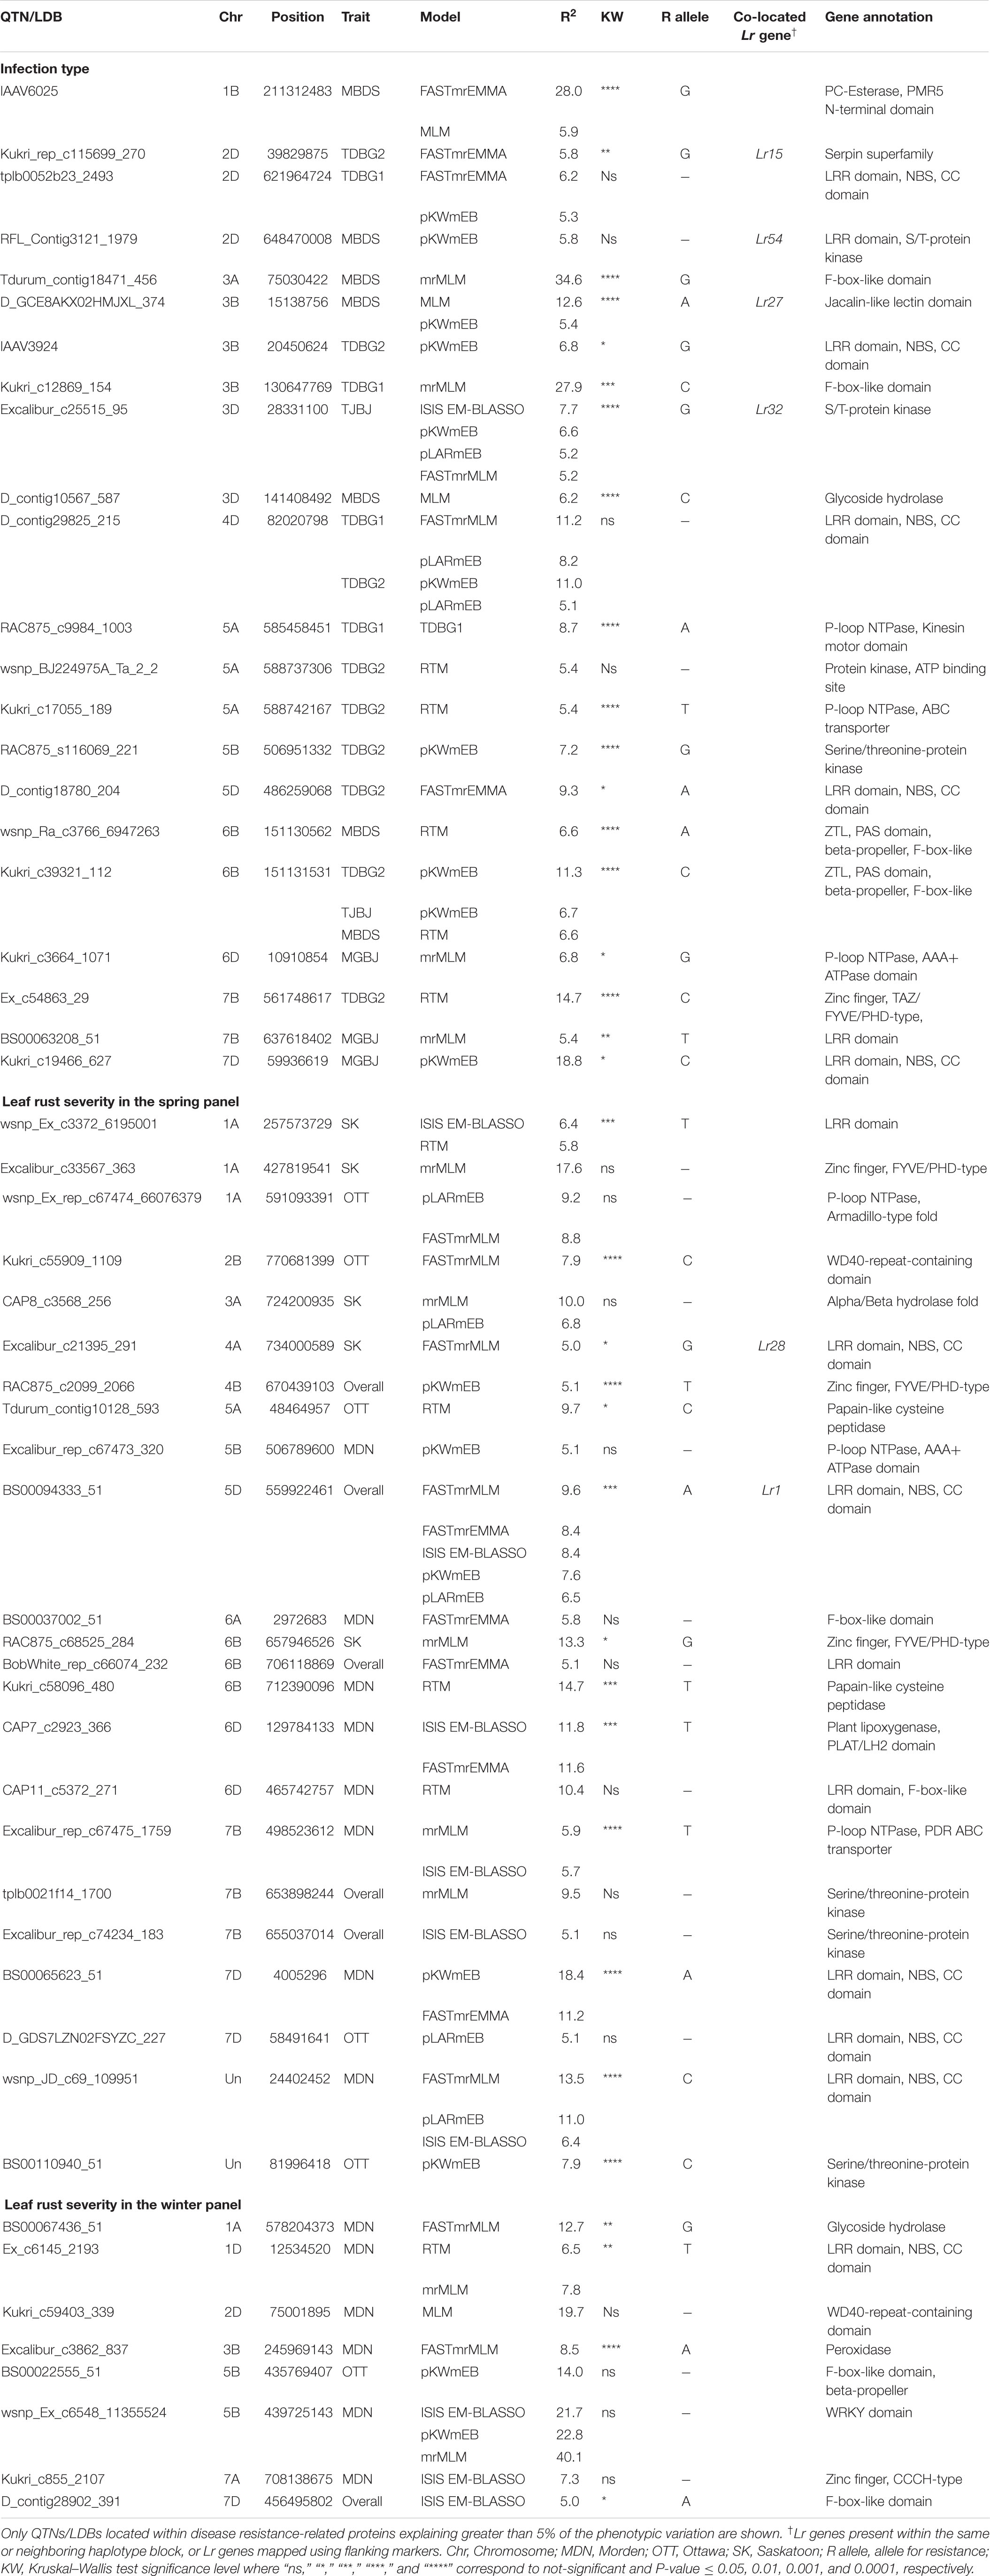
Table 2. Chromosomal location and functional annotation of quantitative trait nucleotides (QTNs) or linkage disequilibrium blocks (LDBs) associated with race-specific infection type and leaf rust severity.
Figure 4. Boxplots showing significant allelic effects for quantitative trait nucleotides (QTNs) present within genes encoding known disease resistance protein types. (A) QTNs associated with race-specific IT response. (B) QTNs associated with leaf rust severity in the spring panel. (C) QTNs associated with leaf rust severity in the winter panel. Labels at the top of each boxplot show the associated trait, i.e., the isolate for (A) or the overall mean or location-specific leaf rust severity (B, C). QTNs, chromosomal locations and annotation are indicated below each plot. Locations are Morden (MDN), Ottawa (OTT) and Saskatoon (SK). Kruskal–Wallis significance levels “∗,” “∗∗,” “∗∗∗,” and “****” correspond to P-value ≤ 0.05, 0.01, 0.001, and 0.0001, respectively.
Comparing Associated Loci With Previously Reported Lr Genes
To identify novel putative disease resistance loci, the physical positions of the QTNs identified were compared to the positions of the 66 previously reported Lr genes (Supplementary Table S5). All QTNs and Lr genes, except for Lr10, Lr14 (a,b), Lr25, Lr26, Lr29, Lr30, Lr36, Lr44, Lr56, Lr59, and Lr66, were physically mapped on the CS reference genome v1.0 (IWGSC, 2018). The positions of these mapped Lr genes and the IT and leaf rust severity QTNs identified herein by at least two models are illustrated (Figure 5).
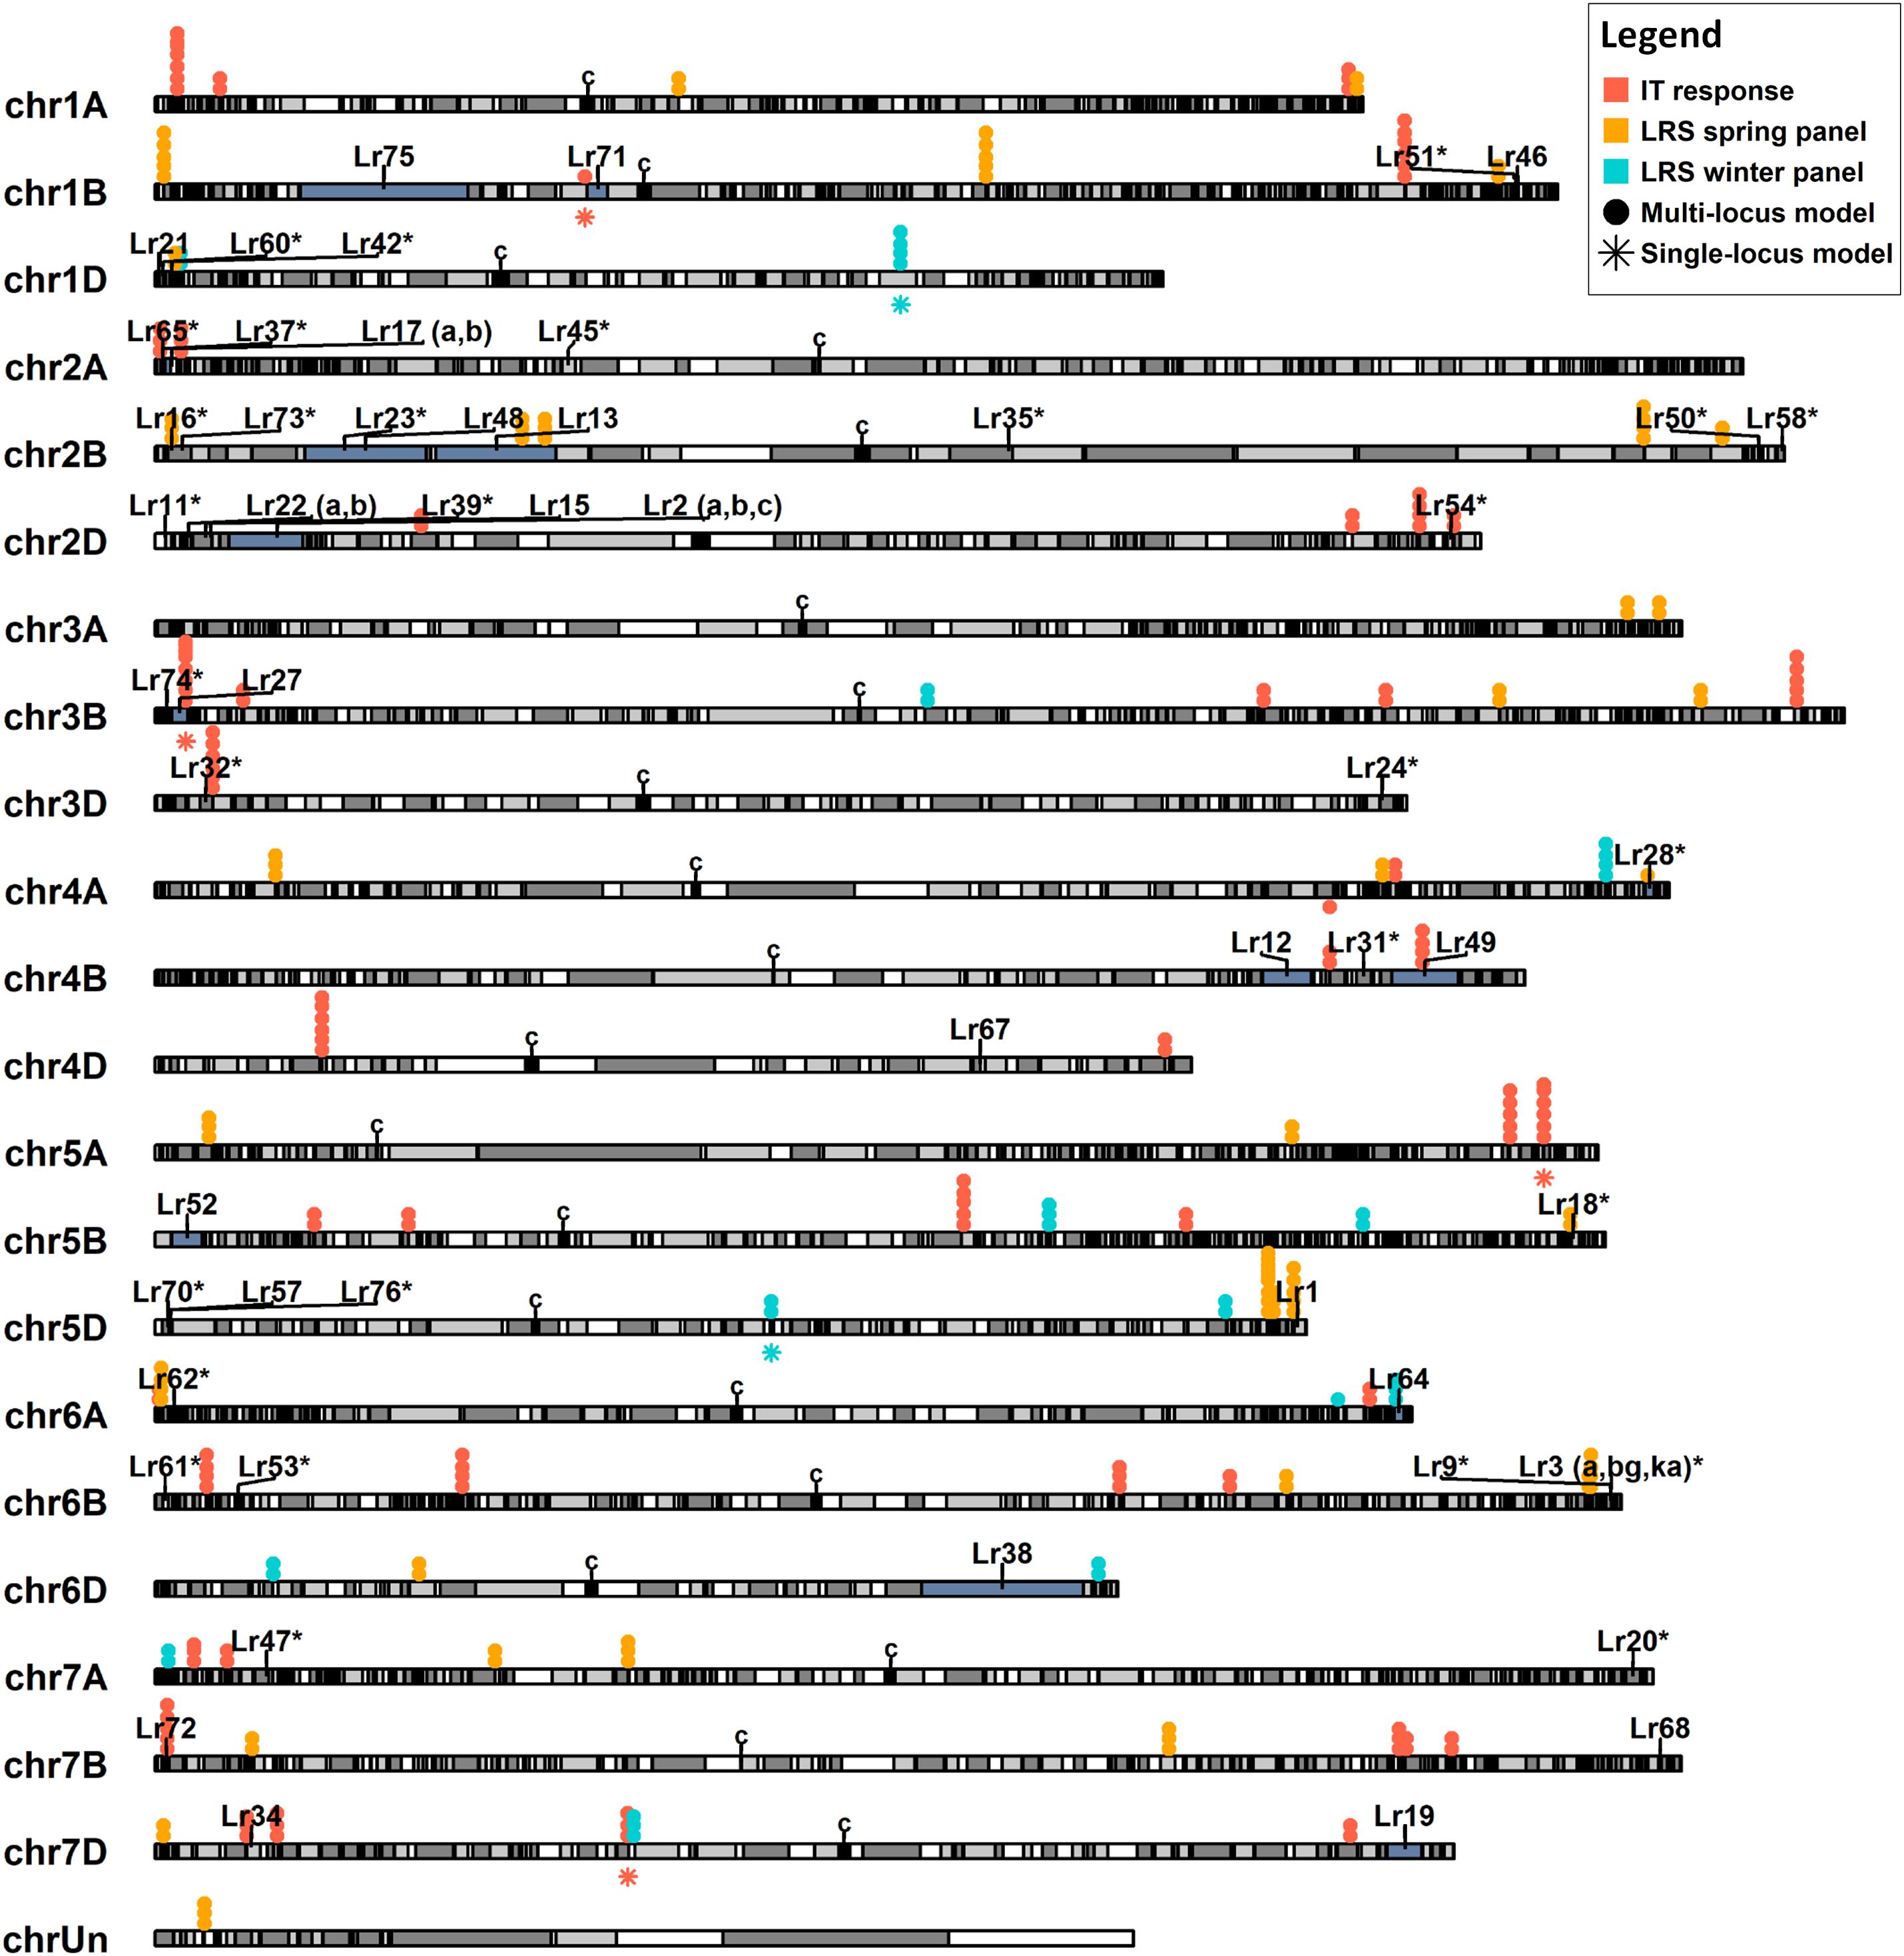
Figure 5. Physical map illustrating the position of 55 known leaf rust resistance genes (Lr) and quantitative trait nucleotides (QTNs) associated with leaf rust severity (LRS) and infection type (IT) against six leaf rust races. The positions of the previously cloned Lr genes are indicated by a single vertical line on the chromosome. Regions shaded in gray indicate linkage disequilibrium blocks, while those shaded in blue indicate the location of the proximal and distal markers of mapped Lr genes. Lr genes previously mapped with a single marker are indicated with an asterisk (*). For simplicity, QTNs associated with race-specific IT are shown in orange and those associated with LRS in the spring and winter panels are color-coded in yellow and blue, respectively. Solid dot (•) QTNs indicate association through a multi-locus model while star (⋆) QTNs were identified with the single-locus model MLM. Centromeres are denoted with a “c” symbol. Only QTNs identified by more than one model are shown.
Of the Lr genes mapped using both proximal and distal flanking markers, markers for Lr12, Lr13, Lr15, Lr19, Lr27, Lr28, Lr49, Lr64, and Lr75 co-located with 13 of the QTNs identified (Supplementary Table S13). These include seven QTNs associated with leaf rust severity and six with IT response. Haplotype black analysis was used to evaluate the relationships between the QTNs detected and the Lr genes mapped using gene sequences or single genetic markers. A total of 2113 haplotype blocks (D’ ≥ 0.5) were obtained, with an average block size of 4.9 MB. Two QTNs, BS00094333_51, associated with leaf rust severity, and D_GDS7LZN02F1Q5F_180, with IT caused by isolates TDBG1, MGBJ and TJBJ, were in the same haplotype blocks as the cloned genes Lr1 and Lr34, respectively, while three co-located in the same blocks as genetic markers of Lr16, Lr32 and Lr73 (Supplementary Table S13). Apart from this, another three QTNs were in neighboring blocks of the markers linked to Lr18 and Lr54. Pairwise linkage analysis between these blocks resulted in mean D’ statistics ranging from 0.44 to 0.66. Overall, Kruskal–Wallis tests identified significant allele-phenotype differences (P-value < 0.05) for 14 of the 21 QTNs mapping near positions of known Lr genes (Table 2, Supplementary Table S13).
Discussion
Puccinia triticina populations are constantly evolving, as exemplified by the presence of more than 70 races detected in North America each year (Ellis et al., 2014). This can quickly render the deployed Lr genes ineffective. Identification of novel sources of disease resistance is necessary to stay ahead in this plant-pathogen evolutionary arms race and to maintain disease resistance in crops. The ability to detect novel Lr genes through marker-based association studies depends greatly on the phenotypic and genetic variation present in the germplasm. The majority of the GWAS in wheat are based on elite cultivars, breeding lines or landraces sourced from breeding programs, genebanks or private seed collections, mainly because introgression into adapted germplasm is easier and faster from the primary genepool as compared to more distant germplasm (Gao et al., 2016; Riaz et al., 2018). These collections, although geographically adapted, often provide limited genetic diversity due to the domestication and selective breeding bottlenecks. Conversely, ancestors and wild relatives of wheat lack adaptation traits for agriculture, but are a rich source of genetic variation, accounting for 44% of the Lr genes identified to date (McCallum et al., 2012; USDA, 2017). In the past century, research to identify and transfer resistance genes from wild relatives was laborious, lengthy and focused on one gene at the time. Recent developments in genotyping technologies and the release of the wheat reference genome are enabling high throughput identification of new resistance genes regardless of the genepool, and thus accelerating their gene cloning (IWGSC, 2018; Arora et al., 2019). Here, we described an efficient method to identify new Lr gene loci and candidate genes from many Triticum and Aegilops species using an array-based SNP genotyping platform and eight GWAS models. Through this approach, we identified a total of 50 and 46 disease-related QTNs associated with field leaf rust severity and IT response against six P. triticina isolates, respectively, several of which were located near known Lr genes and others were linked to putative new ones. The QTNs identified in this study provide the framework for investigating novel and effective Lr genes from this diverse germplasm and for cloning known Lr genes.
Genetic Diversity
Bread wheat, an allohexaploid species, comprises an estimated 17 billion nucleotides, more than 85% of which is repetitive DNA (IWGSC, 2018). Array-based SNP genotyping platforms provide a quick and cost-effective opportunity to survey whole genomes of a large number of samples. We used the wheat 90 K array to genotype a diverse collection of 385 accessions. A total of 34.1% of the SNPs were shared between the hexaploid and tetraploid datasets, similar to a previous report of 33.9% (Wang et al., 2014). The high percentage of shared SNPs is indicative of the extensive gene flow from the tetraploid ancestors to hexaploid wheat (Dvorak et al., 2006). Because nearly half of the diploid accessions were Ae. tauschii, the D genome donor of hexaploid wheat, the total of 7,243 (47.2%) of shared SNPs between the diploid and hexaploid datasets also agrees with the gene flow between these species. Mapping against the CS exome sequence and subsequent comparison with exome capture data identified 9,570 SNPs, from which the B (45.1%), A (36.6%) and D (17.3%) sub-genome distribution compared to several previous reports (Wang et al., 2014; Daba et al., 2018; Pont et al., 2019).
Structure Analysis
Relationships between the 27 species in the collection were explored using phylogenetic tree analysis. Four major clades were observed, clearly separating the wild species from the T. aestivum and T. turgidum subspecies. T. aestivum ssp. spelta, hypothesized to have emerged from hybridization between T. aestivum and T. turgidum ssp. dicoccum (Blatter et al., 2004; Pont et al., 2019), was observed to cluster among the T. aestivum subspecies, separately from all T. turgidum ssp. dicoccum and dicoccoides. SHWs created by crossing tetraploid T. turgidum with diploid Ae. tauschii, were distributed between the two tetraploid clades based on the genetic characterization of their tetraploid parent. For example, 12 SHW accessions created by crossing the durum wheat cultivar ‘Langdon’ with different Ae. tauschii accessions, clustered with ‘Langdon’ in the modern tetraploids clade. Similarly, multiple SHWs created by crossing wild emmer wheat accessions PI113961 and PI355465 with Ae. tauschii, clustered with their tetraploid parents in the ancient tetraploid clade. Similar studies using SNP, SSR and AFLP markers have reported the genetic diversity of SHWs to clearly reflect the sub-species, geographical origin and morphological traits of their tetraploid parent, possibly due to the fact that it contributed two-third of their genome (Lage et al., 2003; Dreisigacker et al., 2008; Bhatta et al., 2018).
The major clade of wild relatives was separately analyzed to highlight the relationships between the species (Supplementary Figure S9). With the exception of Ae. sharonensis, clustering of the Aegilops species of the Sitopsis section was consistent with previous studies, where Ae. speltoides ssp. speltoides and Ae. speltoides ssp. ligustica, formed one clade and Ae. longissima, Ae. bicornis and Ae. searsii formed the other (Bahrman et al., 1988; Sasanuma et al., 1996; Miki et al., 2019). The majority of the Triticum species with an A genome also grouped together, where accessions of T. zhukovskyi were clustered closer to their tetraploid ancestor T. timopheevii (Dvorak et al., 1993). The unique amphiploid EKC22_RL5347 resulting from a cross between Ae. speltoides (S) and T. monococcum (Am) also clustered with the A-genome species. The close relationship between Ae. crassa (DM or DDM) and Ae. juvenalis (DMU) species was also expected because they both share a D and an M genomes (Baum et al., 2012; Edet et al., 2018). Both genomes of Ae. triuncialis (UC or CU) are nearly identical to the diploid genomes of Ae. umbellulata (U) and Ae. markgrafii (C) (Badaeva et al., 2004) and, unsurprisingly, the Ae. triuncialis cluster located between the diploid accessions with the U and C genomes. With the exception of Ae. juvenalis (DMU), which clustered with its D genome progenitor, polyploid species carrying a U genome were closely related to one another and to Ae. umbellulata despite having different non-U genomes (Badaeva et al., 2004; Kilian et al., 2011). Some of the wild relative species were sparsely represented in our collection, somewhat limiting our ability to establish clear relationships between the various genomes. Increasing their sample size is expected to refine this evolutionary relationship picture. Regardless, the collection had ample diversity to detect many putative new Lr genes.
The relationships observed in the phylogenetic tree were also observed by PCA. Overall, clustering patterns hinted at possible ascertainment biases; species of the A, B or D sub-genomes segregated more clearly, with few to no outliers, compared to other species. As the 90 K array consisted of SNPs previously discovered in cultivars of polyploid wheat, and its D genome progenitor Ae. tauschii (Wang et al., 2014), genotype calling may be limited to common alleles identified in the initial SNP discovery process (Albrechtsen et al., 2010). Although the genotyping data may not be sufficient to uncover novel ancestral relationships, it was nonetheless effective in revealing genetic variations at the species level and corroborating previously observed relationships (Bahrman et al., 1988; Badaeva et al., 2004).
Detection of Previously Reported Lr Genes
A total of 13 QTNs identified were present within the mapped flanking markers of nine cataloged Lr genes. The QTN Excalibur_c21395_291 mapped between psr119 and mag3092, two markers tightly linked to Lr28 (McIntosh et al., 1982; Sohail et al., 2014). Similarly, the QTN Excalibur_rep_c68362_62, mapped 1.6 Mb upstream, in a neighboring haplotype block of IWB41960, a marker tightly linked to the resistant gene Lr18 (Dyck and Samborski, 1968; Carpenter et al., 2018). Both Lr18 and Lr28 loci QTNs were present within CC-NBS-LRR genes and showed significant allele-specific phenotypic differences, making them candidate genes worthy of further investigation.
Five QTNs were found to be in the same haplotype blocks as the cloned genes Lr1 and Lr34 and the genetic markers for Lr16 (wmc764), Lr32 (wmc43), and Lr73 (wPt-4453) (McCartney et al., 2005; Cloutier et al., 2007; Krattinger et al., 2009; Thomas, 2010; Park et al., 2014). The QTNs close to Lr1 and Lr32 were present within CC-NBS-LRR and serine/threonine kinase domains, while the others were located within a 3-ketoacyl-CoA synthase domain or within genes of unknown function. These QTNs identified had within-block D’ statistics ranging from 0.54 to 0.85, where higher values suggest high linkage disequilibrium and similar association with phenotypic traits between pairs of SNPs in the same block (Cuyabano et al., 2014). Moreover, four of these five QTNs showed significant allele-specific phenotypic variation.
Overall, the lack of cloned genes or tightly linked markers restrict the ability to pinpoint the precise physical position of some Lr genes. QTNs linked to or within flanking markers of known Lr genes may serve as novel markers for gene cloning, however, fine-mapping, allelism tests, transformation genome editing (e.g., CRISPR) experiments must be performed to ascertain their identities.
Identification of Novel Sources of Leaf Rust Resistance
The most prevalent class of known resistance genes encode intracellular immune receptors with NBS-LRR domains, many of which also possess a coiled-coil (CC) N-terminal motif. These genes play an important role in pathogen recognition and initiation of downstream signaling cascades. In the wheat genome, as many as 661 to 1,560 full-length NBS-LRR genes have been reported, higher than any other plant species (Gu et al., 2015; Steuernagel et al., 2020). Four of the six Lr genes cloned to date encode CC-NBS-LRR proteins (Feuillet et al., 2003; Huang et al., 2003; Cloutier et al., 2007; Thind et al., 2017).
GWAS for race-specific IT response and leaf rust severity identified a total of 16 QTNs within genes encoding complete CC-NBS-LRR domains. Of these, 11 explained greater than 5% of the phenotypic variation, while the remaining were small-effect loci. As discussed above, QTNs close to Lr1, Lr18, Lr28, and Lr54 were in CC-NBS-LRR genes but the remaining were located where no known Lr genes have been mapped to date. For IT response, the most prominent QTNs within CC-NBS-LRR genes included D_contig18780_204 and Kukri_c19466_627, where for the former, all species in the U-genome group, SHWs and Ae. tauschii var. strangulata expressed the favorable allele, while for the latter, resistant accessions included wild relatives in the D-genome group and some SHWs, among others.
The highest number of QTNs within genes encoding CC-NBS-LRR proteins was identified in the spring panel rated for leaf rust severity. Of note is BS00065623_51 on the distal end of 7DS, where different subspecies of T. aestivum, such as T. aestivum ssp. spelta, was associated with the low-severity A allele, while most T. aestivum ssp. aestivum and all SHWs associated with the high-severity G allele. While the spring panel was made up of subspecies of T. aestivum, T. turgidum and SHWs, the winter panel was predominantly a collection of SHWs and wild relative species. The most notable leaf rust severity associated QTN identified in the winter panel may be Ex_c6145_2193. This QTN, present within a CC-NBS-LRR gene, was located on the distal end of the short arm of chromosome 1DS. Here, all the wild relatives including Ae. crassa, Ae. juvenalis and Ae. cylindrica among others, associated with the low-severity T allele, but the high-severity C allele was only detected in some Ae. tauschii and SHW accessions. Candidate CC-NBS-LRR genes identified here, in the primary as well as the wild gene pool, are valuable sources of genetic resistance.
Plant disease resistance is driven by complex mechanisms involving several layers of defense. Not surprisingly, the classes of known disease resistance genes have expanded greatly in the past few years. For leaf rust, in addition to Lr34 encoding an ABC transporter (Krattinger et al., 2009), the cloned Lr67 gene codes for a hexose transporter (Moore et al., 2015). Other pathogen resistance genes cloned in wheat encode serine/threonine protein kinases and wall-associated kinases (Cao et al., 2011; Shi et al., 2016). Identification of these diverse resistance proteins supports the possibility of uncovering novel classes of disease resistance genes. Consequently, in addition to those in CC-NBS-LRR genes, we identified a number of QTNs present in genes coding for other known resistance proteins in wheat and other plant species. A key QTN identified herein was Excalibur_rep_c67475_1759 located within a pleiotropic drug resistance-type ABC transporter protein, known to be involved in the secretion of fungal defense-related metabolites, including resistance to DON accumulation in wheat Fusarium head blight infection (Jasiński et al., 2001; Shang, 2009). Similarly, QTN Kukri_c39321_112 on 6B was associated with IT responses against three isolates (TDBG2, MBDS, and TJBJ). It was found within a gene encoding a ZTL-type beta-propeller/F-box domain protein known to regulate plant flowering time and provide resistance against yellow rust in wheat and powdery mildew in barley (Kim et al., 2005; Bozkurt et al., 2007; Dagdas et al., 2009). Here, species with the favorable allele included modern T. turgidum cultivars, Ae. speltoides, Ae. sharonensis and T. timopheevii, among others. These loci, located in novel genomic regions, are also recognized as putative candidate leaf rust resistance genes, and some may potentially confer resistance against multiple leaf rust isolates.
Overall, twice as many QTNs were identified in the spring panel as compared to the winter panel. This imbalance may be due to the difference in the number of accessions in each panel or the nature of the germplasm within each one where the spring panel comprised mostly the species used to design the wheat 90 K array, thereby providing higher quality genotyping. In addition, the potential for identifying novel disease resistance genes is also dependent on the mapping of the QTNs to the T. aestivum reference genome. As the reference only represents the A, B and D genomes of a single genotype, it may limit, but not prevent, our ability to identify rare resistance genes unique to the contrasting genomes of the wild relatives.
Conclusion
The GWAS described herein highlights the multi-genic and complex nature of pathogen disease resistance where multiple markers were associated with different field environments and pathogen races. We identified several QTNs located near known Lr resistance genes providing, at the very least, novel markers for the cloning of these genes. Some of them were located within known resistance gene classes such as CC-NBS-LRR. As such, these become prime candidates for direct investigations. This study also identified novel leaf rust resistance loci from the domesticated T. aestivum and T. turgidum species that can be capitalized upon quickly, but also others from wild relative species that may be harnessed to add to the leaf rust resistance repertoire of wheat. Once cloned, the novel Lr genes can be transferred into adapted germplasm using modern genome-assisted breeding strategies, such as gene cassettes and genome editing (Wulff and Moscou, 2014; Wang et al., 2018). Gene cassettes allow multiple cloned disease resistance genes to be transformed simultaneously into a single genome to provide durable and broad-spectrum resistance, because the closely linked genes will not segregate, will be easy to select for, and will essentially have the advantages of gene pyramiding (Kolmer et al., 2009; Arora et al., 2019). Gene-specific markers can also be developed to facilitate the transfer of these genes through conventional breeding. The recently introduced CRISPR-Cas9 system in wheat (Zhang et al., 2016; Liang et al., 2017) offers many advantages. It can facilitate the investigation of candidate genes in any germplasm, bypassing the laborious fine-mapping experiments and enabling their functional analyses. We believe that gene editing could also be capitalized upon to “transfer” resistance genes from wild relatives through the allelic conversion of the orthologous domesticated alleles, providing that sufficient sequence similarity exists between the wheat and the wild relative alleles. This “long-shot” strategy would eliminate the need for the long, laborious and difficult introgression via crossing, and eradicate its associated linkage drag drawbacks. In conclusion, we described a powerful approach to identify QTN markers and candidate genes for leaf rust resistance through combining a broad germplasm including cultivated species and wild relatives, array-based genotyping, field severity and IT phenotyping and, through the use of several GWAS models.
Data Availability Statement
The datasets presented in this study can be found in online repositories. The names of the repository/repositories and accession number(s) can be found in the manuscript/Supplementary Material.
Author Contributions
FF performed the data analysis and wrote the manuscript; FY provided bioinformatics and statistics guidance; BM, SC and CP performed leaf rust severity phenotyping; BM performed race-specific phenotyping; CM and CH produced the wheat 90 K array data; GF co-developed the original experiment and provided some of the key germplasm; SC designed the experiments and co-wrote the manuscript. All authors read and edited the manuscript.
Funding
This project was funded through an Agriculture and Agri-Food Canada A-base grant (project J-001372) and a Canadian Agricultural Partnership Wheat Cluster grant (project J-001961).
Conflict of Interest
The authors declare that the research was conducted in the absence of any commercial or financial relationships that could be construed as a potential conflict of interest.
Acknowledgments
The authors would like to thank Elsa Reimer and Winnie McNabb for leaf rust phenotyping in Morden, Dr. Jemanesh Haile for leaf rust phenotyping in Saskatoon, Tara Edwards and Leslie Bezte for the genotyping data, Dr. Eric Kerber for providing some of the unique germplasm, Nick Manseau for help with editing and, Drs. Sridhar Ravichandran and Demissew Sertse Desta for help with some of the bioinformatics analyses.
Supplementary Material
The Supplementary Material for this article can be found online at: https://www.frontiersin.org/articles/10.3389/fpls.2020.583738/full#supplementary-material
Supplementary Figure 1 | Stacked bar plot summarizing genotype distribution of infection type response against six leaf rust isolates. Scores from the Stakman scale were converted to a linear 1–9 scale. Each bar represents the distribution of scores for a specific leaf rust isolate.
Supplementary Figure 2 | Comparison between raw mean values and BLUP estimates for leaf rust severity. Scatter plots show mean values (y-axis) vs. BLUP estimates (x-axis) for overall severity in the spring (A) and winter (B) diversity panels. Boxplots show the interquartile range and median severity calculated using aggregate means (C–E) and BLUP estimates (D–F) for Morden (MDN), Ottawa (OTT) and Saskatoon (SK) in the spring diversity panel, and MDN and OTT in the winter diversity panel.
Supplementary Figure 3 | Histograms describing the distribution of overall severity scores in the spring and winter panels. Raw mean values of the spring (A) and winter (B) diversity panels and genotypic best linear unbiased predictor (BLUP) estimates of the spring (C) and winter (D) diversity panels are illustrated. Genotypic BLUP estimates are conditional means which summarize phenotypic variation across all locations and years.
Supplementary Figure 4 | Scree plots for estimating the K number of sub-populations in the SNP datasets for the race-specific infection type (A) and field leaf rust severity of the spring (B) and winter (C) diversity panels. PCAdapt and LEA are both PCA-based methods, where PCAdapt plots the number of PCs vs. proportion of variance explained, and LEA plots the Tracy–Widom statistic vs. K. Admixture detects population structure through trends in cross-validation error vs. K.
Supplementary Figure 5 | LEA structure plots illustrating the ancestry mix of the subpopulations using K = 8 for the race-specific infection type (A), K = 8 for leaf rust severity of the spring (B) and K = 6 for the winter (C) diversity panels.
Supplementary Figure 6 | Box plots showing (A) percentage variance explained (r2) and (B) false discovery rate (FDR) adjusted P-values for quantitative trait nucleotides (QTNs) identified by each of the eight genome-wide association study (GWAS) models.
Supplementary Figure 7 | Plot showing intersecting sets of quantitative trait nucleotides (QTNs) identified by each of the eight genome-wide association study (GWAS) models for all leaf rust traits. Names of the GWAS models are listed on the left side below the x-axis. Empty light-gray dots indicate GWAS models that are not part of the intersection, while filled black dots indicate GWAS models that are participating in the intersection. The size of each intersecting set is illustrated in the bar plot. Note that the intersection sets are disjointed, i.e., they are non-overlapping. For simplicity, only intersecting sets of size ≥ 5 are shown.
Supplementary Figure 8 | Heatmap showing genotype calls for quantitative trait nucleotides (QTNs) that displayed significant allele-specific phenotype differences for (A) infection type response against six leaf rust isolates and leaf rust severity in the (B) spring and (C) winter diversity panel. Rows represent the entry number and genome symbol of the accessions in the germplasm and columns represent the QTNs. Genotypes AA represent homozygous alleles associated with low leaf rust infection type (A) or severity scores (B,C) and genotype BB represent homozygous alleles associated with high scores. Genotype AB and NA represent heterozygous alleles and no genotype calls, respectively. Different colors in the left panel represent the different groups of species in the germplasm.
Supplementary Figure 9 | Rooted maximum likelihood phylogenetic tree illustrating the relationships between the wild Aegilops, Triticum and Haynaldia species in the germplasm. The leaf node labels are the entry number and genome symbol of each accession.
Supplementary Table 1 | List of accessions included in the study and their respective genome, ploidy, growth habit, origin, and seed source.
Supplementary Table 2 | Infection type scores of accessions rated for response against six leaf rust isolates. Scores are based on the Stakman scale (A) and their linear conversion using a 1–9 scale (B).
Supplementary Table 3 | Virulence and avirulence formulas for the six leaf rust pathogen isolates used to measure infection type response.
Supplementary Table 4 | Genotypic and location-specific best linear unbiased predictor (BLUP) estimates for leaf rust severity of the spring (A) and winter (B) diversity panels.
Supplementary Table 5 | List of known wheat leaf rust resistance genes, their source, gene and marker references, and position on the Chinese Spring reference genome v1.0 (IWGSC, 2018) mapped using gene sequences or flanking and linked markers.
Supplementary Table 6 | Linear mixed model for leaf rust severity of the spring (A) and winter (B) panels across years and locations.
Supplementary Table 7 | Average leaf rust severity of accessions of the spring (A) and winter (B) diversity panels calculated over all locations, years and replicates.
Supplementary Table 8 | Chromosomal position of the wheat 90 K array SNP markers on the Chinese Spring exome sequence (ES) and reference genome sequence (CS) v1.0 (IWGSC, 2018).
Supplementary Table 9 | List of eight accessions which did not cluster with other individuals of their respective species.
Supplementary Table 10 | Significant quantitative trait nucleotides (QTNs) and linkage disequilibrium blocks (LDBs) for infection type (IT) response against six leaf rust isolates identified by association mapping using one single-locus and seven multi-locus models.
Supplementary Table 11 | Significant quantitative trait nucleotides (QTNs) and linkage disequilibrium blocks (LDBs) associated with leaf rust severity in the spring and winter diversity panels as identified by association mapping using one single-locus and seven multi-locus models.
Supplementary Table 12 | Functional annotation of genes located within 5 KB of quantitative trait nucleotides (QTNs) or peak single nucleotide polymorphism (SNP) markers of linkage disequilibrium blocks (LDBs) associated with infection type response against six leaf rust isolates and leaf rust (LR) severity of the spring and winter diversity panels.
Supplementary Table 13 | Quantitative trait nucleotides (QTNs) located within flanking markers of leaf rust (Lr) resistance genes positioned onto the Chinese Spring reference genome sequence v1.0 (IWGSC, 2018) (A), within the same linkage disequilibrium block (LDB) (B), or a neighboring LDB (C).
Footnotes
- ^ https://plants.ensembl.org/Triticum_aestivum/Info/Index
- ^ https://wheat.pw.usda.gov/cgi-bin/seqserve/blast_wheat.cgi
References
Albrechtsen, A., Nielsen, F. C., and Nielsen, R. (2010). Ascertainment biases in SNP chips affect measures of population divergence. Mol. Biol. Evol. 27, 2534–2547. doi: 10.1093/molbev/msq148
Alexander, D. H., and Lange, K. (2011). Enhancements to the ADMIXTURE algorithm for individual ancestry estimation. BMC Bioinformatics 12:246. doi: 10.1186/1471-2105-12-246
Alexander, D. H., Novembre, J., and Lange, K. (2009). Fast model-based estimation of ancestry in unrelated individuals. Genome Res. 19, 1655–1664. doi: 10.1101/gr.094052.109
Aoun, M., Breiland, M., Kathryn Turner, M., Loladze, A., Chao, S., Xu, S. S., et al. (2016). Genome-wide association mapping of leaf rust response in a durum wheat worldwide germplasm collection. Plant Genome 9, 1–24. doi: 10.3835/plantgenome2016.01.0008
Arora, S., Steuernagel, B., Gaurav, K., Chandramohan, S., Long, Y., Matny, O., et al. (2019). Resistance gene cloning from a wild crop relative by sequence capture and association genetics. Nat. Biotechnol. 37, 139–143. doi: 10.1038/s41587-018-0007-9
Badaeva, E. D., Amosova, A. V., Samatadze, T. E., Zoshchuk, S. A., Shostak, N. G., Chikida, N. N., et al. (2004). Genome differentiation in Aegilops. 4. Evolution of the U-genome cluster. Plant Syst. Evol. 246, 45–76. doi: 10.1007/s00606-003-0072-4
Bahrman, N., Zivy, M., and Thiellement, H. (1988). Genetic relationships in the Sitopsis section of Triticum and the origin of the B genome of polyploid wheats. Heredity 61, 473–480. doi: 10.1038/hdy.1988.141
Bates, D., Maechler, M., Bolker, B., and Walker, S. (2014). lme4: linear mixed-effects models using Eigen and S4. J. Stat. Softw. 1, 1–23. doi: 10.18637/jss.v067.i01
Baum, B. R., Edwards, T., Mamuti, M., and Johnson, D. A. (2012). Phylogenetic relationships among the polyploid and diploid Aegilops species inferred from the nuclear 5S rDNA sequences (Poaceae: Triticeae). Genome 55, 177–193. doi: 10.1139/g2012-006
Benjamini, Y., and Hochberg, Y. (1995). Controlling the false discovery rate: a practical and powerful approach to multiple testing. J. R. Stat. Soc. Series B Stat. Methodol. 57, 289–300. doi: 10.1111/j.2517-6161.1995.tb02031.x
Bhatta, M., Morgounov, A., Belamkar, V., Poland, J., and Baenziger, P. S. (2018). Unlocking the novel genetic diversity and population structure of synthetic hexaploid wheat. BMC Genomics 19:591. doi: 10.1186/s12864-018-4969-2
Blatter, R. H. E., Jacomet, S., and Schlumbaum, A. (2004). About the origin of European spelt (Triticum spelta L.): allelic differentiation of the HMW glutenin B1-1 and A1-2 subunit genes. Theor. Appl. Genet. 108, 360–367. doi: 10.1007/s00122-003-1441-7
Bozkurt, O., Unver, T., and Akkaya, M. S. (2007). Genes associated with resistance to wheat yellow rust disease identified by differential display analysis. Physiol. Mol. Plant Pathol. 71, 251–259. doi: 10.1016/j.pmpp.2008.03.002
Bradbury, P. J., Zhang, Z., Kroon, D. E., Casstevens, T. M., Ramdoss, Y., and Buckler, E. S. (2007). TASSEL: software for association mapping of complex traits in diverse samples. Bioinformatics 23, 2633–2635. doi: 10.1093/bioinformatics/btm308
Cao, A., Xing, L., Wang, X., Yang, X., Wang, W., Sun, Y., et al. (2011). Serine/threonine kinase gene Stpk-V, a key member of powdery mildew resistance gene Pm21, confers powdery mildew resistance in wheat. Proc. Natl. Acad. Sci. U.S.A. 108, 7727–7732. doi: 10.1073/pnas.1016981108
Carpenter, N. R., Griffey, C., Rosso, L., Malla, S., Chao, S., and Guedira, G. B. (2018). Mapping Lr18: a leaf rust resistance gene widely deployed in soft red winter wheat. J. Plant Dis. Biomark. 1, 4–10.
Cavanagh, C. R., Chao, S., Wang, S., Huang, B. E., Stephen, S., Kiani, S., et al. (2013). Genome-wide comparative diversity uncovers multiple targets of selection for improvement in hexaploid wheat landraces and cultivars. Proc. Natl. Acad. Sci. U.S.A. 110, 8057–8062. doi: 10.1073/pnas.1217133110
Cloutier, S., McCallum, B. D., Loutre, C., Banks, T. W., Wicker, T., Feuillet, C., et al. (2007). Leaf rust resistance gene Lr1, isolated from bread wheat (Triticum aestivum L.) is a member of the large psr567 gene family. Plant Mol. Biol. 65, 93–106. doi: 10.1007/s11103-007-9201-8
Cuyabano, B. C. D., Su, G., and Lund, M. S. (2014). Genomic prediction of genetic merit using LD-based haplotypes in the Nordic Holstein population. BMC Genomics 15:1171. doi: 10.1186/1471-2164-15-1171
Daba, S. D., Tyagi, P., Brown-Guedira, G., and Mohammadi, M. (2018). Genome-wide association studies to identify loci and candidate genes controlling kernel weight and length in a historical united states wheat population. Front. Plant Sci. 9:1045. doi: 10.3389/fpls.2018.01045
Dagdas, Y. F., Dagdas, G., Unver, T., and Akkaya, M. S. (2009). A new ZTL-type F-box functions as a positive regulator in disease resistance: VIGS analysis in barley against powdery mildew. Physiol. Mol. Plant Pathol. 74, 41–44. doi: 10.1016/j.pmpp.2009.08.003
Dreisigacker, S., Kishii, M., Lage, J., and Warburton, M. (2008). Use of synthetic hexaploid wheat to increase diversity for CIMMYT bread wheat improvement. Aust. J. Agric. Res. 59, 413–420. doi: 10.1071/AR07225
Dvorak, J., Akhunov, E. D., Akhunov, A. R., Deal, K. R., and Luo, M.-C. (2006). Molecular characterization of a diagnostic DNA marker for domesticated tetraploid wheat provides evidence for gene flow from wild tetraploid wheat to hexaploid wheat. Mol. Biol. Evol. 23, 1386–1396. doi: 10.1093/molbev/msl004
Dvorak, J., Terlizzi, P. D., Zhang, H.-B., and Resta, P. (1993). The evolution of polyploid wheats: identification of the A genome donor species. Genome 36, 21–31. doi: 10.1139/g93-004
Dyck, P. L. (1977). Genetics of leaf rust reaction in three introductions of common wheat. Can. J. Genet. Cytol. 19, 711–716. doi: 10.1139/g77-077
Dyck, P. L., and Kerber, E. R. (1985). “Resistance of the race specific type,” in Diseases, Distribution, Epidemiology and Control, eds A. P. Roelfs and W. R. Bushnell (Cambridge, MA: Academic Press).
Dyck, P. L., and Samborski, D. J. (1968). Genetics of resistance to leaf rust in the common wheat varieties Webster, Loros, Brevit, Carina, Malakof and Centenario. Can. J. Genet. Cytol. 10, 7–17. doi: 10.1139/g68-002
Dyck, P. L., Samborski, D. J., and Anderson, R. G. (1966). Inheritance of adult plant leaf rust resistance derived from the common wheat varieties ‘Exchange’ and ‘Frontana’. Can. J. Genet. Cytol. 8, 665–671. doi: 10.1139/g66-082
Edet, O. U., Gorafi, Y. S. A., Nasuda, S., and Tsujimoto, H. (2018). DArTseq-based analysis of genomic relationships among species of tribe Triticeae. Sci. Rep. 8:16397. doi: 10.1038/s41598-018-34811-y
Ellis, J. G., Lagudah, E. S., Spielmeyer, W., and Dodds, P. N. (2014). The past, present and future of breeding rust resistant wheat. Front. Plant Sci. 5:641. doi: 10.3389/fpls.2014.00641
Feuillet, C., Travella, S., Stein, N., Albar, L., Nublat, A., and Keller, B. (2003). Map-based isolation of the leaf rust disease resistance gene Lr10 from the hexaploid wheat (Triticum aestivum L.) genome. Proc. Natl. Acad. Sci. U.S.A. 100, 15253–15258. doi: 10.1073/pnas.2435133100
Frichot, E., and François, O. (2015). LEA: an R package for landscape and ecological association studies. Methods Ecol. Evol. 6, 925–929. doi: 10.1111/2041-210x.12382
Gao, L., Turner, M. K., Chao, S., Kolmer, J., and Anderson, J. A. (2016). Genome wide association study of seedling and adult plant leaf rust resistance in elite spring wheat breeding lines. PLoS One 11:e0148671. doi: 10.1371/journal.pone.0148671
Gel, B., and Serra, E. (2017). karyoploteR: an R/Bioconductor package to plot customizable genomes displaying arbitrary data. Bioinformatics 33, 3088–3090. doi: 10.1093/bioinformatics/btx346
Gu, L., Si, W., Zhao, L., Yang, S., and Zhang, X. (2015). Dynamic evolution of NBS–LRR genes in bread wheat and its progenitors. Mol. Genet. Genomics 290, 727–738. doi: 10.1007/s00438-014-0948-8
He, J., Meng, S., Zhao, T., Xing, G., Yang, S., Li, Y., et al. (2017). An innovative procedure of genome-wide association analysis fits studies on germplasm population and plant breeding. Theor. Appl. Genet. 130, 2327–2343. doi: 10.1007/s00122-017-2962-9
Hiebert, C. W., Thomas, J. B., McCallum, B. D., Humphreys, D. G., DePauw, R. M., Hayden, M. J., et al. (2010). An introgression on wheat chromosome 4DL in RL6077 (Thatcher∗6/PI 250413) confers adult plant resistance to stripe rust and leaf rust (Lr67). Theor. Appl. Genet. 121, 1083–1091. doi: 10.1007/s00122-010-1373-y
Hourcade, D., Bogard, M., Bonnefoy, M., Savignard, F., Mohamadi, F., Lafarge, S., et al. (2019). Genome-wide association analysis of resistance to wheat spindle streak mosaic virus in bread wheat. Plant Pathol. 68, 609–616. doi: 10.1111/ppa.12972
Huang, L., Brooks, S. A., Li, W., Fellers, J. P., Trick, H. N., and Gill, B. S. (2003). Map-based cloning of leaf rust resistance gene Lr21 from the large and polyploid genome of bread wheat. Genetics 164, 655–664.
IWGSC (2018). Shifting the limits in wheat research and breeding using a fully annotated reference genome. Science 361:eaar7191. doi: 10.1126/science.aar7191
Jasiński, M., Stukkens, Y., Degand, H., Purnelle, B., Marchand-Brynaert, J., and Boutry, M. (2001). A plant plasma membrane ATP binding cassette–type transporter is involved in antifungal terpenoid secretion. Plant Cell 13, 1095–1107. doi: 10.1105/tpc.13.5.1095
Keller, B., Wicker, T., and Krattinger, S. G. (2016). Advances in wheat and pathogen Genomics: implications for disease control. Annu. Rev. Phytopathol. 56, 67–87. doi: 10.1146/annurev-phyto-080516-035419
Kersey, P. J., Allen, J. E., Armean, I., Boddu, S., Bolt, B. J., Carvalho-Silva, D., et al. (2016). Ensembl genomes 2016: more genomes, more complexity. Nucleic Acids Res. 44, D574–D580. doi: 10.1093/nar/gkv1209
Kilian, B., Mammen, K., Millet, E., Sharma, R., Graner, A., Salamini, F., et al. (2011). “Aegilops,” in Wild Crop Relatives: Genomic and Breeding Resources: Cereals, ed. C. Kole (Berlin: Springer), 1–76. doi: 10.1007/978-3-319-23534-9_1
Kim, S. A., Brossard, M., Roshandel, D., Paterson, A. D., Bull, S. B., and Yoo, Y. J. (2019). Gpart: human genome partitioning and visualization of high-density SNP data by identifying haplotype blocks. Bioinformatics 35, 4419–4421. doi: 10.1093/bioinformatics/btz308
Kim, W.-Y., Hicks, K. A., and Somers, D. E. (2005). Independent roles for EARLY FLOWERING 3 and ZEITLUPE in the control of circadian timing, hypocotyl length, and flowering time. Plant Physiol. 139, 1557–1569. doi: 10.1104/pp.105.067173
Kimber, G., and Tsunewaki, K. (1988). “Genome symbols and plasma types in the wheat group,” in Department of Agronomy, eds T. E. Miller and R. M. D. Koebner (Columbia, MO: University of Missouri).
Kolmer, J. A., Chen, X., and Jin, Y. (2009). “Diseases which challenge global wheat production—the wheat rusts,” in Wheat Science and Trade, ed. B. F. Carver (Ames, IA: Wiley-Blackwell), 89–124. doi: 10.1002/9780813818832.ch5
Krattinger, S. G., Lagudah, E. S., Spielmeyer, W., Singh, R. P., Huerta-Espino, J., McFadden, H., et al. (2009). A putative ABC transporter confers durable resistance to multiple fungal pathogens in wheat. Science 323, 1360–1363. doi: 10.1126/science.1166453
Kumar, S., Stecher, G., Peterson, D., and Tamura, K. (2012). MEGA-CC: computing core of molecular evolutionary genetics analysis program for automated and iterative data analysis. Bioinformatics 28, 2685–2686. doi: 10.1093/bioinformatics/bts507
Kuznetsova, A., Brockhoff, P. B., and Christensen, R. H. B. (2017). lmerTest package: tests in linear mixed effects models. J. Stat. Softw. 82, 1–26. doi: 10.18637/jss.v082.i13
Lage, J., Warburton, M. L., Crossa, J., Skovmand, B., and Andersen, S. B. (2003). Assessment of genetic diversity in synthetic hexaploid wheats and their Triticum dicoccum and Aegilops tauschii parents using AFLPs and agronomic traits. Euphytica 134, 305–317. doi: 10.1023/B:EUPH.0000004953.85283.f4
Letunic, I., and Bork, P. (2016). Interactive tree of life (iTOL) v3: an online tool for the display and annotation of phylogenetic and other trees. Nucleic Acids Res. 44, W242–W245. doi: 10.1093/nar/gkw290
Liang, Z., Chen, K., Li, T., Zhang, Y., Wang, Y., Zhao, Q., et al. (2017). Efficient DNA-free genome editing of bread wheat using CRISPR/Cas9 ribonucleoprotein complexes. Nat. Commun. 8:14261. doi: 10.1038/ncomms14261
Long, D. L., and Kolmer, J. A. (1989). A north American system of nomenclature for Puccinia recondita f. sp. tritici. Phytopathology 79, 525–529. doi: 10.1094/Phyto-79-525
Luu, K., Bazin, E., and Blum, M. G. B. (2017). Pcadapt: an R package to perform genome scans for selection based on principal component analysis. Mol. Ecol. Resour. 17, 67–77. doi: 10.1111/1755-0998.12592
McCallum, B., Hiebert, C., Huerta-Espino, J., and Cloutier, S. (2012). “Wheat leaf rust,” in Disease Resistance in Wheat, ed. I. Sharma (Wallingford: CAB International), 33–62. doi: 10.1079/9781845938185.0033
McCallum, B. D., Hiebert, C. W., Cloutier, S., Bakkeren, G., Rosa, S. B., Humphreys, D. G., et al. (2016). A review of wheat leaf rust research and the development of resistant cultivars in Canada. Can. J. Plant Pathol. 38, 1–18. doi: 10.1080/07060661.2016.1145598
McCallum, B. D., and Seto-Goh, P. (2006). Physiologic specialization of Puccinia triticina, the causal agent of wheat leaf rust, in Canada in 2003. Can. J. Plant Sci. 28, 208–213. doi: 10.1080/07060660609507288
McCartney, C. A., Somers, D. J., McCallum, B. D., Thomas, J., Humphreys, D. G., Menzies, J. G., et al. (2005). Microsatellite tagging of the leaf rust resistance gene Lr16 on wheat chromosome 2BSc. Mol. Breed. 15, 329–337. doi: 10.1007/s11032-004-5948-7
McFadden, E. S., and Sears, E. R. (1946). The origin of Triticum spelta and its free-threshing hexaploid relatives. J. Hered. 37, 81–89. doi: 10.1093/oxfordjournals.jhered.a105590
McIntosh, R., Miller, T., and Chapman, V. (1982). Cytogentical studies in wheat. XII: Lr28 for resistance to Puccinia recondita and Sr34 for resistance to P. graminis tritici. Z. Pflanzenzuchtg. 89, 295–306.
Mi, X., Wegenast, T., Utz, H. F., Dhillon, B. S., and Melchinger, A. E. (2011). Best linear unbiased prediction and optimum allocation of test resources in maize breeding with doubled haploids. Theor. Appl. Genet. 123, 1–10. doi: 10.1007/s00122-011-1561-4
Miki, Y., Yoshida, K., Mizuno, N., Nasuda, S., Sato, K., and Takumi, S. (2019). Origin of wheat B-genome chromosomes inferred from RNA sequencing analysis of leaf transcripts from section Sitopsis species of Aegilops. DNA Res. 26, 171–182. doi: 10.1093/dnares/dsy047
Moore, J. W., Herrera-Foessel, S., Lan, C., Schnippenkoetter, W., Ayliffe, M., Huerta-Espino, J., et al. (2015). A recently evolved hexose transporter variant confers resistance to multiple pathogens in wheat. Nat. Gen. 47, 1494–1498. doi: 10.1038/ng.3439
Park, R. F., Mohler, V., Nazari, K., and Singh, D. (2014). Characterisation and mapping of gene Lr73 conferring seedling resistance to Puccinia triticina in common wheat. Theor. Appl. Genet. 127, 2041–2049. doi: 10.1007/s00122-014-2359-y
Peterson, R. F., Campbell, A. B., and Hannah, A. E. (1948). A diagrammatic scale for estimating rust intensity on leaves and stems of cereals. Can. J. Res. 26c, 496–500. doi: 10.1139/cjr48c-033
Pont, C., Leroy, T., Seidel, M., Tondelli, A., Duchemin, W., Armisen, D., et al. (2019). Tracing the ancestry of modern bread wheats. Nat. Gen. 51, 905–911. doi: 10.1038/s41588-019-0393-z
Ren, W.-L., Wen, Y.-J., Dunwell, J. M., and Zhang, Y.-M. (2018). pKWmEB: integration of Kruskal–Wallis test with empirical Bayes under polygenic background control for multi-locus genome-wide association study. Heredity 120, 208–218. doi: 10.1038/s41437-017-0007-4
Riaz, A., Athiyannan, N., Periyannan, S. K., Afanasenko, O., Mitrofanova, O. P., Platz, G. J., et al. (2018). Unlocking new alleles for leaf rust resistance in the Vavilov wheat collection. Theor. Appl. Genet. 131, 127–144. doi: 10.1007/s00122-017-2990-5
Roelfs, A. P., and Martens, J. W. (1988). An international system of nomenclature for Puccinia graminis f. sp. tritici. Phytopathology 78, 526–533. doi: 10.1094/Phyto-78-526
Samborski, D. J. (1985). “Wheat leaf rust,” in The Cereal Rusts, eds A. P. Roelfs and W. R. Bushnell (Orlando, FL: Academic Press), 39–59. doi: 10.1016/b978-0-12-148402-6.50010-9
Sasanuma, T., Miyashita, N. T., and Tsunewaki, K. (1996). Wheat phylogeny determined by RFLP analysis of nuclear DNA. 3. Intra- and interspecific variations of five Aegilops Sitopsis species. Theor. Appl. Genet. 92, 928–934. doi: 10.1007/BF00224032
Segura, V., Vilhjálmsson, B. J., Platt, A., Korte, A., Seren, Ü., Long, Q., et al. (2012). An efficient multi-locus mixed-model approach for genome-wide association studies in structured populations. Nat. Gen. 44, 825–830. doi: 10.1038/ng.2314
Shang, Y. (2009). Characterization of a PDR type ABC transporter gene from wheat (Triticum aestivum L.). Chin. Sci. Bull. 54, 3249–3257. doi: 10.1007/s11434-009-0553-0
Shi, G., Zhang, Z., Friesen, T. L., Raats, D., Fahima, T., Brueggeman, R. S., et al. (2016). The hijacking of a receptor kinase–driven pathway by a wheat fungal pathogen leads to disease. Sci. Adv. 2:e1600822. doi: 10.1126/sciadv.1600822
Sohail, Y., Bansal, U. K., Bariana, H. S., Chhuneja, P., Mumtaz, A., Rattu, A., et al. (2014). Identification of a co-dominant eSTS marker linked with leaf rust resistance gene Lr28 in wheat (Triticum aestivum L.). Aust. J. Crop Sci. 8, 1210–1215. doi: 10.13140/2.1.4628.5444
Stakman, E., Stewart, D., and Loegering, W. (1962). Identification of Physiologic Races of Puccinia graminis var. tritici. St. Paul, MN: USDA-ARS.
Steuernagel, B., Witek, K., Krattinger, S. G., Ramirez-Gonzalez, R. H., Schoonbeek, H.-J., Yu, G., et al. (2020). The NLR-Annotator tool enables annotation of the intracellular immune receptor repertoire. Plant Physiol. 183, 468–482. doi: 10.1104/pp.19.01273
Tamba, C. L., Ni, Y.-L., and Zhang, Y.-M. (2017). Iterative sure independence screening EM-Bayesian LASSO algorithm for multi-locus genome-wide association studies. PLoS Comput. Biol. 13:e1005357. doi: 10.1371/journal.pcbi.1005357
Tamba, C. L., and Zhang, Y.-M. (2018). A fast mrMLM algorithm for multi-locus genome-wide association studies. bioRxiv [Preprint] doi: 10.1101/341784
Tanksley, S. D., and McCouch, S. R. (1997). Seed banks and molecular maps: unlocking genetic potential from the wild. Science 277, 1063–1066. doi: 10.1126/science.277.5329.1063
Thind, A. K., Wicker, T., Šimková, H., Fossati, D., Moullet, O., Brabant, C., et al. (2017). Rapid cloning of genes in hexaploid wheat using cultivar-specific long-range chromosome assembly. Nat. Biotechnol. 35, 793–796. doi: 10.1038/nbt.3877
Thomas, J. (2010). Genetic markers and leaf rust resistance of the wheat gene Lr32. Crop Sci. 50, 2310–2317. doi: 10.2135/cropsci2010.02.0065
Wang, S., Wong, D., Forrest, K., Allen, A., Chao, S., Huang, B. E., et al. (2014). Characterization of polyploid wheat genomic diversity using a high-density 90,000 single nucleotide polymorphism array. Plant Biotechnol. J. 12, 787–796. doi: 10.1111/pbi.12183
Wang, S.-B., Feng, J.-Y., Ren, W.-L., Huang, B., Zhou, L., Wen, Y.-J., et al. (2016). Improving power and accuracy of genome-wide association studies via a multi-locus mixed linear model methodology. Sci. Rep. 6:19444. doi: 10.1038/srep19444
Wang, S.-X., Zhu, Y.-L., Zhang, D.-X., Shao, H., Liu, P., Hu, J.-B., et al. (2017). Genome-wide association study for grain yield and related traits in elite wheat varieties and advanced lines using SNP markers. PLoS One 12:e0188662. doi: 10.1371/journal.pone.0188662
Wang, W., Pan, Q., He, F., Akhunova, A., Chao, S., Trick, H., et al. (2018). Transgenerational CRISPR-Cas9 activity facilitates multiplex gene editing in allopolyploid wheat. CRISPR J. 1, 65–74. doi: 10.1089/crispr.2017.0010
Wen, Y.-J., Zhang, H., Ni, Y.-L., Huang, B., Zhang, J., Feng, J.-Y., et al. (2018). Methodological implementation of mixed linear models in multi-locus genome-wide association studies. Brief. Bioinform. 19, 700–712. doi: 10.1093/bib/bbw145
Winfield, M. O., Allen, A. M., Burridge, A. J., Barker, G. L. A., Benbow, H. R., Wilkinson, P. A., et al. (2016). High-density SNP genotyping array for hexaploid wheat and its secondary and tertiary gene pool. Plant Biotechnol. J. 14, 1195–1206. doi: 10.1111/pbi.12485
Wulff, B. B. H., and Moscou, M. J. (2014). Strategies for transferring resistance into wheat: from wide crosses to GM cassettes. Front. Plant Sci. 5:692. doi: 10.3389/fpls.2014.00692
Keywords: wheat, leaf rust, GWAS, QTN, genotyping array, single nucleotide polymorphism, Aegilops, Triticum
Citation: Fatima F, McCallum BD, Pozniak CJ, Hiebert CW, McCartney CA, Fedak G, You FM and Cloutier S (2020) Identification of New Leaf Rust Resistance Loci in Wheat and Wild Relatives by Array-Based SNP Genotyping and Association Genetics. Front. Plant Sci. 11:583738. doi: 10.3389/fpls.2020.583738
Received: 19 July 2020; Accepted: 15 October 2020;
Published: 16 November 2020.
Edited by:
Jacqueline Batley, The University of Western Australia, AustraliaReviewed by:
Parveen Chhuneja, Punjab Agricultural University, IndiaJason Fiedler, United States Department of Agriculture (USDA), United States
Copyright © 2020 Her Majesty the Queen in Right of Canada – that is, by the Government of Canada, as represented by the Minister of Agriculture and Agri-Food. This is an open-access article distributed under the terms of the Creative Commons Attribution License (CC BY). The use, distribution or reproduction in other forums is permitted, provided the original author(s) and the copyright owner(s) are credited and that the original publication in this journal is cited, in accordance with accepted academic practice. No use, distribution or reproduction is permitted which does not comply with these terms.
*Correspondence: Sylvie Cloutier, SylvieJ.Cloutier@Canada.ca