 Victor Allan1†
 Mani Vetriventhan2*†
 Ramachandran Senthil2†
 S. Geetha1†
 Santosh Deshpande2†
 Abhishek Rathore2†
 Vinod Kumar2†
 Prabhat Singh2†
 Surender Reddymalla2†
 Vânia C. R. Azevedo2*†
- 1Centre for Plant Breeding and Genetics, Tamil Nadu Agricultural University (TNAU), Coimbatore, India
- 2International Crops Research Institute for the Semi-Arid Tropics (ICRISAT), Hyderabad, India
Germplasm should be conserved in such a way that the genetic integrity of a given accession is maintained. In most genebanks, landraces constitute a major portion of collections, wherein the extent of genetic diversity within and among landraces of crops vary depending on the extent of outcrossing and selection intensity infused by farmers. In this study, we assessed the level of diversity within and among 108 diverse landraces and wild accessions using both phenotypic and genotypic characterization. This included 36 accessions in each of sorghum, pearl millet, and pigeonpea, conserved at ICRISAT genebank. We genotyped about 15 to 25 individuals within each accession, totaling 1,980 individuals using the DArTSeq approach. This resulted in 45,249, 19,052, and 8,211 high-quality single nucleotide polymorphisms (SNPs) in pearl millet, sorghum, and pigeonpea, respectively. Sorghum had the lowest average phenotypic (0.090) and genotypic (0.135) within accession distances, while pearl millet had the highest average phenotypic (0.227) and genotypic (0.245) distances. Pigeonpea had an average of 0.203 phenotypic and 0.168 genotypic within accession distances. Analysis of molecular variance also confirms the lowest variability within accessions of sorghum (26.3%) and the highest of 80.2% in pearl millet, while an intermediate in pigeonpea (57.0%). The effective sample size required to capture maximum variability and to retain rare alleles while regeneration ranged from 47 to 101 for sorghum, 155 to 203 for pearl millet, and 77 to 89 for pigeonpea accessions. This study will support genebank curators, in understanding the dynamics of population within and among accessions, in devising appropriate germplasm conservation strategies, and aid in their utilization for crop improvement.
Introduction
Plant genetic resources include landraces, wild and weedy relatives, improved cultivars, etc. which are of potential value as a resource for present and future generations of people. Landraces occupy a major portion in collections conserved in genebanks. Landraces possess a multifaceted evolutionary history and a vast diversity, primarily associated with humans, also influenced by both natural and farmers' informal selections (Hawkes, 1983). The high variability and genetic diversity of landraces are well-known. Harlan (1965) reported the gene-flow from weeds to landraces and several other authors (Ellstrand et al., 1999; Jarvis and Hodgkin, 1999; Messeguer, 2003; Gompert and Buerkle, 2016) reported the transfer and diffusion of genes into landraces from various sources in both self and out-crossing species. Harlan (1971) emphasized landraces as genetically dynamic populations, and a result of millennia of artificial and natural selection, also Hawkes (1983) described landraces as highly diverse populations or a mixture of heterogenous genotypes, and several other authors proposed various definitions to landraces, explaining their heterogeneity and genetic nature (Brown, 1978; Martin and Adams, 1987; Astley, 1991; Michaelis et al., 1991). Brown (1978), Bellon (2009), and Frankel and Soulé (1981) explained the occurrence of within and between population genetic variation in landrace populations and further explained the within-population diversity is mainly an effect of heterogeneity over space and time. Many pieces of literature are available emphasizing the high variability in landraces, however, only a few studies are available investigating diversity within individuals of landrace accessions that are conserved in genebanks (Busso et al., 2000; Bhattacharjee et al., 2002), while few other studies focused on diversity within landrace populations conserved in situ (Djè et al., 1999; Pressoir and Berthaud, 2004; Dreisigacker et al., 2005; Al Khanjari et al., 2007; Jones et al., 2008; Hagenblad et al., 2012; Kyratzis et al., 2019).
Therefore, understanding the diversity within landraces is essential to make sure that, in genebanks the genetic integrity of a given accession is maintained with its innate variability and diversity without losing any rare allele variants. The major cause for allele loss in genebank accessions is genetic drift when accessions are regenerated with small sample sizes (Crossa, 1995). Mode of pollination being the key factor governing the frequencies of alleles within different individuals of a population, it influences the variability, quantum of diversity, gene flow and population dynamics behind evolution. Hammer et al. (1996) explained the effect of mode of pollination on genetic erosion of landraces, Zeven (1998) explained the attainment of gradual homozygosity within inbreeding landrace populations, and Villa et al. (2005) explained the influence of mode of reproduction in alteration of genetic structure of landraces. Genebanks exercise various scientific strategies to preserve the inherent genetic variability within each accession with theoretical foundations of various population genetic considerations, mainly the mode of reproduction, allelic frequencies, distribution of allelic variations, the proportion of rare alleles, etc. to maintain the genetic integrity of an accession. Rare alleles, however, are easily susceptible to random genetic drifts and can be lost permanently (Ramanatha Rao and Hodgkin, 2002) when handled with inadequate scientific knowledge about the underlying population dynamics. Thus, appropriate conservation strategies with statistically estimated population sizes should be followed. In this study, we have chosen three crops that differ in pollination behavior, including highly cross pollinated pearl millet (>85%) (Burton, 1983), and often-cross pollinated sorghum (about 18%) (Barnaud et al., 2008) and pigeonpea (about 30%) (Saxena et al., 1990), to comparatively assess the within and between accession diversity. Landraces of these crops possess large variability within accessions, therefore chosen for this study.
Classical molecular markers used to assess the genetic diversity in these crops included SSR (Budak et al., 2003; Chandra-Shekara et al., 2007; Bashir et al., 2015), RFLP (Bhattacharjee et al., 2002; Govindaraj et al., 2009), ISSR (Kumar et al., 2006; Animasaun et al., 2015), RAPD (Chowdari et al., 1998; Chandra-Shekara et al., 2007), SRAP (Xie et al., 2010), etc. However, these molecular markers had constrains such as high cost of genotyping per sample and most of these technologies are gel-based and lacked the ability to rapidly analyze large number of marker loci. Recent technological developments in high throughput genotyping overcame these limitations and technologies like DArTSeq, by combining DArT (Diversity Array Technology) with NGS (Next Generation Sequencing), offered the flexibility of genome-wide characterization of germplasms, even without prior sequence information, parallelly providing a low-cost platform for high throughput marker genotyping. Several studies using DArTSeq on diversity and population structure assessments have been reported on various crops evidencing the potential scope of this technology in diversity assessment (Pailles et al., 2017; Raman et al., 2017; Barilli et al., 2018; Edet et al., 2018; Ndjiondjop et al., 2018). What makes DArTSeq to stand apart from other GBS (Genotyping By Sequencing) techniques is their method of complexity reduction that are targeted over the genomic coding regions and the additional advantage of genotyping without prior sequence information extents its scope even toward the under researched wild accessions. It also offers relatively better genome coverage with high reproducibility as DArTSeq is performed at higher sequencing depths and uses strict filtering criterions, it generates markers with less missing data compared to other GBS approaches.
With these background, this study aims (i) to assess genotypic (DArTSeq) and phenotypic characterization of geographically representative diverse sorghum, pearl millet, and pigeonpea landraces and wild accessions to comparatively investigate the extent of diversity within and among accessions, and (ii) to assess the minimum sample (population) size required to capture 95% of the alleles with an expected probability of 95%, from the least frequent allele or from the frequency of the rarest allele for each accession. The scope of this study aims to benefit genebank curators in understanding the dynamics of population within and among accessions, and devising proper sampling strategies (sample size) while regeneration, for effective genebank management and for their utilization in crop improvement. To the best of our knowledge, this study is the first of its kind, and no studies were found utilizing NGS for investigating within accession diversity and sample size estimations, particularly for sorghum, pigeonpea, and pearl millet.
Materials and Methods
Plant Material
This study investigated a total of 108 geographically diverse accessions of sorghum, pearl millet, and pigeonpea (Supplementary Tables 1–3) (Figure 1), conserved at ICRISAT genebank. Accessions of sorghum included 31 landraces and 5 wild accessions, collected from 26 different countries from 5 different continents, consisted of all the 5 basic races and all 10 intermediate races as classified by Harlan and de Wet (1972). Accessions of pearl millet consisted of 33 landraces and 3 wild accessions, collected from 19 different countries from 2 different continents, and accessions of pigeonpea included 36 landraces collected from 34 different countries from 5 different continents. All these 108 accessions were raised in fields during post-rainy 2018 at ICRISAT, Hyderabad, for phenotypic and genotypic characterization. Sorghum accessions were sown on black soil, whereas pearl millet and pigeonpea were sown on red soil. Accessions of sorghum occupied three-rows of 9 m length, spaced 75 cm between rows, with a plant-to-plant spacing of about 10 cm. Accessions of pearl millet were laid in 4-meter rows, with each accession occupying 4 rows, spaced 75 cm between rows and 10 cm between plants. Each accession of pigeonpea occupied two rows of 9-meter length, spaced ~75 cm between rows and 50 cm between plants.
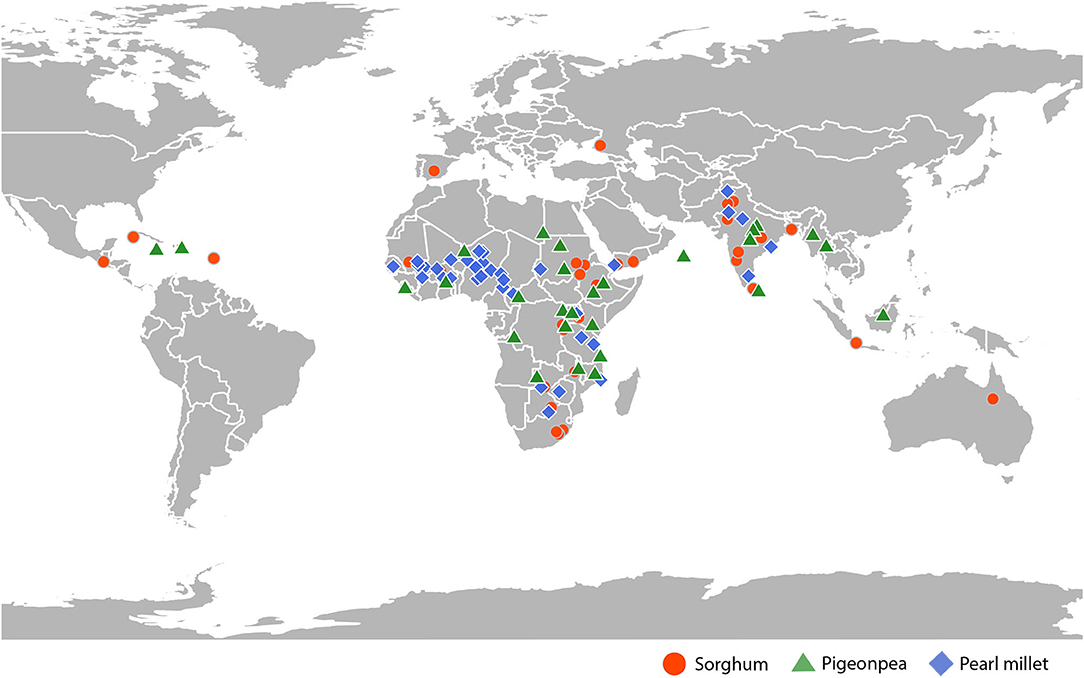
Figure 1. Geographical distribution of the sorghum, pigeonpea, and pearl millet accessions used in this study over continents.
DNA Extraction, Complexity Reduction and Genotyping
Individual plants within each accession of sorghum, pearl millet, and pigeonpea were labeled with unique plant ID, and leaf samples were collected from 15 plants in each accession of sorghum and pigeonpea, and 25 plants from each accession of pearl millet, totaling a 540, 900 and 540 samples in sorghum, pearl millet, and pigeonpea respectively. Leaf samples were collected from 15 days old seedlings of sorghum and pearl millet, and 2-month old seedlings of pigeonpea. Collected leaf samples were sealed in zip lock bags or collected using the PCR plates with corresponding plant ID for each sample and packed with ice cubes, and sent for DNA extraction on the same day. The DNA extraction was carried out following the procedure reported by Mace et al. (2003) and the extracted genomic DNA samples were sent to DArT Private Limited in Canberra, Australia (www.diversityarrays.com) for DArTSeq genotyping.
SNP Filtering
The SNP markers from DArTSeq were filtered with a maximum threshold of 95% reproducibility, 80% call rate for markers, and 50% missing values over samples. The SNPs were not filtered for minor allele frequencies (MAF) in order to preserve the rare allele variants, which have the main part of the focus in this study.
Phenotypic Evaluation
To capture maximum phenotypic variability, all the individual plants within each accession were labeled with unique plant ID and data on both qualitative and quantitative traits (Supplementary Table 4) were recorded for all the 3 crops following the respective crop descriptors (IBPGR and ICRISAT, 1993a,b,c), throughout the growing season. In this study, a large number of plants including those plants that were used for DArTSeq and also plants that were not sampled for DArTSeq were phenotyped. The total plant count for each accession ranged from 115 to 234 in sorghum, 51 to 116 in pearl millet. However, in pigeonpea, only 35 accessions had plant count over 10. Two accessions of pigeonpea had a plant count of <14, and remaining accessions had plant counts between 21 and 33. Thus, only data from the 35 accessions of pigeonpea was used for phenotypic analysis.
Phenotypic Data Analysis
Descriptive statistics such as mean, standard deviation, and standard error were computed for quantitative traits to assess the spread and distribution of the data. Preliminary analysis of phenotypic data included investigating diversity among accessions using the mean and range values. This was followed by post-hoc tests, which included Student Newman Keuls test (Newman, 1939; Keuls, 1952) and Levene's test (Levene, 1960) to verify statistical significance between means and homogeneity of variances, respectively. Gower distance metric (Gower, 1971) was used for within accession diversity assessment using both quantitative and qualitative data. Pairwise distances between individual plants were subjected to the ward.D2 agglomerative clustering algorithm (Murtagh and Legendre, 2014) with 100 bootstraps. The same set of analyses were applied to all three crops. R software v.3.6.0 (R Core Team, 2019) was used with R-CRAN packages like “cluster” (Maechler et al., 2019) for Gower's distance computation, “fpc” (Hennig, 2020) and “pvclust” (Suzuki et al., 2019) for bootstrapped clustering, “car” (Fox and Weisberg, 2019) and “agricolae” (de Mendiburu, 2013) for SNK test and Levene's test, respectively.
Genotypic Data Analysis
DArTSeq derived SNP data after filtering were used for analysis. Analysis of Molecular Variance (AMOVA) was computed as proposed by Excoffier et al. (1992), which partitioned the total variance into within and among population variance components. AMOVA was carried out considering each accession (with 15 or 25 individuals) as a separate population. For testing the significance, results of AMOVA were subjected to Monte Carlo's estimate of p-values with 99 permutations. Heterozygosity was estimated as reported by Nei (1973). For diversity assessment, Euclidean based modified Roger's distance metric (Goodman and Stuber, 1983) was used and distances between individual plants were computed, which was followed by ward.D2 agglomerative clustering (Murtagh and Legendre, 2014) and a dendrogram was produced. The “clusterboot” function from the R-package “fpc” (Hennig, 2020) and the “aboot” function from the R-package “poppr” (Kamvar et al., 2015) were used to evaluate the clusters with 100 bootstraps. Shannon diversity (H′) (Shannon, 1948) was calculated for each accession using the formula,
Where pi is the estimated frequency of the allele “a” on the whole sample and A is the total number of alleles in the sample.
Population structure was assessed by DAPC (Discriminant Analysis of Principle Components) using posterior membership probabilities while assessing the membership stability by estimation of a-scores. Phenotypic and genotypic distance matrices were subjected to Mantel's correlation with permutation tests (Mantel, 1967). The minimum seed sample size required to capture 95% of alleles within an accession with a 95% certainty, during sampling for regeneration, was calculated as reported by Crossa (1989) for each accession. Considering the rarest biallelic locus (SNP), two alleles B1 and B2with frequencies of p1and p2, so that (p1 + p2 = 1), the two possible outcomes will be,
Thus the probability of getting at least one copy of the each B1 and B2will be ,
All the above-mentioned analyses were performed using R software v.3.6.0 (R Core Team, 2019). Custom scripted codes were used for filtering, distance matrix, heterozygosity estimations, and seed sample size computations, also packages from R- CRAN and GitHub like “adegenet” (Jombart, 2008) and “ade4” (Dray et al., 2007) were used for computation of AMOVA and Mantel's test, respectively.
Results
Phenotyping
Descriptive Statistics and post-hoc Tests
The variations in the mean and range estimates indicated considerable variability among landraces and wild accessions of sorghum, pearl millet and pigeonpea. The SNK test indicated significant (p ≤ 0.05) mean differences among accessions (Supplementary Table 5). Levene's test indicated heterogeneous variances for all the quantitative traits in sorghum, pearl millet, and pigeonpea (Supplementary Table 6).
Phenotypic Diversity: Within and Between Accessions
The Gower's phenotypic distance matrix (Gower, 1971) was computed to obtain pairwise distances between plants of all the accessions. Within accession distances varied from 0.038 to 0.141, 0.145 to 0.271, and 0.071 to 0.410 for sorghum, pearl millet, and pigeonpea, respectively (Table 1). In sorghum IS 13215 (0.141) had the maximum mean within accession distance followed by IS 31637 (0.136) and IS 27325 (0.136), and the accession IS 12919 (0.038) showed the lowest within accession distance followed by IS 13065 (0.046) and IS 2134 (0.048). In pearl millet, IP 12138 (0.271) showed the maximum within accession distance followed by the accessions IP 13112 (0.270) and IP 8761 (0.268), whereas the accession IP 21640 (0.145) had the lowest within accession distance followed by IP 22039 (0.159) and IP 21752 (0.162). In pigeonpea, ICP 13545 (0.410) showed the highest mean within accession distance followed by ICP 12840 (0.317) and ICP 10889 (0.299), whereas the least was noticed in ICP 7035 (0.071) followed by ICP 11485 (0.092) and ICP 9124 (0.094). The wild accessions of pearl millet had the minimum within accession distance [IP 21640 (0.145), IP 22039 (0.159), and IP 21752 (0.162)], in comparison to the overall scale of mean distance values of landraces (0.194–0.271). The same scenario was observed in sorghum where the wild accessions IS 14485 (0.065), IS 10897 (0.092), IS 11005 (0.077), IS 18833 (0.087), and IS 22428 (0.076) had low phenotypic within accession distances in comparison to the overall range of within accession distance values of landraces (0.038–0.141). On an average, distance among accessions was found to be higher than that of within accessions distance in all the three crops. Between accessions distance values were higher in accessions of sorghum (mean 0.387; range 0.308–0.415), followed by pigeonpea (mean 0.302; range 0.252–0.388), while low in pearl millet (mean 0.271; range 0.245–0.310) (Table 1).
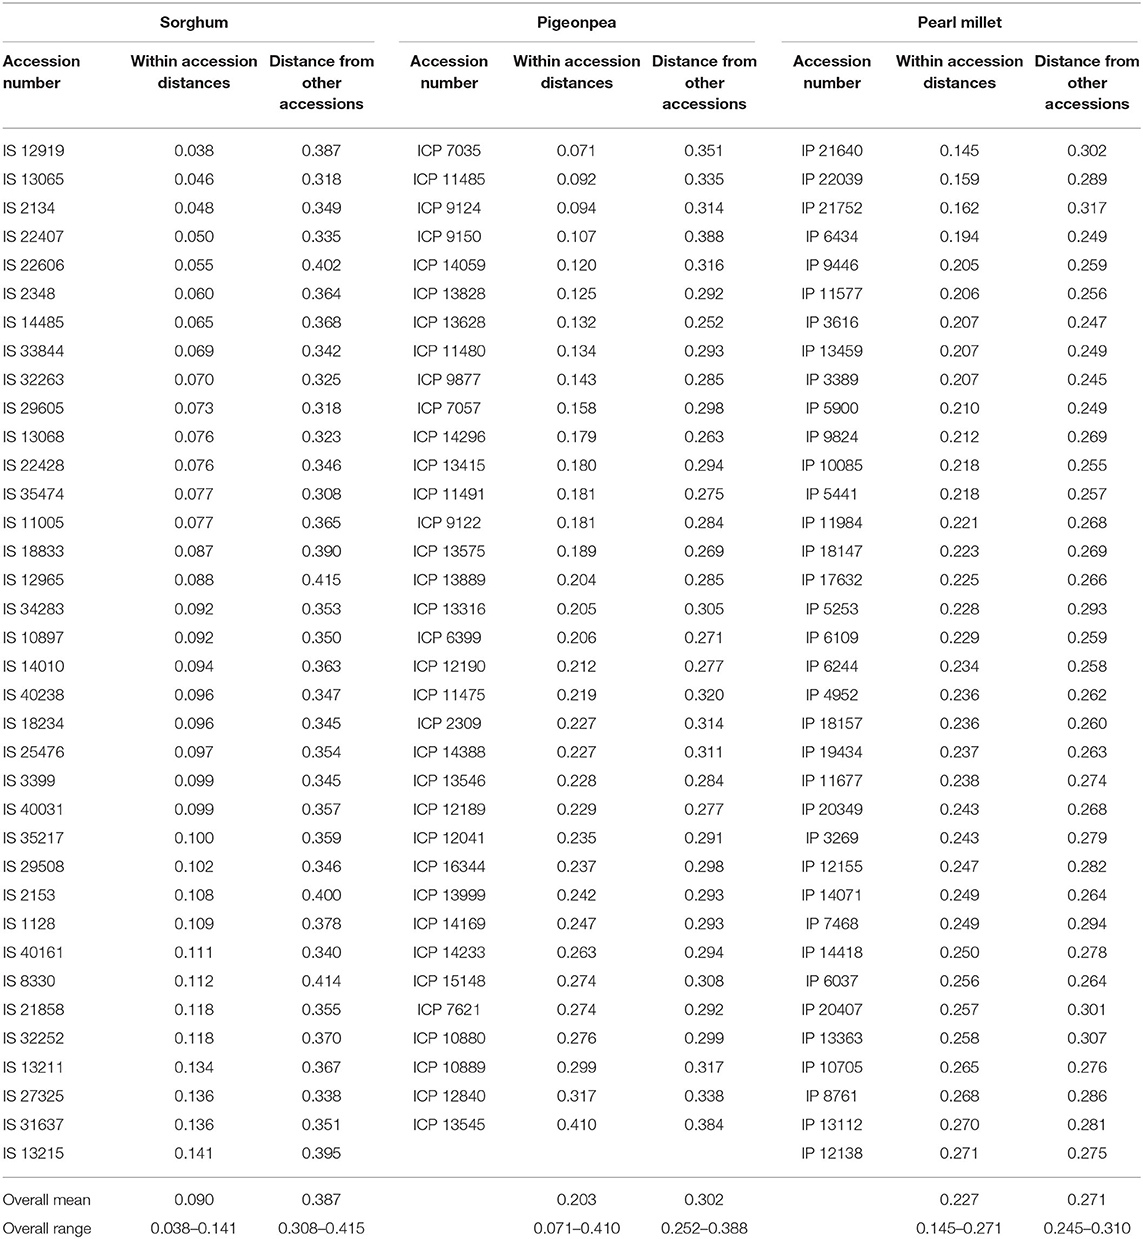
Table 1. Mean phenotypic distances within and between accessions of sorghum, pigeonpea, and pearl millet.
Hierarchal clustering was constructed based on Gower's phenotypic distance, and the number of clusters was decided based on the number of accessions in each crop from which the data were collected. Thus, dendrogram trees were cut at 36 clusters for sorghum and pearl millet, and 35 clusters for pigeonpea, with the assumption that the individuals within accession clusters together. A cluster membership bar-plot was generated to visualize distribution or migration of individuals of different accessions to different clusters. The cluster wise stability was evaluated using the “clusterboot” function from the “fpc” package. The Jaccard coefficients between clusters of resampled data were >70 for 35 clusters in sorghum, 15 clusters in pigeonpea, and 16 clusters in pearl millet (Supplementary Table 7) and the remaining clusters showed values <70. The bootstrapped cluster dendrograms were plotted with approximately unbiased p-values (AU) and bootstrap probability (Supplementary Figures 1A–C) calculated using multiscale bootstrap resampling in the R-package “pvclust.” Bootstrap values were low in some cases of pearl millet and pigeonpea and this low bootstrap values would be a combined outcome of high variability in the data, large number of variable individuals, and the nature of clustering algorithm. Supporting the high variability and presence of valid clusters in the data, the “pvpick” function from the “pvclust” R-package yielded 66, 738, and 109 significant clusters in sorghum, pearl millet, and pigeonpea, respectively. Thus, the presence of large number of significant clusters within the studied accessions illustrates the higher variability for the observed traits and ultimately represents the higher diversity within the studied landraces. In sorghum, except cluster numbers 7, 13, and 14 all other 33 clusters have shown exclusive clustering of each accession into singleton clusters (Figure 2A). In cluster number 7, individuals of entries IS 8330 and IS 12965 were found to clustered together. The individuals of accession IS 2153 were found to be distributed in two clusters (58 individuals in cluster 14 and 139 individuals in cluster 13). In pearl millet and pigeonpea, clustering patterns showed that in most accessions, the individuals were not clustered uniquely, and found mixed with other accessions. In pigeonpea all the individuals of three accessions ICP 9150, ICP 7035, and ICP 11485 were clustered in clusters 1, 10, and 14, respectively. However, in ICP 9124, except a single individual all the other individuals were clustered in cluster 16 (Figure 2B). In pearl millet, no exclusive clusters were observed and all the 36 clusters showed mixing of individuals from different accessions (Figure 2C). However, The majority of individuals of wild accessions (IP 21640, IP 21752, and IP 22039) were distributed in 3 clusters (C-1, C-2, and C-3) showing their phenotypic similarity.
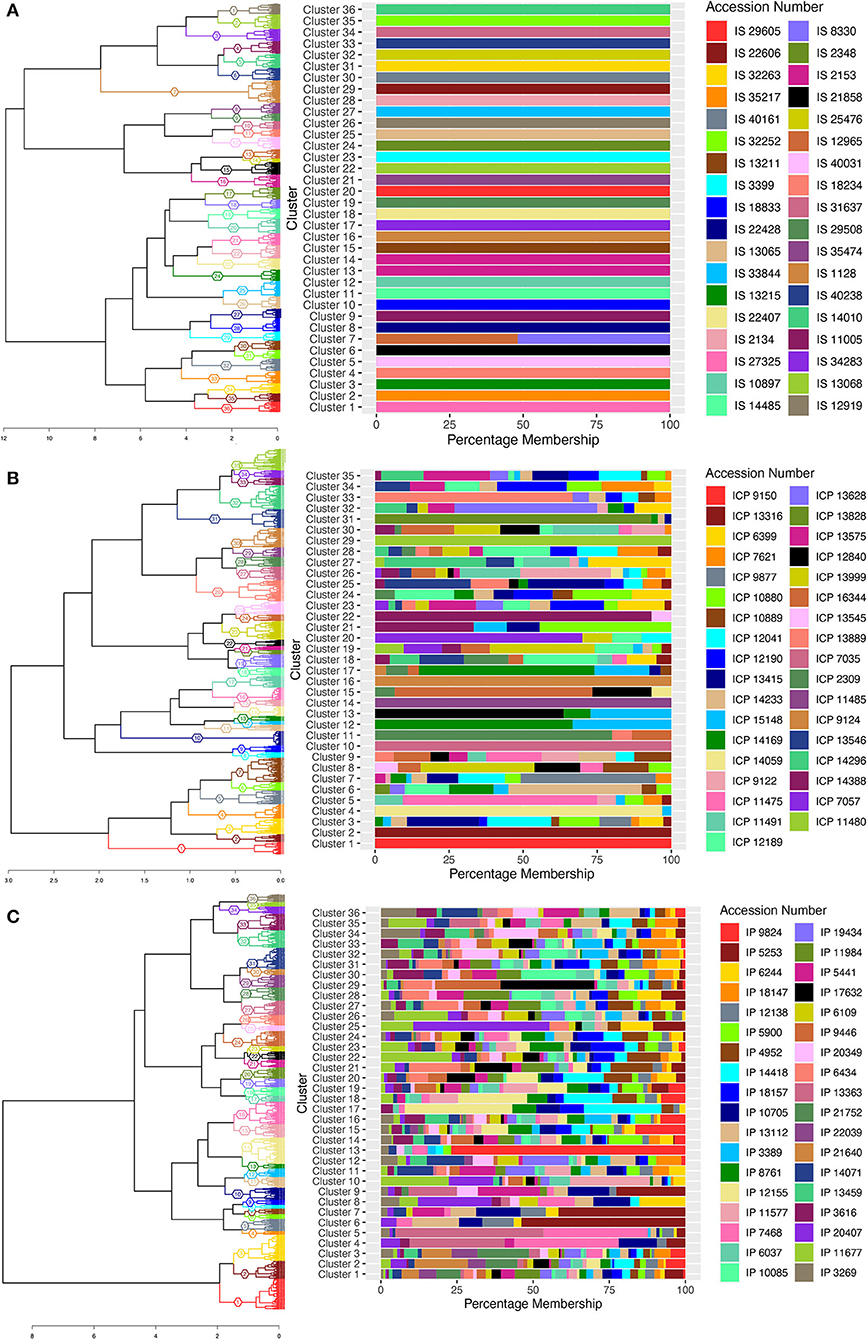
Figure 2. Cluster dendrogram of single plant phenotypic distances, using ward.D2 clustering algorithm, 36, 35, and 36 clusters for sorghum, pigeonpea, and pearl millet, respectively, represented with colors and cluster numbers, with percentage membership of accessions into each cluster denoted by colors in the adjacent bar graph. (A) the cluster dendrogram for sorghum, (B) the cluster dendrogram for pigeonpea, and (C) the cluster dendrogram for pearl millet.
Genotypic Diversity
After filtering, we obtained 45,249 SNPs from a total of 76,753 SNPs in pearl millet, 19,052 SNPs from a total of 38,898 SNPs in sorghum, and 8,211 SNPs from a total of 10,096 SNPs in pigeonpea. The SNPs displayed good coverage across genome in all the three crops (Figure 3). Over the 10 chromosomes of sorghum the number of SNPs ranged from 909 to 2,988, and over the 7 chromosomes of pearl millet the number of SNPs ranged from 5,086 to 6,639, and from 121 to 755 over the 11 chromosomes of pigeonpea. The information of number of SNPs in each chromosome of sorghum, pearl millet and pigeonpea is presented in Supplementary Table 8.
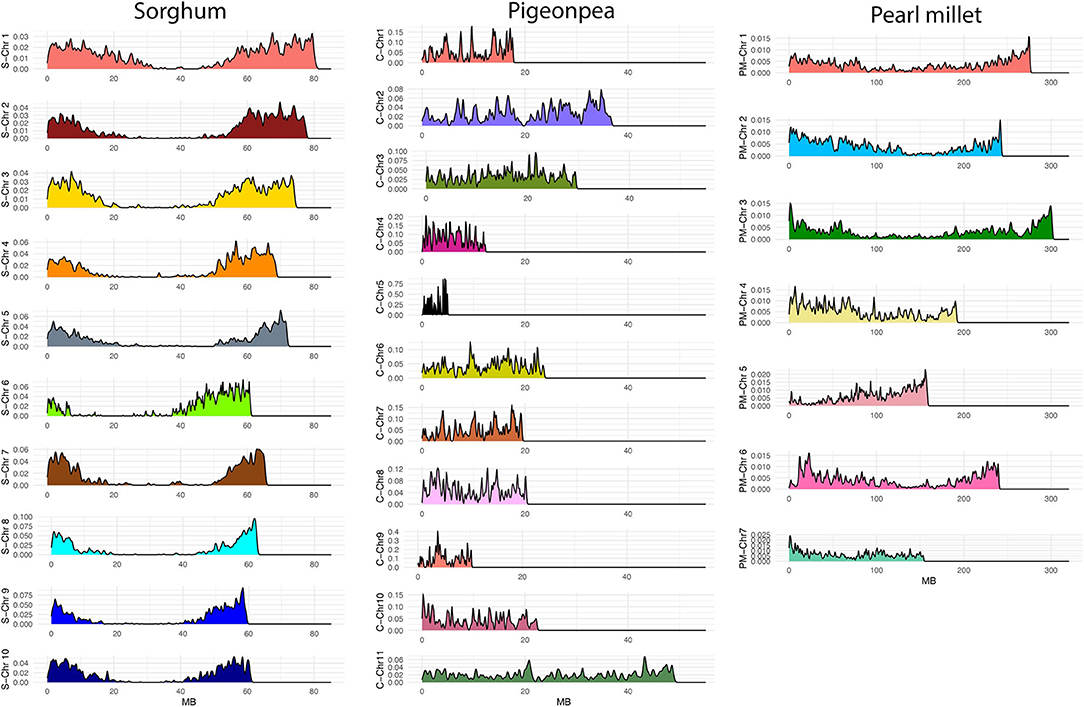
Figure 3. SNP densities over chromosomes of sorghum (S-Chr 1–10, the letter “S” represents sorghum), pigeonpea (C-Chr 1–11, the letter “C” represents Cajanus), and pearl millet (PM-Chr 1–7, the letter “PM” represents pearl millet) after filtering for quality parameters. The x-axis represents SNP positions along each chromosome (MB) and the y-axis represents SNP densities over chromosomes.
AMOVA
The analysis of molecular variance (Excoffier et al., 1992) was performed by providing predefined populations, that each accession as a separate population. The results showed that the proportion of molecular variance contributed by within accession variance depicted a low value of 26.3% in sorghum, a relatively higher value in pigeonpea (57.0%), and the highest in pearl millet (80.2%) (Table 2; Figure 4). Variance among populations was high in sorghum (73.7%), while low in pearl millet (19.8%) and intermediate in pigeonpea (43%).
Table 2. AMOVA on DArTSeq- SNP data of sorghum, pigeonpea, and pearl millet assuming each accession as a single population.
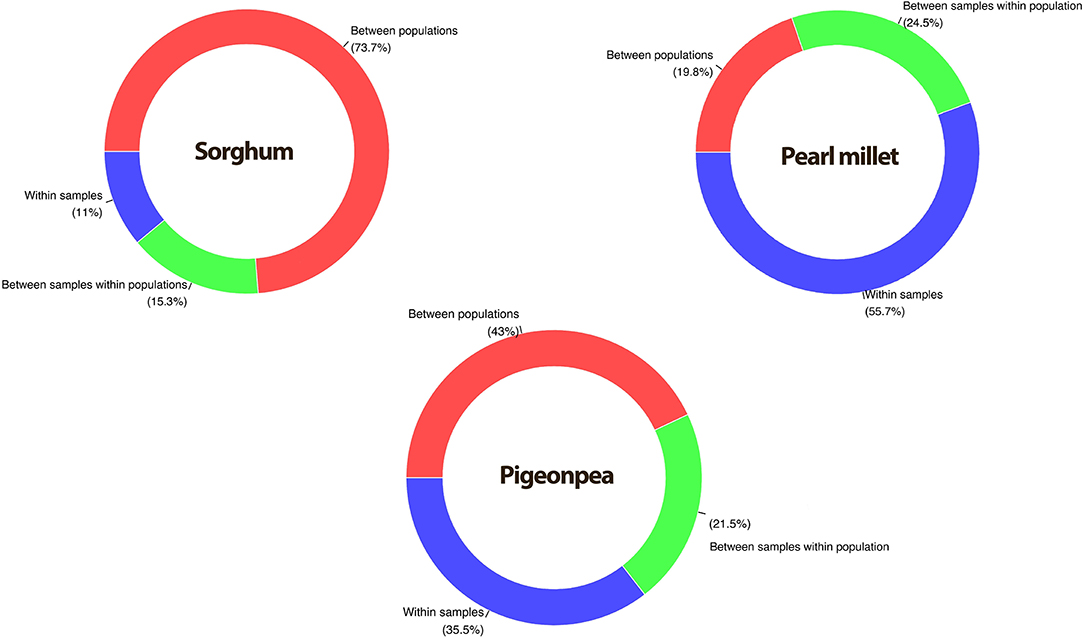
Figure 4. Percent contribution by different variance components in sorghum, pigeonpea, and pearl millet partitioned by AMOVA.
Genotypic Diversity: Within and Between Accessions
Modified Rogers Distance (MRD) (Wright, 1978; Goodman and Stuber, 1983) between pairs of individuals were estimated. Pairwise MRD within each accession was averaged, thus the overall mean genetic distance within each accession varied from 0.031 (IS 33844) to 0.342 (IS 18833), 0.181 (IP 9824) to 0.300 (IP 22039), and 0.040 (ICP 9150) to 0.393 (ICP 10889) in sorghum, pearl millet, and pigeonpea, respectively (Table 3). Three of the five wild accessions studied in sorghum namely IS 18833 (0.342), IS 14485 (0.329), and IS 10897 (0.316), showed higher within accession distance values relative to the studied landraces and the other two wild accessions, IS 11005 (0.119) and IS 22428 (0.127), showed midrange values. However, all the studied wild accessions of pearl millet, IP 21752 (0.273), IP 21640 (0.279), and IP 22039 (0.300), showed higher within accession distance values relative to the mean distances of the pearl millet landraces studied. Averaging the MRD among accessions were found to be higher in comparison to within accession distances. Comparing the three crops, higher scale of between accession distance values were found in sorghum (0.360–0.435), followed by pigeonpea (0.237–0.422) and pearl millet (0.276–0.324).
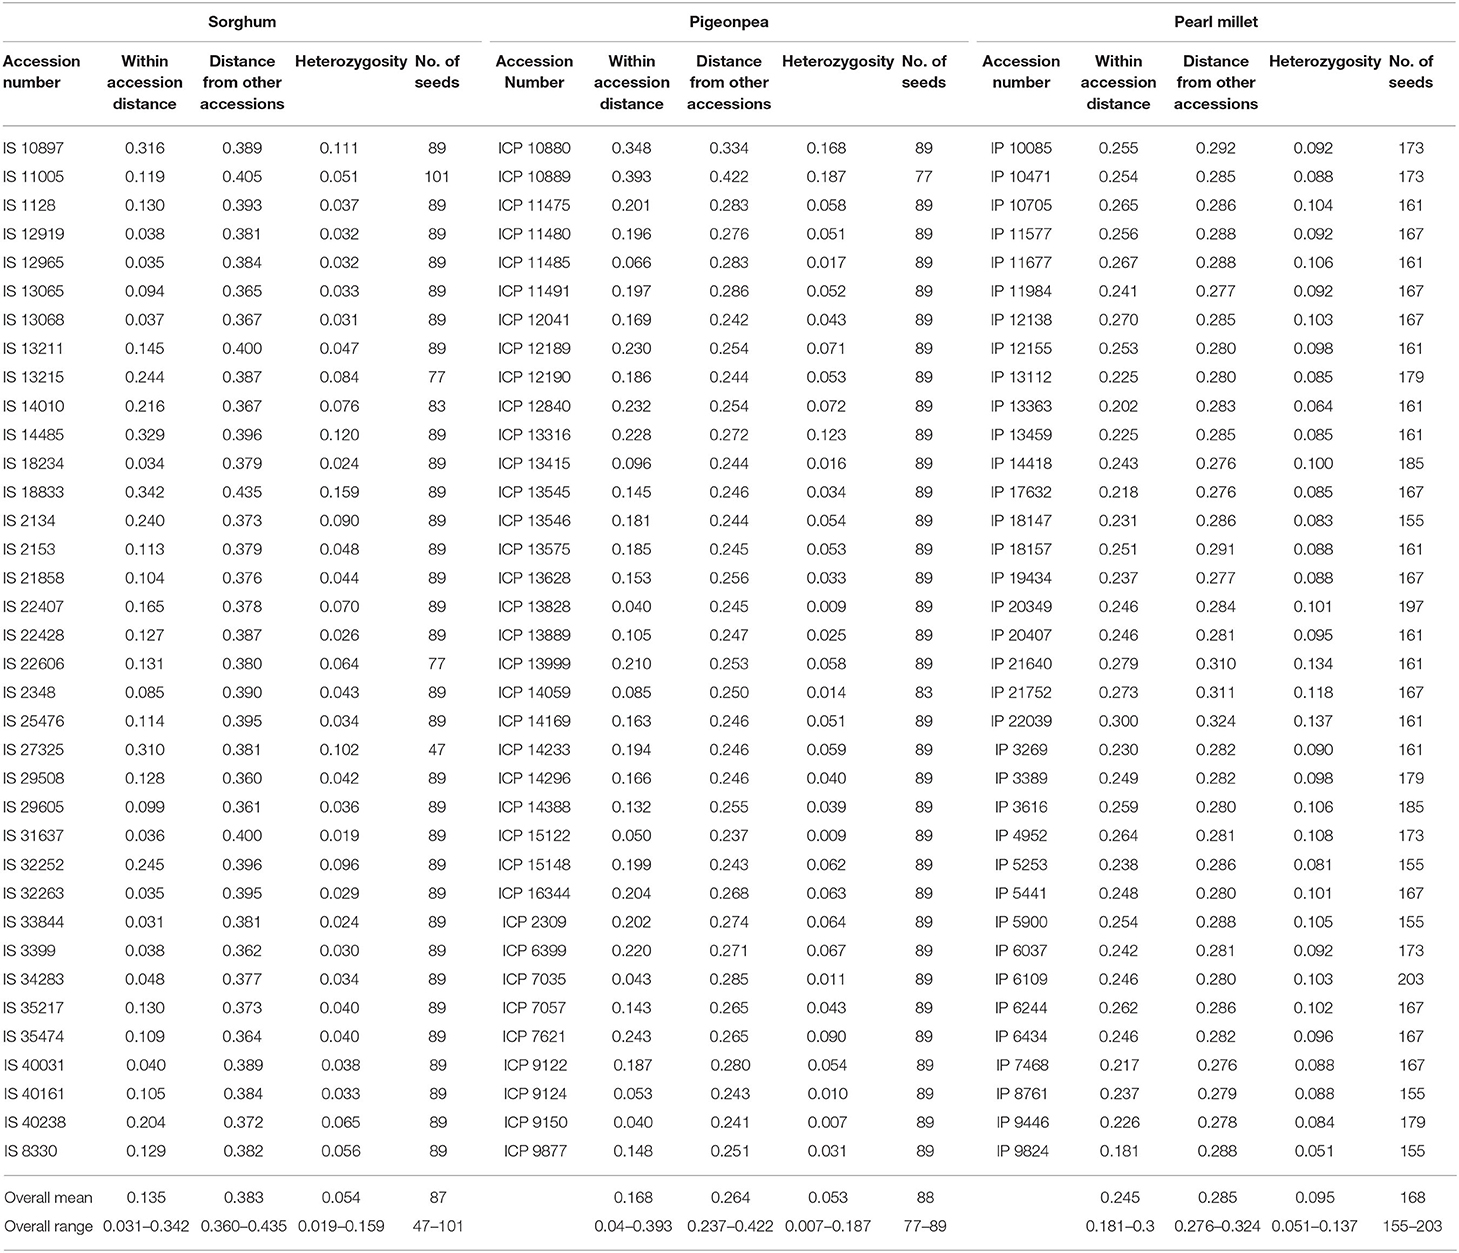
Table 3. Mean genotypic within and between accession distances, observed heterozygosity within accessions (heWs) and estimated seed sample sizes using the least DArTSeq–SNP allelic frequency in all the accessions of sorghum, pigeonpea, and pearl millet.
Heterozygosity among accessions in sorghum varied from 0.019 in IS 31637 to 0.159 in IS 18833. Among five wild accessions studied in sorghum, three accessions had higher heterozygosity (0.111 in IS 10897, 0.120 in IS 14485, and 0.159 in IS 18833) in comparison to all the landraces, while the other two wild accessions had low heterozygosity (0.026 in IS 22428 and 0.051 in IS 11005). In pearl millet, IP 9824 (0.051) and IP 22039 (0.137) estimated the lowest and highest heterozygosity, respectively. As in sorghum, the wild accessions of pearl millet viz., IP 21640 (0.134), IP 21752 (0.118), and IP 22309 (0.137) depicted maximal heterozygosity estimates in comparison to the landraces. In pigeonpea, ICP 9150 (0.007) had the minimum heterozygosity while ICP 10889 (0.187) had the highest heterozygosity (Table 3).
Clustering based on MRD grouped the individuals of all the accessions into different clusters. The cluster wise stability was assessed using the “clusterboot” function from R-package “fpc” with 100 bootstraps. About 33 clusters in sorghum, 24 clusters in pigeonpea and 19 clusters in pearl millet showed Jaccard coefficient values >70 and all the other clusters showed values <70. The Jaccard coefficient values of all the clusters were presented in Supplementary Table 9. Bootstrapped dendrograms (Supplementary Figures 2A–C) with 100 bootstraps were plotted using the “aboot” function provided in the R-package “poppr.” The dendrogram tree was cut at 36 clusters considering number of accessions in the respective crops, with an assumption that the individuals of each accession should aggregate into singleton cluster. Also a cluster membership bar-plot was used to visualize this cluster partition and migration of plants to different clusters. In sorghum, 19 accessions, viz., IS 1128, IS 12919, IS 12965, IS 13065, IS 18234, IS 18833, IS 2153, IS 21858, IS 22428, IS 25476, IS 31637, IS 32252, IS 32263, IS 33844, IS 3399, IS 34283, IS 13068, IS 35474, and IS 40031 were found to be uniform, by clustering of all the individual of an accessions into separate singleton clusters (Figure 5A), while the landraces IS 29508 and IS 29605 were found to be grouped in a single cluster. All other accessions of sorghum were found to have mixtures. In pigeonpea, ICP 2309, ICP 9124, ICP 7057, ICP 9877, ICP 11480, ICP 14059, ICP 13628, ICP 7035, ICP 9150, ICP 13828, and ICP 15122 showed perfect singleton clustering (Figure 5B), while other accessions showed overlapping of individuals of different accessions which may be explained due to the heterogeneity achieved in evolutionary gene-flow or the presence of admixtures in the respective accessions. In pearl millet, a completely distinctive and complex distribution of accessions into clusters has been noticed. The accessions IP 9824, IP 7468, IP 11577, IP 11677, IP 13363, and IP 19434 showed perfect singleton clustering (Figure 5C) while all other accessions were not clustered uniquely to singleton clusters, indicating heterogeneity within landraces and sharing of alleles between accessions. The wild accessions of pearl millet showed an interesting pattern of clustering that the individuals of the accession IP 22039 was shared between cluster numbers 11 and 12 showing the presence of a variable set of alleles or two subpopulations, and also there can be seen some individuals of the accession IP 21752 clustered with the individuals of the accession IP 21640 in cluster number 14 depicting some similar alleles between these two accessions.
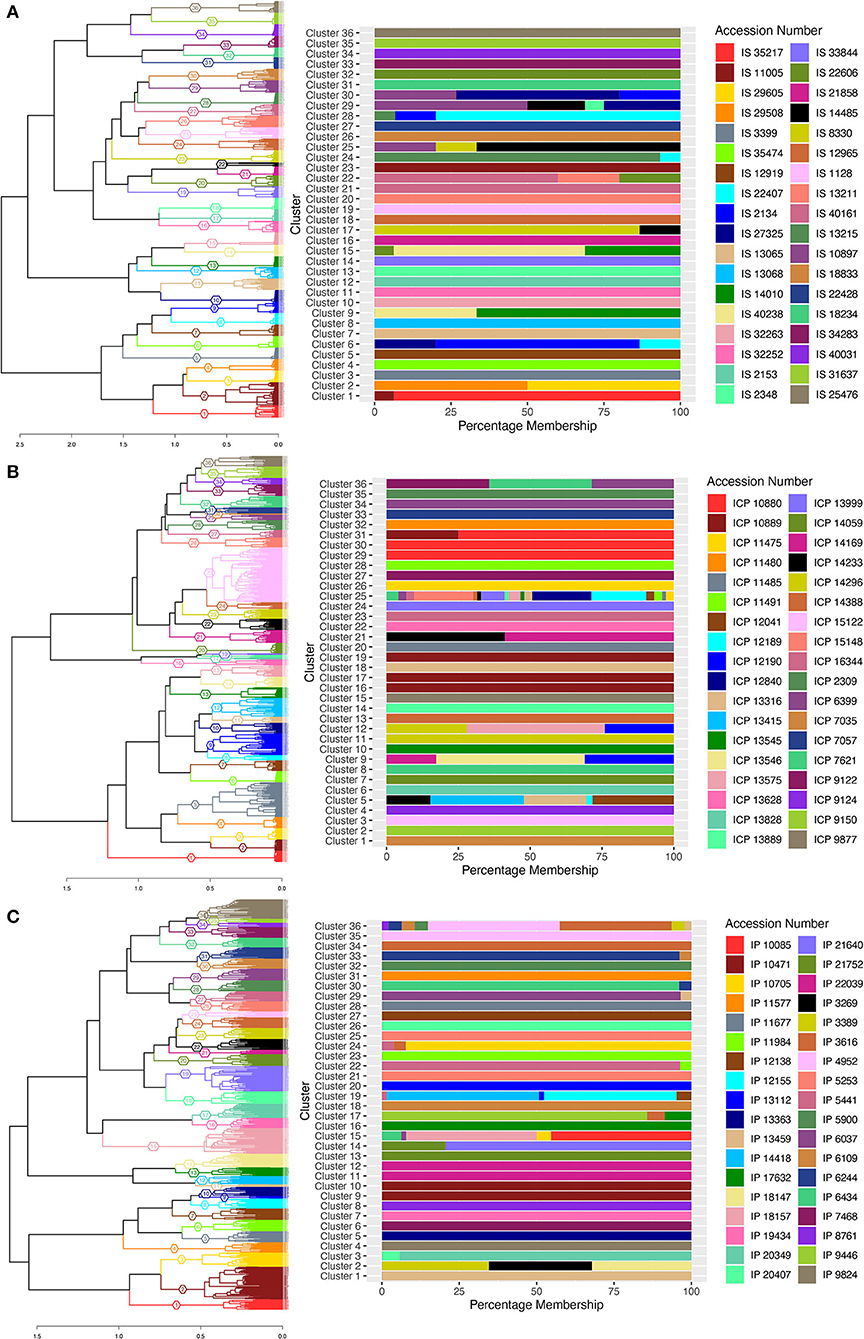
Figure 5. Cluster dendrogram of single plant genotypic distances estimated from DArTSeq- SNP data, using ward.D2 clustering algorithm, 36 clusters for sorghum, pigeonpea, and pearl millet, represented with colors and cluster numbers, with percentage membership of accessions into each cluster denoted by colors in the adjacent bar graph. (A) the cluster dendrogram of sorghum, (B) the cluster dendrogram of pigeonpea, and (C) the cluster dendrogram of pearl millet.
Shannon Diversity
The Shannon diversity was estimated for all 36 accessions in sorghum, pigeonpea, and pearl millet (Table 4). The values ranged from 0.113 to 2.363 with an overall mean of 0.275 in sorghum, 0.121–1.739 with an overall mean of 0.498 in pigeonpea and 1.128–2.715 with an overall mean of 1.856 in pearl millet. In sorghum, the accession IS 22606 (0.113) had the lowest Shannon diversity followed by the accessions IS 35474 (0.114) and IS 35217 (0.116), and the accession IS 18833 (2.363) had the highest Shannon diversity followed by accessions IS 32252 (1.138) and IS 14485 (0.583). In pigeonpea the accession ICP 9150 (0.121) had the lowest value of Shannon diversity followed by the accessions ICP 15122 (0.148) and ICP 13415 (0.156), and the accession ICP 13316 (1.739) had the highest Shannon diversity followed by the accessions ICP 10880 (1.542) and ICP 10889 (1.404). In pearl millet the accessions IP 9824 (1.128), IP 10471 (1.270), and IP 18157 (1.335) had lower values of Shannon diversity and the accessions IP 21640 (2.715), IP 6109 (2.677), and IP 20349 (2.489) had higher values. It should be noted that, in both sorghum and pearl millet, all the wild accessions had high values of Shannon diversity. Three out of five wild accessions in sorghum IS 18833 (2.363), IS 14485 (0.583), and IS 10897 (0.495) had higher values relative other accessions of sorghum, while the remaining two wild accessions IS 22428 (0.192) and IS 11005 (0.198) found to have intermediate values. Also, the wild accessions of pearl millet had relatively higher values of Shannon diversity IP 21640 (2.715), IP 22039 (2.382), and IP 21752 (2.359) in comparison to all other accessions of pearl millet.
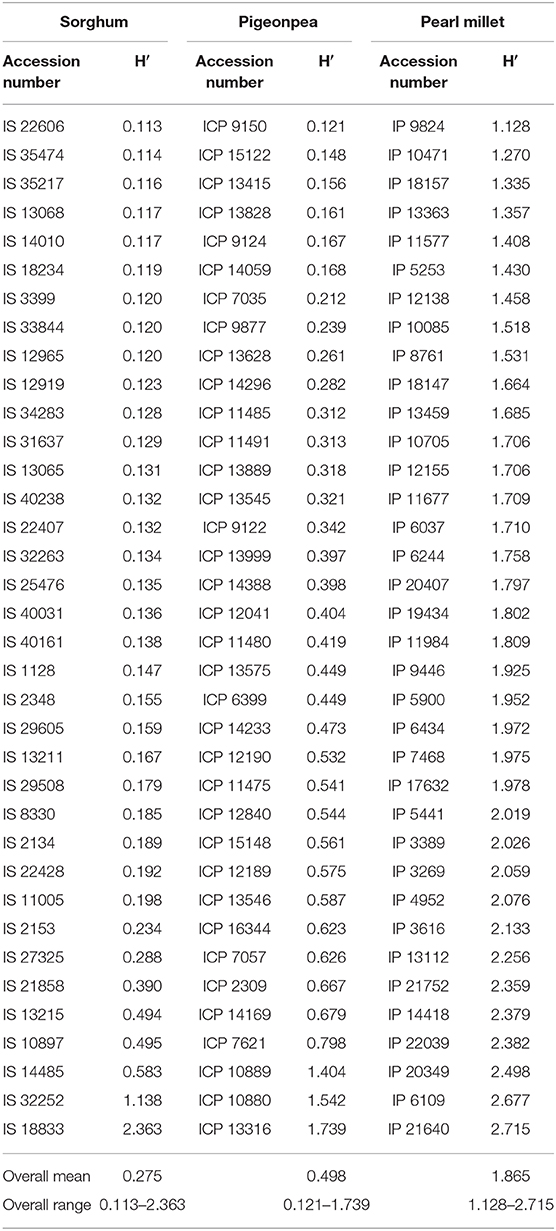
Table 4. Shannon diversity (H′) estimates within each accession of sorghum, pigeonpea, and pearl millet estimated from the DArTSeq–SNPs.
Relationship Between Phenotypic and Genotypic Distances
Mantel's correlation between phenotypic and genotypic distance matrices showed highly significant positive correlation (r = 0.45, P ≤ 0.01) for sorghum, pearl millet (r = 0.13, p ≤ 0.01), and pigeonpea (r = 0.19, P ≤ 0.01), thus depicting the effectiveness of complimentary use of molecular and phenotypic tools as a better approach for the assessment of the genetic diversity.
Population Structure Using DAPC
Detecting the number of clusters using the find.cluster function hasn't shown any significant elbow of reduction in BIC values (Supplementary Figure 3), instead, a gradual reduction in the BIC values was seen on increasing number of clusters. So that, DAPC was carried out using 36 clusters representing the 36 accessions in sorghum, pearl millet and pigeonpea. The optm.a.score function detected an optimal first 45 PCs for pearl millet and first 7 PCs for both sorghum and pigeonpea. Based on the posterior membership probabilities the population membership graph showing the population structure was created. In sorghum (Supplementary Figure 4A), 17 accessions (IS 1128, IS 12965, IS 18234, IS 18833, IS 2153, IS 21858, IS 25476, IS 31637, IS 32252, IS 32263, IS 33844, IS 3399, IS 34283, IS 35217, IS 35474, IS 40031, and IS 40161) were clustered exclusively into separate populations, whereas both the accessions IS 29508 and IS 29605 were clustered into a single population and all the other accessions are seen to have mixtures at different levels. In the population structure of pigeonpea (Supplementary Figure 4B), seven accessions (ICP 13828, ICP 14059, ICP 7035, ICP 11485, ICP 14169, ICP 15122, and ICP 9150) were found to be pure, and in pearl millet (Supplementary Figure 4C), seven accessions (IP 6434, IP 7468, IP 9824, IP 18157, IP 13363, and IP 3389) were seen to be clustered perfectly without any posterior probability for assessment to other populations while all the other accessions in both pearl millet and pigeonpea have a considerable amount of mixtures depicting the heterogeneity in the respective accessions.
For all the 36 populations, the quality of the attribution of accessions into populations were investigated by estimating the a-scores (Supplementary Table 10). An a-scores of 1 represents an accurate allocation of the plants into groups. Twenty-seven clusters (1, 3, 4, 5, 6, 7, 8, 10, 11, 13, 14, 15, 17, 18, 19, 21, 22, 23, 24, 27, 28, 29, 30, 33, 34, 35, and 36) in sorghum, 3 clusters in pearl millet (4, 24, and 30) and 17 clusters in pigeonpea (1, 2, 10, 11, 12, 13, 14, 15, 16, 17, 21, 22, 24, 25, 29, 32, and 33) showed a greater reliability (a-score = 0.81–0.99). The clusters (2, 9, 12, 16, 26, and 31) in sorghum, the clusters (2, 5, 6, 8, 10, 12, 13, 15, 16, 17, 18, 19, 20, 21, 25, 26, 27, 28, and 29) in pearl millet and the clusters (4, 5, 6, 7, 9, 18, 19, 20, 23, 26, 30, 31, 34, and 36) in pigeonpea showed an average reliability (a-score = 0.65–0.80) in the attribution, whereas 3 clusters (20, 25, and 32) from sorghum, 14 clusters (1, 3, 7, 9, 11, 14, 22, 23, 31, 32, 33, 34, 35, and 36) from pearl millet and 5 clusters (3, 8, 27, 28, and 35) from pigeonpea were found to have a low reliability (a-score = <0.65) in the attribution to the DAPC detected populations.
Estimation of Seed Sample Size
Seed sample sizes required for regeneration to capture 95% of the alleles with an expected probability of 95%, was estimated based on the allelic frequencies of the DArTSeq–SNPs, for each accession using the model proposed by Crossa (1989). The results of the sample sizes required are given in Table 3. Seed sample sizes for sorghum ranged from 47 to 101, 155 to 203 for pearl millet, and 77 to 89 for pigeonpea. The seed sample size increments exponentially after the alternate allele frequency attains a value below 0.1 (Figure 6) depicting the need for an exponentially larger sample size for conserving the alleles with frequencies below 0.1. The number of rare allelic variants or markers (frequency less than or equal to 5% within accessions) preserved in the recommended sample size for each accession of the three crops (Supplementary Table 11) ranged from 345 to 3,075 in sorghum, 231 to 878 in pigeonpea, and 3,444 to 6,726 in pearl millet.
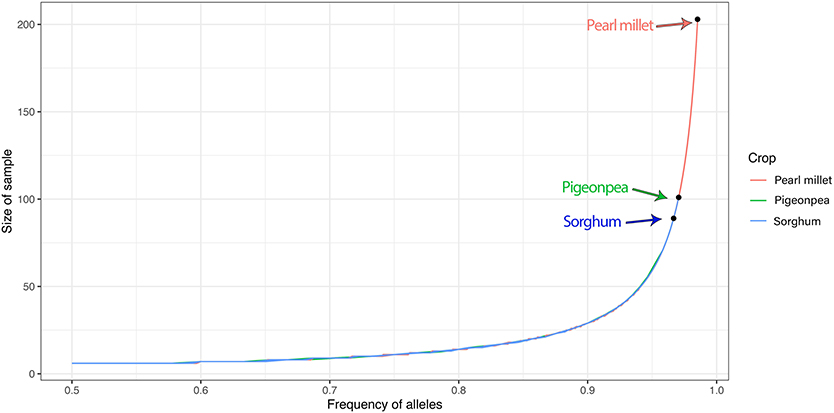
Figure 6. Plot of seed sample sizes needed for regeneration vs. allelic frequencies to preserve 95% of alleles showing the exponential increase in the size of sample required with the decrease in the alternate allele frequency. The arrows represent the highest values of seed sample size estimated in sorghum, pigeonpea, and pearl millet.
Discussion
Sorghum, pearl millet, and pigeonpea are the important food crops, providing food and income to a large population thriving in the arid and semi-arid tropics. However, in this era of modern agriculture, landraces of these crops are becoming prone to genetic erosion, (Hammer et al., 1996; Shewayrga et al., 2008; Pattanashetti et al., 2016). Most landraces, that were permanently extinct from the farmers' field over the course of agricultural development, are only available in genebanks' collections. As each landrace possess a unique genetic fingerprint of ages of acclimatization to diverse environmental conditions, they are considered as an indispensable source of genetic variations by plant breeders and can address a potential scope in the development of improved varieties with higher productivity, nutrients, and climate resilience, etc. (Dwivedi et al., 2016). Thus, conserving landraces with their inherent genetic variability is crucial for ensuring food security in the near future and also for sustainable agriculture. ICRISAT genebank conserves about 42,000 accessions of sorghum, 24,000 accessions of pearl millet, and over 13,000 accessions of pigeonpea, wherein about 86% of sorghum and pearl millet collections and over 60% of pigeonpea collections are landraces. The main focus of genebank curator is to maintain the genetic integrity and diversity within accessions while regeneration. Hence, this study assessed the diversity within landrace accessions by phenotyping and genotyping a large number of plants within each accession and estimated the seed sample size required in order to conserve the inherent diversity.
Enormous variability was observed within and among landraces of sorghum, pigeonpea, and pearl millet. Molecular variance within accessions was observed to be low in sorghum (26.3%), highest in pearl millet (80.2%), while pigeonpea showing an intermediate within accession variance of 57.0%. Our results are in correspondence with previous works, by various authors (Tostain et al., 1987; Tostain and Marchais, 1989; Busso et al., 2000; Bashir et al., 2015) on pearl millet landraces, reported a high intra-population variation of 70–90% and higher observed heterozygosity of 0.77–0.82. However, Bhattacharjee et al. (2002) reported a low 30.89% within accession variability using RFLP markers in pearl millet, also the author addressed this low variability as a contradiction for a cross-pollinated crop like pearl millet and discussed various instances that would have caused this lower variability. In sorghum, Adugna (2014) reported a 54.44% molecular variance due to diversity within landrace populations that were conserved on farms in Ethiopia. No studies investigating landraces diversity within accessions were reported in sorghum and pigeonpea, while few studies are on landraces conserved on-farm that are continually evolving through outcrossing and selections (Djè et al., 1999; D'Andrea and Casey, 2002; Songok et al., 2010; Adugna, 2014; Bashir et al., 2015).
The phenotypic and genotypic within accession distances were scaled toward the higher values in pearl millet, so that blurring the differentiation of within and between accessions diversity. The density distribution of within and between accession distances in pearl millet showed this scenario clearly, exhibiting the merging of densities (Figures 7C,F) of within and between accession distances in both phenotypic and genotypic evaluation. Pigeonpea being often cross-pollinated also depicted a pattern of overlapping within and among accession distances in both phenotypic and genotypic evaluation (Figures 7B,E). Whereas, sorghum showed a clear separation of distances within accessions from distances between accessions in both phenotypic and genotypic assessment, depicting the higher uniformity and homogeneity within the accessions (Figures 7A,D). The higher values and merging of between and within accession distances in pearl millet and pigeonpea shows the high phenotypic and genotypic heterogeneity within accessions, and also the clear separation of densities of within and between accession distances in sorghum clearly explains the higher uniformity within the accessions of sorghum.
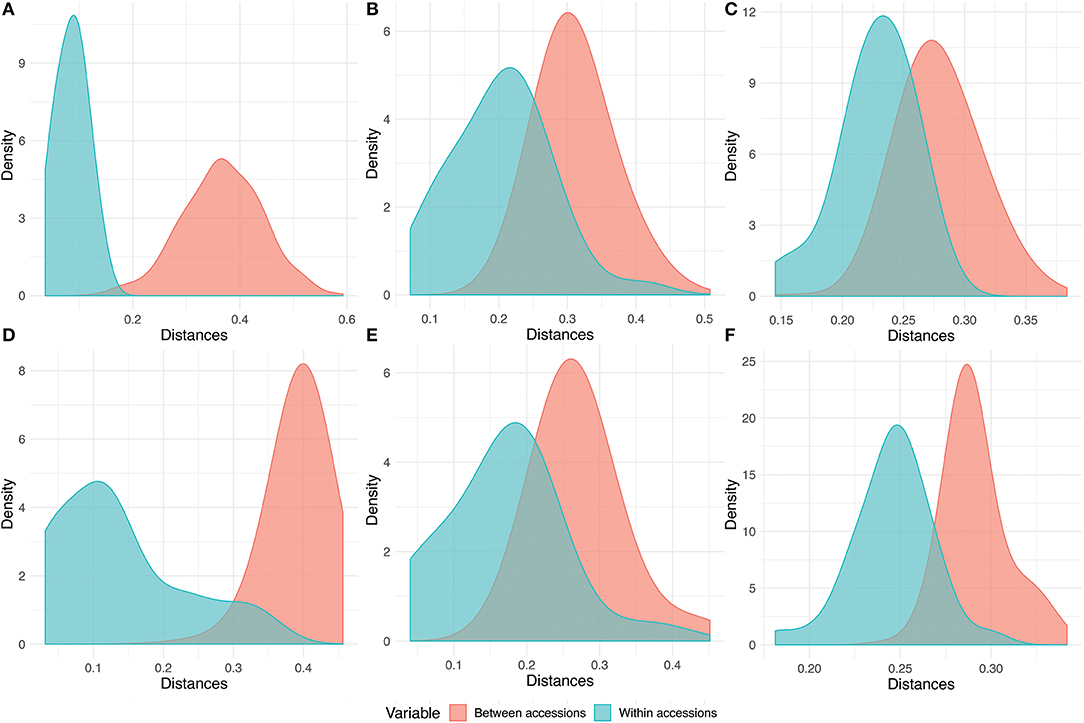
Figure 7. Comparison graph of densities of within and between accession distances. (A–C) denotes the phenotypic distance distribution for sorghum, pigeonpea, and pearl millet, respectively, and (D–F) denotes the genotypic within and between accession distance distribution estimated from DArTSeq-SNP data of sorghum, pigeonpea, and pearl millet, respectively.
Population structure analyses indicated that most of the accessions in sorghum were uniform enough to cluster individuals of single accession together as a singleton clusters. In sorghum, accessions IS 29508 and IS 29605 were clustered into a single population in both DAPC and ward.D2 clustering with genotypic distances, indicating the presence of high similarity and common alleles in these two accessions. The accession IS 33844 showed high uniformity with a low within accession diversity (0.031), and a selection from this landrace has been released as a variety in India as ‘Parbhani moti’ (Upadhyaya and Vetriventhan, 2018). Pearl millet and pigeonpea showed a higher heterogeneity within accessions, while most of the accessions showed mixed populations. In pigeonpea and pearl millet only some accessions showed singleton clustering. High population mixtures in these crops correspond to their pollination behavior, and sharing of alleles between populations. Landraces generally differ between populations, based on the intensity of selection imposed by farmers, their pollination mechanisms, the level of gene-flow within and between population, and level of exchange of seed materials between farmers. Previously several authors reported pollen flow between populations and the mixing of landrace populations in sorghum and pigeonpea (Songok et al., 2010; Kassa et al., 2012; Adugna, 2014; Westengen et al., 2014). Harlan (1965) reported the gene-flow from weeds to landraces and several other authors (Ellstrand et al., 1999; Jarvis and Hodgkin, 1999; Messeguer, 2003; Gompert and Buerkle, 2016) reported the transfer of genes into landraces from various sources in both self and outcrossing species. Also, some studies reported the mixing of the population by a considerable exchange of seeds within cultures or regions (Louette, 1997). The level of heterogeneity and diversity in landraces are crop-specific and associated with their mode of fertilization (Villa et al., 2005) and also several authors (Hammer et al., 1996; Zeven, 1998) stated the influence of mode of pollination in various population genetics factors over the course of evolution of landraces. Hence, complying to the effect of mode of reproduction on diversity, a higher degree of outcrossing (about 85%) in pearl millet (Burton, 1983) could impose a higher diversity in pearl millet, in comparison to lower outcrossing crops such as sorghum (about 18%) (Barnaud et al., 2008) and an intermediate outcrossing crops (about 30%) like pigeonpea (Saxena et al., 1990), and this varies with species.
Most of the accessions that showed relatively higher within genetic distances in sorghum and pearl millet were wild accessions. Thus, using wild accessions in this study helped us in the comparative assessment with landraces and also aided in the better understanding of the effect of domestication and different evolutionary forces that shaped the landraces. Historically farmers conserving landraces on-farm and multiplied desirable phenotypes, which survived both natural and artificial selection. The effect of this farmers' selection led to local adaptations and variations within the landrace populations (Zeven, 1998). Teshome et al. (2016) studied the maintenance of landrace diversity in sorghum by farmers belonging to different regions in Ethiopia and reported a narrow preference to specific economic traits and selection by farmers. Thus, the wild accessions in this case lack of farmers' selections and its obligatory to be highly diverse as these are evolving under natural selection.
Comparing diversity of the three crops in our study, heterozygosity (Figure 8A), phenotypic (Figure 8B), and genotypic (Figure 8C) within accession diversity of sorghum were notably low for most of its accessions, intermediate for most of the accessions of pigeonpea and followed a more stable trend around the maximal values for pearl millet. Similar to the molecular within accession distances, Shannon diversity revealed diversity estimates, scaled over the higher values for pearl millet, followed by an intermediate in pigeonpea and lower estimates for sorghum (Figure 8D). However, in sorghum and pigeonpea both highly diverse and highly uniform accessions with maximal and minimal estimates of genotypic distances and Shannon diversity were observed. The higher diversity estimates indicate the presence of higher variability within accessions. In case of pigeonpea most of the accessions were found to have molecular within accession distances <0.250 except two accessions viz., ICP 10880 (0.348) and ICP 10889 (0.393). On further investigation into the individual plant within accession distances of these accessions, it appeared that, some individuals within these accessions were diverse from all the other individuals of the respective accession. Such that, the accession ICP 10880 had two individuals that were highly divergent from all other individuals by a mean distance of 0.410 and 0.434. Also these individuals were found to cluster separately in hierarchal clustering. Same for the accession ICP 10889, where some individuals were highly divergent from the other. In case of sorghum, most of the accessions had a molecular within accession distances <0.250 except three wild accessions viz., IS 10897 (0.316), IS 14485 (0.329), IS 18833 (0.342) and one landrace IS 27325 (0.310). In the landrace IS 27325, it can be seen that the individuals are divided into three subgroups in hierarchal clustering. Thus, higher diversity in some landraces of sorghum and pigeonpea can be due their pollination behavior, which ultimately influences the population substructure. The lower outcrossing in these crops offers the higher probability of fixation of various alleles within a fewer members or individuals, restricting the frequency/occurrence of some allele within a small group of a landrace population, thus gradually over generations, forming distinct subpopulations within groups. These varied groups of individuals are however not phenotypically variable enough to consider it as separate population, but however assimilated a genetically distinct fingerprint from various elements throughout the course of evolution. Similar cases of extreme values of low and high diversity were previously encountered by researchers. Zeven (1998) emphasized the low diversity and increased homozygosity in inbreeding accessions and also explained the influence of farmers' selection and sampling strategies for reduction of diversity in landrace populations. Adugna (2014) and Westengen et al. (2014) found both high and low within-population diversity in sorghum landraces cultivated in Ethiopia and reasoned the low within landrace diversity could be due to farmers' sampling during migration, as farmers tend to carry few heads during migration and settlements.
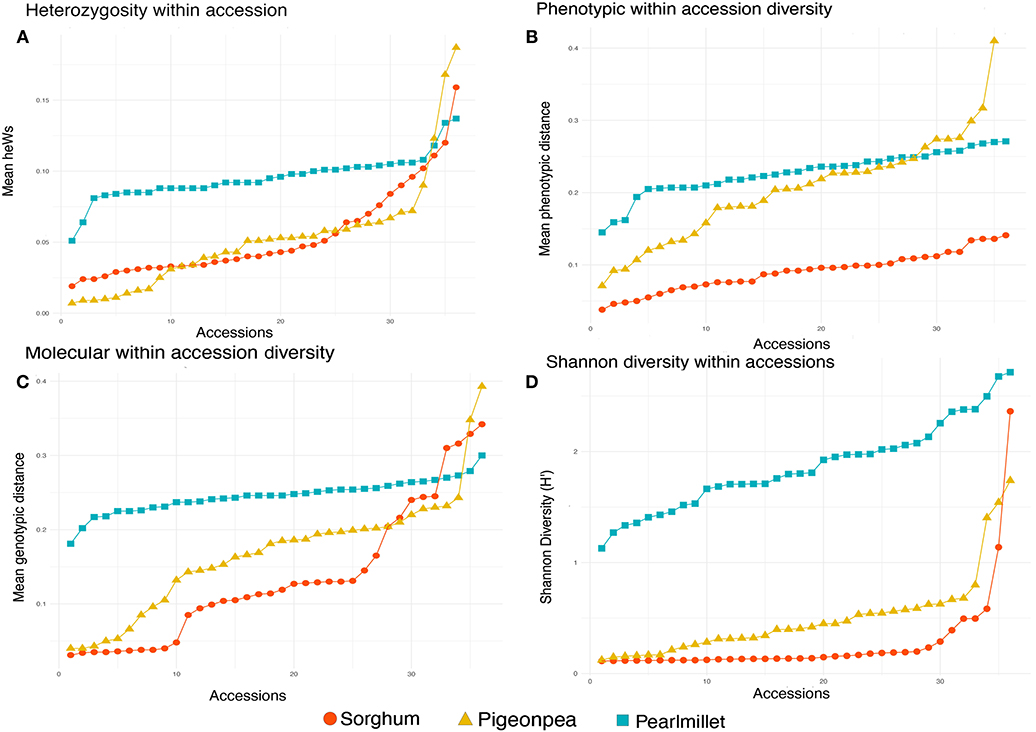
Figure 8. (A) Average heterozygosity within accessions for each 36 accessions of sorghum, pigeonpea, and pearl millet estimated from DArTSeq SNP data, (B) Average phenotypic within accessions distances for 36 accessions of sorghum and pearl millet and 35 accessions of pigeonpea, (C) Average genotypic within accession distances for each 36 accessions of sorghum, pigeonpea, and pearl millet estimated from DArTSeq SNP data, (D) Shannon diversity within accessions for each 36 accessions of sorghum, pigeonpea, and pearl millet estimated from DArTSeq SNP data.
Based on the level of diversity within each accession of different crops, appropriate conservation and regeneration strategy should be followed to conserve the genetic integrity and diversity of landraces. ICRISAT genebank follows various pollination control and sampling strategies to maintain the genetic integrity and diversity within accessions, while regenerating different crops. Theoretically, selfing will be a good strategy to maintain the genetic integrity and diversity in self-pollinated crops and often-cross pollinated crops (out-crossing >5%), because of the low effect of inbreeding depression, and to preserve alleles within the population. In cross-pollinated species like pearl millet, sib mating is the best strategy to mimic the random mating, and for that ICRISAT genebank performs cluster bagging (bagging few panicles of different individuals of the same accession) that reduces the effect of inbreeding depression. However, in both cases, the appropriate population size needs to be ensured while regeneration for capturing the rare alleles. Small sample sizes while regenerating landraces may lead to genetic drift which results in the loss of some rare alleles. Crossa (1989) based on his results on stimulated populations, reported a practical system for maize regeneration, wherein the author discussed that the ideal system of regeneration involves equalizing the genetic contribution of parents and avoiding small population sizes and, also Crossa (1995) suggested a practical seed sample size of 130–200 in monoecious crops for retaining the rare alleles in most of the loci. FAO standards specify a sample size of 30 individuals in a completely random mating population and 60 individuals for completely selfing species to capture 95% of the alleles which have a frequency >0.05 (FAO, 2014). However, in sorghum, pigeonpea, and pearl millet, no detailed molecular studies were done previously utilizing NGS tools to determine optimum population size requirements for regeneration. Therefore, we estimated the minimum sample size to capture 95% of the SNP alleles spread throughout the whole genome with an expected probability of 95% based on the least frequent allele or the frequency of the rarest allele for each accession following Crossa (1989). From our study, seed sample sizes were found to be minimal for sorghum (47–101), and pigeonpea (77–89), and high for pearl millet (155–203). The sample size required to conserve the genetic integrity of germplasm depends largely on the frequency of the least common alleles or genotypes.
In conclusion, sorghum, pigeonpea, and pearl millet accessions showed higher within and among accession diversity, indicating that the regeneration strategies at ICRISAT genebank are appropriate to ensure the genetic integrity of each accession. Information from this study will support genebank curators in understanding within accession variability and assists in devising scientific sampling strategies (sample size) for regeneration to maintain the genetic integrity and variability. This could also help breeders in the utilization end to understand the population dynamics and subpopulation structure, to forward the material with appropriate breeding techniques.
Data Availability Statement
The original contributions presented in the study are publicly available. This data can be found here: http://dataverse.icrisat.org/dataset.xhtml?persistentId=doi:10.21421/D2/CCSOZ8 for pigeonpea http://dataverse.icrisat.org/dataset.xhtml?persistentId=doi:10.21421/D2/WU4JFA for pearl http://dataverse.icrisat.org/dataset.xhtml?persistentId=doi:10.21421/D2/DSYLHB for sorghum.
Author Contributions
VCRA, MV, SD, and AR contributed to conception and design of the study. VCRA, MV, VA, RS, VK, PS, and SR conducted field experiments and data collection. This work is part of VA's thesis research. SG supported student research as chairman. VA and MV performed the statistical analysis and wrote the first draft of the manuscript. VCRA reviewed and approved the first draft. All authors contributed to manuscript revision, read, and approved the submitted version.
Funding
We acknowledge funds by global diversity crop trust (GCDT) and genebank platform for funding support for this study.
Conflict of Interest
The authors declare that the research was conducted in the absence of any commercial or financial relationships that could be construed as a potential conflict of interest.
Acknowledgments
We thank Dr. Juan Andres (Biometrics and Statistics Unit Head, CIMMYT, Mexico) for his kind help in AMOVA for the DArTSeq data and Shannon diversity. Also, we extend our thanks to Dr. Jorge Franco (Professor of Biometrics and Statistics, Universidad de la República, Uruguay), Dr. Carolina Paola Sansaloni (High-throughput genotyping and sequencing specialist, CIMMYT, Mexico) and Dr. Fernando Henrique Ribeiro (Associate Scientist-Agricultural Statistics, CIMMYT, Mexico) for their kind support in calculation of genotypic diversity.
Supplementary Material
The Supplementary Material for this article can be found online at: https://www.frontiersin.org/articles/10.3389/fpls.2020.587426/full#supplementary-material
Supplementary Figure 1. Cluster dendrogram with unbiased bootstrap probability values for edges, with ward.D2 clustering for Gower's distances, for single plant phenotypic data (A) The cluster dendrogram of sorghum, (B) the cluster dendrogram of pigeonpea, and (C) Cluster dendrogram of pearl millet.
Supplementary Figure 2. Cluster dendrogram with bootstrap probability values for edges, with ward.D2 clustering for Modified Roger's distances, for single plant genotypic data (A) The cluster dendrogram of sorghum, (B) the cluster dendrogram of pigeonpea, and (C) Cluster dendrogram of pearl millet.
Supplementary Figure 3. Values of BIC vs. number of clusters with maximum of 70 clusters in DAPC analysis for (A) sorghum, (B) pigeonpea, and (C) pearl millet.
Supplementary Figure 4. Population structure using the posterior membership probabilities, using K = 36 in DAPC analysis: (A) The population structure of sorghum. (B) Population structure of pigeonpea and (C) Population structure of pearl millet.
Supplementary Table 1. List of accessions of sorghum used for phenotypic and genotypic within accession diversity evaluation.
Supplementary Table 2. List of accessions of pigeonpea used for phenotypic and genotypic within accession diversity evaluation.
Supplementary Table 3. List of accessions of pearl millet used for phenotypic and genotypic within accession diversity evaluation.
Supplementary Table 4. List of the quantitative and qualitative traits recorded in sorghum, pearl millet and pigeonpea.
Supplementary Table 5. Mean grouping by Student-Newman-Keuls Test of sorghum, pearl millet and pigeonpea for all the quantitative traits recorded.
Supplementary Table 6. Levene's test for significant differences in population variances.
Supplementary Table 7. Bootstrapping values (Jaccard coefficient) of clusters for phenotypic data.
Supplementary Table 8. Number of DArTSeq-SNPs in each chromosome of sorghum, pearl millet and pigeonpea after filtering.
Supplementary Table 9. Bootstrapping (Jaccard coefficients) values of clusters for DArTSeq SNP data.
Supplementary Table 10. Probability of attribution of all the single plants in each accession into different groups based on the discriminant analysis of principle components on DArTSeq-SNP data (K = 36).
Supplementary Table 11. Number of rare alleles preserved in the recommended sample size estimated from DArTSeq-SNP data of sorghum, pigeonpea, and pearl millet.
References
Adugna, A. (2014). Analysis of in situ diversity and population structure in Ethiopian cultivated Sorghum bicolor (L.) landraces using phenotypic traits and SSR markers. Springerplus 3:212. doi: 10.1186/2193-1801-3-212
Al Khanjari, S., Hammer, K., Buerkert, A., and Röder, M. S. (2007). Molecular diversity of Omani wheat revealed by microsatellites: II. hexaploid landraces. Genet. Resour. Crop Evol. 54, 1407–1417. doi: 10.1007/s10722-006-9125-1
Animasaun, D., Morakinyo, J., Mustapha, O., and Krishnamurthy, R. (2015). Assessment of genetic diversity in accessions of pearl millet (Pennisetum glaucum) and napier grass (Pennisetum purpureum) using microsatellite (ISSR) markers. Iran. J. Genet. Plant Breed. 4, 25–35.
Astley, D. (1991). 2. Exploration: methods and problems of exploration and field collecting. Biol. J. Linn. Soc. 43, 11–22. doi: 10.1111/j.1095-8312.1991.tb00579.x
Barilli, E., Cobos, M. J., Carrillo, E., Kilian, A., Carling, J., and Rubiales, D. (2018). A high-density integrated DArTseq SNP-based genetic map of pisum fulvum and identification of QTLs controlling rust resistance. Front. Plant Sci. 9:167. doi: 10.3389/fpls.2018.00167
Barnaud, A., Trigueros, G., McKey, D., and Joly, H. I. (2008). High outcrossing rates in fields with mixed sorghum landraces: how are landraces maintained? Heredity 101, 445–452. doi: 10.1038/hdy.2008.77
Bashir, E. M. A., Ali, A. M., Ali, A. M., Mohamed, E. T. I., Melchinger, A. E., Parzies, H. K., et al. (2015). Genetic diversity of sudanese pearl millet (Pennisetum glaucum (L.) R. Br.) landraces as revealed by SSR markers, and relationship between genetic and agro-morphological diversity. Genet. Resour. Crop Evol. 62, 579–591. doi: 10.1007/s10722-014-0183-5
Bellon, M. R. (2009). “Do we need crop landraces for the future? Realizing the global option value of in situ conservation,” in Agrobiodiversity and Economic Development, 1st Edn., eds. A. Kontoleon, U. Pasqual, and M. Smale (Abington: Routledge).
Bhattacharjee, R., Bramel, P., Hash, C., Kolesnikova-Allen, M., and Khairwal, I. (2002). Assessment of genetic diversity within and between pearl millet landraces. Theor. Appl. Genet. 105, 666–673. doi: 10.1007/s00122-002-0917-1
Brown, A. H. D. (1978). Isozymes, plant population genetic structure and genetic conservation. Theor. Appl. Genet. 52, 145–157. doi: 10.1007/BF00282571
Budak, H., Pedraza, F., Cregan, P. B., Baenziger, P. S., and Dweikat, I. (2003). Development and utilization of SSRs to estimate the degree of genetic relationships in a collection of pearl millet germplasm. Crop Sci. 43, 2284–2290. doi: 10.2135/cropsci2003.2284
Burton, G. W. (1983). “Breeding pearl millet,” in Plant Breeding Reviews-Volume 1, ed J. Janick (Boston, MA: Springer US), 162–182. doi: 10.1007/978-1-4684-8896-8_6
Busso, C. S., Devos, K. M., Ross, G., Mortimore, M., Adams, W. M., Ambrose, M. J., et al. (2000). Genetic diversity within and among landraces of pearl millet (Pennisetum glaucum) under farmer management in West Africa. Genet. Resour. Crop Evol. 47, 561–568. doi: 10.1023/A:1008767220320
Chandra-Shekara, A. C., Prasanna, B. M., Bhat, S. R., and Singh, B. B. (2007). Genetic diversity analysis of elite pearl millet inbred lines using RAPD and SSR markers. J. Plant Biochem. Biotechnol. 16, 23–28. doi: 10.1007/BF03321924
Chowdari, K. V., Davierwala, A. P., Gupta, V. S., Ranjekar, P. K., and Govila, O. P. (1998). Genotype identification and assessment of genetic relationships in pearl millet [Pennisetum glaucum (L.) R. Br] using microsatellites and RAPDs. Theor. Appl. Genet. 97, 154–162. doi: 10.1007/s001220050880
Crossa, J. (1989). Methodologies for estimating the sample size required for genetic conservation of outbreeding crops. Theor. Appl. Genet. 77, 153–161. doi: 10.1007/BF00266180
Crossa, J. (1995). “Sample size and effective population size in seed regeneration of monoecious species,” in Regeneration of Seed Crops and Their Wild Relatives: Proceedings of a Consultation Meeting (ICRISAT) (Hyderabad: Bioversity International), 140.
D'Andrea, A. C., and Casey, J. (2002). Pearl millet and Kintampo subsistence. Afr. Archaeol. Rev. 19, 147–173. doi: 10.1023/A:1016518919072
de Mendiburu, F. (2013). Statistical Procedures for Agricultural Research. Package ‘Agricolae,’ Version 1.4-4. Vienna: Comprehensive R Archive Network, Institute for Statistics and Mathematics. Available online at: http://cran.r-project.org/web/packages/agricolae/agricolae.pdf
Djè, Y., Forcioli, D., Ater, M., Lefèbvre, C., and Vekemans, X. (1999). Assessing population genetic structure of sorghum landraces from North-western Morocco using allozyme and microsatellite markers. Theor. Appl. Genet. 99, 157–163. doi: 10.1007/s001220051220
Dray, S., Dufour, A.-B., and Chessel, D. (2007). The {ade4} package – {II}: two-table and {K}-table methods. R News 7, 47–52.
Dreisigacker, S., Zhang, P., Warburton, M. L., Skovmand, B., Hoisington, D., and Melchinger, A. E. (2005). Genetic diversity among and within CIMMYT wheat landrace accessions investigated with SSRs and implications for plant genetic resources management. Crop Sci. 45, 653–661. doi: 10.2135/cropsci2005.0653
Dwivedi, S. L., Ceccarelli, S., Blair, M. W., Upadhyaya, H. D., Are, A. K., and Ortiz, R. (2016). Landrace germplasm for improving yield and abiotic stress adaptation. Trends Plant Sci. 21, 31–42. doi: 10.1016/j.tplants.2015.10.012
Edet, O. U., Gorafi, Y. S. A., Nasuda, S., and Tsujimoto, H. (2018). DArTseq-based analysis of genomic relationships among species of tribe Triticeae. Sci. Rep. 8:16397. doi: 10.1038/s41598-018-34811-y
Ellstrand, N. C., Prentice, H. C., and Hancock, J. F. (1999). Domesticated plants into their wild relatives. Annu. Rev. Ecol. Syst. 30, 539–563. doi: 10.1146/annurev.ecolsys.30.1.539
Excoffier, L., Smouse, P. E., and Quattro, J. M. (1992). Analysis of molecular variance inferred from metric distances among DNA haplotypes: application to human mitochondrial DNA restriction data. Genetics 131, 479–491.
FAO (2014). Genebank Standards for Plant Genetic Resources for Food and Agriculture. Rome: Food and Agriculture Organization.
Fox, J., and Weisberg, S. (2019). An {R} Companion to Applied Regression. 3rd ed. Thousand Oaks, CA: Sage Publications.
Frankel, O., and Soulé, M. E. (1981). Conservation and Evolution. 1st Edn. Cambridge: Cambridge University Press.
Gompert, Z., and Buerkle, C. A. (2016). What, if anything, are hybrids: enduring truths and challenges associated with population structure and gene flow. Evol. Appl. 9, 909–923. doi: 10.1111/eva.12380
Goodman, M. M., and Stuber, C. W. (1983). Races of maize. 6: Isozyme variation among races of maize in Bolivia. Maydica 28, 169–188.
Govindaraj, M., Selvi, B., Prabhu, D. A., and Rajarathinam, S. (2009). Genetic diversity analysis of pearl millet (Pennisetum glauccum [L.] R. Br.) accessions using molecular markers. Afr. J. Biotechnol. 8, 6046–6052. doi: 10.5897/AJB2009.000-9493
Gower, J. C. (1971). A general coefficient of similarity and some of its properties. Biometrics 27, 857–871. doi: 10.2307/2528823
Hagenblad, J., Zie, J., and Leino, M. W. (2012). Exploring the population genetics of genebank and historical landrace varieties. Genet. Resour. Crop Evol. 59, 1185–1199. doi: 10.1007/s10722-011-9754-x
Hammer, K., Knüpffer, H., Xhuveli, L., and Perrino, P. (1996). Estimating genetic erosion in landraces - two case studies. Genet. Resour. Crop Evol. 43, 329–336. doi: 10.1007/BF00132952
Harlan, J. R. (1965). The possible role of weed races in the evolution of cultivated plants. Euphytica 14, 173–176. doi: 10.1007/BF00038984
Harlan, J. R. (1971). Agricultural origins: centers and noncenters. Science 174, 468–474. doi: 10.1126/science.174.4008.468
Harlan, J. R., and de Wet, J. M. J. (1972). A simplified classification of cultivated sorghum. Crop Sci. 12, 172–176. doi: 10.2135/cropsci1972.0011183X001200020005x
Hennig, C. (2020). fpc: Flexible Procedures for Clustering. Available online at: https://cran.r-project.org/package=fpc
IBPGR and ICRISAT (1993a). Descriptors for Pearl Millet [Pennisetum glaucum (L.) R. Br.]. Rome; Patancheru: Plant Genetic Resources; International Crops Research Institute for the Semi-Arid Tropics.
IBPGR and ICRISAT (1993b). Descriptors for Pigeonpea [Cajanus cajan (L.) Millsp.]. Rome; Patancheru: Plant Genetic Resources; International Crops Research Institute for the Semi-Arid Tropics.
IBPGR and ICRISAT (1993c). Descriptors for Sorghum [Sorghum bicolor (L.) Moench]. Rome; Patancheru: Plant Genetic Resources; International Crops Research Institute for the Semi-Arid Tropics.
Jarvis, D. I., and Hodgkin, T. (1999). Wild relatives and crop cultivars: detecting natural introgression and farmer selection of new genetic combinations in agroecosystems. Mol. Ecol. 8, S159–S173. doi: 10.1046/j.1365-294X.1999.00799.x
Jombart, T. (2008). adegenet: a R package for the multivariate analysis of genetic markers. Bioinformatics 24, 1403–1405. doi: 10.1093/bioinformatics/btn129
Jones, H., Leigh, F. J., Mackay, I., Bower, M. A., Smith, L. M. J., Charles, M. P., et al. (2008). Population-based resequencing reveals that the flowering time adaptation of cultivated barley originated east of the fertile crescent. Mol. Biol. Evol. 25, 2211–2219. doi: 10.1093/molbev/msn167
Kamvar, Z. N., Brooks, J. C., and Grünwald, N. J. (2015). Novel R tools for analysis of genome-wide population genetic data with emphasis on clonality. Front. Genet. 6:208. doi: 10.3389/fgene.2015.00208
Kassa, M. T., Penmetsa, R. V., Carrasquilla-Garcia, N., Sarma, B. K., Datta, S., Upadhyaya, H. D., et al. (2012). Genetic patterns of domestication in pigeonpea (Cajanus cajan (L.) Millsp.) and wild cajanus relatives. PLoS ONE 7:e39563. doi: 10.1371/journal.pone.0039563
Keuls, M. (1952). The use of the studentized range in connection with an analysis of variance. Euphytica 1, 112–122. doi: 10.1007/BF01908269
Kumar, A., Arya, L., Kumar, V., and Sharma, S. (2006). Inter simple sequence repeat (ISSR) analysis of cytoplasmic male sterile, male fertile lines and hybrids of pearlmillet [Pennisetum glaucum (L.) R. Br.]. Crop Sci. 1, 117–119.
Kyratzis, A. C., Nikoloudakis, N., and Katsiotis, A. (2019). Genetic variability in landraces populations and the risk to lose genetic variation. the example of landrace “Kyperounda” and its implications for ex situ conservation. PLoS ONE 14:e0224255. doi: 10.1371/journal.pone.0224255
Levene, H. (1960). “Robust tests for the equality of variance,” in Contributions to Probability and Statistics, ed I. Olkin (Palo Alto, CA: Stanford University Press), 278–292.
Louette, D. (1997). “Seed exchange among farmers and gene flow among maize varieties in traditional agricultural systems,” in Gene Flow Among MaizeLandraces, Improved Maize Varieties, and Teosinte: Implications for Transgenic Maize (Mexico: CIMMYT), 56–66.
Mace, E. S., Buhariwalla, K. K., Buhariwalla, H. K., and Crouch, J. H. (2003). A high-throughput DNA extraction protocol for tropical molecular breeding programs. Plant Mol. Biol. Rep. 21, 459–460. doi: 10.1007/BF02772596
Maechler, M., Rousseeuw, P., Struyf, A., Hubert, M., and Hornik, K. (2019). Package “Cluster: Cluster Analysis Basics and Extensions”, Version 2.0.9, 1–82. Available online at: https://svn.r-project.org/R-packages/trunk/cluster
Mantel, N. (1967). The detection of disease clustering and a generalized regression approach. Cancer Res. 27, 209–220.
Martin, G. B., and Adams, M. W. (1987). Landraces of Phaseolus vulgaris (Fabaceae) in Northern Malawi. I. regional variation. Econ. Bot. 41, 190–203. doi: 10.1007/BF02858965
Messeguer, J. (2003). Gene flow assessment in transgenic plants. Plant Cell. Tissue Organ Cult. 73, 201–212. doi: 10.1023/A:1023007606621
Michaelis, A., Green, M., and Rieger, R. (1991). Glossary of Genetics: Classical and Molecular. Berlin: Springer Science & Business Media.
Murtagh, F., and Legendre, P. (2014). Ward's hierarchical agglomerative clustering method: which algorithms implement Ward's criterion? J. Classif. 31, 274–295. doi: 10.1007/s00357-014-9161-z
Ndjiondjop, M. N., Semagn, K., Sow, M., Manneh, B., Gouda, A. C., Kpeki, S. B., et al. (2018). Assessment of genetic variation and population structure of diverse rice genotypes adapted to lowland and upland ecologies in Africa using SNPs. Front. Plant Sci. 9:446. doi: 10.3389/fpls.2018.00446
Nei, M. (1973). Analysis of gene diversity in subdivided populations. Proc. Natl. Acad. Sci. U.S.A. 70, 3321–3323. doi: 10.1073/pnas.70.12.3321
Newman, D. (1939). The distribution of range in samples from a normal population, expressed in terms of an independent estimate of standard deviation. Biometrika 31, 20–30. doi: 10.1093/biomet/31.1-2.20
Pailles, Y., Ho, S., Pires, I. S., Tester, M., Negrão, S., and Schmöcke, S. M. (2017). Genetic diversity and population structure of two tomato species from the galapagos islands. Front. Plant Sci. 8:138. doi: 10.3389/fpls.2017.00138
Pattanashetti, S. K., Upadhyaya, H. D., Dwivedi, S. L., Vetriventhan, M., and Reddy, K. N. (2016). “Pearl millet,” in Genetic and Genomic Resources for Grain Cereals Improvement, eds M. Singh and H. D. Upadhyaya (San Diego, CA: Academic Press), 253–289. doi: 10.1016/B978-0-12-802000-5.00006-X
Pressoir, G., and Berthaud, J. (2004). Patterns of population structure in maize landraces from the Central Valleys of Oaxaca in Mexico. Heredity 92, 88–94. doi: 10.1038/sj.hdy.6800387
R Core Team (2019). R: A Language and Environment for Statistical Computing. Available online at: https://www.r-project.org/
Raman, R., Qiu, Y., Coombes, N., Song, J., Kilian, A., and Raman, H. (2017). Molecular diversity analysis and genetic mapping of pod shatter resistance loci in Brassica carinata L. Front. Plant Sci. 8:1765. doi: 10.3389/fpls.2017.01765
Ramanatha Rao, V., and Hodgkin, T. (2002). Genetic diversity and conservation and utilization of plant genetic resources. Plant Cell. Tissue Organ Cult. 68, 1–19. doi: 10.1023/A:1013359015812
Saxena, K. B., Singh, L., and Gupta, M. D. (1990). Variation for natural out-crossing in pigeonpea. Euphytica 46, 143–148. doi: 10.1007/BF00022307
Shannon, C. E. (1948). A mathematical theory of communication. Bell Syst. Tech. J. 27, 379–423. doi: 10.1002/j.1538-7305.1948.tb01338.x
Shewayrga, H., Jordan, D. R., and Godwin, I. D. (2008). Genetic erosion and changes in distribution of sorghum (Sorghum bicolor L. (Moench)) landraces in north-eastern Ethiopia. Plant Genet. Resour. 6, 1–10. doi: 10.1017/S1479262108923789
Songok, S., Ferguson, M., Muigai, A. W., and Silim, S. (2010). Genetic diversity in pigeonpea [Cajanus cajan (L.) Millsp.] landraces as revealed by simple sequence repeat markers. Afr. J. Biotechnol. 9, 3231–3241.
Suzuki, R., Terada, Y., and Shimodaira, H. (2019). pvclust: Hierarchical Clustering With P-Values via Multiscale Bootstrap Resampling. Available online at: https://cran.r-project.org/package=pvclust
Teshome, A. A., Fahrig, L., Torrance, J. K., Lambert, J. D., and Arnason, T. J. (2016). Maintenance of sorghum (Sorghum bicolor, Poaceae) landrace diversity by farmers' selection in Ethiopia. Econ. Botany 53, 79–88. doi: 10.1007/BF02860796
Tostain, S., and Marchais, L. (1989). Enzyme diversity in pearl millet (Pennisetum glaucum). Theor. Appl. Genet. 77, 634–640. doi: 10.1007/BF00261235
Tostain, S., Riandey, M.-F., and Marchais, L. (1987). Enzyme diversity in pearl millet (Pennisetum glaucum). Theor. Appl. Genet. 74, 188–193. doi: 10.1007/BF00289967
Upadhyaya, H. D., and Vetriventhan, M. (2018). “Ensuring the genetic diversity of sorghum,” in Achieving Sustainable Cultivation of Sorghum, ed W. Roony (Cambridge: Burleigh Dodds Science Publishing Limited), 546. doi: 10.19103/AS.2017.0015.06
Villa, T. C. C., Maxted, N., Scholten, M., and Ford-Lloyd, B. (2005). Defining and identifying crop landraces. Plant Genet. Resour. 3, 373–384. doi: 10.1079/PGR200591
Westengen, O. T., Okongo, M. A., Onek, L., Berg, T., Upadhyaya, H., Birkeland, S., et al. (2014). Ethnolinguistic structuring of sorghum genetic diversity in Africa and the role of local seed systems. Proc. Natl. Acad. Sci. U.S.A. 111, 14100–14105. doi: 10.1073/pnas.1401646111
Wright, S. (1978). “Variability within and among natural populations,” in Evolution and the Genetics of Populations: A Treatise in Four Volumes, Vol. 1 (Chicago, IL: University of Chicago Press), 91–96.
Xie, X. M., Zhou, F., Zhang, X. Q., and Zhang, J. M. (2010). Genetic variability and relationship between MT-1 elephant grass and closely related cultivars assessed by SRAP markers. J. Genet. 88, 281–290. doi: 10.1007/s12041-009-0041-y
Keywords: DArTseq, within accession diversity, effective population size, landraces, pearl millet, pigeonpea, regeneration, sorghum
Citation: Allan V, Vetriventhan M, Senthil R, Geetha S, Deshpande S, Rathore A, Kumar V, Singh P, Reddymalla S and Azevedo VCR (2020) Genome-Wide DArTSeq Genotyping and Phenotypic Based Assessment of Within and Among Accessions Diversity and Effective Sample Size in the Diverse Sorghum, Pearl Millet, and Pigeonpea Landraces. Front. Plant Sci. 11:587426. doi: 10.3389/fpls.2020.587426
Received: 26 July 2020; Accepted: 05 November 2020;
Published: 14 December 2020.
Edited by:
Velu Govindan, International Maize and Wheat Improvement Center, MexicoReviewed by:
Deepmala Sehgal, International Maize and Wheat Improvement Center, MexicoDinakaran Elango, Pennsylvania State University (PSU), United States
Copyright © 2020 Allan, Vetriventhan, Senthil, Geetha, Deshpande, Rathore, Kumar, Singh, Reddymalla and Azevedo. This is an open-access article distributed under the terms of the Creative Commons Attribution License (CC BY). The use, distribution or reproduction in other forums is permitted, provided the original author(s) and the copyright owner(s) are credited and that the original publication in this journal is cited, in accordance with accepted academic practice. No use, distribution or reproduction is permitted which does not comply with these terms.
*Correspondence: Vânia C. R. Azevedo, v.azevedo@cgiar.org; Mani Vetriventhan, m.vetriventhan@cgiar.org
†ORCID: Victor Allan orcid.org/0000-0001-7230-081X
Mani Vetriventhan orcid.org/0000-0001-9111-2320
Ramachandran Senthil orcid.org/0000-0003-4017-8180
S. Geetha orcid.org/0000-0002-1403-4741
Santosh Deshpande orcid.org/0000-0002-7182-3456
Abhishek Rathore orcid.org/0000-0001-6887-4095
Vinod Kumar orcid.org/0000-0001-7837-7770
Prabhat Singh orcid.org/0000-0001-7827-697X
Surender Reddymalla orcid.org/0000-0002-0983-2474
Vânia C. R. Azevedo orcid.org/0000-0002-9088-078X