 Zhenchang Wang1,2†
 Jinjing Liu1,2†
 Yaosheng Wang3
 Evgenios Agathokleous4
 Yousef Alhaj Hamoud1,5*
 Rangjian Qiu6*Cheng Hong1,2Minghao Tian1,2
 Hiba Shaghaleh7Xiangping Guo1,2
- 1College of Agricultural Science and Engineering, Hohai University, Nanjing, China
- 2Jiangsu Province Engineering Research Center for Agricultural Soil-Water Efficient Utilization, Carbon Sequestration and Emission Reduction, Nanjing, China
- 3Institute of Environment and Sustainable Development in Agriculture, Chinese Academy of Agricultural Sciences, Beijing, China
- 4School of Applied Meteorology, Nanjing University of Information Science and Technology, Nanjing, China
- 5Department of Soil and Land Reclamation, Aleppo University, Aleppo, Syria
- 6State Key Laboratory of Water Resources and Hydropower Engineering Science, Wuhan University, Wuhan, China
- 7College of Environment, Hohai University, Nanjing, China
Natural abundance of the stable isotope (δ13C and δ15N) in plants is widely used to indicate water use efficiency (WUE). However, soil water and texture properties may affect this relationship, which remains largely elusive. Therefore, the purpose of this study was to evaluate δ13C as affected by different combinations of alternate wetting and drying irrigation (AWD) with varied soil clay contents in different organs and whole plant and assess the feasibility of using δ13C and δ15N as a physiological indicator of whole-plant water use efficiency (WUEwhole-plant). Three AWD regimes, I100 (30 mm flooded when soil reached 100% saturation), I90 (30 mm flooded when reached 90% saturation) and I70 (30 mm flooded when reached 70% saturation) and three soil clay contents, 40% (S40), 50% (S50), and 60% (S60), were included. Observed variations in WUEwhole-plant did not conform to theoretical expectations of the organs δ13C (δ13Corgans) of plant biomass based on pooled data from all treatments. However, a positive relationship between δ13Cleaf and WUEET (dry biomass/evapotranspiration) was observed under I90 regime, whereas there were no significant relationships between δ13Corgans and WUEET under I100 or I70 regimes. Under I100, weak relationships between δ13Corgans and WUEET could be explained by (i) variation in C allocation patterns under different clay content, and (ii) relatively higher rate of panicle water loss, which was independent of stomatal regulation and photosynthesis. Under I70, weak relationships between δ13Corgans and WUEET could be ascribed to (i) bigger cracks induced by water-limited irrigation regime and high clay content soil, and (ii) damage caused by severe drought. In addition, a negative relationship was observed between WUEwhole-plant and shoot δ15N (δ15Nshoot) across the three irrigation treatments, indicating that WUEwhole-plant is tightly associated with N metabolism and N isotope discrimination in rice. Therefore, δ13C should be used cautiously as an indicator of rice WUEwhole-plant at different AWD regimes with high clay content, whereas δ15N could be considered an effective indicator of WUEwhole-plant.
Introduction
As one of the world’s most widely cultivated crops, rice provides calories for half the world’s population (Runkle et al., 2021). Nearly two-thirds of the total rice production depends on flooded irrigation (Umesh et al., 2018). However, water for agriculture is facing increasing challenges due to land degradation, water scarcity, chemical contamination, and extreme weather caused by climate changes (Kümmerer et al., 2018). Since crop yield losses due to water deficit is greater than those attributed to other environmental stressors worldwide, efficient use of water resources is of paramount significance (Gao et al., 2018). At leaf level, water use efficiency (WUE) is often defined as the ratio between carbon fixation (An) and stomatal conductance to water vapor (gs) (so-called intrinsic WUE, viz WUEi). The WUE at whole-plant level (WUEwhole-plant) is usually represented by three functions: (i) WUET=Total dry biomass/transpiration (T) (Topbjerg et al., 2014), (ii) WUEET=Total dry biomass/evapotranspiration (ET), and (iii) WUEI=Total dry biomass/irrigation amount (I) (Gao et al., 2018). The WUE based on transpiration contains information about plant photosynthesis with water physiological processes and seems to be most relevant for crop physiological traits (Impa et al., 2005). The WUEET and WUEI are mainly determined from dry matter production and soil water loss (relating to transpiration and soil surface evaporation for WUEET, and relating to transpiration, soil surface evaporation as well as seepage and percolation of soil for WUEI, respectively). Therefore, the WUEET and WUEI can be used as an integrated indicator of environmental conditions affecting plant water relations and dry matter production (Zhao et al., 2004).
Instead of traditional flooded irrigation of rice, an efficient water–saving practice, called alternate wetting and drying (AWD) irrigation, has been widely used. This irrigation practice introduces unsaturated soil conditions into the irrigation scheduling during the growing season, which allows a reduction in the water layer depth until the soil is slightly dry before the next irrigation (Oliver et al., 2019). Numerous studies have demonstrated that AWD improves WUEwhole-plant by 35–63% (Reis et al., 2018; Oliver et al., 2019; Haque et al., 2021; Song et al., 2021). However, several studies reported that the low soil water potential during drying stage of AWD would adversely affect crop physiology and growth, eventually reducing the yield and exhibiting a low WUEwhole-plant (Walley et al., 1999; Carrijo et al., 2017). In addition, seepage and evapotranspiration vary with different statuses of water and soil in the field, for instance, seepage values during cultivated stage were observed to be as high as 25 mm day−1 due to soil cracks in rice fields (Datta et al., 2017). Therefore, it remains debatable whether WUE is improved under AWD, especially in different soil types.
Soil clay content is another factor that can directly or indirectly affect WUE. Clay content affects the ability of soil to retain carbon (C), water, and nutrient ions, thus affecting the biophysiochemical processes in plants (Silver et al., 2000). The interaction between soil texture and irrigation regime is complex. Soil with high clay content expend and swell periodically under AWD in paddy fields, easily causing cracks whose volumes are affected by the severity of the drought (Al-Jeznawi et al., 2020; Bordoloi et al., 2020). The existence of cracks can promote the evaporation rate through the increased soil–air interface, aggravating the damage of drought (Cheng et al., 2021). Moreover, cracks offer a preferential flow path (closely related to seepage and percolation) in subsequent irrigation, accelerating water and fertilizer infiltration and influencing plant physiological responses, hence indirectly reducing yield and WUE (Wang et al., 2018; Cheng et al., 2021). Meanwhile, the tearing effect of cracks on the root system under the high clay content will also affect the plant dry matter allocation and physiological processes, therefore affecting WUE (Ma et al., 2008; Ren et al., 2021). Due to the influence of cracks and soil texture, soil with different clay contents not only differs in evaporation and leakage, but also leads to varied plant physiological responses, such as photosynthesis, transpiration, and C transfer and allocation (Awale et al., 2013; Dou et al., 2016). Therefore, the responses of varying types of WUE, such as WUET, WUEET, and WUEI, to AWD regimes may differ in the presence of different clay contents.
The theory linking δ13C and WUE has been well established, and the physiological basis of such relationship is also well understood. Plants are known to vary in their discrimination against heavy isotope of carbon during the assimilation process of CO2 by photosynthetic carboxylase (30‰) and the diffusion process of atmospheric CO2 through stomata into leaves (4.4‰) (Domergue et al., 2022). Therefore, environmental factors affecting any of the An and gs could have a direct effect on δ13C in plants (Livingston et al., 1999). For example, under drought condition, the isotope discrimination for 13C is relatively low, leading to an enriched 13C in plant matter (Domergue et al., 2022). As a result, there exists a positive linear relationship between δ13C and WUEi in many crop species under drought conditions. Since WUEwhole-plant is highly related to WUEi, the δ13C in plant dry matter is supposed to be strongly correlated with the WUEwhole-plant (Blankenagel et al., 2022).
Although several studies found that δ13C in leaf is positively correlated with WUEwhole-plant under a certain degree of water deficit (Gouveia et al., 2019a; Mininni et al., 2022), the change of WUEwhole-plant is not always consistent with the change of plant δ13C under different irrigation regimes (Walley et al., 1999; Zhao et al., 2004). For instance, Zhao et al. (2004) found that δ13C in rice leaf at different growth periods was negatively correlated or even uncorrelated with WUE under varied irrigation regimes. Under a slight degree of water deficit for AWD, the cracks are probably small or do not exist (Alhaj Hamoud et al., 2018), while high clay content may suggest a changed stomatal conductance or photosynthetic capacity through the improved water and nitrogen condition in soil (Silver et al., 2000), eventually affecting δ13C value in plants. Nonetheless, under severe degree of water deficit for AWD, the soil with high clay content may strongly swell and shrink, leading to the formation of cracks (Al-Jeznawi et al., 2020). This could tear roots and influence the biomass allocation of plant organs (Silver et al., 2000), hence in turn it may affect δ13C in plant dry matter. However, the effect of different irrigation regimes as a function of varied soil clay contents on δ13C remains unknown. Additionally, the isotopic signatures of individual organs are more readily available for physiological and biochemical analysis compared to the whole-plant. The question thus arises as to whether δ13Corgans can be used to predict information on δ13Cwhole-plant. In particular, the internal partitioning and metabolism of primary assimilation may generate δ13C differences between plant organs (Robinson et al., 2000). Therefore, we hypothesized that different AWD regimes under varied soil clay contents could influence the C allocation and δ13C values in various organs, by influencing the soil condition such as water and fertilizer. The relationship between δ13Corgan and δ13Cwhole-plant, and between δ13Corgan and WUEwhole-plant as a function of varied soil clay contents might be modified accordingly.
In addition to δ13C, the N isotope composition (δ15N) of plant was also reported as a physiological indicator responding to drought stress conditions (Ulrich et al., 2019). The WUEwhole-plant is closely related to the WUEi (An/gs) of leaves as previously discussed (Blankenagel et al., 2022). Hence, any factor influencing An and/or gs would have a direct effect on WUEi, in turn affecting WUEwhole-plant. It was reported that WUEi was positively correlated with leaf nitrogen concentration ([N]leaf) under well-watered conditions (Topbjerg et al., 2014; Tang et al., 2017). Considering the variation of [N]leaf and δ15N in plants were both closely linked to N metabolism in plants (Yousfi et al., 2013), it is suggested that there is a link between WUEwhole-plant and δ15N in plants. Consistent with this, Yousfi et al. (2012) showed that leaf δ15N was negatively correlated with transpiration efficiency in durum wheat exposed to salinity and water deficit. A similar relationship between δ15Nleaf and WUE has also been reported in potato (Topbjerg et al., 2014). However, Cao et al. (2014) revealed that WUE was positively correlated with δ15N in poplar (Populus) genotypes. The reasons for this discrepancy remain unknown. In addition, different AWD regimes under varied soil clay contents could also affect N metabolism as well as [N]leaf and δ15N in different organs by influencing soil water and fertilizer conditions, therefore it might alter the relationship between the δ15N and WUE, which, however, also remains unclear.
In this study, an experiment was conducted to investigate the C allocation and 13C distribution in various organs of rice plants as influenced by different irrigation regimes and clay contents. We hypothesized that different irrigation regimes and clay contents could lead to changes in gs and An of rice, thus affecting changes in WUE, δ13C, and δ15N. The combined application of different irrigation regimes and soil clay contents may cause C allocation changes, affecting the relationship between WUE and δ13C, as well as between δ13Corgan and δ13Cwhole-plant. Therefore, the main objectives of this study were to (1) investigate the effect of clay content on carbon allocation of rice organs under three irrigation regimes; (2) evaluate the effect of different irrigation regimes and clay contents on WUE and δ13C at the organ and the whole-plant levels, and (3) comprehensively analyze the relationships between (i) WUE and δ13Corgan, (ii) WUE and δ15Norgan, and (iii) δ13Cwhole-plant and δ13Corgan.
Materials and methods
Experimental site
The experiment was conducted at the Experimental Farm of the Soil and Water Engineering Department of Hohai University, Nanjing, China (longitude 118°83′E and latitude 31°95′N) during July and October, 2016. The area has a typical humid subtropical monsoon climate with an annual precipitation of 1062 mm. The mean temperature is 15.5°C. The used cylindrical pots were 51 cm in height and had a 16 cm inner diameter. Each pot was firstly filled with 1.2 kg gravel-sand soil at the bottom and then covered with 8 kg of dry soil. A drainage hole at the bottom of each pot and a movable basin under the pot were used to collect percolation water. Detailed information about the experimental pots was reported in Wang et al. (2022).
Experimental design
The experiment had nine treatments, consisting of three water regimes and three soil clay contents. Each treatment was replicated four times. The pots were placed under a plastic shelter on a randomized complete block design. For the three water treatments, the pots maintained 25 mm of water over 7 d after transplanting to ensure plant establishment. After that, the upper limit in all the treatments was set as 30 mm flooding water, and the lower limits were 100%, 90%, and 70% of saturated soil water content, respectively (denoted as I100, I90, and I70, respectively). The specific irrigation process in this study is shown in Wang et al. (2022). The soil treatment was controlled using three different soil clay contents, i.e. 40%, 50%, and 60% (denoted as S40, S50 and S60, respectively). The original soil (i.e. S40) had a sand, silt, and clay fraction of 20.81%, 38.94%, and 40.25%, respectively. The S50 and S60 treatments were formed by mixing with respective amounts of pure clay. The selected physicochemical properties and corresponding measurements of soil are same as reported in Wang et al. (2022).
Two seedlings of rice (Oryza sativa L cv. Nanjing44) were transplanted in each pot on 20 July, 2016. Potassium phosphate (0.10 g P kg−1 soil) and potassium sulfate (0.13 g K kg−1 soil) were applied and incorporated before transplanting. In addition, all pots were fertilized with urea (0.15 g N kg−1 soil) in a four-split-application during vegetative and reproductive growth stages.
Soil water content and soil crack volume
The original pot weight with dry soil was recorded. The gravimetrical soil moisture content was measured by weighing the pots based on weight loss every day:
The length, depth, and width of soil cracks were recorded by a steel rule with a 2mm diameter steel rod when the soil water content reached the lower limit of irrigation (100%, 90%, 70% saturated moisture respectively) before each irrigation event. The soil crack volume was calculated by assuming triangular shape of the cracks (Bandyopadhyay et al., 2003):
where d, w and l are the depth, width, and length of the crack (cm), respectively.
The data of average crack volume was shown in Supplementary Figure 1.
Plant sampling and measurements
SPAD, panicle length and dry biomass
The relative chlorophyll content (SPAD) was estimated with a portable chlorophyll meter (SPAD-502, Konica Minolta, Japan). All SPAD readings were taken at the middle portion of fully expanded flag leaf of rice at the full heading stage and were determined between 08:00 h and 11:00 h on a sunny day. The SPAD values of each pot were the average readings of five randomly selected flag leaves. After harvest of rice, the panicle length was measured by a ruler. In addition, grain, stem, leaf, and root samples were separately collected in paper bags. All samples were oven dried at 70°C for 72 h to a constant weight to measure the dry biomass.
Carbon concentration, carbon and nitrogen isotopic composition
After weighing, the rice samples were ground into a fine powder and sieved (2mm), and 0.1 g of fine powdered rice organs was used for measurement of isotopic composition. Carbon concentration([C], %), carbon isotopic composition (δ13C, ‰) and nitrogen isotopic composition (δ15N, ‰) in plant organs were determined using an Elemental Analyzer System (vario PYRO cube, Elementar Analysensysteme GmbH, Germany) interfaced with an Isotope Mass Spectrometer (Isoprime 100, Elementar Analysensysteme GmbH, Germany). The carbon content in organ (Corgan) was calculated from the [C]organ and the dry biomass of the respective organ. The whole plant C content (Cwhole-plant) was calculated from the Cgrain, Cstem, Cleaf, and Croot. The C allocation (%) of organ was defined as the ratio of Corgan to Cwhole-plant. The δ13C and δ15N value of rice organs can be calculated as:
where R is the ratio of 13C/12C or 15N/14N.
The δ13C whole-plant was calculated as follows:
Evapotranspiration and WUE
The amounts of irrigation and percolation water were measured after each irrigation event and were shown in Supplementary Figure 2. The total evapotranspiration (ET) over the growing season for each pipe was determined as the summation of difference between total irrigation water volume and percolation water volume. The accumulative transpiration was calculated by subtracting the water evaporation from the evapotranspiration, as shown in Supplementary Figure 2. The detailed measurement of the surface evaporation loss was displayed in Supplementary information. Water use efficiencies (WUEs) were computed as
Statistical analysis
All data were analyzed with SPSS software (version 13.0, SPSS Inc., Chicago, IL, USA). The data were firstly tested for normality and homogeneity using the Shapiro-Wilks test and the Cochran’s C-test, respectively. Then, differences between either irrigation regimes or soil clay content for the variables measured were tested using two-ways analysis of variance. When significant differences were detected, multiple comparisons of means were carried out with Duncan’s test at a 5% confidence level. In addition, a linear regression analysis was carried out to determine the relationship between (i) WUE and δ13Corgans, (ii) WUE and δ15Norgans, and (iii) δ13Corgans and δ13Cwhole-plant. Pearson correlation analysis was performed to test for correlations among δ15Norgans, δ13Corgans, [C] organs, C allocation rate to diverse organs, SPAD of flag leaves, and crack volume at a 5% confidence level.
Results
SPAD and panicle length
There were significant differences (p< 0.01) in the SPAD values under different water regimes and soil clay contents (Figure 1A). The AWD application (I90 and I70) decreased the SPAD values compared with flooding regime, whereas the elevated clay content significantly increased the SPAD. Compared to I100, the SPAD values under the I90 and I70 regimes decreased by 6.07% and 14.01%, respectively, across soil clay contents. The SPAD values under S50 and S60 increased by 8.42% and 16.08%, respectively, compared to S40, across water regimes. There was no significant (p > 0.05) interaction between the water regime and clay content on SPAD values. In addition, as shown in Figure 1B, the panicle length was significantly influenced by irrigation as well as soil clay content. Across soil clay content, the I70 and I90 regimes significantly decreased the panicle length by 31.60% and 6.49%, respectively, compared to I100. Across irrigation regimes, the panicle length notably increased with the increased clay content (p<0.01).
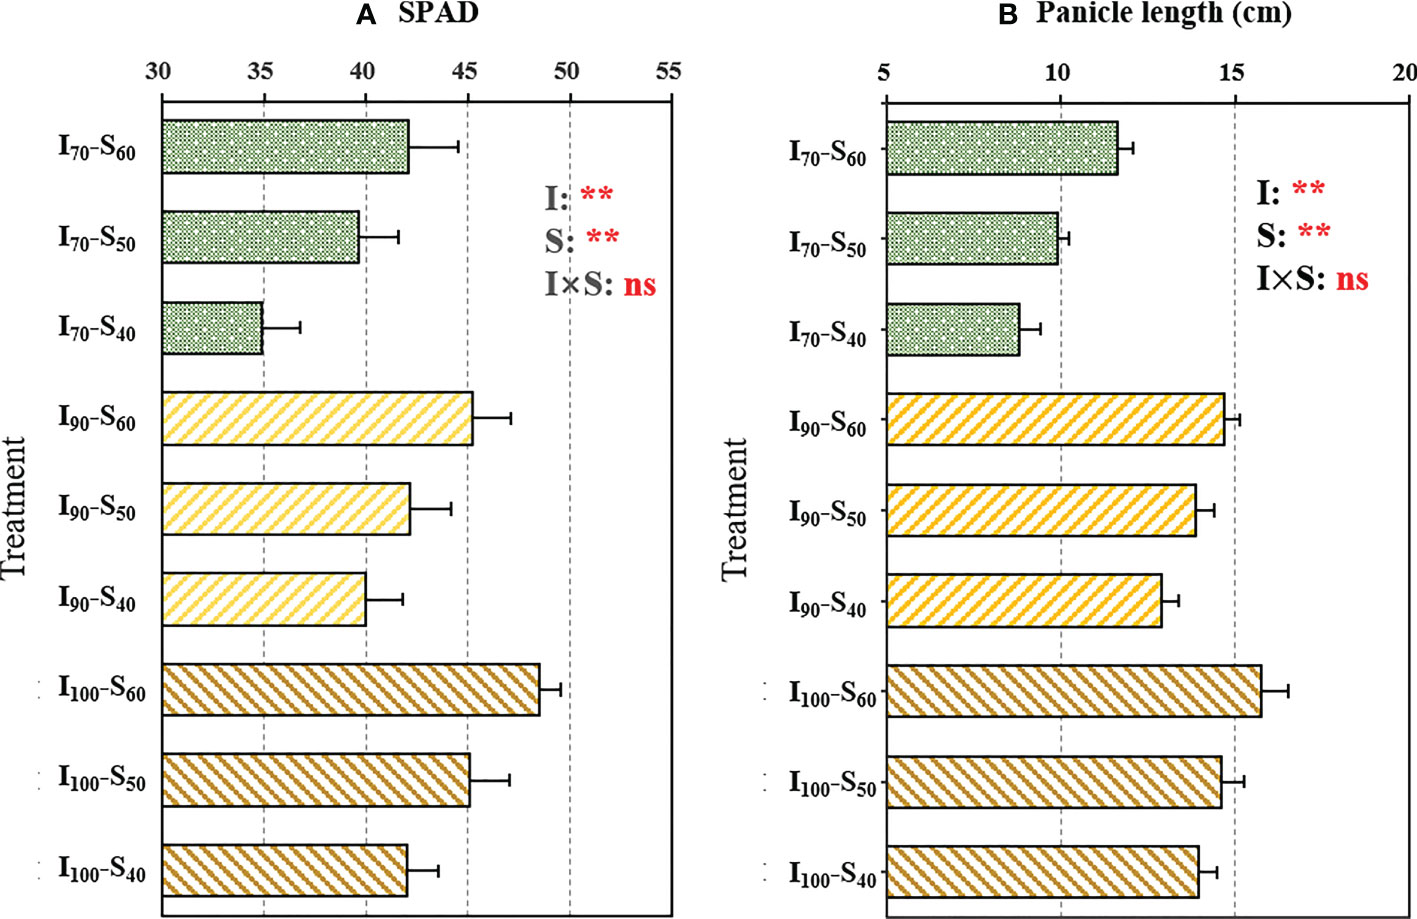
Figure 1 The output of two-way analysis of variance (ANOVA) for (A) SPAD readings of flag leaves and (B) panicle length as influenced by different water regimes and soil clay contents (mean ± SD; n = 4). I70, I90 and I100 represent irrigation regimes of flooding with 30mm (upper limit) as the soil water reaches 70% of saturation (lower limit); flooding with 30mm (upper limit) as the soil water reaches 90% of saturation (lower limit) and flooding with 30mm (upper limit) as the soil water reaches 100% of saturation (lower limit). S40, S50, and S60 indicate soil clay content with 40%, 50% and 60% respectively. I, S, and I×S indicate irrigation regime, soil type, and the interaction between irrigation regime (I) and soil type (S), respectively. ns and ** represent no significance and p<0.01, respectively.
Biomass, ET, and WUE
Figure 2 shows the effects of water regimes and soil clay contents on the dry biomass of rice organs, evapotranspiration (ET) and WUEET. The two-way analysis of variance revealed significant (p< 0.01) differences between the total dry biomass of rice due to the application of different water regimes and soil clay contents (Figure 2A). The total biomass notably increased with elevating clay content, but decreased with a reduction in lower-limit of AWD. Compared to S40, the soil treatment S50 and S60 increased the total biomass by 21.72% and 46.65%, respectively, across irrigation regime. The ET was only significantly affected by the irrigation regimes (p<0.01). The ET under I100 was significantly higher than that under I90 and I70 regimes, across soil clay content. There were also significant (p< 0.01) differences for total transpiration under different water regimes and soil clay contents (Supplementary Figure 2C). With reduction in the lower-limit from 100% to 70% of saturated water content, the transpiration values decreased by 16.39% across soil clay contents. In addition, the transpiration value under S40 was 15.62% greater than that under S60, across water regimes. There was no significant interaction between the water regime and soil clay content on transpiration (p > 0.05).
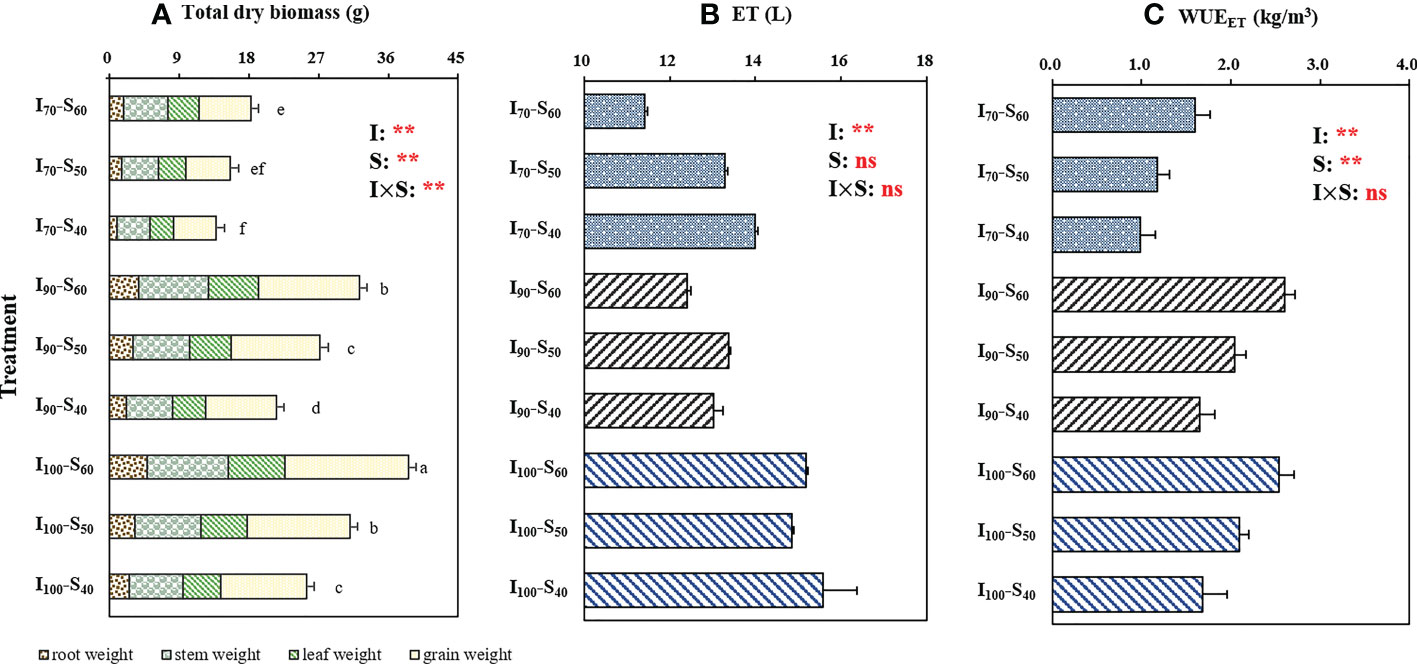
Figure 2 The effect of treatment and output of two-way analysis of variance (ANOVA) for (A) dry biomass of grain, stem, leaf, and root, (B)evapotranspiration (ET), and (C) WUEET of rice as influenced by different water regimes and soil clay contents (mean ± SD; n = 4). I70, I90 and I100 represent irrigation regimes of flooding with 30mm (upper limit) when the soil water reaches 70% of saturation (lower limit); flooding with 30mm (upper limit) as the soil water reaches 90% of saturation (lower limit); and flooding with 30mm (upper limit) as the soil water reaches 100% of saturation (lower limit). S40, S50, and S60 indicate soil clay content with 40%, 50% and 60% respectively. Different letters mean significant differences (p<0.05). I, S, and I×S indicate irrigation regime, soil type, and the interaction between irrigation regime (I) and soil type (S), respectively. ns and ** represent no significance and p<0.01, respectively..
Figure 2C showed significant (p< 0.01) differences in WUEET under different water regimes and soil clay contents. I100 resulted in the highest WUEET while the lowest WUEET value was observed under I70, when analyzed across the soil clay contents. With the increase in soil clay content, the WUEET significantly increased. WUEET under S50 and S60 increased by 22.97% and 56.08%, respectively, compared to S40, across the water regimes. As shown in Figure 2C, no interaction (p > 0.05) on WUEET was found for the water regime and soil clay content treatments. The effect of water regimes and soil clay contents on the WUET and WUEI is shown in Supplementary Figure 3. Increased clay content significantly enhanced both WUET and WUEI. For WUET, across soil clay contents, the highest value and the lowest value were was found in I90 and I70 application, respectively.
C concentration and allocation
For all organs of rice, leaf C concentration ([C]) was significantly affected by soil clay content application (p<0.05, Table 1). The C allocation in the grain and leaf was both affected (p< 0.01) by water regimes and soil clay contents (Table 1). Differences (p< 0.01) in stem C allocation were also found under the different water regimes. The root C allocation varied with the soil clay contents (p< 0.05). Specifically, C allocation in the leaf was higher (p< 0.01) under I70 than that under I100, across the soil clay content treatments, whereas a contrary trend was observed for grain. The stem C allocation was highest in I70 and lowest in I90. With increased clay content, across the irrigation treatments, the C allocation in the grain markedly decreased, but the C allocation in the root significantly increased. For example, the highest value of root C allocation, as an average, was 11.72% under S60 while the lowest value was 9.30% in S40.
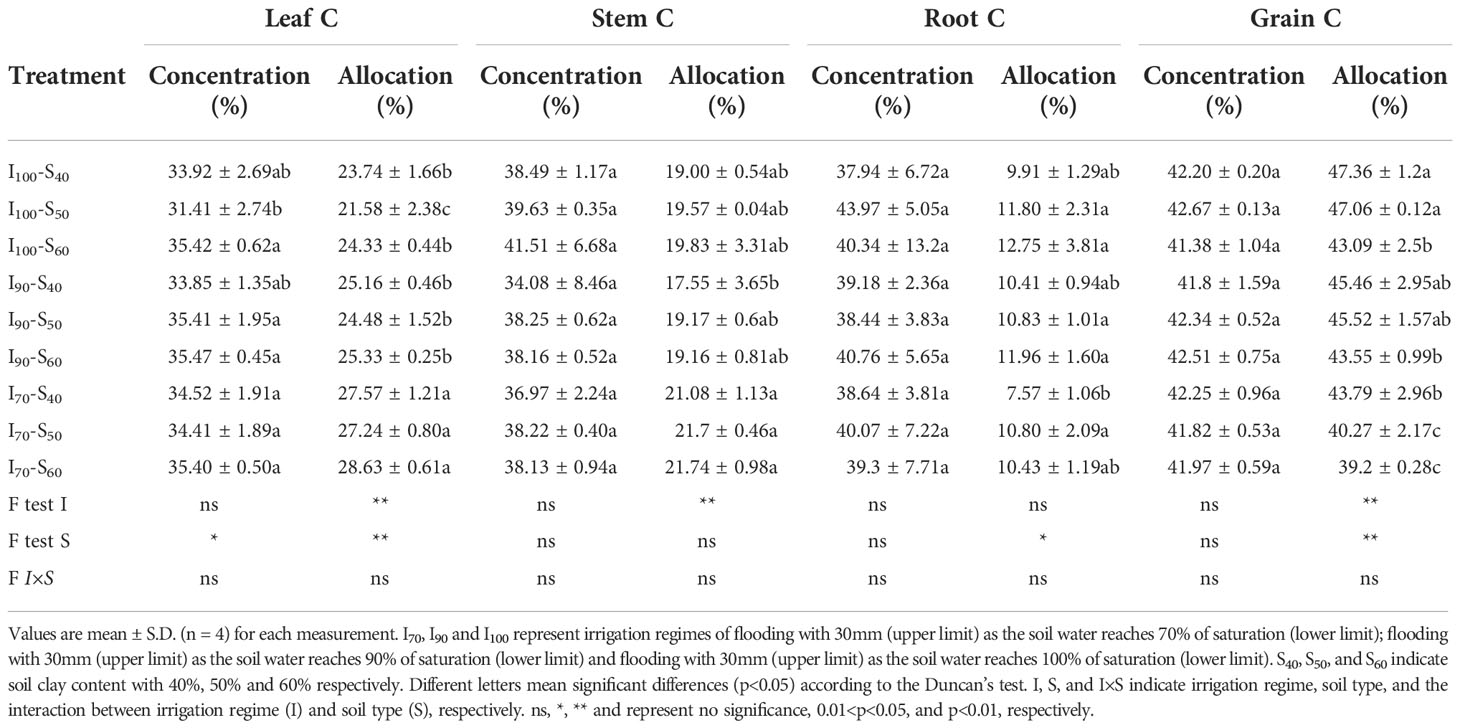
Table 1 The output of treatments and two-way analysis of variance (ANOVA) for the carbon concentration ([C]) values in grain, stem, leaf, and root, and C allocation of grain, stem, leaf, and root subjected to different water regimes and soil clay contents.
Under the I100 and I70 regimes, significant differences were found among the three soil clay contents for C allocation of several organs. However, under the I90 regime, it was similar among the three soil clay contents for all organs. For instance, when increasing the soil clay content from 40% to 60%, the grain C allocation decreased by 9.03% in I100 and 10.48% in I70. The interaction between the water regimes and clay contents was not significant (p > 0.05) for any [C] and C allocation in the different organs.
Variations of δ13C in plant organs and whole-plant
The δ13Cgrain was affected (p< 0.05) by the soil clay content and the interaction between water regime and soil clay content (Figure 3A). With the increasing soil clay content, the δ13Cgrain decreased under I70 and I100 regime, but showed a different trend under the I90 regime. Across water regimes, the δ13Cgrain under S40 (-25.70‰) was significantly higher than that under S60 (-26.97‰). The lowest and highest δ13Cgrain (-27.49‰–24.94‰) were found under the I70-S60 and I100-S40 treatments, respectively.
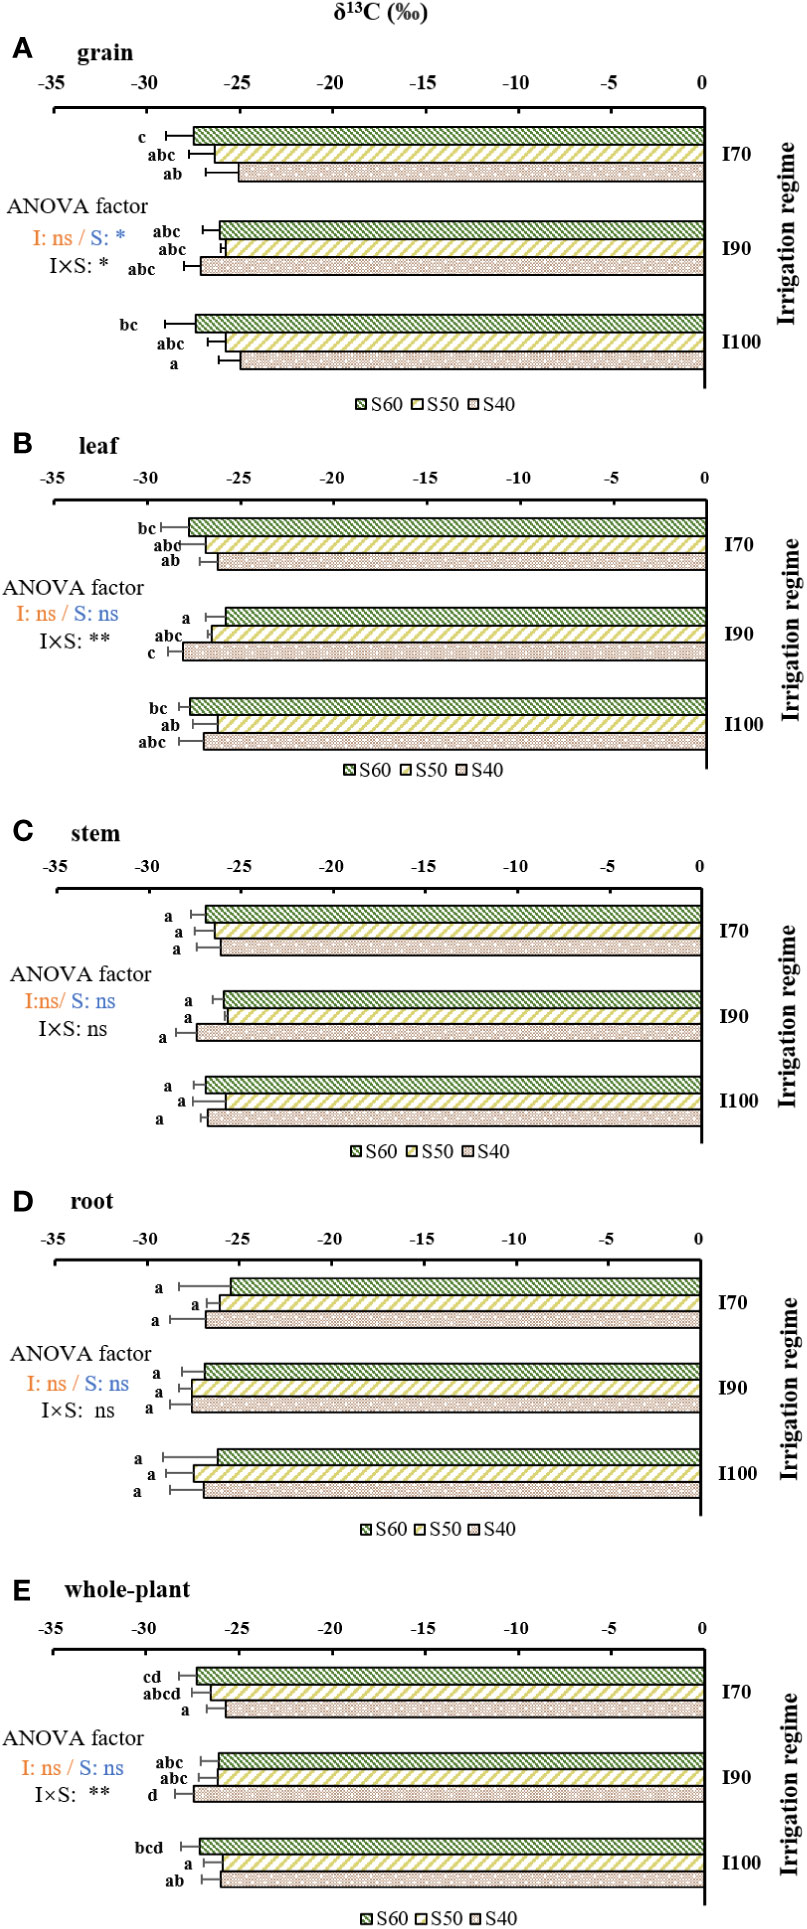
Figure 3 The effects of treatments and output of two-way analysis of variance (ANOVA) for δ13C values in (A) grain, (B) leaf, (C) stem, (D) root and (E) whole-plant as influenced by different water regimes and soil clay contents (mean ± SD; n = 4). I70, I90 and I100 represent irrigation regimes of flooding with 30mm (upper limit) as the soil water reaches 70% of saturation (lower limit); flooding with 30mm (upper limit) as the soil water reaches 90% of saturation (lower limit) and flooding with 30mm (upper limit) as the soil water reaches 100% of saturation (lower limit). S40, S50, and S60 indicate soil clay content with 40%, 50% and 60% respectively. Different letters mean significant differences (p<0.05). I, S, and I×S indicate irrigation regime, soil type, and the interaction between irrigation regime (I) and soil type (S), respectively. ns, *, ** and represent no significance, 0.01<p<0.05, and p<0.01, respectively.
The δ13C values in both leaf and the whole-plant level were significantly influenced by the interaction of water regimes and soil clay contents (Figure 3B, E, p<0.01). For I70, the δ13Cleaf was highest in S40, followed by S50 and S60. For I90, the δ13Cleaf showed an increasing trend with the elevated soil clay content. For I100, the δ13Cleaf decreased with clay content in the order of S50, S40, and S60 applications. The δ13Cwhole-plant showed similar variations as the δ13Cleaf with varied soil clay contents. The lowest δ13Cleaf and δ13Cwhole-plant existed under I90-S40, while the lowest values of δ13Cleaf and the δ13Cwhole-plant existed under the I90-S60 and I70-S40, respectively. In addition, δ13C increased slightly from shoot to root. Especially, under I100-S40, the δ13C in grain was significantly higher than that in other organs.
Relationships between WUE and carbon isotopic composition, and nitrogen isotopic composition
There was no significant relationship found between WUEET and δ13C in rice organs based on the pooled data of nine treatments (Supplementary Figure 4). Nevertheless, across the soil clay content treatments, there was a significantly positive relationship between WUEET and δ13Cleaf (R2=0.73, p<0.01) under I90 irrigation regime (Figure 4B), whereas there was no significant relationship between δ13Corgans and WUEET under I100 or I70 AWD regimes (Figure 4A, C). The WUEI and WUET presented a similar trend for their relationships with rice δ13Corgans (Supplementary Figure 5). Significant relationships were found between (i) WUEI and δ13Cleaf (R2=0.78, p<0.01), (ii) WUEI and δ13Cstem (R2=0.39, p<0.05), and (iii) WUET and δ13Cleaf (R2=0.71, p<0.01) under I90 regime. Across the irrigation regimes, no significant relationship was observed between δ13Corgans and WUEs under any soil treatments (p>0.05, data not shown).
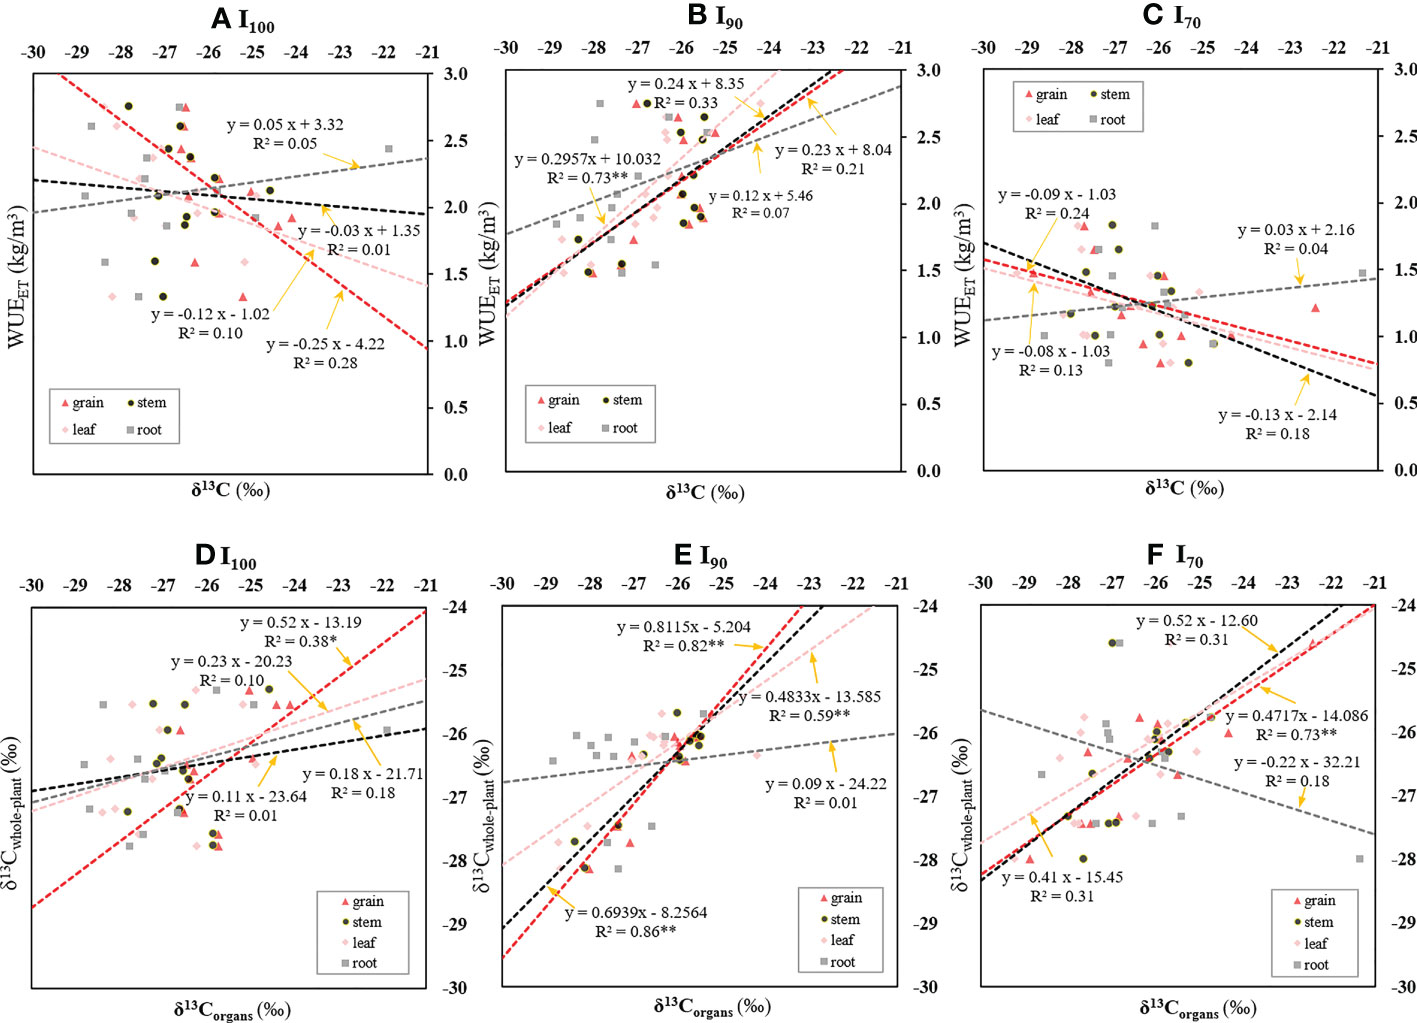
Figure 4 Relationships between WUEET and carbon isotope composition of diverse rice organs (δ13Corgans) (A–C); and between δ13C whole-plant and δ13Corgans (D–F) as influenced by different water regimes. *, ** and represent 0.01<p<0.05, and p<0.01, respectively.
Furthermore, a linear regression was carried out to reveal the variation tendency of the δ13Cwhole-plant with the δ13Corgans under three water regimes (Figure 4D-F). The δ13Cwhole-plant could be expressed as a function of the δ13Cgrain under I100 (R2=0.38, p< 0.05) and I70 regimes (R2=0.73, p< 0.01), respectively. For I90 regime, there were significantly positive relationships between (i) δ13Cwhole-plant and δ13Cgrain (R2=0.82, p<0.01), (ii) δ13C whole-plant and δ13Cstem (R2=0.86, p<0.01), and (iii) δ13Cwhole-plant and δ13Cleaf (R2=0.59, p<0.01).
The SPAD values are positively correlated with the WUEET across the irrigation regimes (R2=0.72, p<0.01, Figure 5). Additionally, there was a significantly negative correlation between WUEI and δ15Ngrain (R2=0.14, p<0.05), and between WUEI and δ15Nleaf (R2=0.22, p<0.01) (Figure 6) based on pooled data. The WUEET was negatively correlated with δ15N in grain (R2=0.24, p<0.01), stem (R2=0.15, p<0.05), and leaf (R2=0.21, p<0.01) (Figure 6). Similarly, the WUET was significantly and negatively correlated with grain (R2=0.23, p<0.01), stem (R2=0.16, p<0.05), and leaf (R2=0.20, p<0.01) (Figure 6).
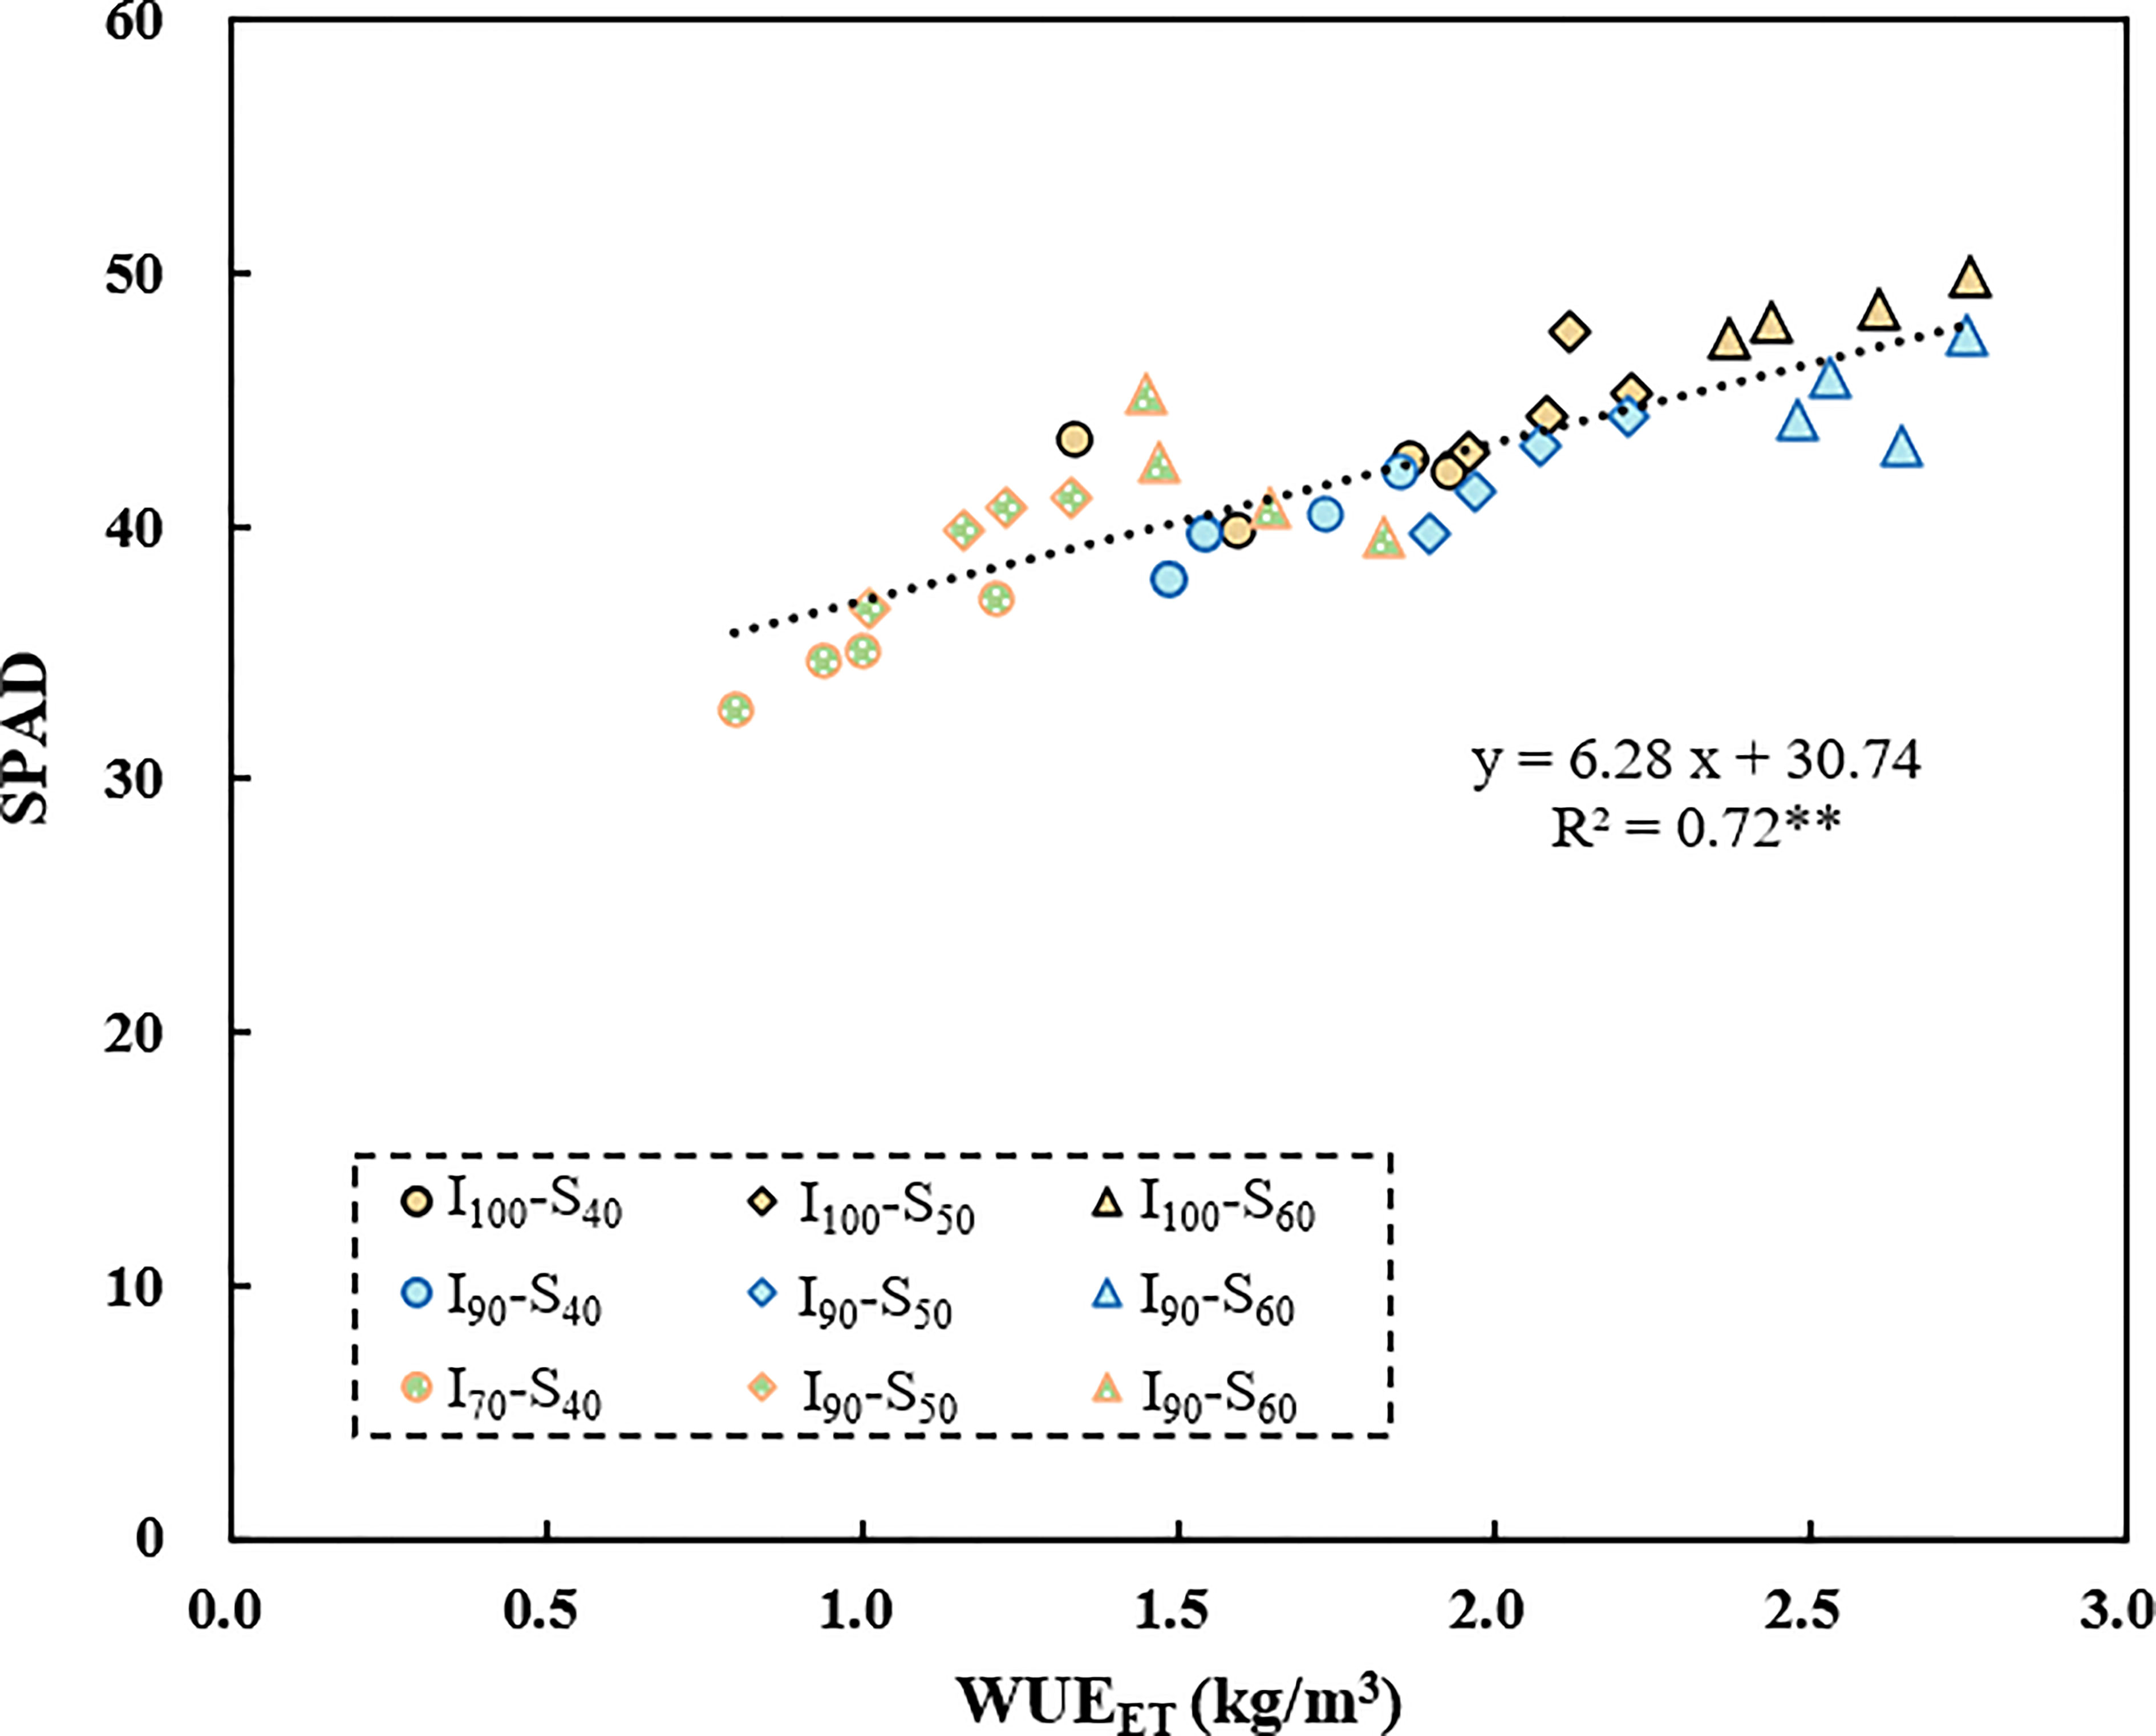
Figure 5 The relationship between SPAD and WUEET as influenced by different water regimes and soil clay contents. ** represents p<0.01.
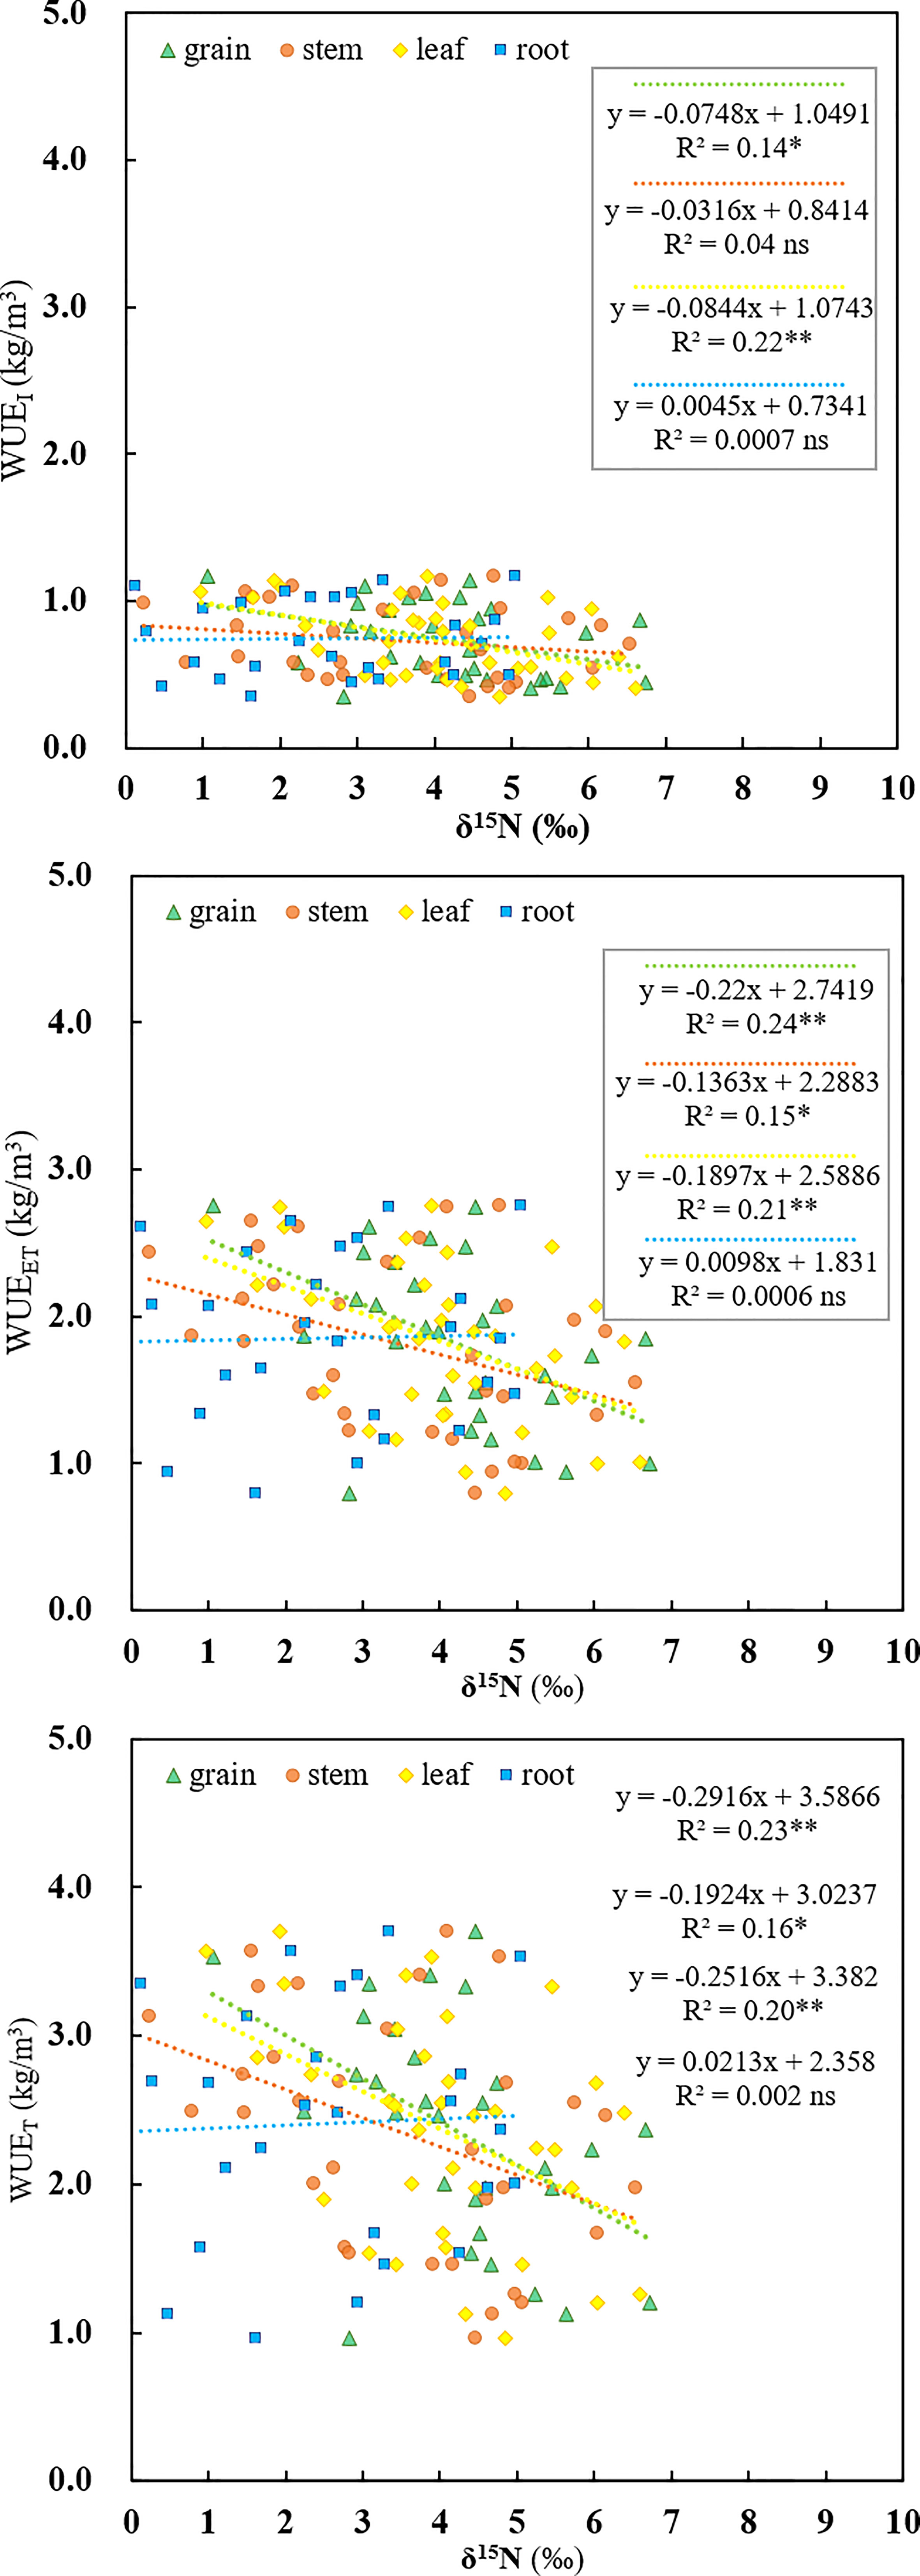
Figure 6 Relationships between three kinds of water use efficiency (WUEI, WUEET, WUET) and nitrogen isotope composition of diverse rice organs (δ15Ngrain, δ15Nstem, δ15Nleaf, δ15N root) as influenced by different water regimes and soil clay contents. ns, *, ** and represent no significance, 0.01<p<0.05, and p<0.01, respectively.
Pearson correlation analysis
Pearson’s correlations among SPAD, δ13C and δ15N of diverse organs are shown in Table 2. The δ15Ngrain (r= -0.50, p< 0.01), δ15Nstem (r= -0.42, p< 0.05) and δ15Nleaf (r= -0.44, p< 0.01) showed a strong negative correlation with SPAD value. In addition, a significantly positive relation between (i) δ13Cgrain and δ13Cstem (r= 0.40, p<0.05), (ii) δ13Cgrain and δ13Cleaf (r= 0.41, p<0.05), and (iii) δ13Cstem and δ13Cleaf (r= 0.54, p<0.01) were found in the current study.
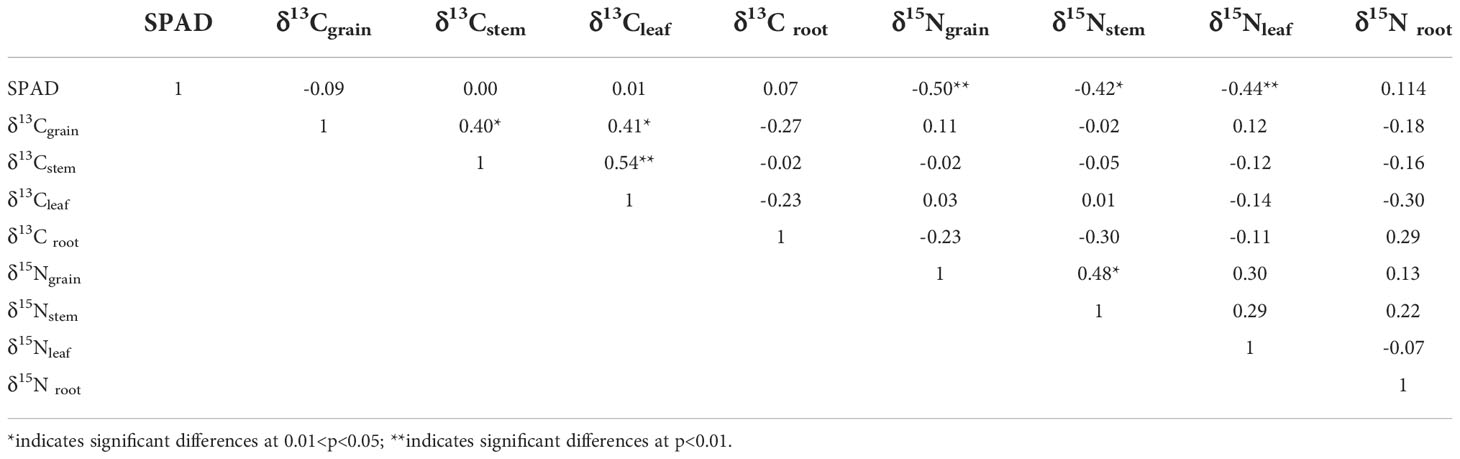
Table 2 Pearson correlation coefficients for SPAD reading, δ13C values in grain, stem, leaf, and root, and δ15N of grain, stem, leaf, and root.
The correlations between the crack volume, [C] and the C allocation of diverse organs are shown in Supplementary Table 1. With increasing crack volume, the C allocation to grain decreased in varying degrees (r=-0.69, p<0.01) while the C allocation to stem and leaf increased (r=0.47, p<0.01 and r=0.81, p<0.01, respectively). However, the crack volume did not have a significant correlation with any organs [C] (Table S1). Furthermore, the [C]grain was negatively correlated with the [C]stem (r=-0.40, p< 0.05). For the C allocation of diverse organs, the C allocation to stem and leaf in rice showed a strong negative correlation with grain (r=-0.66, p<0.01 and r=-0.69, p<0.01, respectively).
Discussion
Effects of irrigation regimes and soil clay contents on WUEs
Water-saving irrigation regime, such as AWD, can improve WUE while maintaining or even increasing rice yield (Song et al., 2021). Consistent with this, in the current study, an increased WUET of rice was observed when reducing the lower-limit of irrigation from 100% to 90% of saturated water content, though the differences were not statistically significant (Supplementary Figure 3). Nevertheless, when the irrigation lower-limit further decreased to 70% of saturated water content, a significantly lower WUET was observed compared to I100 and I90 regimes (Supplementary Figure 3), which mainly due to the higher degree of water deficit in AWD under the I70 treatment (Carrijo et al., 2017). It has been reported that slight drought stress could induce partially stomatal closure, hereby decreasing transpiration and improving WUET (Ma et al., 2021). Whereas, severe drought stress impaired carbon fixation and physiological disorders in plants, such as the reduction of photosynthetic capacity, leading to decreased WUET (Wang et al., 2020). A previous study also indicated that SPAD values of leaves were closely related to photosynthetic capacity (Wang et al., 2012). The significantly lower SPAD values of I70 compared to I90 and I100 (Figure 1A) could indicate the decreased photosynthetic capacity in I70. Consequently, the biomass of I70 was significantly decreased with a reduction in WUET compared to I100 (Figure 2A and Supplementary Figure 3). Similarly, WUEET of I70 was observed significantly lower than those of I100 and I90 (Figure 2C).
In addition to irrigation regimes, the clay content of soil also affected the WUEET and WUET of rice. In the present study, the WUEET and WUET increased with the elevation of soil clay contents (Figure 2C and Supplementary Figure 3) (Fotovat et al., 2007). Similarly, Dou et al. (2016) found that, compared to sand soils, the plants grown in clay soil exhibited higher WUE due to better nitrogen status by increased availability of organic matters and water in clay soil as well as improved nitrogen uptake for plants. Consistent with this, higher SPAD values was observed in the presence of elevated clay content (Figure 1A), which could increase plant photosynthesis capacity (Wang et al., 2012), in line with higher biomass production under this treatment (Figure 2A). WUEI showed a similar changing trend under different irrigation regimes with varied clay content as WUEET and WUET (Figure 2C and Supplementary Figure 3), implying that the three WUEs were mainly regulated by photosynthesis associated with biomass production (Fotovat et al., 2007).
Effect of irrigation regimes and soil clay contents on carbon allocation and δ13C values of different organs
Previous studies reported that carbon allocation in different organs of crops could be induced by irrigation regimes (Arndt and Wanek, 2002; Oliver et al., 2019; Liu et al., 2020). In this study, there were significant differences in C allocation to different organs of rice grown under different irrigation regimes (Table 1). Regarding aboveground organs, C allocation to grain decreased significantly with reduced level of irrigation, but a contrary trend was observed for stem and leaf (Table 1). This result is in contrast to the finding of Song et al. (2021) showing that AWD promoted carbohydrate transfer from stem to grain compared to flooding irrigation. A possible explanation is that moderate drought stress could increase the transfer of C to grain, but this could not occur under severe drought stress due to the drought damage (Oliver et al., 2019). Additionally, Liu et al. (2020) suggested that when plants were exposed to drought stress, the new carbohydrates were preferentially transported from shoot to root, and consequently resulted in an increase of C allocation to root. However, in the current study, the C allocation to belowground organs were not affected by irrigation regimes (Table 1). The phenomenon may be attributed to the larger cracks formed in AWD, which could stretch and tear the roots and might influence the C allocation among organs by inducing root-pruning signal (Supplementary Table 1) (Bordoloi et al., 2020).
In addition to irrigation regime, soil clay content also affected the C allocation of different organs in rice (Table 1). Under I100 and I70 treatment, C allocation to grain varied with clay contents (Table 1), possibly due to the changed water and nitrogen status of soil as affected by the increased clay contents (Fotovat et al., 2007), as previous studies indicated that C allocation of plants differed significantly with respect to the water and fertilizer conditions (Xu et al., 2007). Nonetheless, under the I90 treatment, similar C allocation was observed among organs under different clay contents (Table 1). The possible reason for this discrepancy is ascribed to the soil clay content-induced cracks. For the I100 regime, no soil crack was observed with high soil water potential (Supplementary Figure 1). Therefore, the different clay contents under the same irrigation regime led to the differences in the ability of soils to retain C, water, and nutrient ions, which might impact the C allocation to grain and leaf (Table 1) by affecting plant photosynthetic capacity (Zhao et al., 2021). For I70, the crack volumes were positively correlated with soil clay contents (Supplementary Figure 1), which in turn may significantly influence the soil water and fertilizer contents due to enhanced preferential flow (Cheng et al., 2021). Hence, the C allocation pattern in rice was changed accordingly (Table 1). Regarding I90, the potential increase in N leaching loss associated with enlarged crack volumes (detailed information shown in Wang et al., 2022) was largely offset by the rise in nitrogen retention capacity associated with increased clay content, thereby restricting the variation in the availability of water and nitrogen in soil and C allocation in rice.
It has been widely accepted that variation in allocation patterns in plants could result in δ13C changes in plant organs (De Souza et al., 2005). Compared to autotrophic organs (leaves) that supply plants with carbon, heterotrophic organs (stems, grains and roots) tend to be rich in 13C (Zhang et al., 2015). The difference of δ13C values among organs under I90 was significantly smaller than those under I100 and I70, though there was still a tendency for increased δ13C from leaf to root (Figure 3). Other potential reasons for organ-specific differences in δ13C could be related to the differences in fractionation processes during the enzymatic reactions, and the chemical composition of different organs, such as the amounts of lipids and lignin (Kano-nakata et al., 2014; Zhang et al., 2015). It was found that δ13Cwhole-plant also showed a strong correlation with δ13Cleaf under the I90 regime (Figure 4E), which was in agreement with the finding of Gouveia et al. (2019b). Moreover, δ13Cgrain showed the most consistent and significant correlation with δ13C whole-plant under three irrigation regimes (I100, I90 and I70) (Figure 4D-F). This result may be attributed to the isotopic fractionation during the allocation and transfer processes of carbon within plants (Sanchez-Bragado et al., 2014). As shown in equation 4, δ13C whole-plant was the integrated δ13C values of different organs. Similarly, as indicated by Araus et al. (1993) and Zhu et al. (2021), δ13Cgrain was the result of the combined δ13C values of assimilates produced by different photosynthetic organs, such as the ears and the flag leaves, responsible for grain filling after anthesis, and the remobilization of nonstructural carbohydrate reserves stored in the specific organ, such as the sheaths and culm. Thus, accordingly, δ13Cgrain showed the most consistent correlation with δ13C whole-plant across different treatments, and might be a priority indicator of δ13C whole-plant. The strong negative correlation between [C]grain and [C]stem found in this study (p<0.05, r=-0.40, Supplementary Table 1) further supported the aforementioned speculation. However, there were weak correlations between other δ13Corgans (δ13Cleaf, δ13Cstem, δ13Croot) and δ13Cwhole-plant under I100 or I70 treatment (Figures 4D, F). We speculated that this weak correlation may be related to variations in carbon allocation patterns under the two regimes with varied soil clay contents (Table 1).
Relationship between δ13Corgans and WUE and δ13Cwhole- plant
Farquhar and Richards (1984) reported that Ci/Ca was negatively related to WUEi, while Ci/Ca was negatively related to organ δ13C. Thus, it could be concluded that there was a positive relationship between organ δ13C and WUEi. However, in this study, there was no significant correlation between δ13Corgans and WUEwhole-plant based on pooled data (Supplementary Figure 4). This phenomenon could be explained as follows. First, the possible varied leaf boundary layer conductance among different treatments might result in WUEi independence from stomatal conductance, Ci/Ca and δ13C (Cernusak et al., 2009). In this study, although we did not measure leaf boundary layer conductance between the intercellular spaces and the atmosphere, the significantly higher water loss through transpiration as well as the increased leaf biomass for I100, compared to I70 (Figure 2A and Supplementary Figure 2), might indirectly indicate the varied microclimate and plant statuses caused by different irrigation regimes. Second, the degree of dark respiration, changed mesophyll conductance (gm) under different environmental conditions, and varied proportions of uncontrolled water loss to the transpiration might disturb the relationship between Ci/Ca, δ13C and An/T (photosynthesis rate/transpiration rate) (Farquhar et al., 1989), which consequently result in a poor relationship between organs δ13C and WUEwhole-plant. Interestingly, when the data were grouped into different irrigation regimes, relationships between δ13C and WUEwhole-plant varied with changed irrigation regimes (Figure 4 and Supplementary Figure 5). For I90, there was a significant positive relationship between δ13C and WUEwhole-plant, which was in agreement with the findings by Mininni et al. (2022). However, there were no significant relationships between the WUE and δ13Cwhole-plant in I100 and I70 treatment. For I100, the poor relationship between δ13C of plant organs and WUEwhole-plant might be related to the relatively higher rate of panicle water loss. As indicated by Scartazza et al. (1998), most water loss through panicle was cuticular, which was independent of stomatal regulation and photosynthesis. Hence, high rates of panicle transpiration might disturb the relationships between δ13C and WUE in rice. In this study, increased panicle length (Figure 1B) as well as greater grain weight (Figure 2A) for I100 compared to I90 and I70 might indicate that the relatively higher proportions of panicle water loss to total transpiration would disturb the relationship between δ13C and WUE in rice under I100. Furthermore, changes of carbon allocation pattern for I100 with varied soil clay content (Table 1) might also lead to a breakdown in the relationship between δ13Cleaf and WUEwhole-plant (Wen et al., 2022). For I70, the weak relationship between δ13C and WUEwhole-plant (Figure 4 and Supplementary Figure 5) might be due to physiological damages under severe water deficit, such as severely reduced photosynthetic enzyme activity and consequently disrupted photosynthetic process (Bogati and Walczak, 2022). In addition, for I70, the bigger cracks formed in this water-limited irrigation regime were associated with the stimulated leaching of water and nitrogen. Meanwhile, the tearing effect of cracks on the root system under the high clay content together with the reduced availability of water and nitrogen in I70 might deteriorate the physiological disorder process, which consequently results in breakdown of the relationship between δ13Cleaf and the WUEwhole-plant.
Relationship between organs δ15N and WUE
In contrast to the relationship between δ13C and WUEwhole-plant, which varies with irrigation regimes, we found a significant negative correlation between δ15Nleaf and WUEwhole-plant based on pooled data (Figure 6). This result is consistent with the findings of Topbjerg et al. (2014) and Yousfi et al. (2012) but contrasting to the results of Cao et al. (2014). WUEwhole-plant is known to be highly associated with WUEi, controlled by either An or gs, or a combination of both, and could be improved by enhancing the An or by lowering gs. In this study, with the elevated soil clay content, the WUEET significantly increased (Figure 2C), mainly due to the increased photosynthetic capacity. SPAD has been extensively used to indicate the [N] and photosynthetic capacity in the leaf in the last few years, and a higher SPAD would mean a higher An (Fotovat et al., 2007). With the increased clay content, the [N]leaf increased accordingly, thereby increasing the An and WUEET. Consistent with this, SPAD was significantly positively correlated with WUEET in this experiment (Figure 5). In addition, if the increased WUEi was only linked to SPAD, then a positive correlation between SPAD and δ13Cleaf associated with time-integrated WUEi would be expected. However, in the present study, there was no clear relationship between SPAD and δ13C (p>0.05, Table 2), indicating that other factors may control increased WUEET, such as decreased stomatal conductance in response to abiotic stress (Desrochers et al., 2022). As mentioned previously, SPAD had a significant positive correlation with clay content (Figure 1A). Under water-saving irrigation, with the increase of clay content, larger cracks formed in field could stretch and tear the roots, which is similar to the effect of root pruning (Bordoloi et al., 2020), which could decrease both stomatal conductance and transpiration due to the pruning-induced root signals (Ma et al., 2008; Feng et al., 2022). In this study, the large cracks observed under the same AWD regime with high clay content might suggest a strong stress signal generated by root pruning. Consequently, the stomatal conductance of rice was speculated to be reduced accordingly. Meanwhile, previous studies have shown that reduced gs would lead to a reduction in the loss of ammonia and nitrous oxide, hence decreasing δ15N in leaf (Yousfi et al., 2012). Therefore, increased WUEET and WUET caused by reduced gs (Yan et al., 2020) was expected to be negatively correlated with δ15Nleaf, which is consistent with the results of this study.
Another reason for the negative relationship between 15N and WUEwhole-plant might be the decreased transport from root to shoot of plants exposed to stress-condition (Yousfi et al., 2012). Due to the fractionation induced by nitrate reductase (NR), not assimilated in the roots would be enriched in 15N and exported to shoots for assimilation, causing an increased δ15N in shoots relative to roots (Zhang et al., 2017). Hence, stress conditions would restrict transport from the roots to the shoots, therefore increasing 15N in root while decreasing it in the shoots compared with the flooding irrigation (Yousfi et al., 2012). In our study, the clay contents in soil were positively correlated with SPAD (Figure 1A). Moreover, as shown in Supplementary Figure 1, the soil clay contents were also positively correlated with crack volume under AWD. As suggested aforementioned, higher crack volumes under AWD might imply a strengthened abiotic stress for crop, and consequently reduced from root to shoot, and ultimately resulted in the decrease of δ15N in shoot. Thus, a negative relationship between SPAD and shoot δ15N was likely to be found (Table 2). In this study, the C and N allocation to roots were significantly increased with the elevated soil clay content (Table 1), which further demonstrated that the large crack reduced the export of from roots to shoots. Moreover, the WUEET showed a significant positive correlation with SPAD (Figure 5), but a negative correlation with δ15N (Figure 6). Hence, the SPAD values tend to be negatively correlated with the δ15N (Table 2) and further supported that the increased WUE was probably due to a combination of An and gs. However, it should be noted that 15N in plants can also be influenced by the variations of soil nutrients (Tang et al., 2017), which was limited by the occurrence of cracks. In this case, the discrimination process for 15N during the N uptake tends to be slight, resulting in an increased 15N in plants while the WUE was decreased by the crack. Therefore, a significant negative relationship between the WUE and δ15N was found (Figure 6), but further trials are needed to examine the actual underlying mechanism.
Conclusions
WUEwhole-plant generally increased with higher soil clay content. Variations in WUEwhole-plant were not consistent with variations in δ13C of organs under varied irrigation regimes with high clay contents. The rice δ13C leaf was closely and positively related to the WUEwhole-plant under I90 regimes, whereas δ13C organs was not related to WUEwhole-plant under I100 or I70 water regime. Among the organs, significant correlations were observed between δ13Cgrain and δ13Cwhole-plant under I100, I90 and I70 regimes. In addition, based on pooled data, WUEwhole-plant showed a significant negative correlation with δ15Nshoot. Therefore, it is suggested that δ13C could not be used as a reliable indicator of differences in WUEwhole-plant associated with changes in irrigation regimes and clay content, whereas δ15N could be considered as an effective indicator of WUEwhole-plant.
Data availability statement
The original contributions presented in the study are included in the article/Supplementary Material. Further inquiries can be directed to the corresponding authors.
Author contributions
ZCW and YAH designed the experiments. ZCW and JJL wrote the article and made critical revisions. CH and MHT helped in analyzing the data. YAH and RJQ supervised the experiments. RJQ, YSW, EA, HS, XPG edited and complemented the manuscript writing and its discussion. All authors contributed to the article and approved the submitted version.
Funding
This study was funded by the Fundamental Research Funds for the Central Universities (B210202118), the National Natural Science Foundation of China (52079041,52179036). EA acknowledges multi-year support from The Startup Foundation for Introducing Talent of Nanjing University of Information Science & Technology (NUIST), Nanjing, China (Grant No. 003080) and the Jiangsu Distinguished Professor program of the People’s Government of Jiangsu Province.
Conflict of interest
The authors declare that the research was conducted in the absence of any commercial or financial relationships that could be construed as a potential conflict of interest.
Publisher’s note
All claims expressed in this article are solely those of the authors and do not necessarily represent those of their affiliated organizations, or those of the publisher, the editors and the reviewers. Any product that may be evaluated in this article, or claim that may be made by its manufacturer, is not guaranteed or endorsed by the publisher.
Supplementary material
The Supplementary Material for this article can be found online at: https://www.frontiersin.org/articles/10.3389/fpls.2022.1077152/full#supplementary-material
References
Alhaj Hamoud, Y., Guo, X., Wang, Z., Chen, S., Rasool, G. (2018). Effects of irrigation water regime, soil clay content and their combination on growth, yield, and water use efficiency of rice grown in south China. Int. J. Agric. Biol. Eng. 11, 126–136. doi: 10.25165/j.ijabe.20181104.3895
Al-Jeznawi, D., Sanchez, M., Al-Taie, A. J. (2020). Effect of wetting-drying cycles on desiccation crack pattern and soil behavior. Key Eng. Mater. 857, 188–194. doi: 10.4028/www.scientific.net/KEM.857.188
Araus, J. L., Brown, H. R., Febrero, A., Bort, J., Seeret, M. D. (1993). Ear photosynthesis, carbon isotope discrimination and the contribution of respiratory CO2 to differences in grain mass in durum wheat. Plant Cell Environ. 16, 383–392. doi: 10.1111/j.1365-3040.1993.tb00884.x
Arndt, S. K., Wanek, W. (2002). Use of decreasing foliar carbon isotope discrimination during water limitation as a carbon tracer to study whole plant carbon allocation. Plant Cell Environ. 25, 609–616. doi: 10.1046/j.1365-3040.2002.00838.x
Awale, R., Chatterjee, A., Kandel, H., Ransom, J. (2013). U.S. north-central: Denitrification loss of fertilizer nitrogen during drought year under soil with high clay content. Crop Soils 46, 24–32. doi: 10.2134/cs2013-46-4-7
Bandyopadhyay, K. K., Mohanty, M., Painuli, D. K., Misra, A. K., Hati, K. M., Mandal, K. G., et al. (2003). Influence of tillage practices and nutrient management on crack parameters in a Vertisol of central India. Soil Tillage Res. 71, 133–142. doi: 10.1016/S0167-1987(03)00043-6
Blankenagel, S., Eggels, S., Frey, M., Grill, E., Bauer, E., Dawid, C., et al. (2022). Natural alleles of the abscisic acid catabolism gene ZmAbh4 modulate water use efficiency and carbon isotope discrimination in maize. Plant Cell 00, 0–13. doi: 10.1093/plcell/koac200
Bogati, K., Walczak, M. (2022). The impact of drought stress on soil microbial community, enzyme activities and plants. Agronomy 12, 1–26. doi: 10.3390/agronomy12010189
Bordoloi, S., Ni, J., Wang, C., Ng, W., Ng, C. W. W. (2020). Soil desiccation cracking and its characterization in vegetated soil: A perspective review. Sci. Total Environ. 729, 138760. doi: 10.1016/j.scitotenv.2020.138760
Cao, X., Jia, J., Zhang, C., Li, H., Liu, T., Jiang, X., et al. (2014). Anatomical, physiological and transcriptional responses of two contrasting poplar genotypes to drought and re-watering. Physiol. Plant 151, 480–494. doi: 10.1111/ppl.12138
Carrijo, D. R., Lundy, M. E., Linquist, B. A. (2017). Rice yields and water use under alternate wetting and drying irrigation: A meta-analysis. F. Crop Res. 203, 173–180. doi: 10.1016/j.fcr.2016.12.002
Cernusak, L. A., Winter, K., Turner, B. L. (2009). Physiological and isotopic (δ13C and δ18O) responses of three tropical tree species to water and nutrient availability. Plant Cell Environ. 32, 1441–1455. doi: 10.1111/j.1365-3040.2009.02010.x
Cheng, Q., Tang, C. S., Xu, D., Zeng, H., Shi, B. (2021). Water infiltration in a cracked soil considering effect of drying-wetting cycles. J. Hydrol. 593, 125640. doi: 10.1016/j.jhydrol.2020.125640
Datta, A., Ullah, H., Ferdous, Z. (2017). “Water management in rice,” in Rice prod. worldw (Springer Cham: Springer International Publishing), 255–277.
Reis, A. F. B., Almeida, R. E. M., Lago, B. C., Trivelin, P. C., Linquist, B. A., Favarin, J. L.. (2018). Aerobic rice system improves water productivity, nitrogen recovery and crop per- formance in Brazilian weathered lowland soil. Field Crops Res 218, 59–68. doi: 10.1016/j.fcr.2018.01.002
De Souza, C. R., Maroco, J. P., Dos Santos, T. P., Rodrigues, M. L., Lopes, C. M., Pereira, J. S., et al. (2005). Impact of deficit irrigation on water use efficiency and carbon isotope composition (δ13C) of field-grown grapevines under Mediterranean climate. J. Exp. Bot. 56, 2163–2172. doi: 10.1093/jxb/eri216
Desrochers, J., Brye, K. R., Pollock, E. D., Kristofer Brye, C. R. (2022). Long-term agricultural practice effects on carbon and nitrogen isotopes of soil organic matter fractions. Agrosyst. Geosci. Environ. 5, e20232. doi: 10.1002/agg2.20232
Domergue, J., Abadie, C., Lalande, J., Deswarte, J., Bédard, C., Derory, J., et al. (2022). Grain carbon isotope composition is a marker for allocation and harvest index in wheat. Plant Cell Environ. 45, 2145–2157. doi: 10.1111/pce.14339
Dou, F., Soriano, J., Tabien, R. E., Chen, K. (2016). Soil texture and cultivar effects on rice (Oryza sativa, l.) grain yield, yield components and water productivity in three water regimes. PloS One 11, 1–12. doi: 10.1371/journal.pone.0150549
Farquhar, G. D., Ehleringer, J. R., Hubick, K. T. (1989). Carbon isotope discrimination and photosynthesis. Annu. Rev. Plant Physiol. Plant Mol. Biol. 40, 503–537. doi: 10.1146/annurev.pp.40.060189.002443
Farquhar, G. D., Richards, R. A. (1984). Isotopic composition of plant carbon correlates with water-use efficiency of wheat genotypes. Aust. J. Plant Physiol. 11, 539–552. doi: 10.1071/PP9840539
Feng, Z., Kong, D., Kong, Y., Zhang, B., Yang, X. (2022). Coordination of root growth with root morphology, physiology and defense functions in response to root pruning in Platycladus orientalis. J. Adv. Res. 36, 187–199. doi: 10.1016/j.jare.2021.07.005
Fotovat, R., Valizadeh, M., Toorchi, M. (2007). Association between water-use efficiency components and total chlorophyll content (SPAD) in wheat (Triticum aestivum l.) under well-watered and drought stress conditions. J. Food Agric. Environ. 5, 225–227.
Gao, Q., Sun, J., Tong, H., Wang, W., Zhang, Y., Zhang, G., et al. (2018). Evaluation of rice drought stress response using carbon isotope discrimination. Plant Physiol. Biochem. 132, 80–88. doi: 10.1016/j.plaphy.2018.08.030
Gouveia, C. S. S., Ganança, J. F. T., Slaski, J., Lebot, V., Pinheiro de Carvalho, M.Â.A. (2019a). Stable isotope natural abundances (δ13C and δ15N) and carbon-water relations as drought stress mechanism response of taro (Colocasia esculenta l. Schott). J. Plant Physiol. 232, 100–106. doi: 10.1016/j.jplph.2018.11.024
Gouveia, C. S. S., Ganança, J. F. T., Slaski, J., Lebot, V., Pinheiro de Carvalho, M.Â.A. (2019b). Variation of carbon and isotope natural abundances (δ15N and δ13C) of whole-plant sweet potato (Ipomoea batatas l.) subjected to prolonged water stress. J. Plant Physiol. 243, 153052. doi: 10.1016/j.jplph.2019.153052
Haque, A. N. A., Uddin, M. K., Sulaiman, M. F., Amin, A. M., Hossain, M., Aziz, A. A., et al. (2021). Impact of organic amendment with alternate wetting and drying irrigation on rice yield, water use efficiency and physicochemical properties of soil. Agronomy 11, 1529. doi: 10.3390/agronomy11081529
Impa, S. M., Nadaradjan, S., Boominathan, P., Shashidhar, G., Bindumadhava, H., Sheshshayee, M. S. (2005). Carbon isotope discrimination accurately reflects variability in WUE measured at a whole plant level in rice. Crop Sci. 45, 2517–2522. doi: 10.2135/cropsci2005.0119
Kano-nakata, M., Tatsumi, J., Inukai, Y., Asanuma, S. (2014). Effect of various intensities of drought stress on δ13C variation among plant organs in rice: Comparison of two cultivars. Am. J. Plant Sci. 5, 1686–1693. doi: 10.4236/ajps.2014.511183
Kümmerer, K., Dionysiou, D. D., Olsson, O., Fatta-Kassinos, D. (2018). A path to clean water. Science 361, 222–224. doi: 10.1126/science.aau2405
Liu, Y., Li, P., Wang, T., Liu, Q., Wang, W. (2020). Root respiration and belowground carbon allocation respond to drought stress in a perennial grass (Bothriochloa ischaemum). Catena 188, 104449. doi: 10.1016/j.catena.2019.104449
Livingston, N. J., Guy, R. D., Sun, Z. J., Ethier, G. J. (1999). The effects of nitrogen stress on the stable carbon isotope composition, productivity and water use efficiency of white spruce (Picea glauca (Moench) Voss) seedlings. Plant Cell Environ. 22, 281–289. doi: 10.1046/j.1365-3040.1999.00400.x
Ma, W. T., Tcherkez, G., Wang, X. M., Schäufele, R., Schnyder, H., Yang, Y., et al. (2021). Accounting for mesophyll conductance substantially improves 13C-based estimates of intrinsic water-use efficiency. New Phytol. 229, 1326–1338. doi: 10.1111/nph.16958
Ma, S. C., Xu, B. C., Li, F. M., Liu, W. Z., Huang, Z. B. (2008). Effects of root pruning on competitive ability and water use efficiency in winter wheat. F. Crop Res. 105, 56–63. doi: 10.1016/j.fcr.2007.07.005
Mininni, A. N., Tuzio, A. C., Brugnoli, E., Dichio, B., Sofo, A. (2022). Carbon isotope discrimination and water use efficiency in interspecific Prunus hybrids subjected to drought stress. Plant Physiol. Biochem. 175, 33–43. doi: 10.1016/j.plaphy.2022.01.030
Oliver, V., Cochrane, N., Magnusson, J., Brachi, E., Monaco, S., Volante, A., et al. (2019). Effects of water management and cultivar on carbon dynamics, plant productivity and biomass allocation in European rice systems. Sci. Total Environ. 685, 1139–1151. doi: 10.1016/j.scitotenv.2019.06.110
Ren, B., Qiu, S., Shen, C., Wang, P. (2021). Stable carbon isotope (δ13C) composition in leaf of pinus sylvestris var. mongolica in hulunbuir and its relationship with ecological stoichiometry and environmental factors. Preprints 2021060551. doi: 10.20944/preprints202106.0551.v1.
Robinson, D., Handley, L. L., Scrimgeour, C. M., Gordon, D. C., Forster, B. P., Ellis, R. P. (2000). Using stable isotope natural abundances (δ15N and δ13C) to integrate the stress responses of wild barley (Hordeum spontaneum c. koch.) genotypes. J. Exp. Bot. 51, 41–50. doi: 10.1093/jxb/51.342.41
Runkle, B. R. K., Seyfferth, A. L., Reid, M. C., Limmer, M. A., Moreno-García, B., Reavis, C. W., et al. (2021). Socio-technical changes for sustainable rice production: Rice husk amendment, conservation irrigation, and system changes. Front. Agron. 3. doi: 10.3389/fagro.2021.741557
Sanchez-Bragado, R., Elazab, A., Zhou, B., Serret, M. D., Bort, J., Nieto-Taladriz, M. T., et al. (2014). Contribution of the ear and the flag leaf to grain filling in durum wheat inferred from the carbon isotope signature: Genotypic and growing conditions effects. J. Integr. Plant Biol. 56, 444–454. doi: 10.1111/jipb.12106
Scartazza, A., Lauteri, M., Guido, M. C., Brugnoli, E. (1998). Carbon isotope discrimination in leaf and stem sugars, water-use efficiency and mesophyll conductance during different developmental stages in rice subjected to drought. Aust. J. Plant Physiol. 25, 489–498. doi: 10.1071/PP98017
Silver, W. L., Neff, J., McGroddy, M., Veldkamp, E., Keller, M., Cosme, R. (2000). Effects of soil texture on belowground carbon and nutrient storage in a lowland Amazonian forest ecosystem. Ecosystems 3, 193–209. doi: 10.1007/s100210000019
Song, T., Das, D., Hu, Q., Yang, F., Zhang, J. (2021). Alternate wetting and drying irrigation and phosphorus rates affect grain yield and quality and heavy metal accumulation in rice. Sci. Total Environ. 752, 141862. doi: 10.1016/j.scitotenv.2020.141862
Tang, B., Yin, C., Yang, H., Sun, Y., Liu, Q. (2017). The coupling effects of water deficit and nitrogen supply on photosynthesis, WUE, and stable isotope composition in Picea asperata. acta physiol. Plant 39, 1–11. doi: 10.1007/s11738-017-2451-4
Topbjerg, H. B., Kaminski, K. P., Markussen, B., Kørup, K., Nielsen, K. L., Kirk, H. G., et al. (2014). Physiological factors affecting intrinsic water use efficiency of potato clones within a dihaploid mapping population under well-watered and drought-stressed conditions. Sci. Hortic. 178, 61–69. doi: 10.1016/j.scienta.2014.08.006
Ulrich, D. E. M., Sevanto, S., Peterson, S., Ryan, M., Dunbar, J. (2019). Effects of soil microbes on functional traits of loblolly pine (Pinus taeda) seedling families from contrasting climates. Front. Plant Sci. 10. doi: 10.3389/fpls.2019.01643
Umesh, M. R., Mallesha, Chittapur, B. M., Angadi, S. (2018). Alternate wetting and drying (AWD) irrigation for rice to enhance water productivity and sustainable production: A review. J. Farm Sci. 30, 441–449.
Walley, F. L., Matus, A., Lafond, G. P., van Kessel, C. (1999). Water-use efficiency and carbon isotopic composition in reduced tillage systems. Soil Sci. Soc Am. J. 63, 356–361. doi: 10.2136/sssaj1999.03615995006300020013x
Wang, Z., Kang, S., Jensen, C. R., Liu, F. (2012). Alternate partial root-zone irrigation reduces bundle-sheath cell leakage to CO2 and enhances photosynthetic capacity in maize leaves. J. Exp. Bot. 63, 1145–1153. doi: 10.1093/jxb/err331
Wang, Z., Liu, J., Hamoud, Y. A., Wang, Y., Qiu, R., Agathokleous, E., et al. (2022). Natural 15N abundance as an indicator of nitrogen utilization efficiency in rice under alternate wetting and drying irrigation in soils with high clay contents. Sci. Total Environ. 838, 156528. doi: 10.1016/j.scitotenv.2022.156528
Wang, Z. Q., Liu, Q., Wu, J. H., Li, J., He, J. M., Zhang, Y., et al. (2020). Downregulating VAC14 in guard cells causes drought hypersensitivity by inhibiting stomatal closure. Front. Plant Sci. 11, 1–10. doi: 10.3389/fpls.2020.602701
Wang, C., Zhang, Z.-Y., Fan, S.-M., Mwiya, R., Xie, M.-X. (2018). Effects of straw incorporation on desiccation cracking patterns and horizontal flow in cracked clay loam. Soil Tillage Res. 182, 130–143. doi: 10.1016/J.STILL.2018.04.006
Wen, T., Qu, Y., Lu, K., Guan, C., Zhao, C. (2022). Combining tree-ring width and carbon isotope data to investigate stem carbon allocation in an evergreen coniferous species. Agric. For. Meteorol. 316, 108845. doi: 10.1016/j.agrformet.2022.108845
Xu, Z., Zhou, G., Wang, Y. (2007). Combined effects of elevated CO2 and soil drought on carbon and nitrogen allocation of the desert shrub Caragana intermedia. Plant Soil 301, 87–97. doi: 10.1007/s11104-007-9424-0
Yan, G., Han, S., Zhou, M., Sun, W., Huang, B., Wang, H., et al. (2020). Variations in the natural 13C and 15N abundance of plants and soils under long-term n addition and precipitation reduction: interpretation of c and n dynamics. For. Ecosyst. 7, 1–13. doi: 10.1186/s40663-020-00257-w
Yousfi, S., Serret, M. D., Araus, J. L. (2013). Comparative response of δ13C, δ18O and δ15N in durum wheat exposed to salinity at the vegetative and reproductive stages. Plant Cell Environ. 36, 1214–1227. doi: 10.1111/pce.12055
Yousfi, S., Serret, M. D., Márquez, A. J., Voltas, J., Araus, J. L. (2012). Combined use of δ13C, δ18O and δ15N tracks nitrogen metabolism and genotypic adaptation of durum wheat to salinity and water deficit. New Phytol. 194, 230–244. doi: 10.1111/j.1469-8137.2011.04036.x
Zhang, J., Gu, L., Bao, F., Cao, Y., Hao, Y., He, J., et al. (2015). Nitrogen control of 13C enrichment in heterotrophic organs relative to leaves in a landscape-building desert plant species. Biogeosciences 12, 15–27. doi: 10.5194/bg-12-15-2015
Zhang, J. J., Gu, L., Zhang, J. J., Wu, R., Wang, F., Lin, G., et al. (2017). The interaction between nitrogen and phosphorous is a strong predictor of intra-plant variation in nitrogen isotope composition in a desert species. Biogeosciences 14, 131–144. doi: 10.5194/bg-14-131-2017
Zhao, B., Kondo, M., Maeda, M., Ozaki, Y., Zhang, J. (2004). Water-use efficiency and carbon isotope discrimination in two cultivars of upland rice during different developmental stages under three water regimes. Plant Soil 261, 61–75. doi: 10.1023/B:PLSO.0000035562.79099.55
Zhao, Y., Liang, C., Shao, S., Li, J., Xie, H., Zhang, W., et al. (2021). Interactive effects of elevated CO2 and nitrogen fertilization levels on photosynthesized carbon allocation in a temperate spring wheat and soil system. Pedosphere 31, 191–203. doi: 10.1016/S1002-0160(20)60056-X
Keywords: alternate wetting and drying irrigation, soil clay content, δ13C, δ15N, water use efficiency, Oryza sativa L
Citation: Wang Z, Liu J, Wang Y, Agathokleous E, Hamoud YA, Qiu R, Hong C, Tian M, Shaghaleh H and Guo X (2022) Relationships between stable isotope natural abundances (δ13C and δ15N) and water use efficiency in rice under alternate wetting and drying irrigation in soils with high clay contents. Front. Plant Sci. 13:1077152. doi: 10.3389/fpls.2022.1077152
Received: 22 October 2022; Accepted: 14 November 2022;
Published: 02 December 2022.
Edited by:
Junliang Fan, Northwest A&F University, ChinaReviewed by:
Zhenhua Wei, Northwest A&F University, ChinaNawab Ali, Khyber Pakhtunkhwa Agricultural University, Pakistan
Copyright © 2022 Wang, Liu, Wang, Agathokleous, Hamoud, Qiu, Hong, Tian, Shaghaleh and Guo. This is an open-access article distributed under the terms of the Creative Commons Attribution License (CC BY). The use, distribution or reproduction in other forums is permitted, provided the original author(s) and the copyright owner(s) are credited and that the original publication in this journal is cited, in accordance with accepted academic practice. No use, distribution or reproduction is permitted which does not comply with these terms.
*Correspondence: Yousef Alhaj Hamoud, yousef-hamoud11@hotmail.com; Rangjian Qiu, qiurangjian@whu.edu.cn
†These authors have contributed equally to this work and share first authorship