 Lei Wang1,2,3
 Jinqing Xu1,2,3
 Handong Wang1,2,3
 Tongrui Chen1,4En You1,4Haiyan Bian1,2Wenjie Chen1,2,3,5
 Bo Zhang1,2,3,5Yuhu Shen1,2,3,5*
- 1Key Laboratory of Adaptation and Evolution of Plateau Biota, Northwest Institute of Plateau Biology, Chinese Academy of Sciences, Xining, China
- 2Qinghai Provincial Key Laboratory of Crop Molecular Breeding, Northwest Institute of Plateau Biology, Chinese Academy of Sciences, Xining, China
- 3Laboratory for Research and Utilization of Qinghai Tibetan Plateau Germplasm Resources, Northwest Institute of Plateau Biology, Chinese Academy of Sciences, Xining, China
- 4College of Life Sciences, University of Chinese Academy of Sciences, Beijing, China
- 5Innovation Academy for Seed Design, Chinese Academy of Sciences, Xining, China
Introduction: Oat (Avena sativa L.) is an important cereal crop grown worldwide for grain and forage, owing to its high adaptability to diverse environments. However, the genetic and genomics research of oat is lagging behind that of other staple cereal crops.
Methods: In this study, a collection of 288 oat lines originating worldwide was evaluated using 2,213 single nucleotide polymorphism (SNP) markers obtained from an oat iSelect 6K-beadchip array to study its genetic diversity, population structure, and linkage disequilibrium (LD) as well as the genotype–phenotype association for hullessness and lemma color.
Results: The average gene diversity and polymorphic information content (PIC) were 0.324 and 0.262, respectively. The first three principal components (PCs) accounted for 30.33% of the genetic variation, indicating that the population structure of this panel of oat lines was stronger than that reported in most previous studies. In addition, accessions could be classified into two subpopulations using a Bayesian clustering approach, and the clustering pattern of accessions was closely associated with their region of origin. Additionally, evaluation of LD decay using 2,143 mapped markers revealed that the intrachromosomal whole-genome LD decayed rapidly to a critical r2 value of 0.156 for marker pairs separated by a genetic distance of 1.41 cM. Genome-wide association study (GWAS) detected six significant associations with the hullessness trait. Four of these six markers were located on the Mrg21 linkage group between 194.0 and 205.7 cM, while the other two significant markers mapped to Mrg05 and Mrg09. Three significant SNPs, showing strong association with lemma color, were located on linkage groups Mrg17, Mrg18, and Mrg20.
Discussion: Our results discerned relevant patterns of genetic diversity, population structure, and LD among members of a worldwide collection of oat landraces and cultivars proposed to be ‘typical’ of the Qinghai-Tibetan Plateau. These results have important implications for further studies on association mapping and practical breeding in high-altitude oat.
1 Introduction
Oat (Avena sativa L., 2n = 6x = 42) is an important cereal crop originating from the Mediterranean region (Montilla-Bascón et al., 2013), and an allohexaploid comprising three distinct subgenomes (A, C, and D) that arose through cycles of interspecific hybridization and polyploidization (Yan et al., 2016a). Oat is well-adapted to a cool climate (Hoffman, 1995), and is grown mostly in temperate regions of the world under a wide range of environmental conditions for food, feed, and forage. To date, oat has received considerable attention owing to its high nutritional value and the ability to reduce blood cholesterol levels and mediate the risk of cardiovascular disease (Anderson et al., 2009; Othman et al., 2011).
Compared with other staple cereal crops such as rice, maize, and wheat, the breeding, genomics, and population structure analyses of oat have been lagging, primarily owing to its large, repeat-rich, and polyploid genome and low investment (Tinker et al., 2009; Yan et al., 2016b). Advances in molecular marker exploitation technology have enhanced genome-wide marker discovery in oat. Valuable studies have been carried out on oat genetic diversity, population structure, quantitative trait locus (QTL) identification, and genotype–phenotype association using various molecular markers, including amplified length fragment polymorphism (ALFP) (Achleitner et al., 2008), random amplified polymorphic DNA (RAPD) (Ruwali et al., 2013), simple sequence repeat (SSR) (Montilla-Bascón et al., 2013), diversity arrays technology (DArT) (Tinker et al., 2009; He and Bjørnstad, 2012), and single nucleotide polymorphisms (SNPs) (Winkler et al., 2016; Cömertpay et al., 2018; Yan et al., 2020). A dense consensus map of oat with 12,000 markers based on 12 biparental populations was recently constructed (Chaffin et al., 2016) and supplemented by high-density SNPs discovered through genotyping-by-sequencing (GBS) (Huang et al., 2014; Bekele et al., 2020). The availability of dense markers opens new opportunities for association mapping, molecular breeding, genetic diversity analysis, genome sequencing, and map-based cloning in oat (Chaffin et al., 2016). Moreover, great progress has been recently made in oat genome sequencing and assembly. Four chromosome-scale genome assemblies of diploid, tetraploid, and hexaploid oat have recently been reported (Maughan et al., 2019; Li et al., 2021; Peng et al., 2022; https://wheat.pw.usda.gov/GG3/graingenes_downloads/oat-ot3098-pepsico). These reference genomes will accelerate the studies on oat evolution and gene identification.
Studies show that population structure in oat is not as strong as that in other crops (Winkler et al., 2016; Peng et al., 2022). No one factor, such as geographical origin or morphological traits (such as hulled or hulless grains, lemma color, and panicle type), significantly affect population stratification patterns (Montilla-Bascón et al., 2013; Esvelt Klos et al., 2016).
With the advent of rapid genotyping and next-generation sequencing technologies, genome-wide association study (GWAS) has emerged as a powerful routine strategy to identify genes or regions affecting complex traits in crop species (e.g., Huang et al., 2010, for rice agronomic traits; Wang et al., 2012, for resistance to head smut in maize; Alqudah et al., 2014, for photoperiod response in barley) over the last decade. In oat, GWAS has been performed to study agronomic traits (Winkler et al., 2016; Tumino et al., 2017), quality traits (Newell et al., 2012; Asoro et al., 2013; Carlson et al., 2019), and biotic or abiotic stress tolerance (Tumino et al., 2016). Six significant associations for lodging and two for plant height were detected by Tumino et al. (2017) in a European oat collection using the 6K SNP array. Three independent markers were significantly associated with β-glucan concentration, and one showed sequence homology to genes in rice (Newell et al., 2012). All of these studies indicated that GWAS was an effective method for QTL detection in oat.
The objectives of the present study were to (1) assess the genetic diversity of an oat collection originating from globally diverse regions; (2) characterize the population structure of the oat germplasm; (3) evaluate the extent of pairwise linkage disequilibrium (LD); and (4) perform GWAS for studying morphological traits. The results of this study would be useful for a deeper understanding and better management of the different kinds of oat genetic resources. This study provides valuable genetic markers for oat breeding programs, and represents a successful example for further association studies in oat.
2 Materials and methods
2.1 Plant material
A collection of 288 oat landraces and cultivars was used in this study. Out of 288 oat accessions, 257 accessions (199 landraces and 58 cultivars), originating from 34 countries, were obtained from the USDA National Small Grain Collection (NSGC) (Figure S1 and Table S1). In addition, 29 commercial oat cultivars and two mutagenized genotypes were collected from the oat-producing provinces of northern China (Inner Mongolia, Hebei, Qinghai, Gansu, and Jilin). Further details of the improvement status, country of origin, growth habit, hull type (hulled or hulless), and lemma color of these accessions are provided in Table S1. The ‘country of origin’ information was used to assign each accession to a region of origin as defined by the United Nations Statistics Division.
2.2 Genotypes
Genomic DNA of each accession was extracted from bulked leaf samples of 2-week-old seedlings using the Plant Genomic DNA Kit (Qiagen Inc., USA). The concentration and quality of each DNA sample were assessed by agarose gel electrophoresis and with a nanophotometer (NanoDrop 2000C, Thermo Scientific, USA). A total of 4,852 SNP markers were assayed using the oat iSelect 6K-beadchip array (Illumina, San Diego, CA, USA) at the USDA-ARS Genotyping Laboratory at Fargo, ND, USA, as described by Tinker et al. (2014). SNP genotype calls were made and adjusted in GenomeStudio v2011.1 (Illumina, San Diego, CA, USA). The SNP filtering process was performed according to the requirements of the bioinformatics analysis. The following were eliminated: multiallelic and monomorphic SNPs; SNPs with poor genotype calls resulting from weak signal or ambiguous clustering; and SNPs with relative minor allele frequency (MAF) ≤ 0.05 and missing data > 0.1. The position information of SNPs used in the present study was obtained from the consensus map of oat (version 3.1; Chaffin et al., 2016). The consensus map contains 21 linkage groups, scaled by genetic distance (cM). Linkage groups that are the consensus of the underlying component maps are designated by Merge (Mrg) and are reffered as Mrg01 to Mrg33.
2.3 Morphological trait data and phenotypic analysis
Morphological trait data, including hullessness and lemma color, were downloaded from the Germplasm Resources Information Network (GRIN; https://npgsweb.ars-grin.gov/gringlobal/search) on November 20, 2020, and the traits were affirmed by field planting in the summer of 2020. Oat accessions were planted in April at Diyao Village, Huangzhong County, Qinghai Province (N 36°29′03.63″, E 101°31′09.91″). Each accession was sowed two rows at a sowing density of 20 grains per row. Rows were seperated from each other by 20 cm. At maturity period, the hullessness trait of oat accessions was recorded. If the caryopsis of an oat accession is tightly surrounded by thick, lignin-rich hull after handy threshing, the accession is reffered to as hulled oat and recorded as “Hulled”; whereas if the hull of oat accession is papery and free-threshing, the accession is reffered to as hulless oat and recorded as “Hulless”. At milk-ripe stage, the lemma color of oat accessions is observed and the color is recorded as “Amber/White”, “Black”, “Grey”, “Red”, “Yellow”.
2.4 Genetic diversity, population structure, and LD analyses
Statistics including genetic diversity and polymorphic information content (PIC) were calculated for each locus using the PowerMarker v3.25 software (Liu and Muse, 2005). To estimate the population structure, three methodologies were compared. Model-based structure analysis was performed using STRUCTURE (Pritchard et al., 2000) with the number of ancestral populations (K) ranging from 2 to 10, and the number of subgroups was identified. Principal component analysis (PCA) was carried out using the GCTA software (Yang et al., 2011), and the percentage of genotypic variation explained by the first three PCs is shown in section 3.2 to enable comparison with the data obtained in previous oat studies. In addition, a neighbor-joining tree was constructed using MEGA6 (Tamura et al., 2013) with 1,000 bootstrap replicates.
Pairwise LD was estimated using squared allele frequency correlation (r2) based on loci that have been mapped on the consensus map. The r2 values were calculated using the LDcorSV package of R (Mangin et al., 2012). The genome-wide and chromosomal LD decay data were plotted against the genetic distance (cM), and the LOESS curve was fitted using R.
2.5 GWAS
To evaluate genotype–phenotype associations, GWAS was performed using a mixed linear model (MLM) implemented in TASSEL v5 (Bradbury et al., 2007), with default settings. The PCA matrix and kinship information (K matrix), generated using GCTA and TASSEL v5, respectively, were incorporated in the MLM as covariates. Quantile-quantile (Q-Q) plots and Manhattan plots were generated using the qqman package of R. According with the SNP annotations provided by Tinker et al. (2014), genes orthologous to those carrying the trait-associated SNPs are detected. The design sequence of significant associated SNP are aligned to the new reference genome assembly of hulless common oat (Peng et al., 2022) and the position of trait-associated SNPs in the common oat physical map are determined. The physical chromosomes are nominated as A1-A7, B1-B7, D1- D7.
3 Results
3.1 Genetic diversity
A total of 3,313 polymorphic SNPs were obtained using the 6K Illumina platform. After filtering, 2,213 SNPs with no more than 10% missing calls and at least 5% MAF were retained, of which 2,143 SNPs were mapped on to the consensus map across all 21 linkage groups, covering a total genetic distance of 2688.3 cM with an average spacing of 1.25 cM between two SNPs. The number of SNPs within and among linkage groups varied from 42 (on linkage group Mrg19) to 211 (Mrg01) (Table 1). These markers showed an average genetic diversity of 0.324, with a mode ranging from 0.096 to 0.50. The PIC value varied from 0.091 to 0.375 (average PIC = 0.262). Mean genetic diversity and PIC values, calculated for each of the 21 chromosomes, were found to be similar within the chromosomes (Table 1). The average PIC of oat landraces was 0.260, and that of oat cultivars was 0.259. There was no significant difference between landrace and cultivar of oat.
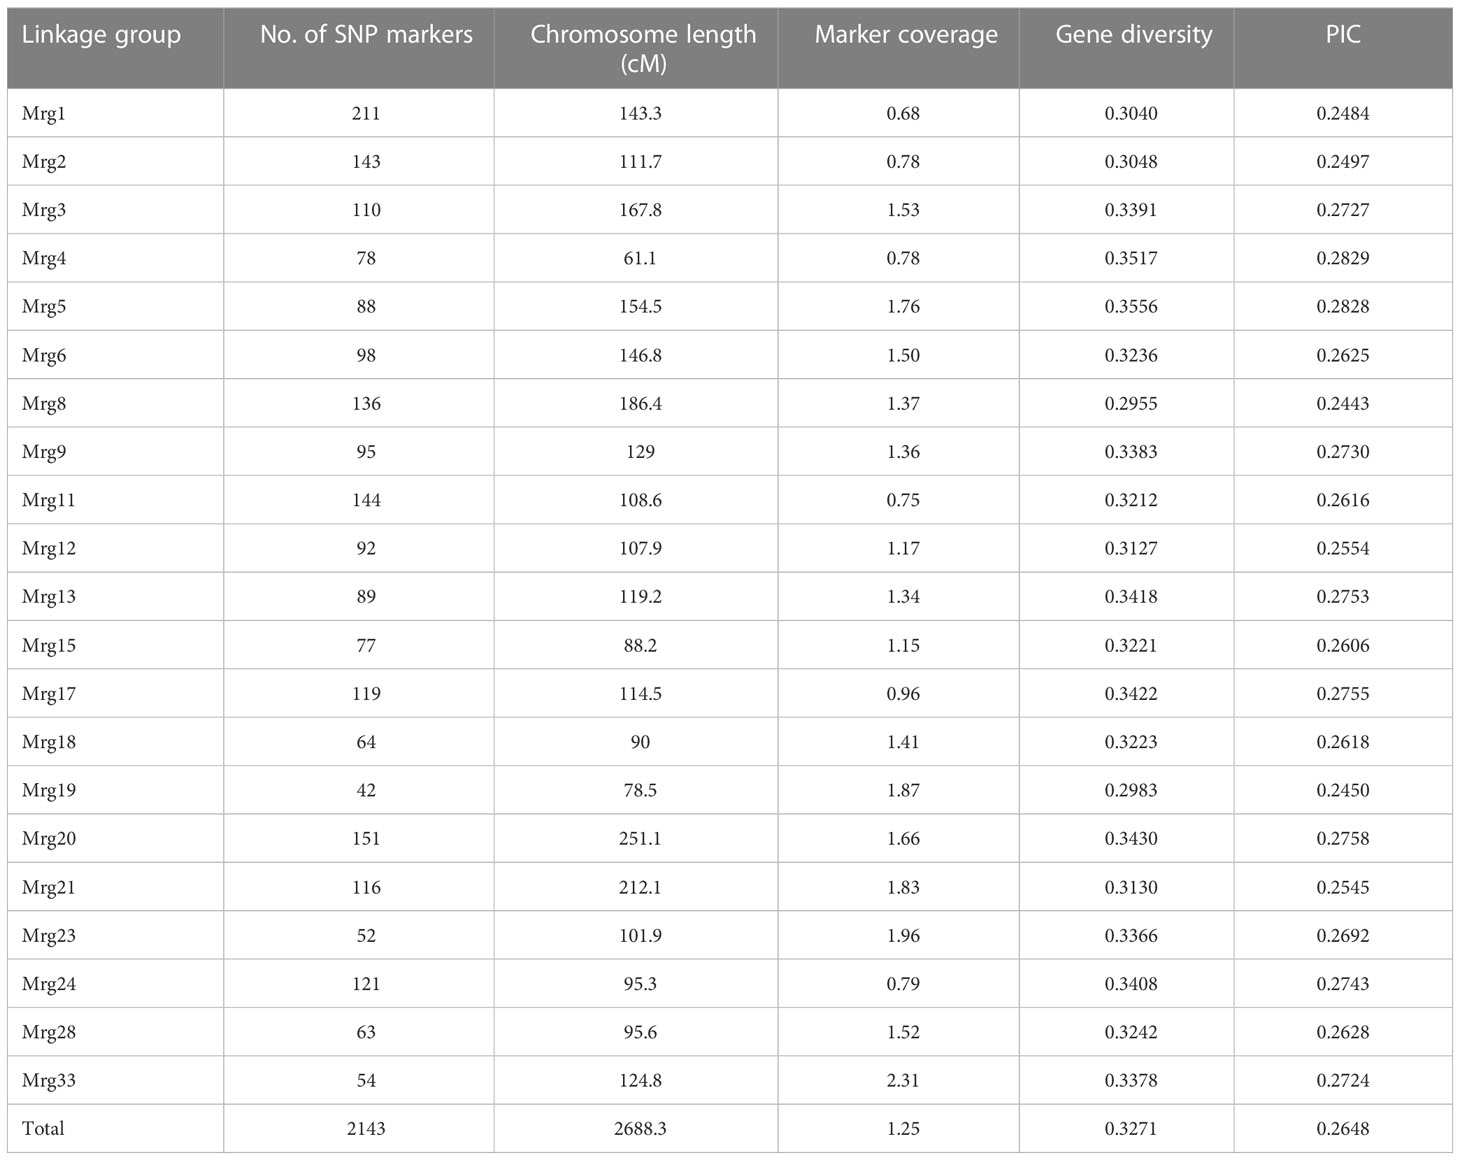
Table 1 SNP marker distribution and coverage, gene diversity, and polymorphic information content (PIC) across all linkage groups in 288 oat accessions.
3.2 Population structure
Population structure in the oat germplasm was investigated using the model-based method implemented in the STRUCTURE software, which assigns each individual a membership coefficient for each cluster. Following the method of Evanno et al. (2005), the optimal number of populations (K) was estimated using the results exported from STRUCTURE. The maximum delta K (ΔK) value was inferred to be two, suggesting that K=2 was the most likely value for the oat collection, with K = 3 being the second best(Figure S2). Accessions with the probability of membership to either population greater than 0.7 were assigned to that specific population, and those with membership probability less than 0.7 were considered admixtures. According to these criteria, 239 of 288 accessions (82.99%) were assigned to one of the two populations (POP1 and POP2), while the remaining 49 accessions (17.01%) were retained in the admixed group (Admixed) (Figure 1A, Table 2). Among the 288 accessions, 56 hulled accessions (48 landraces and 8 cultivars) were assigned to POP1. The landraces in POP1 mainly originated from Western Asia (27), Southern Europe (10), and Southern Asia (6). POP2 consisted of 130 hulled landraces, 45 hulled cultivars, and 8 hulless cultivars. The landraces in POP2 were mainly from Eastern Asia (24), Eastern Europe (49), Southern Europe, (32) and Southern America (11). The cultivars in POP2 were principally from Eastern Asia (29), Northern America (10), and Eastern Europe (8). Among the 31 cultivars collected from North China, 20 including 8 hulless lines were classified into POP2, while the remaining 9 cultivars were considered admixed. Using K = 3, the population POP2 was further divided into two subpopulations; however, the majority of POP2 accessions, especially cultivars, fell into the admixed group (Figure 1B, Table 2).
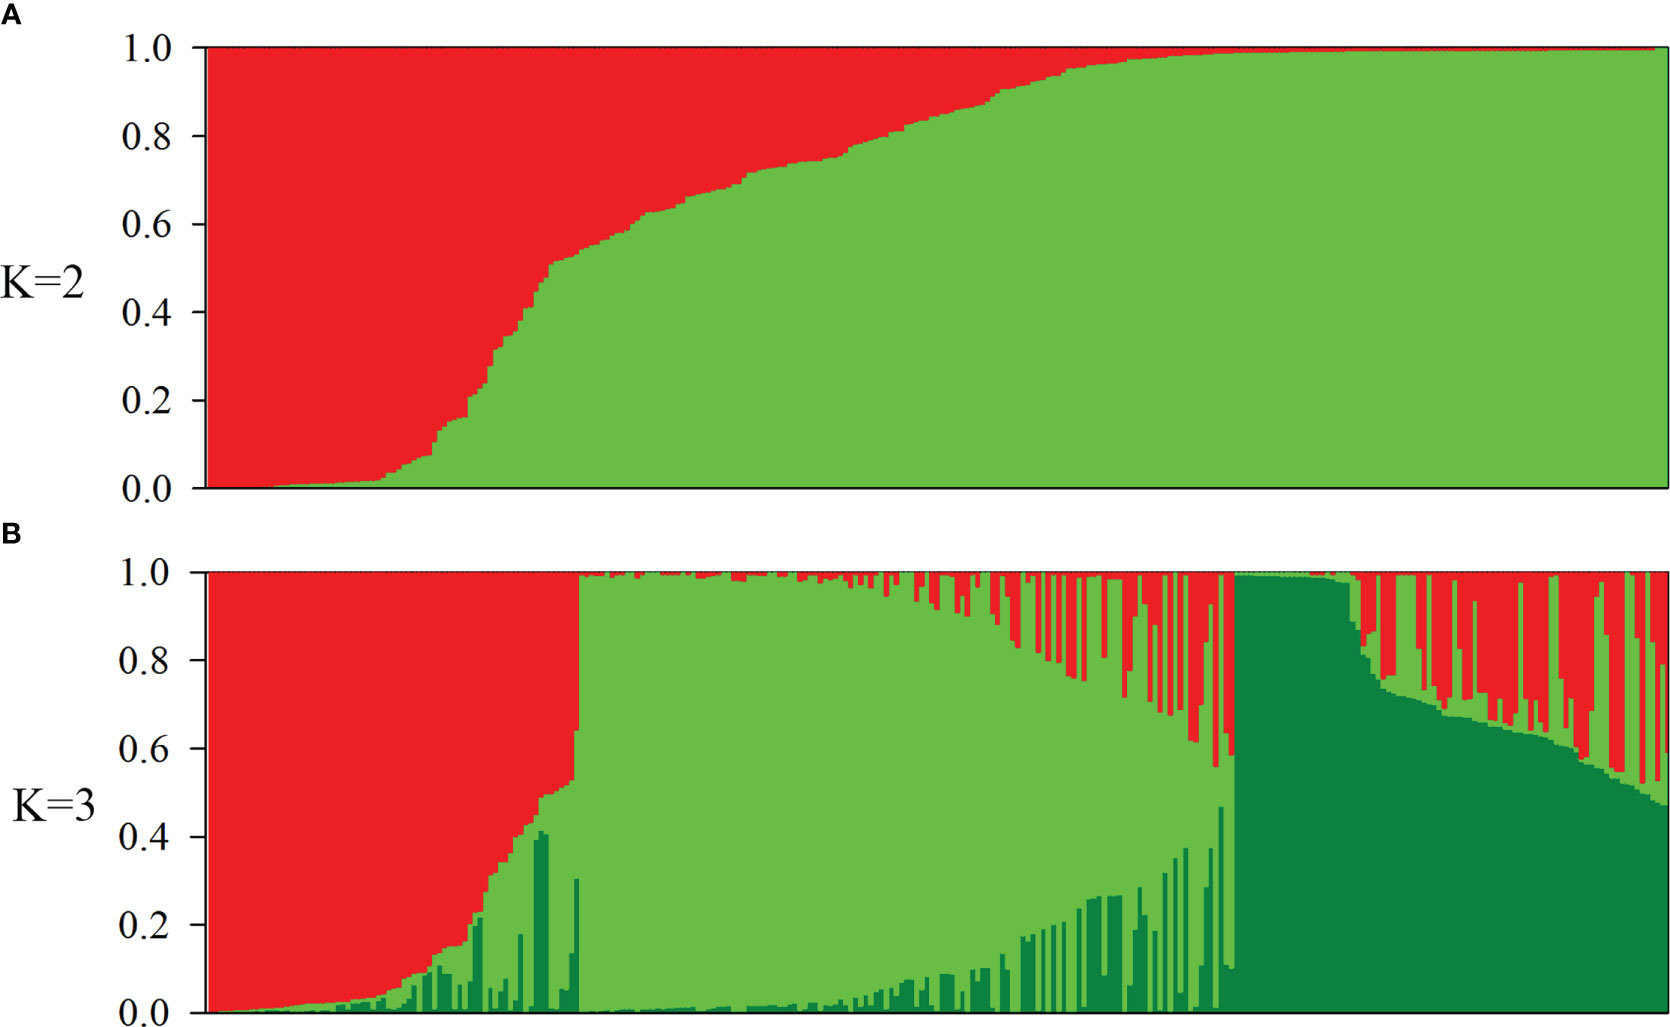
Figure 1 Population structure of 288 oat (Avena sativa. L) accessions. (A, B) Population structure estimated using STRUCTURE and illustrated as bar plots (K = 2 and 3). Each accession is shown as a thin vertical segment, and the color indicates the proportion of each population. Each subgroup is represented by an individual color.
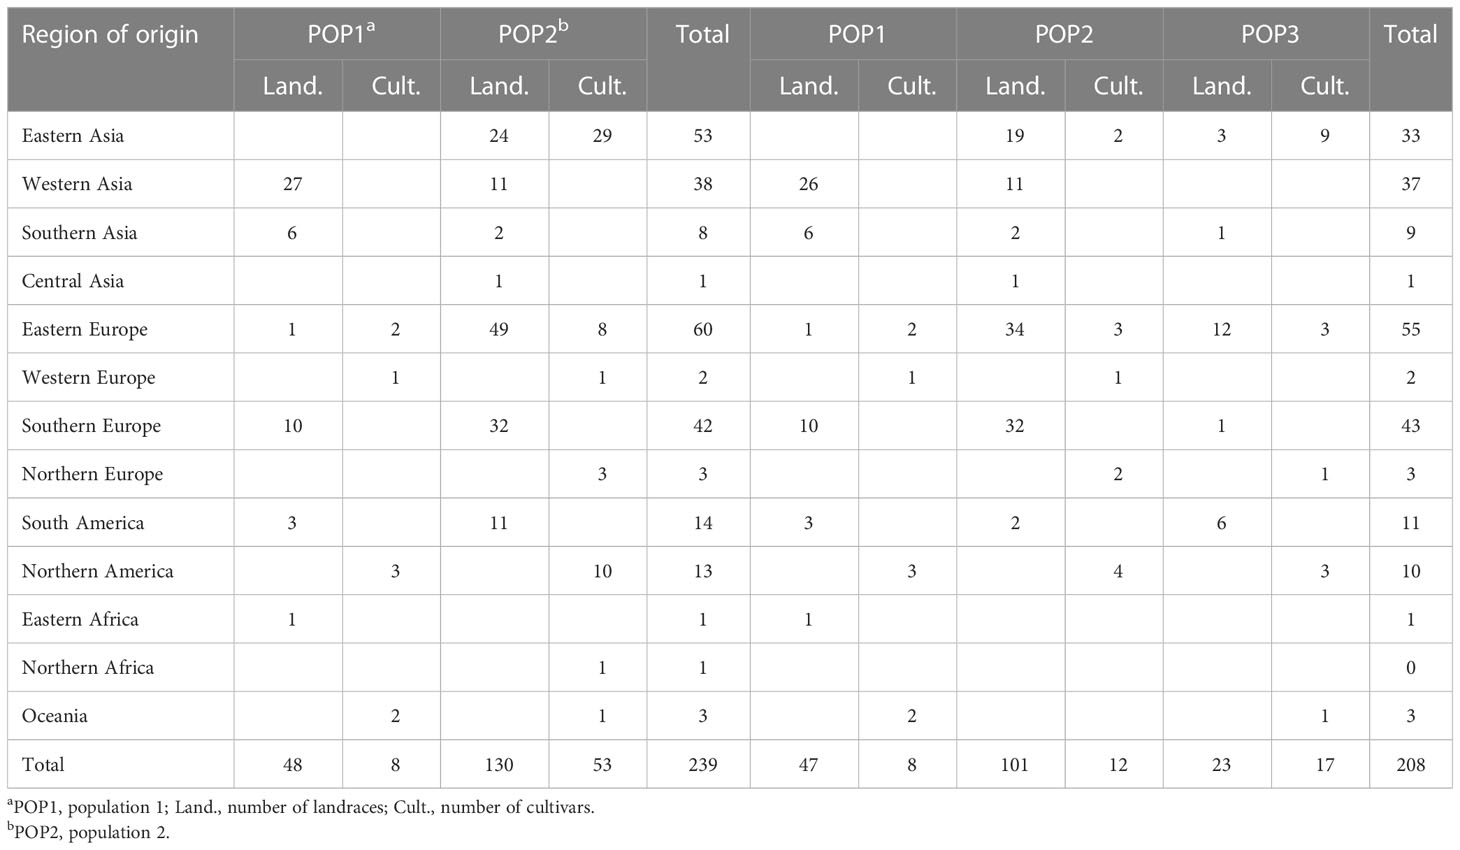
Table 2 Grouping of 288 oat accessions based on STRUCTURE analysis at K = 2 and K = 3.
Next, we analyzed the correlation of the membership coefficients of accessions with their region of origin, improvement status, year of receipt, and lemma color. The correlation coefficient was highest between membership coefficients and origin regions (0.50, P < 0.001), and this correlation in landraces was up to 0.55 (P < 0.001) (Table S2). We also analyzed the distribution of landraces in the two populations (Figure 2, Table 2). All landraces from Eastern Asia, the overwhelming majority of landraces from Eastern Europe (49 of 50), and a large part of landraces from Southern Europe (32 of 42) and Southern America (11 of 14) were assigned to POP2. Landraces from Western Asia were divided into the two populations (27, POP1; 11, POP2). Most of the landraces from Southern Asia (6 of 8) and a minority of accessions from Southern Europe (10 of 42) were assigned to POP1. Overall, the landrace accessions in POP1 were distributed in lower latitude regions compared with those in POP2 (Figure 2).
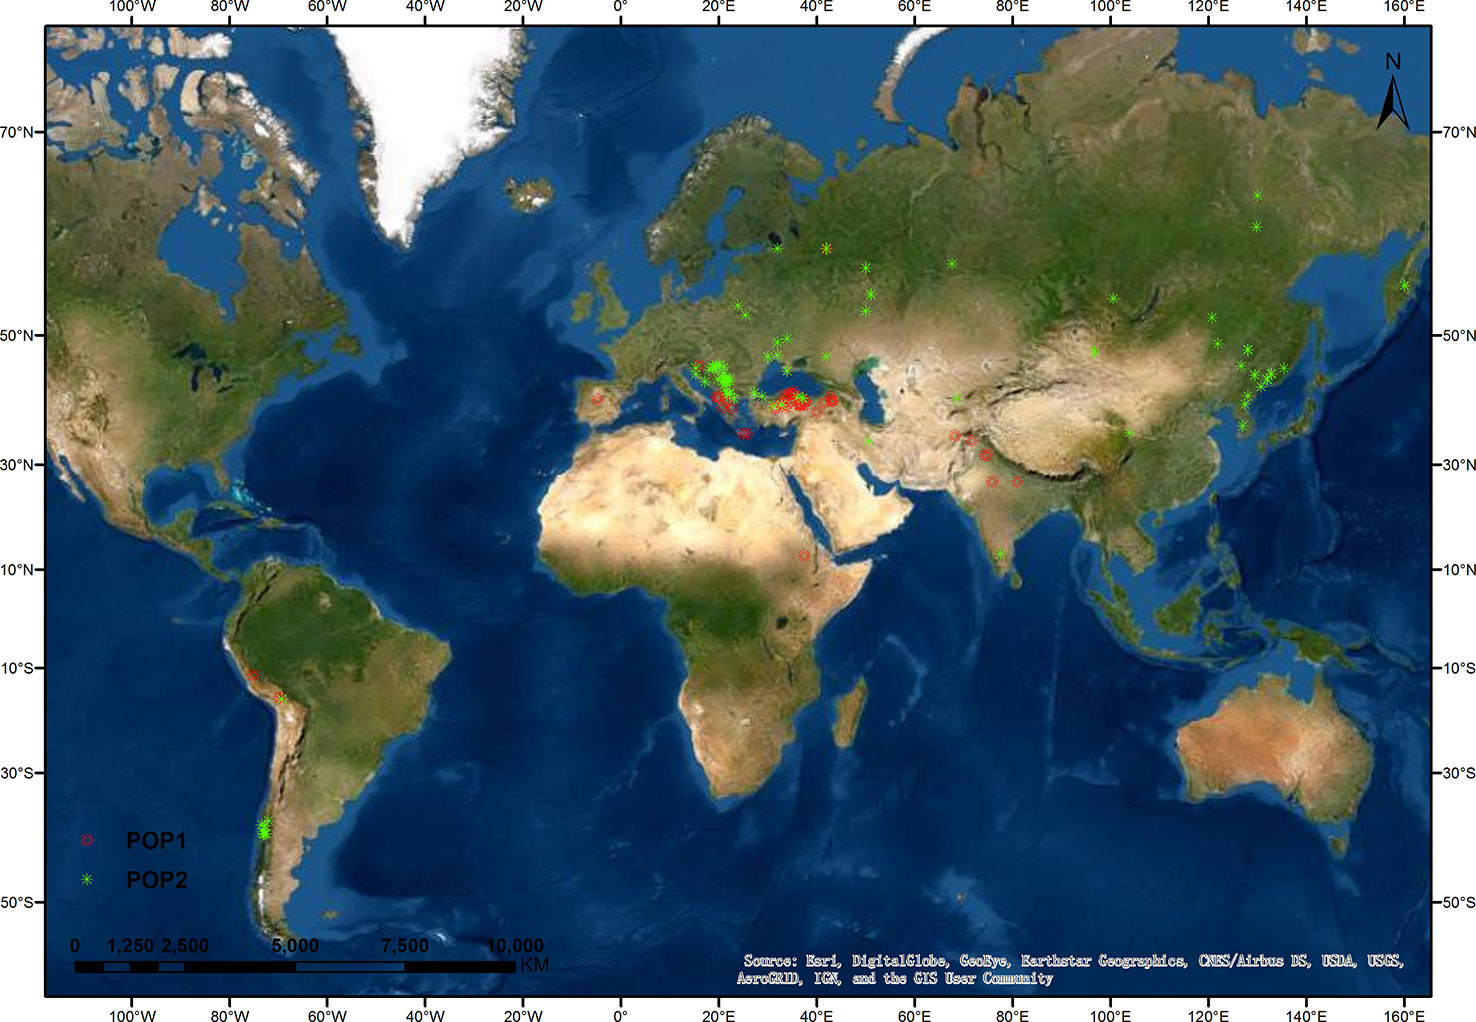
Figure 2 Geographical distribution of oat landraces at K = 2. The locations of oat landraces, with population membership coefficient ≥ 0.7, are indicated by different colors.
PCA was also used to infer the population structure of the oat germplasm. The first three principal components (PC1–PC3) together accounted for 30.33% of the genetic marker variation (PC1, 16.26%; PC2, 8.05%; PC3, 6.02%). Two two-dimensional (2-D) scatter plots of the 288 oat genotypes (Figure 3) exhibited a similar population stratification to that of STRUCTURE. PC1 clearly separated POP1 from POP2, and some accessions, identified as admixed in STRUCTURE, were placed in intermediate positions in the PCA plot (Figure 3).
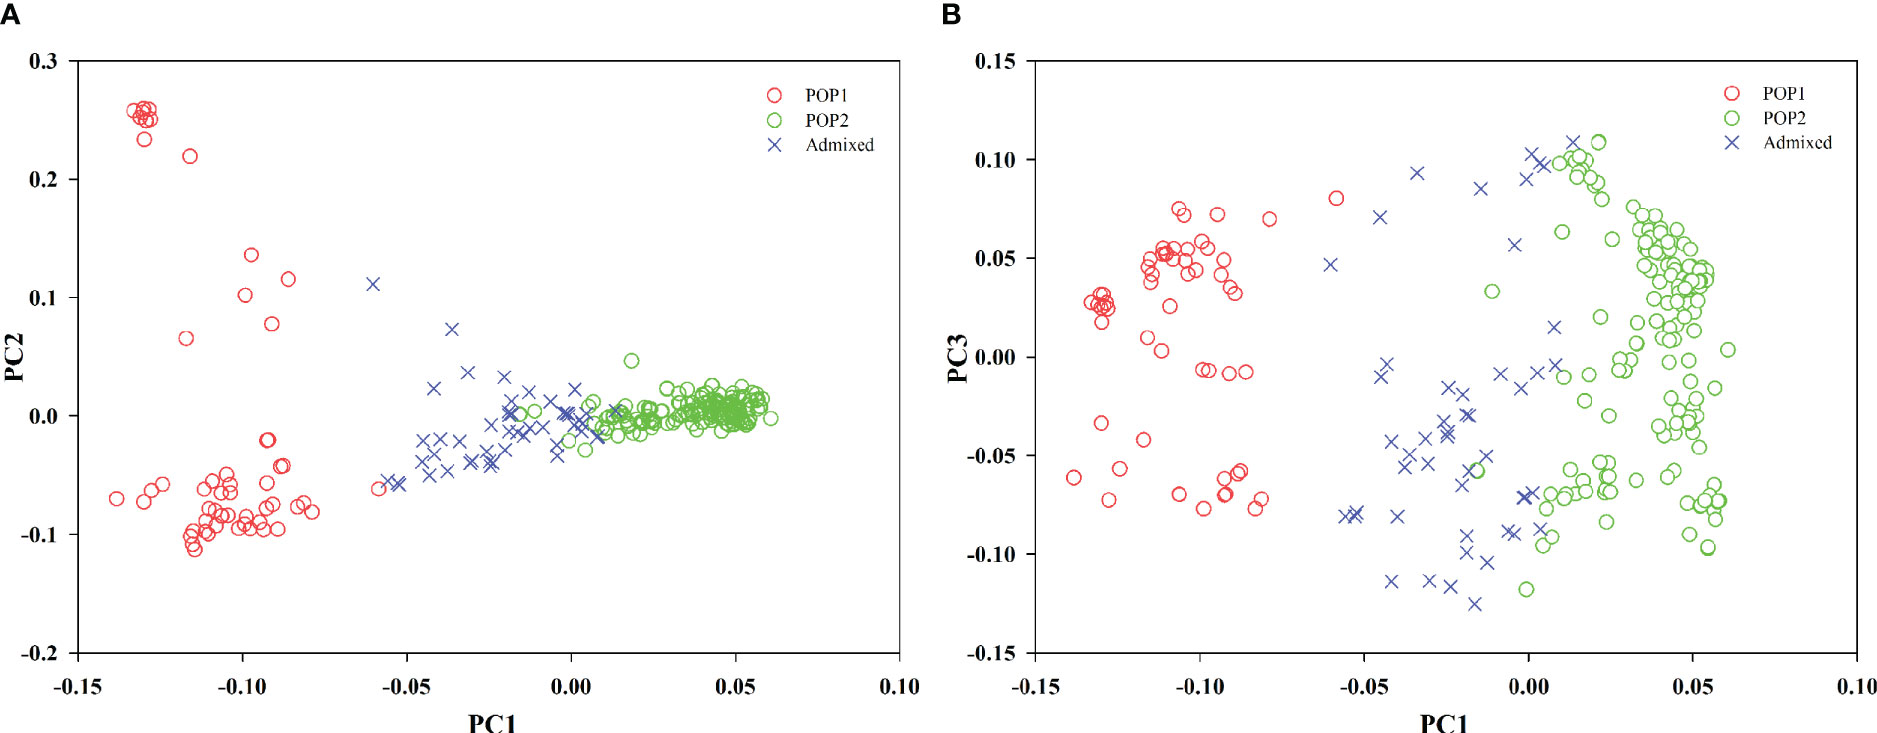
Figure 3 Scatterplots showing the results of principal component analysis (PCA) conducted based on the SNP marker data of oat lines labeled according the different subgroups identified by STRUCTURE (membership coefficient ≥ 0.7). (A, B) Population stratification of oat lines according to the first component PC1 vs. PC2 (A), and PC1 vs. PC3 (B). Admixed individuals are indicated with ×.
The stratification of the oat germplasm was further determined by the neighbor-joining (NJ) method implemented in the program MEGA 6.0 (Figure 4), and the accessions were divided into three clusters. Consistent with the results of STRUCTURE, most oat accessions from Eastern Asia, Eastern Europe, and Southern America grouped into Cluster 2 (Supplementary Table S3). Unlike the STRUCTURE results, most oat lines from Western Asia grouped into Cluster 1 (Table S3). Generally, the stratification of accessions was associated with their geographical origin.
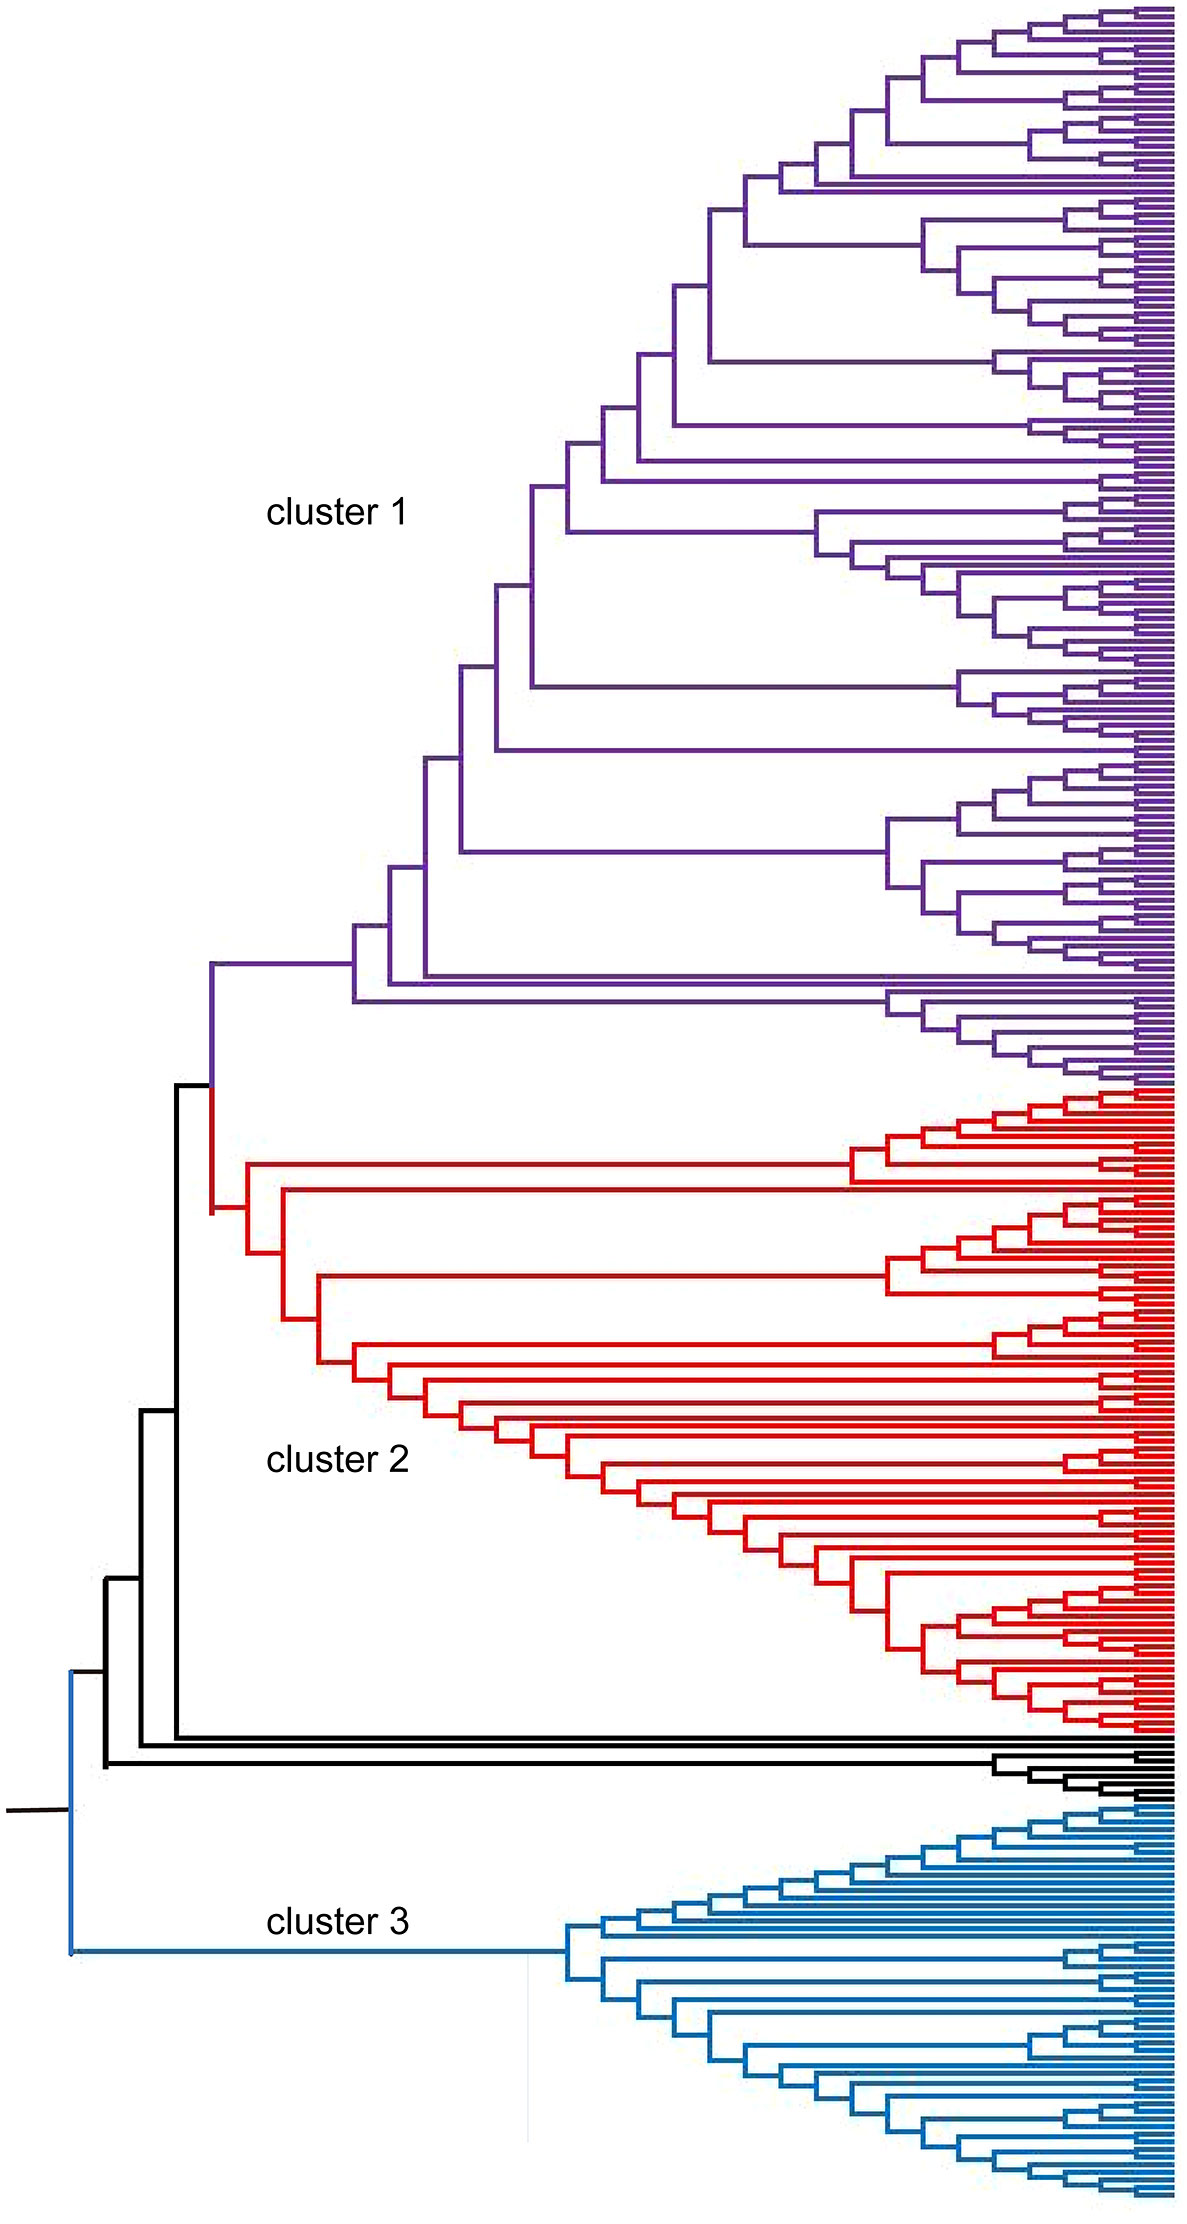
Figure 4 Neighbor-joining phylogenetic tree of 288 oat accessions based on 2,213 SNPs. Each accession is denoted as a vertical line in three colored subclades corresponding to the three clusters.
The PIC of POP1 (0.2621) was greater than that of POP2 (0.2348), indicating that POP1 was genetically more diverse than POP2. Highly significant (P < 0.001) genetic variance resided among the two populations (17.34%). The estimated fixation index (Fst = 0.1379) was also highly significant (P < 0.001). According to the degree of population genetic variance corresponding to Fst values (Hartl et al., 1997), there was moderate genetic variance between the two populations.
3.3 LD analysis
The 2,143 mapped SNPs were used to explore the LD level in the present oat panel. The r2 values revealed a high degree of association among many unlinked and loosely linked markers within all chromosomes (Figure S3). A critical value of r2 beyond which LD is likely to be caused by genetic linkage was calculated by resampling unlinked markers, and was fixed at 0.156 (Breseghello and Sorrells, 2006). The r2 values for intrachromosomal locus pairs ranged from 0 to 1, with an average of 0.085. Of these r2 values, 15.36% exceeded 0.156 and averaged to 0.365. The genome-wide and intrachromosomal LD decayed rapidly with genetic distance (Figure S4). The point at which the LOESS curve and the line r2 = 0.156 intersected was considered the average LD decay distance. Based on the criteria, the average genome-wide LD decay distance was 1.41 cM, and the intrachromosomal LD decayed between 0.02 and 14.99 cM (Figure S4, Table S4). The different chromosomes showed different LD levels, indicating that they had been subjected to variable intensities of natural and artificial systematic selection.
3.4 Genome-wide association
GWAS was performed using 2,143 mapped SNPs. This number of markers was used to establish the threshold of statistical significance of association at p ≤ 2.33 × 10⁻⁵, calculated by applying the Bonferroni correction with an experiment-wise α = 0.05. At p < 2.33 × 10⁻⁵, nine SNP markers showed significant association with the grain hull type and lemma color of oat accessions, and explained 8.28–22.39% of the phenotypic variation in these traits (Table 3; Table S5).
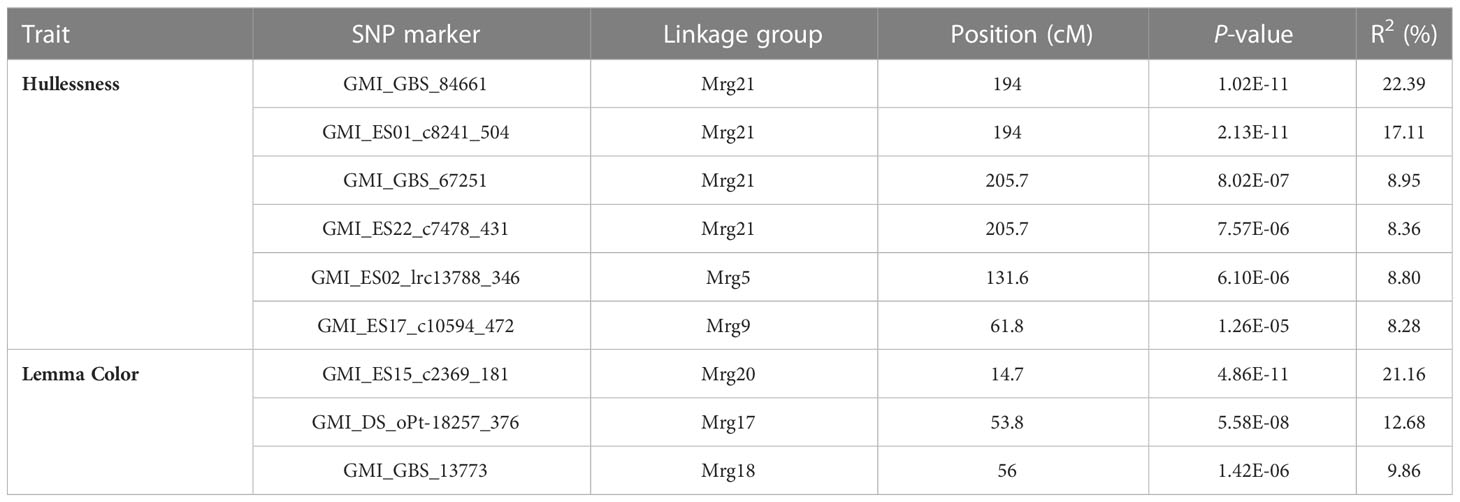
Table 3 Hullessness- and lemma color-associated SNPs and their positions in the oat consensus genetic map.
The strongest evidence of association with the hullessness trait was observed on linkage group Mrg21, specifically based on two markers, GMI_GBS_84661 and GMI_ES01_c8241_504, both located at 194 cM, with the minimum p-value less than 1.0 × 10⁻¹⁰ (Figures 5A, 6A). Strong associations for this trait were also found on linkage group Mrg21 (GMI_GBS_67251 and GMI_ES22_c7478_431, comapping at 205.7 cM, p < 1.0 × 10⁻⁵). Two additional markers, one mapped on Mrg05 (GMI_ES02_lrc13788_346, p < 1.0 × 10⁻⁵) and the other on Mrg09 (GMI_ES17_c10594_472, p < 1.0 × 10⁻⁶), were also significantly associated with hullessness (Figure 5A, 6A).
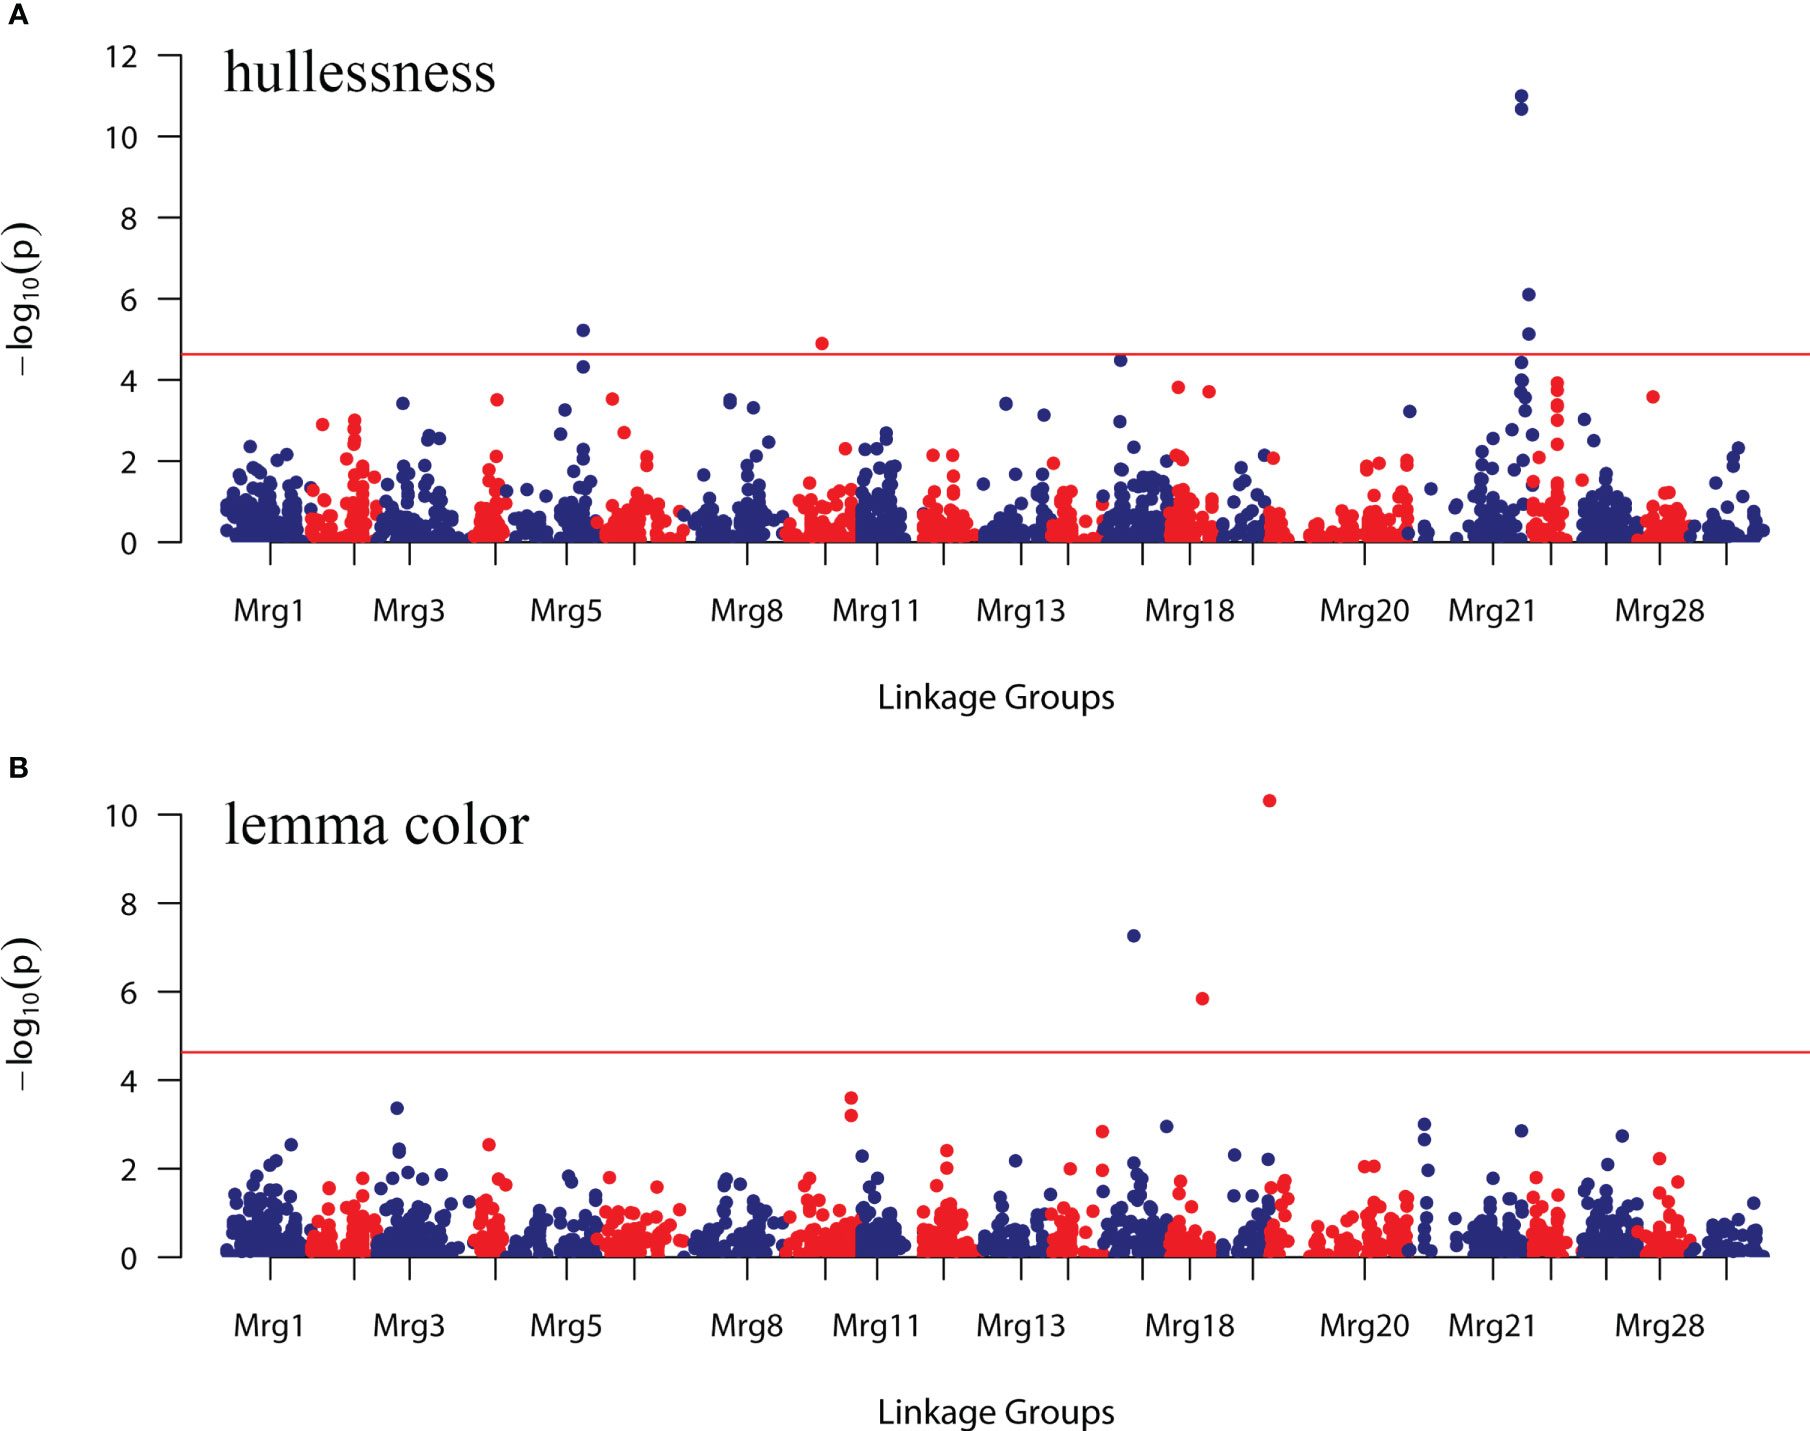
Figure 5 Genome-wide association study (GWAS) of the hullessness and lemma color traits in the oat collection using 2,143 SNP markers. (A) Hullessness; (B) lemma color. The red line represents the threshold calculated according to the false discovery rate (FDR). Markers above the red line in (A, B) were significantly associated with the respective trait.
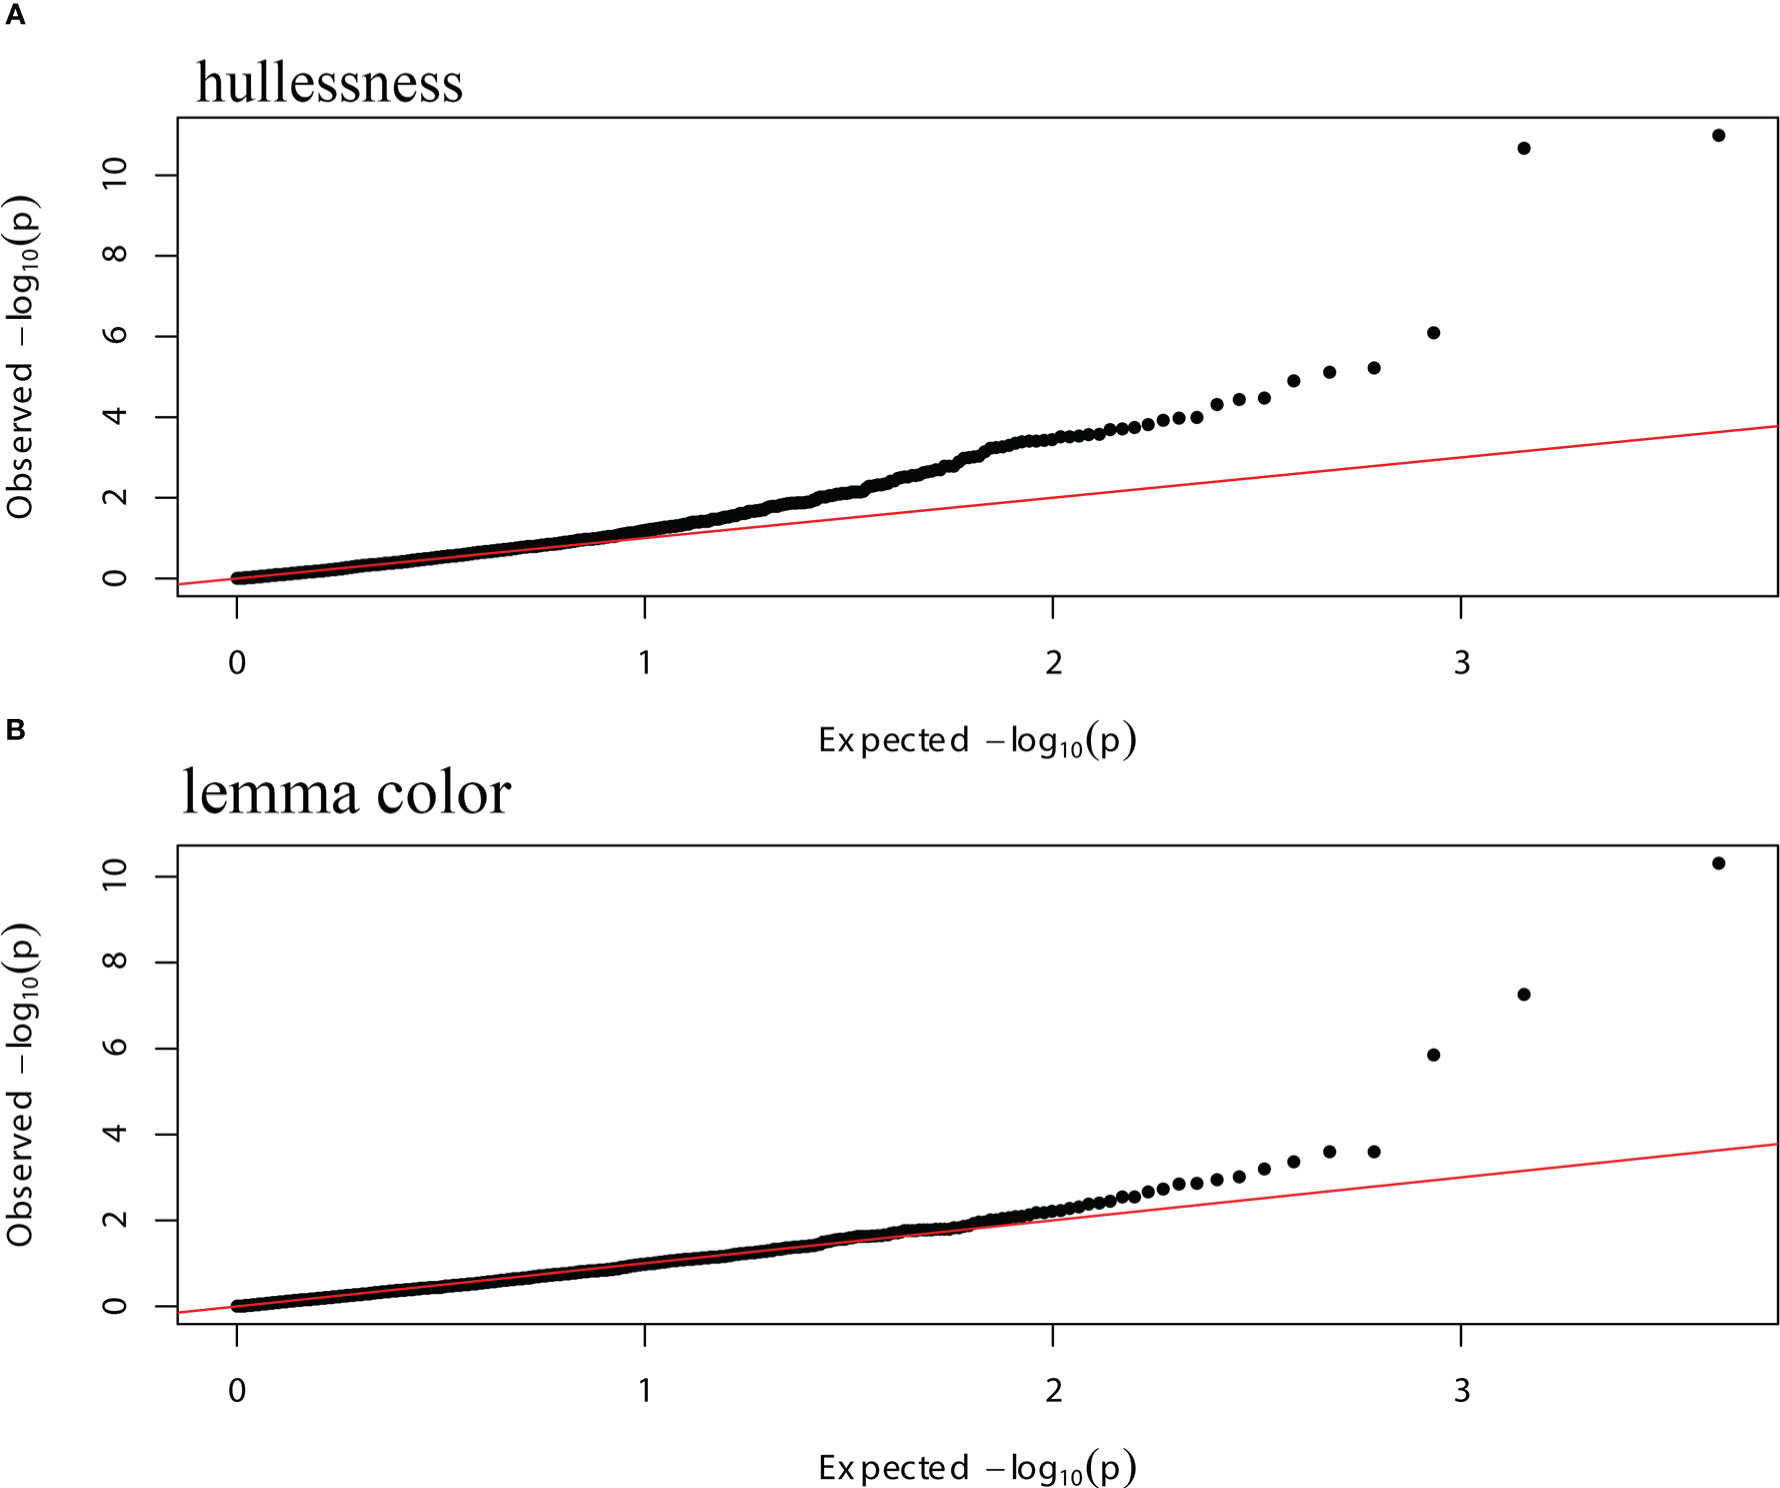
Figure 6 Quantile-quantile (Q-Q) plots of the GWAS data of hullessness and lemma color using a mixed model, with the PCA matrix and kinship information as covariates. (A) Hullessness; (B) lemma color.
Three significant markers were identified for lemma color. Among these, GMI_ES15_c2369_181 (Mrg20, 14.7 cM) showed the most significant effect on lemma color (p < 1.0 × 10⁻¹⁰) (Figures 5B, 6B). The other two markers significantly associated with lemma color were GMI_DS_oPt-18257_376 (Mrg17, 53.8 cM) and GMI_GBS_13773 (Mrg18, 56 cM) (Figures 5B, 6B).
4 Discussion
4.1 Patterns of genetic diversity and population structure
Oat has not only been grown as a grain or forage crop but it has also received significant attention as a whole-grain food owing to its health benefits for humans (Newell et al., 2011). Approximately 80,000 oat cultivars and over 20,000 wild oat accessions have been preserved in gene banks, and are considered as a pool of potentially useful genes (Lipman et al., 2005). Genetic diversity and population structure studies of the oat germplasm provide important information for their genetic conservation and breeding (Montilla-Bascón et al., 2013). The large number of available molecular markers and the high-density consensus map make it easier and more efficient for researchers to explore genetic diversity, population structure, and phenotype-associated QTLs in a sample of the oat germplasm.
In the present study, 2,213 high-quality polymorphic SNPs were identified among 288 oat accessions using the 6K SNP array. The reduction of genetic diversity in cereal crops, such as wheat and maize, during domestication and modern breeding has been a longstanding concern (Eyre-Walker et al., 1998; Cavanagh et al., 2013; Beissinger et al., 2016). However, in some instances, the loss of diversity was not observed from landraces to breeding accessions. Reif et al. (2005) reported that wheat genetic diversity narrowed down from 1950 to 1989 but was enhanced from 1990 to 1997. A similar increase in the average genetic diversity was detected in oat cultivars released between 1930 and 1950 (Fu et al., 2003). Oat landraces and cultivars used in this study showed similar genetic diversity, and a decreasing trend of genetic diversity was not observed from landraces to cultivars. One plausible explanation for this observation is that oat has a relatively short modern breeding history compared with other main cereal crops, and therefore has not experienced intense artificial selection (Yan et al., 2020). Another main reason for the result is that breeders used varied and geographically diverse oat resources during breeding programs. This extensive hybridization not only increased oat yields but also, simultaneously, broadened the genetic background of the cultivars (Fu et al., 2003; Yan et al., 2020). Oat accessions from different regions exhibited varied genetic diversity. Previous studies revealed that the genetic diversity of oat lines originating in Europe was lower than that of lines originating in Northern and Southern America (Fu et al., 2005; Achleitner et al., 2008); our results showed a similar trend (Table S6). The superior genetic diversity of oat lines from America was closely related to oat domestication, spread, and breeding history. The oat accessions of America were originally brought from Europe by humans. Later, germplasm exchange of oat took place frequently, and more exotic varieties (other species or ecotypes, even wild resources) originating from worldwide locations were used in breeding programs (Rodgers et al., 1983). The introgression of exogenous genes greatly increased the genetic diversity of American oat accessions.
Strong population structure has been reported within the germplasm of other crops. For example, Muñoz-Amatriaín et al. (2014) separated barley accessions into distinct subgroups, based on the row number (2 vs. 6), growth habit (spring vs. winter), hull type (hulled vs. hulless), improvement status (wild, landrace, and cultivar), and geographical origin. Oat also has four recognizable characteristics, including hulled, hulless, spring, and winter. Unfortunately, most previous studies reported the oat population structure as weak, and could not use any morphological trait to divide the oat accessions into distinct subpopulations (Montilla-Bascón et al., 2013; Esvelt Klos et al., 2016; Winkler et al., 2016). PCA revealed that the first three PCs accounted for 23.8% of the genetic variation in a 635-member CORE panel of elite oat germplasm (Esvelt Klos et al., 2016), and the first five PCs explained 25.8% of the variation in an 805-member global panel of oat lines (Yan et al., 2020). In these studies, the subgroups revealed by PCA or model-based K-means clustering overlapped and diffused. By contrast, in the USDA collection of 759 oat landraces and historic cultivars, PC1–3 together explained 38.8% of the marker variation, and the majority of oat lines clustered into three subgroups. The population structure pattern was strongly associated with the lemma color and geographical origin of oat lines (Winkler et al., 2016). In the present study, PC1–3 accounted for 30.33% of the genetic variation, supporting a relatively distinct population structure. The majority of 288 oat accessions were divided into two subpopulations. The distribution of the two subpopulations in the 2-D scatter plots was nonoverlapping, and the relationship among oat lines within each subpopulation was relatively tight (Figure 3). The strong association of population structure with geographical origin was especially prominent among landraces (Figure 2), echoing the findings of Fu et al. (2005) and Winkler et al. (2016). Such a distribution pattern could probably be explained by the domestication and spread of oat around the world. It is widely accepted that oat originated in the Mediterranean region, with Turkey as its center of genetic diversity (Loskutov, 2008). Oat was then brought to Europe and Asia (Newton et al., 2011). Subsequently, cultivated oat accessions were introduced into America by the Spanish and British explorers (Rodgers et al., 1983). In the present study, POP1 mainly consisted of landraces from Western Asia (Turkey) and its circumjacent regions (Southern Asia and Southern Europe), while other landraces in POP2 were from regions farther away from Western Asia (Eastern Asia, Eastern Europe, and South America), which is concerning. The other point of concern is that at K = 2, six of the fourteen hulless oat lines from China were identified as admixtures, while the other eight hulless lines clustered into POP2 together with the hulled landraces and cultivars from China, even though their values of membership probability were not high. At K = 6, all 14 hulless lines were identified as admixtures (data not shown). In our study, all the hulless oat lines were cultivars. Pedigree information suggests that most Chinese hulless cultivars have been selected from crosses between hulless and hulled accessions (Ren and Yang, 2018; Yan et al., 2020). Therefore, the population differentiation between Chinese hulless oat cultivars and Chinese hulled oat accessions was dramatically weakened, and hulless cultivars showed a high level of admixture or proximity to common oats (Yan et al., 2020).
4.2 GWAS for hullessness and lemma color
During genome-wide association analysis, it is necessary to determine the density and coverage of markers according to the extent of LD that affects the power and resolution of GWAS in a given population. In the current study, the LD decay results (genome-wide average LD = ~1.4 cM) suggested that at least one marker per 1.4 cM would be necessary to perform effective GWAS in the oat population, similar to previous studies (genome-wide average LD = ~1.5 cM) (Newell et al., 2011; Yan et al., 2020). Given that the total length of the oat consensus map estimated by Chaffin et al. (2016) is 2,843 cM, the number of markers required for the oat population used in this study was approximately 2,000. Therefore, we performed GWAS using 2,143 polymorphic SNPs, which surpassed the minimum number of SNPs required and were sufficient.
Cultivated oats are generally classified as hulled and hulless types, depending on their grain phenotype. The hull of a hulled oat variety is thick, lignin-rich, and hard-to-remove, whereas that of a hulless accession is papery-thin and free-threshing (Yan et al., 2020). Previous studies demonstrated that the hulless trait in oat is controlled by a single, incompletely dominant gene (N1) interacting with modifying genes (Boland and Lawes, 1973). The N1 locus was mapped by De Koeyer et al. (2004) to linkage group TM_5 (Terra × Marion), which was homologous to KO_24_26_34 and was later afirmedto be located at approximately 200 cM on Mrg21 in the consensus map (Chaffin et al., 2016). Ubert et al. (2017) mapped the N1 locus in two recombinant inbred line (RIL) populations (UFRGS 01B7114-1-3 × UFRGS 006013-1 and URS Taura × UFRGS 017004-2), and found that the SNP markers associated with the hulless trait were located on the linkage group Mrg21 near marker GMI_ES14_c19259_657 at 212 cM. The GWAS strategy was also employed to study the hulless trait of oat. Tumino et al. (2016) found a robust association between the hulless trait at the 178.3 cM position on Mrg21. Another GWAS performed by Yan et al. (2020) found that the most significant markers affecting the hulless trait were located on Mrg21 at 205.3, 212.1, and 195.7 cM. The positions of associated markers in the two GWAS were discrete. This could be due to the small number of hulless oat lines in the mapping population used by Tumino et al. (2016), which limited the power of GWAS. In the present study, six significant SNPs were found to be associated with the hulless trait of oat. Four of the six associated SNPs were located at 194.0 and 205.7 cM on Mrg21, suggesting a major QTL between these genetic map positions (Table 3, Figure 6A). These SNPs were located close to the N1 locus detected in the two RIL populations by Ubert et al. (2017), and to the associated SNPs found by Yan et al. (2020). Recently, Peng et al. (2022) generated a high-quality reference genome assembly of hulless common oat (AACCDD genome), and performed GWAS to identify the genomic loci contributing to the hulless trait. A strong peak associated with the trait was detected at the end of chromosome 4D, and colocalized with the N1 locus. We mapped six SNPs associated with the hulless trait in common oat (Table 4). Four of the six SNPs (GMI_GBS_84661, GMI_ES01_c8241_504, GMI_GBS_67251 and GMI_ES22_c7478_431) mapped to the end of chromosome 4D, and two of these four SNPs (GMI_GBS_67251 and GMI_ES22_c7478_431) were located in the candidate region of the N1 locus (Peng et al., 2022). These results provide further evidence suggesting that the major locus N1 controls the hulless trait in oat. The formation of hulless grain is also observed in other crops, such as barley (Hordeum vulgare. L) (Taketa et al., 2008). Lemma and palea are attached firmly to the grain in hulled barley, while they can be easily separated from the grain in hulless barley. Most studies concluded that the hulled grain trait is governed by a single locus (NUD) in barley, and hulless barley varieties carry a loss-of-function nud allele. However, additional loci significantly associated with hullessness have recently been identified in barley through GWAS (Milner et al., 2019; Wabila et al., 2019). In the present study, two additional markers (GMI_ES02_lrc13788_346 and GMI_ES17_c10594_472), identified on Mrg05 and Mrg09 for the first time, were also found to be significantly associated with the hulless trait. Thus, our results suggest that the hulless trait of oat is regulated not only by the N1 locus but also by other genes, as speculated previously (De Koeyer et al., 2004).
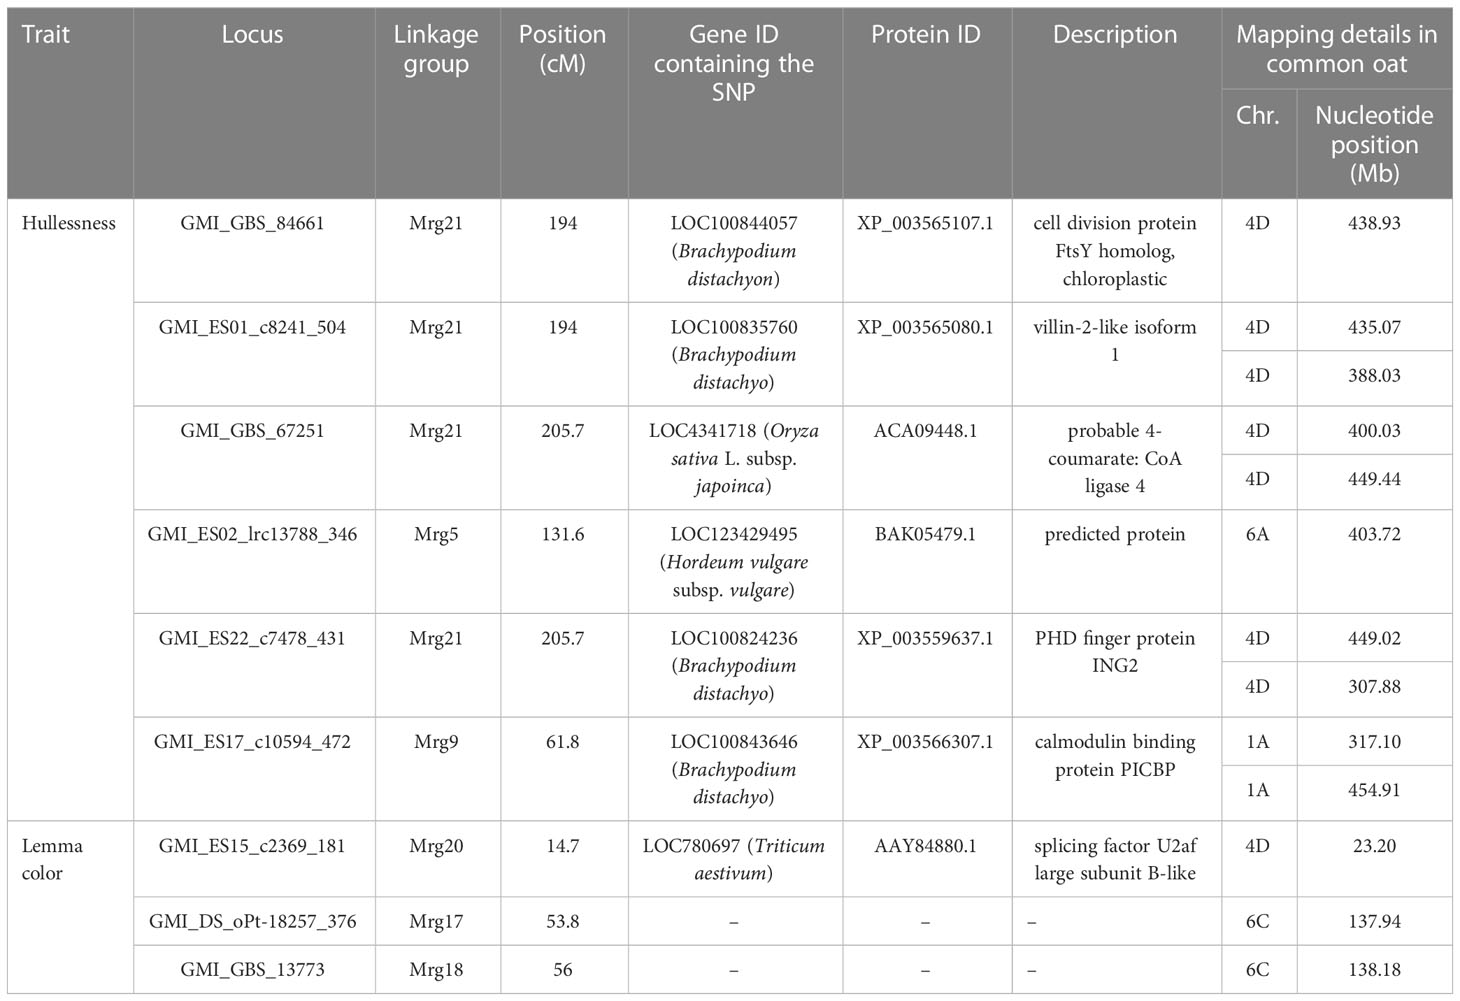
Table 4 Annotated genes located near significant SNP markers in a recently released genome assembly of common oat.
The gene A.satnudSFS4D01G000045, annotated as a receptor-like kinase, was suggested to be a promising candidate for the gene controlling the hulled/hulless trait in oat (Peng et al., 2022). In accordance with the SNP annotations provided by Tinker et al. (2014), genes orthologous to those carrying the hullessness trait-associated SNPs are listed in Table 4. Notably, the candidate gene A.satnudSFS4D01G000045 was not present among these ortholgous genes (Table 4). However, we found that the gene containing the marker GMI_GBS_67251 at the N1 locus likely encodes 4-coumarate: CoA ligase 4 (4CL4) protein. The 4CL4 protein participates in phenylpropanoid metabolism by mediating the activation of a number of hydroxycinnamates for the biosynthesis of monolignols and other phenolic secondary metabolites (Gui et al., 2011). The rice homolog of 4CL4 (IRAL1/4CL4) is also involved in lignin biosynthesis, and mutation of 4CL4 reduces the lignin content of roots and leaves (Liu et al., 2020). Ubert et al. (2017) speculated that the reduced lignification of lemma in hulless oat maybe related to genes that regulate lignin composition and biosynthesis. Therefore, we conjecture that 4CL4 might be another candidate gene controlling the hulled/hulless trait in oat, although more evidence is needed to verify this speculation. The annotated gene of GMI_ES22_c7478_431, which was also located in the N1 locus region, was predicted to encode the PHD finger protein ING2, which participates in the growth regulation biological process. Oat possesses a large, repeat-rich polypoid genome that has undergone extensive rearrangement. Once a better quality genome sequence of hexaploid oat becomes available, additional candidate genesmust be discovered and annotated.
The most significant SNP affecting lemma color (GMI_ES15_c2369_181) in the present study was mapped to Mrg20 (14.7 cM); this SNP was also identified by Tumino et al. (2016) and Winkler et al. (2016) using GWAS. The SNP marker was mapped to chromosome 7D in common oat (Table 4), and the gene containing the marker shared similarity with the gene encoding the splicing factor U2af large subunit B-like protein. Two other significant markers, GMI_DS_oPt-18257_376 and GMI_GBS_13773, were reported for the first time in this study. Both these markers were located on chromosome 6C in close proximity to each other. It is possible that this region on chromosome 6C governs lemma color in oat. Lemma color is a complex and difficult-to-interpret trait. Previous investigation of the inheritance of black and gray colored lemma in a specific hybrid population of oat revealed that black lemma color is controlled by more than two loci (Hoffman, 1999). Studies conducted to date on lemma color suggest that the expression of this trait is affected by environmental factors and epistatic effects.
GWAS in our study found several SNPs associated with hullessness and lemma color in the common oat and the results provide the basis to explore the molecular mechanism of the traits in the further research. The present stuty serves as a typical example to explore genetic basis in other quality and quantity traits using GWAS strategy in common oat.
Data availability statement
The data presented in the study are deposited in the the Genome Sequence Archivein National in Genomics Data Center , China National Center for Bioinformation / Beijing Institute of Genomics, Chinese Academy of Sciences (GSA: PRJCA015511, https://ngdc.cncb.ac.cn/bioproject/browse/PRJCA015511) that are publicly accessible at https://ngdc.cncb.ac.cn/gsa.
Author contributions
YS and LW conceived and designed the research. LW and JX performed the experiments and analyzed the data. HW, HB, TC, EY assisted in the experiments and edited the figures. LW wrote the manuscript. YS, BZ, and WC revised the manuscript. All authors contributed to the article and approved the submitted version.
Funding
This research was financially supported by the Second Tibetan Plateau Scientific Expedition and Research (STEP) program (Grant No. 2019QZKK0303), the Innovation team project of basic research program of Qinghai province (2022-ZJ-902), and the “Western Cross Team” key laboratory special project, Chinese Academy of Sciences.
Acknowledgments
We thank the U.S. National Plant Germplasm System (NPGS) for providing the oat germplasm.
Conflict of interest
The authors declare that the research was conducted in the absence of any commercial or financial relationships that could be construed as a potential conflict of interest.
Publisher’s note
All claims expressed in this article are solely those of the authors and do not necessarily represent those of their affiliated organizations, or those of the publisher, the editors and the reviewers. Any product that may be evaluated in this article, or claim that may be made by its manufacturer, is not guaranteed or endorsed by the publisher.
Supplementary material
The Supplementary Material for this article can be found online at: https://www.frontiersin.org/articles/10.3389/fpls.2023.1131751/full#supplementary-material
References
Achleitner, A., Tinker, N. A., Zechner, E., Buerstmayr, H. (2008). Genetic diversity among oat varieties of worldwide origin and associations of AFLP markers with quantitative traits. Theor. Appl. Genet. 117 (7), 1041–1053. doi: 10.1007/s00122-008-0843-y
Alqudah, A. M., Sharma, R., Pasam, R. K., Graner, A., Kilian, B., Schnurbusch, T. (2014). Genetic dissection of photoperiod response based on GWAS of pre-anthesis phase duration in spring barley. PloS One 9 (11), e113120. doi: 10.1371/journal.pone.0113120
Anderson, J. W., Baird, P., Davis, R. H., Ferreri, S., Knudtson, M., Koraym, A., et al. (2009). Health benefits of dietary fiber. Nutr. Rev. 67 (4), 188–205. doi: 10.1111/j.1753-4887.2009.00189.x
Asoro, F. G., Newell, M. A., Scott, M. P., Beavis, W. D., Jannink, J. L. (2013). Genome-wide association study for beta-glucan concentration in elite north American oat. Crop Sci. 53 (2), 542–553. doi: 10.2135/cropsci2012.01.0039
Beissinger, T. M., Wang, L., Crosby, K., Durvasula, A., Hufford, M. B., Ross-Ibarra, J. (2016). Recent demography drives changes in linked selection across the maize genome. Nat. Plants 2 (7), 1–7. doi: 10.1038/nplants.2016.84
Bekele, W. A., Itaya, A., Boyle, B., Yan, W., Mitchell Fetch, J., Tinker, N. A. (2020). A targeted genotyping-by-sequencing tool (rapture) for genomics-assisted breeding in oat. Theor. Appl. Genet. 133 (2), 653–664. doi: 10.1007/s00122-019-03496-w
Boland, P., Lawes, D. A. (1973). The inheritance of the naked grain character in oats studied in a cross between the naked variety Caesar and the husked variety BO 1/11. Euphytica 22 (3), 582–591. doi: 10.1007/BF00036659
Bradbury, P. J., Zhang, Z., Kroon, D. E., Casstevens, T. M., Ramdoss, Y., Buckler, E. S. (2007). TASSEL: software for association mapping of complex traits in diverse samples. Bioinformatics 23 (19), 2633–2635. doi: 10.1093/bioinformatics/btm308
Breseghello, F., Sorrells, M. E. (2006). Association mapping of kernel size and milling quality in wheat (Triticum aestivum l.) cultivars. Genetics 172 (2), 1165–1177. doi: 10.1534/genetics.105.044586
Carlson, M. O., Montilla-Bascon, G., Hoekenga, O. A., Tinker, N. A., Poland, J., Baseggio, M., et al. (2019). Multivariate genome-wide association analyses reveal the genetic basis of seed fatty acid composition in oat (Avena sativa l.). G3: Genes Genom Genet. 9 (9), 2963–2975. doi: 10.1534/g3.119.400228
Cavanagh, C. R., Chao, S., Wang, S., Huang, B. E., Stephen, S., Kiani, S., et al. (2013). Genome-wide comparative diversity uncovers multiple targets of selection for improvement in hexaploid wheat landraces and cultivars. Proc. Natl. Acad. Sci. 110 (20), 8057–8062. doi: 10.1073/pnas.1217133110
Chaffin, A. S., Huang, Y. F., Smith, S., Bekele, W. A., Babiker, E., Gnanesh, B. N., et al. (2016). A consensus map in cultivated hexaploid oat reveals conserved grass synteny with substantial subgenome rearrangement. Plant Genome 9 (2), plantgenome2015.10.0102. doi: 10.3835/plantgenome2015.10.0102
Cömertpay, G., Habyarimana, E., Baloch, F. S., Güngör, H., Dokuyucu, T., Akkaya, A., et al. (2018). Geographical description and molecular characterization of genetic structure and diversity using a 6K SNP array in Turkish oat germplasm. Can. J. Plant Sci. 99 (1), 12–21. doi: 10.1139/cjps-2017-0293
De Koeyer, D. L., Tinker, N. A., Wight, C. P., Deyl, J., Burrows, V. D., O’donoughue, L. S., et al. (2004). A molecular linkage map with associated QTLs from a hulless × covered spring oat population. Theor. Appl. Genet. 108 (7), 1285–1298. doi: 10.1007/s00122-003-1556-x
Esvelt Klos, K., Huang, Y. F., Bekele, W. A., Obert, D. E., Babiker, E., Beattie, A. D., et al. (2016). Population genomics related to adaptation in elite oat germplasm. Plant Genome 9 (2), plantgenome2015–10. doi: 10.3835/plantgenome2015.10.0103
Evanno, G., Regnaut, S., Goudet, J. (2005). Detecting the number of clusters of individuals using the software STRUCTURE: a simulation study. Mol. Ecol. 14 (8), 2611–2620. doi: 10.1111/j.1365-294X.2005.02553.x
Eyre-Walker, A., Gaut, R. L., Hilton, H., Feldman, D. L., Gaut, B. S. (1998). Investigation of the bottleneck leading to the domestication of maize. Proc. Natl. Acad. Sci. 95 (8), 4441–4446. doi: 10.1073/pnas.95.8.4441
Fu, Y. B., Peterson, G. W., Scoles, G., Rossnagel, B., Schoen, D. J., Richards, K. W. (2003). Allelic diversity changes in 96 Canadian oat cultivars released from 1886 to 2001. Crop Sci. 43 (6), 1989–1995. doi: 10.2135/cropsci2003.1989
Fu, Y. B., Peterson, G. W., Williams, D., Richards, K. W., Fetch, J. M. (2005). Patterns of AFLP variation in a core subset of cultivated hexaploid oat germplasm. Theor. Appl. Genet. 111 (3), 530–539. doi: 10.1007/s00122-005-2044-2
Gui, J., Shen, J., Li, L. (2011). Functional characterization of evolutionarily divergent 4-coumarate: coenzyme a ligases in rice. Plant Physiol. 157 (2), 574–586. doi: 10.1104/pp.111.178301
Hartl, D. L., Clark, A. G., Clark, A. G. (1997). Principles of population genetics (Vol. 116) (Sunderland: Sinauer associates).
He, X., Bjørnstad, Å. (2012). Diversity of north European oat analyzed by SSR, AFLP and DArT markers. Theor. Appl. Genet. 125 (1), 57–70. doi: 10.1007/s00122-012-1816-8
Hoffman, L. A. (1995). World production and use of oats (Springer, Dordrecht: In The Oat Crop), 34–61.
Hoffman, D. L. (1999). Inheritance and linkage relationships of morphological and isozyme loci in as-genome diploid oat (Avena spp.). J. Hered 90 (4), 446–452. doi: 10.1093/jhered/90.4.446
Huang, Y. F., Poland, J. A., Wight, C. P., Jackson, E. W., Tinker, N. A. (2014). Using genotyping-by-sequencing (GBS) for genomic discovery in cultivated oat. PloS One 9 (7), e102448. doi: 10.1371/journal.pone.0102448
Huang, X., Sang, T., Zhao, Q., Feng, Q., Zhao, Y., Li, C., et al. (2010). Genome-wide association studies of 14 agronomic traits in rice landraces. Nat. Genet. 42 (11), 961–967. doi: 10.1038/ng.695
Li, Y., Leveau, A., Zhao, Q., Feng, Q., Lu, H., Miao, J., et al. (2021). Subtelomeric assembly of a multi-gene pathway for antimicrobial defense compounds in cereals. Nat. Commun. 12 (1), 1–13. doi: 10.1038/s41467-021-22920-8
Lipman, E., Maggioni, L., Knüpffer, H., Ellis, R., Leggett, J. M., Kleijer, G., et al. (2005). Cereal genetic resources in Europe: Report of a Cereals Network First Meeting, 3-5 July 2003, Yerevan, Armenia/Report of a Working Group on Wheat, Second Meeting, 22-24 September 2005, La Rochelle, France. Rome, Italy, International Plant Genetic Resources Institute.
Liu, K., Muse, S. V. (2005). PowerMarker: an integrated analysis environment for genetic marker analysis. Bioinformatics 21 (9), 2128–2129. doi: 10.1093/bioinformatics/bti282
Liu, S., Zhao, L., Liao, Y., Luo, Z., Wang, H., Wang, P., et al. (2020). Dysfunction of the 4-coumarate: coenzyme a ligase 4CL4 impacts aluminum resistance and lignin accumulation in rice. Plant J. 104 (5), 1233–1250. doi: 10.1111/tpj.14995
Loskutov, I. G. (2008). On evolutionary pathways of Avena species. Genet. Resour Crop Evol. 55 (2), 211–220. doi: 10.1007/s10722-007-9229-2
Mangin, B., Siberchicot, A., Nicolas, S., Doligez, A., This, P., Cierco-Ayrolles, C. (2012). Novel measures of linkage disequilibrium that correct the bias due to population structure and relatedness. Heredity 108 (3), 285–291. doi: 10.1038/hdy.2011.73
Maughan, P. J., Lee, R., Walstead, R., Vickerstaff, R. J., Fogarty, M. C., Brouwer, C. R., et al. (2019). Genomic insights from the first chromosome-scale assemblies of oat (Avena spp.) diploid species. BMC Biol. 17 (1), 1–19. doi: 10.1186/s12915-019-0712-y
Milner, S. G., Jost, M., Taketa, S., Mazón, E. R., Himmelbach, A., Oppermann, M., et al. (2019). Genebank genomics highlights the diversity of a global barley collection. Nat. Genet. 51 (2), 319–326. doi: 10.1038/s41588-018-0266-x
Montilla-Bascón, G., Sánchez-Martín, J., Rispail, N., Rubiales, D., Mur, L., Langdon, T., et al. (2013). Genetic diversity and population structure among oat cultivars and landraces. Plant Mol. Biol. Rep. 31 (6), 1305–1314. doi: 10.1007/s11105-013-0598-8
Muñoz-Amatriaín, M., Cuesta-Marcos, A., Endelman, J. B., Comadran, J., Bonman, J. M., Bockelman, H. E., et al. (2014). The USDA barley core collection: genetic diversity, population structure, and potential for genome-wide association studies. PloS One 9 (4), e94688. doi: 10.1371/journal.pone.0094688
Newell, M. A., Asoro, F. G., Scott, M. P., White, P. J., Beavis, W. D., Jannink, J. L. (2012). Genome-wide association study for oat (Avena sativa l.) beta-glucan concentration using germplasm of worldwide origin. Theor. Appl. Genet. 125 (8), 1687–1696. doi: 10.1007/s00122-012-1945-0
Newell, M. A., Cook, D., Tinker, N. A., Jannink, J. L. (2011). Population structure and linkage disequilibrium in oat (Avena sativa l.): implications for genome-wide association studies. Theor. Appl. Genet. 122 (3), 623–632. doi: 10.1007/s00122-010-1474-7
Newton, A. C., Akar, T., Baresel, J. P., Bebeli, P. J., Bettencourt, E., Bladenopoulos, K. V., et al. (2011). Cereal landraces for sustainable agriculture. a review. Agron. Sustain Dev. 30 (2), 237–269. doi: 10.1007/978-94-007-0394-0_10
Othman, R. A., Moghadasian, M. H., Jones, P. J. (2011). Cholesterol-lowering effects of oat β-glucan. Nutr. Rev. 69 (6), 299–309. doi: 10.1111/j.1753-4887.2011.00401.x
Peng, Y., Yan, H., Guo, L., Deng, C., Kang, L., Wang, C., et al. (2022). Reference genome assemblies reveal the origin and evolution of allohexaploid oat. Nat. Genet. 54 (8), 1248–1258. doi: 10.21203/rs.3.rs-664692/v1
Pritchard, J. K., Stephens, M., Donnelly, P. (2000). Inference of population structure using multilocus genotype data. Genetics 155 (2), 945–959. doi: 10.1093/genetics/155.2.945
Reif, J. C., Zhang, P., Dreisigacker, S., Warburton, M. L., van Ginkel, M., Hoisington, D., et al. (2005). Wheat genetic diversity trends during domestication and breeding. Theor. Appl. Genet. 110 (5), 859–864. doi: 10.1007/s00122-004-1881-8
Rodgers, D. M., Murphy, J. P., Frey, K. J. (1983). Impact of plant breeding on the grain yield and genetic diversity of spring oats. Crop Sci. 23 (4), 737–740. doi: 10.2135/cropsci1983.0011183X002300040032x
Ruwali, Y., Singh, K., Kumar, S., Kumar, L. (2013). Molecular diversity analysis in selected fodder and dual purpose oat (Avena sativa l.) genotypes by using random amplified polymorphic DNA (RAPD). Afr J. Biotechnol. 12 (22):3425–3429. doi: 10.5897/AJB2013.12410
Taketa, S., Amano, S., Tsujino, Y., Sato, T., Saisho, D., Kakeda, K., et al. (2008). Barley grain with adhering hulls is controlled by an ERF family transcription factor gene regulating a lipid biosynthesis pathway. Proc. Natl. Acad. Sci. 105, 4062–4067. doi: 10.1073/pnas.0711034105
Tamura, K., Stecher, G., Peterson, D., Filipski, A., Kumar, S. (2013). MEGA6: molecular evolutionary genetics analysis version 6.0. Mol. Biol. Evol. 30 (12), 2725–2729. doi: 10.1093/molbev/mst197
Tinker, N. A., Chao, S., Lazo, G. R., Oliver, R. E., Huang, Y. F., Poland, J. A., et al. (2014). A SNP genotyping array for hexaploid oat. Plant Genome 7 (3), plantgenome2014.03.0010. doi: 10.3835/plantgenome2014.03.0010
Tinker, N. A., Kilian, A., Wight, C. P., Heller-Uszynska, K., Wenzl, P., Rines, H. W., et al. (2009). New DArT markers for oat provide enhanced map coverage and global germplasm characterization. BMC Genomics 10 (1), 1–22. doi: 10.1186/1471-2164-10-39
Tumino, G., Voorrips, R. E., Morcia, C., Ghizzoni, R., Germeier, C. U., Paulo, M. J., et al. (2017). Genome-wide association analysis for lodging tolerance and plant height in a diverse European hexaploid oat collection. Euphytica 213 (8), 1–12. doi: 10.1007/s10681-017-1939-8
Tumino, G., Voorrips, R. E., Rizza, F., Badeck, F. W., Morcia, C., Ghizzoni, R., et al. (2016). Population structure and genome-wide association analysis for frost tolerance in oat using continuous SNP array signal intensity ratios. Theor. Appl. Genet. 129 (9), 1711–1724. doi: 10.1007/s00122-016-2734-y
Ubert, I. P., Zimmer, C. M., Pellizzaro, K., Federizzi, L. C., Nava, I. C. (2017). Genetics and molecular mapping of the naked grains in hexaploid oat. Euphytica 213 (2), 1–16. doi: 10.1007/s10681-017-1836-1
Wabila, C., Neumann, K., Kilian, B., Radchuk, V., Graner, A. (2019). A tiered approach to genome-wide association analysis for the adherence of hulls to the caryopsis of barley seeds reveals footprints of selection. BMC Plant Biol. 19 (1), 1–12. doi: 10.1186/s12870-019-1694-1
Wang, M., Yan, J., Zhao, J., Song, W., Zhang, X., Xiao, Y., et al. (2012). Genome-wide association study (GWAS) of resistance to head smut in maize. Plant Sci. 196, 125–131. doi: 10.1016/j.plantsci.2012.08.004
Winkler, L. R., Michael Bonman, J., Chao, S., Admassu Yimer, B., Bockelman, H., Esvelt Klos, K. (2016). Population structure and genotype–phenotype associations in a collection of oat landraces and historic cultivars. Front. Plant Sci. 7, 1077. doi: 10.3389/fpls.2016.01077
Yan, H., Bekele, W. A., Wight, C. P., Peng, Y., Langdon, T., Latta, R. G., et al. (2016a). High-density marker profiling confirms ancestral genomes of avena species and identifies d-genome chromosomes of hexaploid oat. Theor. Appl. Genet. 129 (11), 2133–2149. doi: 10.1007/s00122-016-2762-7
Yan, H., Martin, S. L., Bekele, W. A., Latta, R. G., Diederichsen, A., Peng, Y., et al. (2016b). Genome size variation in the genus Avena. Genome 59 (3), 209–220. doi: 10.1139/gen-2015-0132
Yan, H., Zhou, P., Peng, Y., Bekele, W. A., Ren, C., Tinker, N. A., et al. (2020). Genetic diversity and genome-wide association analysis in Chinese hulless oat germplasm. Theor. Appl. Genet. 133 (12), 3365–3380. doi: 10.1007/s00122-020-03674-1
Keywords: hexaploid oat, population structure, linkage disequilibrium (LD), genome-wide association analysis (GWAS), hullessness, lemma color
Citation: Wang L, Xu J, Wang H, Chen T, You E, Bian H, Chen W, Zhang B and Shen Y (2023) Population structure analysis and genome-wide association study of a hexaploid oat landrace and cultivar collection. Front. Plant Sci. 14:1131751. doi: 10.3389/fpls.2023.1131751
Received: 26 December 2022; Accepted: 22 February 2023;
Published: 21 March 2023.
Edited by:
Hongxiang Ma, Yangzhou University, ChinaReviewed by:
Zujun Yang, University of Electronic Science and Technology of China, ChinaAna Nikolić, Maize research Institute Zemun Polje, Serbia
Copyright © 2023 Wang, Xu, Wang, Chen, You, Bian, Chen, Zhang and Shen. This is an open-access article distributed under the terms of the Creative Commons Attribution License (CC BY). The use, distribution or reproduction in other forums is permitted, provided the original author(s) and the copyright owner(s) are credited and that the original publication in this journal is cited, in accordance with accepted academic practice. No use, distribution or reproduction is permitted which does not comply with these terms.
*Correspondence: Yuhu Shen, shenyuhu@nwipb.cas.cn