 Huiting Tian
 Lingzhi Chen
 Jinyao Wu
 Daitian Zheng
 Qiuping Yang
 Zeqi Ji
 Jiehui Cai
 Yexi Chen
 Zhiyang Li
- Department of Thyroid, Breast, and Hernia Surgery, General Surgery, The Second Affiliated Hospital of Shantou University Medical College, Shantou, China
Introduction: The aims of this research were to conduct the first holistic and deep scientometric analysis of electronic waste and health and provide with the prediction of research trends and hot topics.
Method: A comprehensive literature search was conducted via the Web of Science Core collection databases on 26 August 2022 to identify all articles related to electronic waste and health. A total of 652 records have been extracted from the Web of Science after applying inclusion and exclusion criteria and were analyzed using bibliometrix software of R-package, VOSviewer, and CiteSpace, visualized by tables and diagrams.
Result: The number of publications and total citations had shown a general growth trend from 2012 to 2021, with an average annual growth rate of 23.74%. Mainland China was the significant nation with the greatest number of publications, citations, and international links. The journal publishing the most was “Science of the Total Environment” (n = 56). Huo X and Hu XJ were the top two author contributing to this field with the highest h-index (23). Over time, the focus in this field shifted to exposure to heavy metal, polychlorinated biphenyls, polybrominated biphenyl ethers, and poly- and perfluorinated alkyl substances from electronic waste, and managements, such as hydrometallurgy.
Discussion: By this scientometric analysis, we found that the most active country, journal, organization and author contributing to this filed, as well as high impact documents and references and research hotspots. Also, we found that the hotspots might be exposure to toxic substances from electronic waste procession, its impact on human health and relevant managements. And evironmentally friendly materials to replace heavy metal mate rials, and environmentally friendly and effective recycling methods of electronic waste need to be further studied.
Introduction
Population growth, technological advancement, and economic expansion accelerated the rise in demand for electronic goods and shortened their replacement cycles. Due to the increase in the disposal of end-of-life (EoL) electrical and electronic goods, electrical and electronic waste (e-waste) contribute as one of the major pollution-causing products. Without proper management, the presence of heavy metals such as Hg, Cd, Pb, Co, Ni, Ti, Ag, Hg, Cd, As, and brominated flame retardants (BFRs), as well as other potentially dangerous compounds in e-waste, poses a threat to both the environment and human health (1–13).
A study by Gwenzi et al. revealed that high-tech rare earth elements (REEs) of anthropogenic origin are found in the environment, including aquatic systems. The probability of developing nephrogenic systemic fibrosis, severe kidney damage from Gd-based contrast media, dysfunctional neurological disorder, fibrotic tissue injury, peroxidation, lung damage, cytotoxicity, anti-testicular effects, and infertility may all increase with human exposure to REEs (14). The studies by Grant et al. (15) and Issah et al. (16) showed that exposure to electronic waste may lead to changes in thyroid function, cell expression and function, temperament and behavior, cause adverse neonatal outcomes, decrease lung function, and even damage DNA. Some studies found that excessive exposure to lead is associated with multisystem and long-term effects in neonates and children, including neurological, cardiovascular, adaptive immune, and blood systems, as well as chromosomal and DNA damage (17–19).
In summary, e-waste has become a problem influencing human health that needs urgent attention. Several studies on electric waste and health are available. A scientometric analysis is particularly suitable for measuring a field as a whole and providing an overview of the state, scope, and impact of the field and the major contributors involved. However, there have been no studies that conducted research using the scientometric analysis in this field. This study is the first to study the research trend of e-waste, toxic products from recycling and processing e-waste, and health and provide some valuable insights to future researchers.
Materials and methods
Data collection
The Web of Science Core Collection database of Clarivate Analysis was used to search for all pieces of literature on the connection between electronic waste and health. Search tactics included the use of the medical subject headings (mesh) as well as the entry phrases “electronic waste” and “health.” We first used the online “analyze results” feature of the Web of Science (WoS) to learn more about the publication years, types of documents, authors, affiliations, sources, countries, languages, and open-access texts.
The retrieval formula was as follows: #1, TS = (“Electronic Waste*”) OR TS = (“Waste*, Electronic”) #2, TS = (“Health*”) or TS = (“Normal*”); #3, #1, and #2. Apart from that, the timespan of these publications was filtered from 2012 to 2022. On 25 August 2022, the research was completed, yielding a total of 669 publications. Then, we restricted the language to English and the document types to articles or reviews, yielding a total of 652 publications, including 519 articles and 133 reviews (Table 1). Twenty-three languages other than English and non-publications were excluded. Two duplicate articles were detected using the Zotero software and eliminated. Finally, 519 articles from 652 periodicals, representing 79.60% of the total, and 133 review articles (20.40%) were included in the scientometric study.
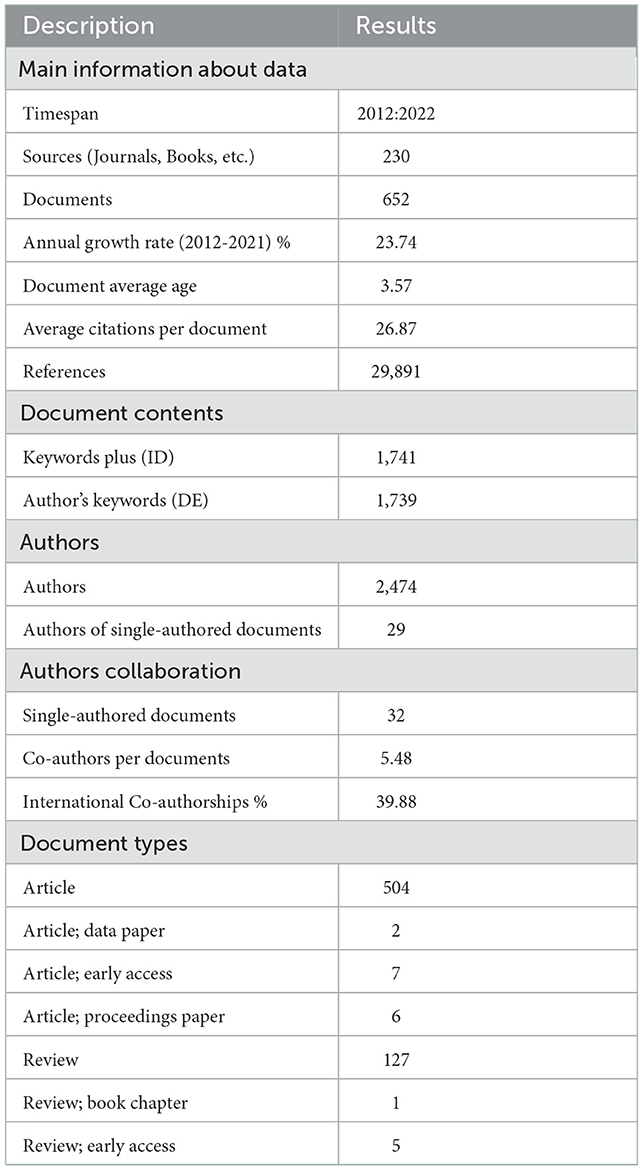
Table 1. Main information of screened records.
Inclusion criteria
The inclusion criteria were as follows: (1) articles searched from WoS; (2) article types were “article” or “review”; (3) articles published from 2012 to 2022; (4) the language of the articles was English. Figure 1 displays the procedures used to gather the documents and analyze the data. This study needed no ethics committee approval.
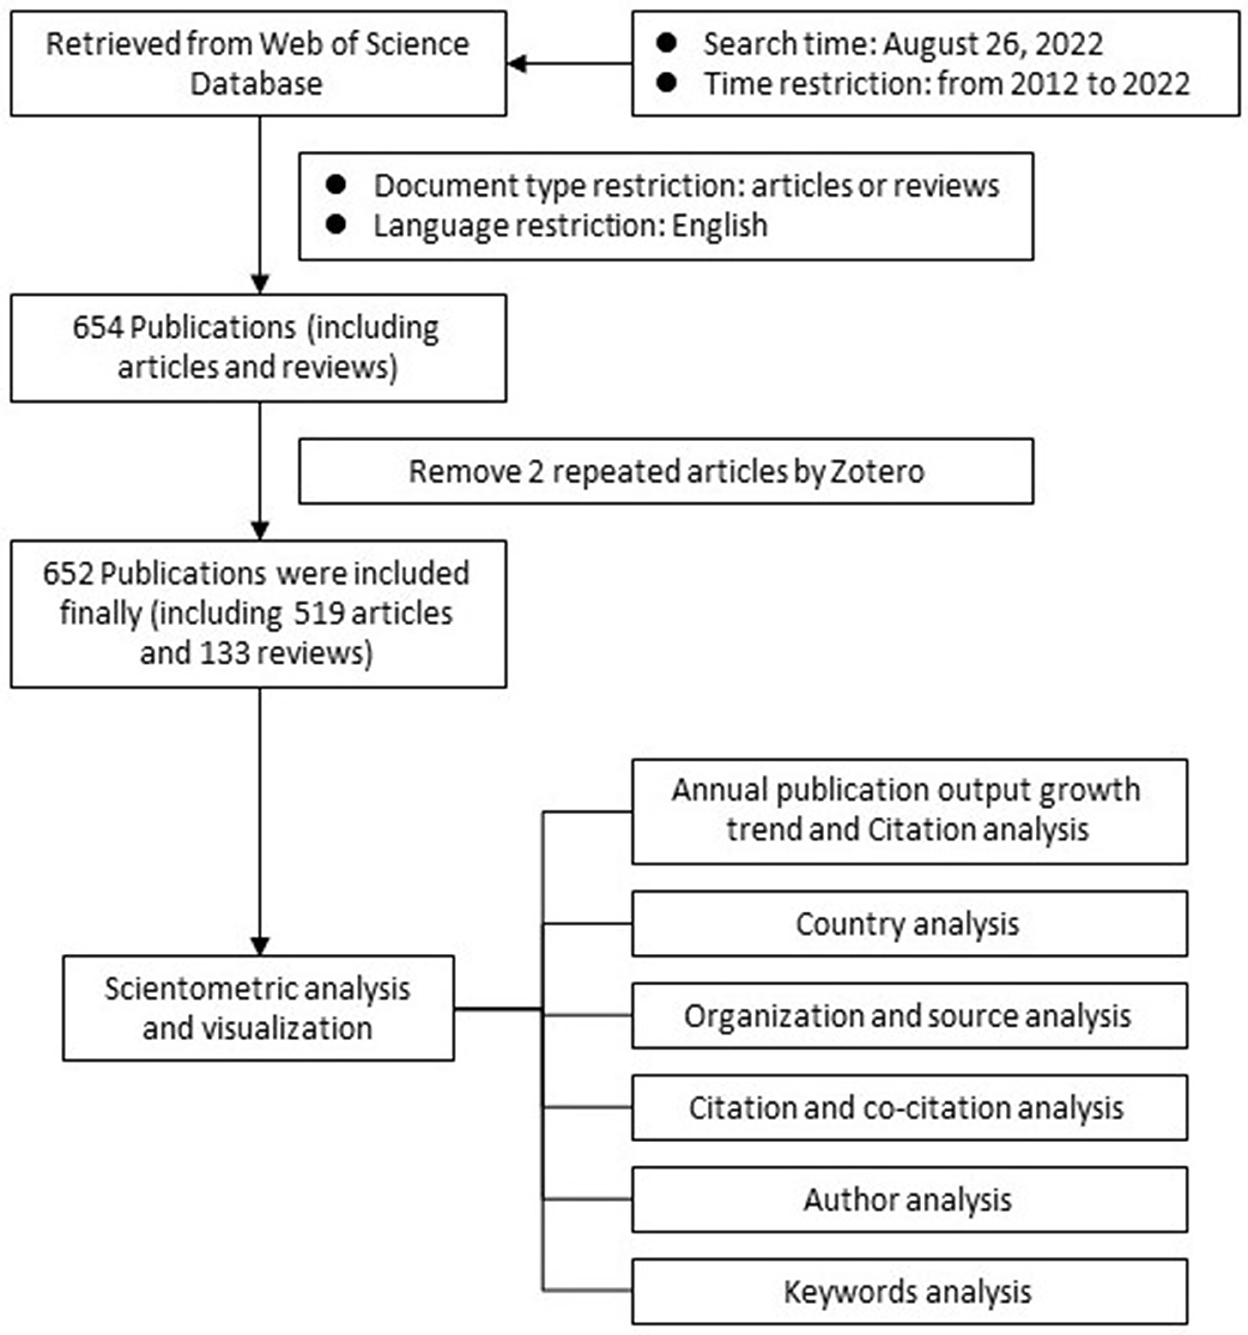
Figure 1. Data collection and the analysis flowchart.
Exclusion criteria
The exclusion criteria were as follows: (1) non-English articles, non-original articles, and non-reviews; (2) retracted articles; and (3) duplicate articles.
Visualization and scientometrics analysis
The information from these documents was loaded into the Biblioshiny website, CiteSpace, and VOSviewer.
An R-tool of R-studio (version 4.2.1), Bibliometrix, was used for a comprehensive science mapping analysis to provide the description, evaluation, and monitoring of published research (20). It was used to convert and analyze publications, citations, and sources of information. The raw files of the retrieved data were imported into the Bibliometrix to obtain the main information (Table 1): annual scientific production, the most productive countries' contribution, the collaboration between the most productive countries, sources (most relevant sources, impact of sources, growth dynamics of sources), authors (production of authors over time, impact of authors ranked by the h-index, g-index, m-index, and the total number of citations), most cited documents and references, and keywords. The co-occurrence network of trend topics across years was used as a metric to help detect the focus of hotspot research.
CiteSpace provides a quantitative and qualitative evaluation of the literature in the field based on a brief analysis of the state of research, research priorities, and evolution of the field (21). Through a CiteSpace visual analysis, the top 20 references with the strongest citation explosion from around the world are compared and analyzed to explore the current status of research and future trends in the field on a global scale.
VOSviewer is a tool that creates maps using network data to build networks of scientific sources, scientists, research organizations, countries, and keywords. It supports three map visualizations: network visualization, overlay visualization, and density visualization (22). Networks were built using VOSviewer (version 1.6.18): country co-authorship, organization co-authorship, references co-citation analysis, document citation analysis, and keyword co-occurrence analysis. The overlay map showed the co-authorship of countries, and the co-citation of references was also shown by the density map. Further, the keywords occurring more than five times were shown in the three visualizations of the co-occurrence analysis to identify important terms (23).
The h-index is an author's or journal's number of published articles, which is widely used to quantify and standardize researchers' scientific impact. Each of these published articles has been cited in another paper at least one time. The M-index is defined as h/n, where h is the h-index and n is the number of years since the year of the first paper of the scientist or journal published, which will remove the effects of different academic career lengths. Using g as the serial number, the articles published by authors were arranged in descending order of the number of citations. The sum of the top g articles' citations is at least a g2 citation. A high g-index indicates a high citation rate (24–26).
Results
Annual publication output growth trend and citation analysis
Over the last 10 years, 2012–2021, the total number of documents retrieved from WoS related to this topic was 558, as shown in Figure 2A, and the annual growth rate was 23.74%. Further, 2021 was the year with the highest contribution to publication output (102, 18.27%). There was an increasing trend from 15 publications in 2012 (2.68%) to 102 publications in 2021 (18.27%), showing a general growth trend. From 2016 to 2019, the growth rate increased from 10 to 19%. The highest growth rate was observed in 2012, from 15 to 32 articles (113.33%), and the growth rate of articles decreased in 2022 (2.22%) and increased in 2021 (10.87%). As shown in Figure 2B, the total article citations grew in a general growth trend from 4 citations in 2012 to 4,715 in 2021.
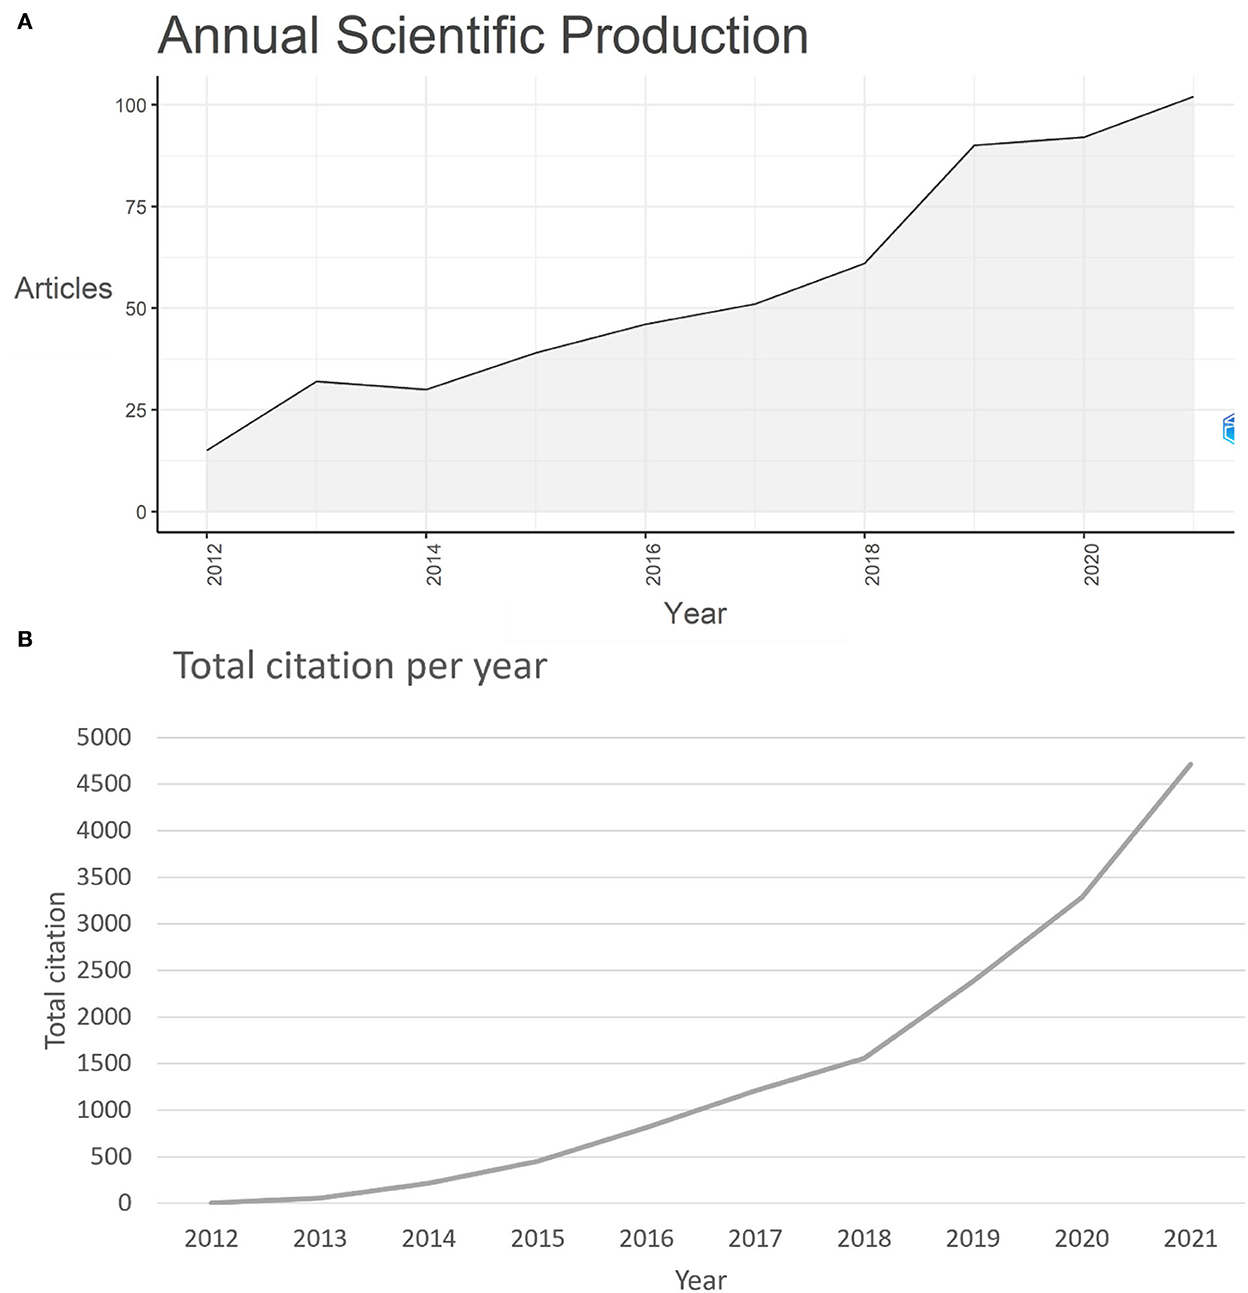
Figure 2. (A) Annual scientific production during the last 10 years in this field; (B) Total article citations per year during the last 10 years in this field.
Countries analysis
In the 652 publications analyzed, the authors lived in 79 countries or territories, as displayed in Figure 3A. A country or territory colored blue on a map of the globe indicates that authors from these countries have contributed to the literature; the darker the blue hue, the greater the number of articles produced from that country or region. It was evident that China (excluding Hong Kong, Macau, and Taiwan, henceforth), the United States, and India are all darker than any other nation or region, with 44.17, 17.79, and 11.04% of all publications, respectively. There are more countries outside these three where publications account for over 2% of the total number of countries, such as Canada, Ghana, Australia, Nigeria, the Netherlands, England, Malaysia, Germany, Thailand, South Africa, Japan, Vietnam, Pakistan, and Belgium. The main participants include seven Asian countries, five European countries, two North American countries, and three African countries.
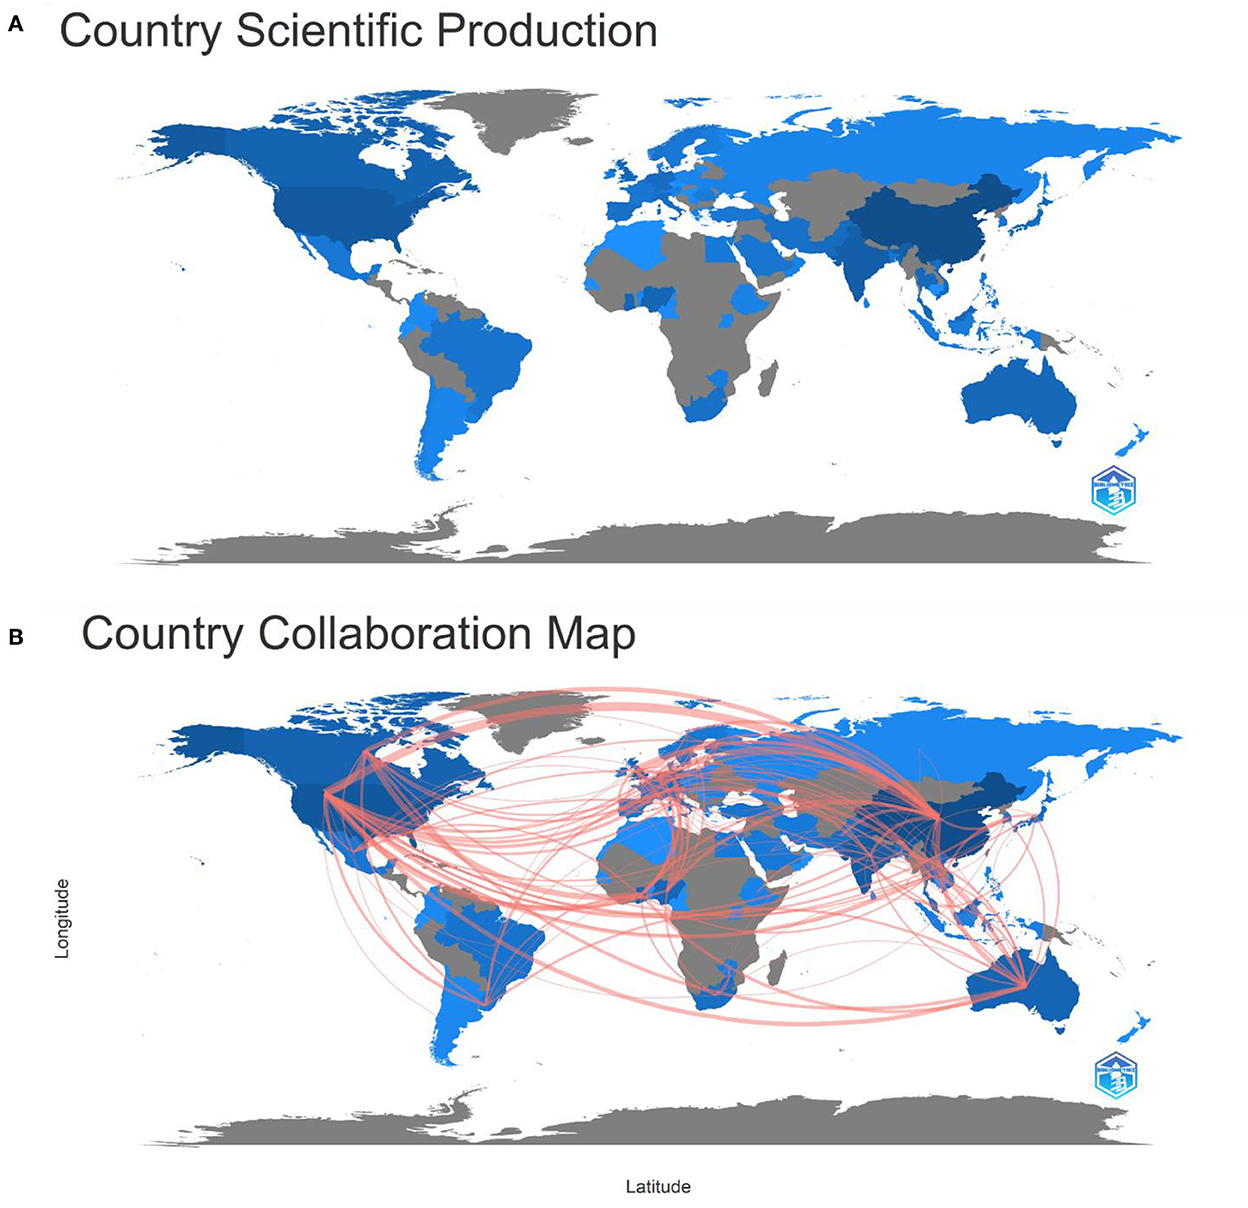
Figure 3. (A) Country or region scientific production world map; (B) country or region collaboration world map (blue color: country or region with publications; gray color: country or region without publications; the intensity: the publications' number).
Figure 3B shows the graph of cooperation between countries or regions. If there are any partnerships between two nations or regions, they are linked by red lines whose thickness is positively correlated with the number of partnerships. Figure 3B shows several red lines connecting mainland China, the USA, and other nations or regions, suggesting that these two nations were the publication's focal points. The number of partnerships between the USA and mainland China results in 41 co-publications, making up the greatest thickness.
Table 2 shows the top 10 countries contributing to this field of study. China was the top contributor in this field, with the highest total of citations, 9,736, which is far more than any other country. The United States followed with 3,353 citations, followed sequentially by Australia (n = 2008), India (n = 1833), Canada (n = 1098), and the Netherlands (n = 1041).
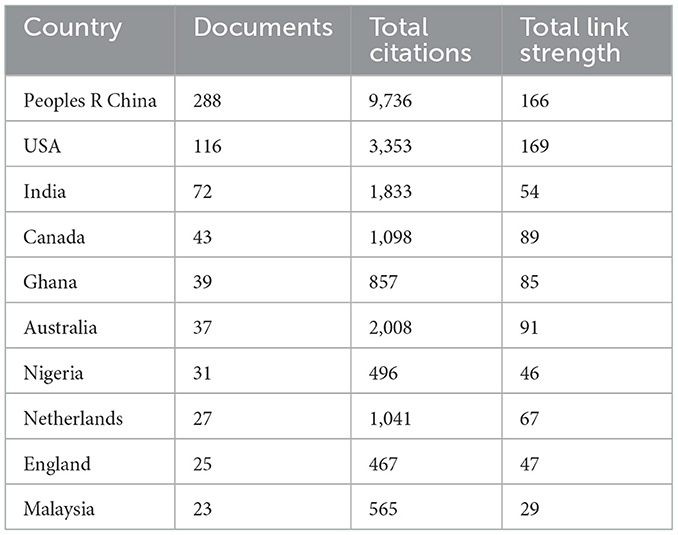
Table 2. Top 10 cited countries contributing to this research area.
A total of 42 nations with much more than five publications in this field of study were examined in the co-authorship analysis. The USA (total link strength = 169), China (166), Australia (91), Canada (89), Ghana (85), and the Netherlands (67) were the top five nations in terms of total link strength (Figure 4A). The diameter of the circles depicts the overall strength of ties between the various nations, and the distance between the circles denotes the strength of the linkages based on how frequently they occur. With time, certain developing nations started to show startling data in this area, including Ghana (total link strength = 85), India (54), Nigeria (46), and Malaysia (29; Figure 4B).
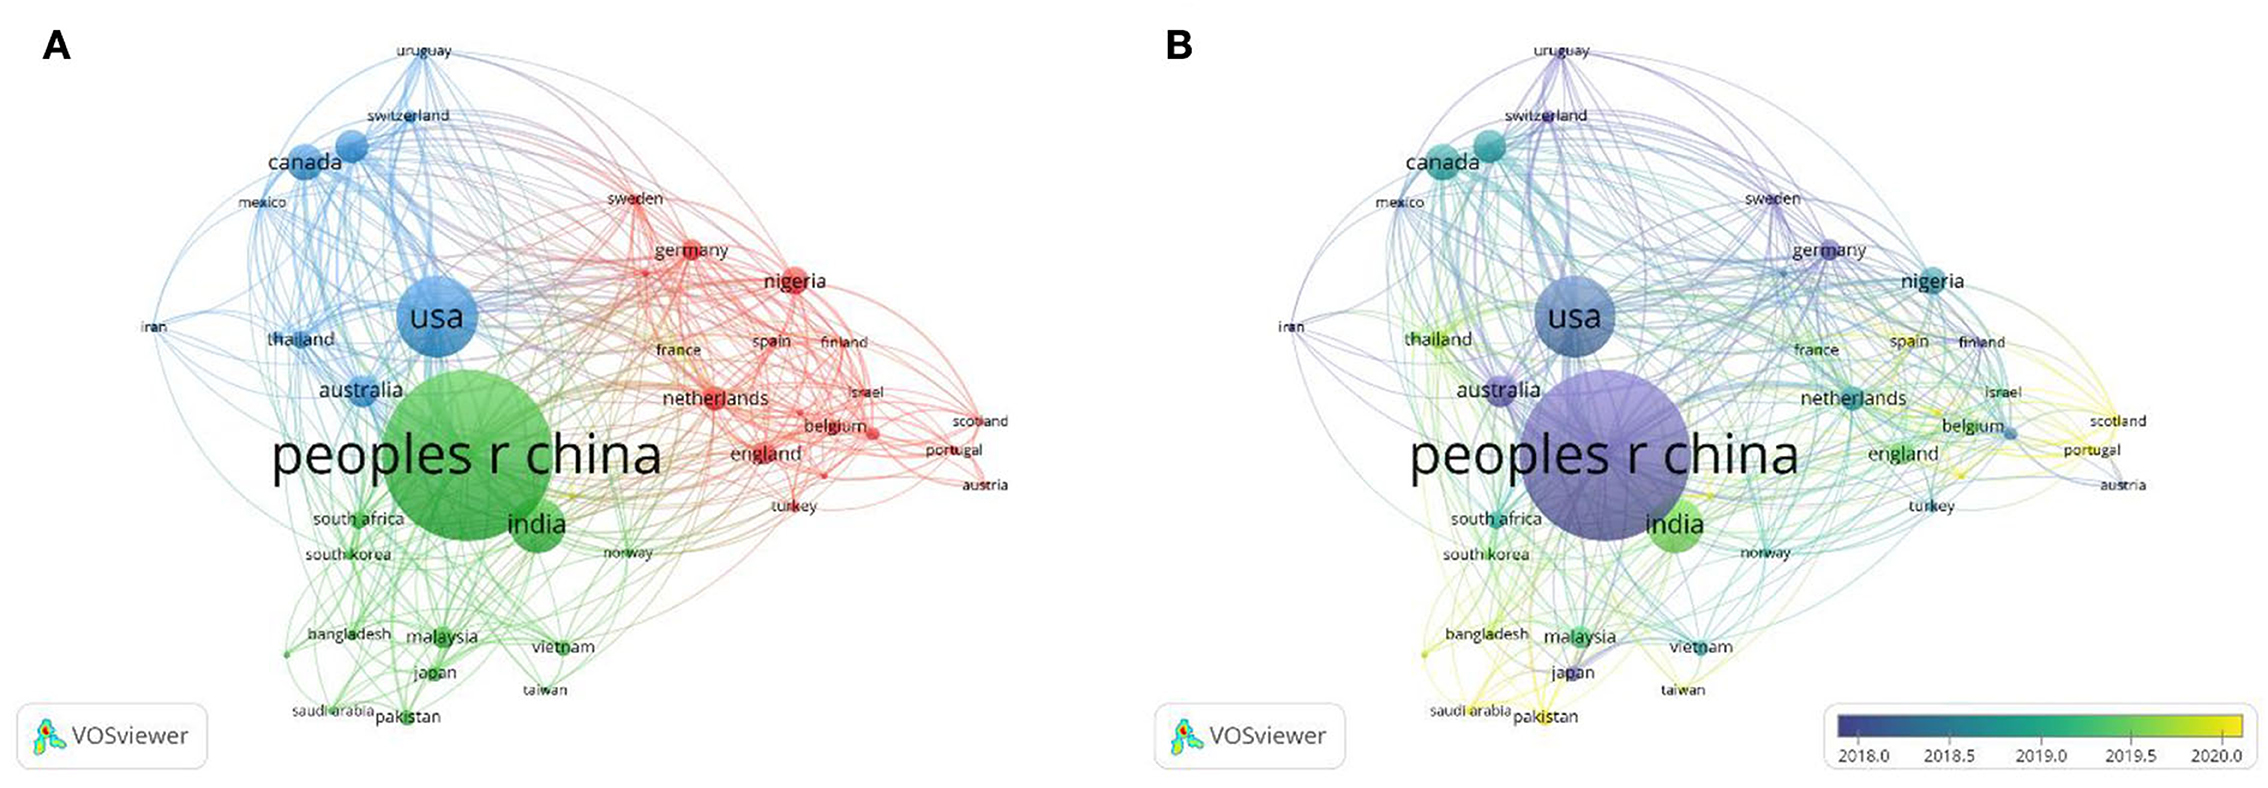
Figure 4. (A) Co-authorship network map between countries with over five publications; (B) Co-authorship overlay map between countries with over five publications (the blue color stands for earlier years; the yellow color stands for more recent years).
Organizations and source analysis
A total of 967 organizations were involved in this field. The Chinese Academy of Sciences contributed the most publications (n = 49, 7.52%), followed by Shantou University (n =47, 7.2%), Jinan University (n = 39, 5.98%), the University of Ghana (n = 28, 4.29%), and the University of Michigan (n = 22, 3.37%; Table 3, Figure 5A). Then, we analyzed the organization's co-authorship of over five papers and obtained the results for 42 institutions. The top five institutions in terms of the strength of their total links were Jinan University (59), Shantou University (58), the Chinese Academy of Sciences (56), the University of Ghana (30), and the University of Chinese Academy of Sciences (20; Table 3, Figure 5A). Over time, the average years of contributions in this field by these organizations are closer to the recent, such as Nanjing Medical University, Guangdong University of Technology, South China Normal University, Synergy Innovation Institution GDUT, Kwame Nkrumah University of Science and Technology, the Academy of Scientific and Innovative Research, and so on (Figure 5B).
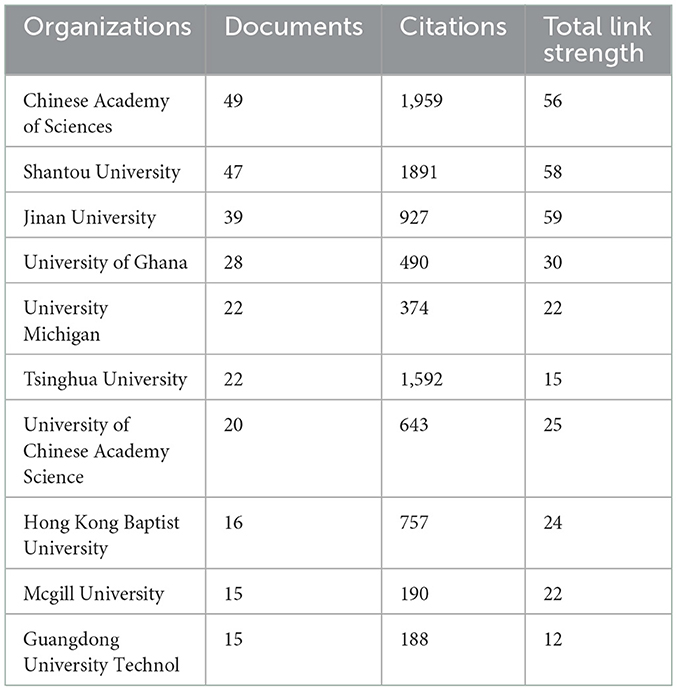
Table 3. Most productive organizations contributing to this area.
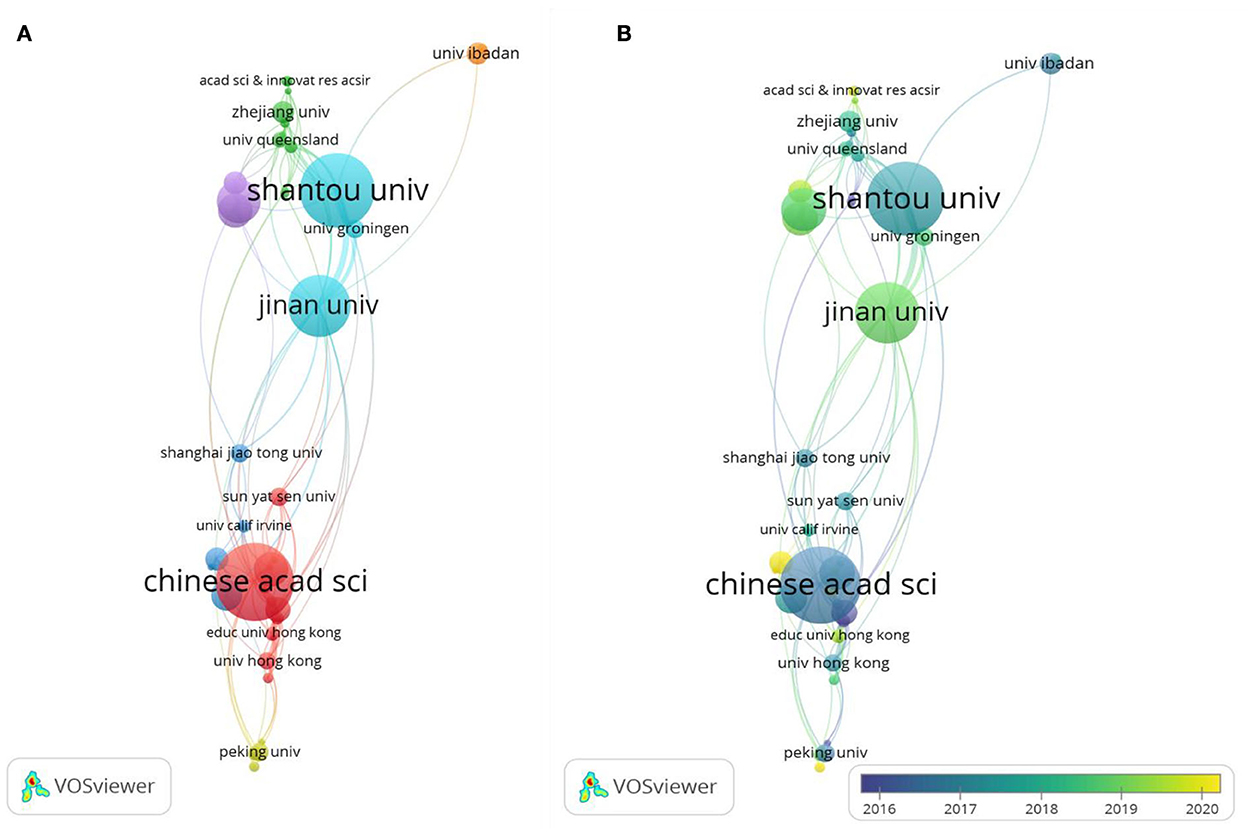
Figure 5. (A) Co-authorship network map for organizations with over five publications; (B) Co-authorship overlay map for organizations with over five publications.
These 652 papers were published in 230 journals. The top 10 journals in this discipline regarding productivity are shown in Supplementary Table 1. A total of 280 papers were published in these top 10 journals (42.94% of all). “Science of the Total Environment” published papers with the maximum number (n = 56). The second-ranked journal was “Environmental Science and Pollution Research” (n = 44). “Environment International” ranked third (n = 32), followed by “Chemosphere” (n = 27) and “Environmental Pollution” (n = 26). These journals focused on environmental science. “Science of the Total Environment” had the highest number of citations (1,820), followed by “Waste Management” (1,611 citations), “Environment International” (1,220 citations), “Journal of Cleaner Production” (1,089 citations), and “Environmental Pollution” (1,080 citations). The significance of these journals was discussed in terms of source impact using the h-index (25, 26). The h-index for “Science of the Total Environment” was the largest at 24, followed by “Environment International” (h-index = 22) and “Environmental Science and Pollution Research” (h-index = 19; Table 4). “Chemosphere,” “Environment International,” “Environmental Pollution,” “Environmental Science and Pollution Research,” and “Science of the Total Environment” have been active in this field for many years. “Environment International” rapidly developed in 2015 and overtook “Environment Pollution” and “Chemosphere” in 2019 (Supplementary Figure 1).
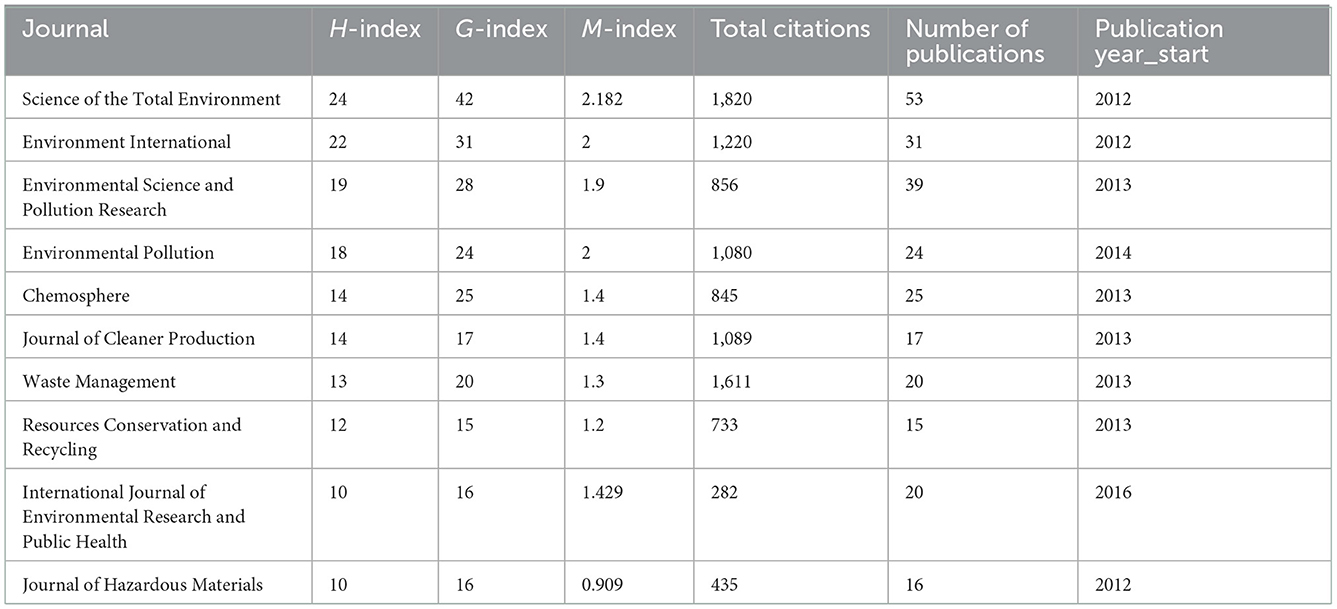
Table 4. Impact of sources on the top 10 journals in this field.
Citation and co-citation analysis
The citation analysis showed that 89 documents were cited more than 50 times (Figure 6). The top ten most-cited documents are listed in Table 5. Among them, “Electronic waste management approaches: an overview” (7) had 382 citations, followed by “A wearable transient pressure sensor made with MXene nanosheets for sensitive broad-range human-machine interfacing” (27) with 327 citations. The third-most-cited article was “Waste Printed Circuit Boards Recycling: An Extensive Assessment of Current Status” (28), with 316 citations.
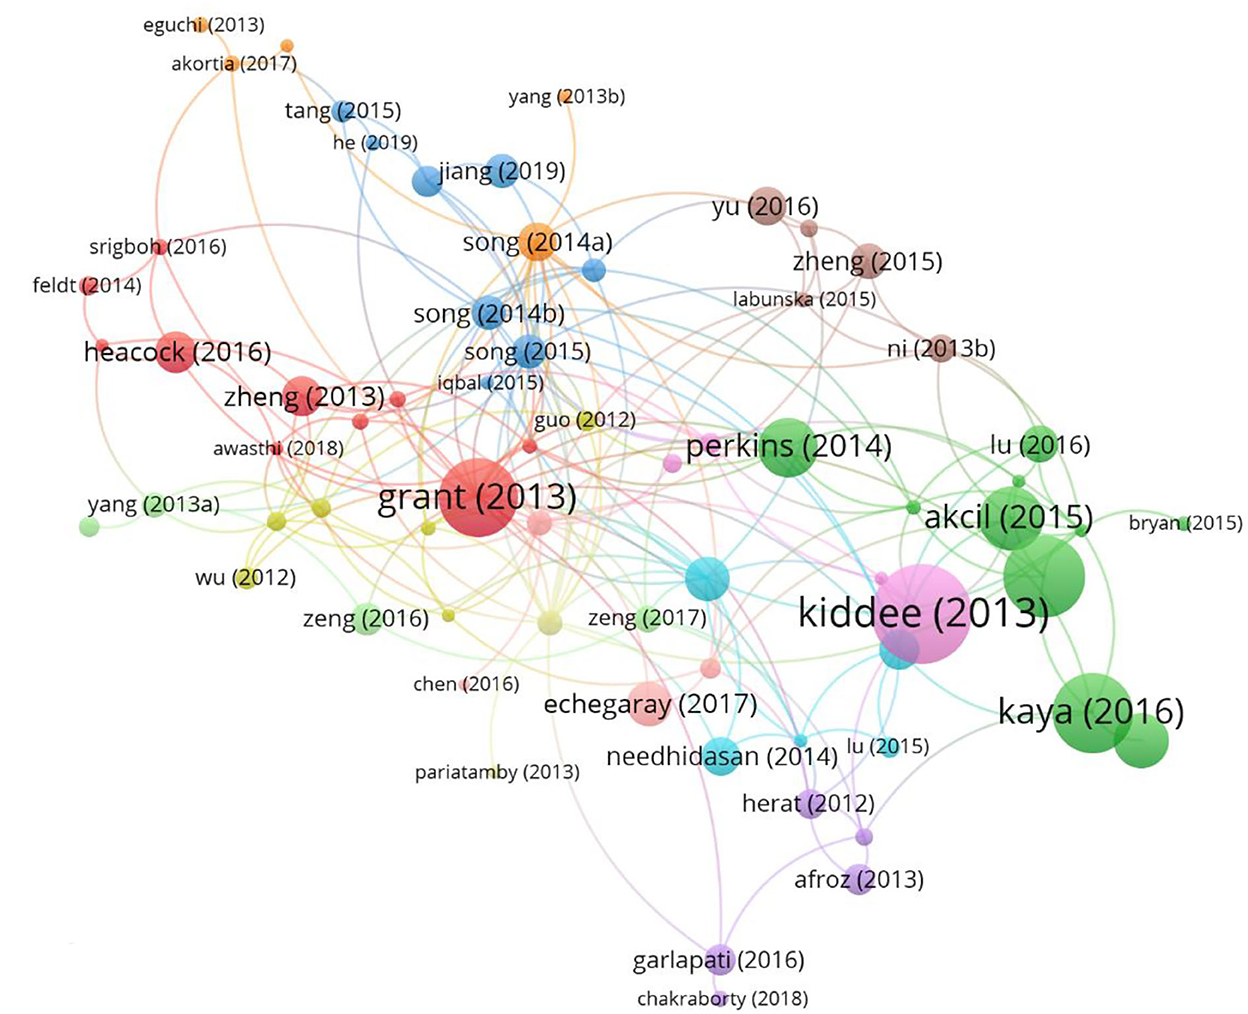
Figure 6. Citation analysis of documents network map with over 50 citations.
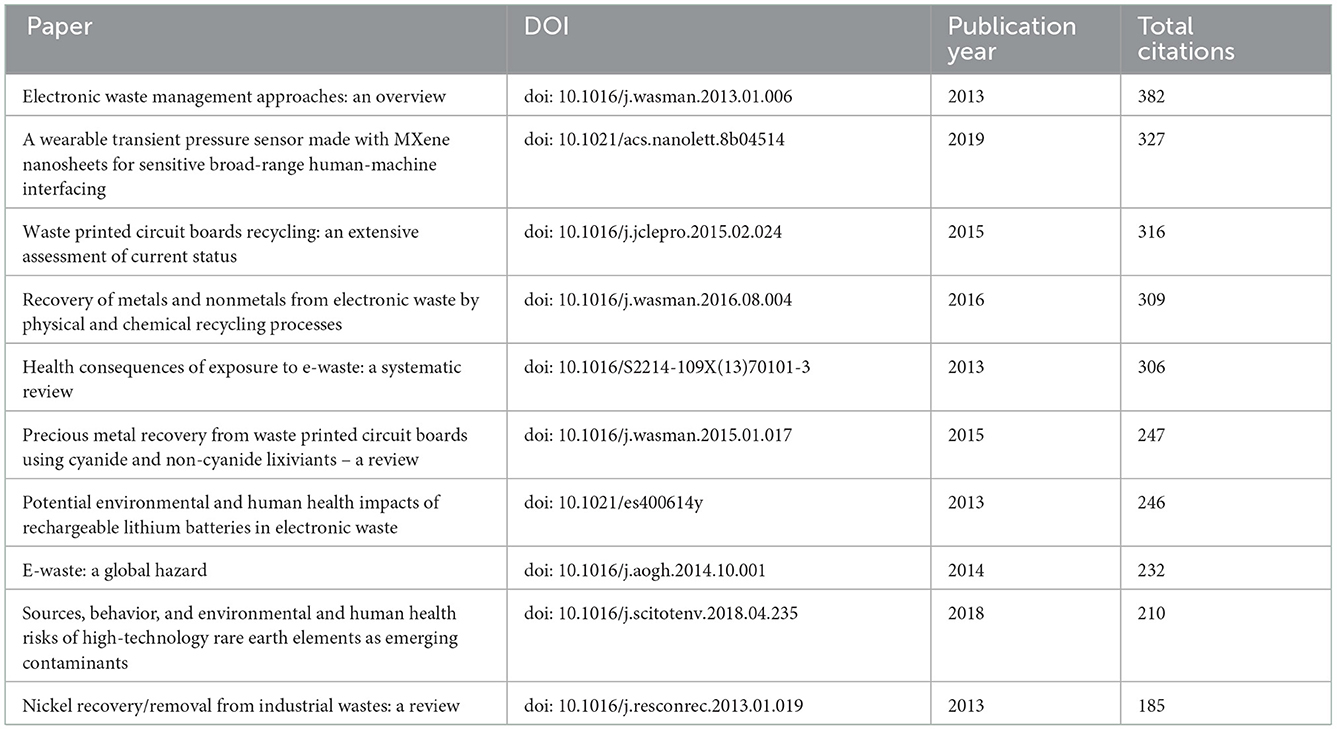
Table 5. Top 10 global cited documents.
A co-citation network map, conducted with VOSviewer, of these publications' references is shown in Figure 7. Using 20 as the minimal citation count for the references, 123 references met the requirement, and two unidentified references were excluded. Those two unidentified references had a total of 114 citations, which may not necessarily be from the same two articles. The node grows in size as more references are cited (Figure 7A). A deeper yellow tint indicated more citation (Figure 7B). Figure 7A presents the five groups of cited sources. The top group, highlighted in red and with 38 entries, represents the most desirable study areas. With 141 citations, Robinson's (29) paper was the most cited, as illustrated in Figure 7. This paper mainly indicated two points. First, there were valuable metals and potential environmental pollution, such as Pb, Hg, Sb, and polychlorinated biphenyls (PCBs). Second, using the unsuitable handling method of processing e-waste could generate toxic substances, e.g., dioxins, impacting human health (29). The top five most cited references were Robinson (29) (141 citations), Grant et al. (15) (122 citations), Wong et al. (30) (106 citations), Huo et al. (31) (99 citations), and Widmer et al. (32) (95 citations). We identified the top 20 references with the most powerful citation explosions via CiteSpace (Supplementary Figure 2). Notably, 65% of them (12/20) showed a citation burst in the period 2014–2016, followed by those in the period 2017–2019 (7/20, 40%). In addition, two references, Balde (33) and Srigboh (34), were cited from 2019 in rapid succession.
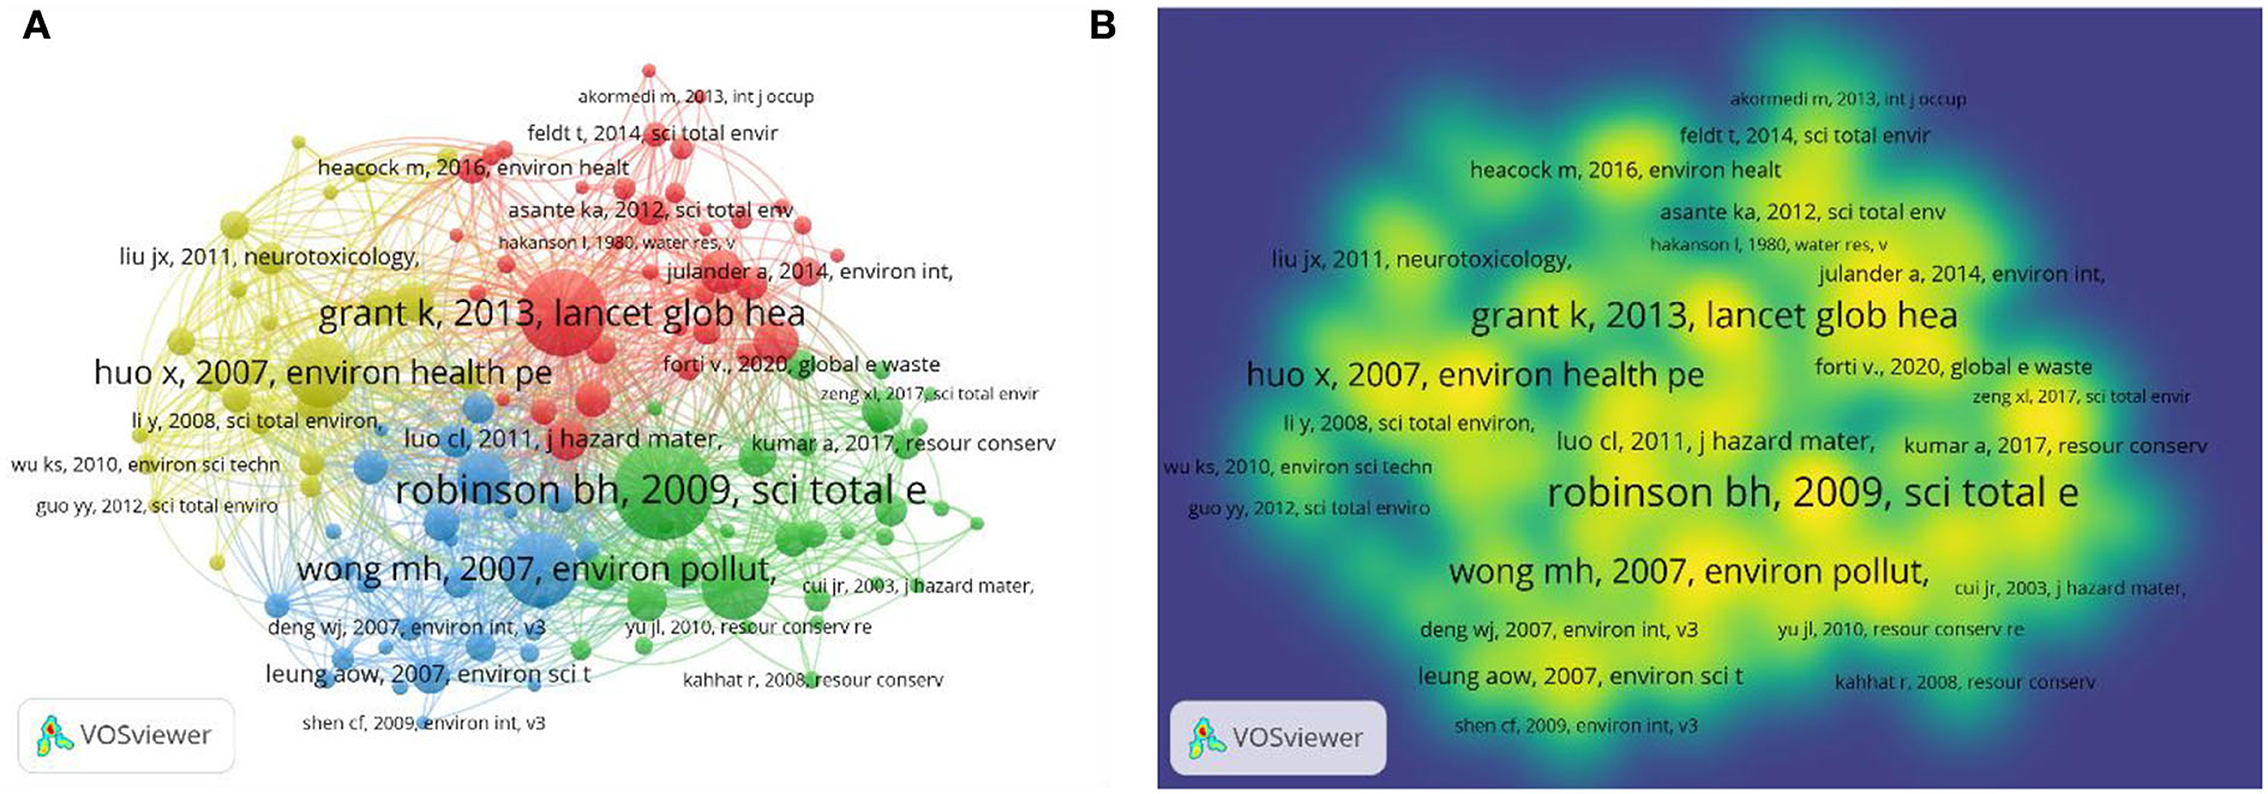
Figure 7. (A) Co-citation network map between references with over 20 citations; (B) Co-citation density map between references with over 20 citations.
Author analysis
A total of 2,474 writers−32 writers of single-authored publications and 2,442 writers of multiple-authored publications—produced these 652 documents. There were 32 single-authored documents. The mean number of co-authors per paper is 5.48. Huo X was the most productive author with 45 publications, accounting for 6.90% of the total, followed by Xu XJ with 40 publications (6.13%), and then Fobil JN (n = 20, 3.07%; Supplementary Figure 3A). Meanwhile, Huo X and Xu XJ were the authors with the highest h-index (h index = 23; Table 6). Authors with higher productivity and a higher h-index held more prominence in the area. Sixteen authors had written more than 10 pieces, while three authors had written more than 20. In Figure 8, the number of articles was represented by the size of the dots, and the overall number of citations each year was represented by the gradation of the color of the dots. Huo X and Xu XJ maintained a steady tendency. Fobil JN, Basu N, and An TC were more active in publishing in the last 3 years.
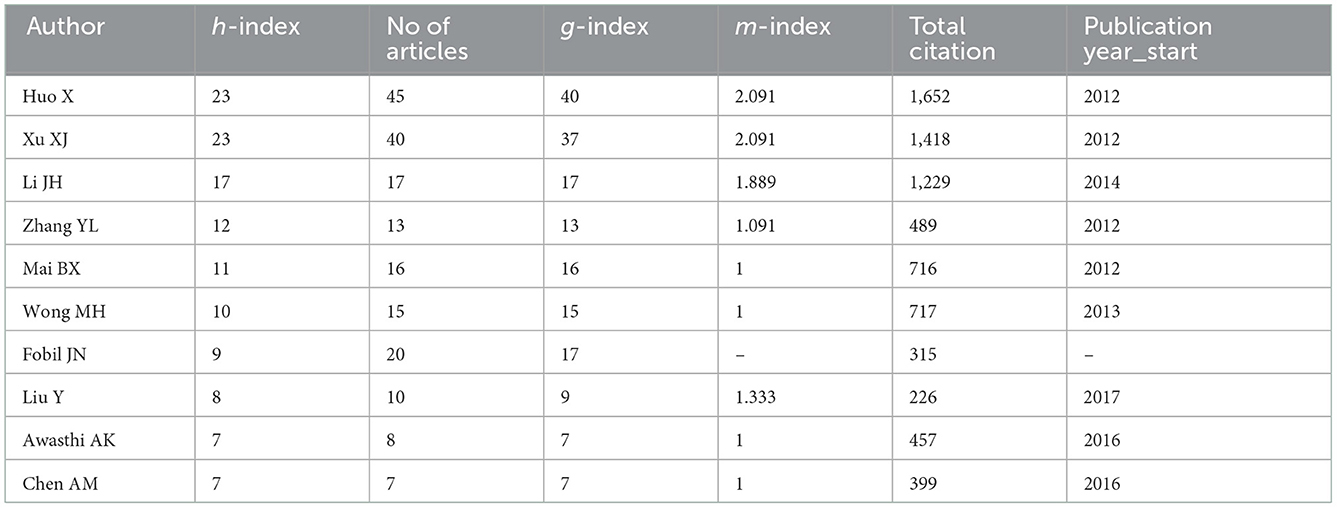
Table 6. Top 10 contributing authors in this area.
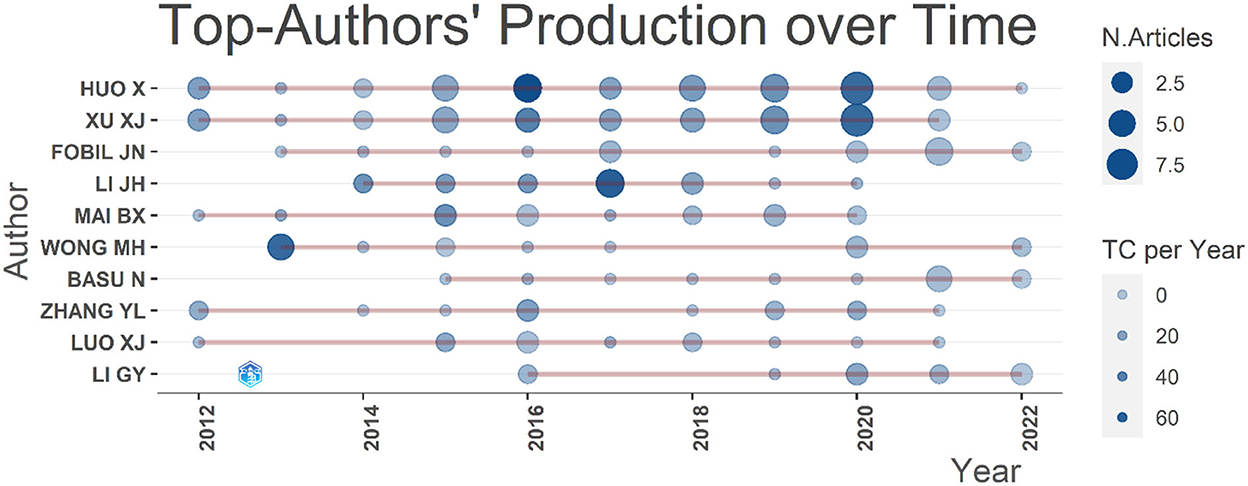
Figure 8. Top authors' production over time.
According to the h-index (Table 6), Huo X and Xu XJ ranked the first (h-index = 23), Li JH ranked second (17), Zhang YL (12) ranked third, Mai BX (11) ranked fourth, followed by Wong MH (10). The top five authors are listed in Supplementary Figure 3B in order of the number of citations their articles received. Huo X ranked first with 1,652 citations, followed by Xu XJ (1418 citations), Li JH (1,229 citations), Sly PD (856 citations), and Wong MH (717 citations). Among the most productive authors, six had an h-index above 10. The m-index, which takes various seniorities of scientists into consideration, corrects the h-index through time and aids in the identification of successful researchers (25, 26). Huo X and Xu XJ had the highest m-index at 2.091, followed by Arya S, Bilal M, and Liu H (m-index = 2.000), Li, JH (1.889), Ma ST and Yu YX (1.500), and Liu Y (1.333; Supplementary Figure 3C). We examined 56 researchers who had published over five articles. A higher g-index indicates a higher citation rate. Huo X (g-index = 40) had the highest g-index, followed by Xu XJ (37), Li JH, and Fobil JN (17), as shown in Supplementary Figure 3D. Huo X (total link strength = 112), Xu XJ (99), and Zhang YL (43) were the top three researchers with the greatest total link strength.
Keywords analysis
VOSviewer and Bibliometrix examined 266 terms with over five appearances, and we excluded the search terms “e-waste” and “electronic waste.” We divided the entire co-occurrence network into various groups using VOSviewer's grouping feature. Stronger, relevant keywords were more likely to be clustered with the same hues. These chosen keywords were categorized into four groups, as seen in the network visualization graph (Figure 9A). In addition, the hue of the superimposed visual map shows the average publication year of these keywords (Figure 9B). If the keyword appeared averagely later, the hue is closer to yellow. To find the topic of the current research, the keywords with the highest frequencies in the most publications were displayed on the graph of keyword density (Figure 9C). When the keywords occur in more publications, the hue is closer to yellow. “Polybrominated diphenyl ethers” (n = 129), “heavy metals” (n = 123), “exposure” (n = 101), “China” (n = 90), “management” (n = 70), and so on were the most used keywords. Over time, the focus of the research field shifted from the relationship between ambient air, chemicals, particles, and lifecycle assessment to the health and circular economy implications of heavy metal exposure and accumulation due to e-waste (Figure 10).
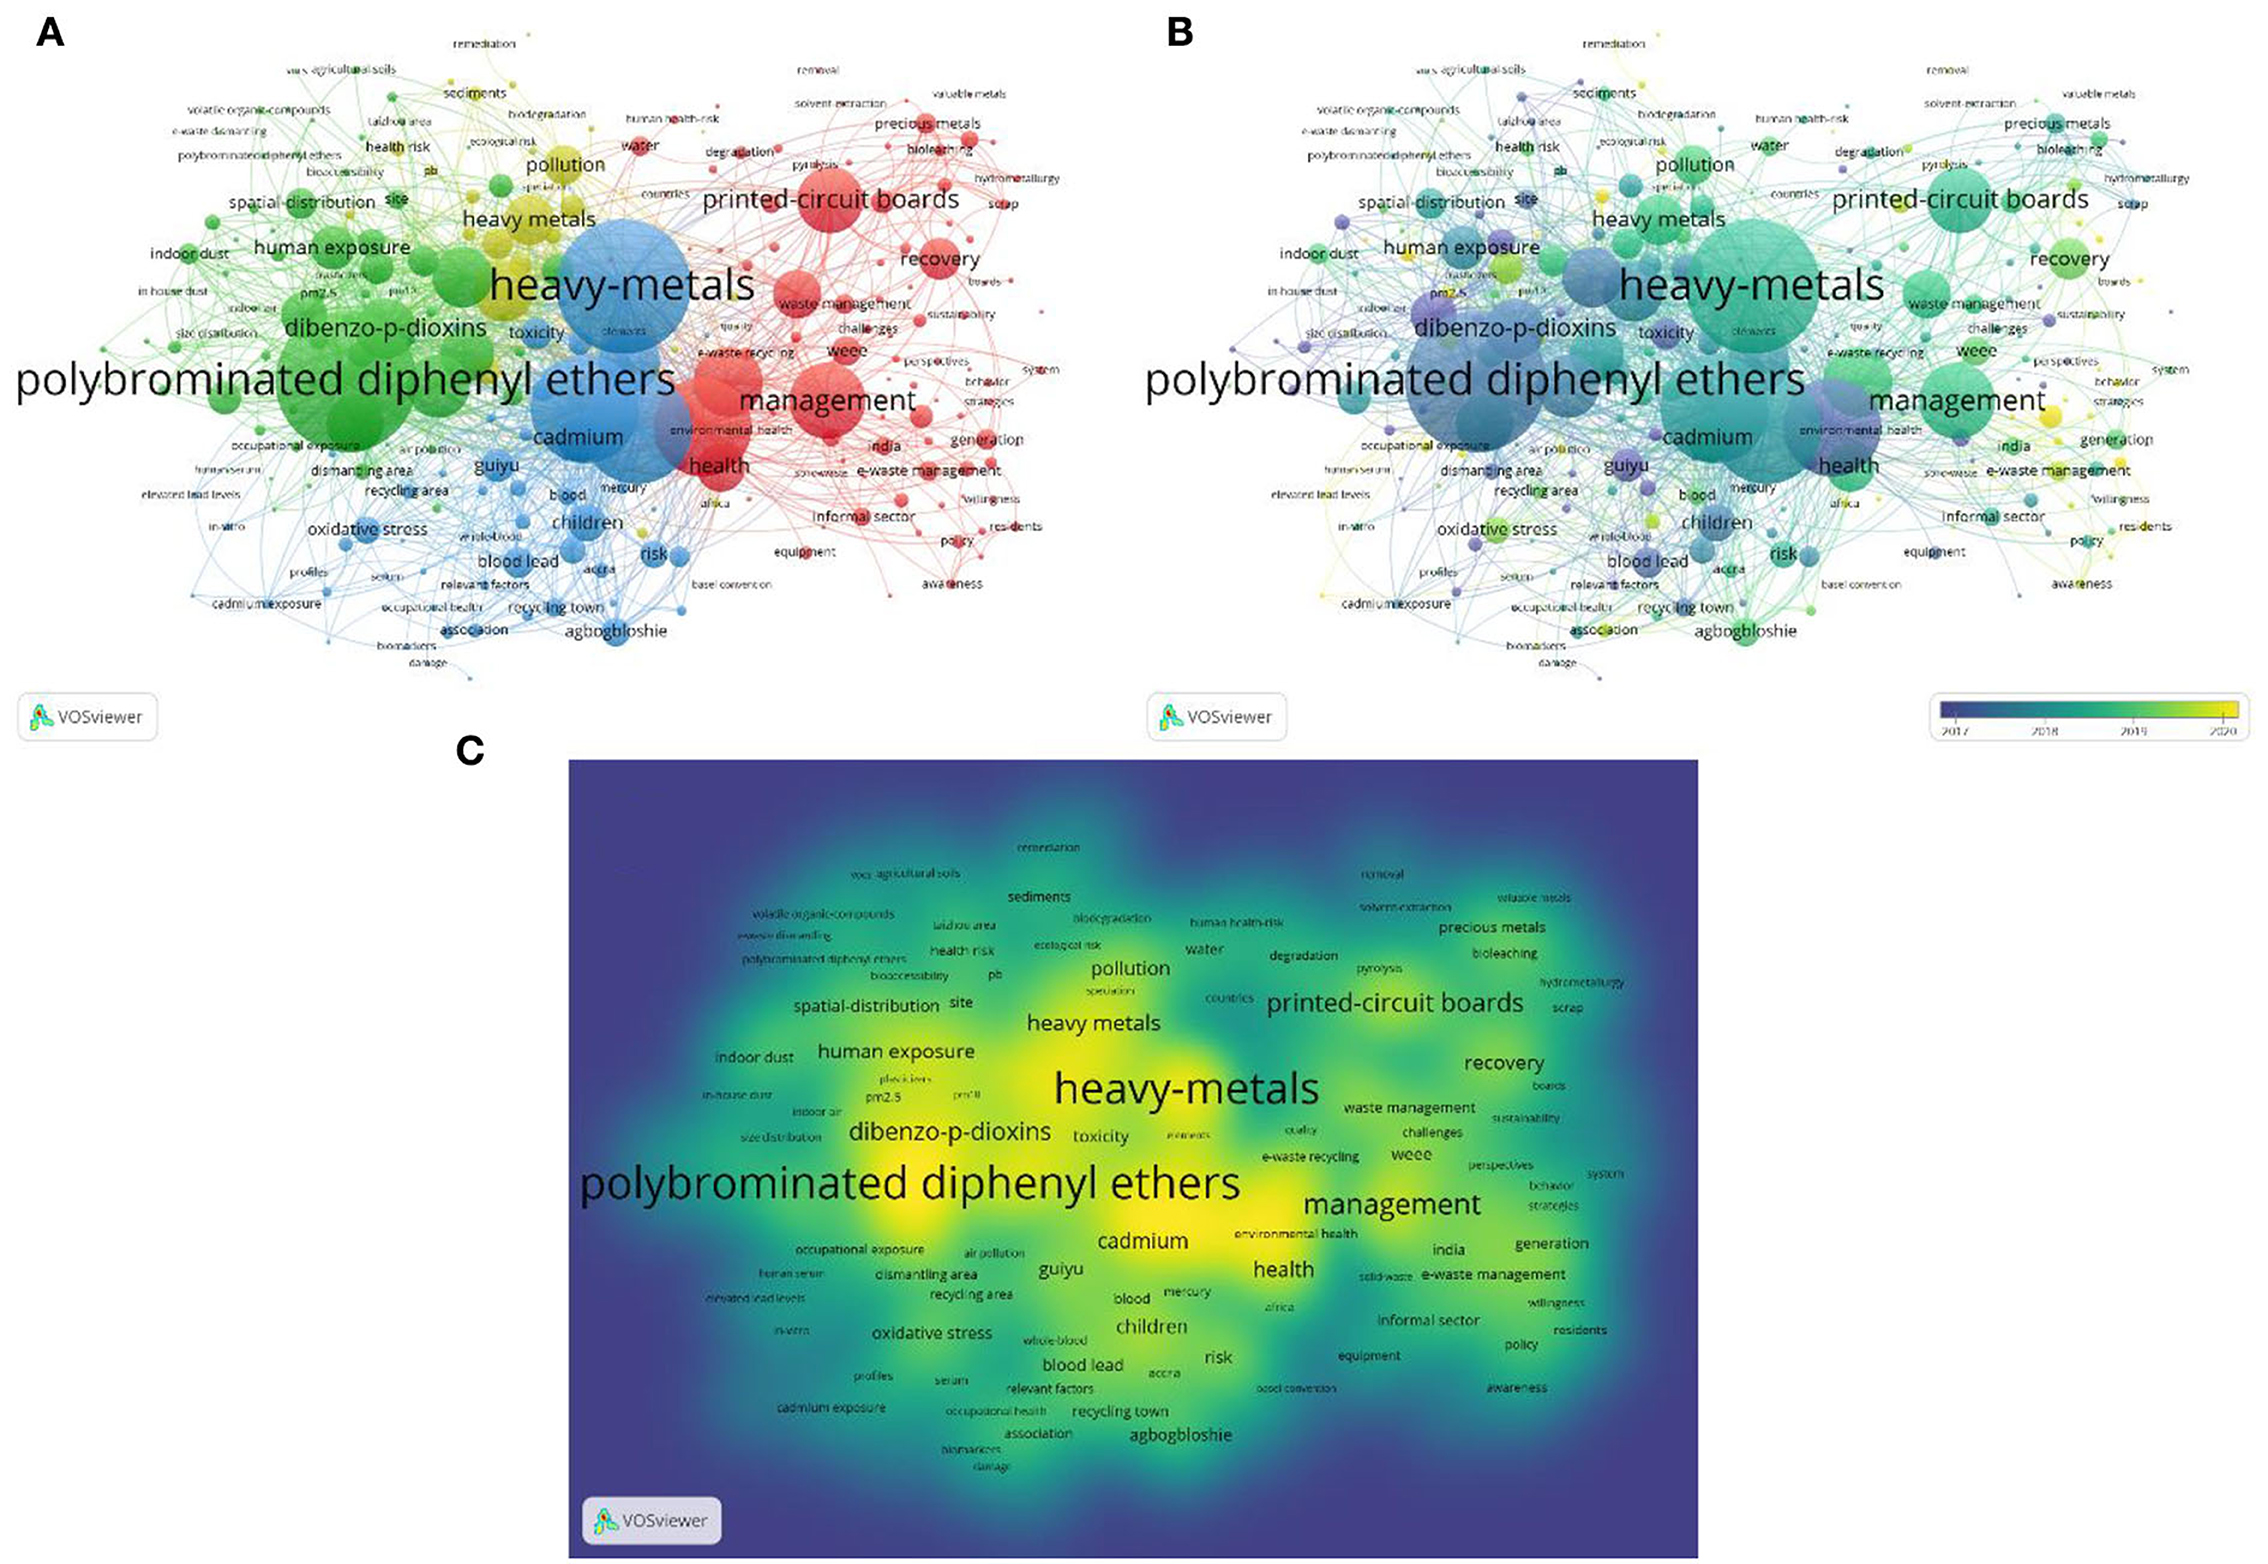
Figure 9. (A) Keywords network map with over five occurrences; (B) Keywords overlay map with over five occurrences; (C) Keywords density map with over five occurrences.
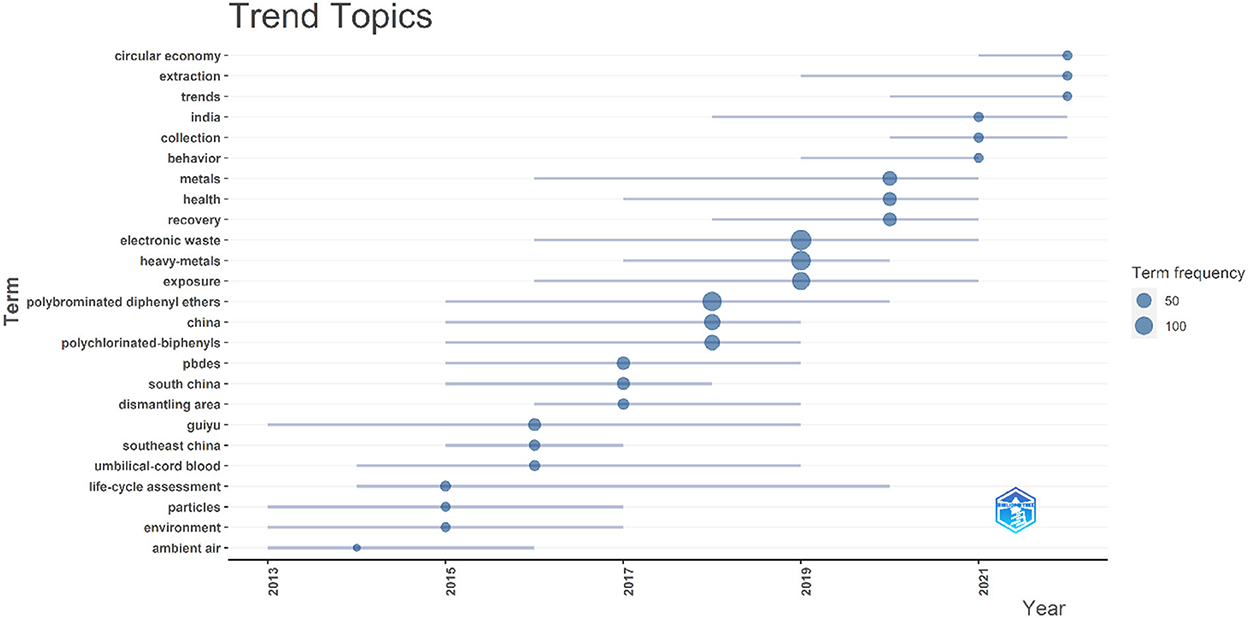
Figure 10. Map showing the trending topics across years.
Discussion
Using Bibliometrix, VOSviewer, and CiteSpace, this paper presented a scientometric analysis of the production of e-waste and health-related publications from 2012 to 2022. At the time of the search, there were 652 pieces of literature on this subject. The number of related publications increased between 2012 and 2021, and the annual growth rate was 23.74%, with the largest growth rate occurring in 2012 (113.33%). There was a general growth trend in publications and total citations, indicating an overall increase in interest in this research area. The growth rate of articles decreased in 2020 (2.22%). Although there was a slight decrease in 2020, the growth rate rose again in 2021 (10.87%). Up until our search, the number of publications in 2022 was 94. Considering the number of publications and total citations in 2021 (102, 4,715) and the general growth trend, we presumed that the number of productions and total citations would continue to rise in 2022.
China, the United States, and India were the largest contributors in this area and were the epicenter of this research. China was in first place, far ahead of other countries, with 288 articles and a total citation of 9,736, while the United States and India had 116 and 72 articles, with total citations of 3,353 and 1,833, respectively, which shows that, although China is a developing country, it pursues sustainable development and also pays attention to its people's health and ecological balance. The country collaboration map shows that the cooperation among countries was also close, forming a research network centered on China. The top three organizations contributing to this field were the Chinese Academy of Sciences, Shantou University, and Tsinghua University. The total number of citations was more than 1,000, indicating that these three organizations had leading roles in this field and strong connections with other organizations, as measured by their link strength of 376. The top three high-impact journals in this field were “Science of the Total Environment,” “Environment International,” and “Environmental Pollution,” which had a total citation count of over 1,000 and an h-index of over 18, indicating that the articles published in these three journals are more influential in this field, worthy of attention, and suitable for reference.
In addition, 50% of the top 10 most cited papers worldwide were published between 2015 and 2019. These ten papers have one thing in common: they all assert that e-waste contains a variety of toxic substances that are harmful to human health, investigate the nature of these substances, and examine potential solutions from multiple perspectives, demonstrating a fundamental understanding of this topic. Toxic substances mainly include dioxin-like compounds (DLCs), polybrominated biphenyl ethers (PBDEs), polychlorinated biphenyls (PCBs), PM2.5, lead (Pb), cobalt (Co), copper (Cu), nickel (Ni), thallium (Ti), and silver (Ag), hydrargyrum (Hg), cadmium (Cd), mercury (Hg), and arsenic (As), high-technology rare earth elements (REEs) of anthropogenic origin, the gases produced (dioxins, furans, polybrominated organic pollutants, and polycyclic aromatic hydrocarbons) by thermal treatments, and brominated flame retardants (BFRs), among others (1, 2, 4–6, 10, 14, 35–39). The study by Tansel et al. indicates that poly- and perfluorinated alkyl substances (PFAS) in e-waste may be a substance that affects human health; however, further study is needed to confirm it. There is a need for better surveillance of e-waste disposal sites, and detailed epidemiological studies of high-risk populations can be undertaken to assess the potential health risks posed by exposure to PFAS at these sites (40).
The following steps can be taken to avoid electronic waste that can be harmful to human health: (1) Prevent the generation of electronic pollutants at the source, identify what hazardous substances are in e-waste sources, their environmental behavior, and their public and ecological health risks, and identify environmentally friendly materials to replace those materials producing hazardous substances; (2) prevent electronic products from turning into electronic pollution by following an intermediate steps: enhance the recycling rate and its management mechanism, improve the life of electronic products, raise people's awareness of sustainability through education, and reduce the generation of electronic pollution; (3) develop a series of pollution treatment mechanisms after the generation of e-waste, such as effective e-waste disposal methods, ecologically responsible management, and routine monitoringv (13, 41–43). Several methods have been built to manage e-waste, including life cycle assessment (LCA), material flow analysis (MFA), multi-criteria analysis (MCA), and extended producer responsibility (EPR). The keys to success in e-waste management are the development of ecologically designed equipment, proper collection of e-waste, recycling of materials by safe methods, disposal of e-waste with appropriate technologies, prohibition of transfer of used and end-of-life electronic equipment to developing countries, and raising awareness of the impacts of e-waste (7, 43–46). The study by Kang et al. used standardized leaching procedures, life cycle impact assessment (LCIA), and hazard evaluation systems to analyze the potential toxicity, potential resource depletion, and hazardous waste categories of electronic products to reduce potential hazards to human health (5). The studies by Kaya et al. and Perkins et al. mentioned that e-waste recycling would become an important industry soon and become an economically and environmentally significant industry. Their aims were to turn today's waste into tomorrow's conflict-free, sustainable polymetallic secondary resource, which requires e-waste to be handled in ecologically responsible, safe, and standardized ways with good efficiency and low carbon emission (6, 47). In addition to the aforementioned entry points, there were others, including the need to integrate e-waste into urban planning efforts through phytoremediation (48, 49).
There are relatively mature physical separation processes, such as gravity, electrostatics, magnetic separators, flotation, and so on, to physically separate and recover metals from e-waste through pyrometallurgy, hydrometallurgy, or biohydrometallurgy. Cyanide or non-cyanide leaching methods of hydrometallurgy are effective methods for recovering precious metals efficiently using non-metallic materials (1, 6, 28, 50). In addition, plasma technology and pyrolysis treatment were applied to handling e-waste (51–53). According to the search, no environmentally friendly electronic materials have yet been found, which can be used as a starting point for further research to find substances that can be recycled in an environmentally friendly manner. Then, we believe that health education and policies are still lacking. We can start by increasing the effectiveness of education and expanding the popularity of environmental protection policies, allocating more government funds for the management and treatment of electronic pollution, centralizing end-of-life processing, improving the electronic product recycling rate, and reducing the generation of e-waste (54, 55).
In the author analysis, Huo X and Xu XJ had the highest number of publications (45, 40) and h-index (23, 23). The consistency and magnitude of their contributions over time indicate that they have always paid attention to this field of research. The keywords “polybrominated diphenyl ethers,” “heavy metals,” “exposure,” and “management” are frequently used in the study. Meanwhile, over time, the focus of the research field shifted to the health and circular economy implications of heavy metal exposure and accumulation due to e-waste. It indicates that the research hotspot should include e-waste, heavy metal exposure, and the corresponding management. Future research directions may include the exposure probability of occupational and non-occupational groups, the exposure probability and degree of different occupational groups, the application of nanomaterials and other emerging materials to replace heavy metal materials in electronic products, and the development of environmentally friendly and effective recycling methods for electronic pollutants (56). There has been an increase in the attention paid to biohydrometallurgy because the main advantages of biohydrometallurgy compared to other methods include low operating and maintenance costs, a low energy input, the use of natural resources such as air and water, a low environmental impact, and operation at ambient temperature and pressure, which is more in line with the principles of the circular economy (57). The study by Khalid et al. (37) revealed that several microorganisms can bio-transform or mineralize PCBs under aerobic or anaerobic conditions.
However, this analysis has some drawbacks. First, only the WoS database was used for the search. It would have been preferable to incorporate these findings with those from additional databases; WoS was the most widely used database in scientometrics, and the majority of bibliometric tools can recognize the formats of files exported from WoS. Second, we restricted the inclusion criteria to English-language studies of WoS. Then, to better display the keywords, the keywords that appeared more than five times in the network were considered. Due to the occurrence of fewer than five appearances of relevant keywords that first occurred in recent years, such as volatile organic compounds and biomarkers, we might have missed the most recent study trends.
Conclusion
This study explored the progress of research on the relationship between e-waste and health by using a quantitative scientometric analysis. We believe that the results of this study will help professionals identify patterns and trends, although it may not accurately represent the micro aspects of these results. Based on the results from the scientometric analysis, the center country of the research field was China. The most active journal was “Science of the Total Environment,” and the most active authors were Huo X and Xu XJ. According to citations, co-citations, and keyword analysis, the current research focus might shift to the health and circular economy implications of exposure to heavy metals, polychlorinated biphenyls (PCBs), polybrominated biphenyl ethers (PBDEs), and poly- and perfluorinated alkyl substances (PFAS), and relevant managements, such as exploring new environmentally friendly and recycling methods of e-waste and developing relatively mature approaches, such as hydrometallurgy and more. This paper identified trends in electronics and health and provided researchers with some highly cited references and potential research directions that are instructive for the field of public health. This study can also help researchers and decision-makers in the e-waste research field better understand the research directions and make scientific choices.
Equations
n, the number of publications in year x or y.
Data availability statement
The raw data supporting the conclusions of this article will be made available by the authors, without undue reservation.
Author contributions
HT: idea conception and design and original draft writing. JW, DZ, and QY: data collection and methodology. HT and LC: data processing and visualization by software. LC, ZJ, and JC: supervision and amendment. YC and ZL: funding acquisition, resource allocation, and project administration. All authors contributed to the article and approved the submitted version.
Funding
This research was funded by the Special Fund Project of Guangdong Science and Technology (grant numbers 210728156901524 and 210728156901519), the Medical Scientific Research Foundation of Guangdong Province, China (grant number A2021432), the Shantou Medical Science and Technology Planning Project (grant numbers 210521236491457, 210625106490696, 220518116490772, and 220518116490933), and the Administration of Traditional Chinese Medicine of Guangdong Province project (grant number 202205092315428030).
Acknowledgments
All the authors appreciate the people who helped with software usage, data collection, and article revision.
Conflict of interest
The authors declare that the research was conducted in the absence of any commercial or financial relationships that could be construed as a potential conflict of interest.
Publisher's note
All claims expressed in this article are solely those of the authors and do not necessarily represent those of their affiliated organizations, or those of the publisher, the editors and the reviewers. Any product that may be evaluated in this article, or claim that may be made by its manufacturer, is not guaranteed or endorsed by the publisher.
Supplementary material
The Supplementary Material for this article can be found online at: https://www.frontiersin.org/articles/10.3389/fpubh.2022.1069172/full#supplementary-material
Abbreviations
e-waste, electronic waste; EoL, end-of-life; BFRs, brominated flame retardants; WoS, web of science; PCBs, polychlorinated biphenyls; PBDEs, polybrominated biphenyl ethers; PFAS, poly- and perfluorinated alkyl substances; DLCs, dioxin-like compounds; Pb, lead; Co, cobalt; Cu, copper; Ni, nickel; Ti, thallium; Ag, silver; Hg, hydrargyrum; Cd, cadmium; Hg, mercury; As, arsenic; REEs, high-technology rare earth elements; ID, keywords plus; DE, author's keywords.
References
1. Akcil A, Erust C, Gahan CS, Ozgun M, Sahin M, Tuncuk A. Precious metal recovery from waste printed circuit boards using cyanide and non-cyanide lixiviants – a review. Waste Manag. (2015) 45:258–71. doi: 10.1016/j.wasman.2015.01.017
2. Coman V, Robotin B, Ilea P. Nickel recovery/removal from industrial wastes: a review. Resour Conserv Recycl. (2013) 73:229–38. doi: 10.1016/j.resconrec.2013.01.019
3. Dai Q, Xu X, Eskenazi B, Asante KA, Chen A, Fobil J, et al. Severe dioxin-like compound (DLC) contamination in e-waste recycling areas: an under-recognized threat to local health. Environ Int. (2020) 139:105731. doi: 10.1016/j.envint.2020.105731
4. Houessionon MGK, Ouendo E-MD, Bouland C, Takyi SA, Kedote NM, Fayomi B, et al. Environmental heavy metal contamination from electronic waste (E-waste) recycling activities worldwide: a systematic review from 2005 to 2017. Int J Environ Res Public Health. (2021) 18:3517. doi: 10.3390/ijerph18073517
5. Kang DHP, Chen M, Ogunseitan OA. Potential environmental and human health impacts of rechargeable lithium batteries in electronic waste. Environ Sci Technol. (2013) 47:5495–503. doi: 10.1021/es400614y
6. Kaya M. Recovery of metals and nonmetals from electronic waste by physical and chemical recycling processes. Waste Manag. (2016) 57:64–90. doi: 10.1016/j.wasman.2016.08.004
7. Kiddee P, Naidu R, Wong MH. Electronic waste management approaches: an overview. Waste Management. (2013) 33:1237–50. doi: 10.1016/j.wasman.2013.01.006
8. Sepúlveda A, Schluep M, Renaud FG, Streicher M, Kuehr R, Hagelüken C, et al. A review of the environmental fate and effects of hazardous substances released from electrical and electronic equipments during recycling: examples from China and India. Environ Impact Assess Rev. (2010) 30:28–41. doi: 10.1016/j.eiar.2009.04.001
9. Huo X, Zheng XB, Liu Q, Zhang T, Wang QH, Xu XJ. Impact of informal e-waste recycling on human health. Zhonghua Yu Fang Yi Xue Za Zhi. (2019) 53:426–32. doi: 10.3760/cma.j.issn.0253-9624.2019.04.020
10. Zeng X, Huo X, Xu X, Liu D, Wu W. E-waste lead exposure and children's health in China. Sci Total Environ. (2020) 734:139286. doi: 10.1016/j.scitotenv.2020.139286
11. Akram R, Natasha, Fahad S, Hashmi MZ, Wahid A, Adnan M, et al. Trends of electronic waste pollution and its impact on the global environment and ecosystem. Environ Sci Pollut Res. (2019) 26:16923–38. doi: 10.1007/s11356-019-04998-2
12. Alabi OA, Adeoluwa YM, Huo X, Xu X, Bakare AA. Environmental contamination and public health effects of electronic waste: an overview. J Environ Health Sci Eng. (2021) 19:1209–27. doi: 10.1007/s40201-021-00654-5
13. Alblooshi BGKM, Ahmad SZ, Hussain M, Singh SK. Sustainable management of electronic waste: empirical evidences from a stakeholders' perspective. Bus Strateg Environ. (2022) 31:1856–74. doi: 10.1002/bse.2987
14. Gwenzi W, Mangori L, Danha C, Chaukura N, Dunjana N, Sanganyado E. Sources, behaviour, and environmental and human health risks of high-technology rare earth elements as emerging contaminants. Sci Total Environ. (2018) 636:299–313. doi: 10.1016/j.scitotenv.2018.04.235
15. Grant K, Goldizen FC, Sly PD, Brune M-N, Neira M, van den Berg M, et al. Health consequences of exposure to e-waste: a systematic review. Glob Health. (2013) 1:e350–61. doi: 10.1016/S2214-109X(13)70101-3
16. Issah I, Arko-Mensah J, Agyekum TP, Dwomoh D, Fobil JN. Electronic waste exposure and DNA damage: a systematic review and meta-analysis. Rev Environ Health. (2021). doi: 10.1515/reveh-2021-0074
17. Huang W, Shi X, Wu K. Human body burden of heavy metals and health consequences of Pb exposure in Guiyu, an E-waste recycling town in China. Int J Environ Res Public Health. (2021) 18:12428. doi: 10.3390/ijerph182312428
18. Ackah M. Soil elemental concentrations, geoaccumulation index, non-carcinogenic and carcinogenic risks in functional areas of an informal e-waste recycling area in Accra, Ghana. Chemosphere. (2019) 235:908–17. doi: 10.1016/j.chemosphere.2019.07.014
19. Al-Harbi M, Alhajri I, Whalen JK. Characteristics and health risk assessment of heavy metal contamination from dust collected on household HVAC air filters. Chemosphere. (2021) 277:130276. doi: 10.1016/j.chemosphere.2021.130276
20. Rodríguez-Soler R, Uribe-Toril J, De Pablo Valenciano J. Worldwide trends in the scientific production on rural depopulation, a bibliometric analysis using bibliometrix R-tool. Land Use Policy. (2020) 97:104787. doi: 10.1016/j.landusepol.2020.104787
21. Xu H, Li Y, Tan Y, Deng N. A scientometric review of urban disaster resilience research. Int J Environ Res Public Health. (2021) 18:3677. doi: 10.3390/ijerph18073677
22. Oyewola DO, Dada EG. Exploring machine learning: a scientometrics approach using bibliometrix and VOSviewer. SN Appl Sci. (2022) 4:143. doi: 10.1007/s42452-022-05027-7
23. Zhuang QD, Hussein MK, Ariffin NFM, Yunos MYM. Landscape character: a knowledge mapping analysis using CiteSpace. Int J Environ Sci Technol. (2022). doi: 10.1007/s13762-022-04279-5
24. Ali J, Jusoh A, Idris N, Airij AG, Chandio R. Wearable devices in healthcare services. Bibliometrix analysis by using R package. Int J Onl Eng. (2022) 18:61–86. doi: 10.3991/ijoe.v18i08.31785
25. Hirsch JE. An index to quantify an individual's scientific research output. Proc Natl Acad Sci USA. (2005) 102:16569–72. doi: 10.1073/pnas.0507655102
26. Würtz M, Schmidt M. The stratified H-index makes scientific impact transparent. Ugeskr Laeger. (2017) 179:V12160886.
27. Guo Y, Zhong M, Fang Z, Wan P, Yu G. A wearable transient pressure sensor made with MXene nanosheets for sensitive broad-range human-machine interfacing. Nano Lett. (2019) 19:1143–50. doi: 10.1021/acs.nanolett.8b04514
28. Ghosh B, Ghosh MK, Parhi P, Mukherjee PS, Mishra BK. Waste printed circuit boards recycling: an extensive assessment of current status. J Clean Prod. (2015) 94:5–19. doi: 10.1016/j.jclepro.2015.02.024
29. Robinson BH. E-waste: an assessment of global production and environmental impacts. Sci Total Environ. (2009) 408:183–91. doi: 10.1016/j.scitotenv.2009.09.044
30. Wong MH, Wu SC, Deng WJ Yu XZ, Luo Q, Leung AOW, et al. Export of toxic chemicals – a review of the case of uncontrolled electronic-waste recycling. Environ Pollut. (2007) 149:131–40. doi: 10.1016/j.envpol.2007.01.044
31. Huo X, Peng L, Xu X, Zheng L, Qiu B, Qi Z, et al. Elevated blood lead levels of children in Guiyu, an electronic waste recycling town in China. Environ Health Perspect. (2007) 115:1113–7. doi: 10.1289/ehp.9697
32. Widmer R, Oswald-Krapf H, Sinha-Khetriwal D, Schnellmann M, Böni H. Global perspectives on e-waste. Environ Impact Assess Rev. (2005) 25:436–58. doi: 10.1016/j.eiar.2005.04.001
33. Balde CP, Forti V, Gray V, Kuehr R, Stegmann P. The Global E-Waste Monitor 2017: Quantities, Flows, and Resources. (2017). Available online at: http://www.researchgate.net/publication/321797215_The_Global_E-waste_Monitor_2017_Quantities_Flows_and_Resources
34. Srigboh RK, Basu N, Stephens J, Asampong E, Perkins M, Neitzel RL, et al. Multiple elemental exposures amongst workers at the agbogbloshie electronic waste (e-waste) site in Ghana. Chemosphere. (2016) 164:68–74. doi: 10.1016/j.chemosphere.2016.08.089
35. Cai K, Song Q, Yuan W, Ruan J, Duan H, Li Y, et al. Human exposure to PBDEs in e-waste areas: a review. Environ Pollut. (2020) 267:115634. doi: 10.1016/j.envpol.2020.115634
36. Hashmi MZ, Chen K, Khalid F, Yu C, Tang X, Li A, et al. Forty years studies on polychlorinated biphenyls pollution, food safety, health risk, and human health in an e-waste recycling area from Taizhou city, China: a review. Environ Sci Pollut Res. (2022) 29:4991–5005. doi: 10.1007/s11356-021-17516-0
37. Khalid F, Hashmi MZ, Jamil N, Qadir A, Ali MI. Microbial and enzymatic degradation of PCBs from e-waste-contaminated sites: a review. Environ Sci Pollut Res Int. (2021) 28:10474–87. doi: 10.1007/s11356-020-11996-2
38. Almeida C, Grosselli M, Gonzalez P, Martinez D, Gil R. Batch leaching tests of motherboards to assess environmental contamination by bromine, platinum group elements and other selected heavy metals. Chemosphere. (2016) 144:1–6. doi: 10.1016/j.chemosphere.2015.08.035
39. Anh HQ, Nam VD, Tri TM, Ha NM, Ngoc NT, Mai PTN, et al. Polybrominated diphenyl ethers in plastic products, indoor dust, sediment and fish from informal e-waste recycling sites in Vietnam: a comprehensive assessment of contamination, accumulation pattern, emissions, and human exposure. Environ Geochem Health. (2017) 39:935–54. doi: 10.1007/s10653-016-9865-6
40. Tansel B. PFAS use in electronic products and exposure risks during handling and processing of e-waste: a review. J Environ Manage. (2022) 316:115291. doi: 10.1016/j.jenvman.2022.115291
41. Awasthi AK, Wang M, Awasthi MK, Wang Z, Li J. Environmental pollution and human body burden from improper recycling of e-waste in China: a short-review. Environmental Pollution. (2018) 243:1310–6. doi: 10.1016/j.envpol.2018.08.037
42. Almasi A, Mohammadi M, Azizi A, Berizi Z, Shamsi K, Shahbazi A, et al. Assessing the knowledge, attitude and practice of the kermanshahi women towards reducing, recycling and reusing of municipal solid waste. Resour Conserv Recycl. (2019) 141:329–38. doi: 10.1016/j.resconrec.2018.10.017
43. Almulhim AI. Household's awareness and participation in sustainable electronic waste management practices in Saudi Arabia. Ain Shams Eng J. (2022) 13:101729. doi: 10.1016/j.asej.2022.101729
44. Islam MT, Huda N. Material flow analysis (MFA) as a strategic tool in E-waste management: applications, trends and future directions. J Environ Manage. (2019) 244:344–61. doi: 10.1016/j.jenvman.2019.05.062
45. Alcantara-Concepcion V, Gavilan-Garcia A, Gavilan-Garcia IC. Environmental impacts at the end of life of computers and their management alternatives in Mexico. J Clean Prod. (2016) 131:615–28. doi: 10.1016/j.jclepro.2016.04.125
46. Arya S, Kumar S. E-waste in India at a glance: current trends, regulations, challenges and management strategies. J Clean Prod. (2020) 271:122707. doi: 10.1016/j.jclepro.2020.122707
47. Perkins DN, Drisse M-NB, Nxele T, Sly PD. E-waste: a global hazard. Ann Glob Health. (2014) 80:286–95. doi: 10.1016/j.aogh.2014.10.001
48. Asibey MO, King RS, Lykke AM, Inkoom DKB. Urban planning trends on e-waste management in Ghanaian cities. Cities. (2021) 108:102943. doi: 10.1016/j.cities.2020.102943
49. Arya S, Rautela R, Chavan D, Kumar S. Evaluation of soil contamination due to crude E-waste recycling activities in the capital city of India. Process Saf Environ Protect. (2021) 152:641–53. doi: 10.1016/j.psep.2021.07.001
50. Thakur P, Kumar S. Metallurgical processes unveil the unexplored “sleeping mines” e-waste: a review. Environ Sci Pollut Res. (2020) 27:32359–70. doi: 10.1007/s11356-020-09405-9
51. Joo J, Kwon EE, Lee J. Achievements in pyrolysis process in E-waste management sector. Environ Pollut. (2021) 287:117621. doi: 10.1016/j.envpol.2021.117621
52. Sanito RC, You S-J, Wang Y-F. Application of plasma technology for treating e-waste: a review. J Environ Manage. (2021) 288:112380. doi: 10.1016/j.jenvman.2021.112380
53. Anguiano M, Lopez CE, Luevanos MP, Balagurusamy N. Bioleaching: an innovative biotechnology for recovery of metals from electronic wastes. Chim Oggi-Chem Today. (2018) 36:33–6.
54. Chen D, Faibil D, Agyemang M. Evaluating critical barriers and pathways to implementation of e-waste formalization management systems in Ghana: a hybrid BWM and fuzzy TOPSIS approach. Environ Sci Pollut Res. (2020) 27:44561–84. doi: 10.1007/s11356-020-10360-8
55. Patil RA, Ramakrishna S. A comprehensive analysis of e-waste legislation worldwide. Environ Sci Pollut Res. (2020) 27:14412–31. doi: 10.1007/s11356-020-07992-1
56. Arain AL, Neitzel RL. A review of biomarkers used for assessing human exposure to metals from E-waste. Int J Environ Res Public Health. (2019) 16:1802. doi: 10.3390/ijerph16101802
Keywords: electronic waste (e-waste), health, environment, scientometric, bibliometrix, VOSviewer
Citation: Tian H, Chen L, Wu J, Zheng D, Yang Q, Ji Z, Cai J, Chen Y and Li Z (2023) Global research into the relationship between electronic waste and health over the last 10 years: A scientometric analysis. Front. Public Health 10:1069172. doi: 10.3389/fpubh.2022.1069172
Received: 13 October 2022; Accepted: 25 November 2022;
Published: 04 January 2023.
Edited by:
Mohsen Saeedi, University Canada West, CanadaReviewed by:
Magdalena Regel-Rosocka, Poznań University of Technology, PolandSabah M. Abdelbasir, Central Metallurgical Research and Development Institute (CMRDI), Egypt
Copyright © 2023 Tian, Chen, Wu, Zheng, Yang, Ji, Cai, Chen and Li. This is an open-access article distributed under the terms of the Creative Commons Attribution License (CC BY). The use, distribution or reproduction in other forums is permitted, provided the original author(s) and the copyright owner(s) are credited and that the original publication in this journal is cited, in accordance with accepted academic practice. No use, distribution or reproduction is permitted which does not comply with these terms.
*Correspondence: Zhiyang Li,  s_zyli4@stu.edu.cn