 Xingyuan Chen
 John M. Zachara
 Yilin Fang
- Pacific Northwest National Laboratory, Richland, WA, United States
The behavior of a persistent uranium plume within an extended river corridor at the DOE Hanford site is dominantly controlled by river stage fluctuations in the adjacent Columbia River. The plume behavior is further complicated by substantial heterogeneity in physical and geochemical properties of the host aquifer sediments. Multi-scale field and laboratory experiments and reactive transport modeling were integrated to understand the complex plume behavior influenced by highly variable hydrologic and geochemical conditions in time and space. In this paper, we (1) describe multiple data sets from field-scale uranium adsorption and desorption experiments performed at our experimental well-field, (2) develop a reactive transport model that incorporates hydrologic and geochemical heterogeneities characterized from multi-scale and multi-type datasets and a surface complexation reaction network based on laboratory studies, and (3) compare the modeling and observation results to provide insights on how to refine the conceptual model and reduce prediction uncertainties. The experimental results revealed significant spatial variability in uranium adsorption/desorption behavior, while modeling demonstrated that ambient hydrologic and geochemical conditions and heterogeneities in sediment physical and chemical properties both contributed to complex plume behavior and its persistence. This research underscores the great challenges in adequately characterizing this type of site to model the reactive transport processes over scales of 10 m or more. Our analysis provides important insights into the characterization, understanding, modeling, and remediation of groundwater contaminant plumes influenced by dynamic surface water and groundwater interactions.
1. Introduction
The dynamic interactions between groundwater and river water (GW-RW) plays an important role in the hydrologic and biogeochemical processes in river corridor ecosystems (Stanford and Ward, 1988, 1993; Boulton et al., 2010; Fleckenstein et al., 2010; Harvey and Gooseff, 2015; Ward and Packman, 2019), as well as in contaminant fate and transport within the zone of GW-RW mixing (Ford, 2004; Zachara et al., 2013, 2016, 2020; Ma et al., 2014a; Shuai et al., 2019). Understanding the spatial and temporal dynamics of hydrologic and geochemical processes in this zone is of critical importance for contaminated site management because approximately 75% of sites regulated under the Resource Conservation and Recovery Act (RCRA) and the Comprehensive Environmental Response, Compensation, and Liability Act (CERCLA or Superfund) are located within half a mile of a surface water (Tomassoni, 1999; Biksey et al., 2001), and many of these discharge to surface waters (US-EPA, 1991). Therefore, developing a knowledge base for understanding contaminant fate and transport within the GW-RW interaction zone and the development of robust system models are essential components for assessing risks and making sound remedial intervention decisions.
Many active and dynamic physical, chemical, and biological processes impact contaminant behavior in the river corridors. Complex spatio-temporal plume behaviors can stem from heterogeneities in source distribution and subsurface physical and geochemical properties, the hydrologic connectivity of different elements in the river corridor (e.g., riparian and hyporheic exchange flow paths) (Harvey et al., 2019), the fluxes and transit times of this exchanging water, and the abundance and distribution of aqueous and solid phase reactants along near-shore flow paths (Conant et al., 2004; Zachara et al., 2013).
The GW-RW interaction zone within the river corridor of large alluvial river systems with coarse-textured sediments may extend hundreds of meters inland from the river shoreline (Zachara et al., 2013), where heterogeneities in subsurface physical and geochemical properties occur within a context of large variability in subsurface water flux, velocities, and directions influenced by changes in river stage (e.g., Conant et al., 2004; Chen et al., 2013; Murray et al., 2013; Zachara et al., 2016, 2020). Modeling is an essential tool to integrate multiple process interactions as necessary to predict plume behavior within this complex hydrologic zone. However, it is challenging to build an accurate conceptual and numerical model that adequately delineates the interactions between fluid flow and chemical processes governing contaminant transformations and mobility, while accounting for the spatial heterogeneities in subsurface properties and dynamic geochemical conditions driven by GW-RW interactions (Zachara et al., 2020).
In this communication we describe and model a series of non-reactive tracer and hexavalent uranium, U(VI), injection experiments in a well-studied river corridor site (see Chen et al., 2012, 2013; Zachara et al., 2013, 2016, 2020; Ma et al., 2014b) along the Columbia River where groundwater flow directions and velocities are highly dynamic. The site contains residual contaminant U in the vadose zone (after remediation) and a persistent 2-km2 uranium contaminant plume in groundwater that discharges to the river. The behavior of the plume at either the local (10's of meters) or system (100's of meters) scale (a requirement for eventual remediation) has not been adequately described by reactive transport models because of hydrologic complexity and lack of information on the in-situ physicochemical properties of the hydrologically connected aquifer and river corridor sediments. Laboratory studies with core materials from the vadose zone and aquifer, and fines removed from them, in contact with groundwater and river water simulants have revealed relatively strong U retardation dominated by mass-transfer limited U-surface complexation (Shang et al., 2011; Stoliker et al., 2011, 2013). In these experiments, groundwater and river water have been found to support different levels of U retardation because of compositional differences (primarily pH, bicarbonate and calcium concentrations) (Stoliker et al., 2011; Yin et al., 2011) that affect U aqueous speciation. However, passive monitoring experiments performed within a compact well-field at the site (Zachara et al., 2016, 2020) during separate periods of groundwater and surface water dominance suggest minimal in-situ retardation of U. This disparity served as motivation for field experiments to evaluate: (1) the in situ retardation characteristics of the system for U in the presence groundwater and river water solutes, (2) the influences of subsurface physical and geochemical heterogeneities, and variable groundwater flow trajectories on U migration behavior, and (3) the relationships between laboratory- and field-derived U surface complexation parameters, and the causes for their differences. The results of this investigation provide important insights for the application of the surface complexation concept to a realistically complex natural system with dynamic hydrology, water compositional variations, and highly heterogeneous subsurface properties.
2. Methods and Materials
2.1. Study Site
The field site is situated within the footprint of the historic South Process Pond of the Hanford 300 Area, consisting of an extended GW-RW interaction zone resulting from snowmelt-driven river water intrusion into the adjacent coarse-textured groundwater aquifers (Zachara et al., 2013, 2016, 2020). The Columbia River stage displays large seasonal and diurnal variations in response to both natural and anthropogenic changes, which leads to highly dynamic hydrochemical conditions (e.g., direction and velocity of groundwater flow and groundwater chemical composition) in the GW-RW interaction zone (Arntzen et al., 2006; Johnson et al., 2012; Chen et al., 2013; Zachara et al., 2020). Moreover, sorbed contaminants in the lower vadose zone (U primarily) are subject to desorption or solubilization due to enhanced water advection and altered chemical conditions as the water table fluctuates (Um et al., 2010). The behavior of contaminant plumes in the GW-RW interaction zone along the Columbia River shoreline is strongly affected by the spatial and temporal variability in the hydrochemical conditions (Peterson and Connelly, 2004) as well as the heterogeneous distribution of contaminant sources (Zachara et al., 2016).
Field experiments were performed within a 120 × 120 m spatial domain (Figure 1). The model domain contained 43 wells, with most of them located within a 60 × 60 m triangular well-field. The triangular well field was designed to capture diurnal and seasonal variability in groundwater flow directions driven by changes in Columbia River stage. All the wells located within and beyond the model domain provide information for defining model boundary conditions. Earlier tracer studies have identified preferential flow paths along the North-South axis of the well-field (Chen et al., 2012, 2013), which approximately co-locates with a paleo-erosional channel filled with highly permeable sediments containing large river cobbles.
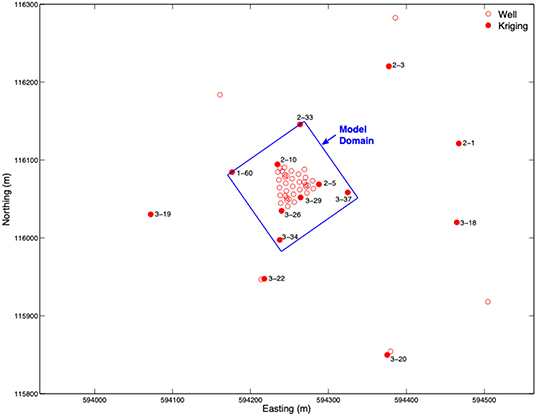
Figure 1. The injection well-field and model domain. All wells shown in filled circles were used for kriging the hourly flow boundary conditions in reactive transport modeling.
Most of the wells within the triangular well field were screened over an approximate 2.5 m interval 9.5–12 m below ground surface (bgs). Three multi-level well clusters (wells 2-26, 2-27, and 2-28; 2-29, 2-30, and 2-31; and wells 3-30, 3-31, and 3-32) were screened at different depths to provide depth-discrete information. Shallow cluster wells (2-26, 2-29, and 3-30) were screened between 9.14 and 10.67 m bgs, the intermediate wells (2-28, 2-31, and 3-32) between 12.86 and 13.47 m bgs, and the deep wells (2-27, 2-30, and 3-31) between 16.46 and 17.07 m bgs.
The unconfined aquifer beneath our study site is comprised of Pleistocene-age flood deposits of the Hanford formation (dominated by gravel) that overlie Pliocene-age fluvio-lacustrine deposits of the Ringold Formation (dominated by mud). The hydraulic conductivity of the Hanford formation is much higher (~7,000 m/d) than that of the Ringold Formation (~1.5 m/d for the sand/silt unit and ~15 m/d for the gravel/sand/silt unit). The contrast in permeability creates a preferential groundwater flow path above the Hanford and Ringold contact, which has constrained the uranium plume to the Hanford formation. Direct and indirect characterization measurements have been assimilated into the site hydrogeologic data base, including electromagnetic borehole flowmeter profiling, multiple constant-rate injection tests, multiple conservative tracer injection tests, and geophysical imaging using electric resistivity tomography (e.g., Murakami et al., 2010; Chen et al., 2012, 2013; Johnson et al., 2012).
Measurements of physical, geochemical, and mineralogical properties, including grain-size distribution, surface area, extractable iron, and mineralogy, were made to establish a geochemical heterogeneity model of the site (Shang et al., 2011; Murray et al., 2013; Stoliker et al., 2013). Geochemical reactivity measurements were performed on the <2 mm sediment size fraction isolated from 10 cm diameter cores of the vadose and saturated zones within the triangular well-field. This size fraction, representing 5–8 % of the total sediment mass, is the most reactive portion of the subsurface sediment, with an average surface area of ~25 m2/g. The mass fraction of the <2 mm sediment varies spatially at the site as revealed by grain size analyses of over 100 sediment samples from the well-field (Murray et al., 2013).
Multi-rate U(VI) surface complexation models have been developed to describe U adsorption in site sediments based on laboratory batch, flow-cell, and column experiments with the <2 mm fractions and intact cores in both groundwater and river-water simulants (e.g., Liu et al., 2008; Shang et al., 2011; Stoliker et al., 2011, 2013; Yin et al., 2011). An important aspect of the current study was to evaluate the applicability of these models and their associated parameters to the field.
2.2. U(VI) Sorption/Desorption Field Experiments
The primary objective of the U injection experiments was to quantify the magnitude of U surface complexation, in-situ, and the extent and rates of U mass transfer between sediment and groundwater for the uppermost portion of the Hanford unconfined aquifer. To this end, the experiments incorporated three separate injection events using subsurface waters (undiluted and diluted) with elevated U concentrations sampled from a known source area to the persistent U plume. During all the three injections, the test solution was injected at a rate sufficient to overcome ambient groundwater flow (i.e., to minimize radial asymmetry of the tracer plume) with subsequent drift allowed under natural flow conditions.
The first two injection experiments were operationally similar, during which the injectate with elevated uranium concentrations was spiked with a unique conservative tracer and injected into well 2-34 (see Figure 2) screened over the upper portion of the aquifer, henceforth referred to as the upper zone injection experiments. These two experiments were nearly identical except for the make-up water composition (one groundwater and the other river water with a lower bicarbonate concentration) and anionic tracer species used (Table 1). This design made it possible to interrogate the effect of injection solution chemical composition on U migration behavior.
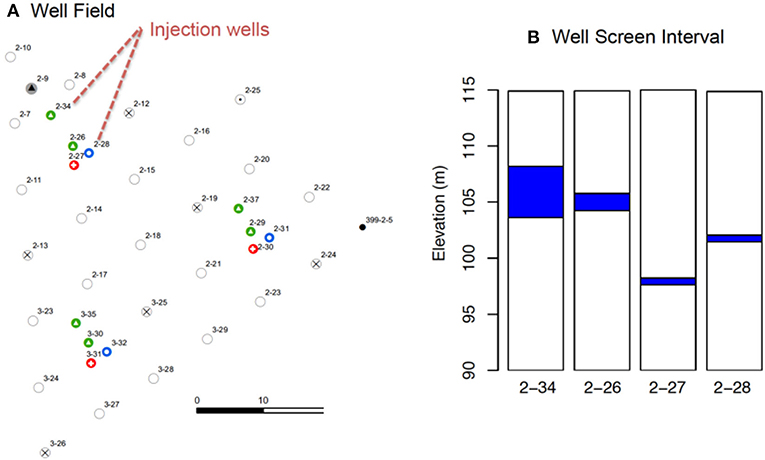
Figure 2. Layout of well-field (A) and representative well screen intervals in select wells (B).
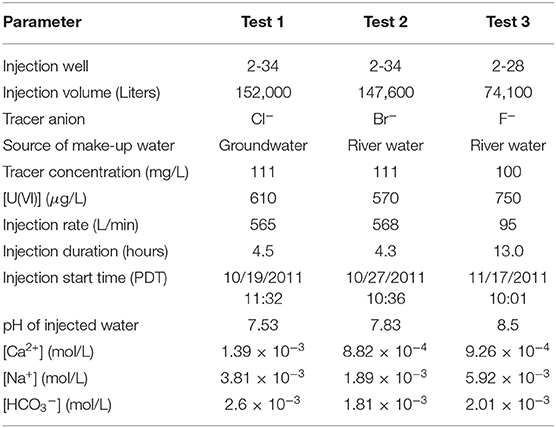
Table 1. Injection summary.
The third experiment utilized an injection solution containing elevated U concentrations and an ionic composition similar to that of the river water (Table 1). This solution was spiked with a third unique anionic tracer species (F−) and injected into the intermediate depth well 2-28 (Figure 2), which is known for slow tracer breakthrough from earlier tracer experiments (Chen et al., 2012, 2013). The third injection was referred to as the intermediate zone injection experiment. Aqueous monitoring of this injection was limited to the three-well cluster (wells 2-28, 2-26, and 2-27), as no other wells in close proximity were screened over the targeted low-permeability zone. This monitoring constraint was not detrimental as the injectate migration velocity was relatively slow in this low permeability zone.
The in-situ experiments were run at constant injection rates for durations of 4.5 and 4.3 h for the first two experiments, respectively, and 13 h for the third injection in the low-permeability zone, resulting in injection volumes between 150,000 and 74,000 liters (L) (Table 1). The injected U concentrations ranged from 565 to 750 μg/L, which were approximately 10 times higher than the background concentration within the plume prior to the experiments. An operational summary for all experiments is provided in Table 1.
During all three injection experiments, aqueous samples were collected from each monitoring well using dedicated variable-speed submersible pumps (Redi-flo2, Grundfos®, Olathe KS) installed at the approximate center point of the screened interval. Sample water was routed through a manifold, with each line controlled by a solenoid valve to allow selection of sampling well, to a single multi-probe flow cell (MP20, QED Environmental Systems, Dexter MI) located in a mobile field laboratory. Samples were purged until specific conductance readings were stable, which generally took 3 min at a flow rate of 3–4 L/min. Measurements performed on all pumped samples included specific conductance, temperature, pH, dissolved oxygen, and oxidation-reduction potential. The flow cell calibration was checked regularly (and adjusted as necessary) using National Institute of Standards and Technology (NIST) traceable specific conductance and pH standards. A separate set of samples was collected after 0.45 μm filtration for lab analyses, including anions by ion chromatography, U by kinetic phosphorescence analysis (acid preservation), major cations by inductively coupled plasma/optical emission spectrometry (acid preservation), and carbon analysis by ion chromatography/non-dispersive infrared. All filtered samples were analyzed for U and anionic tracers, whereas only selected samples were analyzed for anions, cations, or carbon as needed to support interpretation of the observed U mass transport response.
2.3. Reactive Transport Modeling
Groundwater flow and reactive transport processes associated with the injections were simulated by the high-performance code PFLOTRAN (Hammond et al., 2014). The code has been successfully implemented for other studies at this site, incorporating a multi-rate surface complexation model developed from column studies to three-dimensional field-scale modeling of uranium natural attenuation processes (Hammond and Lichtner, 2010). We adopted the same model domain and configuration (Figure 1) from earlier studies that assimilated conservative tracer data to estimate heterogeneous aquifer hydraulic properties at the same well-field (Chen et al., 2012, 2013). While more detailed description of the groundwater flow governing equations is provided by Chen et al. (2012, 2013), we will briefly describe the implementation of the reactive transport model used in this paper.
The model domain covered a horizontal area of 120 × 120 m (Figure 1); with a thickness of 15m in the vertical direction (95–110 m above sea level). The grid resolutions were 1 m horizontally and 0.5 m vertically. All the lateral boundaries (eastern, western, northern and southern) were assigned time-varying water table elevations cell by cell, which were kriged using hourly water level data from wells inside and outside the model domain (Figure 1) with an exponential variogram. The kriged transient lateral boundary conditions were able to capture the flow dynamics during the experimental time frame which were significant but not extreme. The experiments were performed over a month in mid-fall when groundwater flows primarily from the NW to the SE and discharge to the Columbia River. The average river elevation during the experimental period was 104.8 m with frequent excursions of ±0.5 m for salmon spawning management. A no-flow boundary condition was specified at the bottom of the domain because it is underlain by much less permeable Ringold Formation materials that function as an aquitard. A small, constant-rate recharge boundary condition of 55 mm/yr was applied to the top of the model domain based on an earlier monitoring study at the Hanford site (Rockhold et al., 2009).
The transport boundary conditions for conservative tracer species (Cl−, Br−, and F−), U, and other geochemical analytes were set to be free outflow at the four lateral boundaries, where the influx flow was assumed to be free of conservative tracers with average measured background geochemical concentrations. The recharge water at the upper boundary was set to be tracer and U free, while a zero-flux tracer boundary condition was applied at the lower boundary. Although there could be unquantified U input when residual sorbed U in the vadose zone gets released during rising water table or through infiltration, its potential impact was considered minimal given the small recharge rate and our short simulation time window during the relatively low river stages.
The injections of conservative tracers and U at wells 2-34 and 2-28 were simulated as a time series of specified time-varying water flux containing time-averaged tracer and geochemical concentrations, which were calculated based on analysis of aqueous samples collected at different times during the injection experiments. The initial flow condition was a hydrostatic pressure distribution based on the water table at the beginning of simulation, as interpolated from the same set of wells that were used to create the transient lateral flow boundary conditions. The initial conservative tracer concentration was set to be the background concentration of the specific anion over the entire model domain. The initial U concentration in the well-field and modeling domain as a whole can show significant variation in both the horizontal and vertical directions as a result of water table oscillations and river water intrusion events driven by river stage changes (Zachara et al., 2016).
The initial aqueous U concentration field was kriged from a set of aqueous concentrations measured immediately prior to the start of the experiments. The vertical stratification of U was defined by measurements from the three depth-discrete well clusters. The initial uranium concentration field along with multi-rate surface complexation reaction parameters are among the most important factors controlling modeled U concentrations within the U plume (Ma et al., 2014b). As such, multiple realizations of the initial uranium concentration field were generated using sequential Gaussian simulation to represent this uncertainty.
We incorporated the surface complexation models (SCM) of Shang et al. (2011) and Stoliker et al. (2011) into the PFLOTRAN reaction database. Stoliker et al. (2011) investigated the influence of grain size distribution of the <2 mm fraction on its adsorption and desorption of uranium. They found that the total site concentration of the given <2 mm fractions isolated from the site could be estimated by a linear summation of the estimated site concentrations of each of eight <2 mm grain size subclasses, weighted by the specific mass fraction of each class in the <2 mm. Site density (determined by isotherm measurement), the reaction network, and the surface complexation constants were held constant across all grain size classes. On the other hand, Stoliker et al. (2011) investigated the influence of bicarbonate on U surface complexation by <2 mm size fractions spanning the range of HCO3− observed in site groundwater, river water, and groundwater-river water mixtures. Higher concentrations of HCO3−, as found in groundwater, suppressed adsorption over that in river water through formation of poorly sorbing aqueous U-carbonate/bicarbonate complexes. They developed a SCM that well described the effects of aqueous composition on U adsorption and desorption using a generic site density (3.84 μmol/m2) recommended by Davis et al. (1998). The primary differences between the two models were their site densities and surface complexation reaction constants that both differed between models by factors of 103.
Adsorption and desorption of U were described by the following surface complexation reaction:
where >SOH is the surface site for U adsorption, >SOUO2(CO3HCO3)2− is the sorbed U species, and K is the equilibrium reaction constant. The reported values of logK for this reaction were 24.72 (Shang et al., 2011) and 21.64 (Stoliker et al., 2011), respectively.
Because U adsorption/desorption in the site sediments has shown kinetic behavior in laboratory studies (Shang et al., 2011; Stoliker et al., 2013), a multi-rate formulation developed by Liu et al. (2008) was used to describe the kinetics of U(VI) adsorption/desorption in our field-scale modeling, following previous implementations by Hammond and Lichtner (2010) and Ma et al. (2014b). This multi-rate mass transfer model assumes multiple sorption sites with equal fractions of the total available sites. The adsorption of aqueous U species to each site follows a forward-backward rate law. The first-order rate constants of surface complexation sites were assumed to follow a log-normal probability distribution with its mean and standard deviation fitted to experimental data. Various values of the mean and standard deviation (Std) of the log-transformed rate constants have resulted from previous studies with site sediments using different sample support sizes and experimental systems (e.g., batch, flow cell, column) (Liu et al., 2008; Shang et al., 2011; Stoliker et al., 2013). The governing equations of SCM coupled with multi-rate mass transfer, along with other aqueous speciation reactions are described in details by Liu et al. (2008) and Ma et al. (2010), thus not repeated here.
The mass transfer parameters display scale dependency, with rates decreasing with increasing scale (Liu et al., 2013). Select values are summarized in Table 2 with associated logK and site density values for the surface complexation reaction shown in Equation (1). It is noted that the logK value used by Shang et al. (2011) was 3 orders of magnitude higher than that used by Stoliker et al. (2011). However, the sediment site density measured by Shang et al. (2011) by the isotherm method was three orders magnitude lower than the generic surface site density used by Stoliker et al. (2011). These two sets of parameters lead to equivalent SCM results under dilute conditions below surface site saturation. However, the elevated U concentrations used in the injection experiments could exceed surface site saturation for the low values of site density assumed in the SCM of Shang et al. (2011). The mean and standard deviation of the log-transformed mass transfer rate constants, α, from the column studies by Shang et al. (2011) and from the field-scale modeling study of Ma et al. (2014b) were both tested in this study to assess their suitability as in-situ, field-scale parameters.
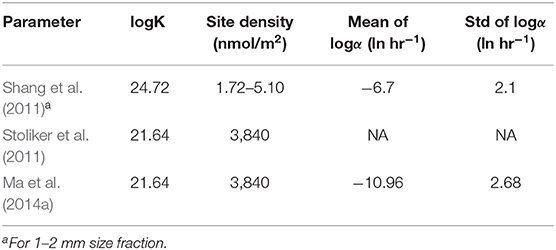
Table 2. Summary of reaction parameters used in previous studies.
The aquifer material at our site is highly heterogeneous in physical properties, such as grain size distribution and macropore volume, which lead to significant heterogeneity in both hydrologic and geochemical properties. Shang et al. (2011) discovered that both site concentration and uranium distribution coefficient (Kd) are highly correlated with macropore volume in different sand- and silt-sized grain-size fractions of the sediment. While macropore volume measurements were only performed on a limited number of samples, Kd measurements were made on over 100, <2.0 mm size fractions from 10 cm diameter core samples collected from the triangular well array (Figure 2), which showed large spatial variability as reported by Murray et al. (2013). We reanalyzed the dataset presented by Shang et al. (2011) and found a high linear correlation between site concentration (SC) and Kd for all different size fractions, and the equation is
with an R2 value larger than 0.99. This high correlation could be attributed to the fact that both SC and Kd are related to the adsorption/desorption capacity of the porous medium. Note that the regression equation were based on limited data points presented by Shang et al. (2011). The correlation coefficient might deteriorate when more data points are available from future characterizations.
We used Equation (2) to convert spatially distributed Kd measurements on composite material to site concentrations at each location, which were then used as conditioning points in sequential Gaussian simulation (Deutsch and Journel, 1998) to generate geostatistical realizations of heterogeneous site concentration field. This set of realizations represents uncertainty in spatial heterogeneity of site concentrations. It is also noted that the site concentration data in Shang et al. (2011) were based on samples with gravels and cobbles excluded. Therefore, additional efforts may be required to use those data at the field scale, for example, a scaling factor as adopted by Hammond and Lichtner (2010).
3. Results and Discussion
3.1. Field Experimental Results
In all the three injection tests, tracer and uranium concentrations were monitored in the injection well and surrounding wells during and after the injections. The injection water composition was different during the three tests with the primary species that are the most important to uranium surface complexation given in Table 1. While the observed responses were highly heterogeneous as expected, the most pronounced responses were found in the injection well and the wells that are close to the injection (referred to as near-field wells hereafter), especially when comparing the differences in responses between the three separate injection tests. Therefore, we focused on evaluating the responses at a set of near-field wells for all the three injection tests. The primary tracer transport trajectory is from northwestern to southeastern toward the river.
3.1.1. Upper Zone Injection Test
During the first two tests (Test 1 and Test 2 in Table 1), the difference in chemical composition of the injected water solution led to different geochemical conditions during and immediately following the injections. The average concentrations of selected species of primary interest (Table 1) showed higher pH and lower calcium, sodium, and bicarbonate concentrations during Test 2, which mimicked the geochemical condition of the adjacent Columbia River water. While the two injections were operated similarly, the difference in response curves of tracer and uranium at the injection well and near-field wells explicitly demonstrate the impact of geochemical conditions on uranium adsorption and desorption.
Both conservative tracer and uranium breakthrough responses in the injection well (2-34) and near-field monitoring wells (2-07, 2-08, 2-09, 2-11, 2-26, 2-28, 2-14, and 2-18) are shown in Figure 3. The two vertical lines in each sub-plot represent the starting of Test 1 and Test 2, which were approximately 192 h apart. The spatial variability in responses of both the conservative tracer and uranium is evident in Figure 3. In most of the wells screened in the upper zone, including wells 2-34, 2-07, 2-08, 2-09, 2-11, and 2-26, the uranium breakthrough pattern was very similar to that of conservative tracer during Test 1, indicating minimal adsorption of uranium. However, during Test 2 with injection water chemistry close to that of river water, monitoring results at wells 2-34, 2-07, 2-11, and 2-26 showed a steeper decline in uranium concentration than in tracer, indicating a stronger sorption of uranium during the second test. However, this difference in response between Test 1 and Test 2 was not observed at wells 2-08 and 2-09, which are located toward the upgradient edge of the injection volume and thus would be expected to have the fastest elution response. In the wells that are further down gradient from the injection well, i.e., 2-14 and 2-18, a lag in uranium breakthrough compared to tracer breakthrough is observed, with larger lag resulted in the Test 2, which is also indicative of stronger sorption.
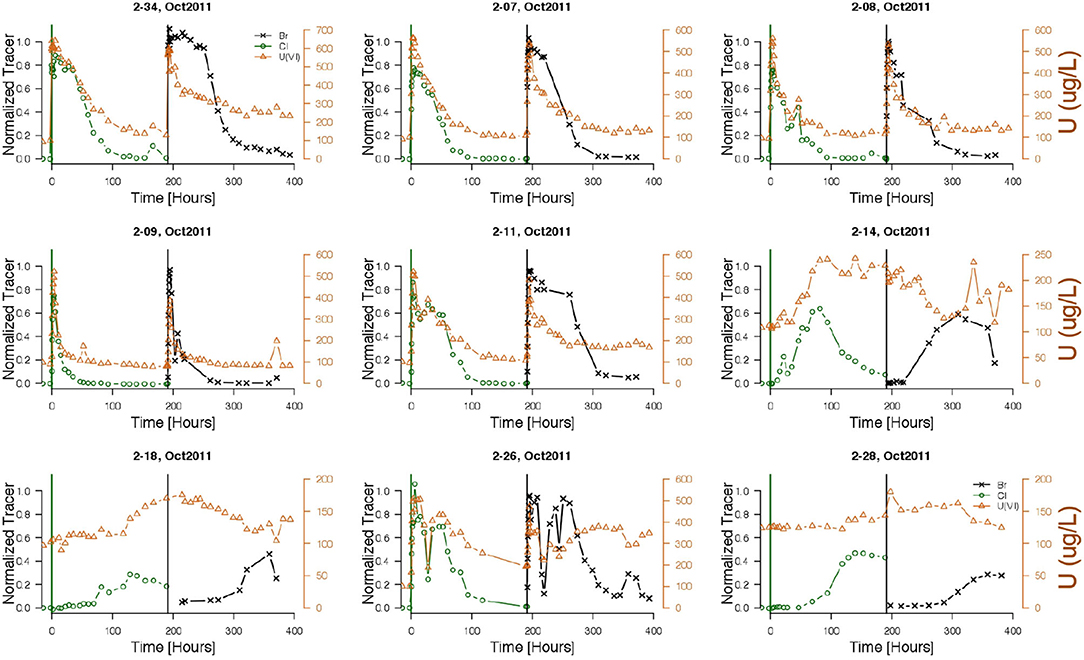
Figure 3. A comparison of conservative tracer and uranium concentrations at the injection well and near-field monitoring wells. Br− was injected in Test 1 and Cl− was injected in Test 2. The two vertical lines represent the starting time of Test 1 and Test 2.
The double peaks observed in well 2-26 as shown in Figure 3 is likely caused by the changes in flow directions following the injection, which transported the upstream water with high concentration of uranium (represented by wells 2-07, 2-08, and 2-09) to downstream locations. This larger degree of variability would be expected at this location because it is near the leading edge of the injection volume, while the injection well is located near the centroid of the injection volume. The slowest breakthrough of tracer was observed in well 2-28 despite its close proximity to the injection well, which is consistent with the presence of low-permeability material at the intermediate depth interval over which well 2-28 is screened. Although tracer breakthroughs were observed at this location, a uranium breakthrough was not observed within the time frame plotted in Figure 3, which covered 192 h after the first injection and 200 h after the second injection. This delay implied strong sorption of uranium at this location.
3.1.2. Intermediate Zone Injection Test
The interpretation of tracer/uranium breakthrough during the intermediate zone injection test (Test 3 in Table 1) relied solely on the observed elution response at well 2-28, as there are no other wells close to well 2-28 that are screened across the same depth interval. Observed conservative tracer (fluoride) and uranium concentrations throughout the injection and initial drift phases of the test are shown in Figure 4. The difference in breakthrough behaviors of conservative tracer and uranium clearly demonstrates the effects of uranium sorption processes within this lower permeability material by the rapid decline in uranium concentration immediately following cessation of the injection. The conservative tracer species remained elevated after the injection phase and demonstrated a typical elution response, with most of the tracer transported out of the monitoring zone within 10 days. Conversely, the steep drop in uranium concentration after the injection was followed by a steady increase in uranium concentration to well above the injection concentration (750 ug/L). This phenomenon is likely associated with enhanced uranium sorption in the presence of low calcium concentration, bicarbonate concentration and higher pH in injected water (as shown in Table 1), followed by uranium desorption promoted by returning groundwater with elevated bicarbonate and lower pH, which is shown in Figure 4. The time series data of calcium and sodium in Figure 4 also shows drastic changes over time, with calcium demonstrating similar temporal pattern compared to uranium.
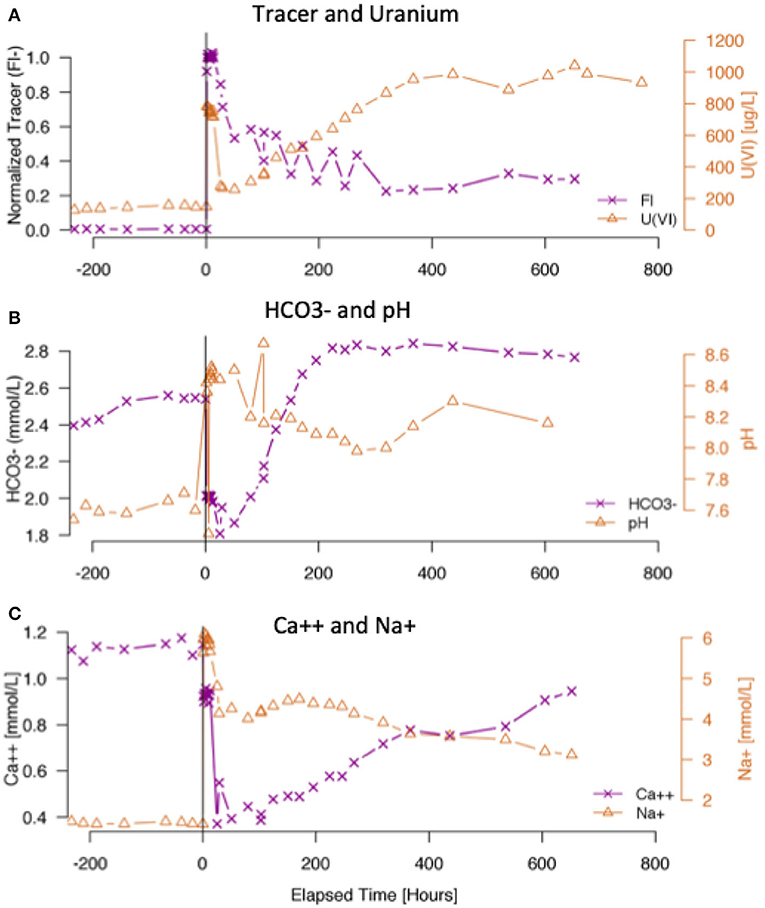
Figure 4. Concentrations of tracer and uranium (A), HCO3− and pH (B), and Ca++ and Na+ (C) at the injection well 2–28 during the intermediate zone injection test. Time zero refers to the start of the injection.
3.2. Reactive Transport Modeling of Uranium
3.2.1. Characterizing Permeability Field With Conservative Tracer Data
In order to model the fate and transport of uranium, the first step is to obtain accurate flow modeling, which requires estimation of permeability field within the model domain. We first adopted an ensemble of permeability fields from previous work by assimilating tracer test data from earlier experiments (Chen et al., 2013) from which the simulated tracer breakthroughs during Test 1 in a selected set of downgradient wells are shown in Figure 5, where the ensemble of simulated breakthrough curves represent uncertainty resulting from uncertain permeability estimates. The match between model simulation and the actual observations is satisfactory in general, although the performance varies between wells, with wells 2-14 and 2-18 showing the least satisfactory match. This set of results demonstrate that estimated permeability field based on other test data may not be able to produce good predictions for new scenarios, given the limitation that each estimation by data assimilation or inverse modeling is embedded with errors and uncertainties arising from measurement and model structural and forcing errors, such as dynamic flow boundary conditions in this case. Therefore, we used the conservative tracer breakthrough data in this experiment to derive permeability field estimates that could lead to better flow modeling, using the same iterative ensemble smoother as described by Chen et al. (2013).
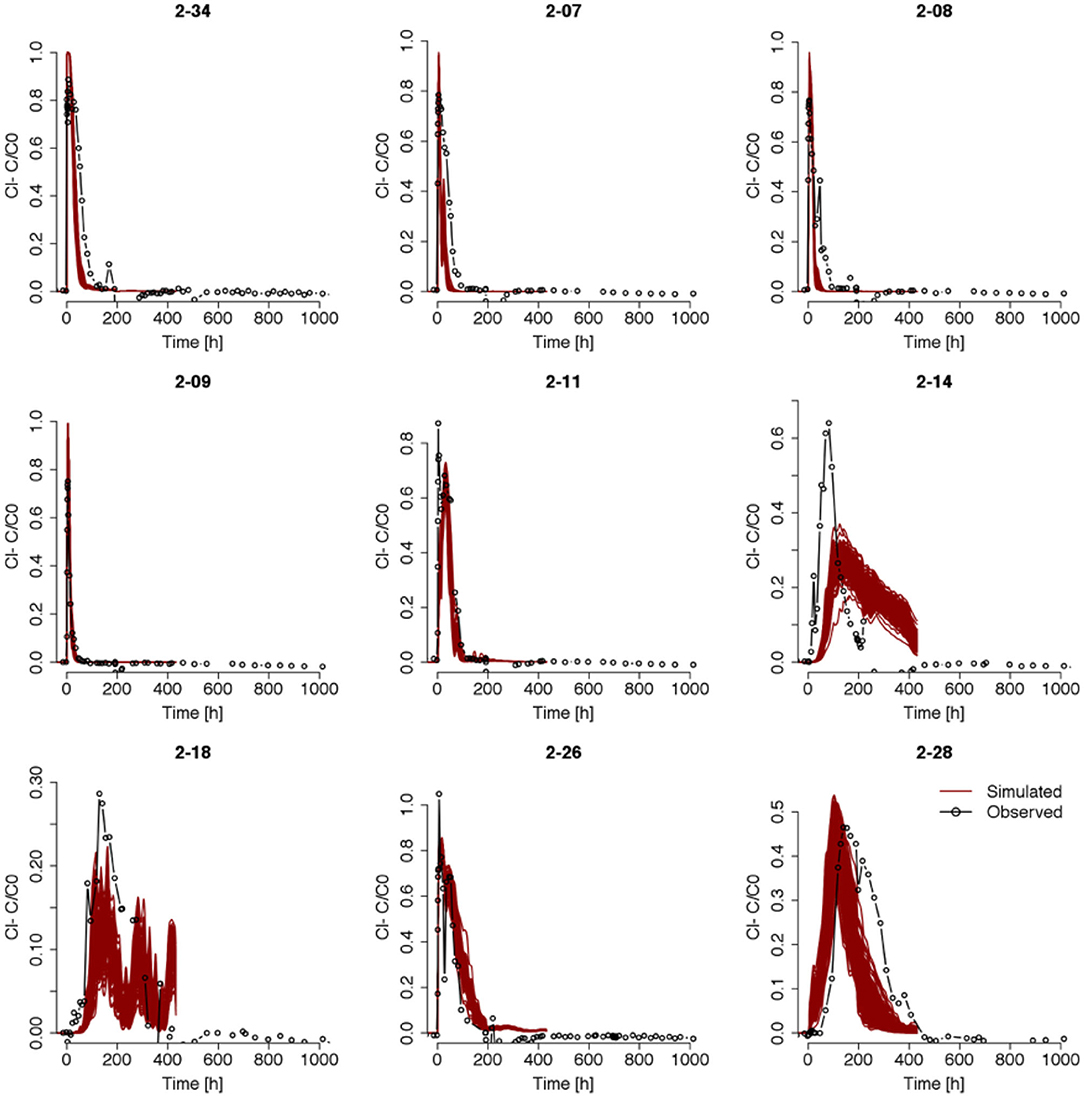
Figure 5. Ensemble of predicted tracer breakthrough curves during Test 1 in selected wells using permeability field estimations from previous data assimilation work (Chen et al., 2013). The connected dots are observed breakthrough curves and each line is a realization from the ensemble of predicted breakthrough curves. The well name for each plot is given in the title for each plot. The ensemble size is 600.
Since Test 1 and Test 2 experienced similar flow conditions, only the tracer data from Test 1 was used to estimate the permeability field. The data to be assimilated were from the injection well and a set of downgradient monitoring wells, including 2-34, 2-11, 2-13, 2-14, 2-15, 2-17, 2-18, 2-19, 2-26, 2-27, and 2-28. This set of wells will be referred to as the conditioning well set hereafter. After three iterations of data assimilation steps, the updated ensemble of the permeability field was used to simulate tracer breakthrough of the first upper zone injection test in the near-field wells (shown in Figure 6). It can be observed that the prediction ensemble using the updated permeability field match the data well, except for an earlier predicted breakthrough in well 2-28. Compared to the match produced by permeability estimates from previous work (Figure 5), we found remarkable improvements for all the wells, especially for wells 2-14 and 2-18. Although we conditioned the permeability estimation on data up to 192 h after the start of Test 1, which was the starting point of Test 2, the simulations were able to reproduce the breakthrough behavior beyond this point in time. Note that the dynamic flow boundary conditions were interpolated from a set of wells shown in Figure 1 with only six wells outside the model domain, which remains as a uncertainty source to estimated permeability field and the subsequent reactive transport processes. We then selected a realization of the permeability field that yielded the best fit in terms of root mean square error between the simulated and observed breakthrough data for the near-field wells. This realization was used in subsequent reactive transport modeling to evaluate impacts of geochemical heterogeneities on uranium transport modeling.
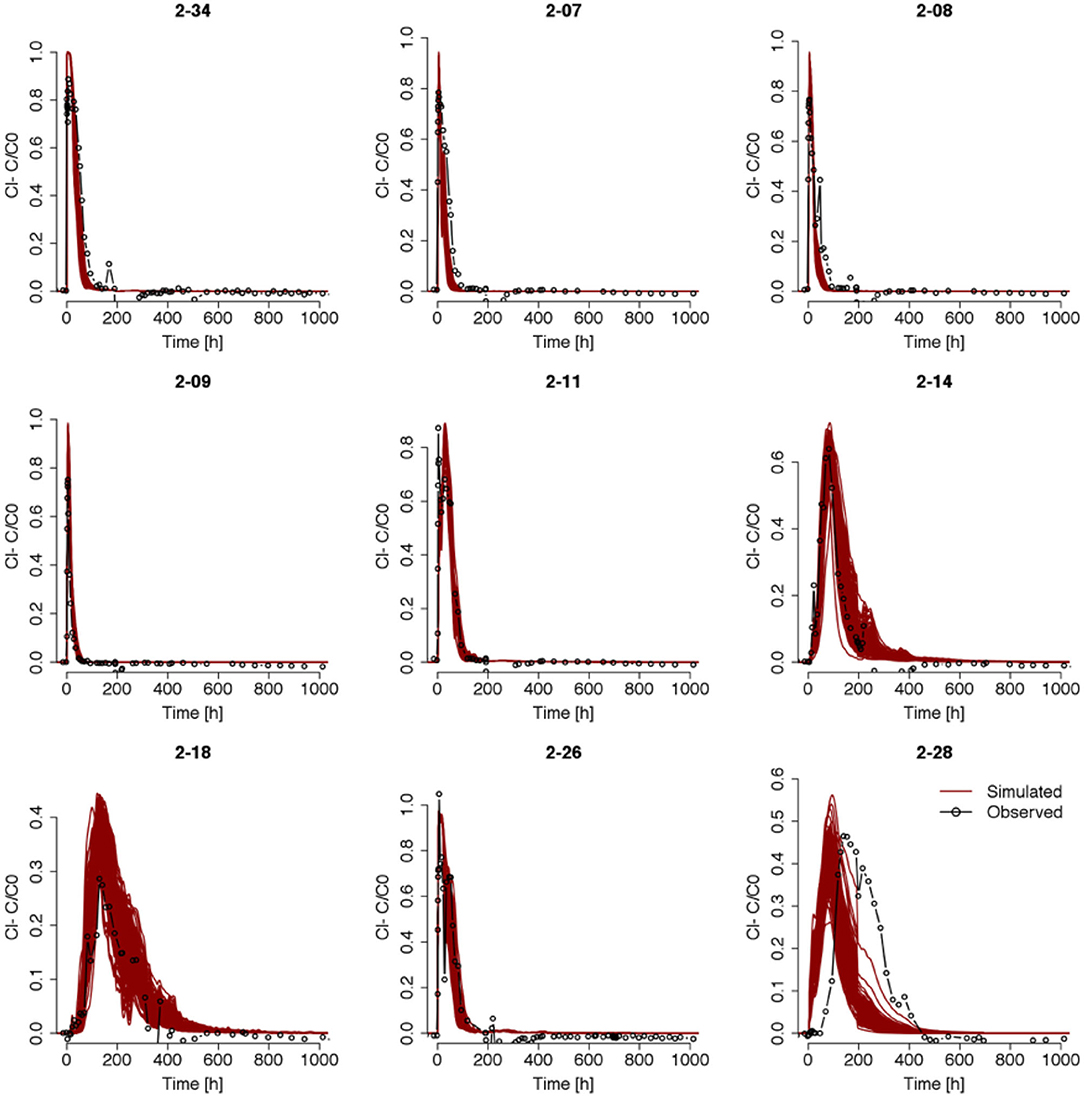
Figure 6. Posterior ensemble of tracer breakthrough curves in selected wells after three iterations of iterative ensemble smoother. The plotting specifics are the same as those given in Figure 5.
3.2.2. Reactive Transport With Geochemical Heterogeneity
Uranium migration during the multiple injection tests was simulated with PFLOTRAN using the SCM model described in section 2.3. We considered two types of geochemical heterogeneities in modeling the uranium fate and transport, i.e., the spatial distribution of initial uranium concentration and sorption site concentrations, and their uncertainty. Rate constants were considered uniform across the domain based on the findings reported by Shang et al. (2011). We tested various set of multi-rate mass transfer parameters and selected those from Ma et al. (2014b) shown in Table 2 because they yielded better match with field observations. Spatially distributed fields of both variables were interpolated from point data using the geostatistical conditional simulation method as described in section 2. Their uncertainty was represented by an ensemble of 300 stochastic realizations.
The resulted ensemble of predicted uranium breakthrough curves are compared to actual field observations in the near-field wells in Figure 7. In general, the model results show lower peaks and steeper decline in uranium concentration after the cessation of injections. This discrepancy is indicative of stronger adsorption prescribed in the model than is actually occurring at the field. Since the sorption site concentration point data were obtained from measurements made on samples that excluded gravels and cobbles, an overestimation of sorption site concentration at the field scale is likely to occur when adopting such information from smaller-scale studies.
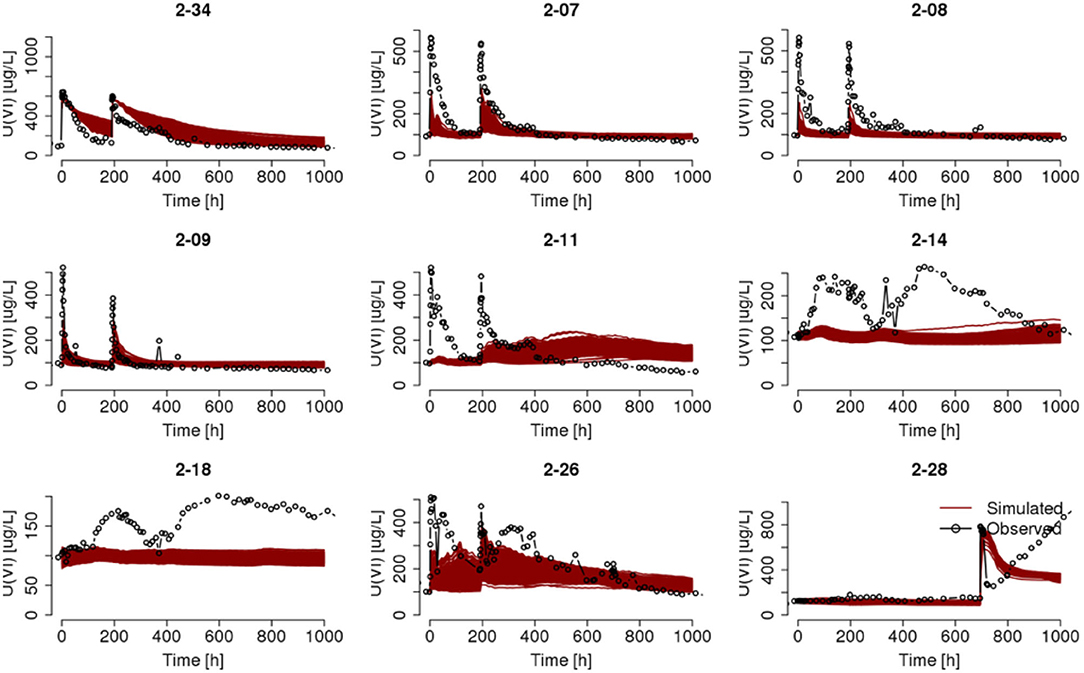
Figure 7. Ensemble of predicted uranium breakthrough curves in selected wells. The best-fit permeability was taken from the posterior ensemble of permeability fields that yielded the conservative tracer breakthrough ensemble in Figure 6. The sorption site concentration field was generated by conditioning on point data derived from Equation (2). Other plotting specifics are the same as Figure 5.
Similarly, Hammond and Lichtner (2010) had to scale the sorption site concentration estimated from smaller-scale studies by one tenth to yield reasonable modeling results at the field scale. We adopted the same approach and simulated uranium transport by scaling the sorption concentration field by one-tenth, which is approximately the average mass fraction of <2 mm size fraction. The results in Figure 8 show considerable improvements in the match between model predictions and actual observations using the reduced sorption site concentration, with the exception in capturing the rebound in uranium concentration in well 2-28 after Test 3. Since Test 3 differed from the other two tests in injection location and depth, as well as the flow condition due to the presence of low-permeability material, we will discuss the modeling challenges of this test separately, although its simulation results will still be demonstrated with other wells for consistency.
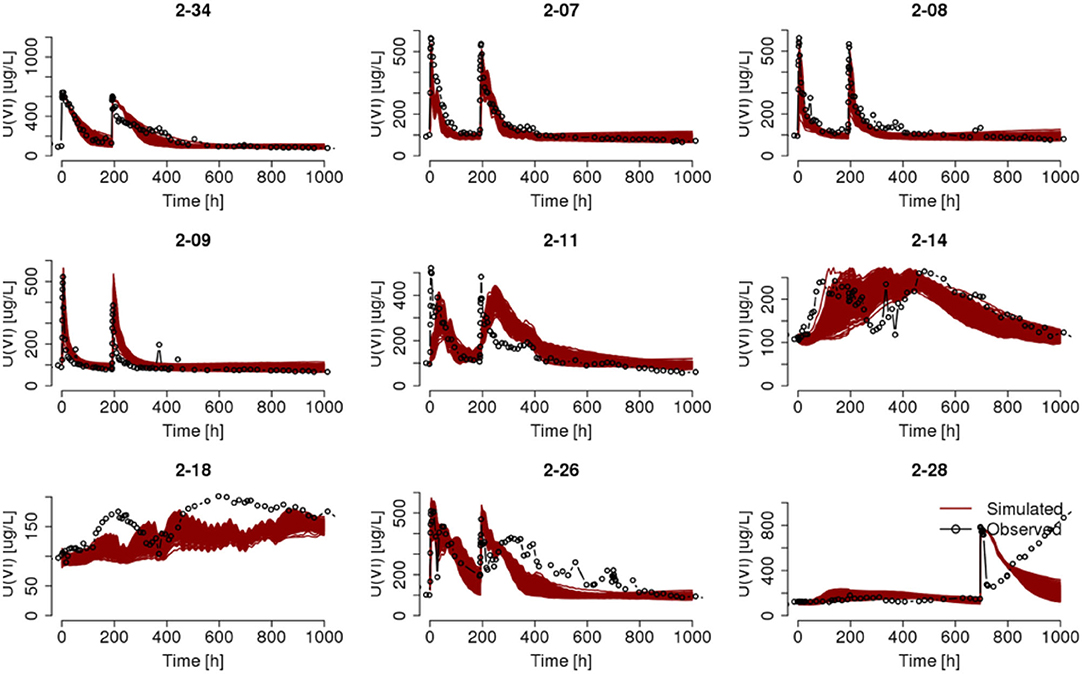
Figure 8. Ensemble of predicted uranium breakthrough curves in selected wells after scaling the sorption site concentration by a factor of one-tenth. Other plotting specifics are the same as Figure 7.
While overall improvements of model predictions are observed after scaling the sorption site concentrations, an across-the-domain scaling factor may not be the optimal approach due to heterogeneity of aquifer materials. For example, the uranium breakthrough in wells 2-07 and 2-18 may be further improved by a scaling factor that is adjusted locally. Some wells in Figure 8 show difference in goodness-of-fit for Test 1 and Test 2, which differed in the chemical composition of the injected water solution. This performance difference might be attributed to the fact that the injection of Test 2 occurred later in simulation time, such that the geochemical conditions prescribed at the model boundaries impacts more heavily on the geochemical conditions near these wells, especially after the cessation of Test 2 injection. We found that pH was under-predicted by the model at the injection and near-field wells, approximately 400 h after the start of Test 1 as shown in Figure 9 for a representative realization. This under-prediction of pH at later times could be caused by the uniform and constant geochemical conditions specified at the lateral boundaries, which had unified the geochemical conditions in the model domain after a certain simulation period.
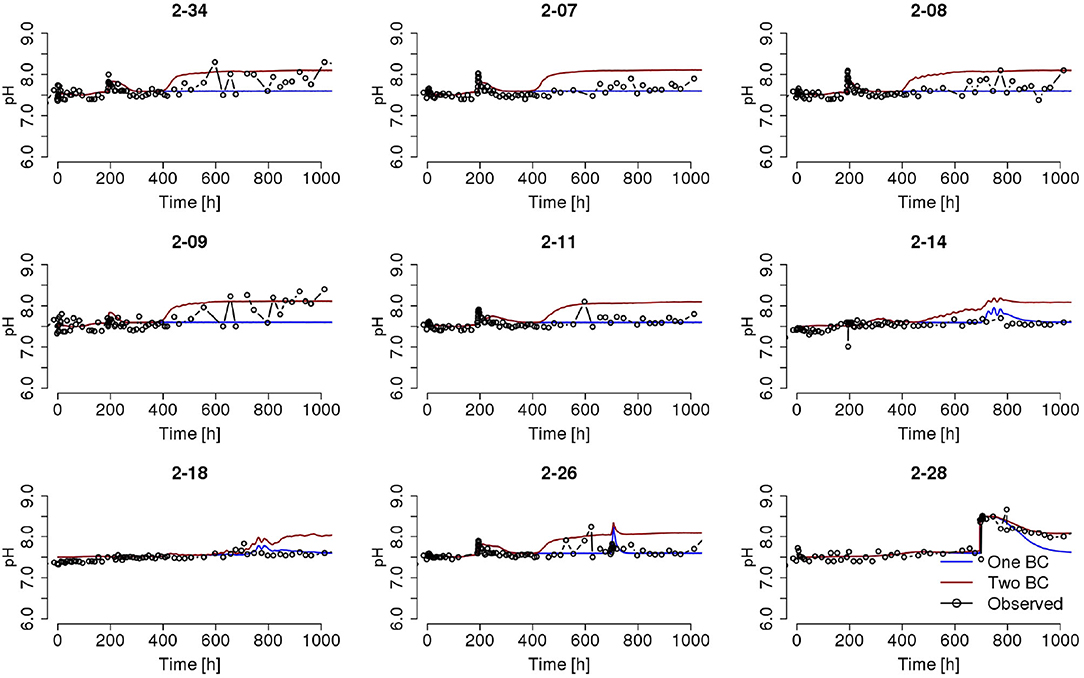
Figure 9. Simulated pH time series in selected wells using two boundary configurations for pH compared to observations. The “One BC” case refers to constant pH concentrations during the simulation window, while the “Two BC” case refers to raising pH concentrations at the northern and western boundaries from 7.5 to 8.12 after 290 h from the start of the simulation. Other modeling configurations are the same as in Figure 8.
To probe the impact of pH values and its spatial heterogeneity on uranium migration in the field, we raised the pH values at the northern and western boundaries, which are the main inflow boundaries during low-water stage, from 7.5 to 8.12 after 290 h from the start of simulation and ran the model simulation again with all other model configurations unchanged. The switching time of 290 h were selected based on trials in matching the observed change in field conditions. The predicted pH at the wells resulted from this new simulation are then on the high end of the observed range. These two pH configurations provide lower and upper bounds for pH observed during the experiment, although temporal dynamics and spatial heterogeneity of pH cannot be captured in this static setup of geochemical boundary conditions. The comparison of simulated HCO3− and Ca++ concentrations in those selected wells are provided in the Supplementary Material. While the field conditions of pH and HCO3− were better captured under the two-step boundary conditions, the Ca++ concentrations were underestimated. The ensemble of predicted uranium breakthroughs with the higher pH at the inflow boundaries is shown in Figure 10. This model revision resulted in substantial differences in predicted U concentration from those shown in Figure 8, with most of the wells showing improved fit following the second injection. This test demonstrated the significant influence of pH, as an example of dynamic and heterogeneous geochemical conditions, on the reactive transport of uranium in dynamic river corridors.
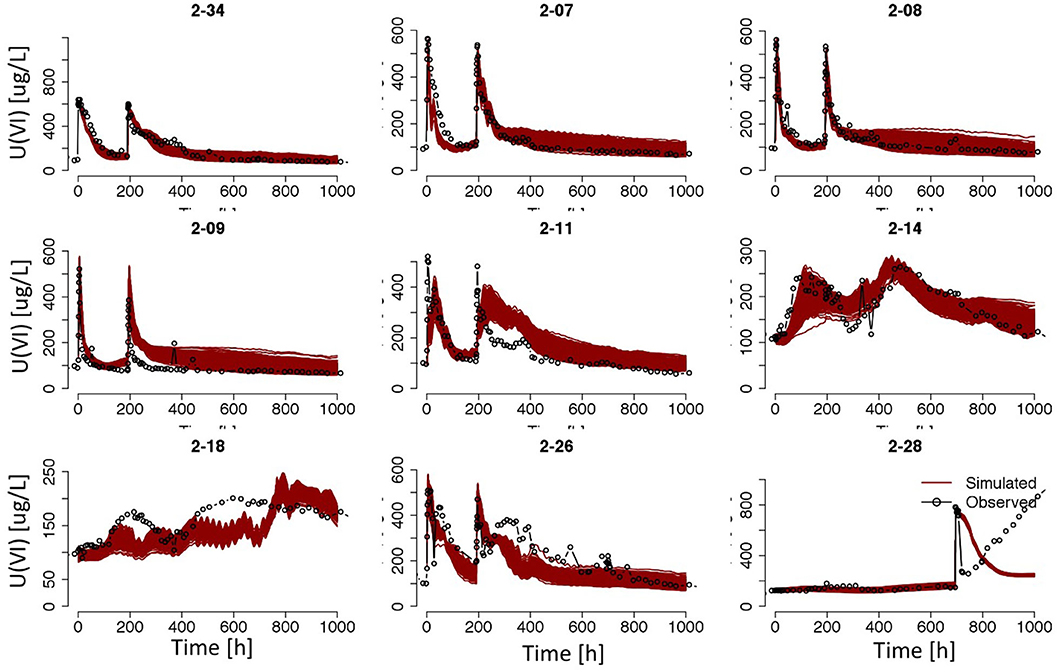
Figure 10. Ensemble of predicted uranium breakthrough curves in selected wells after scaling the sorption site concentration by a factor of one-tenth and raising the pH at the northern and western boundaries from 7.5 to 8.12. Other plotting specifics are same as Figure 8.
To decipher the difficulty in capturing the rebound of uranium after the injection of Test 3 in model simulations, we examined in detail the simulated geochemical conditions at well 2-28 from one realization of the set of simulations that produced Figures 8, 10, with results provided in Figure 11. It is evident that neither of the two model configurations was able to reproduce the set of key geochemical states (i.e., pH, HCO3−, Ca++, and Na+) at well 2-28 during and following the third injection. Through our extensive experiments with combinations of different geochemical boundary condition configurations (constant vs. stair-stepped), injection water composition (Ca++ and HCO3− concentrations), varying rate constants, including ion exchange reactions from Stoliker et al. (2011) and surface complexation models developed on different sediment samples, we found that all of them have significant impacts on simulating the uranium breakthrough in well 2-28.
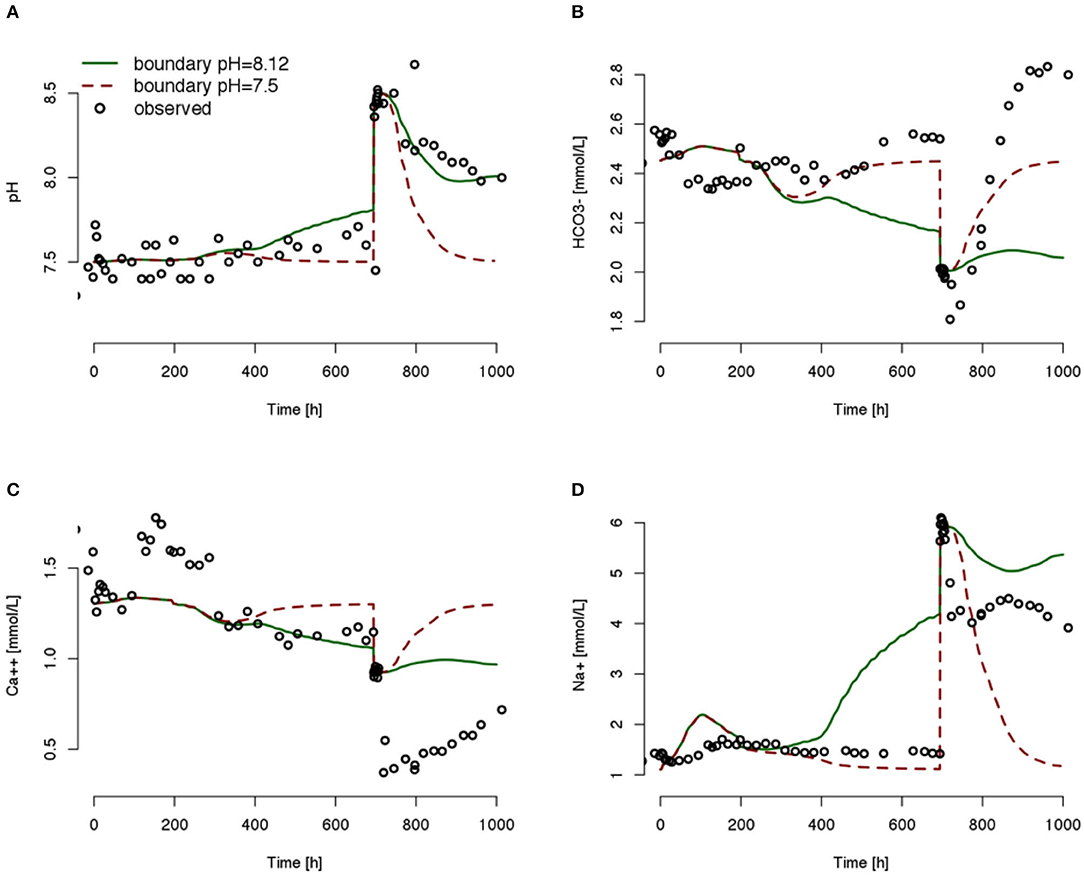
Figure 11. Simulated and observed geochemical conditions, pH (A), HCO3− (B), Ca++ (C), and Na+ (D) at well 2–28. Simulation results are adopted from one realization of the set of simulations that produced Figures 8, 9.
Without belaboring all these experiments, results from the best combination in reproducing uranium behavior at 2-28 is shown in Figure 12, where considerable improvements in model fit to observed uranium breakthrough and geochemical states are resulted. Model revisions associated with this set of improved results include (1) adopting an alternative SCM developed by Stoliker et al. (2011), with the same sorption and desorption reaction (e.g., Equation 1), lower logK (21.64), and higher sorption site concentration (the generic SC used by Stoliker et al., 2011 is about 1,000 times higher than the SC calculated from Equation 2 based on the SCM of Shang et al., 2011). The kinetics of sorption and desorption remained unchanged from earlier model simulations; (2) The geochemical conditions at the inflow boundaries were first prescribed as pre-injection geochemical conditions at well 2-28, and changed to post-injection geochemical conditions after 290 h of simulation time to mimic the discrepancy of geochemical conditions in 2-28 before and after the third injection; (3) lowering the Ca++ and HCO3− concentrations in the injected water to the level that was observed immediately after the injection, which could be justified by lacking of field geochemical measurements on the injected water; and (4) including cation exchange reactions. The cation exchange reactions and selectivity constants from Stoliker et al. (2011) are listed in Table 3. Cation exchange capacitance was scaled from the adsorption site concentration calculated in Equation (2). Tests using the kinetics of sorption and desorption in Shang et al. (2011) indicated that the rate is too high for the field conditions. The model revisions that led to improved uranium sorption and desorption predictions at well 2-28 further demonstrated the complexity of modeling uranium fate and transport at the field scale. Although the simulation experiments may seem ad-hoc, they provide valuable insights on improving conceptual model and its parameterization in a mechanistic and systematic way.
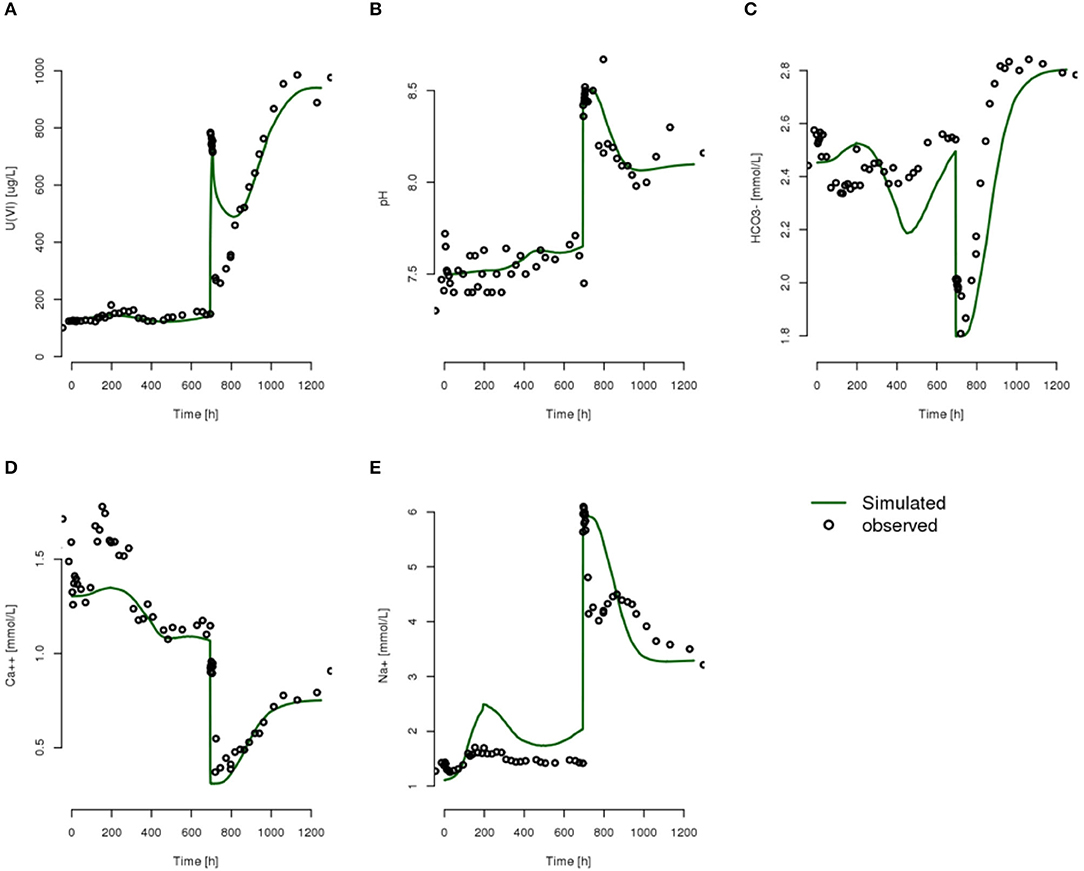
Figure 12. Simulated and Observed uranium breakthrough and key geochemical states using SCM from Stoliker et al. (2011) with stair-stepped geochemical boundary conditions, lower logK, and higher sorption site concentration. (A) U(VI), (B) pH, (C) HCO3−, (D) Ca++, and (E) Na+.
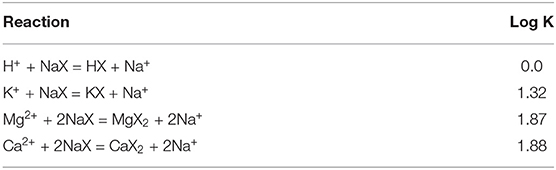
Table 3. Cation exchange reactions and rate constants.
3.3. New Insights for Improving Conceptual Model
Our injection experiments and modeling studies provide important new insights into plume scale adsorption-desorption behavior and appropriate parameters to be used in future persistence calculations. Our comprehensive, 3D flow and reactive transport modeling represents a significant advancement in addressing the variability and dynamics in uranium migration compared to earlier 1D and 2D studies (Yabusaki et al., 2008). We have extended the earlier 3D studies (Ma et al., 2010, 2014b) by dealing with heterogeneity in sorption sites and the impacts of dynamic transport boundary conditions. However, our reactive transport model has not been able to sufficiently describe the observed behaviors in all wells because of uncertainties associated with (1) lack of in-situ characterization of surface site density for uranium adsorption, (2) an unknown spatial inventory of sorbed uranium, and (3) highly dynamic effects resulting from high-frequency river stage fluctuations of the Columbia River and transient geochemical effects resulting from GW-RW interaction. The sensitivity of model simulation results to the geochemical boundary conditions underscores the importance of long-term, high-resolution monitoring of key aqueous species (at least pH, bicarbonate, and calcium concentrations) along with uranium concentrations to better constrain reactive transport models, overcoming the seemingly ad-hoc approach we had to configure our geochemical boundary conditions due to lack of field data.
Ultimately, the new process level understanding of uranium sorption/desorption dynamics, characterization of heterogeneity in geochemical properties, and inventory survey of sorbed uranium should be incorporated into a km-scale three-dimensional model, such as the hydrologic model developed by Zachara et al. (2020), to account for various exchange flow pathways that mix waters with vastly different compositions, and consequently, to capture the transient geochemical conditions that control the persistence of uranium. The conceptualization of such numerical models can be iteratively improved by comparing the model results with spatially distributed monitoring data that are high-resolution in time (more frequent than quarterly and monthly). The numerical models can also be improved by calibrating against field experimental or monitoring data. New inverse modeling method are required to deal with the high-dimensionality of model parameters, model structural uncertainty, and computational costs of conducting ensemble of forward simulations. The datasets analyzed by Zachara et al. (2016, 2020) demonstrate their unique values in revealing the degree of complexity in plume behavior and improving the conceptual models. Such knowledge and insights could be leveraged in other contaminated sites that are less well-studied.
4. Conclusions
This study investigated contaminant migration within a dynamic groundwater and river water transition zone through both field experiments and reactive transport modeling. The transport of uranium at GW-RW transition zone is affected by the interactions between hydrogeologic and geochemical heterogeneities, as well as hydrodynamic flow and geochemical conditions. We demonstrated that interdisciplinary studies that integrate hydrogeology and biogeochemistry are required to fully understand and model the dynamics of geochemical processes in this transition zone.
The availability of various valuable datasets based on previous field and laboratory experiments performed at our study site or on sediments collected from it provide unique opportunity for us to assess how model and data can be integrated to build a site-specific conceptual model for predicting contaminant plume behavior influenced by complex field hydrologic and geochemical conditions. We demonstrated in this study the importance of spatial heterogeneity in physical and geochemical properties, spatial and temporal dynamics of geochemical states, and SCM models and their parameters on uranium migration. In the efforts to improve match between observations and model predictions, we conclude that a more thorough characterization of spatially and temporally varying geochemical states/conditions, to inform both initial and boundary conditions, is as important as characterizing heterogeneities in hydrologic and geochemical properties, such as permeability and sorption site concentrations. The complex interactions between hydrologic and geochemical properties and states on modeling geochemical processes in GW-RW transition poses many non-trivial challenges for building better process models for contaminant fate and transport in this dynamic near-river environment, as well as for model calibration using data assimilation and inverse modeling techniques. The existence of materials with contrasting hydrologic and geochemical properties adds further complexity to modeling, as the dominating reactions/processes and their parameters may differ significantly.
Data Availability Statement
The datasets generated for this study are available on request to the corresponding author. The data can also be downloaded from https://sbrsfa.velo.pnnl.gov/datasets/?UUID=3a4c7573-dac4-404c-ba95-8daacc5761d3.
Author Contributions
XC developed the key concepts, designed and implemented simulations and analyses, and led the writing of the manuscript. JZ designed the study and edited the manuscript. VV and MF led and managed the field experiments, provided experimental data, and edited the manuscript. YF performed model simulations and edited the manuscript. GH assisted setting up reactive transport model in PFLOTRAN and edited the manuscript. All authors contributed to the article and approved the submitted version.
Funding
This research was supported by the U.S. Department of Energy (DOE), Office of Biological and Environmental Research (BER), as part of BER's Subsurface Biogeochemistry Research Program (SBR).
Conflict of Interest
The authors declare that the research was conducted in the absence of any commercial or financial relationships that could be construed as a potential conflict of interest.
Acknowledgments
This contribution originates from the SBR Scientific Focus Area (SFA) at the Pacific Northwest National Laboratory (PNNL). This research used resources of the National Energy Research Scientific Computing Center, a DOE Office of Science User Facility supported by the Office of Science of the U.S. Department of Energy under Contract No. DE-AC02-05CH11231. This paper describes objective technical results and analysis. Any subjective views or opinions that might be expressed in the paper do not necessarily represent the views of the U.S. Department of Energy or the United States Government. PNNL is operated for the DOE by Battelle Memorial Institute under contract DE-AC05-76RL01830.
Supplementary Material
The Supplementary Material for this article can be found online at: https://www.frontiersin.org/articles/10.3389/frwa.2020.533796/full#supplementary-material
References
Arntzen, E. V., Geist, D. R., and Dresel, P. E. (2006). Effects of fluctuating river flow on groundwater/surface water mixing in the hyporheic zone of a regulated, large cobble bed river. River Res. Appl. 22, 937–946. doi: 10.1002/rra.947
Biksey, T. M., Schultz, A. C., and Phillips, W. (2001). Ecological and human health risk assessment. Water Environ. Res. 73, 1699–1730. doi: 10.2175/106143001X144546
Boulton, A. J., Datry, T., Kasahara, T., Mutz, M., and Stanford, J. A. (2010). Ecology and management of the hyporheic zone: stream–groundwater interactions of running waters and their floodplains. J. North Am. Benthol. Soc. 29, 26–40. doi: 10.1899/08-017.1
Chen, X., Hammond, G. E., Murray, C. J., Rockhold, M. L., Vermeul, V. R., and Zachara, J. M. (2013). Application of ensemble-based data assimilation techniques for aquifer characterization using tracer data at Hanford 300 area. Water Resour. Res. 49, 7064–7076. doi: 10.1002/2012WR013285
Chen, X., Murakami, H., Hahn, M. S., Hammond, G. E., Rockhold, M. L., Zachara, J. M., et al. (2012). Three-dimensional Bayesian geostatistical aquifer characterization at the Hanford 300 Area using tracer test data. Water Resour. Res. 48, 1–20. doi: 10.1029/2011WR010675
Conant, B., Cherry, J. A., and Gillham, R. W. (2004). A PCE groundwater plume discharging to a river: influence of the streambed and near-river zone on contaminant distributions. J. Contam. Hydrol. 73, 249–279. doi: 10.1016/j.jconhyd.2004.04.001
Davis, J. A., Coston, J. A., Kent, D. B., and Fuller, C. C. (1998). Application of the surface complexation concept to complex mineral assemblages. Environ. Sci. Technol. 32, 2820–2828. doi: 10.1021/es980312q
Deutsch, C. V., and Journel, A. G. (1998). GSLIB: Geostatistical Software Library and User's Guide, 2nd Edn. Oxford: Oxford University Press.
Fleckenstein, J. H., Krause, S., Hannah, D. M., and Boano, F. (2010). Groundwater-surface water interactions: new methods and models to improve understanding of processes and dynamics. Adv. Water Resour. 33, 1291–1295. doi: 10.1016/j.advwatres.2010.09.011
Ford, R. (2004). The Impact of Ground-Water/Surface-Water Interactions on Contaminant Transport with Application to an Arsenic Contaminated Site. Technical report, U.S. Environmental Protection Agency, Office of Research and Development, National Risk Management Research Laboratory, Ground Water ad Ecosystems Restoration Division, Ada, OK.
Hammond, G. E., and Lichtner, P. C. (2010). Field-scale model for the natural attenuation of uranium at the Hanford 300 Area using high-performance computing. Water Resour. Res. 46, 1–31. doi: 10.1029/2009WR008819
Hammond, G. E., Lichtner, P. C., and Mills, R. T. (2014). Evaluating the performance of parallel subsurface simulators: an illustrative example with PFLOTRAN. Water Resour. Res. 50, 208–228. doi: 10.1002/2012WR013483
Harvey, J., Gomez-Velez, J., Schmadel, N., Scott, D., Boyer, E., Alexander, R., et al. (2019). How hydrologic connectivity regulates water quality in river corridors. JAWRA J. Am. Water Resour. Assoc. 55, 369–381. doi: 10.1111/1752-1688.12691
Harvey, J., and Gooseff, M. (2015). River corridor science: Hydrologic exchange and ecological consequences from bedforms to basins. Water Resour. Res. 51, 6893–6922. doi: 10.1002/2015WR017617
Johnson, T. C., Slater, L. D., Ntarlagiannis, D., Day-Lewis, F. D., and Elwaseif, M. (2012). Monitoring groundwater-surface water interaction using time-series and time-frequency analysis of transient three-dimensional electrical resistivity changes. Water Resour. Res. 48, 1–13. doi: 10.1029/2012WR011893
Liu, C., Shang, J., Kerisit, S., Zachara, J. M., and Zhu, W. (2013). Scale-dependent rates of uranyl surface complexation reaction in sediments. Geochim. Cosmochim. Acta 105, 326–341. doi: 10.1016/j.gca.2012.12.003
Liu, C., Zachara, J. M., Qafoku, N. P., and Wang, Z. (2008). Scale-dependent desorption of uranium from contaminated subsurface sediments. Water Resour. Res. 44, 1–13. doi: 10.1029/2007WR006478
Ma, R., Liu, C., Greskowiak, J., Prommer, H., Zachara, J., and Zheng, C. (2014a). Influence of calcite on uranium(VI) reactive transport in the groundwater-river mixing zone. J. Contam. Hydrol. 156, 27–37. doi: 10.1016/j.jconhyd.2013.10.002
Ma, R., Zheng, C., Liu, C., Greskowiak, J., Prommer, H., and Zachara, J. M. (2014b). Assessment of controlling processes for field-scale uranium reactive transport under highly transient flow conditions. Water Resour. Res. 50, 1006–1024. doi: 10.1002/2013WR013835
Ma, R., Zheng, C., Prommer, H., Greskowiak, J., Liu, C., Zachara, J., et al. (2010). A field-scale reactive transport model for U(VI) migration influenced by coupled multirate mass transfer and surface complexation reactions. Water Resour. Res. 46:W05509. doi: 10.1029/2009WR008168
Murakami, H., Chen, X., Hahn, M. S., Liu, Y., Rockhold, M. L., Vermeul, V. R., et al. (2010). Bayesian approach for three-dimensional aquifer characterization at the Hanford 300 Area. Hydrol. Earth Syst. Sci. 14, 1989–2001. doi: 10.5194/hess-14-1989-2010
Murray, C. J., Zachara, J. M., McKinley, J. P., Ward, A., Bott, Y. J., Draper, K., et al. (2013). Establishing a geochemical heterogeneity model for a contaminated vadose zone-aquifer system. J. Contam. hydrol. 153, 122–140. doi: 10.1016/j.jconhyd.2012.02.003
Peterson, R., and Connelly, M. (2004). Water movement in the zone of interaction between groundwater and the Columbia River, Hanford Site, Washington. J. Hydraul. Res. 42, 53–58. doi: 10.1080/00221680409500047
Rockhold, M., Waichler, S., Saunders, D., Clayton, R., and Strickland, C. (2009). Soil Water Balance and Recharge Monitoring at the Hanford Site-FY09 Status Report. Technical Report Report PNNL-18807, Pacific Northwest National Laboratory, Richland, WA. doi: 10.2172/992383
Shang, J., Liu, C., Wang, Z., and Zachara, J. M. (2011). Effect of grain size on Uranium(VI) surface complexation kinetics and adsorption additivity. Environ. Sci. Technol. 45, 6025–6031. doi: 10.1021/es200920k
Shuai, P., Chen, X., Song, X., Hammond, G. E., Zachara, J., Royer, P., et al. (2019). Dam operations and subsurface hydrogeology control dynamics of hydrologic exchange flows in a regulated river reach. Water Resour. Res. 55, 2593–2612. doi: 10.1029/2018WR024193
Stanford, J. A., and Ward, J. V. (1988). The hyporheic habitat of river ecosystems. Nature 335, 64–66. doi: 10.1038/335064a0
Stanford, J. A., and Ward, J. V. (1993). An ecosystem perspective of alluvial rivers: connectivity and the hyporheic corridor. J. North Am. Benthol. Soc. 12, 48–60. doi: 10.2307/1467685
Stoliker, D. L., Kent, D. B., and Zachara, J. M. (2011). Quantifying differences in the impact of variable chemistry on equilibrium Uranium(VI) adsorption properties of aquifer sediments. Environ. Sci. Technol. 45, 8733–8740. doi: 10.1021/es202677v
Stoliker, D. L., Liu, C., Kent, D. B., and Zachara, J. M. (2013). Characterizing particle-scale equilibrium adsorption and kinetics of Uranium(VI) desorption from U-contaminated sediments. Water Resour. Res. 49, 1163–1177. doi: 10.1002/wrcr.20104
Tomassoni, G. (1999). “A federal statutory/regulatory/policy perspective on remedial decision-making with respect to ground-water/surface-water interaction,” in Proceedings of the Ground-Water/Surface-Water Interactions Workshop (Denver, CO), 13–14.
Um, W., Zachara, J. M., Liu, C., Moore, D. A., and Rod, K. A. (2010). Resupply mechanism to a contaminated aquifer: a laboratory study of U(VI) desorption from capillary fringe sediments. Geochim. Cosmochim. Acta 74, 5155–5170. doi: 10.1016/j.gca.2010.02.001
US-EPA (1991). A Review of Methods for Assessing Nonpoint Source Contaminated Ground-Water Discharge to Surface Water. Technical report, U.S. Environmental Protection Agency, Office of Water, Washington, DC.
Ward, A. S., and Packman, A. I. (2019). Advancing our predictive understanding of river corridor exchange. Wiley Interdisc. Rev. 6:e1327. doi: 10.1002/wat2.1327
Yabusaki, S. B., Fang, Y., and Waichler, S. R. (2008). Building conceptual models of field-scale uranium reactive transport in a dynamic vadose zone-aquifer-river system. Water Resour. Res. 44:W12403. doi: 10.1029/2007WR006617
Yin, J., Haggerty, R., Stoliker, D. L., Kent, D. B., Istok, J. D., Greskowiak, J., et al. (2011). Transient groundwater chemistry near a river: Effects on U(VI) transport in laboratory column experiments. Water Resour. Res. 47, 1–11. doi: 10.1029/2010WR009369
Zachara, J. M., Chen, X., Murray, C., and Hammond, G. (2016). River stage influences on uranium transport in a hydrologically dynamic groundwater-surface water transition zone. Water Resour. Res. 52, 1568–1590. doi: 10.1002/2015WR018009
Zachara, J. M., Chen, X., Song, X., Shuai, P., Murray, C., and Resch, C. T. (2020). Kilometer-scale hydrologic exchange flows in a gravel-bed river corridor and their implications to solute migration. Water Resour. Res. 56:e2019WR025258. doi: 10.1029/2019WR025258
Keywords: tracer injection experiments, reactive transport modeling, data assimilation, surface water and groundwater interaction, river corridor
Citation: Chen X, Zachara JM, Vermuel VR, Hammond G, Freshley M and Fang Y (2020) Understanding Contaminant Migration Within a Dynamic River Corridor Through Field Experiments and Reactive Transport Modeling. Front. Water 2:533796. doi: 10.3389/frwa.2020.533796
Received: 10 February 2020; Accepted: 09 October 2020;
Published: 25 November 2020.
Edited by:
Harrie-Jan Hendricks Franssen, Helmholtz Association of German Research Centers (HZ), GermanyReviewed by:
Kenneth Hurst Williams, Lawrence Berkeley National Laboratory, United StatesRui Ma, China University of Geosciences Wuhan, China
Copyright © 2020 Chen, Zachara, Vermuel, Hammond, Freshley and Fang. This is an open-access article distributed under the terms of the Creative Commons Attribution License (CC BY). The use, distribution or reproduction in other forums is permitted, provided the original author(s) and the copyright owner(s) are credited and that the original publication in this journal is cited, in accordance with accepted academic practice. No use, distribution or reproduction is permitted which does not comply with these terms.
*Correspondence: Xingyuan Chen, Xingyuan.Chen@pnnl.gov