 Vitalii Starchenko
- Chemical Sciences Division, Oak Ridge National Laboratory, Oak Ridge, TN, United States
A fundamental understanding of mineral precipitation kinetics relies largely on microscopic observations of the dynamics of mineral surfaces exposed to supersaturated solutions. Deconvolution of tightly bound transport, surface reaction, and crystal nucleation phenomena still remains one of the main challenges. Particularly, the influence of these processes on texture and morphology of mineral precipitate remains unclear. This study presents a coupling of pore-scale reactive transport modeling with the Arbitrary Lagrangian-Eulerian approach for tracking evolution of explicit solid interface during mineral precipitation. It incorporates a heterogeneous nucleation mechanism according to Classical Nucleation Theory which can be turned “on” or “off.” This approach allows us to demonstrate the role of nucleation on precipitate texture with a focus at micrometer scale. In this work precipitate formation is modeled on a 10 micrometer radius particle in reactive flow. The evolution of explicit interface accounts for the surface curvature which is crucial at this scale in the regime of emerging instabilities. The results illustrate how the surface reaction and reactive fluid flow affect the shape of precipitate on a solid particle. It is shown that nucleation promotes the formation of irregularly shaped precipitate and diminishes the effect of the flow on the asymmetry of precipitation around the particle. The observed differences in precipitate structure are expected to be an important benchmark for reaction-driven precipitation in natural environments.
1. Introduction
Recent advances in studies of natural minerals and chemical processes occurring in the subsurface have significantly improved understanding of reaction kinetics at mineral-water interfaces (Brantley et al., 2008; Putnis and Ruiz-Agudo, 2013; Beckingham et al., 2016; Yuan et al., 2019; Noiriel et al., 2020). However, there is still a gap in understanding how to derive the kinetic coefficients or order of reactive rate from the fundamental physical or chemical parameters of the system. Some studies approach this problem from the atomic scale using advanced molecular dynamics techniques to calculate transition-state theory rate constant (Raiteri et al., 2010; Stack et al., 2012). Furthermore, different upscaling techniques connect local molecular scale processes obtained from Atomic Force Microscopy data to overall reactivity (Teng et al., 2000; Yoreo et al., 2009; Bracco et al., 2013). In these studies the rate of crystal growth is linked to the surface features and their dynamics such as velocity of step propagation (Bosbach et al., 1996), kink cite density (Higgins et al., 2000), presence of impurity ions (Weber et al., 2018), and two dimensional nucleation (Pina et al., 1998).
At the same time, modern computational techniques and synchrothron-based sources allowed us to investigate mineral reactivity at meso- and pore-scale using reactive transport modeling and X-ray tomography (Godinho et al., 2016; Noiriel et al., 2019). These methods provide an opportunity to incorporate flow in porous media (Molins et al., 2014) and resolve the interface between solid and fluid (Dutka et al., 2020).
The most used reaction rates for minerals are empirically derived from batch-type reaction experiments, in which the ideal mixing condition is expected, mineral particles are assumed to be impermeable, and the reactive surface of particles is determined by the methods such as BET (Plummer and Busenberg, 1982; Zhen-Wu et al., 2016). Such methods give a good estimate rate law that allow calculating reaction kinetics for a particular mineral. Moreover, the general expressions have been developed to describe difference between nucleation-dominated and growth-dominated regimes. For instance, the precipitation mechanism of barite mineral is described as a spiral hillock growth at low degrees of supersaturation and two-dimensional nucleation-dominated growth at high degrees of supersaturation (Bosbach, 2002). The transition from one to another is estimated to be at about Ω = 50 which corresponds to the saturation index SI ≈ 1.699. The growth rate follows the second order
where k is the reaction rate constant, Ω is the saturation state in the solution, and n is the reaction order.
However, there is still a lack of theoretical tools which can be used to derive the transition between different precipitation regimes or predict the structure and texture of precipitate under conditions at which the transport phenomena has a major impact (Molins et al., 2017). Moreover, vast majority of the modeling tools neglect the nucleation process during mineral precipitation. It is particularly important in case the nucleation defines the reactive surface area and local distribution of the sites at which growth reaction can occur.
Although incorporation of nucleation process into the pore-scale reactive modeling has been done in several previous works, it still remains a challenging problem which require novel approaches to be developed. The reason for that is mostly related to approximations which are needed for connecting the scales between several nanometers (approximate size of a nucleus) and several micrometers (typical size of a pore in pore-scale reactive modeling). Additionally, the lack of information regarding surface properties of a particular material, such as heterogeneity in the interfacial energy between solid substrate and reactive liquid, and general debates regarding nucleation mechanisms (Gebauer et al., 2008; De Yoreo et al., 2015; Weber et al., 2021) make determination or estimation of nucleation rates particularly challenging. The importance of incorporating nucleation process into the reactive transport modeling emerged when only growth processes failed to match experimental results. For instance, simulation of CO2 deteriorated cement could not reproduce experimental results using only growth kinetics (Li et al., 2017). After implementing nucleation mechanism based on Classical Nucleation Theory (CNT) into 1D reactive transport model the authors successfully matched the experiments. Prasianakis et al. introduced cross scale modeling concept into 2D Lattice Boltzmann approach for reactive transport which was applied to realistic 2D geometry of porous media (Prasianakis et al., 2017). In their approach authors linked CNT and growth of nuclei at atomic level represented as a parameter in particular cell of the simulation lattice. The nucleation rate was calculated based on local concentration in the cell and the surface area and growth rate of spherical nuclei was traced through the simulation. This approach provides a powerful tool to compare effect of homogeneous and heterogeneous nucleation, however the necessity to link the nucleation to a volume of Lattice-Boltzmann grid may introduce artifacts in case of high concentration gradients near interfaces. Another way to model nucleation process is calculation of the induction time or the time of the first stable crystals appearance. To implement randomness of spatial distribution of nuclei, Fazeli et al. (2020) introduced a normal distribution for probabilistic induction times. The authors coupled the probabilistic induction times to the 2D Lattice Boltzmann approach for reactive transport, which allowed them to connect the local induction time to the local concentration and vary reactive fluid saturation, mineral growth rate, and flow rates.
The novelty of the method developed in the current study consists in: (a) the implementation of nucleation on an explicit surface mesh (body fitted grids) which locally takes into account area of each face of the mesh, (b) ability to calculate normal and surface curvature using points which belong to the surface mesh (inset in the Figure 1C) (c) continuous motion of surface mesh points along the normal vector proportionally to the local reaction rate, (d) utilization of unstructured and non-uniform grids for volume mesh (Figures 1B–D), and (f) use of heterogeneous nucleation rate (expressed in number of nuclei per area per time) directly for calculating the probability of nucleation at each time step proportional to the local face area of the surface mesh.
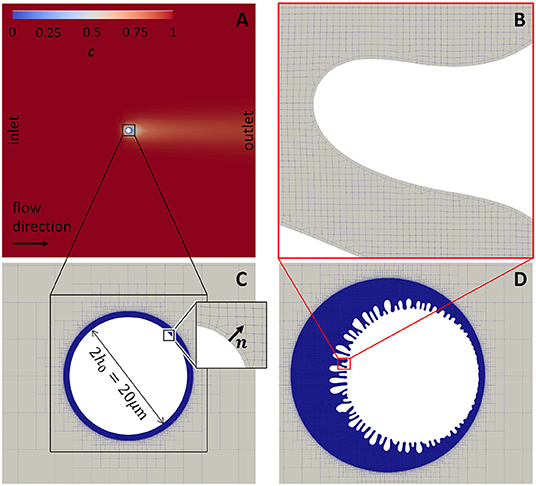
Figure 1. The geometry and initial concentration distribution in the flow around a particle in two dimensional simulation domain. (A) Concentration distribution in a whole 2D simulation domain of 1 × 1 mm with a particle of radius 10 μm at the center of the domain. (B) Mesh at the boundary between the meshed fluid domain and solid. (C) Meshed domain around the particle before precipitation (initial geometry). (D) Meshed domain around the particle after precipitation.
Precise control of interface dynamics has substantial implications in geological and environmental systems as it is described in recent comprehensive review by Noiriel and Soulaine (2021). The review is focused on recent advances in X-ray computed tomography (Noiriel and Daval, 2017; Yuan et al., 2021) and development of pore-scale reactive transport models (Molins et al., 2012; Prasianakis et al., 2020; Soulaine et al., 2021; Yang et al., 2021). In both, experimental and numerical studies it is emphasized that the accurate capture of the fluid-solid interface is extremely important (Hunter et al., 2020; Khatoonabadi et al., 2021; Noiriel et al., 2021; Qin and Beckingham, 2021).
The two specific knowledge gaps this study is focused on are (a) the dynamics of fluid-solid interface and instability phenomena in wide range of reaction and flow rates including high concentration gradients near the surface (Supplementary Figure 2), and (b) interconnection between heterogeneous reaction, nucleation, and transport phenomena (both convective and diffusive) and their influence on evolution of the precipitate texture.
This manuscript is organized as follows. First, the governing equations for the model are introduced in the section 2. Also, in this section the implementation of nucleation procedure on the liquid-solid interface is described using the Classical Nucleation Theory. The results of precipitate growth simulations are presented in section 3 in which the importance of nucleation and its effect on precipitate texture is discussed. In the section 4, the dynamics of surface roughness and surface velocity propagation are analyzed. The results summary and direction of the future studies are discussed in the section 5.
2. Model
Here, the pore-scale modeling approach is used in which the interface between solid and fluid is explicitly introduced via fitting boundary of the simulation domain to the shape of a solid (body fitted grid). As it is typical for geochemical systems, fluid is considered to be incompressible. The heterogeneous reaction is modeled at the boundary and results in precipitation of a solid phase. The displacement of the surface mesh is modeled using Arbitrary Eulerian-Lagrangian (ALE) approach (Hirt et al., 1997).
2.1. Governing Equations
The fluid motion is described by incompressible Navier-Stokes equations
where u is the fluid velocity, p is the pressure normalized by the fluid density, ν is the kinematic viscosity. The transport of reactant is described by a convection-diffusion equation
where c is the reactant concentration, D is the molecular diffusion coefficient.
The heterogeneous precipitation reaction is implemented as a boundary condition applied to the reactive surface. In this simplified model for mineral precipitation a binary reaction is considered, in which the concentrations of anions, A, and cations, B, in the solution define the saturation state of the solution in respect to a mineral AB. Schematically it can be represented as
It is assumed that the species A and B have equal concentrations and are well mixed at the inlet. Also, it is assumed that the diffusion of ions is similar, and the activity coefficient for both type of ions is equal to 1. The Onsager correction to the diffusive transport, which has been shown having significant impact in case of mineral dissolution (Dutka et al., 2020) in comparison to lesser effect during precipitation (Yang et al., 2021), is not considered in this work. Thus, the Equation (3) can be solved for only one type of species and the saturation state, Ω, can be expressed as
where ceq is the equilibrium ion concentrations for a specific mineral.
Therefore, the surface reaction rate and Equation (1) can be rewritten in terms of local concentration
To model the surface motion it is imposed that the flux of mineral ions to the surface during precipitation must match the reaction rate R(c) (Szymczak and Ladd, 2012).
where n is the normal to the surface (inset in the Figure 1C). During precipitation process a solid-fluid interface, Γ, is propagated. The interface is modeled by a boundary mesh that confines the simulation domain and represents the reactive surface. The points of the surface mesh are propagating with velocity uΓ
where νm is the molar volume of the mineral.
2.2. Dimensionless Equations
For the convenience, the governing equations can be scaled using the unit of time, td, and the unit of length, h0,
where hat above a symbol indicates that the quantity is dimensionless. In this study the equations are scaled using td = 0.01 s and h0 = 10μm (see Table 2).
Correspondingly, pressure, viscosity, and molecular diffusion coefficient are scaled as
In order to make transport equation dimensionless the concentration of reactant is scaled by the concentration at the inlet ĉ = c/cin. Then, the dimensionless governing Equations (2) and (3) can be rewritten as
By scaling reaction rate as the Equation (7) can be rewritten as
where .
Typically, to analyze dynamic processes that are governed by flow conditions and reaction rates a set of dimensionless numbers is defined (Soulaine et al., 2017; Starchenko and Ladd, 2018; Xu et al., 2020). This study is relevant to the case in which the flow rates are relatively low and the work is focused on competition between reaction and transport. Thus, the most interesting dimensionless numbers are the Pèclet number (Pe) and the second Damköhler number (DaII), which represent ratio of flow rate to diffusive rate and reaction rate to diffusive rate
where uin is the flow velocity at the inlet, and R(cin) is the reaction rate which corresponds to the inlet concentration. Following the dimensional scaling, the Equation (8) for the interface motion can be written as
Replacing using the Equation (13) the interface motion velocity can be expressed as
where .
By scaling the reactant concentration with cin and defining θ = cin/ceq the reaction rate Equation (6) can be rewritten as,
2.3. Surface Energy
Analysis of Mullins–Sekerka instability (Mullins and Sekerka, 2004) shows that fast growing interfaces generate perturbations with wavelength which is not bound by lower limit. To stabilize the growth, the Gibbs-Thomson relation (Landau and Lifshitz, 1980) was included into the model. It implies that interfaces with higher curvature will require more energy to form. Therefore, the effective equilibrium concentration, , becomes higher and suppresses the short-wavelength perturbations. The stabilizing mechanism corresponds to the additional term for the equilibrium concentration at the solid-fluid interface where the curvature is large. Therefore, the concentration gradient gets smaller and regulates the growth of the interface by removing indefinitely small wavelength of the perturbations. In general, the expression for curvature-dependent equilibrium concentration according to Gibbs-Thomson relation can be described (Rigos and Deutch, 1986) as follows
where γ is the interfacial free energy of material, κ(r) is the curvature of the surface at a particular location, R is the gas constant, and T is temperature. The expression can be simplified using simple expansion
where d0 = (γνm)/(RT) is the capillary constant, and is the dimensionless curvature.
2.4. Nucleation Model
Nucleation during mineral precipitation can follow either classical or non-classical pathways. The non-classical pathway includes such processes as pre-nucleation cluster formation, particle aggregation, transition between mineral polymorphs, etc. (De Yoreo et al., 2015), which is not considered in this work. The Classical Nucleation Theory states that to form a stable nucleus the particle has to exceed a certain size to overcome an energy barrier which arises from the balance between penalty on the formation of new surface and the total crystal lattice volume energy of a particle. This work is focused on heterogeneous nucleation which means the mineral precipitates on the surface and not in the solution. Based on CNT, nucleation rate defines number of particles which can nucleate on a particular surface area at a certain period. The heterogeneous nucleation rate, Js, is a function of the free energy change, ΔG, during the nucleation of a new phase (Fernandez-Martinez et al., 2013; Li et al., 2014) on the fluid-solid interface
where A is a prefactor. The ΔG is a function of interfacial free energy, γ, and the supersaturation, lnΩ:
where β = 16π/3 is the geometric factor, NA is the Avogadro number.
To introduce nucleation in the model it is assumed that a single nucleus can not be resolved. Therefore, each face of the volume mesh, which defines the interface between fluid and solid, is marked as non-reactive until a nucleation event occurs. The probability of a stochastic event (which obeys a rate law J) in time t can be expressed as an exponential probability distribution function: Jexp(−Jt). The cumulative distribution function over period of time, Δt, is an integral of probability distribution
The Equation (22) defines the nucleation probability on a particular face of the area Af, where J = AfJs. Once the condition for nucleation is reached, the face is marked as a reactive one and the boundary condition (13) is applied. The current model does not resolve a single nucleus growth. Since a single nucleus does not cover the face completely, the surface coverage parameter, χ, is introduced, which indicates a ratio between the covered area and total area of each cell. It is assumed that a single nucleation event generates a hemisphere that covers an area of 5 nm2. Assuming that the nucleation adds much less precipitate than mineral growth, the increment for the surface coverage parameter was derived from the growth of a hemisphere with a growth rate corresponding to Equation (17). Therefore, the change in surface coverage in a particular cell each time step can be defined as
where is a dimensionless increment of the hemisphere radius at a particular growth rate
This model is a rough estimation of real processes and does not capture multiple nucleation events, crystal surface energy anisotropy which defines shape of crystalline particles, nuclei impingement, etc. However, it allows smoothing out transition from non-reactive surface to a reactive one when the resolution of a single nucleus is not possible. Surface coverage for a particular face is changing within the range 0 ≤ χ ≤ 1. The reaction rate on the partially covered face is scaled proportionally to the surface coverage . This results in an inert surface at χ = 0 and fully reactive surface at χ = 1. The detailed future studies are needed to make current nucleation model applicable to specific materials or minerals. The nucleation rate is controlled by changing the prefactor A in Equation (20).
2.5. Implementation
Fluid flow and transport equations were solved using an open-source Computational Fluid Dynamics package OpenFOAM®. OpenFOAM® is based on the finite volume discretization. The details of numerical implementation of the OpenFOAM® software can be found elsewhere (Jasak, 1996; Weller et al., 1998). The PISO algorithm used for solving the equations is described in detail in a recent book (Moukalled et al., 2016). The interface motion was implemented using earlier development of the simplified Arbitrary-Lagrangian-Eulerian (ALE) method in dissolFoam solver (Starchenko et al., 2016) which is also described in a recent review paper (Molins et al., 2021).
Briefly, the method implemented in this work combines the pisoFoam solver from OpenFOAM for transient incompressible flow (based on the PISO algorithm), the transient convection-diffusion equation, dynamic volume meshes (implemented in OpenFOAM) and boundary mesh motion/relaxation implemented in dissolFoam solver.
Since the shape of the growing features in some cases is highly irregular, the topological changes to an initial mesh are necessary. In current implementation, remeshing procedure using OpenFOAM meshing tool snappyHexMesh was performed with different intervals through the simulation depending on how unstable the growth is and how rough the surface becomes. The higher the curvature of the growing dendrites the faster the mesh will become significantly distorted. In average for all simulations the criterion for remeshing was set to 1000 time steps. The time integration scheme used in the simulations is Euler implicit scheme which is first order accurate. The spatial discretization is a second-order accurate (Jasak, 1996; Tuković and Jasak, 2012). To perform the simulations, the CADES high performance computing cluster at Oak Ridge National Laboratory was used.
2.6. Geometry, Initial, and Boundary Conditions
The geometry used in this study represents a spherical particle in a flow (Figure 1A). To simplify the visualization, accelerate calculations, and capture the interface growth, 2D simulations are performed in this study. It is important to note that current implementation is capable to model 3D geometry with no additional changes, however, at higher computational cost. A particle at the center of the domain is a cylinder which is confined between two parallel planes with empty boundary conditions. The boundaries in the direction perpendicular to the flow (top and bottom of the Figure 1A) are implemented as the symmetry boundary condition. The flow was defined by the constant flow rate condition. Fluid velocity was set to uin value at the inlet (left side of the Figure 1A) and pressureInletVelocity boundary condition at the outlet. At the solid surface of a particle a no-slip boundary condition was applied.
For the concentration field and transport Equation (3) a custom boundary condition was implemented at the reactive surface. It follows the balance equation (13), reaction rate equation (17), and implements a curvature correction to the equilibrium concentration according to the Equation (19). Additionally, in case of enabled nucleation, the rate is scaled proportionally to the parameter χ. The concentration field is scaled by the reactant concentration at the inlet, cin, (see section 2.2), therefore a Dirichlet boundary condition for ĉ is applied at the inlet and always ĉ = 1. The details of implementation of custom Robin boundary condition for concentration at reactive surface can be found in Starchenko et al. (2016). Also, the details were added to Supplementary Material for convenience. At the outlet a zeroGradient Newman boundary condition is applied.
A starting point for all simulations (time 0) is a steady state solution for the flow and reactant concentration. During simulation the transient Equations (2) and (3) are solved and combined with dynamic mesh motion until the mesh becomes highly distorted and required remeshing (described in section 2.5). After remeshing, the volume fields are mapped from the old to the new mesh using OpenFOAM's field mapping tool mapFieldsPar with the mapping method option correctedCellVolumeWeight. It implements the cell-volume-weighted mesh-to-mesh based interpolation. After the volume fields are mapped to the new mesh, the simulation (transient equations with dynamic mesh) is restarted.
Radius of a particle in the flow is 10 μm and the total dimensions of a domain is 1 × 1 mm. To accelerate calculations, the non-uniform meshes were used in this study. Figure 1C shows the magnified area near the particle to demonstrate the refinement of the mesh near the surface. Figure 1D shows the same area after surface was moved as a result of the precipitation. It demonstrates the need of refinement near the interface in order to resolve features that occur due to the instability growth. Figure 1B shows magnified area around one of the surface features that demonstrates the finest cells. All meshes were generated using snappyHexMesh tool. Briefly, the 2D simulation domain was divided into 320 × 320 cells followed by 6× refinement around the particle surface. Total number of cells is not fixed in the simulation due to the nature of the method and meshing procedures. Average number of cells at the beginning of the simulation did not exceed one million cells. Due to the growth of rough surfaces during precipitation (Figure 1D), the number of cells was continuously increasing during simulation after each remeshing procedure. To maintain the stability of the fluid flow solver the timestep, δt, was chosen to satisfy condition , where Co is a Courant number, is the magnitude of the velocity in the cell i, and δxi is the size of the cell i in the direction of the velocity.
In order to overcome the effect of initial instability generation, which is usually related either to mesh symmetry or floating point numerical error, roughness was introduced on the surface of the initial particle (Figure 2). The algorithm is similar to the generation of roughness on surface of the fracture described in Starchenko et al. (2016). Briefly, the displacements were generated on the surface of a spherical particle using Fourier synthesis (Peitgen, 1988). The standard deviation in the displacement was set to 0.003h0. In case of fracture dissolution, it has been shown that the evolving dissolution patterns in fractures is insensitive to the amplitude and correlation length which characterizes the roughness of the initial fracture surface (Upadhyay et al., 2015). Nevertheless, it is still debated how much surface roughness affects mineral precipitation, which is a topic of the future studies. In case of nucleation, the simulation starts from the smooth surface, since the randomness of the initial growing points is guaranteed by the implemented nucleation algorithm.
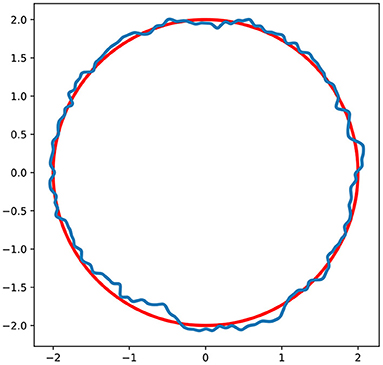
Figure 2. Surface roughness generation. Red line is an initial surface of the particle. Blue line is a surface of a particle with generated roughness.
To calculate mean local curvature scalar of the surface mesh, the functionality of finiteArea method implemented in OpenFOAM® is used. The implementation details can be found in work of Tuković and Jasak (Tuković and Jasak, 2012).
3. Results
Calcite mineral (CaCO3) has been chosen as a reference material for the precipitation. Calcite precipitation is a complex process that depends on many parameters such as CO2 pressure, pH of the solution, etc. Moreover, CaCO3 precipitation can result in a variety of polymorphs (including amorphous calcium carbonate). To focus on the implementation of the pore-scale reactive transport model coupled with heterogeneous reactions and dynamic interface, the simplest surface reaction model has been chosen. The concentrations of counterions Ca2+ and are defined by the equation (3) and the precipitation rate equation (6). Table 1 contains parameters for calcite precipitation. Equilibrium concentration for calcite was estimated as the square root of the equilibrium constant published by Plummer and Busenberg (Plummer and Busenberg, 1982). Additionally, the capillary length in the Equation (19) is assumed to be cm. It is clear that the mentioned above assumptions and simplifications, such as Equation (6), result in a system which do not reflect fully the actual conditions for calcite mineral precipitation. The parameters used in this work needed to be reasonable and close enough to a realistic system. However, to model precipitation of a specific mineral, parameters such as reaction rate constants need to be carefully reviewed and, perhaps, corrections such as ion activities need to be used instead of concentrations to calculate species diffusivity and local saturation states.
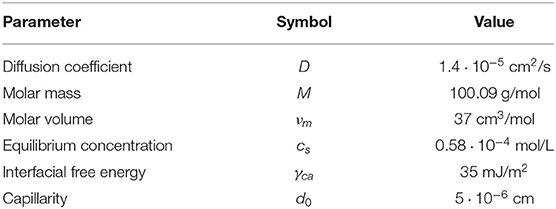
Table 1. Parameters for the calcite mineral precipitation.
3.1. Precipitate Growth
In the parametric study, a Pèclet–Damköhler diagram demonstrates that both reaction and flow rate define regime of mineral precipitation (Figure 3). Namely, the rates control the instability emergence during the evolution of the reactive surface. To effectively change DaII and Pe numbers, the reaction rate constant k and flow velocity at the inlet uin are varied. In most of the simulations the inlet concentration is assumed to be mol/L. Although the reaction rate constant for calcite precipitation is mol/cm2/s (Nilsson and Sternbeck, 1999), for the parametric study k was varied in the range between 10−4 and 10−10 mol/cm2/s; and uin was varied in the range between 0.01 and 10 cm/s. All other parameters used in simulations are summarized in Table 2.
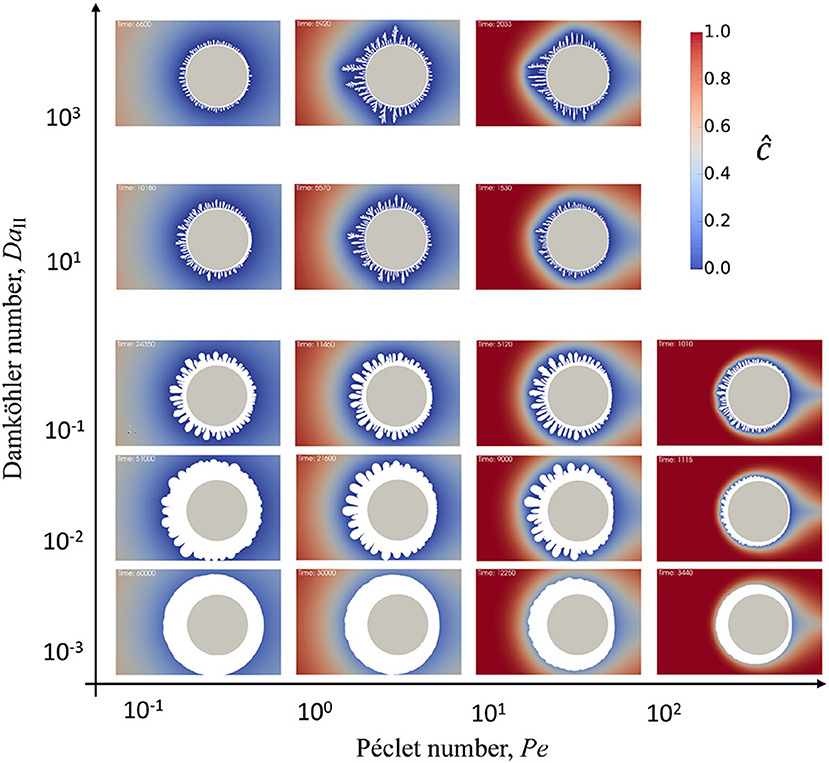
Figure 3. Second Damköhler number, DaII, vs. Péclet number, Pe, phase diagram of precipitation patterns on a particle in reactive flow. The initial particle is shown in gray, precipitate is shown in white, and blue-to-red color scheme shows distribution of reactive species in solution around the particle and solid precipitate.
Table 2. Constant parameters used in simulations.
The diagram in Figure 3 shows the result of precipitation at different flow rate and reaction rate conditions. The simulation images in the diagram were taken at different simulation times and scaled to the same size for comparison. The particle in the center of each snapshot in Figure 3 is shown to demonstrate the scale. At very high Pe numbers the criteria dictated by Co number makes the timestep very small. For instance, at Pe = 7.14·102, which is the last row in Figure 3, the corresponding . This requires significantly longer simulation times, however, the snapshots included into the diagram demonstrate the general tendency. Although a generation of the short wave instabilities is limited by the Gibbs-Thomson effect, the diagram shows that the number of growing features increases and the size of the instability decreases with increasing DaII and Pe numbers. This remains consistent with early works on Mullins–Sekerka instability (Langer, 1980) reflecting that the faster the surface growth the more unstable it becomes. The diagram demonstrates that this effect can be achieved by either enhancing the reaction itself by increasing the rate constant or by increasing transport of reactant to the solid surface (in this case, increasing flow velocity). Moreover, the higher the reaction rate—the higher the curvature of the growing features which start to grow as very thin dendrites with many branches.
In general, by moving from low to high Pe numbers the diffusive layer around the reactive particle becomes smaller. This results in enhanced transport of reactant to the particle interface and, therefore, smaller wavelength of the instability that corresponds to higher reaction rate. Additionally, for all Da numbers the increase in fluid flow velocity introduces anisotropy into the amount of precipitate. The precipitate growth faster on the front side of the particle exposed to the flow. The amount of reactant that reaches the back side of the particle is smaller since it is consumed during the precipitation. Therefore, the overall reaction rate is reduced.
It can be seen in the diagram in Figure 3 that a primary dense precipitate layer growth around the initial particle which then branches into the dendrites. However, the thickness of the primary layer depends on the reaction and flow rates. The primary layer thickens at low DaII and Pe. In real systems it can probably be controlled by the surface roughness or surface defects as well. The growth of the primary layer slows down as dendrites start to grow and at a particular time it is terminated completely. Eventually, the porous secondary precipitate layer is formed out of the growing dendrites which screen the primary layer by consuming all the reactant from the solution.
3.2. Nucleation
To test the coupling of surface growth with nucleation a comparison between the evolution of precipitate on the surface of a particle in flow with nucleation “on” and “off” (Figure 4) was done at different reaction rates. The nucleation switch set to “on” in the solver modifies the boundary condition on the particle in the flow so that initially the surface is inert (i.e., reaction rate is set to zero) and after nucleation it is proportional to the surface coverage (Equation 23) as it is described in the section 2.4. Figures 4A,C correspond to the nucleation switch set to “on.” Figures 4B,D correspond to the case in which nucleation is “off” and the rest of the parameters are the same. The concentration at the inlet was set to mol/L, the equilibrium concentration was set to mol/L, and the flow rate was such that Pe = 0.71. Figures 4A,B correspond to the reaction rate constant k = 10−8 mol/cm2/s and Figures 4C,D correspond to k = 10−6 mol/cm2/s. It is important to note that the parameter lR from the Equation (13) depends on cin. Therefore, the effect of diffusional hindrance on the reaction rate is different from Figure 3 and the resulting growth of precipitate will be different as well. In simple geometries such as channel flow it is possible to estimate an effective reaction rate which includes diffusional hindrance (Szymczak and Ladd, 2012). However, in case of more complex geometries like mineral grain in flow (Dutka et al., 2020) the correction is only an approximation. Although such detailed analysis of diffusional hindrance in the interfacial layer is not included in current manuscript, it is an interesting topic for future studies, especially in case of charged surfaces.
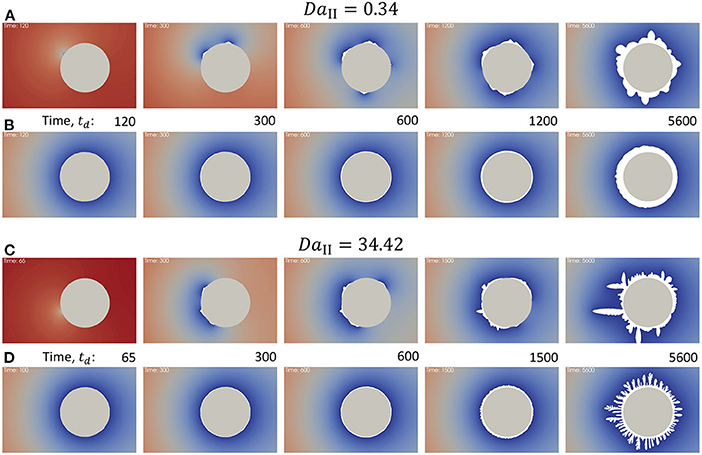
Figure 4. Precipitation on a particle in flow, Pe = 0.71. Time when the snapshots were taken is shown in time units, td. (A) DaII = 0.34 and nucleation is “on,” initial surface is inert. (B) DaII = 0.34 and nucleation is “off,” initial surface is reactive. (C) DaII = 34.42 and nucleation is “on.” (D) DaII = 34.42 and nucleation is “off.”
Since in case of nucleation “on” initial surface is inert, the concentration around the particle in the beginning becomes equal to the concentration at the inlet. After nucleation event occurs the faces of the surface mesh become reactive and the nucleation sites consume reactant locally as it can be seen at time 300td (Figure 4). At both low and high reaction rates nucleation affects distribution of the precipitate and eventually accelerates instabilities in surface growth. The effect is more significant in case of higher reaction rate case (Figure 4C). It is interesting to note that although nucleation accelerates growth of particular sites resulting in irregular shape of the precipitate, the growth without nucleation (Figure 4D, time 5600td) creates porous precipitate with smaller dendrite features. This indicates that nucleation promotes formation of less porous however non-uniformly distributed precipitate.
As it was shown above in Figure 3, the higher flow rate effectively increases the reaction rate at the surface and reduces the width of the dendrites. Figure 5 demonstrates the influence of nucleation rate on precipitate shape at different flow rates. The snapshots were taken at different simulation times chosen so that the total amount of precipitate in all 6 cases was the same. Comparison between low flow rate at Pe = 0.714 (Figure 5A) and high flow rate at Pe = 71.4 (Figure 5B) demonstrates that at all modeled nucleation rate values the width of the growing features slightly decreases for smaller flow rates as expected. It is interesting to note that decreasing nucleation rate results in reduced asymmetry of the precipitate caused by the flow direction. In fact, in Figure 5 at ln (A) = 15 demonstrates that the flow direction almost does not affect whether there is more precipitate on the front or back side of the particle, whereas this effect can be seen at lower nucleation rate [ln (A) = 20] or in case without nucleation.
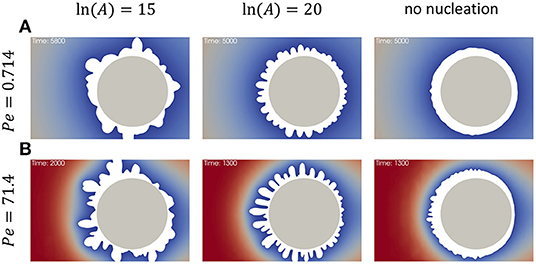
Figure 5. Effect of nucleation rate on the precipitation on a particle in reactive flow at DaII = 0.34. (A) Pe = 0.714, (B) Pe = 71.4. The snapshots in the left column correspond to nucleation rate prefactor ln (A) = 15, in the middle column ln (A) = 20, and in the right column the nucleation is “off” (all surface is reactive from the beginning).
4. Discussion
Since precipitate shape is anisotropic due to the flow direction (in case nucleation is “off”), a plausible way to present the data is in form of angular distribution. Figure 6 shows dependence of surface velocity magnitude, , and surface curvature, , as function of angular coordinate φ. The angular coordinate is defined to be φ = 0 = 2π in the back side of the particle and φ = π in the front side of the particle which faces the flow (Figure 6A). Both max and min functions of and were applied to the groups of points on the interface which were gathered within ranges 4°(i−1) < φ ≤ 4°i, where i = 0, 1, 2, .., 90. In other words, the full range of angular coordinate [0, 2π) is divided into 90 bins and then the max and min functions were applied to the points that correspond to each bin.
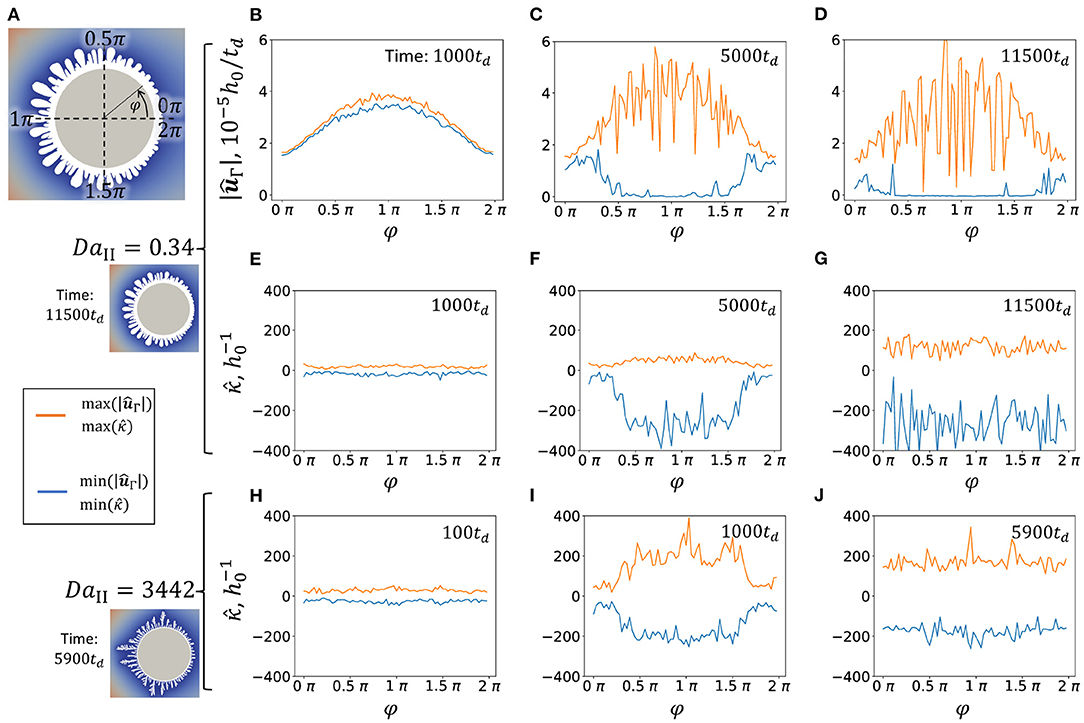
Figure 6. Maximum and minimum of surface velocity magnitude, , and surface curvature, , distribution along angular coordinate φ at flow rate Pe = 7.14. (A) Schematics of angular coordinate φ definition. (B–D) and at different simulation times (DaII = 0.34). (E–G) and at different simulation times (DaII = 0.34). (H–J) and at different simulation times (DaII = 3442). Little snapshots on the right demonstrate the shape of precipitate at corresponding DaII at the later simulation times.
Figures 6B,C show the change in surface velocity of growing precipitate. Initially, the profiles of and are similar with total maximum located at the front side of the particle at φ = π and total minimum located at the back side of the particle. At later stages, the drops to zero in range 0.5π < φ ≤ 1.5π at time 5000td and almost all around the particle at time 11500td. This behavior corresponds to the formation of the primary dense layer around the particle and complete termination of its growth at later stages due to the screening from reactant by growing dendrites. Figure 6C indicates that the growth termination occurs earlier at the front side.
To investigate the evolution of surface the curvature at high (DaII = 3, 442) and low (DaII = 0.34) reaction rates at different stages of precipitation is compared. Negative curvature corresponds to the concave area of the precipitate surface in respect to the solution. Figures 6E,H demonstrate similar structure of precipitate at early stages. Naturally, at later stages of precipitation, growth of dendrites generates highly curved surfaces. Both, concave and convex areas become more curved. As it was discussed above, higher reaction rate promotes shorter wavelength instabilities. Accordingly, the curvature of growing features is smaller at lower reaction rates (orange curves in Figures 6F,G,I,J). However, the curvature of concave areas remains in the same range for both high and low reaction rates (blue curves in Figures 6F,G,I,J). It can be interpreted that the average distance between dendrites is much less affected by the reaction rate than the width of the growing dendrites.
Figure 7 shows the flow velocity maps which correspond to the data presented in Figure 6. The color map is scaled to in order to focus on the area of growing dendrites. The value of absolute maximum velocity in whole domain was registered between 1.2 and 1.25 depending on the case and simulation time. Figure 7A corresponds to the Figures 6B–G and Figure 7B corresponds to the Figures 6H–J. At early simulation stages both velocity maps develop similarly mostly defined by the shape of the initial particle. At later stages, lower reaction rate results in wider dendrites as it can be seen in Figure 7A at time 11500td in comparison to Figure 7B at time 5900td. However, in both cases fluid velocity drops almost to zero between the dendrites, which means that convective transport of reactive ions in channels between dendrites is absent. Therefore, one can hypothesize that the diffusive nature of reactive species in channels between dendrite branches controls the channel width. To test this hypothesis in future studies one should carefully consider both diffusive transport of reactive species into the channel and reactive flux balance at the fluid-solid interface controlled by the Equation 7.
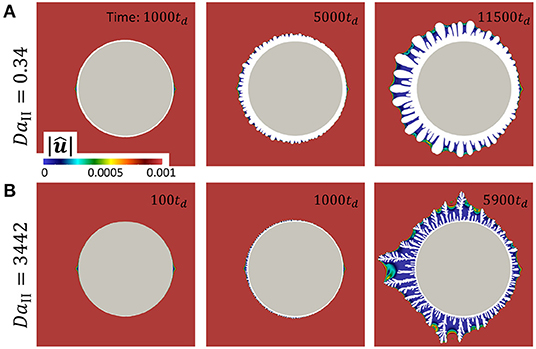
Figure 7. Flow velocity map and precipitate shape which correspond to the data in Figure 6. (A) DaII = 0.34. (B) DaII = 0.34. The color map is scaled to . The snapshots were taken at the simulation times which correspond to the data in Figure 6.
In this study only a 2D geometry is considered. Therefore, the amount of precipitated material proportional to the mass of the mineral can be estimated as the area of precipitate (Figure 8). First two figures (Figures 8A,B) show the amount of precipitate in time at different values of DaII and Pe without nucleation. Figure 8A demonstrates that only at lowest the curve differs from the rest of the cases. This means that mostly the simulations are performed in transport limited regime. It is also confirmed by the Figure 8B, which demonstrates a significant influence of flow rate (or Pe) on the accumulation of precipitate.
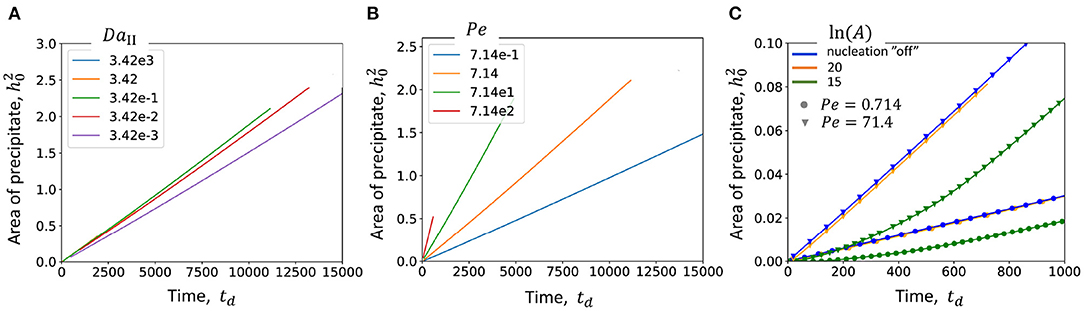
Figure 8. Amount of precipitate vs. simulation time. (A) At different DaII numbers; (B) At different Pe numbers; (C) in case of nucleation is “off” (blue) and “on” at ln A = 20 (orange) and 15 (green) the dependencies are presented at Pe = 0.714 and Pe = 71.4, which corresponds to the data presented in Figure 8.
Interestingly, comparison of the amount of precipitate in case of nucleation “on” and “off” shows that at high nucleation rates (ln A = 20) the curves almost overlap (blue and orange curves in Figure 8C). Only at lower nucleation rates (green curve) the growth of precipitate is delayed at earlier times. However, nucleation does not affect the slope of the curve at later times. Similar behavior is observed at low and high flow rates (Pe = 0.714 and Pe = 7.14). This might indicate that although nucleation affects the shape of precipitate as it was demonstrated in Figure 8, it does not change the overall kinetics in case of limited available reactive surfaces, such as a surface of a particle in flow in this study.
5. Conclusions
In this paper a model that couples pore-scale reactive transport with the Arbitrary Lagrangian-Eulerian approach to simulate interface motion during mineral precipitation has been described. Additionally, the heterogeneous nucleation based on CNT was integrated into the model. The ALE approach allows us to stabilize the short wavelength instabilities by including surface curvature dependent equilibrium concentration. To demonstrate the interplay between reactive transport, chemical reaction, and nucleation phenomena the precipitate formation on a single particle in reactive flow has been modeled.
In the first part of the study (nucleation is turned “off”), Pèclet–Damköhler diagram demonstrates the influence of reaction and flow rate on the shape of the precipitate. The emergence of Mullins–Sekerka instability on growing surfaces becomes more pronounced at higher DaII and Pe numbers. All simulation cases show an appearance of a primary dense precipitate layer around the particle and a secondary porous precipitate layer formed by the instabilities. It is shown that the growth of the dense layer is completely terminated at later times due to the inability of reactant to penetrate into pores. Although the absolute thickness of the primary layer most likely depends on the condition of initial surface in real systems (such as defects, roughness, chemical heterogeneity), the presented model shows that at equal initial conditions the thickness decreases at higher reaction and higher flow rates.
In the second part of the study (nucleation is turned “on”), it is demonstrated that nucleation promotes formation of irregularly shaped precipitate by enhancing instabilities in surface growth. Additionally, it is shown that low nucleation rate reduces the impact of flow direction on the asymmetry of formed precipitate around the particle. Although the shape of precipitate is irregular [Figure 5 at ln (A) = 15], there is no distinct asymmetry (front vs. back of the particle) which is present at larger nucleation rates and when all surface is reactive from the beginning of the simulation. Nevertheless, it is expected that the limit exists at which nucleation is also affected by the flow direction. This requires rigorous studies which perhaps can capture nucleation at mesoscale when single nucleation events can be distinguished.
The presented model provides the capability to simulate complex fluid-solid interfaces and their dynamics. It captures highly irregular surfaces with great precision, utilizes non-uniform meshes for efficient computation and resolution of high concentration gradients, and allows us to introduce required surface properties (e.g., surface coverage). Although this study presents results of two dimensional simulations, the implementation is not limited to 2D. It does not require additional changes to the solver (except of generating different simulation domain). The full 3D simulations are necessary to model a realistic system, since surface instabilities might be suppressed by 2D. Also, it is necessary to simulate a 3D flow in porous systems with significantly more complex pore geometries, since the flow patterns even in 2D can have significantly different properties depending on solid fraction, pore distribution and pore texture (Ramanuj et al., 2020). Naturally, the presented work does not cover all aspects of mineral precipitation process. The number of assumptions and approximations which were discussed in the paper require a careful revision. Directions for the future development should take into account phenomena that become important at the mesoscale, for instance: crystal surface energy anisotropy that defines mineral crystal facets, transport in confinement or near charged interfaces at scales just slightly larger than Debye length, collective growth of individually resolved nuclei.
Data Availability Statement
The raw data supporting the conclusions of this article will be made available by the authors, without undue reservation.
Author Contributions
VS wrote the solver, performed the simulations and analysis, and prepared the manuscript.
Funding
This work was supported by the U.S. Department of Energy, Office of Science, Office of Basic Energy Sciences, Chemical Sciences, Geosciences, and Biosciences Division. This research used resources of the Compute and Data Environment for Science (CADES) at the Oak Ridge National Laboratory, which was supported by the Office of Science of the U.S. Department of Energy under Contract No. DE-AC05-00OR22725.
Conflict of Interest
The author declares that the research was conducted in the absence of any commercial or financial relationships that could be construed as a potential conflict of interest.
Licenses and Permissions
This manuscript has been authored in part by UT-Battelle, LLC, under contract DE-AC05-00OR22725 with the US Department of Energy (DOE). The US Government retains and the publisher, by accepting the article for publication, acknowledges that the US government retains a nonexclusive, paid-up, irrevocable, and worldwide license to publish or reproduce the published form of this manuscript or allow others to do so, for US government purposes. DOE will provide public access to these results of federally sponsored research in accordance with the DOE Public Access Plan (http://energy.gov/downloads/doe-public-access-plan). The author declares that the research was conducted in the absence of any commercial or financial relationships that could be construed as a potential conflict of interest.
Publisher's Note
All claims expressed in this article are solely those of the authors and do not necessarily represent those of their affiliated organizations, or those of the publisher, the editors and the reviewers. Any product that may be evaluated in this article, or claim that may be made by its manufacturer, is not guaranteed or endorsed by the publisher.
Acknowledgments
VS would like to acknowledge helpful discussions with Anthony J. C. Ladd (University of Florida) and Piotr Szymczak (University of Warsaw).
Supplementary Material
The Supplementary Material for this article can be found online at: https://www.frontiersin.org/articles/10.3389/frwa.2021.800944/full#supplementary-material
References
Beckingham, L. E., Mitnick, E. H., Steefel, C. I., Zhang, S., Voltolini, M., Swift, A. M., et al. (2016). Evaluation of mineral reactive surface area estimates for prediction of reactivity of a multi-mineral sediment. Geochim. Cosmochim. Acta 188, 310–329. doi: 10.1016/j.gca.2016.05.040
Bosbach, D. (2002). “Water-rock interactions, ore deposits, and environmental geochemistry a tribute to David A. Crerar,” in The Geochemical Society, Special Publication Number 7, Vol.5, eds R. Hellmann and S. A. Wood (McLean, VA: The Canadian Mineralogist), 97–110.
Bosbach, D., Junta-Rosso, J. L., Becker, U., and Hochella, M. F. (1996). Gypsum growth in the presence of background electrolytes studied by Scanning Force Microscopy. Geochim. Cosmochim. Acta 60, 3295–3304. doi: 10.1016/0016-7037(96)00147-0
Bracco, J. N., Stack, A. G., and Steefel, C. I. (2013). Upscaling calcite growth rates from the mesoscale to the macroscale. Environ. Sci. Technol. 47, 7555–7562. doi: 10.1021/es400687r
Brantley, S. L., White, A. F., and Kubicki, J. D. (2008). Kinetics of Water-Rock Interaction. New York, NY: Springer. doi: 10.1007/978-0-387-73563-4
De Yoreo, J. J., Gilbert, P. U. P. A., Sommerdijk, N. A. J. M., Penn, R. L., Whitelam, S., Joester, D., et al. (2015). Crystallization by particle attachment in synthetic, biogenic, and geologic environments. Science 349:6247. doi: 10.1126/science.aaa6760
Dutka, F., Starchenko, V., Osselin, F., Magni, S., Szymczak, P., and Ladd, A. J. (2020). Time-dependent shapes of a dissolving mineral grain: comparisons of simulations with microfluidic experiments. Chem. Geol. 540:119459. doi: 10.1016/j.chemgeo.2019.119459
Fazeli, H., Masoudi, M., Patel, R. A., Aagaard, P., and Hellevang, H. (2020). Pore-scale modeling of nucleation and growth in porous media. ACS Earth Space Chem. 4, 249–260. doi: 10.1021/acsearthspacechem.9b00290
Fernandez-Martinez, A., Hu, Y., Lee, B., Jun, Y.-S., and Waychunas, G. A. (2013). In situ determination of interfacial energies between heterogeneously nucleated CaCO 3 and quartz substrates: thermodynamics of CO2 mineral trapping. Environ. Sci. Technol. 47, 102–109. doi: 10.1021/es3014826
Gebauer, D., Volkel, A., and Colfen, H. (2008). Stable prenucleation calcium carbonate clusters. Science 322, 1819–1822. doi: 10.1126/science.1164271
Godinho, J. R. A., Gerke, K. M., Stack, A. G., and Lee, P. D. (2016). The dynamic nature of crystal growth in pores. Sci. Rep. 6:33086. doi: 10.1038/srep33086
Higgins, S. R., Bosbach, D., Eggleston, C. M., and Knauss, K. G. (2000). Kink dynamics and step growth on barium sulfate (001): a hydrothermal scanning probe microscopy study. J. Phys. Chem. B 104, 6978–6982. doi: 10.1021/jp0001135
Hirt, C., Amsden, A., and Cook, J. (1997). An arbitrary Lagrangian-Eulerian computing method for all flow speeds. J. Comput. Phys. 135, 203–216. doi: 10.1006/jcph.1997.5702
Hunter, H. A., Ling, F. T., and Peters, C. A. (2020). Metals coprecipitation with barite: nano-XRF observation of enhanced strontium incorporation. Environ. Eng. Sci. 37, 235–245. doi: 10.1089/ees.2019.0447
Jasak, H. (1996). Error analysis and estimation in the finite volume method with applications to fluid flows (Ph.D. thesis). University of London, London, United Kingdom.
Khatoonabadi, M., Prasianakis, N. I., and Mantzaras, J. (2021). Lattice Boltzmann model with generalized wall boundary conditions for arbitrary catalytic reactivity. Phys. Rev. E 103:063303. doi: 10.1103/PhysRevE.103.063303
Landau, L., and Lifshitz, E., (eds.). (1980). “Surfaces,” in Statistical Physics (Elsevier), 517–537. doi: 10.1016/C2009-0-24487-4
Langer, J. S. (1980). Instabilities and pattern formation in crystal growth. Rev. Modern Phys. 52:1. doi: 10.1103/RevModPhys.52.1
Li, Q., Fernandez-Martinez, A., Lee, B., Waychunas, G. A., and Jun, Y. S. (2014). Interfacial energies for heterogeneous nucleation of calcium carbonate on mica and quartz. Environ. Sci. Technol. 48, 5745–5753. doi: 10.1021/es405141j
Li, Q., Steefel, C. I., and Jun, Y.-S. (2017). Incorporating nanoscale effects into a continuum-scale reactive transport model for CO2-deteriorated cement. Environ. Sci. Technol. 51, 10861–10871. doi: 10.1021/acs.est.7b00594
Molins, S., Soulaine, C., Prasianakis, N. I., Abbasi, A., Poncet, P., Ladd, A. J. C., et al. (2021). Simulation of mineral dissolution at the pore scale with evolving fluid-solid interfaces: review of approaches and benchmark problem set. Comput. Geosci. 25, 1285–1318. doi: 10.1007/s10596-019-09903-x
Molins, S., Trebotich, D., Miller, G. H., and Steefel, C. I. (2017). Mineralogical and transport controls on the evolution of porous media texture using direct numerical simulation. Water Resour. Res. 53, 3645–3661. doi: 10.1002/2016WR020323
Molins, S., Trebotich, D., Steefel, C. I., and Shen, C. (2012). An investigation of the effect of pore scale flow on average geochemical reaction rates using direct numerical simulation. Water Resour. Res. 48:W03527. doi: 10.1029/2011WR011404
Molins, S., Trebotich, D., Yang, L., Ajo-Franklin, J. B., Ligocki, T. J., Shen, C., et al. (2014). Pore-scale controls on calcite dissolution rates from flow-through laboratory and numerical experiments. Environ. Sci. Technol. 48, 7453–7460. doi: 10.1021/es5013438
Moukalled, F., Mangani, L., and Darwish, M. (2016). The Finite Volume Method in Computational Fluid Dynamics. Cham: Springer International Publishing. doi: 10.1007/978-3-319-16874-6
Mullins, W. W., and Sekerka, R. F. (2004). Stability of a planar interface during solidification of a dilute binary alloy. J. Appl. Phys. 35:444. doi: 10.1063/1.1713333
Nilsson, Ö., and Sternbeck, J. (1999). A mechanistic model for calcite crystal growth using surface speciation. Geochim. Cosmochim. Acta 63, 217–225. doi: 10.1016/S0016-7037(99)00026-5
Noiriel, C., and Daval, D. (2017). Pore-scale geochemical reactivity associated with CO2 storage: new frontiers at the fluid-solid interface. Acc. Chem. Res. 50, 759–768. doi: 10.1021/acs.accounts.7b00019
Noiriel, C., Oursin, M., and Daval, D. (2020). Examination of crystal dissolution in 3D: a way to reconcile dissolution rates in the laboratory? Geochim. Cosmochim. Acta 273, 1–25. doi: 10.1016/j.gca.2020.01.003
Noiriel, C., Oursin, M., Saldi, G., and Haberthür, D. (2019). Direct determination of dissolution rates at crystal surfaces using 3D X-ray microtomography. ACS Earth Space Chem. 3, 100–108. doi: 10.1021/acsearthspacechem.8b00143
Noiriel, C., Seigneur, N., Le Guern, P., and Lagneau, V. (2021). Geometry and mineral heterogeneity controls on precipitation in fractures: an X-ray micro-tomography and reactive transport modeling study. Adv. Water Resour. 152:103916. doi: 10.1016/j.advwatres.2021.103916
Noiriel, C., and Soulaine, C. (2021). Pore-scale imaging and modelling of reactive flow in evolving porous media: tracking the dynamics of the fluid-rock interface. Transport Porous Media 140, 181–213. doi: 10.1007/s11242-021-01613-2
Pina, C. M., Becker, U., Risthaus, P., Bosbach, D., and Putnis, A. (1998). Molecular-scale mechanisms of crystal growth in barite. Nature 395, 483–486. doi: 10.1038/26718
Plummer, L. N., and Busenberg, E. (1982). The solubilities of calcite, aragonite and vaterite in CO2-H2O solutions between 0 and 90°C, and an evaluation of the aqueous model for the system CaCO3-CO2-H2O. Geochim. Cosmochim. Acta 46, 1011–1040. doi: 10.1016/0016-7037(82)90056-4
Prasianakis, N. I., Curti, E., Kosakowski, G., Poonoosamy, J., and Churakov, S. V. (2017). Deciphering pore-level precipitation mechanisms. Sci. Rep. 7:13765. doi: 10.1038/s41598-017-14142-0
Prasianakis, N. I., Haller, R., Mahrous, M., Poonoosamy, J., Pfingsten, W., and Churakov, S. V. (2020). Neural network based process coupling and parameter upscaling in reactive transport simulations. Geochim. Cosmochim. Acta 291, 126–143. doi: 10.1016/j.gca.2020.07.019
Putnis, C. V., and Ruiz-Agudo, E. (2013). The mineral-water interface: where minerals react with the environment. Elements 9, 177–182. doi: 10.2113/gselements.9.3.177
Qin, F., and Beckingham, L. E. (2021). The impact of mineral reactive surface area variation on simulated mineral reactions and reaction rates. Appl. Geochem. 124:104852. doi: 10.1016/j.apgeochem.2020.104852
Raiteri, P., Gale, J. D., Quigley, D., and Rodger, P. M. (2010). Derivation of an accurate force-field for simulating the growth of calcium carbonate from aqueous solution: a new model for the calcite?water interface. J. Phys. Chem. C 114, 5997–6010. doi: 10.1021/jp910977a
Ramanuj, V., Starchenko, V., Sankaran, R., and Kidder, M. K. (2020). Characteristics of flow through randomly packed impermeable and permeable particles using pore resolved simulations. Chem. Eng. Sci. 228:115969. doi: 10.1016/j.ces.2020.115969
Rigos, A. A., and Deutch, J. M. (1986). Concentration effects on the Mullins-Sekerka instability. J. Chem. Phys. 86, 7119–7125. doi: 10.1063/1.452361
Soulaine, C., Pavuluri, S., Claret, F., and Tournassat, C. (2021). porousMedia4Foam: Multi-SCALE open-source platform for hydro-geochemical simulations with OpenFOAM®. Environ. Modell. Softw. 145:105199. doi: 10.1016/j.envsoft.2021.105199
Soulaine, C., Roman, S., Kovscek, A., and Tchelepi, H. A. (2017). Mineral dissolution and wormholing from a pore-scale perspective. J. Fluid Mech. 827, 457–483. doi: 10.1017/jfm.2017.499
Stack, A. G., Raiteri, P., and Gale, J. D. (2012). Accurate rates of the complex mechanisms for growth and dissolution of minerals using a combination of rare-event theories. J. Am. Chem. Soc. 134, 11–14. doi: 10.1021/ja204714k
Starchenko, V., and Ladd, A. J. C. (2018). The development of wormholes in laboratory-scale fractures: perspectives from three-dimensional simulations. Water Resour. Res. 54, 7946–7959. doi: 10.1029/2018WR022948
Starchenko, V., Marra, C. J., and Ladd, A. J. C. (2016). Three-dimensional simulations of fracture dissolution. J. Geophys. Res. Solid Earth 121, 6421–6444. doi: 10.1002/2016JB013321
Szymczak, P., and Ladd, A. J. C. (2012). Reactive-infiltration instabilities in rocks. Fracture dissolution. J. Fluid Mech. 702, 239–264. doi: 10.1017/jfm.2012.174
Teng, H. H., Dove, P. M., and De Yoreo, J. J. (2000). Kinetics of calcite growth: Surface processes and relationships to macroscopic rate laws. Geochim. Cosmochim. Acta 64, 2255–2266. doi: 10.1016/S0016-7037(00)00341-0
Tuković, Ž., and Jasak, H. (2012). A moving mesh finite volume interface tracking method for surface tension dominated interfacial fluid flow. Comput. Fluids 55, 70–84. doi: 10.1016/j.compfluid.2011.11.003
Upadhyay, V. K., Szymczak, P., and Ladd, A. J. C. (2015). Initial conditions or emergence: what determines dissolution patterns in rough fractures? J. Geophys. Res. B Solid Earth 120, 6102–6121. doi: 10.1002/2015JB012233
Weber, J., Bracco, J. J. N., Poplawsky, J. D. J., Ievlev, A. V. A., More, K. K. L., Lorenz, M., et al. (2018). Unraveling the effects of strontium incorporation on barite growth–in situ and ex situ observations using multiscale chemical imaging. Crystal Growth Design 18, 5521–5533.
Weber, J., Bracco, J. N., Yuan, K., Starchenko, V., and Stack, A. G. (2021). Studies of mineral nucleation and growth across multiple scales: review of the current state of research using the example of barite (BaSO 4). ACS Earth Space Chem. 5, 3338–3361. doi: 10.1021/acsearthspacechem.1c00055
Weller, H. G., Tabor, G., Jasak, H., and Fureby, C. (1998). A tensorial approach to computational continuum mechanics using object-oriented techniques. Comput. Phys. 12:620. doi: 10.1063/1.168744
Xu, L., Szymczak, P., Toussaint, R., Flekkøy, E. G., and Måløy, K. J. (2020). Dissolution phase diagram in radial geometry. Front. Phys. 8:369. doi: 10.3389/fphy.2020.00369
Yang, F., Stack, A. G., and Starchenko, V. (2021). Micro-continuum approach for mineral precipitation. Sci. Rep. 11:3495. doi: 10.1038/s41598-021-82807-y
Yoreo, J. J. D., Zepeda-Ruiz, L. A., Friddle, R. W., Qiu, S. R., Wasylenki, L. E., Chernov, A. A., et al. (2009). Rethinking classical crystal growth models through molecular scale insights: consequences of kink-limited kinetics. Crystal Growth Design 9, 5135–5144. doi: 10.1021/cg900543g
Yuan, K., Starchenko, V., Lee, S. S., De Andrade, V., Gursoy, D., Sturchio, N. C., et al. (2019). Mapping three-dimensional dissolution rates of calcite microcrystals: effects of surface curvature and dissolved metal ions. ACS Earth Space Chem. 3, 833–843. doi: 10.1021/acsearthspacechem.9b00003
Yuan, K., Starchenko, V., Rampal, N., Yang, F., Yang, X., Xiao, X., et al. (2021). Opposing effects of impurity ion Sr 2+ on the heterogeneous nucleation and growth of barite (BaSO 4). Crystal Growth Design 21, 5828–5839. doi: 10.1021/acs.cgd.1c00715
Keywords: mineral precipitation, pore-scale modeling, crystal nucleation, interface motion, reactive transport modeling, Mullins–Sekerka instability, Pèclet–Damköhler diagram
Citation: Starchenko V (2022) Pore-Scale Modeling of Mineral Growth and Nucleation in Reactive Flow. Front. Water 3:800944. doi: 10.3389/frwa.2021.800944
Received: 24 October 2021; Accepted: 30 November 2021;
Published: 14 January 2022.
Edited by:
James E. McClure, Virginia Tech, United StatesReviewed by:
Peter Kang, University of Minnesota Twin Cities, United StatesFrancesco Costanzo, The Pennsylvania State University (PSU), United States
Copyright © 2022 Starchenko. This is an open-access article distributed under the terms of the Creative Commons Attribution License (CC BY). The use, distribution or reproduction in other forums is permitted, provided the original author(s) and the copyright owner(s) are credited and that the original publication in this journal is cited, in accordance with accepted academic practice. No use, distribution or reproduction is permitted which does not comply with these terms.
*Correspondence: Vitalii Starchenko, starchenkov@ornl.gov