 Justin Nichols1*
 Aashish Sanjay Khandelwal1Peter Regier1,2Betsy Summers1,3
 David J. Van Horn4
 Ricardo González-Pinzón1*
- 1Department of Civil, Construction and Environmental Engineering, University of New Mexico, Albuquerque, NM, United States
- 2Marine and Coastal Research Laboratory, Pacific Northwest National Laboratory, Sequim, WA, United States
- 3U.S. Army Corps of Engineers, Albuquerque, NM, United States
- 4Department of Biology, University of New Mexico, Albuquerque, NM, United States
Climate change is causing pronounced shifts during winter in the US, including shortening the snow season, reducing snowpack, and altering the timing and volume of snowmelt-related runoff. These changes in winter precipitation patterns affect in-stream freeze-thaw cycles, including ice and snow cover, and can trigger direct and indirect effects on in-stream physical, chemical, and biological processes in ~60% of river basins in the Northern Hemisphere. We used high-resolution, multi-parameter data collected in a headwater stream and its local environment (climate and soil) to determine interannual variability in physical, chemical, and biological signals in a montane stream during the winter of an El Niño and a La Niña year. We observed ~77% greater snow accumulation during the El Niño year, which caused the formation of an ice dam that shifted the system from a primarily lotic to a lentic environment. Water chemistry and stream metabolism parameters varied widely between years. They featured anoxic conditions lasting over a month, with no observable gross primary production (GPP) occurring under the ice and snow cover in the El Niño year. In contrast, dissolved oxygen and GPP remained relatively high during the winter months of the La Niña year. These redox and metabolic changes driven by changes in winter precipitation have significant implications for water chemistry and biological functioning beyond the winter. Our study suggests that as snow accumulation and hydrologic conditions shift during the winter due to climate change, hot-spots and hot-moments for biogeochemical processing may be reduced, with implications for the downstream movement of nutrients and transported materials.
Introduction
Winter is the fastest warming season in most of the US, and this is causing a shortening of the snow season, a reduction in snow pack, and shifts in the timing and volume of snowmelt related runoff (Grimm et al., 2013; Godsey et al., 2014; Elias et al., 2021; Climate Central, 2022). The reduction in snowpack volume has been attributed to increasing winter temperatures resulting in more frequent winter melt events (Musselman et al., 2021), shifts in precipitation from snow to rain (Berghuijs et al., 2014), and lower total precipitation trends also associated with climate patterns including El Niño and La Niña (Cortés and Margulis, 2017; Goddard and Gershunov, 2020). These changes in winter precipitation patterns affect in-stream freeze–thaw cycles, including in-stream ice and snow cover, and have the potential to trigger changes to in-stream physical, chemical, and biological processes (Prowse, 2001; Prowse et al., 2006) in ~60% of river basins in the Northern Hemisphere (Allard et al., 2011).
In-stream ice and snow cover can limit the light that aquatic phototrophic communities need to grow, generating changes in primary production and autotrophy (Frenette et al., 2008). Similarly, ice and snow cover can disrupt atmosphere-water interactions, halting in-stream reaeration (Woods, 1992; Price et al., 1995; Fang and Stefan, 2009). Combined, in-stream aerobic respiration and the lack of oxygen availability from primary production and reaeration can result in increasingly anoxic conditions (Bernhardt et al., 2018), similar to what has been documented in lentic systems (Davis et al., 2020; Jansen et al., 2021). If such anoxic conditions are sustained, the main electron acceptor can switch along the redox ladder (i.e., from oxygen to nitrate to manganese, etc.), altering the overall ecological functioning of a stream and the aquatic species that can thrive under such transient conditions.
While previous studies support the notion that in-stream ice and snow cover can shift stream metabolism and ecological functioning (Schreier et al., 1980; Prowse, 2001; Loheide and Lundquist, 2009; Calapez et al., 2017), a recent review by Tolonen et al. (2019) noted that we do not currently understand the short to long-term ecological effects of ice and snow formation in streams, mainly because winter is the most understudied season in ecohydrology. Thus, little field data exists to verify hypotheses and to determine when, for how long, and how frequently ice and snow cover control metabolism in streams that experience freeze-thaw cycles. Addressing these unknowns offers an opportunity to better understand and quantify the ecological relevance of freezing streams and winters, which are intuitively associated with ecological “cold-spots” and “cold-moments,” i.e., lower than average ecological activity in space and time, but may regulate the timing and availability of key resources needed for metabolism and nutrient cycling. Thus, tackling the lack of research on winter metabolism in streams is timely because warming trends in high latitudes and altitudes indicate that freezing streams may become less abundant and frequent.
The specific objectives of this study were to (1) determine interannual variability in physical, geochemical, and biological signals in a montane stream during winters with contrasting precipitation regimes, and (2) explore the implications of these findings in the context of climate change and stream functioning. To meet these objectives, we used high-resolution, multi-parameter data collected in a headwater stream in New Mexico and its local environment (climate and soil) to link changes in winter precipitation regimes to changes in aerobic stream metabolism, a key indicator of stream functioning. We found that sustained winter anoxia and dormant aerobic stream metabolism were driven by ice and snow cover during the El Niño year (higher precipitation), and that even though freezing occurred at the top of the stream during the La Niña year (reduced precipitation), it did not cause winter anoxia and instead elevated winter aerobic metabolism. We also found that spring metabolism is highly dependent on winter precipitation. Our results suggest that a progressive decrease in winter snowpacks and the reduction of ice and snow cover on freezing streams may result in the loss of hot-moments for anaerobic metabolism, which has the potential to alter food webs and ecological functioning, not only during the winter but before and after fully anoxic conditions are established.
Methods
Site description
Our study site is in the East Fork Jemez River (EFJR), within the Valles Caldera National Preserve, New Mexico (Figure 1). The EFJR watershed is small, high-altitude catchment, with a drainage area of 107 km2 at an elevation range between 2,580 to 3,432 m. The EFJR is a 3rd order stream with a mean annual discharge of 0.06–0.09 m3/s, featuring large flow fluctuations during spring snowmelt and summer monsoon storms of up to 3 m3/s. The average channel slope at the study site is 0.057 m/m and the sinuosity is 2.04, making it a low gradient meandering stream. The sediments in the streambed are mostly organic matter, silt, and pebbles, and the average stream bank height is 0.8 m (Simino, 2002). The riparian vegetation of the EFJR consists of non-woody grass with limited canopy cover with an average growing season between March and November, and the stream fluctuates between autotrophic and heterotrophic conditions, but is net autotrophic, averaging 0.3 (Summers et al., 2020). The EFJR watershed is contained within a volcanic caldera and the vegetation is composed of extensive grasslands in the valley floors and evergreen forest biomes at higher elevations (48 and 52% of the land cover, respectively). The EFJR watershed experiences large seasonal climate variability with average monthly precipitation and air temperatures ranging between 3.1–10.6 cm and 4.1–15.9 °C, as reported in Model my Watershed (Stroud Water Research Center, 2021).
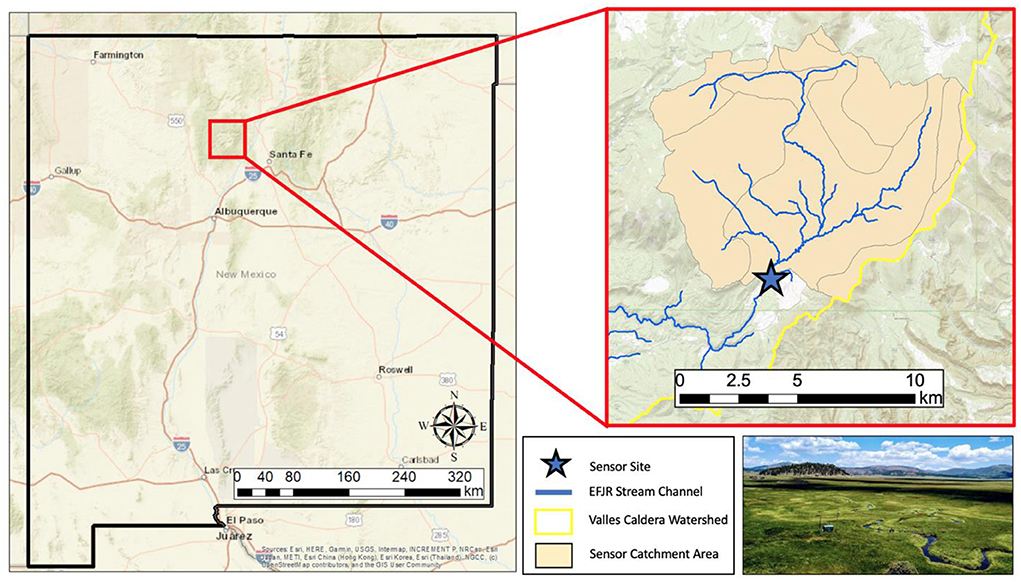
Figure 1. Map and picture of the East Fork Jemez River watershed, located in the Valles Caldera National Preserve in north central New Mexico (USA). Maps were created in Esri ArcMap 10.8.2.
Sensor deployment and processing of raw data
We collected sensor and meteorological data in the EFJR between the fall and spring seasons of 2018–2019, a weak to moderate El Niño year, and 2020–2021, a moderate La Niña year. These categories were defined based on 3-month (December–February) running means of sea surface anomalies (cf. Oceanic Niño Index from the National Oceanographic and Atmospheric Administration; http://elnino.noaa.gov/observ.html).
Sensors used
We deployed a YSI EXO2 multiparameter water quality sonde and a HOBO U20 pressure logger ~10 cm above the streambed at the sensor site. The EXO2 measured water temperature, specific conductivity, DO, fluorescent dissolved organic matter (fDOM), turbidity, and pH at 15-min intervals. The HOBO was set to log synchronously with the YSI EXO2. Meteorological data were collected 30 m away from the in-stream sensors at a climate station maintained by the Western Regional Climate Center (Western Regional Climate Center, 2021). Air temperature, solar radiation, snow depth, barometric pressure, and soil temperature (20 cm depth) were monitored at 10-min intervals. All in-stream sensors were cleaned and recalibrated every 3 weeks in accordance with USGS guidelines (Wagner et al., 2006). We equipped the study site with a solar panel, batteries, and a Campbell Scientific CR1000 datalogger to power the semi-continuous water quality sensors. During field visits, we also collected secondary DO measurements during ice- and snow-cover conditions using a YSI ProODO to validate the YSI EXO2 records. Table 1 summarizes the continuous parameters collected.
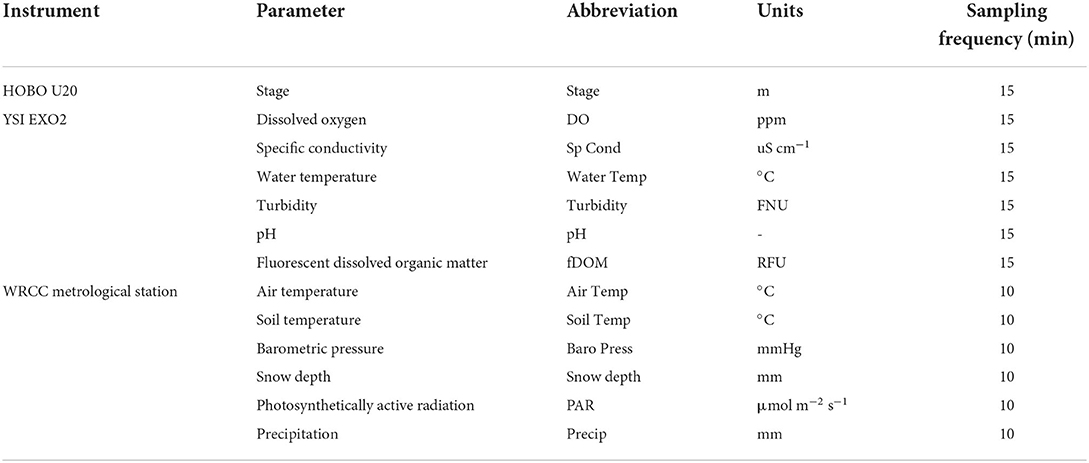
Table 1. Parameters and corresponding sensors and sampling frequencies available in our study between the fall and spring seasons of 2018–2019 and 2020–2021.
Raw data analysis
fDOM was corrected by water temperature changes following (Watras et al., 2011):
where fDOMtemp is the temperature corrected fDOM concentration (RFU), where fDOM is the uncorrected fDOM concentration (RFU), ρ is temperature-specific fluorescence coefficient of −7.545 × 10⁻³ C−1 determined experimentally using EFJR water, WT is the water temperature (C), and Tl is the lab temperature of 22 C when fDOM was calibrated. We present fDOM in RFU instead of quinine sulfate units (QSU) because QSU measurements exceeded the maximum detection limit from 22nd March to 30th April 2019.
Total solar radiation was multiplied by a factor of 2.04 to estimate photosynthetically active radiation (PAR, Meek et al., 1984). To replicate conditions within the stream water column during periods of ice- and snow-cover, PAR was set to zero if snow depth was >200 mm and if diel water temperature cycling ceased (Petrov et al., 2005).
Discharge was derived from a rating curve that was developed by relating data collected during field visits with a Sontek FlowTracker and stage data. Due to logistical constraints, discharge measurements were not taken during periods of prolonged ice- and snow-cover. Therefore, we used stage data from a downstream USGS river gage (USGS Gage: 08324000, Jemez River near Jemez, NM) to establish a time-lagged relationship between the two sites and estimate missing discharges (Summers et al., 2020) (Equations 2 and 3):
where Q (m3 s−1) is the discharge at our study site; Stage (m) is the stage data derived from the atmospheric pressure-corrected HOBO readings within periods when flow could be measured in the field; and JRstage (m) is the stage data from the Jemez River USGS gage used to estimate Q when flow could not be measured at the study site.
Data processing
Raw and converted data were processed for outliers and sensor drift with Aquarius Workstation 3.3 (Aquatic Informatics, Vancouver, British Columbia). Suspected outliers were eliminated by using a moving average filter targeting points deviating more than 20% from an hourly window (Wagner et al., 2006). We corrected for sensor drift and biofouling by comparing pre- and post-cleaning calibration values and applying a linear correction from the date of the previous maintenance. Linear interpolation was applied to data gaps that were < 12 h and an hourly resampling was performed to ensure consistent timestamps for all parameters. A final visual inspection of data quality was performed prior to any statistical analysis.
Stream metabolism
The cumulative photosynthetic and heterotrophic activity of algal and bacterial communities can be estimated as stream metabolism, an indicator of ecological functioning. We estimated daily averages of stream metabolism using the USGS StreamMetabolizer model, which uses a one-station model based on the open-channel metabolism approach (Equations 4–6), combined with inverse Bayesian modeling of diel DO, to estimate gross primary production (GPP), ecosystem respiration (ER), and reaeration coefficients (K600) (Odum, 1956; Appling et al., 2018). GPP quantifies DO production from phototrophic communities, ER quantifies DO losses due to autotrophic and heterotrophic respiration, and K600 is a standardized oxygen gas exchange rate coefficient between the water column and the atmosphere. The modeling equations used in Stream Metabolizer are:
where DOt is the observed dissolved oxygen (mg L−1) at time t; DOsat,t is the hypothetical saturated dissolved oxygen concentration (mg L−1); DOmod,t is the modeled dissolved oxygen concentration and εproc are the observation and processes errors; t0 and t1 are the beginning and end of the day (d); Zt is stage (m); PPFDt is solar radiation as PAR (μmol m−2 d−1); Tt is the water temperature (C); SA, B, C, D are dimensionless Schmidt coefficients (-); GPP is the daily average areal rate of gross primary production (); ER is the daily average areal rate of ecosystem respiration (); and K600 is the standardized gas exchange rate coefficient (d− 1).
Using results from one of our previous studies at the EFJR (Summers et al., 2020), we set the prior probability distribution's mean and standard deviations for GPP (3.9 and 1.5 , respectively) and ER (3.6 and 1.7 , respectively). We ran the model for 3,000 iterations and 1,500 burn-ins with a binned K600 bounded by the minimum and maximum discharge. During periods when we observed ice and snow cover over the water column and daily maximum water temperature did not exceed 0.2 C, we constrained K600 = 0, since reaeration cannot occur under such conditions. We verified the model's fit by validating that it converged to stable solutions and by ensuring that each parameter's Gelman-Rubin R2 value was < 1.1. We also checked for possible equifinality between ER and K600 by checking any potential covariances between the two parameters (Appling et al., 2018). The covariance between ER and K600 estimates was low with a linear correlation coefficient of −0.028 (Supplementary Figure S1).
Statistical methods and data organization
Templates and periods of analysis
We organized the results and discussion into three relevant templates: physical and atmospheric, geochemical, and DO and metabolism. The physical and atmospheric template includes time series of discharge, snow depth, temperatures (air, soil, and water), turbidity and PAR. The geochemical template includes time series of fDOM, specific conductivity, pH and DO. The DO and stream metabolism template includes time series of DO, GPP, ER, and reaeration fluxes. All datasets are also classified by season to further organize the results and discussions. To test statistical differences between seasons, we used two-sample Student's t-test taking into account autocorrelation, thus reducing type-1 error, by using the equivalent sample size method on data that was aggregated daily mean values to remove seasonality in timeseries and meet autoregressive assumption (O'Shaughnessy and Cavanaugh, 2015). Prior to performing a t-test, each parameter's seasonal daily mean values were visually inspected for normality using Q-Q plots, and if normality was not met, log transformations were performed for both the El Niño and La Niña season.
Frequency analysis
We generated spectrograms using the pspectrum function in Matlab (The Mathworks Inc., Natick, Massachusetts) for all sensor-generated time series. Spectrograms use discrete, short-time Fourier transforms to quantify the significance of sinusoidal signals at multiple frequencies or periodicities within a time series (Kirchner et al., 2000). Since diel cycling often exhibits strong seasonality in water quality data, we extracted the spectral power of our time series at a periodicity of 24-h and categorized them as strong diel cycling (>0 dB), weak diel cycling (0 to −100 dB), and no discernable diel cycling (< -100 dB). Threshold limits for diel cycling classification were determined by using water temperature, a parameter with known shifts in diel cycling, as a benchmark enabling us to relate periods with varying diel cycling with their respective spectral power. We did not include stream metabolism estimates in the spectral analysis because they were comprised of daily averaged measurements and do not hold relevant information regarding diel cycling.
Principal component analysis
We examined the relationships between parameters using a principal component analysis (PCA) conducted in Matlab. The first two principal components were determined sufficient for analysis based on the inflection point of variance percent explained (Supplementary Figure S2). Since the correlation coefficient between two parameters is equivalent to the cosine angle between their eigenvectors, parameters plotting in the same direction are positively correlated, those in opposite directions are negatively correlated, and those that are orthogonal are uncorrelated (Jolliffe and Cadima, 2016). We calculated 24 h averages for aquatic and meteorological parameters to be able to include daily estimates of stream metabolism, and standardized each parameter's daily average by centering the mean at zero and scaling by a standard deviation of one to make parameters with varying magnitudes and units comparable:
where SX is the standardized parameter X (-), and μX and σX are the mean and standard deviation of parameter X.
Results
Physical and atmospheric template
Clear differences in snow accumulation occurred between the 2018–2019 El Niño and 2020–2021 La Niña years, with greater snow accumulation taking place during the former. During the El Niño year, a large winter precipitation event increased snow depth to ~800 mm during early January 2019, and, due to numerous precipitation events, a depth of ~500 mm persisted through the end of the winter (Figure 2 and Supplementary Figure S3). In contrast, during the La Niña year, snow depth remained low (~100 mm) throughout the January to March period, with very few precipitation events and several weeks both of ~0 mm and ~200 mm snow depth (Figure 2). This between-year difference in winter snow depth was significant and represents a ~77% decrease in mean snow depth from the El Niño to La Niña year (Figure 3). Stream discharge (fall and spring), soil temperature (winter), and turbidity (fall and winter) were also significantly higher during the El Niño year, while PAR (winter) was the only physical parameter that was significantly higher during La Niña year.
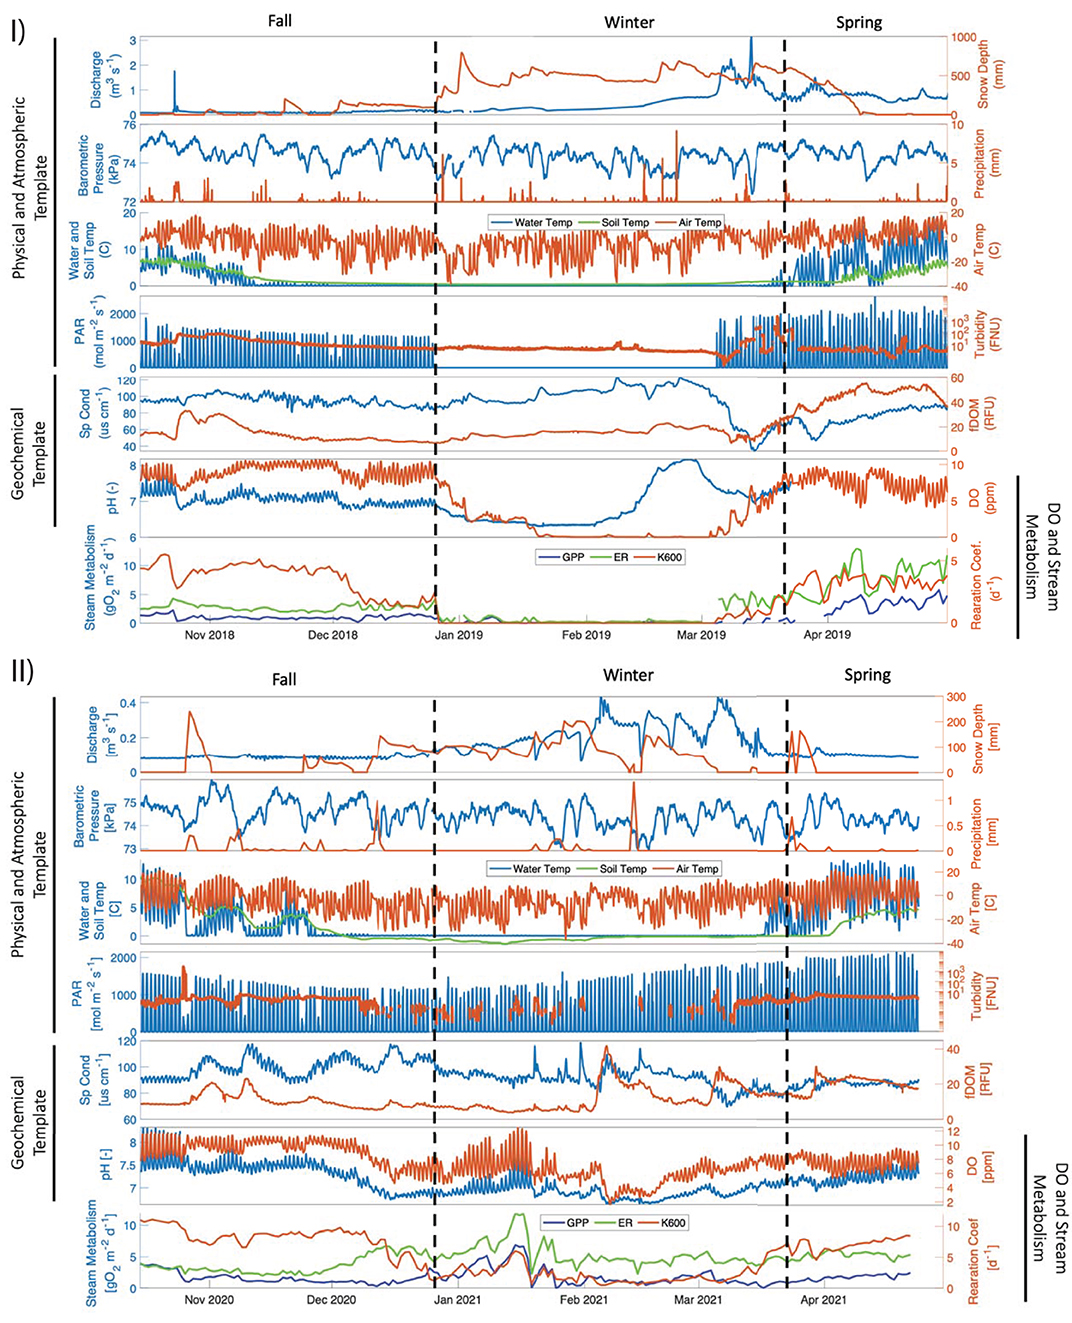
Figure 2. Post QA/QC time series from the (I) El Niño 2018–2019 and (II) La Niña 2020–2021 data organized in three templates: physical and atmospheric, geochemical and DO and stream metabolism. Dashed vertical lines delineate fall, winter, and spring.
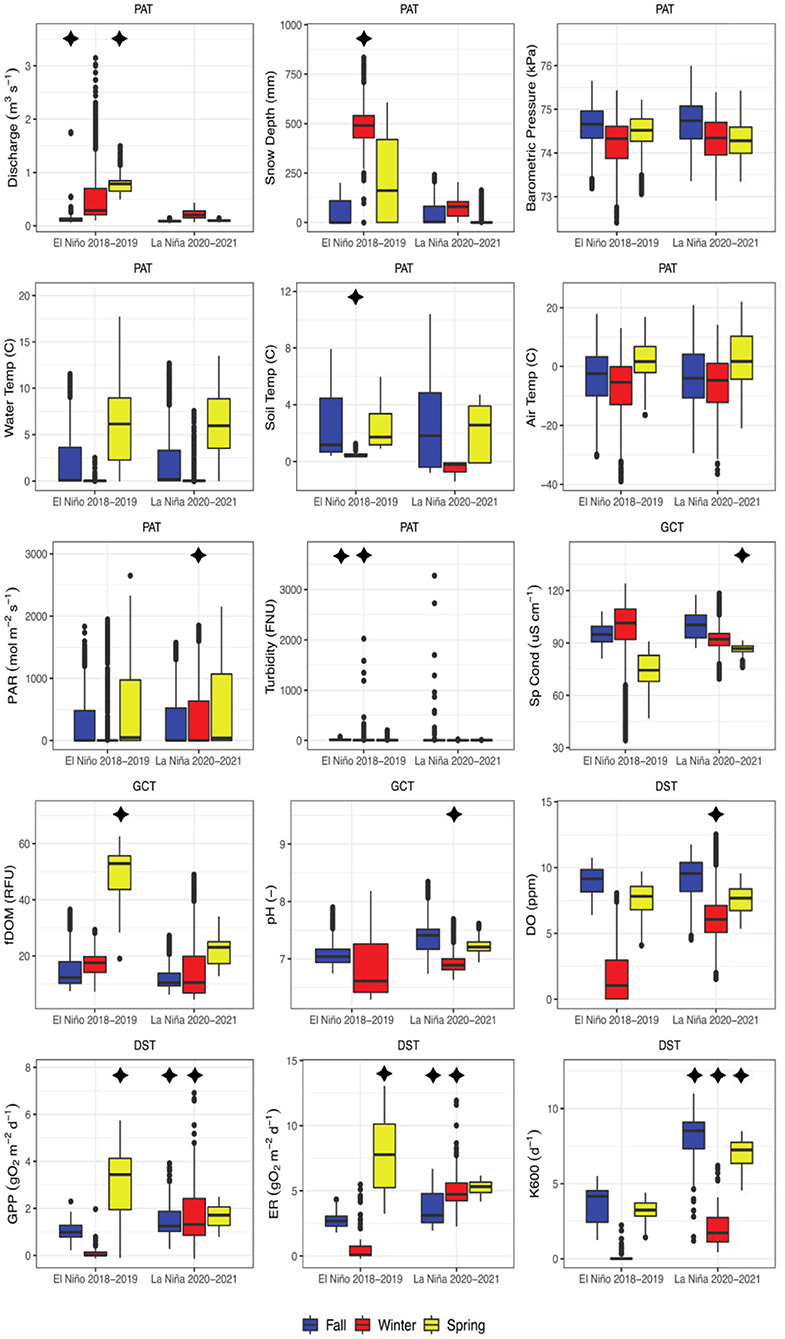
Figure 3. Boxplots comparing seasonal trends between the 2018–2019 El Niño and the 2020–2021 La Niña years. Asterisks represent quantities with statistically different means for the same season between years, and their location indicate which of the 2 years had a greater mean magnitude. Labels represent the physical and atmospheric (PAT), geochemical (GCT), and DO and stream metabolism (DST) templates.
Geochemical template
Water chemistry parameters varied widely across seasons and between years. fDOM gradually increased during the spring of the El Niño year from winter values of ~20 RFU, reaching sustained peak values of ~50 RFU during mid to late spring (Figure 2). In contrast, during the La Niña year, fDOM values remained at ~20 RFU, except for a few short-lived increases to ~40 RFU (Figure 2). This between-year difference in spring fDOM was significant (Figure 3). Additionally, an absence of a diel fDOM signal was observed during the El Niño year, while a moderate to strong daily cycling signal was present in the La Niña year (Figure 4). Specific conductivity was significantly higher in the La Niña year during the spring (Figures 2, 3), and during the winter of the El Niño year its diurnal cycling was suppressed (Figure 4). Lastly, during the El Niño year, pH initially decreased from fall values of ~7 to early winter values of ~6, before increasing to ~8 by the end of the winter season (Figure 2). Minimal diel cycling for pH was observed during the winter season (Figure 4). During the La Niña year, pH values remained between 7 and 7.5 for all seasons (Figure 2) and moderate diel cycling occurred (Figure 4).
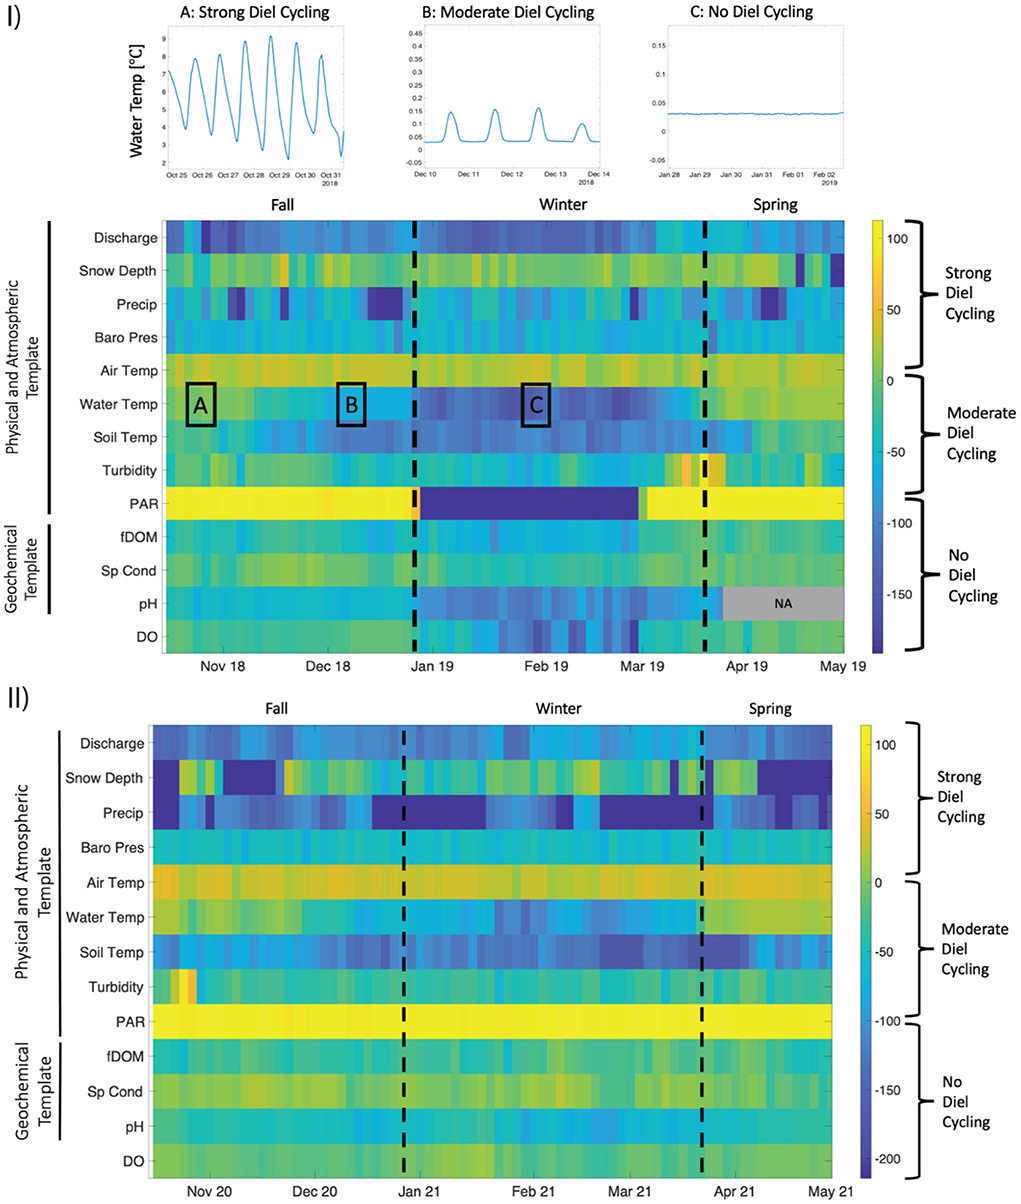
Figure 4. Heatmap of spectral power at 24-h periodicity for (I) El Niño 2018–2019 and (II) La Niña 2020–2021 years organized by physical and atmospheric, and geochemical templates. For reference, we highlight examples of A: strong, B: moderate and C: no diel cycling for water temperature. Dashed vertical lines delineate fall, winter, and spring seasons. Missing pH values are shown as NA.
DO and stream metabolism template
DO and stream metabolism values varied significantly among seasons within the El Niño year and between the El Niño and La Niña years. Dissolved oxygen concentrations fell from daily mean values of ~9 mg/L to ~4 mg/L in early January 2019, declining to anoxia (~0 mg/L) in late January 2019, which persisted through the end of February 2019 (Figure 2 and Supplementary Figure S3). While declines in DO were also observed during February 2021 in the La Niña year, concentrations rarely decreased below 4 mg/L (Figure 2). These between-year differences in winter DO were significant (Figure 3). Additionally, diel cycling of DO differed greatly between years during the winter period, with moderate to no cycling occurring during the El Niño year, and moderate to strong cycling occurring during the La Niña year (Figure 4).
Both GPP and ER were below 5 g O2 m−2d−1 during the fall of the El Niño year, however, during the winter these values decreased to ~ 0 g O2 m−2d−1from early January to mid-March, before increasing considerably during spring (Figure 2). During the La Niña year, GPP was lowest (~3–4 g O2 m−2d−1) during mid-fall, and highest (~5–10 g O2 m−2d−1) during the winter (Figure 2). ER followed the same general pattern as GPP during the La Niña year, except for low ER values at the end of December 2020. Both ER and GPP were significantly higher during the spring in the El Niño year, and higher in the fall and winter in the La Niña year (Figure 3).
Interactions between templates
Based on the principal component analysis (PCA) for the El Niño year (Figure 5A), PC1 separated winter points (negative PC1) from fall and spring (positive PC1). Positive PC1 values were primarily associated with higher temperatures (air, soil, and water), higher metabolic activity (GPP and ER), and weaker loadings for DO and fDOM. Negative PC1 values were most strongly related to snow depth and specific conductivity. PC2 separated spring days (positive PC2) from fall days (negative PC2), with winter days spanning positive and negative PC2 values. Positive PC2 was most strongly associated with discharge and snow depth, while negative PC2 was most strongly associated with DO coupled with K600. Consistent with the El Niño year, PC1 for the La Niña year (Figure 5B) separated winter points (negative PC1) from fall and spring days (positive PC1). Also consistent with the El Niño year, positive La Niña PC1 values were primarily associated with higher temperatures and DO. However, in contrast to the El Niño year, neither metabolic activity (GPP or ER) or fDOM were strongly loaded on PC1. Negative PC1 values for the La Niña year were most strongly related to discharge and snow depth. PC2 again separated spring days (positive PC2) from fall days (negative PC2), but positive PC2 was most strongly related to fDOM which coupled with PAR, while negative PC2 was most strongly related to specific conductivity.
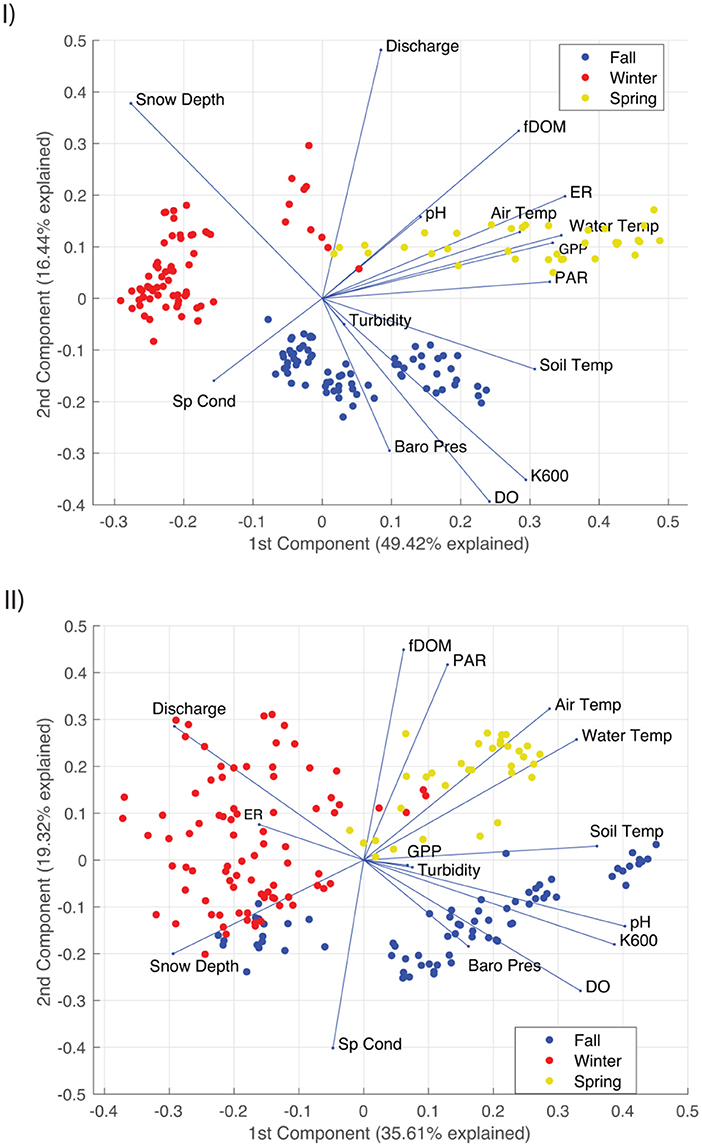
Figure 5. PCA biplot for daily averaged data for the (I) 2018–2019 El Niño and (II) 2020–2021 La Niña years. Parameters plotting in the same direction are positively correlated, those in opposite directions are negatively correlated, and those that are orthogonal are uncorrelated. Principal components one and two explained (I) 65.86% and (II) 54.93% of the total variation. Score values were added to the PCA biplot and are color-coded based on their respective period of analysis.
Discussion
Variable interannual snowpack drives lotic-lentic stream transitions
During the El Niño year, as snowpack accumulated during the winter, stream depth increased due to the formation of ice dams that backed up the water under the ice cover (Supplementary Figures S4, S5). Ice dams are known to occur near changes in stream slope and increases in bedform size (Turcotte et al., 2017), both of which are present a few kilometers downstream of our research site, where the East Fork Jemez River transitions from a low-gradient, fine substrate stream meandering the Valles Caldera and enters a higher gradient reach with large cobbles and boulders. Combined with thick ice cover and frozen riparian soils, ice dams retain water upstream within the channel, making it deeper and wider. Such blockages have been shown to shift streams from lotic to lentic environments (Stickler et al., 2010), affecting residence times, biochemical reactivity, and metabolic functioning (Briggs et al., 2013; Davis et al., 2020; Jansen et al., 2021). Importantly, these in-stream winter conditions observed during the El Niño year did not occur during the La Niña year, suggesting the existence of a precipitation-based activation threshold needed to generate contrasting differences in the physical, geochemical, and metabolic functioning of the stream (Figures 2–4).
Influence of snowpack variability on stream chemistry and metabolism
Differences in snowpack dynamics also influenced stream chemistry, most notably the onset of persistent anoxia during the El Niño winter. Since atmospheric exchange is effectively cut off by ice and snow accumulation over the otherwise free surface of the stream, and groundwater exchange is an unlikely source of oxygen, we suggest that oxic conditions were maintained during the La Niña winter by a combination of oxygenated inputs from upstream fluxes and in-stream GPP. In stark contrast to the El Niño winter, ER and GPP peaked in January of the La Niña year, indicating that winter metabolism was an important control on oxygen despite ice cover and light snowpack (Figure 2 and Supplementary Figure S5). In contrast, the anoxic conditions observed during the El Niño year suggests that the combination of reduced reaeration due to ice cover, the cessation of GPP as light availability declined, and the continuation of heterotrophic respiration resulted in the depletion of dissolved oxygen in the newly formed lentic-like conditions. Similar winter anoxia has been observed in other ice covered, low-flow, aquatic environments, including beaver dam ponds (Devito and Dillon, 1993) and lakes (Deshpande et al., 2015, 2017; Jansen et al., 2019). The importance of atmospheric forcing during the winter on stream metabolism suggests that snowpack has the potential to be as important for metabolism as other in-stream (e.g., hyporheic flow, algal overgrowth) and upslope (e.g., post-fire/precipitation ash and debris mobilization) ecological processes, not only during the winter but into the spring.
Using seven years of data collected between 2005–2011 during the spring and the fall seasons at the same study site (i.e., winter data were not available), we recently found unanticipated shifts from autotrophic to heterotrophic status within and across years (Summers et al., 2020). That study challenged previous paradigms where local attributes including geographic and landscape positioning (e.g., light and temperature regimes) were thought to control the trophic status of streams, and thus, streams were predicted to be either autotrophic or heterotrophic. Our findings from Summers et al. (2020) suggested that complex combinations of spatiotemporal factors, such as snow melt and summer precipitation, and their role in connecting terrestrial and aquatic ecosystems can lead to substantial stream variation in metabolic status, which prompted us to start this winter-focused study to fill the gap on the short and long-term ecological effects of winter dynamics noted in Tolonen et al. (2019) and Summers et al. (2020). Our findings are also consistent with previous research showing that reduced snowpack increases primary productivity in lakes (Garcia et al., 2019).
Implications of changing snowpack on stream function
Winter is the fastest warming season in most of the US, and this is causing reductions in snow pack, and shifts in the timing and volume of snowmelt (Grimm et al., 2013; Godsey et al., 2014; Reidmiller et al., 2018; Elias et al., 2021; Climate Central, 2022). The US Global Change Research Program indicate that atmospheric circulation patterns are changing due to global warming and will cause more aridity in the US southwest, where this study took place, particularly during La Niña years (Christensen et al., 2007; Seager et al., 2007). Although our dataset represents two winter periods as examples, which limits our ability to comprehensively extrapolate our results to future climate predictions, we can gain some sense of expected physical, chemical, and metabolic responses to diminished winter snowpack.
Our study shows that stream metabolism in the spring is highly dependent on what happens in the winter, and the results from Summers et al. (2020) indicate that those winter-driven changes can also extend into the summer. Thus, winter precipitation changes have the potential to trigger multi-season effects on in-stream physical, chemical, and metabolic processes. For example, our results suggests that a progressive reduction in winter precipitation can result in the loss of seasonal oxic-anoxic cycles, with potentially important shifts in redox conditions and associated biochemical cycles (e.g., denitrification), including changes in the speciation of solutes mobilization of greenhouse gases, accumulation of silica, reduction of manganese, iron, phosphorous, and sulfate, and altered lability of exported dissolved organic and inorganic carbon stocks (Lautz and Fanelli, 2008; Navel et al., 2010; Zarnetske et al., 2011, 2012; Harvey et al., 2013; Briggs et al., 2015; Sherson et al., 2015; Bicknell et al., 2020; Regier et al., 2021).
Since our sensors did not capture the dynamics of anaerobic processes, and the winter ecology of streams remains understudied, we call for studies to focus on how winter driven anoxia activates biogeochemical cycles that influence stream metabolism and ecologic function through the rest of the year, paradoxically turning previously assumed winter “cold-spots” and “cold-moments” into hot-spots and hot-moments for biogeochemical processing. This focus is timely because (i) current data suggests that winter is the fastest warming season in the majority of the US, causing shifts in the timing, amount, and type of precipitation, (ii) in-stream freeze–thaw cycles, including ice and snow cover, occur in ~60% of river basins in the Northern Hemisphere and those ecosystems have evolved to sustain winter biogeochemical cycles, and (iii) our study and others show that changes in winter precipitation patterns generate changes in stream metabolism, which propagate through the rest of the year. Accordingly, new studies should focus on investigating how losing the intermittency caused by freezing-thawing cycles due to global warming could negatively affect water quality and ecosystem health in high latitudes and altitudes, where freezing streams may become less abundant and frequent.
Conclusion
Winters are intuitively associated with ecological “cold-spots” and “cold-moments,” i.e., lower than average ecological activity in space and time, but the effects of winter precipitation on stream metabolism and functioning are understudied due to logistical challenges. We found that atmospheric forcing in the form of significant ice and snow cover during the winter drove drastic changes in oxygen availability and stream metabolism during a weak to moderate El Niño year (2018–2019). Two years later, during a moderate La Niña year (2020–2021), the same site underwent a significant reduction of snow cover, which not only resulted in a lack of winter anoxia but even in peak ER and GPP fluxes during the winter. Combining the 2 years of data, we found that winter and post-winter stream metabolism was highly dynamic and dependent on atmospheric forcing, which is changing due to the impacts of global warming on snowpack volume and timing particularly in the winter, the fastest warming season in most of the US.
Data availability statement
The datasets presented in this study can be found in online repositories. The names of the repository/repositories and accession number (s) can be found at: Gonzalez-Pinzon (2022).
Author contributions
JN and RG-P contributed to the conceptualization, spatial analysis, modeling, generation of figures and tables, writing, review, and editing. AK, PR, BS, and DV contributed to the contextualization of the study, modeling, writing, review, and editing. RG-P and DV secured funding, mentored students and post-doc, led the modeling development, and contributed to the writing, review, and editing.
Funding
The National Science Foundation provided support for this research through grants CBET-1707042, HRD- 1345169, HRD-1720912, and HRD-1914778.
Conflict of interest
The authors declare that the research was conducted in the absence of any commercial or financial relationships that could be construed as a potential conflict of interest.
Publisher's note
All claims expressed in this article are solely those of the authors and do not necessarily represent those of their affiliated organizations, or those of the publisher, the editors and the reviewers. Any product that may be evaluated in this article, or claim that may be made by its manufacturer, is not guaranteed or endorsed by the publisher.
Supplementary material
The Supplementary Material for this article can be found online at: https://www.frontiersin.org/articles/10.3389/frwa.2022.1003159/full#supplementary-material
References
Allard, G., Buffin-Bélanger, T., and Bergeron, N. (2011). Analysis of frazil ice as a geomorphic agent in a frazil pool. River Res. Appl. 27, 1136–1148. doi: 10.1002/rra.1490
Appling, A. P., Hall, R. O., Yackulic, C. B., and Arroita, M. (2018). Overcoming equifinality: leveraging long time series for stream metabolism estimation. J. Geophys. Res. Biogeosci. 123, 624–645. doi: 10.1002/2017JG004140
Berghuijs, W. R., Woods, R. A., and Hrachowitz, M. (2014). A precipitation shift from snow towards rain leads to a decrease in streamflow. Nat. Clim. Change 4, 583–586. doi: 10.1038/nclimate2246
Bernhardt, E. S., Heffernan, J. B., Grimm, N. B., Stanley, E. H., Harvey, J. W., Arroita, M., et al. (2018). The metabolic regimes of flowing waters. Limnol. Oceanogr. 63, S99–S118. doi: 10.1002/lno.10726
Bicknell, K., Regier, P., Van Horn, D. J., Feeser, K. L., and González-Pinzón, R. (2020). Linking hydrobiogeochemical processes and management techniques to close nutrient loops in an arid river. Front. Water 2, 22. doi: 10.3389/frwa.2020.00022
Briggs, M. A., Day-Lewis, F. D., Zarnetske, J. P., and Harvey, J. W. (2015). A physical explanation for the development of redox microzones in hyporheic flow. Geophys. Res. Lett. 42, 4402–4410. doi: 10.1002/2015GL064200
Briggs, M. A., Lautz, L. K., Hare, D. K., and Gonzalez-Pinzon, R. (2013). Relating hyporheic fluxes, residence times, and redox-sensitive biogeochemical processes upstream of beaver dams. Freshw. Sci. 32, 622–641. doi: 10.1899/12-110.1
Calapez, A. R., Branco, P., Santos, J. M., Ferreira, T., Hein, T., Brito, A. G., et al. (2017). Macroinvertebrate short-term responses to flow variation and oxygen depletion: A mesocosm approach. Sci. Total Environ. 599–600, 1202–1212. doi: 10.1016/j.scitotenv.2017.05.056
Christensen, J.H., Hewitson, B., Busuioc, A., Chen, A., Gao, X., Held, I., et al. (2007). “Regional climate projections,” in Climate Change 2007: The Physical Science Basis. Contribution of Working Group I to the Fourth Assessment Report of the Intergovernmental Panel on Climate Change, eds S. Solomon, D. Qin, M. Manning, Z. Chen, M. Marquis, K.B. Averyt, et al. (Cambridge: Cambridge University Press).
Climate Central (2022). Warming Seasons. Available online at: https://medialibrary.climatecentral.org/resources/warming-seasons (accessed April 22, 2022).
Cortés, G., and Margulis, S. (2017). Impacts of El Niño and La Niña on interannual snow accumulation in the Andes: results from a high-resolution 31 year reanalysis. Geophys. Res. Lett. 44, 6859–6867. doi: 10.1002/2017GL073826
Davis, M. N., McMahon, T. E., Cutting, K. A., and Jaeger, M. E. (2020). Environmental and climatic factors affecting winter hypoxia in a freshwater lake: evidence for a hypoxia refuge and for re-oxygenation prior to spring ice loss. Hydrobiologia 847, 3983–3997. doi: 10.1007/s10750-020-04382-z
Deshpande, B. N., MacIntyre, S., Matveev, A., and Vincent, W. F. (2015). Oxygen dynamics in permafrost thaw lakes: anaerobic bioreactors in the Canadian subarctic. Limnol. Oceanogr. 60, 1656–1670. doi: 10.1002/lno.10126
Deshpande, B. N., Maps, F., Matveev, A., and Vincent, W. F. (2017). Oxygen depletion in subarctic peatland thaw lakes. Arct. Sci. 3, 406–428. doi: 10.1139/as-2016-0048
Devito, K. J., and Dillon, P. J. (1993). Importance of runoff and winter anoxia to the P and N dynamics of a beaver pond. Can. J. Fish. Aquat. Sci. 50, 2222–2234. doi: 10.1139/f93-248
Elias, E., James, D., Heimel, S., Steele, C., Steltzer, H., and Dott, C. (2021). Implications of observed changes in high mountain snow water storage, snowmelt timing and melt window. J. Hydrol. Reg. Stud. 35, 100799. doi: 10.1016/j.ejrh.2021.100799
Fang, X., and Stefan, H. G. (2009). Simulations of climate effects on water temperature, dissolved oxygen, and ice and snow covers in lakes of the contiguous U.S. under past and future climate scenarios. Limnol. Oceanogr. 54, 2359–2370. doi: 10.4319/lo.2009.54.6_part_2.2359
Frenette, J.-J., Thibeault, P., Lapierre, J.-F., and Hamilton, P. B. (2008). Presence of algae in freshwater ice cover of fluvial Lac Saint-Pierre (st. Lawrence River, Canada)1. J. Phycol. 44, 284–291. doi: 10.1111/j.1529-8817.2008.00481.x
Garcia, S. L., Szekely, A. J., Bergvall, C., Schattenhofer, M., and Peura, S. (2019). Decreased snow cover stimulates under-ice primary producers but impairs methanotrophic capacity. mSphere 4, e00626–e00618. doi: 10.1128/mSphere.00626-18
Goddard, L., and Gershunov, A. (2020). “Impact of El niño on weather and climate extremes,” in El Niño Southern Oscillation in a Changing Climate, eds M. J. McPhaden, A. Santoso and W. Cai. doi: 10.1002/9781119548164.ch16
Godsey, S. E., Kirchner, J. W., and Tague, C. L. (2014). Effects of changes in winter snowpacks on summer low flows: case studies in the Sierra Nevada, California, USA. Hydrol. Process. 28, 5048–5064. doi: 10.1002/hyp.9943
Gonzalez-Pinzon, R. (2022). Winter data Nichols et al. 2022, HydroShare. Available online at: http://www.hydroshare.org/resource/6441ce5861a345439deedc44e5c3a534
Grimm, N. B., Chapin, F. S., Bierwagen, B., Gonzalez, P., Groffman, P. M., Luo, Y., et al. (2013). The impacts of climate change on ecosystem structure and function. Front. Ecol. Environ. 11, 474–482. doi: 10.1890/120282
Harvey, J. W., Böhlke, J. K., Voytek, M. A., Scott, D., and Tobias, C. R. (2013). Hyporheic zone denitrification: controls on effective reaction depth and contribution to whole-stream mass balance: scaling hyporheic flow controls on stream denitrification. Water Resour. Res. 49, 6298–6316. doi: 10.1002/wrcr.20492
Jansen, J., MacIntyre, S., Barrett, D. C., Chin, Y.-P., Cortés, A., Forrest, A. L., et al. (2021). Winter limnology: how do hydrodynamics and biogeochemistry shape ecosystems under ice? J. Geophys. Res. Biogeosci. 126, e2020JG006237. doi: 10.1029/2020JG006237
Jansen, J., Thornton, B. F., Jammet, M. M., Wik, M., Cortés, A., Friborg, T., et al. (2019). Climate-sensitive controls on large spring emissions of CH4 and CO2 from Northern Lakes. J. Geophys. Res. Biogeosci. 124, 2379–2399. doi: 10.1029/2019JG005094
Jolliffe, I. T., and Cadima, J. (2016). Principal component analysis: a review and recent developments. Philos. Trans. R. Soc. Math. Phys. Eng. Sci. 374, 20150202. doi: 10.1098/rsta.2015.0202
Kirchner, J. W., Feng, X., and Neal, C. (2000). Fractal stream chemistry and its implications for contaminant transport in catchments. Nature 403, 524–527. doi: 10.1038/35000537
Lautz, L. K., and Fanelli, R. M. (2008). Seasonal biogeochemical hotspots in the streambed around restoration structures. Biogeochemistry 91, 85–104. doi: 10.1007/s10533-008-9235-2
Loheide II, S. P., and Lundquist, J. D. (2009). Snowmelt-induced diel fluxes through the hyporheic zone. Water Resour. Res. 45, W07404. doi: 10.1029/2008WR007329
Meek, D., Hatfield, J., Howell, T., Idso, S., and Reginato, R. (1984). A generalized relationship between photosynthetically active radiation and solar radiation 1. Agron. J. 76, 939–945. doi: 10.2134/agronj1984.00021962007600060018x
Musselman, K. N., Addor, N., Vano, J. A., and Molotch, N. P. (2021). Winter melt trends portend widespread declines in snow water resources. Nat. Clim. Change 11, 418–424. doi: 10.1038/s41558-021-01014-9
Navel, S., Mermillod-Blondin, F., Montuelle, B., Chauvet, E., Simon, L., and Marmonier, P. (2010). Water–sediment exchanges control microbial processes associated with leaf litter degradation in the hyporheic zone: a microcosm study. Microb. Ecol. 61, 968–979. doi: 10.1007/s00248-010-9774-7
Odum, H. T. (1956). Primary production in flowing waters 1. Limnol. Oceanogr. 1, 102–117. doi: 10.4319/lo.1956.1.2.0102
O'Shaughnessy, P., and Cavanaugh, J. E. (2015). Performing t-tests to compare autocorrelated time series data collected from direct-reading instruments. J. Occup. Environ. Hyg. 12, 743–752. doi: 10.1080/15459624.2015.1044603
Petrov, M., Terzhevik, A. Y., Palshin, N., Zdorovennov, R., and Zdorovennova, G. (2005). Absorption of solar radiation by snow-and-ice cover of lakes. Water Resour. 32, 496–504. doi: 10.1007/s11268-005-0063-7
Price, D. S., Smith, D. W., and Stanley, S. J. (1995). Performance of lagoons experiencing seasonal ice cover. Water Environ. Res. 67, 318–326. doi: 10.2175/106143095X131538
Prowse, T. D. (2001). River-ice ecology. I: hydrologic, geomorphic, and water-quality aspects. J. Cold Reg. Eng. 15, 1–16. doi: 10.1061/(ASCE)0887-381X(2001)15:1(1)
Prowse, T. D., Wrona, F. J., Reist, J. D., Hobbie, J. E., Lévesque, L. M. J., and Vincent, W. F. (2006). General features of the arctic relevant to climate change in freshwater ecosystems. Ambio 35, 330–338. doi: 10.1579/0044-7447(2006)35[330:GFOTAR]2.0.CO;2
Regier, P., Ward, N. D., Indivero, J., Wiese Moore, C., Norwood, M., and Myers-Pigg, A. (2021). Biogeochemical control points of connectivity between a tidal creek and its floodplain. Limnol. Oceanogr. Lett. 6, 134–142. doi: 10.1002/lol2.10183
Reidmiller, D. R., Avery, C. W., Easterling, D. R., Kunkel, K. E., Lewis, K. L. M., Maycock, T. K., et al. (2018). Impacts, Risks, and Adaptation in the United States: The Fourth National Climate Assessment, Volume II. U.S. Global Change Research Program.
Schreier, H., Erlebach, W., and Albright, L. (1980). Variations in water quality during winter in two Yukon rivers with emphasis on dissolved oxygen concentration. Water Res. 14, 1345–1351. doi: 10.1016/0043-1354(80)90195-5
Seager, R., Ting, M., Held, I., Kushnir, Y., Lu, J., Vecchi, G., et al. (2007). Model projections of an imminent transition to a more arid climate in Southwestern North America. Science 316, 1181–1184. doi: 10.1126/science.1139601
Sherson, L. R., Van Horn, D. J., Gomez-Velez, J. D., Crossey, L. J., and Dahm, C. N. (2015). Nutrient dynamics in an alpine headwater stream: use of continuous water quality sensors to examine responses to wildfire and precipitation events: continuous responses to wildfire and precipitation events. Hydrol. Process. 29, 3193–3207. doi: 10.1002/hyp.10426
Simino, J. (2002). East Fork Jemez River. Stream Inventory Report. Available online at: https://www.fs.usda.gov/Internet/FSE_DOCUMENTS/fsbdev7_020716.pdf (accessed September 1, 2022).
Stickler, M., Alfredsen, K. T., Linnansaari, T., and Fjeldstad, H.-P. (2010). The influence of dynamic ice formation on hydraulic heterogeneity in steep streams. River Res. Appl. 26, 1187–1197. doi: 10.1002/rra.1331
Stroud Water Research Center (2021). Model My Watershed Softw. Available online at: https://wikiwatershed.org/ (accessed September 1, 2022).
Summers, B. M., Horn, D. J. V., González-Pinzón, R., Bixby, R. J., Grace, M. R., Sherson, L. R., et al. (2020). Long-term data reveal highly-variable metabolism and transitions in trophic status in a montane stream. Freshw. Sci. 39, 241–255. doi: 10.1086/708659
Tolonen, K. E., Picazo, F., Vilmi, A., Datry, T., Stubbington, R., Paril, P., et al. (2019). Parallels and contrasts between intermittently freezing and drying streams: from individual adaptations to biodiversity variation. Freshw. Biol. 64, 1679–1691. doi: 10.1111/fwb.13373
Turcotte, B., Alfredsen, K., Beltaos, S., and Burrell, B. C. (2017). “Ice-related floods and flood delineation along streams and small rivers,” in CGU HS Committee on River Ice Processes and the Environment 19th Workshop on the Hydraulics of Ice Covered Rivers (Whitehorse, CA).
Wagner, R. J., Boulger, R. W Jr, Oblinger, C. J., and Smith, B. A. (2006). Guidelines and standard procedures for continuous water-quality monitors: Station operation, record computation, and data reporting. USGS Techniques and Metods Report 1-D3. doi: 10.3133/tm1D3
Watras, C. J., Hanson, P. C., Stacy, T. L., Morrison, K. M., Mather, J., Hu, Y.-H., et al. (2011). A temperature compensation method for CDOM fluorescence sensors in freshwater: CDOM temperature compensation. Limnol. Oceanogr. Methods 9, 296–301. doi: 10.4319/lom.2011.9.296
Western Regional Climate Center (2021). Hidden Val. VC N. M. Available online at: https://wrcc.dri.edu/About/citations.php (accessed September 1, 2022).
Woods, P. F. (1992). Limnology of Big Lake, South-Central Alaska, 1983–84. U.S. Dept. of the Interior, U.S. Geological Survey; Books and Open-File Reports Section [distributor].
Zarnetske, J. P., Haggerty, R., Wondzell, S. M., and Baker, M. A. (2011). Labile dissolved organic carbon supply limits hyporheic denitrification. J. Geophys. Res. 116, G04036. doi: 10.1029/2011JG001730
Keywords: winter, stream metabolism, anoxia, snow cover, ice cover, El Niño, La Niña, climate change
Citation: Nichols J, Khandelwal AS, Regier P, Summers B, Van Horn DJ and González-Pinzón R (2022) The understudied winter: Evidence of how precipitation differences affect stream metabolism in a headwater. Front. Water 4:1003159. doi: 10.3389/frwa.2022.1003159
Received: 25 July 2022; Accepted: 05 September 2022;
Published: 29 September 2022.
Edited by:
Jianyao Chen, Sun Yat-sen University, ChinaReviewed by:
Stephanie DeVries, University of Tennessee at Chattanooga, United StatesGuotao Cui, University of California, Merced, United States
Copyright © 2022 Nichols, Khandelwal, Regier, Summers, Van Horn and González-Pinzón. This is an open-access article distributed under the terms of the Creative Commons Attribution License (CC BY). The use, distribution or reproduction in other forums is permitted, provided the original author(s) and the copyright owner(s) are credited and that the original publication in this journal is cited, in accordance with accepted academic practice. No use, distribution or reproduction is permitted which does not comply with these terms.
*Correspondence: Justin Nichols, justin67@unm.edu; Ricardo González-Pinzón, gonzaric@unm.edu