High Eddington quasars as discovery tools: current state and challenges
 Swayamtrupta Panda
 Paola Marziani
- 1Laboratório Nacional de Astrofísica—MCTI, R. dos Estados Unidos, Itajubá, MG, Brazil
- 2INAF-Astronomical Observatory of Padova, Vicolo dell’Osservatorio, Padua, PD, Italy
A landmark of accretion processes in active galactic nuclei (AGN) is the continuum originating from a complex structure, i.e., an accretion disk and a corona around a supermassive black hole. Modelling the broad-band spectral energy distribution (SED) effectively ionizing the gas-rich broad emission line region (BLR) is key to understanding the various radiative processes at play and their importance that eventually leads to the emission from diverse physical conditions. Photoionization codes are a useful tool to investigate two aspects, the importance of the shape of the spectral energy distribution, and the physical conditions in the broad emission line region. In this work, we critically review long-standing issues pertaining to the spectral energy distribution shape and the anisotropic continuum radiation from the central regions around the accreting supermassive black holes (few 10–100 gravitational radii), with a focus on black holes accreting at high rates, possibly much above the Eddington limit. The anisotropic emission is a direct consequence of the development of a geometrically and optically thick structure at regions very close to the black hole due to a marked increase in the accretion rates. The analysis presented in this paper took advantage of the look at the diversity of the type-1 active galactic nuclei provided by the main sequence of quasars. The main sequence permitted us to assess the importance of the Eddington ratio and hence to locate the super Eddington sources in observational parameter space, as well as to constrain the distinctive physical conditions of their line-emitting BLR. This feat is posing the basis for the exploitation of quasars as cosmological distance indicators, hopefully allowing us to use the fascinating super Eddington quasars up to unprecedented distances.
1 Active galactic nuclei as accreting black holes
Active galactic nuclei (AGNs) are among the brightest cosmic objects known to us (Weedman, 1976; Weedman, 1977). They harbour a supermassive black hole (SMBH) at their very centres which due to its immense gravitational potential allows for the infalling of matter. This in-falling matter loses angular momentum while being accreted onto the black hole. This accreted matter manifests in the form of a multi-colour accretion disk which gets heated up and radiates (Shakura and Sunyaev, 1973; Shields, 1978; Czerny and Elvis, 1987; Panda et al., 2018). The photon energy of the dissipated radiation spans a wide range of energies (from sub-eV to hundreds of eVs). The emitted photons then illuminate the material surrounding the accretion disk and lead to the formation and emission of strong, broad emission lines (Schmidt, 1963; Greenstein and Schmidt, 1964; Schmidt and Green, 1983; Osterbrock and Ferland, 2006; Netzer, 2015).
2 Their spectral energy distribution
AGN are observed over the entire range of the electromagnetic spectrum from the radio regime up to MeV-GeV-TeV energy γ-rays (Richards et al., 2006; Harrison, 2014; Yang et al., 2022). The classical view of AGN characterized by an almost flat spectral energy distribution (SED) over many decades in frequency—to juxtapose to the ones of non-active galaxies—has been superseded and extended since long (Malkan and Sargent, 1982; Malkan, 1983), by the recognition that the SED is different for AGN in different accretion states, and is most often characterized by significant features associated with diverse processes and aptly called bump or excess (i.e., IR excess, big blue bump, soft-X excess, etc.)1.
In this contribution, we shall restrict the attention mainly to the ionizing continuum in radio-quiet quasars. In this case, various components of the SED arise due to different radiation mechanisms and at varying distances, notably among them:
1 The characteristic “Big Blue Bump” (Shields, 1978; Czerny and Elvis, 1987) that is formed by the optical and ultraviolet radiation produced due to thermal emission from the accretion disk.
2 The X-ray emission well-fit by a power-law, and produced when the UV photons from the disk undergo inverse Compton scattering by hot electrons in a Compton-thin corona close to the SMBH (e.g., Zdziarski et al., 1990).
3 A spectral component observationally described as a “soft X-ray excess” (e.g., Arnaud et al., 1985). The most widely-accepted interpretation of the excess detected in soft X-rays is of emission in a Compton-thick corona connected with the innermost accretion disk (Walter and Fink, 1993; Petrucci et al., 2020 and references therein). The competing model—relativistically blurred photoionized disc reflection (Ross and Fabian, 2005; Crummy et al., 2006)—isn’t anymore favoured as an explanation for the soft X-ray excess itself, although blurred accretion disk reflection can occur independently from the soft excess (Boissay et al., 2016). The soft excess helps bridge the absorption gap between the UV downturn and the soft X-ray upturn (e.g., Elvis et al., 1994; Laor et al., 1997; Richards et al., 2006; Kubota and Done, 2018), and changes the far-UV and soft-X-ray part of the spectrum, affecting the line production, including Fe ii emission in the BLR (Panda et al., 2019a).
The “intrinsic” AGN continuum at photon energies high enough to ionize Hydrogen is therefore made of the thermal emission from the accretion disk, the power-law emission from the corona, and soft X-ray excess (Collinson, 2016; Kubota and Done, 2018; Panda et al., 2019c; Ferland et al., 2020). Figure 1 shows templates for quasars believed to radiate at moderate or high Eddington ratio, η ≳ 0.1–0.2 (Population A and extreme Population A, hereafter xA, Marziani and Sulentic 2014a and §3.3.2), along with widely-exploited templates believed to be appropriate for populations of quasars radiating in this range (Mathews and Ferland, 1987; Marziani and Sulentic, 2014a; Ferland et al., 2020). There is a notable similarity between the curves. The SED defined by Marziani and Sulentic (2014a) for sources radiating close to the Eddington limit is in good agreement with the high case of Ferland et al. (2020). There is an increase in big blue bump prominence from the high to the highest case, the latter being associated with extreme values of the Eddington ratios. Note that the soft-X ray excess, located between the optical-UV bump and the peak at the hard X-ray (∼100 keV), is prominent in between
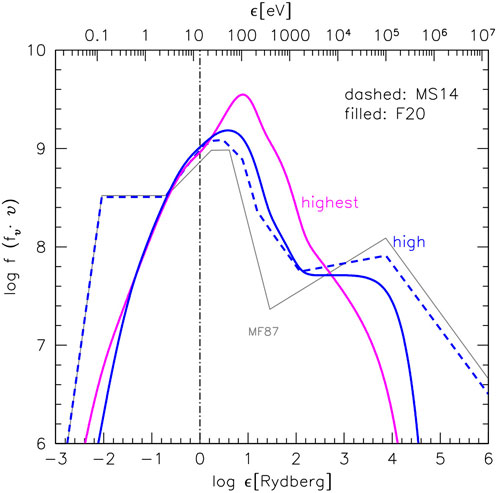
FIGURE 1. Templates of SEDs for high Eddington radiators. Grey; the landmark Mathews and Ferland (1987) SED; dashed blue: the Marziani and Sulentic (2014a) SED for quasars radiating close to the Eddington limit; blue and magenta: high and highest Eddington ratio templates from Ferland et al. (2020)). The SEDs have been normalized at ϵ ≈0.18 Ryd.
A weak but statistically significant correlation between hard-X photon index Γ and Eddington ratio has been found (Trakhtenbrot et al., 2017; Panagiotou and Walter, 2020; Liu et al., 2021), and the statistical weaknesses might be explained by the limited range of hard Γ values compared to uncertainties in individual Γ estimates (Wang et al., 2013). In the highest case, the soft and hard X-ray domains are very steep to the point that a turnover at
A related issue is the location of the high energy downturn around ∼ 100 keV that is required by limits in the measured X-ray background (Mathews and Ferland, 1987). Observations are mostly available up to ∼ 20 keV, and the energy of the downturn is conventionally placed at
The focus of Figure 1 is for log ϵ [Ryd] ≳ − 1. We mention in passing that in the NIR domain, as the low energy tail of the AD emission fades, extrinsic emission is actually reprocessed emission from the dusty torus which surrounds the accretion disk. It becomes the dominant emission at a few μm, along with the polar dust in the direction of SMBH spin axis (Netzer, 2015; Padovani et al., 2017). In the FIR, the SED might be dominated by dust heated by host galaxy star formation, more than by the AGN itself (Kirkpatrick et al., 2015). This is occurring in systems with high accretion rate (e.g., Marziani et al., 2021b). In the case of highly accreting quasars, there is a relatively large prevalence of sources with high radio power, with radio-to-optical ratio ≳ 1 (Ganci et al., 2019; Wang et al., 2022), whose radio emission can be ascribed to star formation processes. Highly-accreting quasars might be predominantly seen as young or rejuvenated active nuclei whose SED is affected by star formation processes (see, e.g., Caccianiga et al., 2015; Ganci et al., 2019).
3 Imminent challenges and opportunities
3.1 What an AGN multi-frequency spectrum can reveal to us?
From an observer’s point of view, we can largely quantify the spectrum into two primary components: 1) the emission lines originating from the BLR/NLR clouds; and 2) the AGN continuum, prominent beyond the Lyman limit, that can photoionize the surrounding gas leading to line emission. The ionizing photon flux can be estimated by a careful analysis of the AGN SED, which then gives us a rough idea of the expected line fluxes for the multitude of ionic species (in their various ionization states) that we see in an AGN spectrum. A careful assessment of the density of these ionized clouds and their locations, in addition to the incident photon flux received by them, allows us to predict the strengths of these lines. Important information about density, ionization conditions, and dynamics in the broad line-emitting region of AGN can be inferred from UV spectroscopic observations which are crucial to understanding these line-emitting regions. Past studies of highly-accreting quasars have in turn illustrated the use of certain line diagnostic ratios from observed spectra (e.g., C iv/He ii, Al IIIλ1860/Si III]λ1892, Fe ii/Hβ) in order to estimate these (density, ionization condition, and metallicity) parameters (Negrete et al., 2012; Negrete et al., 2014; Śniegowska et al., 2021; Garnica et al., 2022, and references therein). Curiously, these extreme sources appear to be characterized by values of density, ionization, and metallicity that are extreme but also extremely well-defined: as far as the virialized emitting region is concerned the parameters reach nH ∼ 1013 cm−3, log U ∼ − 2.5, Z ≳ 20Z⊙2.
3.2 Dichotomy in optical and UV emission line profiles
Historically, the BLR clouds were modelled as single clouds where the different lines arise from different parts of the same cloud—a picture that is still widely accepted (Kwan and Krolik, 1981, see the BLR radial structure as shown by Negrete et al., 2012). In the mid-1980s, propositions were made to explain the BLR as two distinct components (Gaskell, 1982; Collin-Souffrin et al., 1988). The broad emission spectrum in AGNs can be divided into two parts: the first set of lines that include Lyα, C iii], C iv, He i, He ii, and N v predominantly emitted by a highly ionized region that presumably has a relatively low density (≲ 1010 cm−3). These are known as High Ionization Lines (HILs). The upper limit to the density of the media emitting these HILs is set by the semi-forbidden CIII] in order not to be collisionally de-excited even if the actual measurement of the blueshifted C iii] is problematic because of the blending with SiIII]λ1892. As a matter of fact, the density of the outflow is poorly constrained, and there is good reason to believe that a “clumpy” scenario (e.g., Takeuchi et al., 2013) might be also appropriate. The second set of lines includes the bulk of the Balmer lines, Mg ii, Fe ii, O i and Ca ii, emitted by a mildly ionized medium having a much higher density (≳ 1010 cm−3). The real scenario is more convoluted and the search for a global unified picture is still ongoing. However, this representation—dichotomy into LILs and HILs originating from the vicinity of the SMBH due to the inherent radiation of the accretion disk—has been instrumental to identify a low-ionization virialized component and the contribution of a high ionization wind (Leighly, 2004; Marziani et al., 2010), that proved to be especially prominent in highly accreting sources, i.e., quasar radiating at maximum radiative output per unit mass (Martínez-Aldama et al., 2019; Panda, 2022). Low-ionization lines retain fairly symmetric profiles that indicate virial motions and therefore that their width is suitable for virial broadening estimation without the need of introducing large corrections (Marziani et al., 2013; 2019; 2022). MBH estimates remain reliable even if the effect of partially resolved outflows (in radial velocity) has to be taken into account (Negrete et al., 2018; Marziani et al., 2022; Buendia-Rios et al., 2023).
3.3 Quasar main sequence
3.3.1 The Eigenvector 1/main sequence
The study of Boroson and Green (1992) brought together the spectral diversity of Type-1 AGNs under a single framework. Their paper is fundamental for two reasons: 1) it provides one of the first templates for fitting the Fe ii pseudo-continuum. The Fe ii emission manifests itself as a pseudo-continuum owing to the many, blended multiplets over a wide wavelength range, extracted from the spectrum of a prototypical Narrow Line Seyfert Type-1 (NLS1) source, I Zw 1; and more importantly, 2) it introduced the Eigenvector 1 (E1) sequence to unify the diverse group of AGNs. They used principal component analysis—a conventional dimensionality reduction technique—on observed properties of a sample of optically bright quasars to obtain a sequence. Of special importance is the optical plane that shows the connection between the FWHM of the broad Hβ and the strength of the Fe ii blend between 4,434 and 4,684 Å to the Hβ (or RFeII). This optical plane of the Eigenvector 1 (or of the “main sequence” of quasars) was eventually included in a 4D parameter space (4DE1) that encompasses high-ionization broad line blueshifts (Sulentic et al., 2000b; 2007), and soft-X photon index (Sulentic et al., 2000b; Bensch et al., 2015). The 4DE1 additional parameters are related to wind prominence and accretion status. It is therefore not unexpected that the main sequence might be primarily driven by the Eddington ratio, i.e., the ratio between radiation and gravitational forces (e.g., Sulentic et al., 2000a; Marziani et al., 2001; Boroson, 2002; Shen and Ho, 2014; Marziani et al., 2018b) affecting several BLR physical properties (Panda et al., 2018; Panda et al., 2019a; Panda et al., 2019c; Panda, 2021a).
3.3.2 Population A and population B
A classification based on the width of the Hβ emission line profile in an AGN spectrum was introduced by Sulentic et al. (2000a). Population A includes local NLS1s as well as more massive high accretors which are mostly classified as radio-quiet (e.g., Marziani and Sulentic, 2014a) and that have FWHM(Hβ) ≤4,000 km s−1. On the contrary, Population B sources are those with broader Hβ (≥4,000 km s−1), and are, at a large prevalence, “jetted” sources (e.g., Padovani et al., 2017). The Eigenvector 1 sequence of Boroson and Green (1992) was extended to cover the soft-X ray domain (e.g., Sulentic et al., 2000b), assessing a relation between the soft-X photon index Γsoft, the Hβ line width, and the Fe ii prominence (see also later developments on the relation between X-ray and optical spectra by Grupe, 2004; Grupe et al., 2010; Ai et al., 2011; Jin et al., 2012b; Bensch et al., 2015; Ojha et al., 2020).
Sources with higher values of soft X-ray excess (corresponding to a value of the soft-X photon index3 (Γsoft ≈ 3–4) concentrate among the highly accreting Pop. A quasars (Grupe, 2004; Sulentic et al., 2008), while Pop. B quasars typically have Γsoft ≈ 2. The cut-off in the FWHM of Hβ at 4,000 km s−1 was suggested by Sulentic et al. (2000a) who found that low z AGN (z ≲ 1) properties appear to change more significantly at this broader line-width cutoff (see also Collin et al., 2006; Ferland et al., 2020).
The usefulness of a fixed FWHM limit—let it be 2000 km s−1 or 4,000 km s−1 is questionable, as the FWHM is dependent on MBH (or luminosity), viewing angle, and Eddington ratio (Marziani et al., 2018b). It makes sense if the limit is applied to samples in a narrow range of luminosity or MBH. However, we re-iterate the question posed a few years ago (Sulentic and Marziani, 2015):
Are populations A and B simply two extreme ends of the main sequence or do they represent two distinct quasar populations? Or are they tied via a smooth transition in the accretion mode?
The issue is very relevant to our quest to use quasars as standard, or standardizable candles, since the shape of the emission line profiles and continuum strength is directly connected to the central engine, especially to the black hole mass, and, the accretion rate, in addition to the black hole spin and, the angle at which the central engine is viewed by a distant observer (Wang et al., 2014b; Czerny et al., 2017; Panda et al., 2017; Marziani et al., 2018b; Panda et al., 2019c; Panda, 2021b). Looking at the black hole mass vs. luminosity diagram, type-1 AGN in optically selected surveys are distributed along a relatively narrow strip with 0.01 ≲ L/LEdd ≲ 1, over a range of black hole masses MBH exceeding 4 dexes (see, e.g., the Figure 15 of D’Onofrio et al., 2021). For L/LEdd ≲0.01, accretion is expected to enter into a radiatively inefficient domain, in addition to selection effects that disfavour the lowest accretors at a given MBH. At the other end of the L/LEdd range, sources that radiate at L/LEdd ≫ 1 may simply not exist, as radiative efficiency is expected to decrease at a very high accretion rate, yielding to an asymptotic behaviour for the Eddington ratio toward a limiting value of order unity (
3.3.3 Narrow-line Seyfert 1s—A special class of AGNs?
Narrow Line Seyfert Type-1 galaxies (or NLS1s)5 are a class of Type-1 AGNs that are characterized with “narrower” broad emission lines: FWHM(Hβbroad) ≤ 2,000 km s−1, along with the ratio of [Oiii]λ5007 to the Hβ less than 3 (Osterbrock and Pogge, 1985; Goodrich, 1989). In addition to these properties, the NLS1s often exhibit strong Fe ii emission and the relative strength of the optical Fe ii (within 4,434–4,684 Å) to the Hβ, or RFeII ≳ 1 (Sulentic et al., 2000a; Marziani et al., 2018b; Panda et al., 2019c; Rakshit et al., 2020). NLS1s have been used to analyze the Fe ii emission since the late 1970s (Phillips, 1978) and have been regarded among the most noticeable cooling agents of the BLR, emitting about ∼25% of the total energy in the BLR (Wills et al., 1985; Marinello et al., 2016). The Fe ii is a strong contaminant owing to a large number of emission lines and without proper modelling and subtraction, it may lead to a wrong description of the physical conditions in the BLR (Verner et al., 1999; Sigut and Pradhan, 2003; Baldwin et al., 2004; Sigut et al., 2004; Panda, 2021b). NLSy1s tend to be more variable than their “broader” counterparts in the X-ray regime (Leighly, 1999; Grupe, 2004; McHardy et al., 2006), although the scales of their variability are not as pronounced in the optical and infrared regime (Giannuzzo et al., 1998; Ai et al., 2013).
This is a summary of the conventional view of NLSy1s. A more exhaustive view is reached by the contextualization offered by the Eigenvector 1 Main Sequence. More prominently, the parameter RFeII is central to the E1 schema as it is the dominant variable in the principal component analysis presented by Boroson and Green (1992). The PCA analysis led for the first time to the appreciation of the Fe ii relevance in large samples of quasar spectra. NLSy1s showing significant Fe ii emission (RFeII ≳ 0.5) were described by Sulentic et al. (2000a) “as drivers of all Eigenvector 1 correlations.” Indeed, NLS1s with high accretion rates are typically shown to have a soft-X-ray excess (Arnaud et al., 1985) in their broadband SED (Jin et al., 2012a; b; Kubota and Done, 2018; Ferland et al., 2020). NLS1s also show stronger blueshifts (blueward asymmetries) especially in the HILs (e.g., Sulentic et al., 2000a; Sulentic et al., 2007; Leighly and Moore, 2004), as well as higher RFeII implying high L/LEdd (e.g., Du et al., 2016b). The E1 is now well understood to be associated with important parameters of the accretion process in the AGNs (Sulentic et al., 2000a; Shen and Ho, 2014; Marziani et al., 2018b; Panda et al., 2019c; Du and Wang, 2019; Martínez-Aldama et al., 2021), although the nature of the connection between RFeII and L/LEdd remains unclear to date. NLS1s typically host black holes with lower masses (≲ 107 M⊙) and tend to be less luminous and have low radio jet power—which has led many authors (Sulentic et al., 2000a; Mathur, 2000; Berton et al., 2017; Fraix-Burnet et al., 2017) to link them to an evolutionary scheme of BHs. These authors have suggested that the NLS1s are the younger versions of more evolved, more massive SMBHs that constitute the bulk of the population of AGNs.
3.4 Accretion parameters
The estimation of black hole masses is perhaps the most sought-after analysis when it comes to AGN studies (Vestergaard and Peterson, 2006; Shen et al., 2011). AGNs show variations in their continuum and emission line intensities that can range in the order of minutes/days for the continuum to days/weeks/months timescales for the BLR region (Ulrich et al., 1997). This crucial feature led to the estimation of black hole masses for a few hundred nearby AGNs and relatively distant quasars6 using the technique of reverberation mapping (Blandford and McKee, 1982; Peterson, 1988; Peterson, 1993; Peterson et al., 2004) with the knowledge of the location of the line emitting region from the central SMBH7. Coupling the information of the velocity broadening from single/multi-epoch spectroscopy (Kaspi et al., 2000; Bentz et al., 2013; Du et al., 2014) with a basic knowledge of the geometry of the emitting region (Pancoast et al., 2014; Li et al., 2016; Li et al., 2018), we are well poised to derive the black hole masses using the virial relation (Peterson et al., 2004): MBH ∼ fSrBLRδv2/G. There remains still a considerable level of uncertainty in the virial factor fS (Marziani and Sulentic, 2012; Shen, 2013): the geometry and dynamics of the emitting regions remain poorly constrained. In dealing with MBH estimate we actually encounter several difficulties associated with the lack of spherical symmetry of the BLR velocity field (McLure and Jarvis, 2002; Decarli et al., 2011), and with the possibility of anisotropic continuum emission. The uncertainties in the MBH estimation affect the L/LEdd estimates as well, with the complication that L/LEdd estimates from optical/UV data depend on a bolometric correction that in turn depends not only on accretion state as evinced from Figure 1 but also on luminosity (e.g., Netzer, 2019, and references therein) as well as on viewing angle (e.g., Runnoe et al., 2013). Curiously, if the assumption of a highly flattened Hβ emitting region is correct, there could be a way out right for super-Eddington sources exploiting the computation of the “virial luminosity” from line widths (Section 4; Eq. 1).
The ratios between the virial and the redshift-based luminosity can be explained entirely by orientation effects (Negrete et al., 2018), thereby making it possible to derive an estimate of the viewing angle for each individual source. This method has been barely explored, but it has in principle the ability to constrain the disk/wind scenario in extreme Population A. We will discuss in §4.3 the anisotropy in continuum emission for xA sources—these refer to the sources that exhibit strong Fe ii emission (RFeII ≳1) and are associated with accretion rates close to the Eddington limit, in the optical plane of the Eigenvector 1 main sequence diagram (Marziani et al., 2018a; Panda et al., 2019c).
4 An avenue for cosmological studies?
A better understanding of the AGN’s inner workings can pave the road to far-reaching applications. One of them is the standardization of quasars (or QSOs) for measuring cosmological parameters. Two methods that involve quasar intrinsic properties resort to a law analogous to that of Faber-Jackson, connecting velocity dispersion and luminosity (Section 4.1), and the radius-luminosity scaling laws (Section 4.2). Both methods face challenges.
4.1 Eddington standard candles?
The application of quasars radiating at or above the Eddington limit has been proposed for several years although the method has not yet been exploited to its full potential (Marziani et al., 2021b; Dultzin et al., 2020, and references therein). The method is conceptually simple: the accretion luminosity of a quasar is proportional to the a power of the line width,8 i.e., L ∝FWHMn. The value of the exponent n = 4 comes from the virial relation for the black hole mass, the assumptions of constant Eddington ratio (L/LEdd ∝ L/MBH
More in detail, the equation connecting luminosity and line width can be written as:
Where we have evidenced the main physical factors entering the estimate of the virial luminosity from measurements of radial velocity dispersion δvr (FWHM, σ). The effect of orientation can be quantified by assuming that the line broadening is due to an isotropic component δviso + a flattened component whose virial velocity field projection along the line of sight is
that implies:
The factor
4.2 Scatter in the R-L relation, standardizing QSOs for cosmological studies
An important result of the reverberation mapping studies is from the empirical power-law relation between the BLR radius (or light travel time delay) and the luminosity, RBLR
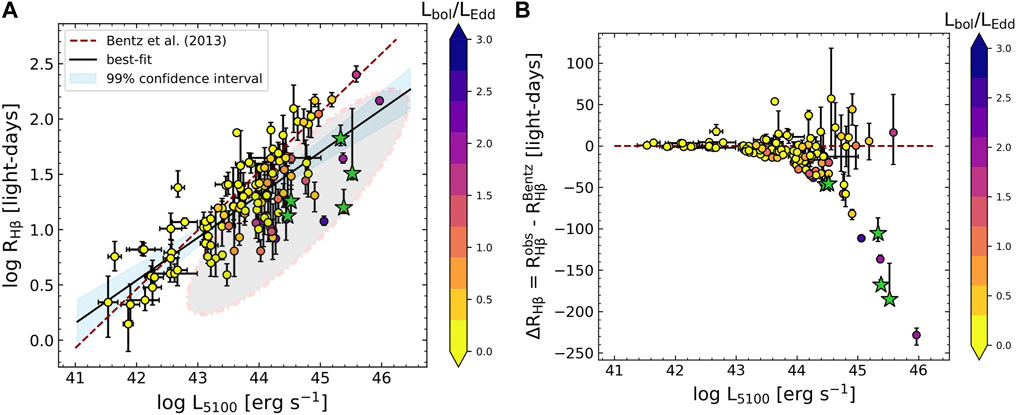
FIGURE 2. (A) BLR radius (of Hβ emitting region) versus the AGN monochromatic luminosity at 5100Å. The sources are coloured with respect to their Eddington ratios (Lbol/LEdd). The dashed line shows the classical relation from Bentz et al. (2013). The linear best-fit relation (black solid line) for the sources has the form: log RHβ = 0.387×(log L5100)—15.702, with a Spearman’s correlation coefficient ρ ≈0.733 and p-value ≈2.733×10⁻²¹. The shaded region in light blue marks the 99% confidence interval about the linear best-fit relation. The shaded ellipse highlights the sources with relatively high Eddington ratio values that deviate away from the classical relation, i.e., towards shorter BLR radii. Sources with L/LEdd
Recent observations have led to populate the RBLR-L5100 observational space and take the total count over 100, especially the sources monitored under the SEAMBH project (Super-Eddington Accreting Massive Black Holes, Du et al., 2014; Wang et al., 2014a; Hu et al., 2015; Du et al., 2015; Du et al., 2016a; Du et al., 2018), and from the SDSS-RM campaigns (Grier et al., 2017; Shen et al., 2019). But this has introduced us to a new challenge - the inherent dispersion in the RBLR-L5100 relation after the introduction of these new sources. Figure 2A is an abridged version from Martínez-Aldama et al. (2019); Panda (2021a) where the RBLR-L5100 observational space for 117 reverberations mapped AGNs is shown. The sources are coloured with respect to their Eddington ratios (Lbol/LEdd). The best-fit relation for this sample is, log RHβ = 0.387×(log L5100) - 15.702, with a Spearman’s correlation coefficient (ρ) = 0.733 and p-value = 2.733 × 10⁻²¹, thus making the overall slope of the relation much shallower than obtained from the previous studies by Bentz et al. (2013) and bringing the validity of the empirical RBLR-L5100 relation into question. But interestingly, the sources that eventually led to the increase in the scatter in the relation show a trend with the Eddington ratio - the larger the dispersion of a source from the empirical RBLR-L5100 relation, the higher its Eddington ratio! In Martínez-Aldama et al. (2019), we found that this dispersion can be accounted for in the standard RBLR-L5100 relation with an added dependence on the Eddington ratio (Lbol/LEdd). This is highlighted in the Figure 2B, where the difference between the observed time delays and that estimated from the empirical RBLR-L5100 relation (i.e., ΔRBLR; Bentz et al., 2013), for the sources shown in the left panel, are plotted against their respective L5100. One can appreciate the drop in the ΔRBLR value, especially for sources with high Eddington ratios indicating that sources with shorter “observed” time lag especially at the high luminosity end of the scaling relation exhibit high accretion rates. In other words, these sources are expected to host SMBHs with low BH masses (Du et al., 2014; Du et al., 2016a). Although we note that there are some sources which, albeit being of high Eddington nature, are observed to have RBLR sizes comparable to the predicted value from Bentz et al. (2013). Du and Wang (2019) exploited this further in their work and realized that with an additional correction term, the relation can be reverted back to the original relation with a slope ∼0.5. This additional correction term is an observational parameter, the relative strength between the optical Fe ii emission and the corresponding Hβ emission (RFeII) that has been shown in earlier studies to be a reliable observational proxy for the Eddington ratio (Sulentic et al., 2000a; Marziani et al., 2001; Shen and Ho, 2014; Marziani et al., 2018b; Panda et al., 2019c; Du and Wang, 2019; Martínez-Aldama et al., 2021) which we touched upon in earlier sections. The relation takes the form (Du and Wang, 2019):
Where the flux (F) can be independently estimated from the observed AGN spectrum for a given source. With this correction in terms of an observable quantity, i.e., RFeII, we avoid the circularity problem which was present when the correction was explicitly made in terms of the Eddington ratio (Martínez-Aldama et al., 2019), and can have a robust estimate of the luminosity distance (DL). This then allows us to construct a Hubble diagram using quasars where we know their luminosity distance and their redshifts, and test the validity of the standard cosmological model and their alternatives (see, e.g., Haas et al., 2011; Watson et al., 2011; Czerny et al., 2013; Czerny et al., 2019; Czerny et al., 2021; Khadka et al., 2021; Khadka et al., 2022; Zajaček et al., 2021). Super-Eddington accreting sources are expected to be preferentially selected with increasing redshift in flux-limited sample (Sulentic et al., 2014). A combination of this selection bias and intrinsic Eddington ratio evolution (e.g., Cavaliere and Vittorini, 2000; Hopkins et al., 2006) makes for high redshift quasar spectra often resembling lower-z extreme Population A spectra (an effect predicted by Sulentic et al. 2000a). Their inclusion is thus vital in extending the RBLR-L5100 relation to higher luminosity regime as shown in Figure 3 where, κ = 1.65 ± 0.06, α = 0.45 ± 0.03, and γ = −0.35 ± 0.08. Clearly, the introduction of the RFeII term and for sources with strong Fe ii emission, is able to account for their shorter time-lags and hence, smaller RBLR sizes. In addition, we are able to recover the slope (α) closer to the theoretical predictions, i.e., 0.5 (Davidson, 1977; Davidson and Netzer, 1979) and hence, we can safely use the modified RBLR-L5100 relation (including the correction term wrt RFeII) to independently estimate the monochromatic luminosity for a given source, and couple the information from the flux obtained from direct observations, to eventually estimate the luminosity distance to the said source:
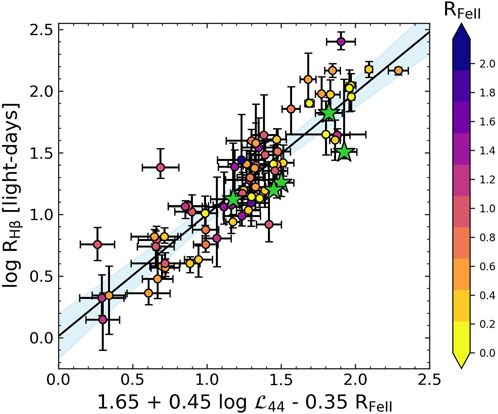
FIGURE 3. An abridged version of Figure 5 in Du and Wang (2019) showing the new RBLR—L5100 relation with the inclusion of the RFeII. The sample contains 75 reverberation-mapped sources which have RFeII estimated from their respective spectrum. The best-fit relation is shown in a black solid line with ρ = 0.894 and p-value = 3.466×10⁻²⁷. The corresponding shaded region (in light blue) highlights the 99% confidence interval about the linear best-fit relation with an effective scatter of ∼0.196 dex. Here,
Where the flux (F) can be independently estimated from the observed AGN spectrum for a given source. In this way, we can avoid circularity and can have a robust estimate of the luminosity distance.
4.3 Anisotropic radiation from the accretion disk
An equally important aspect in this regard is the ionizing continuum produced by the central engine. The characterization of the ionizing SED that comes from regions closer than the BLR is important for our study of the emission lines. From the photo-ionization point of view, this fraction of the broad-band SED is closely related to the number of ionizing photons that eventually leads to the line production that has permitted the estimation of a photoionization radius of the BLR (Wandel et al., 1999; Negrete et al., 2014; Martínez-Aldama et al., 2015; Panda, 2021b; Panda, 2022).
We tested the variation in the low-ionization part of the BLR by accounting for the changes in the shape of the ionizing continuum (the SED) and the location of the Hβ-emitting BLR from the central ionizing source (or RBLR) from the reverberation mapping, in the context of Main Sequence of Quasars (Panda, 2022). In this and previous work (Panda, 2021b), we have found that in order to estimate the correct physical conditions for these low-ionization lines emitting regions in the BLR, it is not sufficient to only retrieve the flux ratios (e.g., RFeII) but to also have an agreement with the corresponding modelled and observed line strengths (or line equivalent widths, EWs). Compared to the results that are directly obtained from the photoionization theory, these new results highlight the shift in the overall location of the line-emitting RBLR—in terms of the ionization parameter U and the local cloud density (nH) recovered from the analysis towards lower values (by up to 2 dexes) compared to the RBLR values estimated from the photoionization theory. This brings the modelled location in agreement with the reverberation mapping results, especially for the high-accreting NLS1s which show shorter time-lags/smaller emitting regions. A corollary result is that to retrieve such physical conditions, the BLR should “see” a different, filtered SED with only a fraction of the total ionizing photon flux. This analysis was performed on selected sources with readily available broad-band SEDs and archival spectroscopic measurements. In addition, we assumed source-specific metallicities that were derived using the UV diagnostic lines from earlier studies (see, e.g., Marziani et al., 2022). There is a need to extend this analysis to a larger number of reverberation-mapped sources. We, therefore, need synchronous multi-wavelength observations to build robust SEDs that can be used to confirm this scenario. Also, there is a need to bring together a global picture where a combined analysis of the UV and optical emitting regions can be put together—to allow us to gauge the salient differences in the low- and high-ionization line emitting regions.
Wang et al. (2014c) derived the analytical solutions (steady-state) for the structure of “slim” accretion discs from sub-Eddington accretion rates to extremely high, super-Eddington rates. They notice the appearance of a funnel-like structure very close to the SMBH at super-Eddington rates and attribute this feature to the puffing up of the inner accretion disk by radiation pressure, wherein the Shakura and Sunyaev (1973) prescription for a geometrically thin, optically thick accretion disk doesn’t hold (Abramowicz et al., 1988; Sadowski, 2011; Wang et al., 2014c). We show an illustration of this scenario in Figure 4. Such modifications to the disk structure strongly affect the overall anisotropic emission of ionizing photons from the disk in addition to just inclination effects that arise due to the axisymmetric nature of these systems. Therefore, with a rise in accretion rates, a continuum anisotropy needs to be accounted for. The anisotropy then leads to the shrinking in the position of the BLR—exposed to a lower continuum flux than the observer (Figure 4)—that brings the modelled location in agreement with the observed estimates from the reverberation mapping campaigns (see Panda, 2021b, for more details).
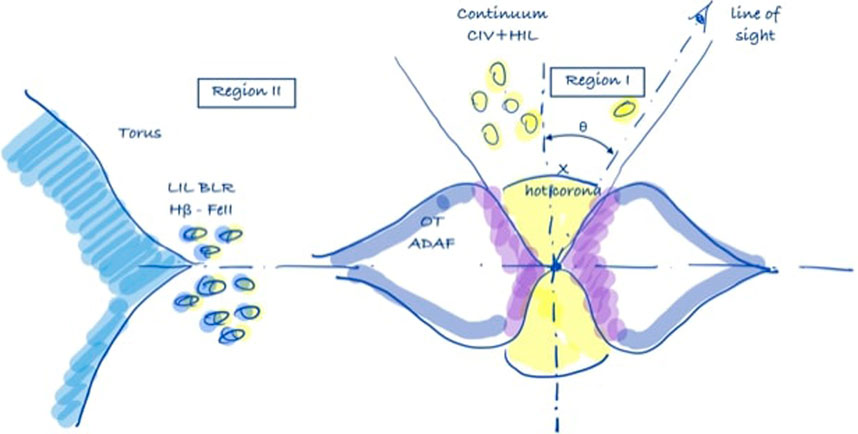
FIGURE 4. Schematic view of the inner sub-parsec region around the SMBH for a high accreting AGN. Region I is exposed to the continuum emitted from the hottest part of the optically thick (OT) and geometrically thick advection-dominated accretion flow (ADAF). The observer sees inside of this region if the line-of-sight is inclined by ≲30 degrees from the disk axis. Region II refers to the region shielded from the hottest region and exposed to a colder continuum emitted from the ADAF at angles ≳θ. Abridged version from Wang et al. (2014c); not drawn to scale.
The left panel in Figure 5 shows the slim-disk SEDs (Jian-Min Wang, priv. comm.) for a representative BH mass of 108 M⊙, accreting at
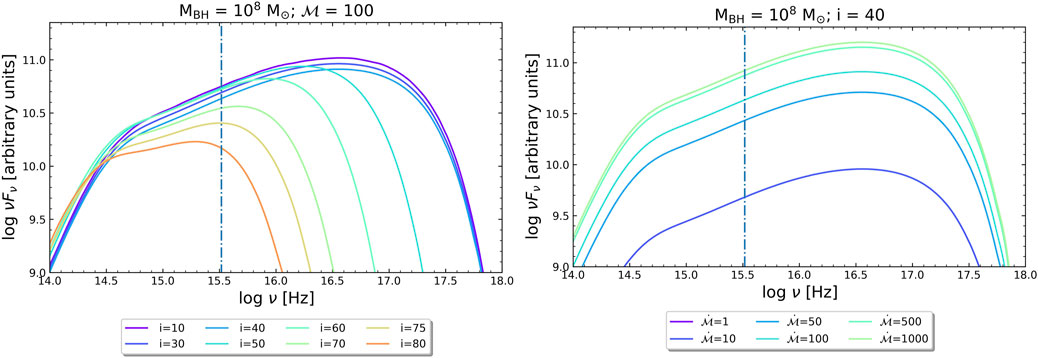
FIGURE 5. Spectral energy distributions (SEDs) obtained for slim accretion disks for a representative black hole mass, MBH = 108 M⊙. LEFT: SEDs are shown for a range of viewing angle cases for a representative dimensionless accretion rate,
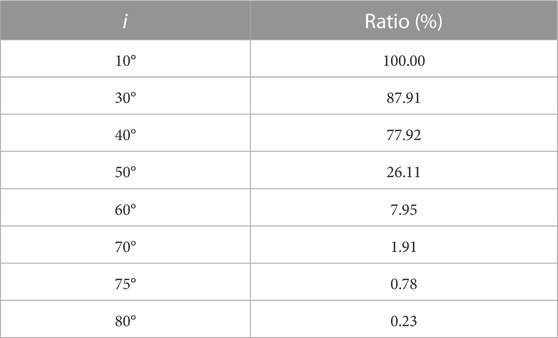
TABLE 1. Fraction of ionizing continuum flux (in %) of the slim disk SED shown in the left panel of Figure 5 (relative to the case with i = 10°).
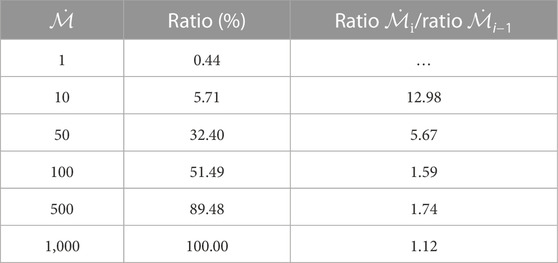
TABLE 2. Fraction of ionizing continuum flux (in %) under the slim disk SEDs shown in the right panel of Figure 5 (normalized to the case with
In Figure 6, we highlight a representative fit (in grey) to the high SED case (in blue) from Ferland et al. (2020) utilizing a two-component model, i.e., a slim accretion disk that represents the thermal component (in dashed red) along with a hot Comptonized component (in dashed green). Here, the slim accretion disk SED is modelled for a face-on viewing angle, i = 10° for a
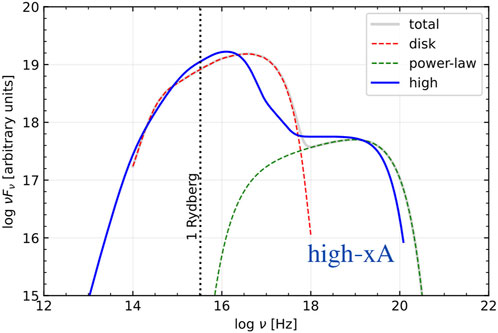
FIGURE 6. A simplified model for the “high” SED of Ferland et al. (2020) using the
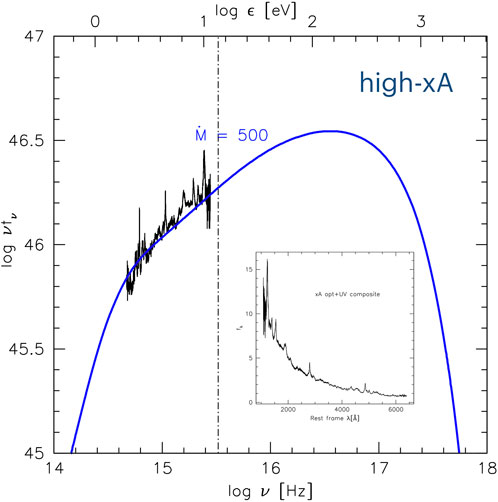
FIGURE 7. Composite spectrum for xA from Marziani et al. (2013), with the Wang et al. (2014c) SED superimposed for
Table 2 shows that the fraction of ionizing photons at a very high accretion rate tends to saturate, with only a 10% increasing from the doubling of the accretion rate, from
5 Concluding remarks
We have reviewed some basic aspects of luminous type-1 AGN (Section 1) to introduce highly accreting sources with special attention to their SEDs (Section 3), focusing on the most relevant aspects (such as anisotropy, Section 4.3) in the context of the possible application to the measurements of the cosmological parameters (Sections 3, 4). We have stressed that Population A includes NLS1s but that only a fraction of the sources can be considered highly accreting, as a defining criterion is RFeII ≳ 1, and this criterion isn’t met by all Population A and NLS1 sources. On the converse, a criterion based on line width implies a dependence on black hole mass (and hence luminosity in flux-limited samples), viewing angle, Eddington ratio, and yields a selection that is, unavoidably, sample dependent (Marziani et al., 2018a; Panda et al., 2019c).
Looking at the bigger picture, we can construct the Hubble diagram with the luminosity distances using Eq. 5 corrected according to Eq. 4 and the corresponding redshifts for each source. The key here is to have the measurement of the time-delay (e.g., from Eq. 4) and the AGN monochromatic flux using single epoch spectra that allow us to estimate the luminosity distances regardless of accretion properties. Hence, very large samples of reverberation-mapped AGNs can be used as cosmological candles (Collier et al., 1999; Elvis and Karovska, 2002; Horne et al., 2003; Panda et al., 2019b; Khadka et al., 2022). This may further allow us to study the evolution of the cosmological parameters as a function of the redshift allowing for the reconciliation of the Hubble tension—the disparity between the measured value of the Hubble constant in the local and the early Universe (see Figure 8).

FIGURE 8. This graphic lists the variety of techniques that have been used to measure the expansion rate of the universe, known as the Hubble constant (H0). One set of observations looked at the very early universe (or the early route, shown in the bottom half of the graphic) and the second set of observation strategies analyzed the universe’s expansion in the local universe (or the late route, shown in the upper half of the graphic). The letters corresponding to each technique are plotted on the bridge on the right. The location of each dot on the bridge road represents the measured value of the H0, while the length of the associated bar shows the estimated amount of uncertainty in the measurements. The combined average from the seven methods from the late route yields a H0 value of 73 km s−1 Mpc−1. This number is at odds with the combined value of the techniques used to calculate the universe’s expansion rate from the early route. Their combined value for the H0 is 67.4 km s−1 Mpc−1. Abridged version. Original graphic credit: NASA, ESA, and A. James (STScI).
There will be an immense potential for the ideas and results presented in this work in the near future, serving as test-beds for the vast number of AGNs that will be explored with the ongoing and upcoming ground-based 10-m-class (e.g., Maunakea Spectroscopic Explorer, Marshall et al., 2019) and 40 m-class (e.g., The European Extremely Large Telescope, Evans et al., 2015) telescopes; and space-based missions such as the JWST (Gardner et al., 2006; Jakobsen et al., 2022) and the Nancy Grace Roman Space Telescope (Spergel et al., 2013). Increased availability of high-quality, multi-wavelength photometric, spectroscopic and interferometric measurements extending to higher redshifts is a necessity to help develop our ever-growing theoretical understanding of how these massive, energetic cosmic sources work and evolve as well as how they might be exploited for cosmic distance estimates.
Author contributions
All authors listed have made a substantial, direct, and intellectual contribution to the work and approved it for publication.
Acknowledgments
SP acknowledges the Conselho Nacional de Desenvolvimento Científico e Tecnológico (CNPq) Fellowship (164753/2020-6). SP further acknowledges the organizers of the SPIG—31st Summer School and International Symposium on the Physics of Ionized Gases, held between 05th and 09th September 2022, for allowing presenting our work as an invited contribution. We are grateful to Prof. Jian-Min Wang for providing his slim disk SED models and to Prof. Bożena Czerny for fruitful discussions.
Conflict of interest
The authors declare that the research was conducted in the absence of any commercial or financial relationships that could be construed as a potential conflict of interest.
Publisher’s note
All claims expressed in this article are solely those of the authors and do not necessarily represent those of their affiliated organizations, or those of the publisher, the editors and the reviewers. Any product that may be evaluated in this article, or claim that may be made by its manufacturer, is not guaranteed or endorsed by the publisher.
Footnotes
1The old description of AGN continuum as non-thermal, featureless was perhaps inspired by the earliest quasars studied that were mainly radio loud and at any rate sub-Eddington accretors. The power-law function used to fit the optical/UV continuum over a limited range in frequency is now considered to represent the thermal continuum from an accretion disk, whose power
2There is a general consensus that type-1 AGN BLR gas has supersolar abundance with canonical estimates reaching over 10 times solar (Hamann and Ferland, 1993; Hamann and Ferland, 1999). However, the highest values depend also on the lines employed as diagnostics: the Al and Si lines are strongly dependent on enrichment by supernovæ ejecta, as stressed by the authors themselves (see, e.g., Garnica et al., 2022).
3here, the energy range considered for the estimation of the index is 0.5–2 keV based on archival Chandra and XMM-Newton data.
4Values of L/LEdd ≫ 1 should be viewed with extreme care, especially in cases of very narrow emission line profiles: orientation effects may drastically reduce the line profile in the case the emitting regions are seen pole-on. These sources stand out in a L/LEdd vs. MBH or luminosity diagram (Marziani et al., 2006).
5Type 1/Type 2 classifications are based on the observation of the broad emission line features in an AGN spectrum. According to unified model (Antonucci, 1993; Urry and Padovani, 1995; Marin, 2014; Netzer, 2015), the presence of the dusty, obscuring torus impedes/allows the direct view to the central engine of the SMBH and the BLR region—that is located closer to the SMBH. This then manifests in the AGN spectrum—where the broad emission lines originating from the BLR are either seen (Type-1) or not (Type-2).
6Quasars, or QSOs, are luminous AGNs discovered at larger redshifts. This distinction is mainly of historical importance; in the following, we will use the term quasars as an umbrella term for type 1 AGN.
7In actuality, the difference in the light travel time is estimated by making a cross-correlation between the continuum light directly reaching us and the light that bounces first at the BLR region and then comes to us (Peterson, 1993; Horne et al., 2004). The continuum light is produced very close to the SMBH—in correspondence with the inner accretion disk (see, e.g., Shakura and Sunyaev, 1973; Czerny and Elvis, 1987).
8The equation is equivalent to the original formulation of the Faber-Jackson law (Faber and Jackson, 1976) and is equivalent to other relations linking virialized systems to the amount of radiation emitted.
9Here, the relation assumes the BLR radius for the Hβ and the nearest continuum luminosity at 5100 Å.
10This is the dimensionless accretion rate introduced by Wang et al. (2014a):
11Rydberg ≈3.29 × 10¹⁵ Hz.
12The average frequency of the ionizing continuum changes by just 5% passing from the Mathews and Ferland (1987) to Marziani and Sulentic (2014a): from
References
Abramowicz, M. A., Czerny, B., Lasota, J. P., and Szuszkiewicz, E. (1988). Slim accretion disks. Astrophysical J. 332, 646–658. doi:10.1086/166683
Ai, Y. L., Yuan, W., Zhou, H., Wang, T. G., Dong, X. B., Wang, J. G., et al. (2013). A comparative study of optical/ultraviolet variability of narrow-line Seyfert 1 and broad-line Seyfert 1 active galactic nuclei. Astronomical J. 145, 90. doi:10.1088/0004-6256/145/4/90
Ai, Y. L., Yuan, W., Zhou, H. Y., Wang, T. G., and Zhang, S. H. (2011). X-Ray properties of narrow-line Seyfert 1 galaxies with very small broadline widths. Astrophysical J. 727, 31. doi:10.1088/0004-637X/727/1/31
Antonucci, R. (2012). A panchromatic review of thermal and nonthermal active galactic nuclei. Astronomical Astrophysical Trans. 27, 557–602.
Antonucci, R. (1993). Unified models for active galactic nuclei and quasars. Annu. Rev. Astronomy Astrophysics 31, 473–521. doi:10.1146/annurev.aa.31.090193.002353
Arnaud, K. A., Branduardi-Raymont, G., Culhane, J. L., Fabian, A. C., Hazard, C., McGlynn, T. A., et al. (1985). EXOSAT observations of a strong soft X-ray excess in MKN 841. Mon. Notices R. Astronomical Soc. 217, 105–113. doi:10.1093/mnras/217.1.105
Baldwin, J. A., Ferland, G. J., Korista, K. T., Hamann, F., and LaCluyzé, A. (2004). The origin of Fe II emission in active galactic nuclei. Astrophysical J. 615, 610–624. doi:10.1086/424683
Barth, A. J., Pancoast, A., Bennert, V. N., Brewer, B. J., Canalizo, G., Filippenko, A. V., et al. (2013). The lick AGN monitoring project 2011: Fe II reverberation from the outer broad-line region. Astrophysical J. 769, 128. doi:10.1088/0004-637X/769/2/128
Bensch, K., del Olmo, A., Sulentic, J., Perea, J., and Marziani, P. (2015). Measures of the soft X-ray excess as an eigenvector 1 parameter for active galactic nuclei. J. Astrophysics Astronomy 36, 0–474. doi:10.1007/s12036-015-9355-8
Bentz, M. C., Cackett, E. M., Crenshaw, D. M., Horne, K., Street, R., and Ou-Yang, B. (2016). A reverberation-based black hole mass for MCG-06-30-15. Astrophysical J. 830, 136. doi:10.3847/0004-637X/830/2/136
Bentz, M. C., Denney, K. D., Grier, C. J., Barth, A. J., Peterson, B. M., Vestergaard, M., et al. (2013). The low-luminosity end of the radius-luminosity relationship for active galactic nuclei. Astrophysical J. 767, 149. doi:10.1088/0004-637X/767/2/149
Bentz, M. C., Horenstein, D., Bazhaw, C., Manne-Nicholas, E. R., Ou-Yang, B. J., Anderson, M., et al. (2014). The mass of the central black hole in the nearby Seyfert galaxy NGC 5273. Astrophysical J. 796, 8. doi:10.1088/0004-637X/796/1/8
Bentz, M. C., Peterson, B. M., Netzer, H., Pogge, R. W., and Vestergaard, M. (2009). The radius-luminosity relationship for active galactic nuclei: The effect of host-galaxy starlight on luminosity measurements. II. The full sample of reverberation-mapped AGNs. Astrophysical J. 697, 160–181. doi:10.1088/0004-637X/697/1/160
Berton, M., Foschini, L., Caccianiga, A., Ciroi, S., Congiu, E., Cracco, V., et al. (2017). An orientation-based unification of young jetted AGN: The case of 3C 286. Front. Astronomy Space Sci. 4, 8. doi:10.3389/fspas.2017.00008
Blandford, R. D., and McKee, C. F. (1982). Reverberation mapping of the emission line regions of Seyfert galaxies and quasars. Astrophysical J. 255, 419–439. doi:10.1086/159843
Boissay, R., Ricci, C., and Paltani, S. (2016). A hard X-ray view of the soft excess in AGN. Astronomy Astrophysics 588, A70. doi:10.1051/0004-6361/201526982
Boroson, T. A. (2002). Black hole mass and Eddington ratio as drivers for the observable properties of radio-loud and radio-quiet QSOs. Astrophysical J. 565, 78–85. doi:10.1086/324486
Boroson, T. A., and Green, R. F. (1992). The emission-line properties of low-redshift quasi-stellar objects. Astrophysical J. Suppl. 80, 109. doi:10.1086/191661
Buendia-Rios, T. M., Negrete, C. A., Marziani, P., and Dultzin, D. (2023). Statistical analysis of Al III and C III] emission lines as virial black hole mass estimators in quasars. Astronomy Astrophysics 669, A135. doi:10.1051/0004-6361/202244177
Caccianiga, A., Antón, S., Ballo, L., Foschini, L., Maccacaro, T., Della Ceca, R., et al. (2015). WISE colours and star formation in the host galaxies of radio-loud narrow-line Seyfert 1. Mon. Notices R. Astronomical Soc. 451, 1795–1805. doi:10.1093/mnras/stv939
Carniani, S., Marconi, A., Maiolino, R., Balmaverde, B., Brusa, M., Cano-Díaz, M., et al. (2015). Ionised outflows inz∼ 2.4 quasar host galaxies. Astronomy Astrophysics 580, A102. doi:10.1051/0004-6361/201526557
Cavaliere, A., and Vittorini, V. (2000). The fall of the quasar population. Astrophysical J. 543, 599–610. doi:10.1086/317155
Collier, S., Horne, K., Wanders, I., and Peterson, B. M. (1999). A new direct method for measuring the Hubble constant from reverberating accretion discs in active galaxies. Mon. Notices R. Astronomical Soc. 302, L24–L28. doi:10.1046/j.1365-8711.1999.02250.x
Collin, S., Kawaguchi, T., Peterson, B. M., and Vestergaard, M. (2006). Systematic effects in measurement of black hole masses by emission-line reverberation of active galactic nuclei: Eddington ratio and inclination. Astronomy Astrophysics 456, 75–90. doi:10.1051/0004-6361:20064878
Collin-Souffrin, S., Dyson, J. E., McDowell, J. C., and Perry, J. J. (1988). The environment of active galactic nuclei - I. A two-component broad emission line model. Mon. Notices R. Astronomical Soc. 232, 539–550. doi:10.1093/mnras/232.3.539
Collinson, J. S. (2016). Spectral and temporal studies of supermassive black holes. UK: Ph.D. thesis, Durham University.
Crummy, J., Fabian, A. C., Gallo, L., and Ross, R. R. (2006). An explanation for the soft X-ray excess in active galactic nuclei. Mon. Notices R. Astronomical Soc. 365, 1067–1081. doi:10.1111/j.1365-2966.2005.09844.x
Czerny, B., and Elvis, M. (1987). Constraints on quasar accretion disks from the optical/ultraviolet/soft X-ray big bump. Astrophysical J. 321, 305–320. doi:10.1086/165630
Czerny, B., Hryniewicz, K., Maity, I., Schwarzenberg-Czerny, A., Życki, P. T., and Bilicki, M. (2013). Towards equation of state of dark energy from quasar monitoring: Reverberation strategy. Astronomy Astrophysics 556, A97. doi:10.1051/0004-6361/201220832
Czerny, B., Li, Y.-R., Hryniewicz, K., Panda, S., Wildy, C., Sniegowska, M., et al. (2017). Failed radiatively accelerated dusty outflow model of the broad line region in active galactic nuclei. I. Analytical solution. Astrophysical J. 846, 154. doi:10.3847/1538-4357/aa8810
Czerny, B., Martínez-Aldama, M. L., Wojtkowska, G., Zajaček, M., Marziani, P., Dultzin, D., et al. (2021). Dark energy constraintsfrom quasar observations. Acta Phys. Pol. A 139, 389–393. doi:10.12693/APhysPolA.139.389
Czerny, B., Olejak, A., Rałowski, M., Kozłowski, S., Martinez Aldama, M. L., Zajacek, M., et al. (2019). Time delay measurement of Mg II line in CTS C30.10 with SALT. Astrophysical J. 880, 46. doi:10.3847/1538-4357/ab2913
Davidson, K., and Netzer, H. (1979). The emission lines of quasars and similar objects. Rev. Mod. Phys. 51, 715–766. doi:10.1103/RevModPhys.51.715
Davidson, K. (1977). On photoionization analyses of emission spectra of quasars. Astrophysical J. 218, 20–32. doi:10.1086/155653
Decarli, R., Dotti, M., and Treves, A. (2011). Geometry and inclination of the broad-line region in blazars. Mon. Notices R. Astronomical Soc. 413, 39–46. doi:10.1111/j.1365-2966.2010.18102.x
D’Onofrio, M., Marziani, P., and Chiosi, C. (2021). Past, present and future of the scaling relations of galaxies and active galactic nuclei. Front. Astronomy Space Sci. 8, 157. doi:10.3389/fspas.2021.694554
Du, P., Hu, C., Lu, K.-X., Huang, Y.-K., Cheng, C., Qiu, J., et al. (2015). Supermassive black holes with high accretion rates in active galactic nuclei. IV. Hβ time lags and implications for super-eddington accretion. Astrophysical J. 806, 22. doi:10.1088/0004-637X/806/1/22
Du, P., Hu, C., Lu, K.-X., Wang, F., Qiu, J., Li, Y.-R., et al. (2014). Supermassive black holes with high accretion rates in active galactic nuclei. I. First results from a new reverberation mapping campaign. Astrophysical J. 782, 45. doi:10.1088/0004-637X/782/1/45
Du, P., Lu, K.-X., Zhang, Z.-X., Huang, Y.-K., Wang, K., Hu, C., et al. (2016a). Supermassive black holes with high accretion rates in active galactic nuclei. V. A new size-luminosity scaling relation for the broad-line region. Astrophysical J. 825, 126. doi:10.3847/0004-637X/825/2/126
Du, P., Wang, J.-M., Hu, C., Ho, L. C., Li, Y.-R., and Bai, J.-M. (2016b). The fundamental plane of the broad-line region in active galactic nuclei. Astrophysical J. Lett. 818, L14. doi:10.3847/2041-8205/818/1/L14
Du, P., and Wang, J.-M. (2019). The radius-luminosity relationship depends on optical spectra in active galactic nuclei. Astrophysical J. 886, 42. doi:10.3847/1538-4357/ab4908
Du, P., Zhang, Z.-X., Wang, K., Huang, Y.-K., Zhang, Y., Lu, K.-X., et al. (2018). Supermassive black holes with high accretion rates in active galactic nuclei IX 10 new observations of reverberation mapping and shortened Hβ lags. Astrophysical J. 856, 6. doi:10.3847/1538-4357/aaae6b
Dultzin, D., Marziani, P., de Diego, J. A., Negrete, C. A., Del Olmo, A., Martínez-Aldama, M. L., et al. (2020). Extreme quasars as distance indicators in cosmology. Front. Astronomy Space Sci. 6, 80. doi:10.3389/fspas.2019.00080
Elvis, M., and Karovska, M. (2002). Quasar parallax: A method for determining direct geometrical distances to quasars. Astrophysical J. Lett. 581, L67–L70. doi:10.1086/346015
Elvis, M., Wilkes, B. J., McDowell, J. C., Green, R. F., Bechtold, J., Willner, S. P., et al. (1994). Atlas of quasar energy distributions. Astrophysical J. Suppl. 95, 1–68. doi:10.1086/192093
Evans, C., Puech, M., Afonso, J., Almaini, O., Amram, P., Aussel, H., et al. (2015). The science case for multi-object spectroscopy on the European ELT. arXiv e-prints , arXiv:1501.04726.
Faber, S. M., and Jackson, R. E. (1976). Velocity dispersions and mass-to-light ratios for elliptical galaxies. Astrophysical J. 204, 668–683. doi:10.1086/154215
Fabian, A. C., Lohfink, A., Kara, E., Parker, M. L., Vasudevan, R., and Reynolds, C. S. (2015). Properties of AGN coronae in the NuSTAR era. Mon. Notices R. Astronomical Soc. 451, 4375–4383. doi:10.1093/mnras/stv1218
Fausnaugh, M. M., Grier, C. J., Bentz, M. C., Denney, K. D., De Rosa, G., Peterson, B. M., et al. (2017). Reverberation mapping of optical emission lines in five active galaxies. Astrophysical J. 840, 97. doi:10.3847/1538-4357/aa6d52
Ferland, G. J., Done, C., Jin, C., Landt, H., and Ward, M. J. (2020). State-of-the-art AGN SEDs for photoionization models: BLR predictions confront the observations. Mon. Notices R. Astronomical Soc. 494, 5917–5922. doi:10.1093/mnras/staa1207
Fraix-Burnet, D., Marziani, P., D’Onofrio, M., and Dultzin, D. (2017). The phylogeny of quasars and the ontogeny of their central black holes. Front. Astronomy Space Sci. 4, 1. doi:10.3389/fspas.2017.00001
Ganci, V., Marziani, P., D’Onofrio, M., del Olmo, A., Bon, E., Bon, N., et al. (2019). Radio loudness along the quasar main sequence. Astronomy Astrophysics 630, A110. doi:10.1051/0004-6361/201936270
Gardner, J. P., Mather, J. C., Clampin, M., Doyon, R., Greenhouse, M. A., Hammel, H. B., et al. (2006). The james webb space telescope. Space Sci. Rev. 123, 485–606. doi:10.1007/s11214-006-8315-7
Garnica, K., Negrete, C. A., Marziani, P., Dultzin, D., Śniegowska, M., and Panda, S. (2022). High metal content of highly accreting quasars: Analysis of an extended sample. Astronomy Astrophysics 667, A105. doi:10.1051/0004-6361/202142837
Gaskell, C. M. (1982). A redshift difference between high and low ionization emission-line regions in QSO’s-evidence for radial motions. Astrophysical J. 263, 79–86. doi:10.1086/160481
Giannuzzo, M. E., Mignoli, M., Stirpe, G. M., and Comastri, A. (1998). A search for variability in Narrow Line Seyfert 1 Galaxies. II. New data from the Loiano monitoring programme. Astronomy Astrophysics 330, 894–900.
Giustini, M., and Proga, D. (2019). A global view of the inner accretion and ejection flow around super massive black holes. Radiation-driven accretion disk winds in a physical context. Astronomy Astrophysics 630, A94. doi:10.1051/0004-6361/201833810
Goodrich, R. W. (1989). Spectropolarimetry of “narrow-line” Seyfert 1 galaxies. Astrophysical J. 342, 224. doi:10.1086/167586
Greenstein, J. L., and Schmidt, M. (1964). The quasi-stellar radio sources 3C 48 and 3C 273. Astrophysical J. 140, 1. doi:10.1086/147889
Grier, C. J., Trump, J. R., Shen, Y., Horne, K., Kinemuchi, K., McGreer, I. D., et al. (2017). The sloan digital sky survey reverberation mapping project: Hα and Hβ reverberation measurements from first-year spectroscopy and photometry. Astrophysical J. 851, 21. doi:10.3847/1538-4357/aa98dc
Grupe, D. (2004). A complete sample of soft X-ray-selected AGNs. II. Statistical analysis. Astronomical J. 127, 1799–1810. doi:10.1086/382516
Grupe, D., Komossa, S., Leighly, K. M., and Page, K. L. (2010). The simultaneous optical-to-X-ray spectral energy distribution of soft X-ray selected active galactic nuclei observed by swift. Astrophysical J. Suppl. 187, 64–106. doi:10.1088/0067-0049/187/1/64
Haas, M., Chini, R., Ramolla, M., Pozo Nuñez, F., Westhues, C., Watermann, R., et al. (2011). Photometric AGN reverberation mapping - an efficient tool for BLR sizes, black hole masses, and host-subtracted AGN luminosities. Astronomy Astrophysics 535, A73. doi:10.1051/0004-6361/201117325
Hamann, F., and Ferland, G. (1999). Elemental abundances in quasistellar objects: Star formation and galactic nuclear evolution at high redshifts. Annu. Rev. Astronomy Astrophysics 37, 487–531. doi:10.1146/annurev.astro.37.1.487
Hamann, F., and Ferland, G. (1993). The chemical evolution of QSOs and the implications for cosmology and galaxy formation. Astrophysical J. 418, 11. doi:10.1086/173366
Harrison, C. (2014). Observational constraints on the influence of active galactic nuclei on the evolution of galaxies. Ph.D. thesis, Durham University.
Hopkins, P. F., Hernquist, L., Cox, T. J., Di Matteo, T., Robertson, B., and Springel, V. (2006). A unified, merger-driven model of the origin of starbursts, quasars, the cosmic X-ray background, supermassive black holes, and galaxy spheroids. Astrophysical J. Suppl. 163, 1–49. doi:10.1086/499298
Horne, K., Korista, K. T., and Goad, M. R. (2003). Quasar tomography: Unification of echo mapping and photoionization models. Mon. Notices R. Astronomical Soc. 339, 367–386. doi:10.1046/j.1365-8711.2003.06036.x
Horne, K., Peterson, B. M., Collier, S. J., and Netzer, H. (2004). Observational requirements for high-fidelity reverberation mapping. Publ. Astronomical Soc. Pac. 116, 465–476. doi:10.1086/420755
Hu, C., Du, P., Lu, K.-X., Li, Y.-R., Wang, F., Qiu, J., et al. (2015). Supermassive black holes with high accretion rates in active galactic nuclei. III. Detection of Fe II reverberation in nine narrow-line Seyfert 1 galaxies. Astrophysical J. 804, 138. doi:10.1088/0004-637X/804/2/138
Jakobsen, P., Ferruit, P., Alves de Oliveira, C., Arribas, S., Bagnasco, G., Barho, R., et al. (2022). The near-infrared spectrograph (NIRSpec) on the james webb space telescope. I. Overview of the instrument and its capabilities. Astronomy Astrophysics 661, A80. doi:10.1051/0004-6361/202142663
Jin, C., Ward, M., and Done, C. (2012a). A combined optical and X-ray study of unobscured type 1 active galactic nuclei - II. Relation between X-ray emission and optical spectra. Mon. Notices R. Astronomical Soc. 422, 3268–3284. doi:10.1111/j.1365-2966.2012.20847.x
Jin, C., Ward, M., Done, C., and Gelbord, J. (2012b). A combined optical and X-ray study of unobscured type 1 active galactic nuclei - I. Optical spectra and spectral energy distribution modelling. Mon. Notices R. Astronomical Soc. 420, 1825–1847. doi:10.1111/j.1365-2966.2011.19805.x
Kamraj, N., Brightman, M., Harrison, F. A., Stern, D., García, J. A., Baloković, M., et al. (2022). X-ray coronal properties of swift/BAT-selected Seyfert 1 active galactic nuclei. Astrophysical J. 927, 42. doi:10.3847/1538-4357/ac45f6
Kaspi, S., Smith, P. S., Netzer, H., Maoz, D., Jannuzi, B. T., and Giveon, U. (2000). Reverberation measurements for 17 quasars and the size-mass-luminosity relations in active galactic nuclei. Astrophysical J. 533, 631–649. doi:10.1086/308704
Khadka, N., Martínez-Aldama, M. L., Zajaček, M., Czerny, B., and Ratra, B. (2022). Do reverberation-measured Hβ quasars provide a useful test of cosmology? Mon. Notices R. Astronomical Soc. 513, 1985–2005. doi:10.1093/mnras/stac914
Khadka, N., Yu, Z., Zajaček, M., Martinez-Aldama, M. L., Czerny, B., and Ratra, B. (2021). Standardizing reverberation-measured Mg II time-lag quasars, by using the radius-luminosity relation, and constraining cosmological model parameters. Mon. Notices R. Astronomical Soc. 508, 4722–4737. doi:10.1093/mnras/stab2807
Kirkpatrick, A., Pope, A., Sajina, A., Roebuck, E., Yan, L., Armus, L., et al. (2015). The role of star formation and an AGN in dust heating of z = 0.3-2.8 galaxies. I. Evolution with redshift and luminosity. Astrophysical J. 814, 9. doi:10.1088/0004-637X/814/1/9
Kubota, A., and Done, C. (2018). A physical model of the broad-band continuum of AGN and its implications for the UV/X relation and optical variability. Mon. Notices R. Astronomical Soc. 480, 1247–1262. doi:10.1093/mnras/sty1890
Kwan, J., and Krolik, J. H. (1981). The formation of emission lines in quasars and Seyfert nuclei. Astrophysical J. 250, 478–507. doi:10.1086/159395
Laor, A., Fiore, F., Elvis, M., Wilkes, B. J., and McDowell, J. C. (1997). The soft X-ray properties of a complete sample of optically selected quasars. II. Final results. Astrophysical J. 477, 93–113. doi:10.1086/303696
Laor, A., and Netzer, H. (1989). Massive thin accretion discs. - I. Calculated spectra. Mon. Notices R. Astronomical Soc. 238, 897–916. doi:10.1093/mnras/238.3.897
Laurenti, M., Piconcelli, E., Zappacosta, L., Tombesi, F., Vignali, C., Bianchi, S., et al. (2022). X-ray spectroscopic survey of highly accreting AGN. Astronomy Astrophysics 657, A57. doi:10.1051/0004-6361/202141829
Leighly, K. M. (1999). A comprehensive spectral and variability study of narrow-line Seyfert 1 galaxies observed by ASCA. II. Spectral analysis and correlations. Astrophysical J. Suppl. 125, 317–348. doi:10.1086/313287
Leighly, K. M. (2004). Hubble space telescope STIS ultraviolet spectral evidence of outflow in extreme narrow-line Seyfert 1 galaxies. II. Modeling and interpretation. Astrophysical J. 611, 125–152. doi:10.1086/422089
Leighly, K. M., and Moore, J. R. (2004). Hubble space telescope STIS ultraviolet spectral evidence of outflow in extreme narrow-line Seyfert 1 galaxies. I. Data and analysis. Astrophysical J. 611, 107–124. doi:10.1086/422088
Li, Y.-R., Songsheng, Y.-Y., Qiu, J., Hu, C., Du, P., Lu, K.-X., et al. (2018). Supermassive black holes with high accretion rates in active galactic nuclei. VIII. Structure of the broad-line region and mass of the central black hole in mrk 142. Astrophysical J. 869, 137. doi:10.3847/1538-4357/aaee6b
Li, Y.-R., Wang, J.-M., and Bai, J.-M. (2016). A non-parametric approach to constrain the transfer function in reverberation mapping. Astrophysical J. 831, 206. doi:10.3847/0004-637X/831/2/206
Liu, H., Luo, B., Brandt, W. N., Brotherton, M. S., Gallagher, S. C., Ni, Q., et al. (2021). On the observational difference between the accretion disk-corona connections among super- and sub-eddington accreting active galactic nuclei. Astrophysical J. 910, 103. doi:10.3847/1538-4357/abe37f
Lu, K.-X., Du, P., Hu, C., Li, Y.-R., Zhang, Z.-X., Wang, K., et al. (2016). Reverberation mapping of the broad-line region in NGC 5548: Evidence for radiation pressure? Astrophysical J. 827, 118. doi:10.3847/0004-637X/827/2/118
Lubiński, P., Beckmann, V., Gibaud, L., Paltani, S., Papadakis, I. E., Ricci, C., et al. (2016). A comprehensive analysis of the hard X-ray spectra of bright Seyfert galaxies. Mon. Notices R. Astronomical Soc. 458, 2454–2475. doi:10.1093/mnras/stw454
Malkan, M. A., and Sargent, W. L. W. (1982). The ultraviolet excess of Seyfert 1 galaxies and quasars. Astrophysical J. 254, 22–37. doi:10.1086/159701
Malkan, M. A. (1983). The ultraviolet excess of luminous quasars. II. Evidence for massive accretion disks. Astrophysical J. 268, 582–590. doi:10.1086/160981
Marin, F. (2014). A compendium of AGN inclinations with corresponding UV/optical continuum polarization measurements. Mon. Notices R. Astronomical Soc. 441, 551–564. doi:10.1093/mnras/stu593
Marinello, M., Rodríguez-Ardila, A., Garcia-Rissmann, A., Sigut, T. A. A., and Pradhan, A. K. (2016). The Fe II emission in active galactic nuclei: Excitation mechanisms and location of the emitting region. Astrophysical J. 820, 116. doi:10.3847/0004-637X/820/2/116
Marshall, J., Bolton, A., Bullock, J., Burgasser, A., Chambers, K., DePoy, D., et al. (2019). The maunakea spectroscopic explorer. Bull. Am. Astronomical Soc. 51, 126.
Martínez-Aldama, M. L., Czerny, B., Kawka, D., Karas, V., Panda, S., Zajaček, M., et al. (2019). Can reverberation-measured quasars Be used for cosmology? Astrophysical J. 883, 170. doi:10.3847/1538-4357/ab3728
Martínez-Aldama, M. L., Dultzin, D., Marziani, P., Sulentic, J. W., Bressan, A., Chen, Y., et al. (2015). O I and Ca II observations in intermediate redshift quasars. Astrophysical J. Suppl. 217, 3. doi:10.1088/0067-0049/217/1/3
Martínez-Aldama, M. L., Panda, S., Czerny, B., Marinello, M., Marziani, P., and Dultzin, D. (2021). The CaFe project: Optical Fe II and near-infrared Ca II triplet emission in active galaxies. II. The driver(s) of the Ca II and Fe II and its potential use as a chemical clock. Astrophysical J. 918, 29. doi:10.3847/1538-4357/ac03b6
Marziani, P., del Olmo, A., D’Onofrio, M., Dultzin, D., Negrete, C. A., Martínez-Aldama, M. L., et al. (2018a). “Narrow-line Seyfert 1s: What is wrong in a name?,” in Revisiting narrow-line Seyfert 1 galaxies and their place in the universe, 2. doi:10.22323/1.328.0002
Marziani, P., del Olmo, A., Martínez-Carballo, M. A., Martínez-Aldama, M. L., Stirpe, G. M., Negrete, C. A., et al. (2019). Black hole mass estimates in quasars. A comparative analysis of high- and low-ionization lines. Astronomy Astrophysics 627, A88. doi:10.1051/0004-6361/201935265
Marziani, P., Dultzin, D., del Olmo, A., D’Onofrio, M., de Diego, J. A., Stirpe, G. M., et al. (2021a). “The quasar main sequence and its potential for cosmology,” in Nuclear activity in galaxies across cosmic time. Editors M. Pović, P. Marziani, J. Masegosa, H. Netzer, S. H. Negu, and S. B. Tessema., 356, 66–71. doi:10.1017/S1743921320002598
Marziani, P., Dultzin, D., Sulentic, J. W., Del Olmo, A., Negrete, C. A., Martínez-Aldama, M. L., et al. (2018b). A main sequence for quasars. Front. Astronomy Space Sci. 5, 6. doi:10.3389/fspas.2018.00006
Marziani, P., Dultzin-Hacyan, D., and Sulentic, J. W. (2006). “Accretion onto supermassive black holes in quasars: Learning from optical/UV observations,” in New developments in black hole research. Editor P. V. Kreitler (New York: Nova Press), 123.
Marziani, P., Martínez Carballo, M. A., Sulentic, J. W., Del Olmo, A., Stirpe, G. M., and Dultzin, D. (2016). The most powerful quasar outflows as revealed by the Civ λ1549 resonance line. Astrophysics Space Sci. 361, 29. doi:10.1007/s10509-015-2611-1
Marziani, P., Olmo, A. d., Negrete, C. A., Dultzin, D., Piconcelli, E., Vietri, G., et al. (2022). The intermediate-ionization lines as virial broadening estimators for population A quasars. Astrophysical J. Suppl. 261, 30. doi:10.3847/1538-4365/ac6fd6
Marziani, P., Sniegowska, M., Panda, S., Czerny, B., Negrete, C. A., Dultzin, D., et al. (2021b). The main sequence view of quasars accreting at high rates: Influence of star formation. Res. Notes Am. Astronomical Soc. 5, 25. doi:10.3847/2515-5172/abe46a
Marziani, P., and Sulentic, J. W. (2012). Estimating black hole masses in quasars using broad optical and UV emission lines. NARev 56, 49–63. doi:10.1016/j.newar.2011.09.001
Marziani, P., and Sulentic, J. W. (2014a). Highly accreting quasars: Sample definition and possible cosmological implications. Mon. Notices R. Astronomical Soc. 442, 1211–1229. doi:10.1093/mnras/stu951
Marziani, P., Sulentic, J. W., Negrete, C. A., Dultzin, D., Zamfir, S., and Bachev, R. (2010). Broad-line region physical conditions along the quasar eigenvector 1 sequence. Mon. Notices R. Astronomical Soc. 409, 1033–1048. doi:10.1111/j.1365-2966.2010.17357.x
Marziani, P., Sulentic, J. W., Plauchu-Frayn, I., and del Olmo, A. (2013). Low-ionization outflows in high Eddington ratio quasars. Astrophysical J. 764, 150. doi:10.1088/0004-637x/764/2/150
Marziani, P., and Sulentic, J. W. (2014b). Quasars and their emission lines as cosmological probes. Adv. Space Res. 54, 1331–1340. doi:10.1016/j.asr.2013.10.007
Marziani, P., Sulentic, J. W., Zwitter, T., Dultzin-Hacyan, D., and Calvani, M. (2001). Searching for the physical drivers of the eigenvector 1 correlation space. ApJ 558, 553–560. doi:10.1086/322286
Mathews, W. G., and Ferland, G. J. (1987). What heats the hot phase in active nuclei? Astrophysical J. 323, 456–467. doi:10.1086/165843
Mathur, S. (2000). Narrow-line Seyfert 1 galaxies and the evolution of galaxies and active galaxies. Mon. Notices R. Astronomical Soc. 314, L17–L20. doi:10.1046/j.1365-8711.2000.03530.x
Matsuoka, Y., Kawara, K., and Oyabu, S. (2008). Low-ionization emission regions in quasars: Gas properties probed with broad O I and Ca II lines. Astrophysical J. 673, 62–68. doi:10.1086/524193
McHardy, I. M., Koerding, E., Knigge, C., Uttley, P., and Fender, R. P. (2006). Active galactic nuclei as scaled-up Galactic black holes. Nature 444, 730–732. doi:10.1038/nature05389
McLure, R. J., and Jarvis, M. J. (2002). Measuring the black hole masses of high-redshift quasars. Mon. Notices R. Astronomical Soc. 337, 109–116. doi:10.1046/j.1365-8711.2002.05871.x
Mineshige, S., Kawaguchi, T., Takeuchi, M., and Hayashida, K. (2000). Slim-disk model for soft X-ray excess and variability of narrow-line Seyfert 1 galaxies. Publ. Astronomical Soc. Jpn. 52, 499–508.
Molina, M., Malizia, A., Bassani, L., Ursini, F., Bazzano, A., and Ubertini, P. (2019). Swift/XRT-NuSTAR spectra of type 1 AGN: Confirming INTEGRAL results on the high-energy cut-off. Mon. Notices R. Astronomical Soc. 484, 2735–2746. doi:10.1093/mnras/stz156
Negrete, A., Dultzin, D., Marziani, P., and Sulentic, J. (2012). BLR physical conditions in extreme population A quasars: A method to estimate central black hole mass at high redshift. Astrophysical J. 757, 62. doi:10.1088/0004-637x/757/1/62
Negrete, C. A., Dultzin, D., Marziani, P., Esparza, D., Sulentic, J. W., del Olmo, A., et al. (2018). Highly accreting quasars: The SDSS low-redshift catalog. Astronomy Astrophysics 620, A118. doi:10.1051/0004-6361/201833285
Negrete, C. A., Dultzin, D., Marziani, P., and Sulentic, J. W. (2014). A photoionization method for estimating BLR “size” in quasars. Adv. Space Res. 54, 1355–1361. doi:10.1016/j.asr.2013.11.037
Netzer, H. (2019). Bolometric correction factors for active galactic nuclei. Mon. Notices R. Astronomical Soc. 488, 5185–5191. doi:10.1093/mnras/stz2016
Netzer, H. (2015). Revisiting the unified model of active galactic nuclei. Annu. Rev. Astronomy Astrophysics 53, 365–408. doi:10.1146/annurev-astro-082214-122302
Ojha, V., Chand, H., Dewangan, G. C., and Rakshit, S. (2020). A comparison of X-ray photon indices among the narrow- and broad-line Seyfert 1 galaxies. Astrophysical J. 896, 95. doi:10.3847/1538-4357/ab94ac
Osterbrock, D. E., and Ferland, G. J. (2006). Astrophysics of gaseous nebulae and active galactic nuclei.
Osterbrock, D. E., and Pogge, R. W. (1985). The spectra of narrow-line Seyfert 1 galaxies. Astrophysical J. 297, 166–176. doi:10.1086/163513
Padovani, P., Alexander, D. M., Assef, R. J., De Marco, B., Giommi, P., Hickox, R. C., et al. (2017). Active galactic nuclei: what’s in a name? Astronomy Astrophysics Rev. 25, 2. doi:10.1007/s00159-017-0102-9
Padovani, P., and Rafanelli, P. (1988). Mass-luminosity relationships and accretion rates for Seyfert 1 galaxies and quasars. Astronomy Astrophysics 205, 53–70.
Panagiotou, C., and Walter, R. (2020). NuSTAR view of Swift/BAT AGN: The R-Γ correlation. Astronomy Astrophysics 640, A31. doi:10.1051/0004-6361/201937390
Pancoast, A., Brewer, B. J., Treu, T., Park, D., Barth, A. J., Bentz, M. C., et al. (2014). Modelling reverberation mapping data - II. Dynamical modelling of the Lick AGN Monitoring Project 2008 data set. Mon. Notices R. Astronomical Soc. 445, 3073–3091. doi:10.1093/mnras/stu1419
Panda, S., Czerny, B., Adhikari, T. P., Hryniewicz, K., Wildy, C., Kuraszkiewicz, J., et al. (2018). Modeling of the quasar main sequence in the optical plane. Astrophysical J. 866, 115. doi:10.3847/1538-4357/aae209
Panda, S., Czerny, B., Done, C., and Kubota, A. (2019a). CLOUDY view of the warm corona. Astrophysical J. 875, 133. doi:10.3847/1538-4357/ab11cb
Panda, S., Czerny, B., and Wildy, C. (2017). The physical driver of the optical eigenvector 1 in quasar main sequence. Front. Astronomy Space Sci. 4, 33. doi:10.3389/fspas.2017.00033
Panda, S., Martínez-Aldama, M. L., and Zajaček, M. (2019b). Current and future applications of Reverberation-mapped quasars in Cosmology. Front. Astronomy Space Sci. 6, 75. doi:10.3389/fspas.2019.00075
Panda, S., Marziani, P., and Czerny, B. (2019c). The quasar main sequence explained by the combination of Eddington ratio, metallicity, and orientation. Astrophysical J. 882, 79. doi:10.3847/1538-4357/ab3292
Panda, S. (2022). Parameterizing the AGN radius–luminosity relation from the eigenvector 1 viewpoint. Front. Astronomy Space Sci. 9, 850409. doi:10.3389/fspas.2022.850409
Panda, S. (2021a). Physical Conditions in the broad-line Regions of active galaxies. Ph.D. Thesis, polish Academy of Sciences. Institute of Physics.
Panda, S. (2021b). The CaFe project: Optical Fe II and near-infrared Ca II triplet emission in active galaxies: Simulated EWs and the co-dependence of cloud size and metal content. Astronomy Astrophysics 650, A154. doi:10.1051/0004-6361/202140393
Pei, L., Barth, A. J., Aldering, G. S., Briley, M. M., Carroll, C. J., Carson, D. J., et al. (2014). Reverberation mapping of the KEPLER field AGN KA1858+4850. Astrophysical J. 795, 38. doi:10.1088/0004-637X/795/1/38
Peterson, B. M. (1988). Emission-line variability in Seyfert galaxies. Publ. Astronomical Soc. Pac. 100, 18. doi:10.1086/132130
Peterson, B. M., Ferrarese, L., Gilbert, K. M., Kaspi, S., Malkan, M. A., Maoz, D., et al. (2004). Central masses and broad-line region sizes of active galactic nuclei. II. A homogeneous analysis of a large reverberation-mapping database. Astrophysical J. 613, 682–699. doi:10.1086/423269
Peterson, B. M. (1993). Reverberation mapping of active galactic nuclei. Publ. Astronomical Soc. Pac. 105, 247. doi:10.1086/133140
Petrucci, P. O., Gronkiewicz, D., Rozanska, A., Belmont, R., Bianchi, S., Czerny, B., et al. (2020). Radiation spectra of warm and optically thick coronae in AGNs. Astronomy Astrophysics 634, A85. doi:10.1051/0004-6361/201937011
Phillips, M. M. (1978). Permitted fe II emission in Seyfert 1 galaxies and QSOs I. Observations. Astrophysical J. Suppl. 38, 187. doi:10.1086/190553
Rakshit, S., Stalin, C. S., and Kotilainen, J. (2020). Spectral properties of quasars from sloan digital sky survey data release 14: The catalog. Astrophysical J. Suppl. 249, 17. doi:10.3847/1538-4365/ab99c5
Ricci, C., Ho, L. C., Fabian, A. C., Trakhtenbrot, B., Koss, M. J., Ueda, Y., et al. (2018). BAT AGN Spectroscopic Survey - XII. The relation between coronal properties of active galactic nuclei and the Eddington ratio. Mon. Notices R. Astronomical Soc. 480, 1819–1830. doi:10.1093/mnras/sty1879
Richards, G. T., Lacy, M., Storrie-Lombardi, L. J., Hall, P. B., Gallagher, S. C., Hines, D. C., et al. (2006). Spectral energy distributions and multiwavelength selection of type 1 quasars. Astrophysical J. Suppl. 166, 470–497. doi:10.1086/506525
Ross, R. R., and Fabian, A. C. (2005). A comprehensive range of X-ray ionized-reflection models. Mon. Notices R. Astronomical Soc. 358, 211–216. doi:10.1111/j.1365-2966.2005.08797.x
Runnoe, J. C., Brotherton, M. S., Shang, Z., Wills, B. J., and DiPompeo, M. A. (2013). The orientation dependence of quasar single-epoch black hole mass scaling relationships. Mon. Notices R. Astronomical Soc. 429, 135–149. doi:10.1093/mnras/sts322
Schmidt, M. (1963). 3C 273: A star-like object with large red-shift. Nature 197, 1040. doi:10.1038/1971040a0
Schmidt, M., and Green, R. F. (1983). Quasar evolution derived from the Palomar bright quasar survey and other complete quasar surveys. Astrophysical J. 269, 352–374. doi:10.1086/161048
Shakura, N. I., and Sunyaev, R. A. (1973). Black holes in binary systems. Observational appearance. Astronomy Astrophysics 24, 337–355.
Shen, Y., Hall, P. B., Horne, K., Zhu, G., McGreer, I., Simm, T., et al. (2019). The sloan digital sky survey reverberation mapping project: Sample characterization. Astrophysical J. Suppl. 241, 34. doi:10.3847/1538-4365/ab074f
Shen, Y., and Ho, L. C. (2014). The diversity of quasars unified by accretion and orientation. Nature 513, 210–213. doi:10.1038/nature13712
Shen, Y., Richards, G. T., Strauss, M. A., Hall, P. B., Schneider, D. P., Snedden, S., et al. (2011). A catalog of quasar properties from sloan digital sky survey data release 7. Astrophysical J. Suppl. 194, 45. doi:10.1088/0067-0049/194/2/45
Shields, G. A. (1978). Thermal continuum from accretion disks in quasars. Nature 272, 706–708. doi:10.1038/272706a0
Sigut, T. A. A., Pradhan, A. K., and Nahar, S. N. (2004). Theoretical Fe I-iii emission-line strengths from active galactic nuclei with broad-line regions. Astrophysical J. 611, 81–92. doi:10.1086/422027
Sigut, T. A. A., and Pradhan, A. K. (2003). Predicted Fe II emission-line strengths from active galactic nuclei. Astrophysical J. Suppl. 145, 15–37. doi:10.1086/345498
Śniegowska, M., Marziani, P., Czerny, B., Panda, S., Martínez-Aldama, M. L., del Olmo, A., et al. (2021). High metal content of highly accreting quasars. Astrophysical J. 910, 115. doi:10.3847/1538-4357/abe1c8
Spergel, D., Gehrels, N., Breckinridge, J., Donahue, M., Dressler, A., Gaudi, B. S., et al. (2013). Wide-field InfraRed survey telescope-astrophysics focused telescope assets WFIRST-AFTA final report. arXiv e-prints , arXiv:1305.5422.
Sulentic, J., and Marziani, P. (2015). Quasars in the 4D eigenvector 1 context: A stroll down memory lane. Front. Astronomy Space Sci. 2, 6. doi:10.3389/fspas.2015.00006
Sulentic, J. W., Bachev, R., Marziani, P., Negrete, C. A., and Dultzin, D. (2007). C IV λ1549 as an eigenvector 1 parameter for active galactic nuclei. Astrophysical J. 666, 757–777. doi:10.1086/519916
Sulentic, J. W., Marziani, P., del Olmo, A., Dultzin, D., Perea, J., and Alenka Negrete, C. (2014). GTC spectra of z ≈ 2.3 quasars: Comparison with local luminosity analogs. Astronomy Astrophysics 570, A96. doi:10.1051/0004-6361/201423975
Sulentic, J. W., Marziani, P., and Dultzin-Hacyan, D. (2000a). Phenomenology of broad emission lines in active galactic nuclei. Annu. Rev. Astronomy Astrophysics 38, 521–571. doi:10.1146/annurev.astro.38.1.521
Sulentic, J. W., Zamfir, S., Marziani, P., and Dultzin, D. (2008). “Our search for an H-R diagram of quasars,” in Revista mexicana de Astronomia y astrofisica conference series. Vol. 32 of revista mexicana de Astronomia y astrofisica conference series, 51–58.
Sulentic, J. W., Zwitter, T., Marziani, P., and Dultzin-Hacyan, D. (2000b). Eigenvector 1: An optimal correlation space for active galactic nuclei. Astrophysical J. Lett. 536, L5–L9. doi:10.1086/312717
Sun, J., and Shen, Y. (2015). Dissecting the quasar main sequence: Insight from host galaxy properties. Astrophysical J. Lett. 804, L15. doi:10.1088/2041-8205/804/1/L15
Takeuchi, S., Ohsuga, K., and Mineshige, S. (2013). Clumpy outflows from supercritical accretion flow. Publ. Astronomical Soc. Jpn. 65, 88. doi:10.1093/pasj/65.4.88
Tortosa, A., Bianchi, S., Marinucci, A., Matt, G., and Petrucci, P. O. (2018). A NuSTAR census of coronal parameters in Seyfert galaxies. Astronomy Astrophysics 614, A37. doi:10.1051/0004-6361/201732382
Trakhtenbrot, B., Ricci, C., Koss, M. J., Schawinski, K., Mushotzky, R., Ueda, Y., et al. (2017). BAT AGN spectroscopic survey (BASS) - VI. The ?x-L/LEdd relation. Mon. Notices R. Astronomical Soc. 470, 800–814. doi:10.1093/mnras/stx1117
Ulrich, M.-H., Maraschi, L., and Urry, C. M. (1997). Variability of active galactic nuclei. Annu. Rev. Astronomy Astrophysics 35, 445–502. doi:10.1146/annurev.astro.35.1.445
Urry, C. M., and Padovani, P. (1995). Unified schemes for radio-loud active galactic nuclei. Publ. Astronomical Soc. Pac. 107, 803. doi:10.1086/133630
Verner, E. M., Verner, D. A., Korista, K. T., Ferguson, J. W., Hamann, F., and Ferland, G. J. (1999). Numerical simulations of Fe II emission spectra. Astrophysical J. Suppl. 120, 101–112. doi:10.1086/313171
Vestergaard, M., and Peterson, B. M. (2006). Determining central black hole masses in distant active galaxies and quasars. II. Improved optical and UV scaling relationships. Astrophysical J. 641, 689–709. doi:10.1086/500572
Vietri, G., Piconcelli, E., Bischetti, M., Duras, F., Martocchia, S., Bongiorno, A., et al. (2018). The WISSH quasars project. IV. Broad line region versus kiloparsec-scale winds. Astronomy Astrophysics 617, A81. doi:10.1051/0004-6361/201732335
Walter, R., and Fink, H. H. (1993). The ultraviolet to soft X-ray bump of Seyfert 1 type active galactic nuclei. Astronomy Astrophysics 274, 105.
Wandel, A., Peterson, B. M., and Malkan, M. A. (1999). Central masses and broad-line region sizes of active galactic nuclei. I. Comparing the photoionization and reverberation techniques. Astrophysical J. 526, 579–591. doi:10.1086/308017
Wang, A., An, T., Cheng, X., Ho, L. C., Kellermann, K. I., Baan, W. A., et al. (2022). VLBI observations of a sample of palomar-green quasars I: Parsec-scale morphology. Mon. Notices R. Astronomical Soc. 518, 39–53. doi:10.1093/mnras/stac3091
Wang, J.-M., Du, P., Hu, C., Netzer, H., Bai, J.-M., Lu, K.-X., et al. (2014a). Supermassive black holes with high accretion rates in active galactic nuclei. II. The most luminous standard candles in the universe. Astrophysical J. 793, 108. doi:10.1088/0004-637X/793/2/108
Wang, J.-M., Du, P., Li, Y.-R., Ho, L. C., Hu, C., and Bai, J.-M. (2014b). A new approach to constrain black hole spins in active galaxies using optical reverberation mapping. Astrophysical J. Lett. 792, L13. doi:10.1088/2041-8205/792/1/L13
Wang, J.-M., Du, P., Valls-Gabaud, D., Hu, C., and Netzer, H. (2013). Super-eddington accreting massive black holes as long-lived cosmological standards. Phys. Rev. Lett. 110, 081301. doi:10.1103/PhysRevLett.110.081301
Wang, J.-M., Qiu, J., Du, P., and Ho, L. C. (2014c). Self-shadowing effects of slim accretion disks in active galactic nuclei: The diverse appearance of the broad-line region. Astrophysical J. 797, 65. doi:10.1088/0004-637X/797/1/65
Watarai, K.-Y., Fukue, J., Takeuchi, M., and Mineshige, S. (2000). Galactic black-hole candidates shining at the Eddington luminosity. Publ. Astronomical Soc. Jpn. 52, 133.
Watson, D., Denney, K. D., Vestergaard, M., and Davis, T. M. (2011). A new cosmological distance measure using active galactic nuclei. Astrophysical J. Lett. 740, L49. doi:10.1088/2041-8205/740/2/L49
Weedman, D. W. (1976). Luminosities of Seyfert galaxies and QSOs. Astrophysical J. 208, 30–36. doi:10.1086/154577
Weedman, D. W. (1977). Seyfert galaxies. Annu. Rev. Astronomy Astrophysics 15, 69–95. doi:10.1146/annurev.aa.15.090177.000441
Wills, B. J., Netzer, H., and Wills, D. (1985). Broad emission features in QSOs and active galactic nuclei. II - new observations and theory of Fe II and H I emission. Astrophysical J. 288, 94–116. doi:10.1086/162767
Yang, G., Boquien, M., Brandt, W. N., Buat, V., Burgarella, D., Ciesla, L., et al. (2022). Fitting AGN/galaxy X-ray-to-radio SEDs with CIGALE and improvement of the code. Astrophysical J. 927, 192. doi:10.3847/1538-4357/ac4971
Zajaček, M., Czerny, B., Martinez-Aldama, M. L., Rałowski, M., Olejak, A., Przyłuski, R., et al. (2021). Time delay of Mg II emission response for the luminous quasar HE 0435-4312: Toward application of the high-accretor radius-luminosity relation in cosmology. Astrophysical J. 912, 10. doi:10.3847/1538-4357/abe9b2
Zappacosta, L., Piconcelli, E., Giustini, M., Vietri, G., Duras, F., Miniutti, G., et al. (2020). The WISSH quasars project. VII. The impact of extreme radiative field in the accretion disc and X-ray corona interplay. Astronomy Astrophysics 635, L5. doi:10.1051/0004-6361/201937292
Zdziarski, A. A., Ghisellini, G., George, I. M., Svensson, R., Fabian, A. C., and Done, C. (1990). Electron-positron pairs, Compton reflection, and the X-ray spectra of active galactic nuclei. Astrophysical J. Lett. 363, L1. doi:10.1086/185851
Keywords: galaxies: active, quasars: emission lines, quasars: supermassive black holes, quasars: accretion, accretion disks, quasars: reverberation mapping, cosmology
Citation: Panda S and Marziani P (2023) High Eddington quasars as discovery tools: current state and challenges. Front. Astron. Space Sci. 10:1130103. doi: 10.3389/fspas.2023.1130103
Received: 22 December 2022; Accepted: 19 April 2023;
Published: 09 May 2023.
Edited by:
Jirong Mao, Chinese Academy of Sciences (CAS), ChinaReviewed by:
Yan-Rong Li, Chinese Academy of Sciences (CAS), ChinaMarcella Longhetti, Brera Astronomical Observatory, Italy
Roberto Serafinelli, Institute for Space Astrophysics and Planetology (INAF), Italy
Copyright © 2023 Panda and Marziani. This is an open-access article distributed under the terms of the Creative Commons Attribution License (CC BY). The use, distribution or reproduction in other forums is permitted, provided the original author(s) and the copyright owner(s) are credited and that the original publication in this journal is cited, in accordance with accepted academic practice. No use, distribution or reproduction is permitted which does not comply with these terms.
*Correspondence: Swayamtrupta Panda, spanda@lna.br
†CNPq Fellow