Optimization Based Modeling for the Food Supply Chain's Resilience to Outbreaks
 Emma Moynihan
 Charalampos Avraam2
  Sauleh Siddiqui
 Roni Neff
- 1Department of Environmental Health and Engineering, Center for a Livable Future, Johns Hopkins University, Baltimore, MD, United States
- 2Center for Urban Science and Progress, New York University, Brooklyn, NY, United States
- 3Departments of Environmental Science and Mathematics & Statistics, American University, Washington, DC, United States
Scant research focuses on the resiliency of food supply chain networks to outbreaks, despite the estimated 600 million global foodborne illnesses annually. Outbreaks that cross country, state and provincial lines are virulent due to the number of people they can affect and difficulty controlling them. Research is needed on food supply chain networks, which are not well-characterized in relation to foodborne illnesses or generally. This paper introduces the United States Food, Energy, and State Transportation (US-FEAST) model and demonstrates its applicability via analysis of a hypothetical demand shock resulting from multistate food contamination. US-FEAST is an optimization-based model across all fifty states with yearly timesteps to 2030. It is a framework integrating food system data from multiple individual data sources. To calibrate, we develop a bilevel optimization routine to generate synthetic, state-level data and provide estimates of otherwise unavailable data at the intersections of the food and transportation systems. The results of US-FEAST elucidate potential heterogenous state-level variations in response, regional changes in food flows, vulnerabilities in the supply chain, and implications for food system resilience. While the generated data and scenarios are not empirical evidence, they provide insights to aid in planning by projecting outcomes and intervention effects. Our results estimate a 23% beef production decrease and 4% price decrease provide a road map toward data needs for quantifying food system resilience to foodborne illness. US-FEAST and its framework may have global utility for studying food safety in national and international food supply chain networks.
Introduction
A resilient food system should be able to provide sufficient accessible, affordable, and acceptable food to the population it serves, with resilience to diverse shocks, including disease outbreaks (Tendall et al., 2015; Chodur et al., 2018). Although interest in food system resilience is growing, particularly since the onset of COVID-19, scant research has evaluated the ways in which foodborne outbreaks and may play out across food supply chain networks and no identified research explores impacts across individual states or provinces (Garnett et al., 2020). Yet, the World Health Organization (WHO) estimates 48 million individuals contract a foodborne illness every year (World Health Organization (WHO), 2015). Limited research has modeled resilience to foodborne outbreaks at a subnational level, despite extensive research establishing the importance of area geographies to a system or community's resilience (Cutter et al., 2010; Zhou et al., 2010). Subnational analysis of the resilience of critical infrastructures and their interdependencies provides a valuable tool to support mitigating the effects of future crises. The preexisting characteristics, demographics, and priorities of an area can influence the experiences of the population and shape infrastructures' ability to respond (Avraam et al., 2021a). While a body of literature retrospectively assesses impacts of specific outbreaks, modeling scenarios of concern can contribute additional insights regarding the potential implications of widespread or severe foodborne outbreaks.
Data limitations hinder empirical research. Comprehensive data on supply chains at the subnational level are limited by proprietary data from private food companies and their supply chains, lack of data collection, and issues of data quality. There are limited data on the food system's essential interactions with other systems, such as the energy and transportation sectors (Ng and Popkin, 2012; Genge et al., 2016). Synthetic data generation can address some of these challenges. Current synthetic data generation modeling efforts tend to work on either national scales or are focused on a limited geographic area (Zhou et al., 2016; Spiegelberg et al., 2017). Few modeled data generation efforts depict entire countries at a subnational level. When comprehensive subnational data are available, the level of detail within and between infrastructures is often limited. For example, modeled food flows of the United States tend to use broad food categories such as “meats, poultry and seafood” and to group these food category flows together to provide more granular geographic data (such as at the country level) (Konar et al., 2018; Lin et al., 2019). In our framework, “synthetic data” refer to state-level data on food production, processing, trade, and consumption which are generated by us through numerical and modeling methods to be consistent with state-level consumer preferences, national food production records, and the profit-maximizing behavior of market agents across food supply chains. We use the term “synthetic data” to distinguish such regionally disaggregated, generated food data from publically available food data records at the national level. Therefore, our research models specific food items' production, trade, and consumption across all fifty states.
The United States Food, Energy, and State Transportation (US-FEAST) model serves as a framework for the integration of food systems data from different data sources and applies mathematical optimization methods to synthesize and generate data, revealing interdependent and essential connections between food, energy, and transportation systems. In this paper, we focus on the food and transportation systems up to 2030. US-FEAST addresses the vulnerabilities that come from partitioned discussion of each system's resilience by creating opportunities to analyze linkages between systems and strengthen society's resilience as a whole. Even though US-FEAST is based on the US, our framework is applicable to other national and international food supply chain networks.
The representation of the broader US food supply chain in US-FEAST requires the harmonization of multiple data sets under the same framework. Demand-side modeling integrates historical household consumption patterns from the “National Health and Nutrition Examination Survey” (Food Commodity Intake Database (WWEIA-FCID), 2022) with food preference data from the International Model for Policy Analysis of Agricultural Commodities and Trade (IMPACT) model, and food waste data from the Food and Agricultural Organization (FAO) and the United States Department of Agriculture. Food supply incorporates data from FAO's Statistical Database (FAOSTAT), the Commodity Costs and Returns database, and the USDA Economic Research Service. Data from the American Transportation Research Institute inform the modeling of food transportation. Finally, we use bilevel optimization to reconcile inconsistencies between databases and generate synthetic data within US-FEAST. The Supplementary Materials includes a detailed description of all individual data sources and the bilevel optimization routine.
While synthetic data generation methods such as those presented in this paper can provide a baseline for current estimates and yield valuable insights to “what if” questions for future scenarios, we should be careful to avoid interpreting these data as empirical evidence toward concrete policy decisions. The generated data are not observable findings but could serve as a guide toward a range of possibilities and potential interventions across different disease scenarios and contexts. The synthetic data generated in this paper also provide a pathway for future research and data collection methods, which could lead to empirical verifications of the ideas presented in this paper.
In this paper, we model potential ramifications of an outbreak of a novel foodborne pathogen we'll refer to as “novel prion disease” (NPD), based loosely on the characteristics of Bovine Spongiform Encephalopathy (BSE) (popularly known as “mad cow disease”). BSE is a fatal, foodborne, neurodegenerative disease found in cattle that is transmissible to humans (CDC, 2018a; CFS, 2019). BSE is thought to be caused by misfolded proteins called prions (CDC, 2018a). Concern first grew from an epidemic of “Mad Cow Disease” in the 1980s in the United Kingdom; the infection spread to cattle in other countries, including the United States (EU, 2017; CFS, 2019). BSE has a six-to-eight-year long incubation period in humans on average and is always fatal (EU, 2017). BSE continues to be found in cattle in the United States as recently as 2018 (CDC, 2018b). Unlike other foodborne pathogens, prions like BSE cannot be controlled through food safety measures such as pasteurization. As of yet, there are no treatment options (Jin et al., 2004; NINDS, 2018).
The objective of this paper is to use modeling to estimate state-level production, retail, consumption, and transportation food flows for all fifty US states under different resilience scenarios by introducing the food and transportation components of the US-FEAST model. For this paper, we hypothesized NPD would shock the food system of all fifty states leading to: (1) decreased retail price of cow meat, (2) changes in interstate food flows, (3) increases in demand for other meat products, including chicken and pork given their cross-price elasticity with beef and 4) ultimately decreased beef production over the long-term. We rely on two limited studies that have relevance for understanding how a severe outbreak mirroring the clinical characteristics of BSE might unfold in the U.S over several years. Taylor et al.'s (2016) work considers how beef demand at the household level might change long-term in the event of a BSE contamination. We also rely on Jin et al. (2004) model of short-term changes in export and demand for beef when BSE is in the food system. Our model assumes the outbreak is confined to the United States, though our framework integrating food, energy and transportation infrastructures is applicable to national and international food supply chain networks. Our framework reveals the dependencies between all states through food trade, thus enabling the study of scenarios causing disparate impacts across states. Although the BSE outbreak scenario assumes a similar effect on all fifty states, trade dependencies lead to varying impacts on food production and flows between states. For example, food production of self-sufficient states is more resilient to variations in demand of neighboring states compared to major food production of states which cover demand from neighboring states. Similarly, changes in food consumption for states relying on imports to cover their demand will significantly affect trade with other states and world regions. International trade complements domestic trade and allows competitive low-cost producers to access additional consumers, even when domestic demand saturates, while consumers can choose between domestic producers and imports for the lowest-cost alternative. A description of our approaches and further assumptions used to inform this scenario are detailed in the Methods section.
Materials and Methods
US-FEAST Overview
The US-FEAST food model uses existing data combined with optimization-based modeling to generate synthetic data to represent and comprehensively model the U.S. food supply chain, consumer food demand, energy, and transportation systems at the state level. The data sources for the US-FEAST food model are publicly available government or agricultural research center datasets. In this paper, the US-FEAST food model covers all fifty states and contains an “international” region to capture international trade. The international region ensures that net US imports and exports of each food product are consistent with state-level production, consumption and trade, i.e., international production supplies net US imports, while net US exports cover international consumption. The US-FEAST food model runs in yearly time steps from 2016 up to 2030. The US-FEAST food model comprises interacting agents across the food supply chain, each maximizing their respective objective. Therefore, the US-FEAST food model can be used to assess economic tradeoffs that arise under a shock or a policy intervention. In this paper, our methodology allows us to assess the tradeoff between a decrease in food production and prices due to consumers' concerns, and cheaper food availability for those that opt to consume.
One of the model's strengths is that it is equipped with a bilevel optimization routine that uses existing data to address data gaps. In section Bilevel Optimization Routine for Synthetic Data Generation we explain how the bilevel optimization routine synthetically generates data within and at the interdependencies of the food and transportation systems where data are unavailable. In addition, US-FEAST can facilitate integration with other energy-economy models.
While the US-FEAST framework is applied to the US in this paper, its generalizability to other countries and regions goes beyond existing national and international food-modeling frameworks to account for interactions across food supply chains. Existing comprehensive food systems models include Aglink-Cosimo used by the Food and Agriculture Organization of the United Nations for the analysis in the yearly OECD-FAO Agricultural Outlooks and The International Model for Policy Analysis of Agricultural Commodities and Trade (IMPACT) of the International Food Policy Research Institute (Organisation for Economic Co-operation and Development Food and Agricultural Association (OCED-FAO), 2015; Robinson et al., 2015). In both models, food producers decide their output by substituting between inputs based on changes in input prices and countries trade individually with a single global market instead of trading bilaterally. Therefore, our framework can inform the introduction of agent-level detail in international food system models. The proposed bilevel optimization routine can generate data on bilateral food trade among countries, which account for interdependencies between food products, to inform international food trade policies beyond international meat supply chains (Avraam et al., 2021b). Even though US-FEAST focuses on the US food system, our framework is applicable to a range of countries, including food security in Ethiopiaand sectors with interacting agents across their supply chains, e.g., fuel markets and electricity markets (Huppmann and Egging, 2014; Brijs et al., 2017; Bakker et al., 2018; Sankaranarayanan et al., 2020). The bilevel data-generation routine can disaggregate data, however its accuracy depends on the inputs available to generate it. Therefore, applying US-FEAST to more countries requires collecting and compiling data on food consumption preferences and national food production of specific food products, as opposed to aggregate production of food categories. In addition, the application needs to account for region-specific policies, e.g., subsidies and taxes on food production and consumption, and is possible for regions and countries with competitive food markets. The US-FEAST framework is directly applicable to international food supply chains as well (Avraam et al., 2021b).
Finally, the US-FEAST food model is set up to study long-run changes in the operation of the food system at the regional level, based on regulatory, supply-side, and/or demand-side interventions. These include, but are not limited to, taxes on production, consumption, and transportation; changes in regional production potential; regional demand patterns; and disruptions in inter-regional trade.
Description of Food Items and Data Sources
Figure 1 presents a schematic of the US-FEAST model's food subcomponent at a high level. Seventeen food staples and selected derivates of those food staples likely to be found in standard American households comprise this list (Table 1). We include food items across all main food groups, including meat, grains, dairy, fruit and vegetables. Foods are categorized as minimally processed, moderately processed, or heavily processed. We also include food products that constitute significant inputs in the production of processed food staples. For instance, soybeans are one of the 17 selected food items, and while Americans do not consume soybeans directly in large quantities, soybean oil is used in a number of commonly consumed heavily processed foods; and soybeans are a key component of animal feed. In the model, each state can trade with its neighboring states to supplement their production or dispense surplus production.
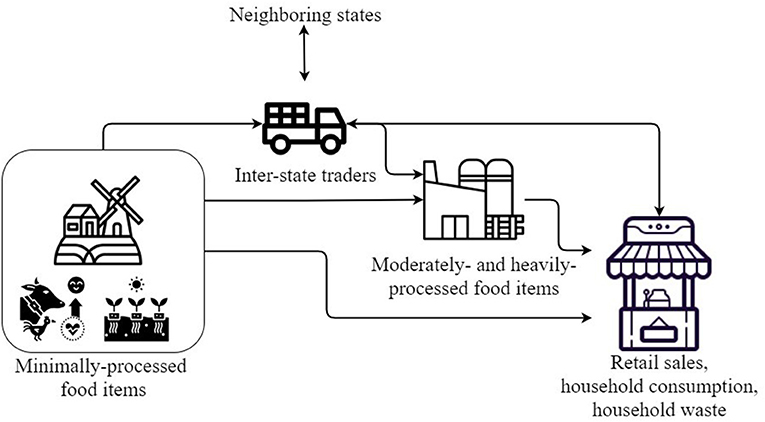
Figure 1. State-level U.S. food supply chain representation in US-FEAST. Interacting agents in the US-FEAST food model are profit maximizers, while consumers decide based on their preferences. We simplify or treat as exogenous additional features across the food supply chains and food system, from production to waste and recycling.
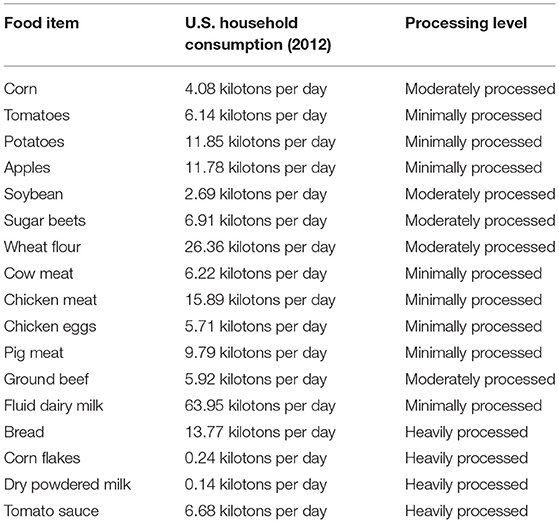
Table 1. US-FEAST food items.
The main data sources for the food system can be found in Table 2. Food consumption for the 17 food items in US-FEAST is derived using data from the Economic Research Service Food Environment Data System (FEDS) of the United States Department of Agriculture. Supplementary Tables S5–S7 in the Supplementary Material detail all data sources for consumer prices, production cost, and state-level production. We either aggregate or perform computations to estimate state-level production, consumption, and food loss and waste across the United States up to 2030.
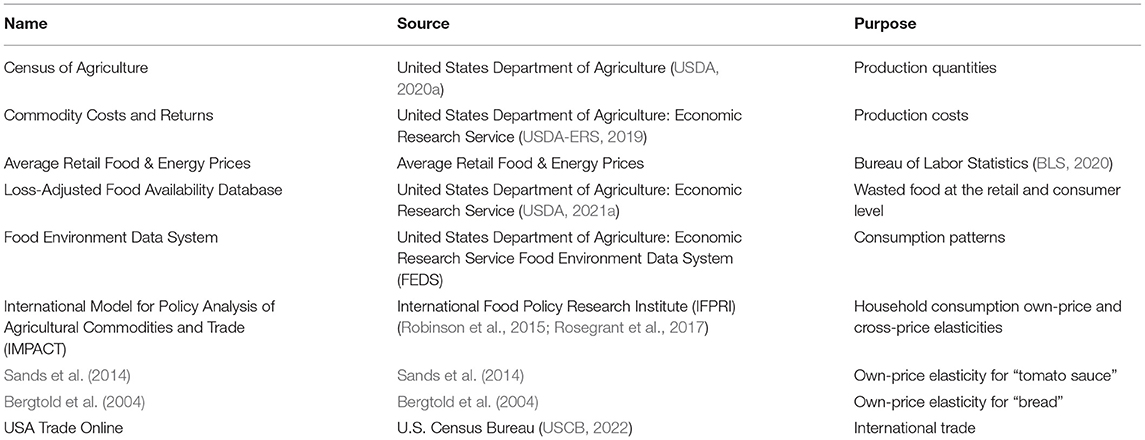
Table 2. Main data sources for US-FEAST food component.
US-FEAST uses the own-price and cross-price elasticities of the International Model for Policy Analysis of Agricultural Commodities and Trade (IMPACT) of the International Food Policy Research Institute (IFPRI) (Robinson et al., 2015; Rosegrant et al., 2017). When an item is not included in any of IMPACT's food categories, we use the own-price elasticity of “other food products” from USDA's Economic Research Report Number 174 (Sands et al., 2014). Supplementary Table S8 in the Supplementary Material shows the source of the own-price and cross price elasticity of every food product in US-FEAST.
US-FEAST Methods
The US-FEAST food model is rooted in a series of assumptions that enable groups of market participants at all levels of the supply chain to be modeled as profit maximizers (Avraam et al., 2021b). We provide a detailed description of all US-FEAST sets, variables and parameters in Supplementary Tables S1–S3, respectively, of the Supplementary Material. Here, each “market participant” should be thought of as a state-level aggregation of market activities. For example, for each product, a representative producer in each state decides the aggregate, state-level production of that product. Food producers decide on optimal production based on current and future profitability, as shown in Equation (1),
We denote by the level of production, while is the state-level wholesale price, and is the marginal cost of production of processed food item f ∈ F, in state r ∈ R, in year t ∈ T. We denote by F the set of all food products, R the set of all states, and T the set of all years. For minimally processed food items, the marginal cost depends on the level of production, while for moderately and heavily processed food items, the marginal cost depends also on intermediate inputs such as natural gas, electricity, and other production factors. In both cases, the marginal cost of production is an increasing function of the level of production. Food traders maximize their profit by exploiting price differences between states, as shown in Equation (2),
We denote by and the wholesale price for traders and retailers in the origin state r and destination state rr. The transportation cost between states rr and r is , and is the quantity of livestock product f ∈ F, traded from state rr ∈ R to state r ∈ R, in year t ∈ T. International traders decide on imports and exports to and from a state based on the same rationale. Equation (2) grasps that traders will decide to trade only when the retail price at the destination state rr is sufficient to compensate for the cost of purchasing a product at a neighboring state r and the cost of transportation. Households decide on their consumption of each food product based on comparative prices; households can substitute consumption between different food items, as shown in Equation (3),
where C(f) is the set of food items that can substitute product f, ϵf, f, t is the own-price elasticity of the consumption of food item f, ϵf, ff, t is the elasticity of substitution between food item f and any other food item ff ∈ C(f). Moreover, is the level of consumption, is the baseline consumption, is the retail price, is the baseline retail price of food product f ∈ F, in state r ∈ R, in year t ∈ T.
Total consumption of livestock product f in each state r and year t comprises household consumption, household waste, and demand for food product f as input for the production of processed food items ff. Equations (4) and (5) describe the demand for product f from the processing sector and total state-level consumption respectively,
We denote by the sum of the demand for product f ∈ F by all processing sites that produce moderately- and heavily-processed food products ff ∈ F, in region r ∈ R in year t ∈ T. We assume that is the proportion of household consumption that is wasted and so the term is the total quantity of food product f that is purchased by consumers in state r, in year t. Hence, is the total quantity of food product f that is required in region r and in year t for all purposes, i.e., household consumption, household waste, and as intermediate input for the production of heavily processed food items. Moreover, O(f) is the set of all food products that require f as an input, iof, ff, r, t is the value share of food product f which is used in the production of the processed food item ff ∈ F, in region r, in year t.
The wholesale prices in each state are such that the state-level balance for each food product f and for every year t is met
We denote by and the international imports and exports of food product f in region to and from r, in year t, and by N(r) the set of all states rr that are neighbors of state r. The retail price accounts for state-level taxes and subsidies
We denote by the percentage markup to the wholesale price of food product f, in region r, in year t.
The optimization problems of the individual agents, coupled with the technological and market clearing constraints, are solved jointly to compute a Nash Equilibrium (NE) of the market. US-FEAST is formulated as a Mixed Complementarity Problem and is implemented in the General Algebraic Modeling System (GAMS). Section Mathematical Formulation of the US-Feast Food Model of the Supplementary Materials provides a detailed treatment of the model formulation and derivation of US-FEAST equations.
Bilevel Optimization Routine for Synthetic Data Generation
US-FEAST uses bilevel optimization to generate state-level data inputs that are either unavailable or cannot be derived through aggregation or computation using the existing data. The bilevel optimization routine computes feasible state-level flows and adjusts the production and transportation cost parameters in Equations (1) and (2) to ensure that the balance of the physical quantities in Equations (3)–(6). The routine comprises two stages. At the first stage, a bilevel program computes equilibrium state-level flows, and equilibrium marginal costs, wholesale prices, and retail prices, for given baseline production and consumption, up to 2030. At the second stage, we compute the parameters of the marginal cost functions of all producers and traders in the US-FEAST food model. We provide a complete description of the data generation methods in section Calibration Routine of the Supplementary Materials.
Figure 2 shows one example result of our bilevel data generation routine. Data on inter-state trade of specific food products are often proprietary and unavailable for research. For example, the US Freight Analysis Framework provides data on commodity food flows between geographic areas, but the information is not specified to individual food products (FAF, 2017). The bilevel data generation routine is able to estimate feasible inter-state trade patterns based on the trade balance of a food product in a state, i.e., the difference between state-level production and consumption, and the relative production cost differences between states. All generated data are publicly available on the National Hazards Engineering Research Infrastructure's (NHERI) Design Safe-CI website (Avraam et al., 2019).
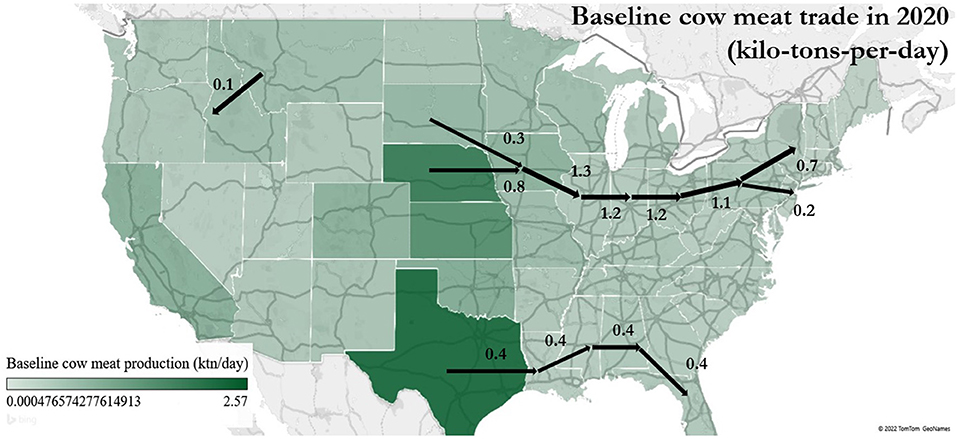
Figure 2. Generated data: baseline cow meat trade between selected states in 2020 in kilo-tons-per-day. Baseline cow meat production varies regionally. Food trade in the US-FEAST food model is driven by the state-level mismatch between production and total consumption, and the difference of wholesale prices between states.
NPD Scenario Assumptions
We simulate a nationwide and state level response to a demand shock and an international export ban in the modeled U.S. food system over the course of 10 years (2020–2030) caused by a novel prion disease (NPD) similar in fatality and latency to BSE. In this section we detail the assumptions that inform our scenario and provide justifications for these assumptions. We envision NPD results from a random mutation in a wildlife mammal, such as is currently occurring in the epidemic of chronic wasting disease among deer and elk in North America (Osterholm et al., 2019). Certain prions, such as those that cause chronic wasting disease, are highly transmittable agents, transferring easily from species to species (Gough and Maddison, 2010; Osterholm et al., 2019). Presumably through interactions within the environment such as via contaminated urine or feces from infected animals, the novel disease has been transmitted from wildlife to farmed cows in the U.S. In this scenario imported beef remains safe.
Due to the long latency between transmission and disease manifestation, we assume the disease is not detected in cows for several years. This leads to widespread dissemination across farms in the United States and into the U.S. food supply chain. As such, we assume the disease becomes a multistate outbreak with no centralized location. We envision the first suspected case in humans will lead to an initial culling of cows because currently, the only way to test for prion diseases in animals is by taking a brain biopsy post-mortem (FDA, 2020). However, blood tests to detect prion diseases in humans have recently been developed (Concha-Marambio et al., 2020). Based on the numbers of slaughtered cows in the United Kingdom during the 1990's “Mad Cow Disease” outbreak, we assume that there will be an initial culling of several million cattle. The response would call for emergent development of a non-invasive test that will minimize beef shortages (Lee et al., 2013). This non-invasive test would make it possible for the government to avoid recalling the entire beef supply. Over the course of the 2020s, we envision this non-invasive test being used to fully remove BSE from the cattle supply.
Beef cattle husbandry in the United States varies regionally. Much of the cattle produced in the United States occurs in Texas and the Great Plains, though cattle production is also common in the West and Midwest (USDA, 2015). As of July 2020, there are roughly 100 million cattle in the United States (USDA, 2020b). While cattle generally start on pasture; 99% of U.S. cattle are finished in feedlots (Hayek and Garrett, 2018). It takes 8–12 years for the growth and shrinkage of cattle herds (USDA, 2021b). Cattle feed consists mainly of forage, including hay and grass, and is commonly supplemented with corn or soybean derived products and additives (USDA, 2004; McAllister et al., 2020). Feed can contribute up to half of all production costs associated with raising cattle (USDA, 2004). The USDA projects 27 billion pounds of beef will be produced in the United States in 2020 (USDA, 2020c). Beef processing plants are most concentrated in Texas, the Great Plains, California and the Midwest (BLS, 2020). Four beef producer firms are responsible for upwards of 80% of the beef produced in the United States (Drouillard, 2018). From January to December 2020 the United States additionally imported nearly 900 million pounds of beef from other countries, mainly from Australia and New Zealand (USDA, 2020d). Depending on the cut, beef in the United States typically costs between $2.43 (ground beef 70–79% lean) to $11 (tenderloin) per pound (USDA, 2020e).
For this study, we presume there will be initial concern among the public that NPD might also occur among poultry and swine. However, there have been no documented cases of BSE in poultry (Moore et al., 2011). There have also been no documented naturally occurring cases of prion disease transmitting to swine due to species barrier. Cases of prion disease transmitting are reported only in experimental and controlled settings (Greenlee et al., 2016). As such, we assume swine will also quickly be confirmed to be immune and that the impact of this prion disease on poultry and swine sales will be minimal. Therefore, in this scenario we only reduce consumer demand for beef as shown in Table 3.
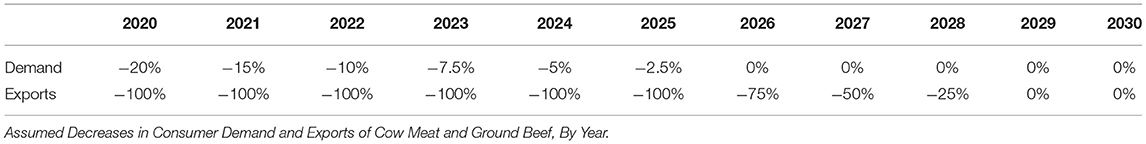
Table 3. Scenario assumptions.
Based on Taylor et al. (2016), we assume that the discovery of NPD-positive meat cases will result in a decrease in household consumption of ground beef and cow meat. The severity, non-detectability, and latency of the NPD outbreak could drive reduced purchases of any cow meat or ground beef product. However, Taylor et al. (2016) found that in the BSE outbreaks in the late 20th and 21st century consumers continued to purchase meat, despite potential concerns. For that, following on Jin et al.'s (2004) assumptions, which are based on the United Kingdom and Japan's historical reactions to BSE, we assume that the initial shock causes a 20% decrease in household consumption. Due to cultural differences between other countries and the United States the actual demand decrease could vary. Assuming information is unavailable regarding the geographic location in which contamination happens, the model simulates a decrease in consumer demand and net international exports of cow meat and ground beef between 2020 and 2030 across all fifty states. As the situation is gradually resolved, household consumption and exports gradually rebound to their baseline levels by 2030. Table 3 lists the decreases in yearly time steps. Banning exports under a scenario of reduced demand can decrease the revenues of producers relying on exports compared to baseline revenues and can create a surplus of low-cost supply for the domestic market. Table 4 shows beef imports and exports amounts for the top-ten beef importing and exporting states at baseline (2012) according to US Census Bureau data (USDA, 2020a). Table 5 shows net exports in US-FEAST for the top-ten exporting states of beef to the rest of the world in 2012, 2020, and 2030.
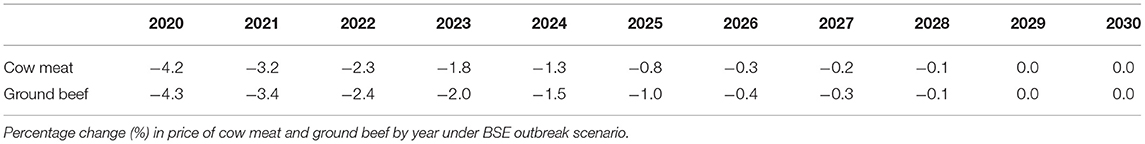
Table 4. Scenario results.
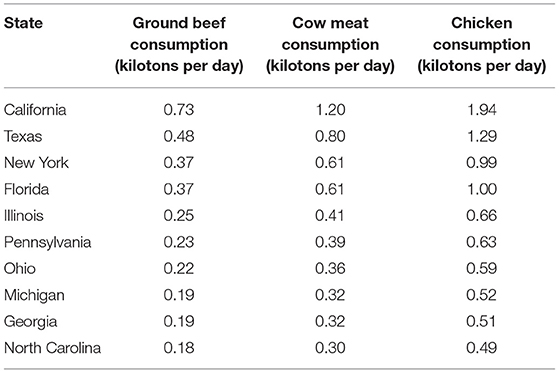
Table 5. Top 10 states with cow meat, ground beef, and chicken consumption (2012).
We also rely on Jin et al.'s (2004) assumptions of changes in beef exports, which are rooted in many countries fully banning all beef imports from affected countries (Jin et al., 2004). The model assumes all countries ban importing U.S. beef in this scenario. Table 3 lists the changes to exports by year. The scenario assumes the prion disease is only found in the United States and that imported beef is not feared by U.S. consumers.
There is a dearth of detailed data regarding changes to the price elasticities of food items during a foodborne outbreak. In the absence of data on changes in demand as a response to prices, we assume prices for cow meat and ground beef are inelastic. One of the few sources on this topic, Peng et al. (2004), determined the price elasticities of cow meat and other meat products during a historical BSE outbreak in Canada to be inelastic. We consulted other work on the price elasticities of meat products but only found estimates that were not specific to BSE outbreaks (Regmi and Seale, 2010; Okrent and Alston, 2012; Sands et al., 2014). Based on estimates from the International Food Policy Research Institute (IFPRI), we assumed the cross price-elasticities between beef and chicken and beef and pork to be close to 0.03 (Robinson et al., 2015; Rosegrant et al., 2017). Following IFPRI's data, the cross-price elasticities in our model are relatively small compared to the own-price elasticities of a food product. As noted above, the model assumes that a portion of the population will still not completely forgo buying cow meat or ground beef considering the risk. The US-FEAST food model assumes consumers, on aggregate, pick the cheaper option when choosing between consuming domestically raised vs. imported meat, although in reality consumers could opt to consume more imported cow meat and ground beef based on trust of food supply.
Results
This section describes the main findings of the modeled disease outbreak using US-FEAST from 2020 to 2030. In the scenario, we decrease state-level consumption [parameter in Equation (3)] and fix international exports [variable in Equation (2) when the destination node r is the “rest of world” region] of cow meat and ground beef according to Table 3 compared to their baseline values. Under the new conditions, US-FEAST computes the response of producers, traders, and consumers for all food products and in all states. National-level findings are detailed first, followed by state-level results.
National Results
We begin by demonstrating how the initial reduction in household consumption and international exports (modeled based on historical data) affect national production and retail prices of cow meat and ground beef (Table 4). Baseline consumption of cow meat, ground beef and chicken can be found in Table 5. When household consumption is assumed to fall by 20% in 2020, U.S. production of cow meat is estimated to decrease by 23% and ground beef by 24% (Table 6). The modeled consumer price of retail cow meat and ground beef decreases by ~4% in 2020, the scenario's first year. In this scenario, national production of cow meat and ground beef decreases, which in turn results in a decrease in the marginal cost of production. Subsequently, national and state-level wholesale and retail prices of cow meat and ground beef decrease too. The NPD impact on pricing fades over time in our model, following the assumed gradual increase in household consumption based on prior real-world scenarios. The estimated decrease in price is ~1% compared to the baseline price, barring other secular changes, for both cow meat and ground beef in 2025, 5 years removed from the outbreak.
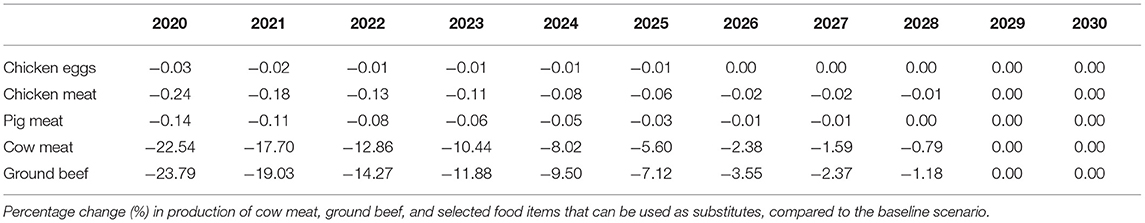
Table 6. Scenario results.
The decrease in domestic consumption in this scenario implies that there is available low-cost cow meat that can be allocated to the international market. However, in this scenario we assume that the international market responds to the outbreak in the U.S. by banning imports from the U.S. in the short-term and gradually lifting the ban in the medium term. The impact of the ban on domestic cow meat and ground beef producers is likely to affect producers, however in the baseline scenario net exports of the U.S. comprise <1% of cow meat production and <5% of ground beef production.
The small cross-price elasticities in the demand function of household consumers in Equation (3) implies that demand of other food items in our model is relatively unaffected. Subsequently, production and retail prices of other food items are largely insensitive to this scenario as well. These changes in consumption were not found to differ geographically or over time in this scenario. Figure 3 shows the percent change in the production of chicken eggs, chicken meat, and pig meat, i.e., items that consumers can substitute for ground beef and cow meat in this model. Likewise, we can reasonably assume the price of corn and soybean used in cow feed were not impacted, as they could be diverted to feed chicken and pig. We can see that food products chicken eggs, chicken meat, and pig meat are marginally impacted. The primary reason is the small cross-price elasticity established in the scenario. A secondary reason is that in the scenario households decide on their consumption by comparing the prices of the different food products. State-level wholesale and retail prices of cow meat and ground beef decrease in this scenario. Therefore, by Equation (3), in this scenario consumers do not have the economic incentive to switch part of their consumption for cow meat and ground beef to other food products.
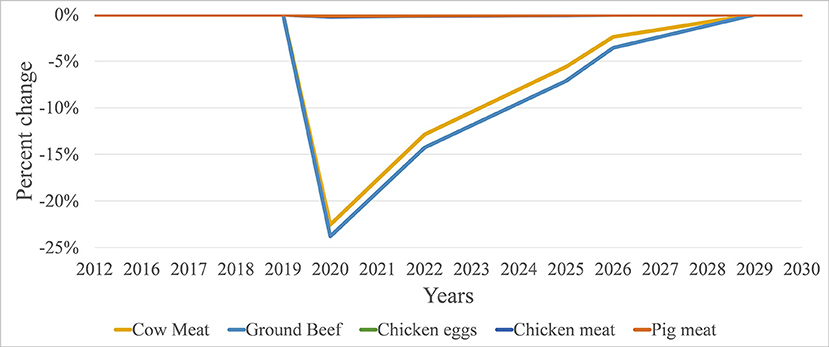
Figure 3. US-FEAST national change in production, compared to the baseline scenario, of cow meat, ground beef, and selected animal protein items.
State-Level Results
Although the modeled reduction in household consumption is uniform across states in this scenario, the response of each state's production can vary, depending on its production profile, and the response of neighboring states and inter-state traders. The generation of synthetic food flows for the baseline scenario of the US-FEAST food model allows us to incorporate the behavior of inter-state traders and thus assess the dependence between production decisions of neighboring states. Specifically, the data-generation routine in section Bilevel Optimization Routine for Synthetic Data Generation revealed the dependence of states close to the Atlantic on food production in South Dakota, Nebraska, Iowa, Illinois, Indiana, and Ohio. Given the scale of the results, it will be useful to discuss the implications of food trade either at the state or at the regional level. Figure 4 shows the Census regions and divisions of the U.S.
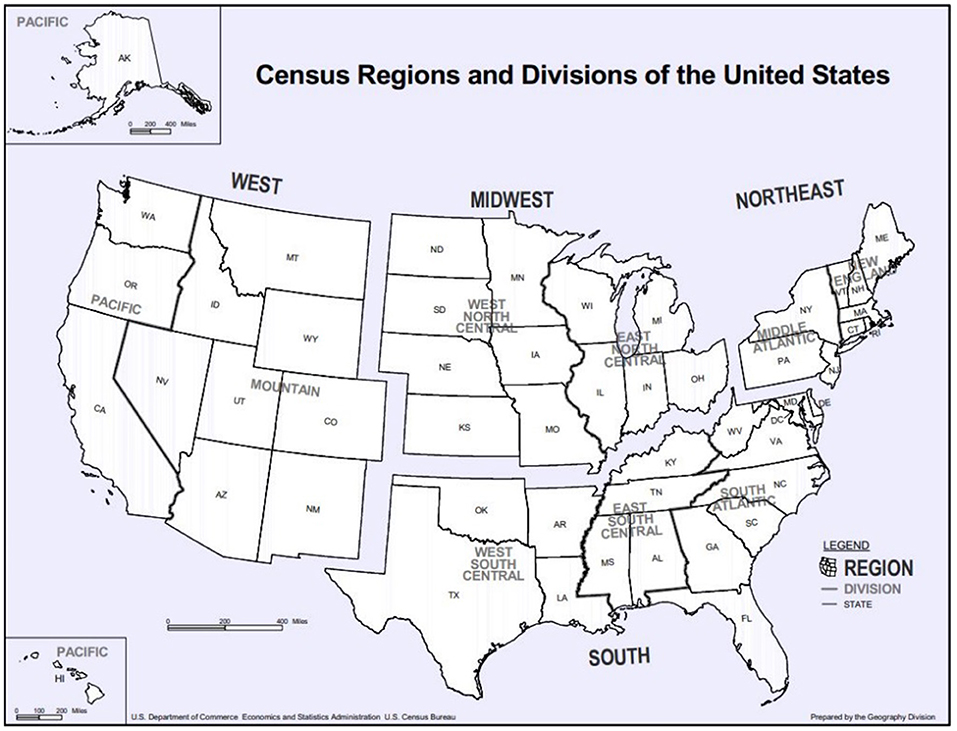
Figure 4. U.S. Census Regions and Divisions of the U.S. Retrieved from U.S. Census Bureau, (2021). A written description is available in Kachan et al. (2014).
We assume NPD to be widespread in cattle produced across the nation. As described in the Methods section, inter-state trade depends on each state's supply capabilities, state-level demand, and trader's profit. State-level production of cow meat decreases between 20 and 25% from the baseline scenario, with some of the largest changes observed in the southern and western states, despite the fact the model homogenously decreased demand across the United States. Potential reasons for this will be covered in the Discussion section. In Figure 5 the modeled intertemporal state-level percentage change in cow meat production is plotted for the states with the maximum, minimum, and median state-level production changes. As one example, Texas, the country's largest beef producer, decreases its production by 24% in this model. In absolute tonnage, Texan beef production decreases by 0.6 kilotons per day. Changes in cow meat production are regionally homogeneous and do not vary depending on whether a state is a large or small producer of beef in the baseline scenario. The top five state producers of beef decrease production on average by 25% in 2020, while the five smallest decrease production by 21%. Figure 6 shows the top five and bottom five states with the largest and smallest percent decrease in cow meat production. The top four states with the largest percent decrease in the U.S. are in the South.
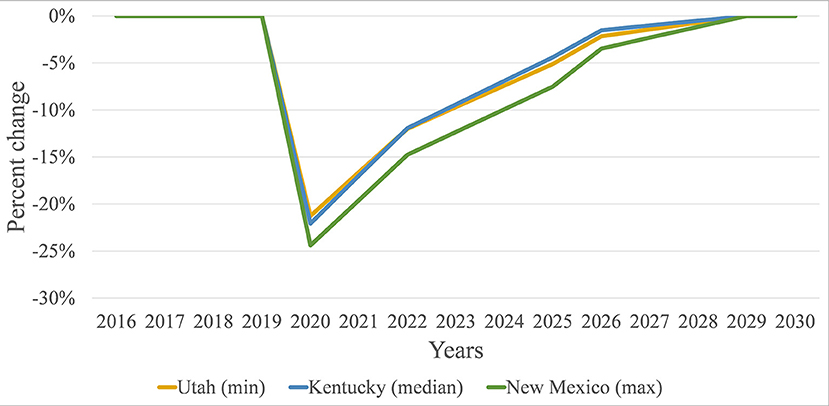
Figure 5. US-FEAST state-level cow meat production changes in the BSE outbreak scenario compared to the baseline scenario.
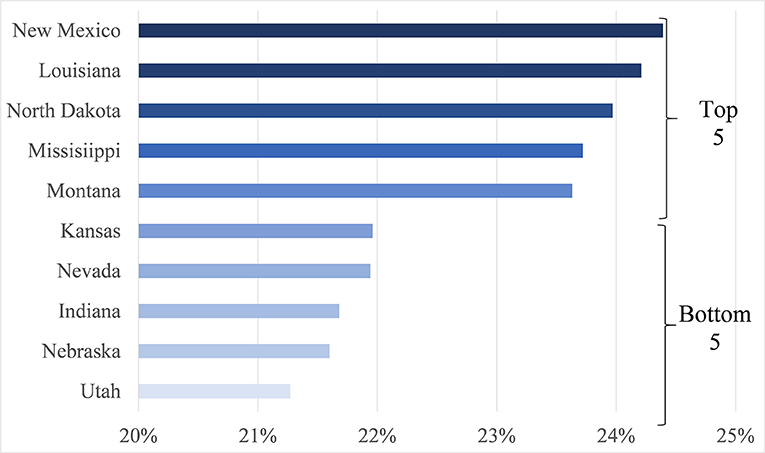
Figure 6. Percent decrease in cow meat production compared to baseline production for the top five and bottom five states in 2020.
The retail price of cow meat in this scenario is estimated to decrease between 4.1 and 4.7% across the United States in 2020. Figure 7 depicts the maximum, minimum, and median percentage change in cow meat retail prices. Figure 8 shows the top five and bottom five states with the largest and smallest percent decrease in cow meat production. Similarly, to cow meat production, the top four states with the largest percent decrease in the U.S. are Texas, New Mexico, and Louisiana, in the South; and North Dakota, and Montana in the North. The price of cow meat changes the least in Utah, Nevada, and the northeast. The change in state-level retail prices is geographically homogeneous. The bottom five states face a 4% decrease in retail prices, while the top five states experience a 4.6% decrease in retail prices. Potential reasons for these results will be elaborated in the Discussion section.
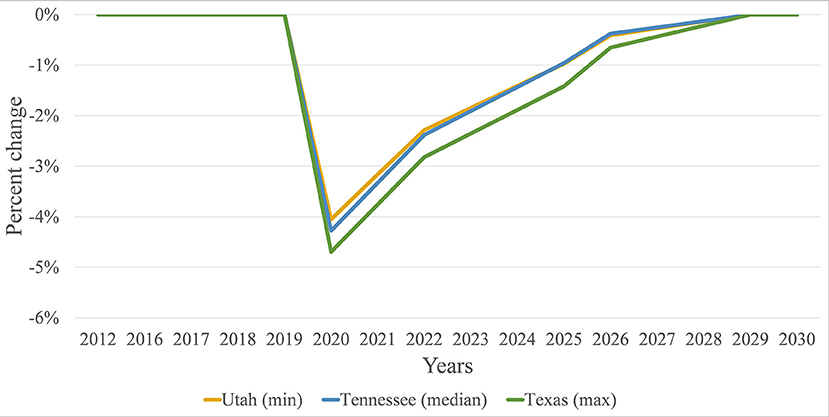
Figure 7. US-FEAST state-level cow meat retail price changes in the BSE outbreak scenario compared to the baseline scenario.
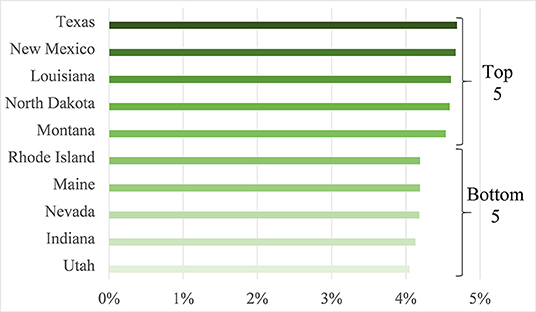
Figure 8. Percent decrease in cow meat production compared to baseline production for the top five and bottom five states in 2020.
Changes to the flow of cow meat in US-FEAST within the United States (Figure 9) are significantly altered in this scenario, reflecting the model's assumption that trade happens based on proximity and wholesale price differences. The largest percent changes in flow occur between the Midwest to the northeast, with the greatest percent reduction in flows occurring from Missouri to Kentucky. While Texas is among the states whose production is affected the most in this scenario, the change in flow of cow meat in and out of Texas is smaller than the change in trade observed between the northeast central region of the U.S. and the middle Atlantic region.
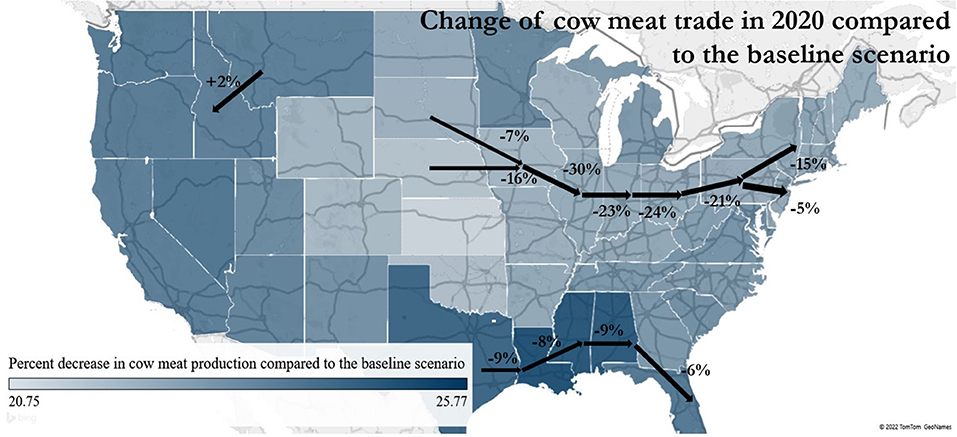
Figure 9. Decrease in cow meat trade in 2020 compared to the baseline scenario, between selected states. The change in trade between states can range and need not be the same as the change in state-level production or consumption.
Following the national-level trend, we do not find state-level variations in household consumption of other food items, which remain relatively unaffected in the outbreak. The result is driven by the small elasticity of substitution between the food items represented in US-FEAST and based on the assumptions of this scenario. We did not observe changes in consumption of other food products by state or over time in this scenario.
Discussion
This paper demonstrates how resilience to foodborne outbreaks can be examined through optimization-based modeling. Optimization models are mathematical models that select the best option from a series of alternatives to reach a desired objective. They are often stated as minimizing an objective function with respect to constraints. In this paper, we use a collection of optimization models that represent state-level production, processing, distribution, consumption, and waste, formulated as a single complementarity problem (Facchinei and Pang, 2007). Our primary interest is in assessing what may happen to a food system after a demand shock due to widespread food animal infection. The COVID-19 pandemic illustrates the pervasive effects demand shocks can have on the food system. Rapid changes in consumer demand in response to fears about the pandemic led to food shortages of some items as well a decrease in value of many staple items, thereby harming producers as well as consumers (Elleby et al., 2020); over time, these factors interacted with other supply chain influences to create even more significant disruptions.
Overall, the simulated impacts of the NPD outbreak scenario show that over 5 years, U.S. cow meat production and ground beef production could decline by nearly 25% initially, with limited price impacts, particularly on non-ground beef products. Our model's decrease in cattle production resembles the 30% decline in cattle production the United Kingdom observed from 1995 to 1996 during the height of its BSE epidemic (FAO, 2022). US-FEAST's cow meat and ground beef production recover gradually, following the assumed recovery of household consumption and what was observed during the United Kingdom's recovery (FAO, 2022). The NPD outbreak scenario caused a shock in household consumption, where the percent decrease was uniform among states. Yet, US-FEAST results find considerable state variation in potential impacts. The estimated results suggest states in the northeast would experience some of the greatest changes in flow of cow meat into their states, while the South experiences some of the greatest changes in production and retail price of cow meat under a prion disease outbreak. We will revisit the reasons behind these results in section Interpretation of Model Results.
Disease Justification
We chose BSE as a starting point for several reasons. First, we wanted to model impacts of a disease with high severity, which might have clearer impacts on consumer behavior than one causing less worry. Second, BSE has a long incubation period, which can make it hard to detect quickly, leading to medium- and long-term disruptions in the food system. Third, the long incubation period allows for the potential that meat could be traded and processed before disease is identified, which can have cascading impact on the food system. Our scenario is based on a novel prion disease with similar features, and which is also transmitted via beef consumption. While systems exist that will likely detect BSE itself prior to widespread dissemination, a novel pathogen may not be detected.
Potential responses to a future prion disease outbreak, like BSE, are likely to create diverse food supply chain effects. For example, consumer fears about contracting NPD disease may affect beef demand, which in turn affects related supply chains and prices for feed and for substitute food products, with subsequent demand ramifications. Effects could vary geographically and across time, depending on supply chain locations and consumer preferences.
Our work is not an epidemiological model and there are no attempts to approximate disease burden; rather, the NPD context is provided because it undergirds the demand shock we simulate. We rely on two limited studies that have relevance for understanding how a severe outbreak mirroring the clinical characteristics of BSE might unfold in the U.S over several years. Taylor et al.'s (2016) work evaluated the long-term impacts of BSE on the quantity of household beef purchasing in the United States, and as such we used this work to model change in beef demand over time. Jin et al. (2004) made modeling assumptions about changes in export and consumer demand for beef in the United States in the short-term, based on what occurred in other countries. We rely on Jin et al.'s (2004) work to model changes to international trade and initial shocks to consumer demand. By relying on Jin et al. (2004), our results assume the United States food system reacts similarly to other countries with observed prion disease outbreaks. In actuality, cultural differences could lead to varied demand and trade responses.
Interpretation of Model Results
While the hypothetical NPD outbreak scenario is just one example of how a prion disease outbreak could occur, the modeling here can provide useful insights into how other foodborne diseases or supply chain disruptions could affect food supply and prices, even if the particulars differ. For instance, had an optimization-based model for the UK's food system been available during its BSE epidemic, predicting declines in production and price could have been used to better address policies to protect the agricultural sector (United Kingdom Parliament, 1998). At the same time, it is important to attend to key factors which could affect the generalizability of findings, including food prices, price elasticities, food flows, food substitutions, lack of detailed interactions with the rest of the world, and other aspects of the food system context such as cattle production cycles.
Food Prices
In this scenario, we find that wholesale and retail prices in the west-south central region decrease the most compared to the baseline scenario. It should be noted that these results reflect the assumed 20% initial drop in demand and may not reflect the reality should such an event occur in reality. This is a consequence of the regional impact of the outbreak and the underlying cost assumptions in our model. Specifically, in the Methods section and in the Supplementary Materials we describe our assumed marginal cost functions that are increasing in the level of production. Production in Texas and the South decreases due to the decline in household consumption in the same and neighboring regions that depend on food production of Texas and its neighboring states in the baseline scenario. In addition, the west-south central region experiences the largest decrease in cow meat consumption, in absolute value. Hence, the large change in cow meat prices in that region compared to other regions is the result of the combination of the cost function assumption and the large decrease in total purchases in west-south central. While individual-level actions are always difficult to predict, at an aggregate level, consumption activities can be assumed to have consistent characteristics that can be represented in models such as ours (Evenson and Gollin, 2003; Sankaranarayanan et al., 2020). Our model reveals the tradeoff between a decrease in demand because of consumers' concerns, and the availability of cheaper meat for those that choose to consume it. The decreased price (4.1–4.7%) of beef in our modeled data is similar to the 5.8% price reduction seen at the height of the United Kingdom's BSE epidemic (Office for National Statistics, 2022).
The large fluctuations in wholesale prices in Texas could impact local welfare. Our results estimate the South experiences some of the largest changes to price of cow meat, despite not being particularly higher consumers of beef compared to the rest of the country (Lusk, 2017). In the absence of fiscal and financial countermeasures from the respective states, the outbreak is likely to force many producers out of the market and significantly decrease the income of those who are competitive enough. If, in addition, the outbreak is the only major shock in the economy, then the impact to the food sector is likely to propagate to other sectors due to their interdependencies and the decrease in overall consumption can affect the national economy. Emergency response strategies would then have to contain the impact. However, the macro-economic effects of an outbreak are out of the scope of this paper.
Price Elasticities
Own-price and cross-price elasticities capture how consumers adjust their consumption of a product based on changes in the price of the same and other products. The price elasticities used in the US-FEAST model do not account for the level of anxiety and mistrust felt by consumers in the wake of a prion disease outbreak. It is possible the public will not have a fully inelastic response to the NPD as is modeled here. Research demonstrates that perceptions of risk and “willingness to accept” risk often change due to a disruption and these changes can depend on socioeconomic and demographic factors. The extent to which a person perceives risk can influence their price elasticity. Generally, the higher a person's income level, the more likely they are to perceive the world as a safe place, in part because they are able to pay more to feel safe (Dossman et al., 2001; Hammitt and Haninger, 2007; Haninger and Hammitt, 2011). Persons of high income are on average less likely to respond to changes in the retail price of a food item (Lusk and Tonsor, 2016). Additionally, persons of color and women tend to be more risk averse regarding foodborne outbreaks than the general population (Dossman et al., 2001; Hammitt and Haninger, 2007).
Due to limited data, we apply the same own-price and cross-price elasticity to all states in the U.S. However, own-price and cross-price elasticities could vary by region. Unfortunately, state-level price elasticity estimates for diverse population groups are scarce. Our choice to reflect the inelastic demand observed post-BSE outbreak in Canada (Peng et al., 2004) affects the model's observed retail price fluctuations. Trying to understand the response of food systems supply chains across all these dimensions in the event of a foodborne outbreak calls for more detailed estimates of own-price and cross price elasticities.
Food Flows
In the baseline scenario, US-FEAST's data generation routine reveals the dependence of the north-east central region upon the middle Atlantic. In the presence of an outbreak, US-FEAST's results indicate changes in the flow of cow meat. While the model's supply chains are stylized, the identified spatial variation in impacts supports the observation that geographic factors can play a critical role in foodborne outbreaks and resilience. The percent changes in flows between states along the north-west central to middle Atlantic route are the largest, which is a consequence of the revealed strong dependence of these regions on cow meat production in the north-west central region. Hence, traders along this route are the most vulnerable to a prion disease outbreak. U.S. FEAST bases food flows on supply and demand. In other words, the flow between two states is a function that optimizes economic profitability and consumer demand being met. In actuality, food does not always go to the nearest state. The flow of food through the United States is often circuitous and dependent on a multitude of factors.
Substitution
Our model assumes that households substitute between food items by comparing their respective prices. In this model, household consumers decide their consumption of a food product based primarily on the price of the product (although we recognize that in reality many other factors are important in product substitution, such as taste preferences, and even political ideology). This behavior is grasped by the own-price elasticities in Equation (3). For given price differences, the level of substitution between food items is driven by the cross-price elasticity of substitution between the two items in Equation (3). The substitution grasps consumers' willingness to shift their consumption from one food product to another, based on the relative prices of the two products. In our model, the cross-price elasticities are relatively small compared to the own-price elasticities of a food product. This characteristic of our inputs implies that one meat sector is only marginally affected by changes in another meat sector. Moreover, the consumers' economic rationale would imply that, under regular conditions, the consumption of chicken and pork would decrease if the price of cow meat and ground beef decreased ceteris paribus. However, the decrease in cow meat consumption in our scenario does not come as a result of a trend in the food market, but rather as a shock that forces consumers to adjust their diet. The adjustment of cow meat and ground beef production leads to a decrease in cow meat and ground beef prices under the prion outbreak. For that, when the representative consumers in our model compare the prices of different meat products in order to decide their consumption during the outbreak, they do not decide to shift their consumption to other meat products. First, due to the small cross-price elasticity of substitution and second, due to the competitiveness of cow meat and ground beef compared to other meat products. Ultimately, the results may indicate that substitution of chicken or pork for cow meat in certain populations is more complicated than what is suggested by a standard economic model of household meat consumption. Similar to food prices, the food substitutions modeled in U.S. FEAST do not consider the level of mistrust or anxiety the public might have in any type of meat or animal product, nor geographic variation in how these factors play out with taste preferences and price sensitivity. Further, mistrust and anxieties may transfer to other animal products, and may persist across time, even when products are deemed safe by government authorities.
International Impacts
The countries most likely to be impacted by a NPD outbreak in the United States are those that import the most American beef; Japan, South Korea, Mexico, and Canada [(U.S. Meat Export Federation (USMEF), 2022)]. In the absence of available American beef, these countries would likely need to increase their imports from other countries as increasing their own cattle production for consumption would take years. Due to decreased supply and increased demand, the price of beef could increase not only in countries that import significant amounts of American beef, but also in countries that now must compete with those countries for beef supplies; substitution effects could similarly cause global reverberations for other food products. LMICs and net-importing countries could feel this shortage most acutely, with less available funds to purchase more expensive products. Anxiety and mistrust of beef could also affect purchasing patterns internationally even though the outbreak is confined to the United States. Ultimately, international reactions are likely to vary due to dietary preferences, societal norms, the wealth of a nation, and food system connectivity. For instance, the European Union banned British beef 3 years following the BSE epidemic (with restrictions remaining in place until 2006), while the United States only began allowing British beef in 2020 (EU, 2006; BBC, 2020).
Further Research
This is the first published analysis using the US-FEAST food model. Results from the simulated outbreak estimate significant changes to the food and state transportation systems under this scenario, but further research is warranted to evaluate the validity of model's findings. First, the food flows in our model are based on optimization techniques, as noted above. A future iteration of the model could validate these flows with empirical observations of food flows. As more trade data become available, and for more individual food products, our baseline food flows could also be validated using aggregate databases, e.g., with the US Freight Analysis Framework (FAF, 2017). Additional iterations of this scenario in US-FEAST could assess how robust our results are to the specific ways in which the scenario is defined. For instance, the initial scenario did not localize the contamination, but future scenarios could situate the outbreak in varying regions, and assess how the resilience of the food supply chain is impacted based on point of origin. We chose to model a novel prion disease because of its long incubation period in order to accommodate US-FEAST's yearly time intervals. Future research using different models could also look into the effects of an outbreak in shorter time intervals, namely weeks or months to fully assess impact on the food system and its related infrastructures. This model currently interacts with a general “international region.” With additional data collection and generation, future iterations could consider interactions between the United States' critical infrastructures and those of other specific countries. Alternatively, these methods could be adapted to build a FEAST-like model in other country settings, provided sufficient data are available. Finally, this work identifies research needs to further improve understanding of consumer behavior in the case of long-incubation and high-anxiety foodborne illness outbreaks, to gain additional trade data, and to apply and iterate the model in other ways.
Model Strengths and Limitations
To the best of the authors' knowledge, this is the first paper to model U.S. state-level flows of specific food items in the aftermath of a foodborne outbreak. US-FEAST's ability to model specific food items across all fifty states, and to conduct comparative analysis up to 2030, are unique contributions to the food supply chain and food system resilience literature. Researching the implications of disease outbreaks on the food supply chain at large is urgent because, as COVID-19 and the Russian invasion of Ukraine have demonstrated, emerging and unanticipated conditions can cause global supply chain crises, with severe implications for food security and jobs (Dunn et al., 2020; Guan et al., 2020; Niles et al., 2021). Prior work has only been able to aggregate food commodities broadly, such as live animals or vegetables, through limited sources such as the U.S. Census Bureau's Commodity Flow Survey, or to downscale larger data from empirical results on freight analysis (Lin et al., 2019). Although not part of this analysis discussed in this paper, a further strength of the US-FEAST model is that it is set up to be able to interpret how changes in one critical infrastructure, such as the transportation sector, interacts with another critical infrastructure, like the food system. The complementarity modeling framework, unique to US-FEAST in the study of food systems, is amenable to modeling across infrastructures (Ferris and Pang, 1997; Huppmann and Egging, 2014; Abrell and Weigt, 2016). Understanding these connections is vital because these infrastructures cannot work in isolation and the interdependencies drive the food system's ability to function.
There are multiple limitations with this model and scenario. The synthetic data are only as reliable as the underlying data and economic theory, which tend to be difficult to generalize in the food system. Needed data are often unavailable. The decisions by US-FEAST food model agents optimize resources at the most competitive price between the closest geographic locations possible, yet in reality, food system relationships are complex, including private supply chains and concentrations of power and resources. Only limited data underlie the assumptions related to price elasticity following a disease outbreak, imports and exports, food system trust, and geographic variation in cultural and other related factors are based on limited data. Another limitation is that US-FEAST only models 17 food items, so it is not known how other food items and their cross-price elasticities excluded would influence results. US-FEAST also lacks data on production. Our model does not account for the length of time it takes to grow and contract a cattle herd (8–12 years) nor does it include a lag for the growth of cattle to slaughter weight (USDA, 2021b,c). This may impact the length of time it takes the food system to recover from a shock, and the demand for animal feed during that period. Another limitation is that data sources did not always include multiple time points, making model calibration challenging. Additionally, due to lack of data, our model does not simulate individual countries' interactions with the United States, at a national or subnational level. We aggregate trade with the rest of the world into one international region. Finally, due to the years included in the model's data, the scenario involves an outbreak that would have already happened, in 2020; the model's construction across time does not account for long term impacts on the food system from COVID-19, the crisis in Ukraine or other factors.
Conclusion
We quantitatively evaluated the long-term effects of NPD across the U.S. The results of our model suggest a beef demand shock in the United States may cause varied ramifications across the United States depending on a state's geography, baseline production and consumption characteristics, demographics, and relation to other neighboring states. These impacts would have global ramifications. Ultimately, the results suggest the considerable influence geography plays on the food system's reaction to a serious foodborne outbreak and shows how a single outbreak could reverberate with lasting effects across the food system for many years. We suggest improving global public health/one health funding and infrastructure for monitoring and responding to food safety and animal health threats as well for research to address them.
Data Availability Statement
The datasets presented in this study can be found in online repositories. The names of the repository/repositories and accession number(s) can be found at: https://www.designsafe-ci.org/data/browser/public/designsafe.storage.published/PRJ-2511.
Author Contributions
EM collected all data used to derive model parameters and implement the scenario. EM and CA performed data aggregations, other computations to estimate the parameters of the mode, analysis of the results, and drafted the manuscript. CA and SS designed the bilevel data-generation routine. CA coded the bilevel data-generation routine and US-FEAST in the General Algebraic Modeling System (GAMS). EM and RN designed the scenario and CA implemented the scenario in GAMS. EM, CA, SS, and RN edited the manuscript. RN and SS supervised all research activities related to this project. All authors contributed to the article and approved the submitted version.
Funding
This work was funded by NSF Grant #1745375 (EAGER: SSDIM: Generating Synthetic Data on Interdependent Food, Energy, and Transportation Networks via Stochastic, Bi-level Optimization).
Conflict of Interest
The authors declare that the research was conducted in the absence of any commercial or financial relationships that could be construed as a potential conflict of interest.
Publisher's Note
All claims expressed in this article are solely those of the authors and do not necessarily represent those of their affiliated organizations, or those of the publisher, the editors and the reviewers. Any product that may be evaluated in this article, or claim that may be made by its manufacturer, is not guaranteed or endorsed by the publisher.
Acknowledgments
We extend our gratitude to Naomi Meiselman, Carson Drew, and Andrez Melendez for their efforts assisting in the model development.
Supplementary Material
The Supplementary Material for this article can be found online at: https://www.frontiersin.org/articles/10.3389/fsufs.2022.887819/full#supplementary-material
References
Abrell, J., and Weigt, H. (2016). Investments in a combined energy network model: substitution between natural gas and electricity? Energy J. 37, 63–86. doi: 10.5547/01956574.37.4.jabr
Avraam, C., Lambrou, S., Jiang, W., and Siddiqui, S. (2021b). Antimicrobial resistance and livestock trade for low- and middle-income countries: regional analysis of global coordination policies. Front. Sustain. Food Syst. 5, 650315. doi: 10.3389/fsufs.2021.650315
Avraam, C., Moynihan, E., Neff, R., and Siddiqui, S. (2019). EAGER: SSDIM: Generating Synthetic Data on Interdependent Food, Energy, and Transportation Networks via Stochastic, Bi-level Optimization. West Lafayette, IN: DesignSafe-CI. doi: 10.17603/ds2-y5k1-yx25
Avraam, C., Zhang, Y., Sankaranarayanan, S., Zaitchik, B., Moynihan, E., Juturu, P., et al. (2021a). Optimization-based systems modeling for the food-energy-water nexus. Curr. Sustain. Renew. Energy Rep. 8, 4–16. doi: 10.1007/s40518-020-00161-5
Bakker, C., Zaitchik, B. F., Siddiqui, S., Hobbs, B. F., Broaddus, E., Neff, R. A., et al. (2018). Shocks, seasonality, and disaggregation: modelling food security through the integration of agricultural, transportation, and economic systems. Agric. Syst. 164, 165–184. doi: 10.1016/j.agsy.2018.04.005
BBC (2020). UK Beef Exports to US Resume After More Than 20 Years. British Broadcasting Service. Available online at: https://www.bbc.com/news/business-54347426 (accessed May 28, 2022).
Bergtold, J., Akobundu, E., and Peterson, E. B. (2004). The FAST method: estimating unconditional demand elasticities for processed foods in the presence of fixed effects. J. Agric. Resource Econ. 29, 276–295. Available online at: http://www.jstor.org/stable/40987220
BLS (2020). Quarterly Census of Employment and Wages (QCEW). Bureau of Labor Statistics. Data from second quarter 2020, all private ownership – NAICS 31161 Animal, except poultry, slaughtering; NAICS 311612 Meat processed from carcasses, NAICS 311613 Rendering and meat byproduct processing. Available online at: https://data.bls.gov/cew/apps/data_views/data_views.htm#tab=Tables (accessed December 6, 2020).
Brijs, T., van Stiphout, A., Siddiqui, S., and Belmans, R. (2017). Evaluating the role of electricity storage by considering short-term operation in long-term planning. Sustain. Energy Grids Netw. 10, 104–117. doi: 10.1016/j.segan.2017.04.002
CDC (2018a). About BSE. Bovine Spongiform Encephalopathy (BSE), or Mad Cow Disease. Technical Report. Atlanta, GA: Centers for Disease Control and Prevention; U.S. Department of Health and Human Services. Available online at: https://www.cdc.gov/prions/bse/about.html (accessed July 15, 2019).
CDC (2018b). BSE Cases Identified in the United States. Bovine Spongiform Encephalopathy (BSE), or Mad Cow Disease. Technical Report. Atlanta, GA: Centers for Disease Control and Prevention; U.S. Department of Health and Human Services. Available online at: https://www.cdc.gov/prions/bse/case-us.html (accessed July 15, 2019).
CFS (2019). Timeline of Mad Cow Disease Outbreaks. Center for Food Safety. Available online at: https://www.centerforfoodsafety.org/issues/1040/mad-cow-disease/timeline-mad-cow-disease-outbreaks (accessed July 15, 2019).
Chodur, G. M., Zhao, X., Biehl, E., Mitrani-Reiser, J., and Neff, R. (2018). Assessing food system vulnerabilities: a fault tree modeling approach. BMC Public Health 18, 817. doi: 10.1186/s12889-018-5563-x
Concha-Marambio, L., Pritzkow, S., Moda, F., Tagliavani, F., Ironside, J. W., and Soto, C. (2020). Detection of prions in blood from patients with variant Creutzfeldt-Jakob disease. Sci. Transl. Med. 8, 370ra183. doi: 10.1126/scitranslmed.aaf6188
Cutter, S. L., Burton, C. G., and Emrich, C. T. (2010). Disaster resilience indicators for benchmarking baseline conditions. J. Homeland Secur. Emerg. Manage. 7, 51. doi: 10.2202/1547-7355.1732
Dossman, D. M., Adamowicz, W. L., and Hrudey, S. E. (2001). Sociodemographic determinants of health and food-safety related risk perceptions. Risk Anal. 21, 307–318. doi: 10.1111/0272-4332.212113
Drouillard, J. S.. (2018). Current situation and future trends for beef production in the United States of America - a review. Asian Austral. J. Animal Sci. 31, 1007–1016. doi: 10.5713/ajas.18.0428
Dunn, C. G., Kenney, E., Fleischhacker, S. E., and Bleich, S. N. (2020). Feeding low-income children during the COVID-19 pandemic. N. Engl. J. Med. 382, e40. doi: 10.1056/NEJMp2005638
Elleby, C., Domínguez, I. P., Adenauer, M., and Genovese, G. (2020). Impacts of the COVID-19 pandemic on the global agricultural markets. Environ. Resource Econ. 76, 1067–1079. doi: 10.1007/s10640-020-00473-6
EU (2006). BSE: UK Beef Embargo to Be Lifted. European Union: European Commission. Available online at: https://ec.europa.eu/commission/presscorner/detail/en/IP_06_278 (accessed May 28, 2022).
EU (2017). Facts About Variant Creutzfeldt-Jakob Disease. European Union: European Centre for Disease Prevention and Control. Available online at: https://ecdc.europa.eu/en/vcjd/facts (accessed July 15, 2019).
Evenson, R. E., and Gollin, D. (2003). Assessing the impact of the Green Revolution, 1960 to 2000. Science 300, 758–762. doi: 10.1126/science.1078710
Facchinei, F., and Pang, J. S. (2007). Finite-Dimensional Variational Inequalities and Complementarity Problems. New York, NY: Springer Science & Business Media.
FAF (2017). Freight Analysis Framework Version 5. Bureau of Transportation Statistics; Office of the Assistant Secretary for Research and Technology and Federal Highway Administration U.S. Department of Transportation. Available online at: https://faf.ornl.gov/faf5/dtt_total.aspx
FAO (2022). Crops and Livestock Products. FAOSTAT; Food and Agricultural Organization of the United Nations. Available online at: https://www.fao.org/faostat/en/#data/QCL
FDA (2020). All About BSE (Mad Cow Disease). United States Food and Drug Administration. Available online at: https://www.fda.gov/animal-veterinary/animal-health-literacy/all-about-bse-mad-cow-disease#:~:text=Currently%2C%20there%20is%20no%20reliable,abnormal%20prion%20in%20the%20brain (accessed November 28, 2020).
Ferris, M. C., and Pang, J. S. (1997). Engineering and economic applications of complementarity problems. Siam Rev. 39, 669–713. doi: 10.1137/S0036144595285963
Garnett, P., Doherty, B., and Heron, T. (2020). Vulnerability of the United Kingdom's food supply chains exposed by COVID-19. Nat. Food 1, 315–318. doi: 10.1038/s43016-020-0097-7
Genge, B., Kiss, I., Haller, P., and Siaterlis, C. (2016). “Generating high quality data for the protection of modern critical infrastructures,” in Digital Forensic and Security (ISDFS), 2016 4th International Symposium (Little Rock, AK), 53–58. doi: 10.1109/ISDFS.2016.7473517
Gough, K. C., and Maddison, B. C. (2010). Prion transmission: prion excretion and occurrence in the environment. Prion 4, 275–282. doi: 10.4161/pri.4.4.13678
Greenlee, J. J., Kunkle, R. A., Smith, J. D., and Greenless, M. H. W. (2016). Scrapie in swine: a diagnostic challenge. Food Safety 4, 110–114. doi: 10.14252/foodsafetyfscj.2016019
Guan, D., Wang, D., Hallegatte, S., Davis, S. J., Huo, J., Li, S., et al. (2020). Global supply-chain effects of COVID-19 control measures. Nat. Human Behav. 4, 577–587. doi: 10.1038/s41562-020-0896-8
Hammitt, J. K., and Haninger, K. (2007). Willingness to pay for food safety: sensitivity to duration and severity of illness. Am. J. Agric. Econ. 89, 1170–1175. doi: 10.1111/j.1467-8276.2007.01079.x
Haninger, K., and Hammitt, J. K. (2011). Diminishing willingness to pay per quality-adjusted life year: valuing acute foodborne illness. Risk Anal. 31, 1363–1380. doi: 10.1111/j.1539-6924.2011.01617.x
Hayek, M. N., and Garrett, R. D. (2018). Nationwide shift to grass-fed beef requires larger cattle population. Environ. Res. Lett. 13, 084005. doi: 10.1088/1748-9326/aad401
Huppmann, D., and Egging, R. (2014). Market power, fuel substitution and infrastructure - A large-scale equilibrium model of global energy markets. Energy 75, 483–500. doi: 10.1016/j.energy.2014.08.004
Jin, H. J., Skripnitchenko, A., and Koo, W. W. (2004). The Effects of the BSE Outbreak in the United States on the Beef and Cattle Industry. Technical Report. Fargo, ND: Center for Agricultural Policy and Trade Studies; North Dakota State University. Available online at: https://ageconsearch.umn.edu/bitstream/23072/1/sr030004.pdf (accessed December 27, 2019).
Kachan, D., Tannenbaum, S. L., Olano, H. A., LeBlanc, W. G., McClure, L. A., and Lee, D. J. (2014). Geographical variation in health-related quality of life among older US adults, 1997-2010. Prev. Chronic Dis. 11, 140023. doi: 10.5888/pcd11.140023
Konar, M., Lin, X., Ruddell, B., and Sivapalan, M. (2018). Scaling properties of food flow networks. PLoS ONE 13, e0199498. doi: 10.1371/journal.pone.0199498
Lee, J., Kim, S. Y., Hwang, K. J., Ju, Y. R., and Woo, H. (2013). Prion diseases as transmissible zoonotic diseases. Osong Public Health Res. Perspect. 4, 57–66. doi: 10.1016/j.phrp.2012.12.008
Lin, X., Ruess, P. J., Marston, L., and Konar, M. (2019). Food flows between counties in the United States. Environ. Res. Lett. 14, 084011. doi: 10.1088/1748-9326/ab29ae
Lusk, J.. (2017). Where Do People Eat the Most Meat? Available online at: http://jaysonlusk.com/blog/2017/2/1/where-do-people-eat-the-most-meat (accessed April 12, 2021).
Lusk, J. L., and Tonsor, G. T. (2016). How meat demand elasticities vary with price, income, and product category. Appl. Econ. Perspect. Policy 38, 673–711. doi: 10.1093/aepp/ppv050
McAllister, T. A., Stanford, K., Chaves, A. V., Evans, P. R., Eustaquio de Souza Figueredo, E., and Ribiero, G. (2020). “Chapter 5: nutrition, feeding and management of beef cattle in intensive and extensive production systems,” in Animal Agriculture, eds F. W. Bazer, C. Lamb, and G. Wu (Cambridge, MA: Academic Press), 75–98.
Moore, J., Hawkins, S. A., Austin, A. R., Konold, T., Green, R. B., Blamire, I. W., et al. (2011). Studies of the transmissibility of the agent of bovine spongiform encephalopathy to the domestic chicken. BMC Res. Notes 17, 501. doi: 10.1186/1756-0500-4-501
Ng, S. W., and Popkin, B. M. (2012). Monitoring foods and nutrients sold and consumed in the United States: dynamics and challenges. J. Acad. Nutr. Dietetics 112, 41–45.e4. doi: 10.1016/j.jada.2011.09.015
Niles, M. T., Beavers, A. W., Clay, L. A., Dougan, M. M., Pignotti, G. A., and Rogus, S. (2021). A multi-site analysis of the prevalence of food security in the United States, before and during the COVID-19 pandemic. Curr. Dev. Nutr. 2021, nzab135. doi: 10.1093/cdn/nzab135
NINDS (2018). National Institute of Neurological Disorders and Stroke. Creutzfeldt-Jakob Disease Fact Sheet. NIH Publication No. 18-NS-2760. Available online at: https://www.ninds.nih.gov/Disorders/Patient-Caregiver-Education/Fact-Sheets/Creutzfeldt-Jakob-Disease-Fact-Sheet#6 (accessed May 17, 2020).
Office for National Statistics (2022). RPI: Percentage Change Over 12 Months - Beef . Consumer price inflation time series (MM23). Available online at: https://www.ons.gov.uk/economy/inflationandpriceindices/timeseries/cdik/mm23 (accessed May 28, 2022).
Okrent, A. M., and Alston, J. M. (2012). The Demand for Disaggregated Food-Away-From-Home and Food-at-Home Products in the United States. ERR-139, U.S. Department of Agriculture, Economic Research Service. Available online at: https://www.ers.usda.gov/webdocs/publications/45003/30438_err139.pdf?v=8279.2
Organisation for Economic Co-operation Development Food Agricultural Association (OCED-FAO) (2015). Aglink-Cosimo Model Documentation. A Partial Equilibrium Model of World Agricultural Markets. Paris: Organisation for Economic Co-operation and Development and Food and Agriculture Organization of the United Nations (OECD-FAO). Available online at: https://www.agri-outlook.org/documents/Aglink-Cosimo-model-documentation-2015.pdf (accessed April 25, 2022).
Osterholm, M. T., Anderson, C. J., Zabel, M. D., Scheftel, J. M., Moore, K. A., and Appleby, B. S. (2019). Chronic wasting disease in cervids: implications for prion transmission to humans and other animal species. mBio 10, e01091–e01019. doi: 10.1128/mBio.01091-19
Peng, Y., McCann-Hiltz, D., and Goddard, E. (2004). Consumer Demand for Meat in Alberta, Canada: Impact of BSE. American Agricultural Economics Association Annual Meeting. Denver, CO.
Regmi, A., and Seale, J. L. Jr. (2010). Cross-Price Elasticities of Demand Across 114 Countries. TB-1925. Washington, DC: U.S. Department of Agriculture, Economic Research Service.
Robinson, S., Mason-D'Croz, D., Islam, S., Sulser, T. B., Robertson, R. D., Zhu, T., et al. (2015). The International Model for Policy Analysis of Agricultural Commodities and Trade (IMPACT): Model Description for Version 3. IFPRI Discussion Paper 1483. Washington, DC: International Food Policy Research Institute. Available online at: http://ebrary.ifpri.org/cdm/ref/collection/p15738coll2/id/129825. doi: 10.2139/ssrn.2741234
Rosegrant, M. W., Sulser, T. B., Mason-D'Croz, D., Cenacchi, N., Nin-Pratt, A., Dunston, S., et al. (2017). Quantitative Foresight Modeling to Inform the CGIAR Research Portfolio. Project Report for USAID. Washington, DC: International Food Policy Research Institute. Available online at: http://ebrary.ifpri.org/cdm/ref/collection/p15738coll2/id/131144
Sands, R., Jones, C., and Marshall, E. P. (2014). Global Drivers of Agricultural Demand and Supply. Economic Research Report 186137. Washington, DC: United States Department of Agriculture, Economic Research Service.
Sankaranarayanan, S., Zhang, Y., Carney, J., Nigussie, Y., Esayas, B., Simane, B., et al. (2020). What are the domestic and regional impacts from ethiopia's policy on the export ban of teff? Front. Sustain. Food Syst. 4, 4. doi: 10.3389/fsufs.2020.00004
Spiegelberg, M., Baltazar, D. E., Sarigumba, M. P. E., Orencio, P. M., Hoshino, S., Hashimoto, S., et al. (2017). Unfolding livelihood aspects of the Water-Energy-Food Nexus in the Dampalit Watershed, Philippines. J. Hydrol. Regional Stud. 11, 53–68. doi: 10.1016/j.ejrh.2015.10.009
Taylor, M., Klaiber, H. A., and Kuchler, F. (2016). Changes in U.S. consumer response to food safety recalls in the shadow of a BSE scare. Food Policy 62, 56–64. doi: 10.1016/j.foodpol.2016.04.005
Tendall, D., Joerin, J., Kopainsky, B., Edwards, P., Shreck, A., Le, Q. B., et al. (2015). Food system resilience: defining the concept. Global Food Secur. 6, 17–23. doi: 10.1016/j.gfs.2015.08.001
U.S. Meat Export Federation (USMEF) (2022). Export Statistics. Available online at: https://www.usmef.org/news-statistics/statistics/ (accessed April 16, 2022).
United Kingdom Parliament (1998). Agriculture - Third Report: The UK Beef Industry. Agriculture Committee Reports. House of Commons. Session 1997-1998. Available online at: https://publications.parliament.uk/pa/cm199798/cmselect/cmagric/474iii/ag0302.htm (accessed May 28, 2022).
USCB (2022). USA Trade Online. Available online at: https://usatrade.census.gov/ (accessed May 29, 2022).
USDA (2004). Livestock Nutrition: Feeding Cows. Illinois Grazing Manual Fact Sheet. Natural Resources Conservation Service; United States Department of Agriculture. Available online at: https://www.nrcs.usda.gov/wps/cmis_proxy/;https/ecm.nrcs.usda.gov%3A443/fncmis/resources/WEBP/ContentStream/idd_70009C69-0000-C94B-9D29-A18E9879DE11/0/ILGM-LIVESTOCKNUTRITION_Feeding-Cows.pdf (accessed December, 6, 2020).
USDA (2015). 2012 Census of Agriculture. Cattle Industry Highlights. National Agricultural Statistics Services. United States Department of Agriculture. https://www.nass.usda.gov/Publications/Highlights/2015/Cattle_Highlights.pdf
USDA (2020a). 2017 Census of Agriculture. National Agricultural Statistics Servicesl United States Department of Agriculture. Available online at: https://www.nass.usda.gov/AgCensus/ (accessed November 28, 2020).
USDA (2020b). Cattle Inventory. National Agricultural Statistics Services; United Starts Department of Agriculture. Available online at: https://www.nass.usda.gov/Newsroom/2020/07-24-2020.php (accessed December 6, 2020).
USDA (2020c). Livestock, Dairy, and Poultry Outlook. Situation and Outlook Report LDP-M-317. United States Department of Agriculture, Economic Research Service. Available online at: https://www.ers.usda.gov/webdocs/outlooks/99857/ldp-m-317.pdf?v=5307.8 (accessed December 6, 2020).
USDA (2020d). Livestock and Meat International Trade Data. United States Department of Agriculture, Economic Research Service. Available online at: https://www.ers.usda.gov/data-products/livestock-and-meat-international-trade-data/livestock-and-meat-international-trade-data/#Beef%20(fresh),%20chilled,%20and%20frozen:%20Year-to-date%20imports%20under%20various%20trade%20agreements (accessed December 6, 2020).
USDA (2020e). National Retail Report - Beef. Advertised Prices for Beef at Major Retail Supermarket Outlets Ending During the Period of 12/04 thru 12/10. United States Department of Agriculture. Available online at: https://www.ams.usda.gov/mnreports/lswbfrtl.pdf (accessed December 6, 2020).
USDA (2021a). Food Availability (Per Capita) Data System. United States Department of Agriculture, Economic Research Service. Available online at: https://www.ers.usda.gov/data-products/food-availability-per-capita-data-system/
USDA (2021b). Cattle and Beef: Sector at a Glance. United States Department of Agriculture, Economic Research Service. Available online at: https://www.ers.usda.gov/topics/animal-products/cattle-beef/sector-at-a-glance/ (accessed December 6, 2021).
USDA (2021c). Slaughter Cattle: Grades and Standards. Available online at: https://www.ams.usda.gov/grades-standards/slaughter-cattle-grades-and-standards (accessed December 6, 2021).
USDA-ERS (2019). Commodity Costs and Returns. United States. Department of Agriculture, Economic Research Service. Available online at: https://www.ers.usda.gov/data-products/commodity-costs-and-returns/
What We Eat in America – Food Commodity Intake Database (WWEIA-FCID). (2022). Food Commodity Intake Database 2005–2010. United States Environmental Protection Agency. Available online at: https://fcid.foodrisk.org/# (accessed June 26, 2022).
World Health Organization (WHO) (2015). WHO Estimates of the Global Burden of Foodborne Diseases. Available online at: https://apps.who.int/iris/bitstream/handle/10665/199350/9789241565165_eng.pdf (accessed April 16, 2022).
Zhou, H., Wang, J., Wan, J., and Jia, H. (2010). Resilience to natural hazards: a geographic perspective. Nat. Hazards 53, 21–41. doi: 10.1007/s11069-009-9407-y
Keywords: food supply chain, resilience, food safety and quality, foodborne outbreak, prion agent
Citation: Moynihan E, Avraam C, Siddiqui S and Neff R (2022) Optimization Based Modeling for the Food Supply Chain's Resilience to Outbreaks. Front. Sustain. Food Syst. 6:887819. doi: 10.3389/fsufs.2022.887819
Received: 02 March 2022; Accepted: 07 June 2022;
Published: 07 July 2022.
Edited by:
Arun K. Bhunia, Purdue University, United StatesReviewed by:
Ezequiel Coscueta, Universidade Católica Portuguesa, PortugalSujata A. Sirsat, University of Houston, United States
Yaohua Feng, Purdue University, United States
Copyright © 2022 Moynihan, Avraam, Siddiqui and Neff. This is an open-access article distributed under the terms of the Creative Commons Attribution License (CC BY). The use, distribution or reproduction in other forums is permitted, provided the original author(s) and the copyright owner(s) are credited and that the original publication in this journal is cited, in accordance with accepted academic practice. No use, distribution or reproduction is permitted which does not comply with these terms.
*Correspondence: Roni Neff, rneff@jhu.edu