Residual stress and microstructure in IN718-René41 graded superalloy fabricated by laser blown directed energy deposition
 Shenyan Huang
 Chen Shen1
  Yuxuan Zhang
- 1GE Research, Niskayuna, NY, United States
- 2Neutron Scattering Division, Oak Ridge National Laboratory, Oak Ridge, TN, United States
Additively printed Ni-based superalloy with a compositionally graded transition from IN718 to René41 was fabricated by laser blown-powder directed energy deposition (DED/LB-M), with the goals of meeting location-specific temperature capability and reducing component cost for hot gas path turbine components. Residual stress distribution in thin wall specimens with three sets of DED build parameters in the as-built and stress-relieved states was measured by neutron diffraction. For calculating residual stress, the calculated d0 method was found to be more appropriate as stress-free reference than using the lattice spacing measured from the stress-relief heat treated specimens. Longer dwell time (lower interpass temperature), higher energy input, smaller layer thickness resulted in a higher magnitude of tensile residual stresses at edges and compressive residual stresses at center of the specimens. The residual stress results did not show a strong dependence on graded compositions, indicating that the residual stress build-up was more geometry and process dependent. Non-destructive neutron imaging based on the attenuation coefficient qualitatively visualized the compositional variation in the bulk and showed good agreement with quantitative Electron Probe Micro-Analysis (EPMA) measurement. Grain structure, texture, and residual plastic strain along the build direction were characterized by Electron Backscatter Diffraction (EBSD). Long columnar grains with (001) preferred grain orientation were dominant along the build direction. Compositional change did not show an obvious effect on the epitaxial growth of dendrites and the continuation of the columnar grains. Residual plastic strain was relatively low in the as-built specimens.
1 Introduction
Welding the less expensive Ni-based superalloy with low or zero fraction of γ′/γ′′ precipitates to the more expensive superalloy with medium/high fraction of γ′ precipitates is an approach to reduce hot gas path turbine component cost while still meeting temperature requirements at specific locations of the component. However, fusion welding process usually generates high residual stress at an abrupt interface that may lead to debit in mechanical properties. Another well-known technical challenge is the poor weldability and strain-age cracking of medium to high γ′ superalloys. Additive manufacturing (AM) enables a new Frontier of functionally graded material (FGM) in complex component geometries and has a much better control of the joining transition, as both have been found difficult to achieve with conventional manufacturing methods (Hofmann et al., 2014; Yan et al., 2020; Ansari et al., 2021). Additive FGM approach allows using low-cost material at non-critical location while providing non-abrupt interfaces that mitigate stress localization. It has a high potential to decrease component cost by saving material with needed properties for use only at critical locations, and to improve durability compared to conventional dissimilar metal welding. Directed energy deposition (DED) is favored for building FGM components because of its easy operation of powder mixing, faster printing speed than laser powder bed fusion (PBF-LB) additive techniques, and lower processing cost. Enabled by a controlled powder mixing from multiple hoppers, the compositional gradient between low and high γ′ superalloys can be readily customized in the number of gradient layers, composition in each layer, and gradient thickness to reach improved build quality and interface mechanical properties.
Recent additive FGM development for metals has been mainly focused on compositionally graded dissimilar alloys, including but not limited to stainless steel 316 to Ni alloy IN718 (Li et al., 2022), stainless steel 316L to Ni alloy IN625 (Sasikumar et al., 2022), 316L to Ni alloy Rene88DT (Lin et al., 2005), copper alloy to stainless steel 304L (Li et al., 2018), ferritic/martensitic G91 steel to austenitic 347H steel (Wang et al., 2022), IN718 to copper alloy GRCop-42 (Walker, et al., 2022), and Co-based CoMoCr alloy to IN718 (Wen et al., 2021). Microstructurally graded alloy has also been investigated, such as IN718 with microstructure transition in the grain morphology, size, and texture that tailor anisotropy of mechanical properties (Popovich et al., 2017). In contrast, AM compositionally graded superalloys remains an under-explored research area, although wide varieties of cast or wrought superalloys are proven technology for high temperature harsh environment applications. Only one recent study of graded superalloys for turbine blisk application appears in the literature, which achieves tensile properties comparable to the cast terminal alloys and a creep debit after heat treatment (Luo et al., 2021). Despite having the same crystal structure of face centered cubic in the matrix of two terminal alloys, superalloys contain complex secondary phases stable at different temperatures, whose phase fraction, morphology, and size are quite sensitive to small chemistry changes. Compositionally graded superalloys by AM do present unique challenges, including gradient path design of complex multi-element compositions that avoid detrimental phases, residual stress caused by high thermal gradient and rapid cooling in additive process, cracking susceptibility in medium/high γ′ superalloys, and heat treatment to satisfy the whole composition span.
The residual stress documented in most AM literature of AM is referred to as Type I macroscopic residual stress, which impacts bulk mechanical properties unlike Type II grain-level residual stress and Type III intragranular residual stress. A steep residual stress gradient arises from the unique thermal cycle in AM process, involving rapid heating, cooling, and re-melting of underlying material occurred in a localized region (Li et al., 2018). High temperature gradient and rapid cooling rate during deposition are generally thought to be the primary causes of residual stress. Preheat to reduce temperature gradient has shown some success to lower residual stress in AM parts. Laser DED is reported to generate lower residual stress than wire arc DED process and powder bed fusion but it likely has higher residual stress than e-beam melting (Li et al., 2018). The influence of inter-layer dwell time on residual stress has been experimentally or computationally investigated for Co-based Stellite SF6 (Jendrzejewski and Sliwinski, 2007), AISI 308 austenitic stainless steel (Klingbeil et al., 2002), IN625 and Ti64 (Denlinger et al., 2015), IN718 (Abusalma et al., 2022), etc. While most literature concluded that a shorter dwell time yielded lower residual stress, Denlinger et al. reported the opposite result of lower residual stress with longer dwell time for IN625. Preheat to reduce the temperature gradient has been frequently practiced to decrease residual stress in AM process. In-situ ultrasound impact peening process applied during laser metal deposition of IN718 has shown success in significantly altering the tensile residual stress into compressive stress along the vertical direction (Wang and Shi, 2019). In-situ laser shocking peening during selective laser melting of stainless steel 316 is reported to significantly increase the magnitude and depth of compressive residual stress (Kalentics et al., 2017). In general, available experimental data of residual stress for additive manufactured materials are quite sparse, considering the large data pool of print parameters and the resulting microstructures reported for commercial superalloys such as IN625 and IN718.
In an ongoing development, a compositionally graded Ni superalloy comprised a low γ′/γ′′ superalloy and a medium/high γ′ superalloy was fabricated using laser blown-powder directed energy deposition (DED/LB-M). Hot gas path components that require high and low temperature capabilities at different locations could benefit from such graded structure, potentially eliminating the use welded or mechanically joined components. Thin and thick IN718-René41 graded DED specimens were successfully demonstrated and confirmed to be crack-free. René41 (R41) is a medium γ′-strengthened superalloy that is on the border line between weldable and non-weldable superalloys. Welded R41 was reported to be susceptible to strain-age cracking during welding or post-weld heat treatment, as a result of combined effects of residual stress, aging contraction with γ′ precipitation, and formation of M23C6 carbide thin films on the grain boundaries (Franklin and Savage, 1974; Kayacan et al., 2004). Recent laser powder bed fusion studies of R41 reported crack-free dense parts in the as-built and post heat-treated conditions (Atabay et al., 2020; Atabay et al., 2021). In the present work, the effects of DED build parameters on the residual stress, composition profile, and microstructure of thin-wall IN718-R41 compositionally graded specimens were investigated by neutron diffraction, neutron imaging, and conventional characterization techniques. The measured residual stress distribution provides validation data for future residual stress simulation incorporating the thermal history of DED process and representative material properties.
2 Materials and methods
The actual powder compositions of the two studied alloys are listed in Table 1. IN718 and R41 have major chemistry difference in Fe, Co, Al, Mo, Ti, and Nb. IN718 powder was produced by AP&C (GE Additive) with a powder size range of 45–150 μm. R41 powder was produced by TLS Technik GmbH & Co. Spezialpulver KG with a powder size range of 44–125 μm.
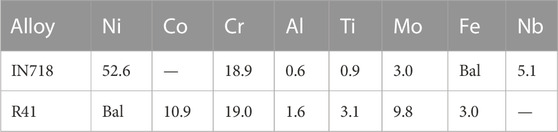
TABLE 1. Actual powder composition in weight percent (wt%).
Six single-pass thin-wall IN718/R41 graded specimens in three sets of build parameters (two specimens per parameter set) were printed by an RPMI 557 DED/LB-M system laser blown-powder Directed Energy Deposition (DED/LB-M) system at Edison Welding Institute. Metal powders were fed into the focused beam of a high-power laser to melt and deposit material. This DED-LB/M system used a continuous wave fiber laser capable of 3 kW focused to a beam diameter between 1.27 and 4 mm. Table 2 summarizes the build parameters. Laser travelled back and forth along the specimen length to build up the height (laser deposition by single pass). The powder DED machine was equipped with two hoppers that allowed mixing of IN718 and R41 powders in designed ratios by weight percent. For all specimens, the build sequence from bottom (build plate) to top followed equal number of layers in six compositions: IN718, 80% IN718 and 20% R41 mix, 60% IN718 and 40% R41 mix, 40% IN718 and 60% R41 mix, 20% IN718 and 80% R41 mix, and R41. Wrought IN718 was used for the build plate to minimize the stress induced by coefficient of thermal expansion (CTE) mismatch with the first built layer (i.e., 100% IN718). In Table 2, the first two sets of build parameters intended to study the effect of dwell time are given. The third set of build parameters is designed to study the effect of layer thickness and laser power. After built, the six specimens were extracted by EDM wiring with the build plate remaining, to retain the as-built residual stress. Specimens 1A, 2A, and 3A were kept in the as-built state for residual stress measurement by neutron diffraction. The duplicates 1B, 2B, and 3B were EDM wired into halves. One half went through a stress relief heat treatment followed by residual stress measurement (heat-treated 1B, 2B, and 3B), while the other half remained in the as-built state for microstructure characterizations (as-built 1B, 2B, and 3B). The stress relief heat treatment applied was 10°C/min ramp to 1,204°C, 1 h hold at 1,204°C in a flowing argon environment followed by air cool. The specimens were positioned upright inside the furnace during heat treatment, having the build plate material to support. The half specimens had a thin oxide scale at surface after heat treatment, which did not affect the residual stress measurement. Figure 1 shows the as-built specimens and heat-treated halves. The approximate dimension of 1A was 26.5–22 mm in length, 16 mm in height, 2.3–2.6 mm in thickness (because of the rough surface). The approximate dimension of 2A was 27–22 mm in length, 18 mm in height, 2.2–2.4 mm in thickness. The approximate dimension of 3A was 27–23 mm in length, 20 mm in height, 2–2.5 mm in thickness.

TABLE 2. DED build parameters used for IN718/R41 graded specimens (in argon gas environment).
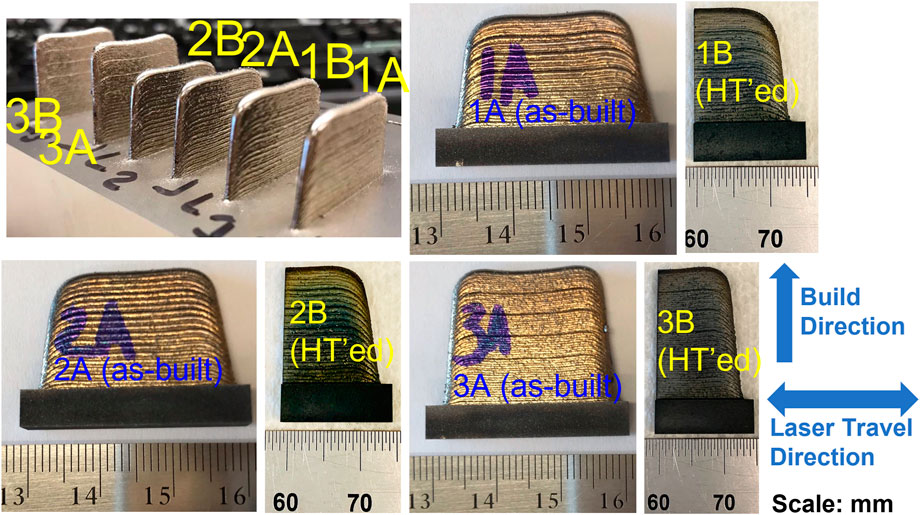
FIGURE 1. As-built and heat-treated IN718/R41 graded single-pass thin-wall specimens. Laser travel direction is seen by the line profiles at specimen surface that are parallel to the build plate.
The neutron diffraction experiment was performed at BL-7, the VULCAN beamline at Spallation Neutron Source at Oak Ridge National Laboratory (An et al., 2019). The experimental setup is displayed in Figure 2. Six specimens (as-built 1A, 2A, 3A and heat-treated halves of 1B, 2B, 3B) were mounted on a sample holder with horizontal rotation and positioned at an angle of 45° with respect to the incident neutron beam. Two area detectors (Banks 1 and 2) were positioned at ± 90° with respect to the incident neutron beam to collect diffraction data in two orthogonal directions of the specimens, along the laser’s (horizontal) travel direction and normal to the specimen plane, respectively. The instrument was set at chopper speed of 30 Hz, a defined beam size of 2 × 2 × 2 mm3, with data collection of 1 min at each location. Before each measurement, the specimens were scanned to align to the beam center. Because of symmetry, only half regions of the as-built 1A, 2A, 3A specimens were mapped, while the heat-treated halves (1B, 2B, 3B) were mapped over the entire region, with the exception that the regions within 1.5 mm from the edge were not measured to avoid experimental artifacts. A 1.0 mm spacing between each measurement location was applied for residual stress mapping. One more orientation was mapped with the sample turned by 90° around the normal axis to obtain the lattice strains along the build direction. The three orthogonal directions are required for residual stress calculation. Given the preferred texture along the build direction, it was considered not appropriate to use single peak fitting of (311) or (100) diffraction peaks of the matrix γ phase. Instead, LeBail whole pattern fitting was performed in GSAS to obtain the average lattice parameter of γ phase and calculate the average lattice strain. We did not consider separating γ and γ′ due to small misfit, if any. Composition changes after heat treatment and precipitation of γ′ in R41 during cooling from stress-relief heat treatment (though at a reduced volume fraction compared to full heat treatment), could have introduced fitting uncertainty, although the diffraction peaks in the heat-treated specimens were observed to be predominantly the γ phase and the γ/γ′ lattice misfit in R41 appeared to be small. All the fitted diffraction patterns showed goodness of fitting with χ2 below 3. The change of the composition micro-segregation during heat treatment occurred throughout the specimen, which could affect the stress-free d0 determination. Here, assuming plane stress (zero normal stress through thin wall), a method of calculating the stress-free lattice spacing d0 was adopted, based on the lattice strains in three orthogonal directions and Poisson’s ratio at each measurement location (Eq. 5 in An et al., 2017). The elastic strain in the heat treatment stress relieved specimens was also evaluated and compared with the calculated d0 approach. Residual stress was then calculated using Young’s modulus of 200 GPa and Poisson’s ratio of 0.35. IN718 and R41 have similar Young’s moduli and Poisson’s ratios, indicating that the composition gradients of mixed IN718 and R41 also have similar values. Typical error of residual stress measurement by neuron diffraction is approximately ±30 MPa, considering error propagation from lattice strain measurements.
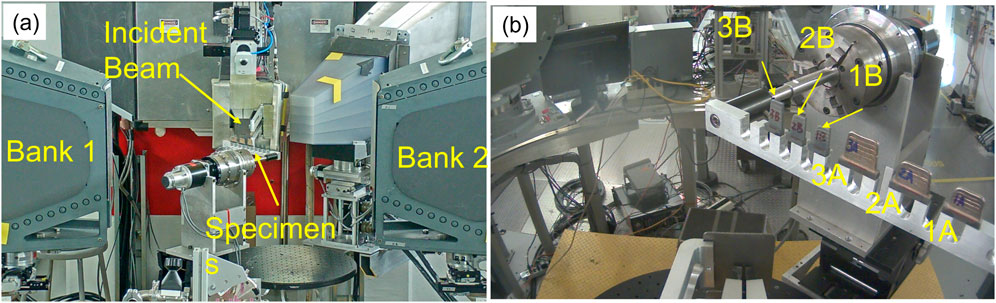
FIGURE 2. (A) Neutron diffraction experimental setup; (B) a closer view of the three as-built specimens 1A, 2A, and 3A and three heat-treated halves 1B, 2B, and 3B mounted on the sample holder.
The neutron imaging measurement was performed at CG-1D, Neutron Imaging instrument at High Flux Isotope Reactor (HFIR) at Oak Ridge National Laboratory. Cold neutrons with wavelengths ranging from 0.8 to ∼6 Å were used for imaging (Santodonato et al., 2015). A 100 μm 6LiF/ZnS scintillator converted the transmitted neutrons into light signal, which was then recorded by a charge-coupled-device (CCD) camera with effective pixel size of 42 µm by 42 µm. The collected 2D grayscale projection was recorded as a raw image. Neutron transmission images were then obtained by normalizing with flat field images and dark current images. Computed tomography (CT) scans were also performed to probe the internal gradient and to extract thickness profile along the build direction. During the CT scan, the sample was rotated through a 360° range with a step size of 0.29°. At each angle, image with an exposure time of 30 s was recorded. After collecting over 1,000 projections, the neutron images were preprocessed by noise filtering, beam fluctuation correction and normalization. Then 3D volumes were successfully reconstructed by filtered-back-projection using MuhRec (Kaestner, 2022). After 3D reconstruction, visualization and analysis were performed using Amira (Stalling and Westerhoff, 2005), a software developed by Thermo-Fisher Scientific in collaboration with the Zuse Institute Berlin.
Electron Backscatter diffraction (EBSD) was performed on the in-plane cross section of the remaining halves of as-built specimens 1B, 2B, and 3B, using a Hitachi SU-70 FEG-SEM an Oxford AZtek Symmetry EBSD detector. An accelerating voltage of 20 kV and a step size of 2 µm were applied. The measured area was a strip of 1 mm width (parallel to laser travel direction) and the full height of the specimen to cover the entire compositional range. Grain boundary maps, kernel average misorientation maps, inverse pole figures, and pole figures were analyzed from the EBSD data. Composition profiles along the build height were quantified on a transverse cross section by Electron Probe Micro-analysis (EPMA). A line profile was performed using a spread beam of 10 μm (along build direction) x 40 μm (parallel to build plate) and a 65 μm step size on the as-built specimens.
3 Results
3.1 Microstructure of as-built specimens
The 10° grain boundary maps along the build direction were measured by EBSD for as-built specimens 1B, 2B, and 3B, as displayed in Figure 3. The measured location was a few mm from the specimen side edge. The scanned area covered a 1 mm width and the entire height of each specimen. The grain structure was dominant by columnar grains aligned along the build direction due to the directional thermal gradient introduced by the DED/LB-M process. The length of some columnar grains reached a few millimeters, indicating epitaxial growth during deposition and continuation of grain structure across many deposition layers. Composition change in the gradient does not seem to interrupt the continuity of the grain structure. Fine equiaxed grains were observed at the top 0.5 mm region of the builds, because of high cooling rate at surface. Across the height, a few equiaxed grains were also seen sporadically, with no clear association of their locations with the build layers. Grain size distribution was not quantified given the low number of grains, wide span of grain size, and insufficient statistics.
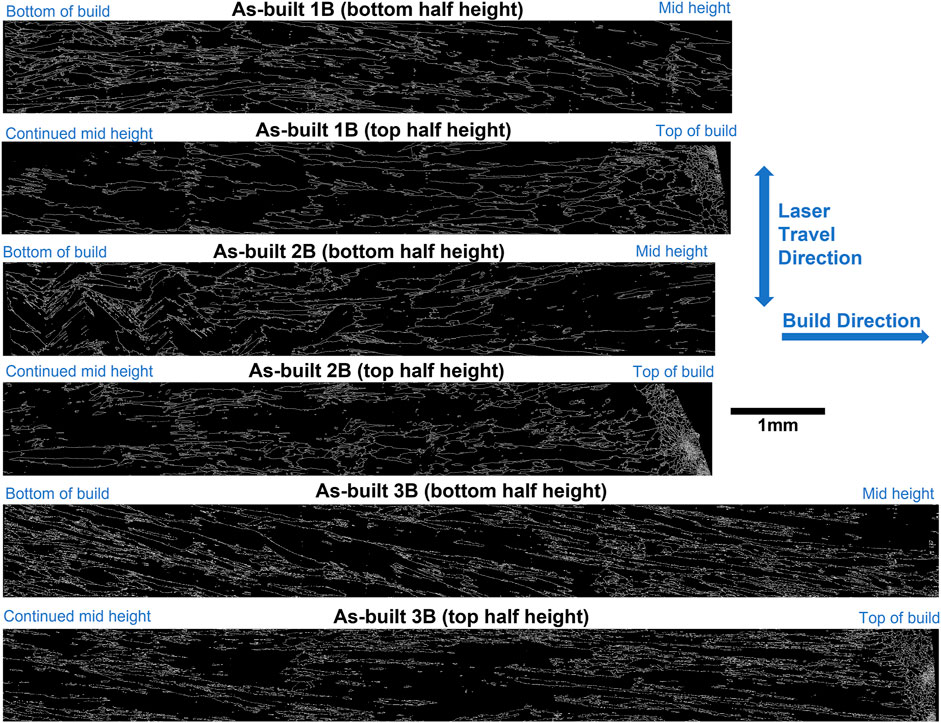
FIGURE 3. 10° grain boundary maps (excluding twin boundaries) along build direction. The maps capture entire height of each specimen in the prepared cross section. Maps were divided into two regions (bottom half and top half) for better visualization.
Figure 4 shows the inverse pole figures and pole figures obtained from EBSD analysis for the as-built specimens at the same measurement location. A preferred 〈001〉 texture along the build direction was observed as expected. The build started with a few misoriented grains near the build plate, which were outgrown by the 〈001〉 oriented grains after a few millimeters of build distance. As-built 3B seems to be more textured than 1B and 2B. Those equiaxed grains occasionally seen in the bulk of the builds appeared to have random orientations, as well as the chilled fine grains in the top of the builds.
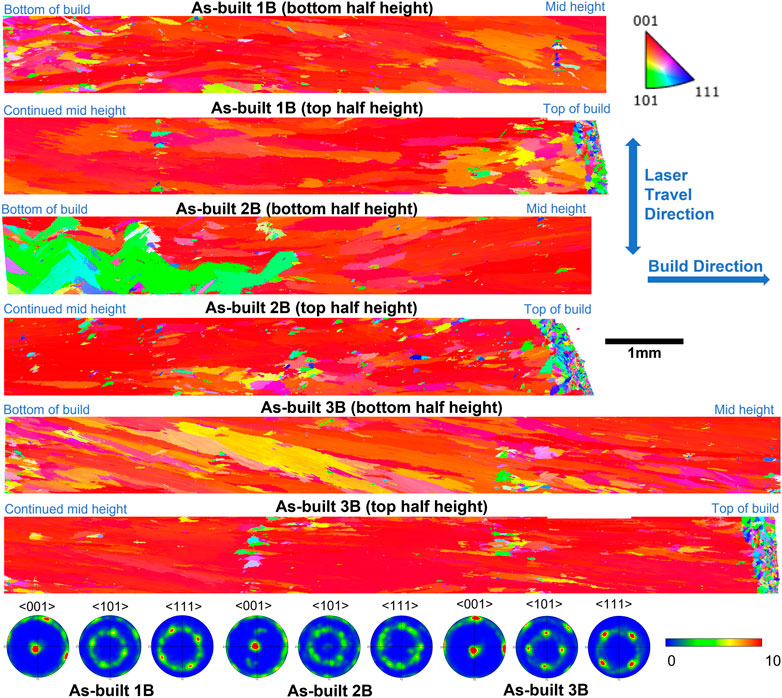
FIGURE 4. Inverse pole figures and pole figures along build direction. The inverse pole figure maps capture the entire height of each specimen in the prepared cross section. Maps were divided into two regions (bottom half and top half) for better visualization.
EBSD Kernel Average Misorientation (KAM) maps of as-built 1B, 2B, and 3B are shown in Figure 5 (the same measured areas as the grain boundary maps, inverse pole figures, and pole figures). As a measure of intergranular crystal rotation, the KAM values indicate the amount of plastic strain in the samples. The three samples all show a similarly low level of residual plastic strain in the as-built state, except for some local high values encountered at low-angle boundaries. Overall, there is little variation in the residual plastic strain along the FGM build direction (composition gradient).
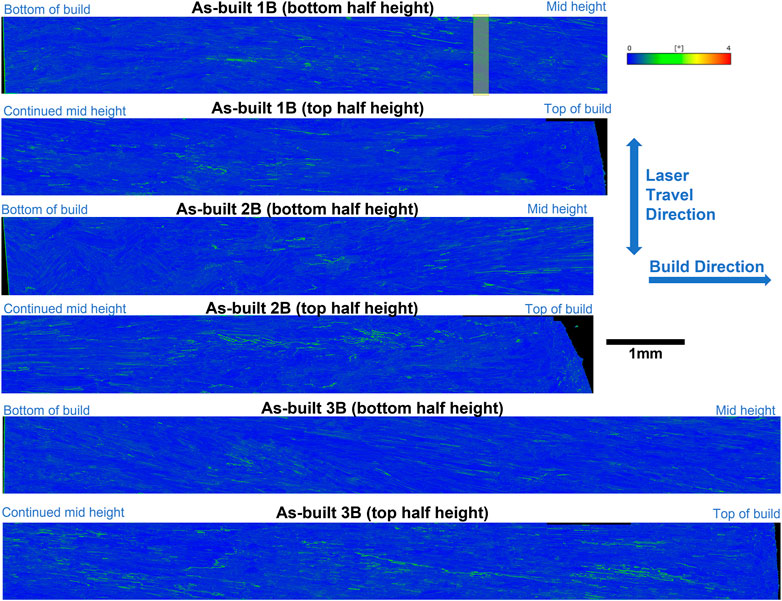
FIGURE 5. EBSD Kernel Average Misorientation (max. 4°) maps along build direction for the as-built samples. Maps were divided into two regions (bottom half and top half) for better visualization. The data were subsequently averaged in thin slices (shown by the yellow ribbon in 1B) for Figure 6.
To analyze this further, the KAM maps were discretized to thin slices (shown schematically by the yellow ribbon in Figure 5) perpendicular to the build direction. The KAM values were averaged in each slice and are plotted with the distance from build plate in Figure 6. Pixels on low-angle boundaries or outside sample edge (mostly near the sample’s top) were excluded from averaging. The width of the slices was chosen to be 0.1 mm (50 times of EBSD pixel size), making three to five slices within each DED deposition layer and about 30 slices in each composition gradient. While lacking a clear correlation to compositions, the profiles in Figure 6 indicate a common trend along the build direction: minimal residual plastic strain at the very top (about 0.5 mm) of all samples (labeled “C”), a transient of relatively high strain at the upper portion (“B”), and relatively low strain at the lower portion (“A”, absent in Sample 1B). The region “C” coincides with the transition from cellular to equiaxed grain structure in all three samples. The change from “A” to “B” could be contributed by the change in dwell time in the middle gradient region and the upper terminal (Rene 41) region (Table 2). However, the trend is insignificant considering the overall low retained plastic strain.

FIGURE 6. Averaged KAM values along build direction (distance from the build plate side of each map) for the as-built samples. The averaging was done in each thin slice shown in Figure 5.
3.2 Quantitative composition profile in as-built specimens
Composition profiles along the build direction for as-built 1B, 2B, 3B were measured by EPMA. Figure 7 presents the line profiles of elements Co, Mo, Nb, Al, Ti, Fe. The vertical dash lines specify the starting point of each composition layers. A sharp change in composition upon a change in powder mixing ratio was not seen. Instead, a gradual decrease in Fe, Nb and an increase in Co, Mo, Ti, Al was observed at approximately 1 mm distance from each transition point. The feature is believed to be due to remelting of the prior layer during powder deposition. A detailed analysis will be presented in a follow-up paper. Neutron diffraction data could not well resolve the transition region because of the large beam size of 2 mm used in the experiment. In the majority of region, the material reached relatively constant compositions as evident by the flat profile, which agrees with the target compositions.
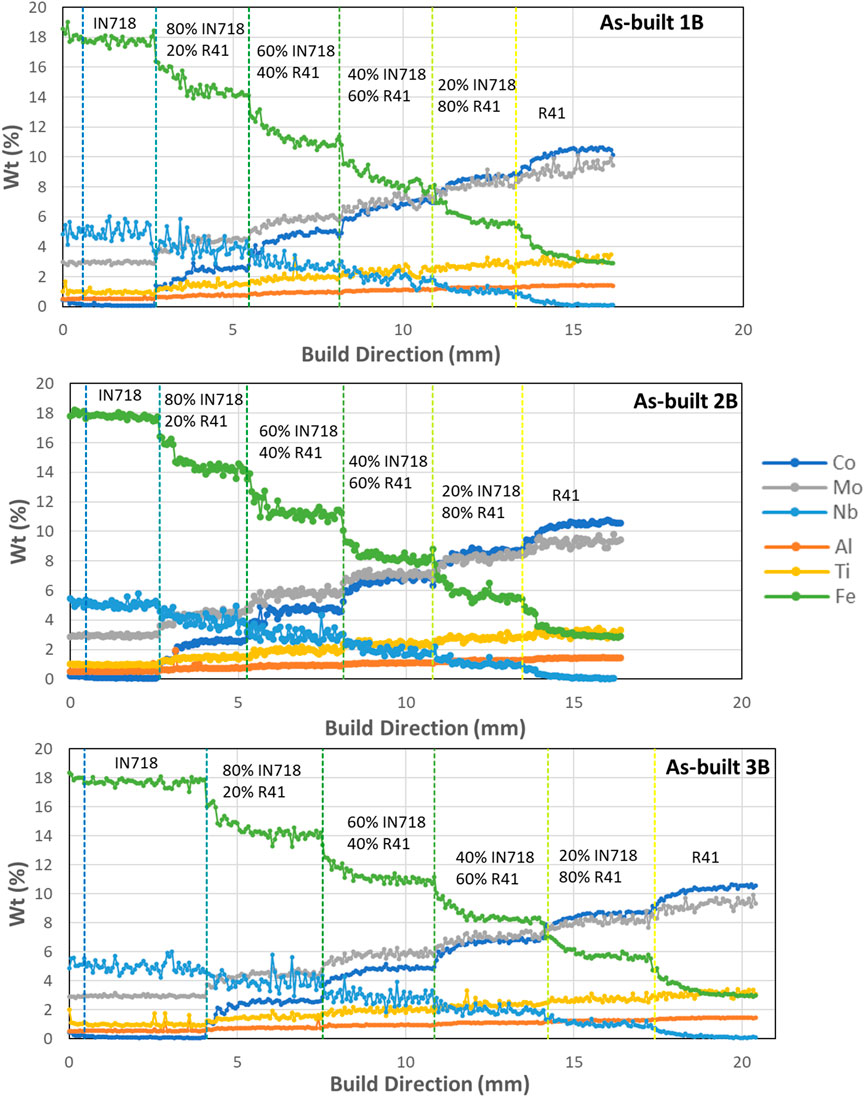
FIGURE 7. Quantitative composition profiles of the elements Co, Mo, Nb, Al, Ti, and Fe in weight percent measured by EPMA along build direction for the as-built halves of 1B, 2B, 3B specimens. The vertical dash lines mark the boundaries of each composition region (IN718, 80% IN718–20%R41, 60% IN718–40% R41, 40% IN718–60% R41, 20% IN718–80% R41, R41).
3.3 Bulk composition distribution by neutron imaging
The bulk composition distribution was examined via neutron imaging. Figure 8A visualizes a normalized neutron transmission image of as-built 3A and heat-treated 3B. As indicated by the color map, yellow represents higher transmission and blue represents lower transmission. In the build area of both 3A and 3B, step/layer can be clearly seen and the transmission decreases as the height increases. According to the Beer-Lambert law:
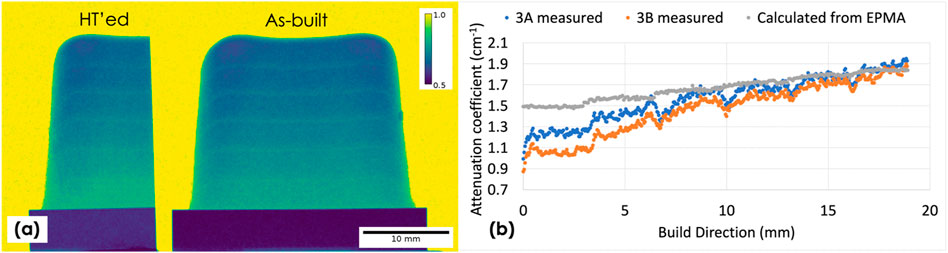
FIGURE 8. (A) Neutron transmission image of as-built 3A and heat-treated 3B; (B) comparison between the measured neutron attenuation coefficient (cm−1) and the calculated attenuation coefficient (cm−1) using EPMA quantified compositions.
3.4 Residual stress distribution
The calculated residual stress contours for as-built specimens 1A, 2A, 3A are displayed in Figure 9. The yellow dash line labeled on the specimen pictures outlines the mapped regions. Common features are observed among the three specimens: compressive residual stress at center region and tensile residual stress close to the edges, with a low residual stress band between the compressive and tensile residual stress regions. This stress contour is qualitatively consistent with published studies of AM specimens that went through melting and solidification. The residual stress along the specimen length (laser travel direction) appears to have a higher magnitude than the residual stress along the specimen height (build direction). Although the 1.5 mm edge of the specimens were not measured, the stress contours indicate a high magnitude of tensile stress along build direction at the side edge locations and along specimen length at the top edge location. Comparing specimens 1A and 2A, longer dwell time (or lower interpass temperature) in 2A results in a higher magnitude of surface tensile and bulk compressive residual stress than in 1A. Specimen 3A shows the highest magnitude of surface tensile and bulk compressive residual stress compared to 1A and 2A, indicating that the taller sample height, greater heat input, and higher number of build layers (with a smaller layer thickness) all contribute to the observed higher residual stress. It is possible that the bottom of the builds that meets the build plate is low in residual stress, because the lowest measurement locations (1.5 mm above the build plate) present lower stress levels than the center region. Although the CTE in IN718 and R41 differs by less than 10%, it could still generate considerable amount of CTE mismatch induced stress in thick, large, complex shape components due to volumetric expansion or contraction. It is anticipated that the composition gradients create a smoother transition of CTE compared to a sharp composition change from IN718 to R41, thus alleviating thermal stress. We did not have additional neutron beamtime for single material builds of IN718 and R41 specimens with the same build parameters to allow a direct comparison with the IN718-R41 graded specimens. However, the residual stress results do not show a strong dependence on graded compositions, indicating that the residual stress build-up is more geometry and process dependent.
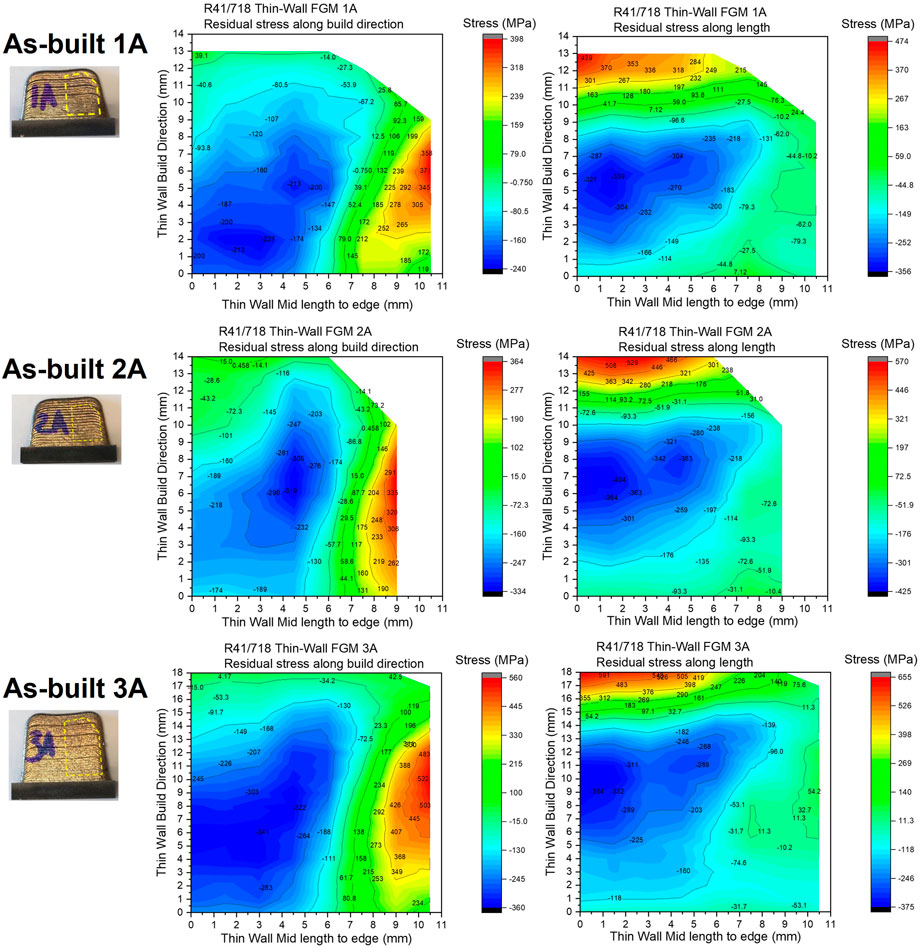
FIGURE 9. Residual stress contours along build direction and length of as-built 1A, 2A, 3A. Yellow dash line in the specimen pictures illustrates the mapped regions.
Residual stress contours for the (stress relief) heat-treated specimens 1B, 2B, 3B are shown in Figure 10. The specimens did not exhibit any noticeable distortion after heat treatment. The magnitude of residual stress in all three samples was extremely low (below 50 MPa at most locations), compared to the as-built specimens. The internal compressive and surface tensile residual stress distribution in the as-built specimens were greatly relieved. This suggests that the stress relief heat treatment condition (1,204°C/1h) on 1B, 2B, 3B was effective in greatly reducing the residual stress. Note that this temperature was above the solvus of γ′ and γ′′ phases in R41, IN718, and the composition gradients. There was also an absence of microcracks formed during heat treatment. In other words, strain age cracking, a phenomenon often reported in welding and AM of γ′ strengthened Ni-based superalloys, was not observed in the studied specimens. After stress relief heat treatment, specimen 3B (with a higher residual stress in the as-built state) showed a slightly higher magnitude of residual stress than 1B and 2B after stress relief heat treatment, especially at the top region.
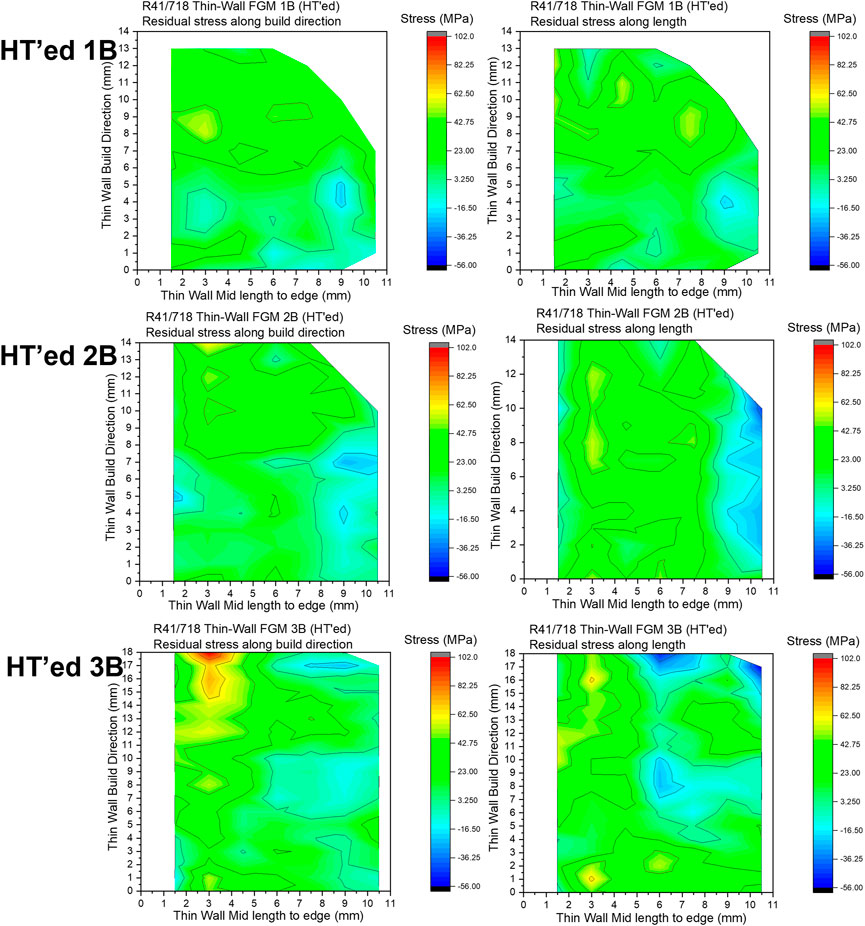
FIGURE 10. Residual stress contours along build direction and length of stress relief heat treated specimens 1B, 2B, 3B.
4 Discussion
Internal stress is the driving force behind cracking in fusion-based AM process. It is sensitive to build parameters and strategies (e.g., laser scan pattern, component geometry and topology). Making high-γ′ FGMs is even more challenging because, other than thermal condition, phase transformation and physical property variation with chemical compositions add to the source of the internal stress. As importantly, understanding how the stress changes in post-build heat treatment is key to prevent strain-age cracking in γ′ alloys. Direct observation and spatial mapping of internal (residual) stresses on samples of a relevant geometry, after build and after heat treatment, by neutron diffraction offers a first step of probing important insights into Type I macroscopic residual stress.
Residual stress of AM monolithic IN718 has been experimentally measured and reported by several studies (Jinoop et al., 2019; Barros, et al., 2019; Ahmad et al., 2018; Deng, et al., 2018; Nadammal, et al., 2017). These studies represent different additive modalities (i.e., PBF or DED) with a variety of specimen geometries and scan/build strategies, which are all sensitive to the resulting residual stress distribution. To the best of our knowledge, residual stress of AM monolithic R41 has never been reported. Nevertheless, a meaningful qualitative comparison between literature and our results is discussed here. The magnitudes of the observed maximum tensile stress and maximum compressive stress in the present study were 655 MPa in as-built 3A top region and 425 MPa in as-built 2A bulk region, respectively. Barros et al. reported ∼400 MPa on top and 600–900 MPa on lateral in as-built 20 × 20 × 15 mm cube specimens printed by PBF-LB. Selective laser melted IN718 has been reported to have ∼800 MPa tensile residual stress near surface (Ahmad et al., 2018; Deng, et al., 2018) and 200–400 MPa compressive stress in the middle region (Nadammal, et al., 2017; Ahmad et al., 2018). This suggests that DED/LB-M does not necessarily produce a lower magnitude of residual stress than PBF-LB. Similar to Barros’ finding, residual stress anisotropy on top and lateral regions in the vertical and horizontal direction is also observed in our study. Different post-build heat treatment conditions were applied on AM IN718 in literature. Jinoop et al. applied post heat treatment at 950°C and 1,050°C on DED/LB-M IN718 and obtained 50% reduction of the surface residual stress after 1,050°C heat treatment (Jinoop et al., 2019). Barros et al. used 1,065°C solution treatment on PBF-LB printed IN718 and observed ∼50% reduction of residual stress on top region, 50%–68% reduction of residual stress on lateral region. The present study shows that more than 90% of the residual stress in the bulk and near surface could be relieved by a higher annealing temperature at 1,204°C, regardless of the studied compositions. It is believed that this temperature to fully solution/dissolve the secondary phases in the studied IN718-R41 composition range probably helps stress relief. To establish a quantitative relationship among DED process parameters, thermal history, and residual stress formation, our team is currently working on DED process modeling and residual stress simulation of the IN718/R41 graded builds. Experimental data presented in this paper will be used for model validation.
In the neutron measurement, accurate determination of residual stress relies on the choice of stress-free reference. Two common approaches are 1) use a small, comb specimen extracted from same location whose residual stress is removed by machining, and 2) use a specimen after stress-relief heat treatment. The present study adopted a third approach that did not require additional physical specimens as stress-free reference. Instead, this approach calculated the reference from lattice spacing measurements in three orthogonal directions of the specimen itself. It works only for thin specimens in which a plane stress state (zero normal stress) is a good approximation. A graded composition would require a number of comb specimens in the same compositions being extracted as references, in order to fully eliminate the effect of composition on lattice spacing. This would create excessive work and neutron measurement time. In contrast, the calculated d0 approach is efficient in residual stress measurement of compositionally graded thin specimens. Furthermore, this calculated d0 approach was also applied to the heat-treated specimens. In Figure 11, the resulting stress-free lattice parameter contours of the heat-treated specimens are compared to those of the as-built. Interestingly, the two contours reveal different patterns: the stress-free lattice parameters in the heat-treated specimens show a composition dependent gradient, while the lattice parameters in the as-built specimens do not show such trend. It is also noted that the contours of the three heat treated specimens are highly consistent and similar, confirming that the trend is real. One possible explanation is that the heat treatment condition also homogenized local composition micro-segregation at dendrites and thus affected the overall lattice parameter detected in the 2 × 2 × 2 mm3 beam volume. In other words, the applied heat treatment not only changed the residual stress state but also removed micro-segregation. Therefore, the heat-treated specimens are not recommended as stress-free reference. In contrast, the calculated d0 method is the preferred approach because of two major advantages: 1) it is independent of local microstructure and chemistry; and 2) it extracts location-specific data from the same sample with no concern for sample variation (An et al., 2017; An et al., 2018; Huang et al., 2018).
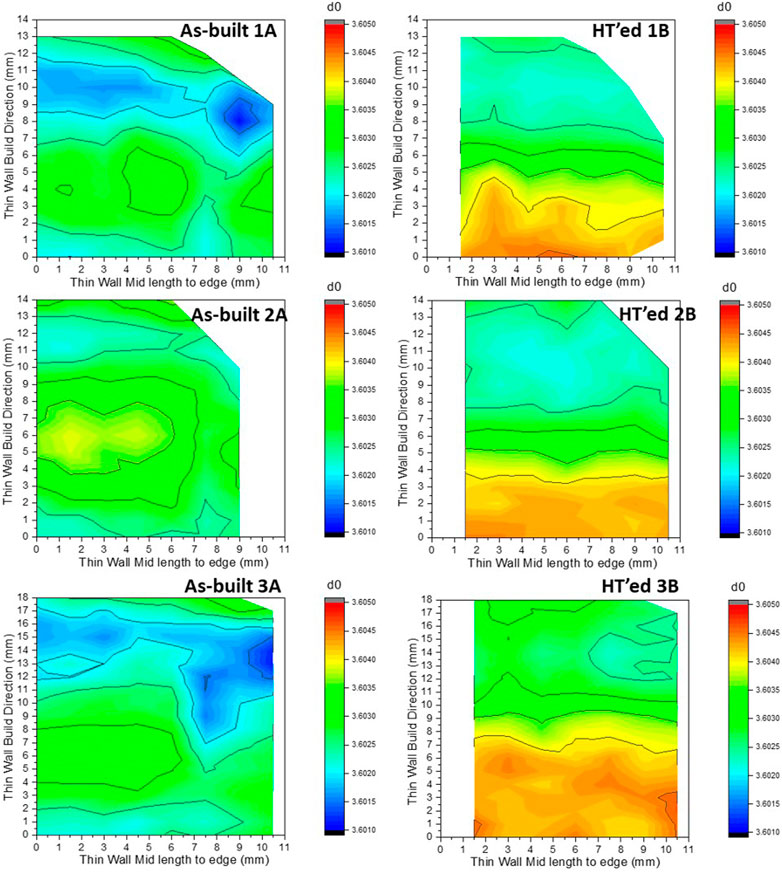
FIGURE 11. Calculated stress-free lattice parameter of as-built and stress relief heat treated specimens.
The calculated stress-free lattice parameter of the heat-treated specimens reflects the composition effect alone for IN718-R41 gradient. The two terminal alloys, IN718 and R41, have subtle but noticeable differences in their lattice parameters. For comparison, the lattice parameters of γ matrix phase were calculated using various regression models in the literature (Caron, 2000; Wang et al., 2007; Kablov and Petrushin, 2008; Lazo et al., 2009). Caron’s model considered the elements Co, Cr, Mo, W, Re, Ru, Al, Ti, Ta, Nb, while Wang’s model had one additional element Hf and Kablov’s model had two additional elements V and Hf. Lazo’s model had the lowest number of elements for γ lattice parameter including Ni, Co, Mo, W, Ta, Nb, V, but excluded Cr, Al, Ti, Re, Ru. These literature models were developed using data from commercial and experimental superalloys, with a large fraction of single-crystal blade alloys. Polycrystalline superalloys with medium γ′ fraction for intermediate temperature applications have insufficient experimental data for lattice parameter in the literature. Thus, it is not surprising that these models do not well predict lattice parameters of IN718-R41 gradient. In addition, room temperature lattice parameters of γ phase were calculated with Thermo-Calc software and TCNI database. As shown in Figure 12, only Lazo’s model and Thermo-Calc/TCNI predict the downward trend while the other three models all predict an upward trend. Average stress-free lattice parameters of heat treated 1B, 2B, 3B were calculated over the measurement locations at the same height and plotted against the predicted data. Curves of the three specimens tightly overlap, with small decrease from IN718 to R41, while all the models, except the Thermo-Calc prediction, project a greater variation of lattice parameters. Future research is recommended to expand the experimental database for polycrystalline superalloy composition space and improve the model accuracy over temperatures.
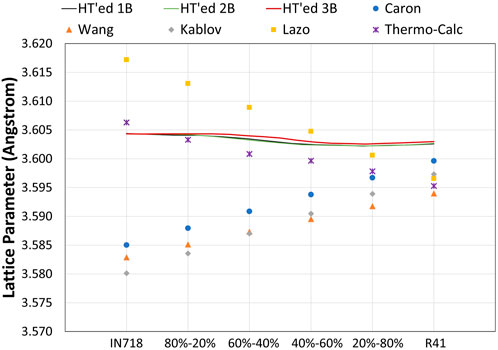
FIGURE 12. Stress-free lattice parameters of IN718-R41 gradient from heat-treated specimens compared to lattice parameters predicted from various composition-based models (Caron, 2000; Wang et al., 2007; Kablov and Petrushin, 2008; Lazo et al., 2009) and Thermo-Calc with TCNI database.
5 Conclusion
Single-pass thin-wall specimens of compositionally graded superalloy IN718-R41 were successfully fabricated by DED/LB-M without cracking. Residual stress contour measured by neutron diffraction revealed a typical edge tensile, center compressive stress profile. Stress-relief heat treatment (1,204°C for 1 h) largely relieved the as-built residual stress. Longer inter-layer dwell time (lower interpass temperature), higher heat input, and smaller layer thickness resulted in a higher magnitude of tensile and compressive residual stress at specific locations. The residual stress results do not show a strong dependence on graded compositions, indicating that the residual stress build-up is more geometry and process dependent. For calculating residual stress, the calculated d0 method was found to be superior to using the heat-treated specimens as stress-free reference. Non-destructive neutron imaging based on the attenuation coefficient qualitatively visualized the compositional variation in the bulk and showed good agreement with the quantitative EPMA measurement. Long columnar grains with (001) preferred grain orientation were dominant along the build direction. Compositional gradient did not show obvious effect on the epitaxial growth of dendrites and continuation of the columnar grains. Residual plastic strain determined from EBSD KAM maps was found to be low in the as-built specimens. These results suggest a promising technical path toward further developing DED/LB-M processed IN718-R41 graded superalloy in complex structures. Remaining challenges such as printability of thick, complex geometry, cracking and residual stress mitigation, and heat treatment optimization should be addressed in future work.
Data availability statement
The raw data supporting the conclusion of this article will be made available by the authors, without undue reservation.
Author contributions
SH: conceptualization, methodology, investigation, writing—original draft, writing—review and editing; CS: investigation, validation, writing—original draft, writing—review and editing; KA, YZ: formal analysis, investigation, writing—review and editing; IS, MB, DY: investigation, writing—review and editing.
Funding
This work was supported by the Department of Energy, Office of Energy Efficiency and Renewable Energy, Advanced Manufacturing Office through Award DE-EE0009118 with Technology Manager Dr. Christopher Hovanec. A portion of this research used resources at the Spallation Neutron Source and High Flux Isotope Reactor, DOE Office of Science User Facilities operated by the Oak Ridge National Laboratory.
Acknowledgments
The authors would like to acknowledge technical support from James McGee, Siyeong Ju, Jesse Della Villa, Reid Peacock, Yang Jiao, Changjie Sun at GE Research, Alex Kitt, Lee Kerwin, Luke Mohr at Edison Welding Institute.
Conflict of interest
The authors declare that the research was conducted in the absence of any commercial or financial relationships that could be construed as a potential conflict of interest.
Publisher’s note
All claims expressed in this article are solely those of the authors and do not necessarily represent those of their affiliated organizations, or those of the publisher, the editors and the reviewers. Any product that may be evaluated in this article, or claim that may be made by its manufacturer, is not guaranteed or endorsed by the publisher.
References
Abusalma, H., Eisazadeh, H., Hejripour, F., Bunn, J., and Aidun, D. K. (2022). Parametric study of residual stress formation in wire and arc additive manufacturing. J. Manuf. Process. 75, 863–876. doi:10.1016/j.jmapro.2022.01.043
Ahmad, B., van der Veen, S. O., Fitzpatrick, M. E., and Guo, H. (2018). Residual stress evaluation in selective-laser-melting additively manufactured titanium (Ti-6Al-4V) and Inconel 718 using the contour method and numerical simulation. Addit. Manuf. 22, 571–582. doi:10.1016/j.addma.2018.06.002
An, K., Chen, Y., and Stoica, A. D. (2019). Vulcan: A “hammer” for high-temperature materials research. MRS Bull. 44, 878–885. doi:10.1557/mrs.2019.256
An, K., McClintock, D. A., and Frost, M. (2018). Residual stress measurements of front window welds in a prototypical spallation neutron source target module. Technical Report. doi:10.2172/1459284
An, K., Yuan, L., Dial, L., Spinelli, I., Stoica, A. D., and Gao, Y. (2017). Neutron residual stress measurement and numerical modeling in a curved thin-walled structure by laser powder bed fusion additive manufacturing. Mater. Des. 135, 122–132. doi:10.1016/j.matdes.2017.09.018
Ansari, M., Jabari, E., and Toyserkani, E. (2021). Opportunities and challenges in additive manufacturing of functionally graded metallic materials via powder-fed laser directed energy deposition: A review. J. Mat. Process. Technol. 294, 117117. doi:10.1016/j.jmatprotec.2021.117117
Atabay, S. E., Sanchez-Mata, O., Muniz-Lerma, J. A., Gauvin, R., and Brochu, M. (2021). Effect of heat treatment on the microstructure and elevated temperature tensile properties of Rene 41 alloy produced by laser powder bed fusion. J. Alloys Compd. 858, 157645. doi:10.1016/j.jallcom.2020.157645
Atabay, S. E., Sanchez-Mata, O., Muniz-Lerma, J. A., Gauvin, R., and Brochu, M. (2020). Microstructure and mechanical properties of rene 41 alloy manufactured by laser powder bed fusion. Mater. Sci. Eng. A 773, 138849. doi:10.1016/j.msea.2019.138849
Barros, R., Silva, F. J. G., Gouveia, R. M., Saboori, A., Marchese, G., Biamino, S., et al. (2019). Laser powder bed fusion of inconel 718: Residual stress analysis before and after heat treatment. Metals 9, 1290. doi:10.3390/met9121290
Brown, D. A., Chadwick, M. B., Capote, R., Kahler, A. C., Trkov, A., Herman, M. W., et al. (2018). ENDF/B-VIII.0: The 8th major release of the nuclear reaction data library with CIELO-project cross sections, new standards and thermal scattering data. Nucl. Data Sheets 148, 1–142. doi:10.1016/j.nds.2018.02.001
Caron, P. (2000). High γ′ solvus new generation nickel-based superalloys for single crystal turbine blade applications. Proc. Ninth Int. Symposium Superalloys, 737–746.
Deng, D., Peng, R. L., Brodin, H., and Moverare, J. (2018). Microstructure and mechanical properties of Inconel 718 produced by selective laser melting: Sample orientation dependence and effects of post heat treatments. Mater. Sci. Eng. A 718, 294–306. doi:10.1016/j.msea.2017.12.043
Denlinger, E. R., Heigel, J. C., Michaleris, P., and Palmer, T. A. (2015). Effect of inter-layer dwell time on distortion and residual stress in additive manufacturing of titanium and nickel alloys. J. Mater. Process. Technol. 215, 123–131. doi:10.1016/j.jmatprotec.2014.07.030
Franklin, J. E., and Savage, W. F. (1974). Stress relaxation and strain-age cracking in René 41weldments. Suffern, NY: International Nickel, 380–387.
Hofmann, D., Kolodziejska, J., Roberts, S., Otis, R., Liu, Z., Borgonia, J., et al. (2014). Compositionally graded metals: A new frontier of additive manufacturing. J. Mat. Res. 29, 1899–1910. doi:10.1557/jmr.2014.208
Huang, L., Chen, X., Yu, D., Chen, Y., and An, K. (2018). “Residual stress distribution in a hydroformed advanced high strength steel component: Neutron diffraction measurements and finite element simulations,” in Proceedings of the WCX World Congress Experience, Detroit, Michigan, USA. doi:10.4271/2018-01-0803
Jendrzejewski, R., and Śliwiński, G. (2007). Investigation of temperature and stress fields in laser cladded coatings. Appl. Surf. Sci. 254, 921–925. doi:10.1016/j.apsusc.2007.08.014
Jinoop, A. N., Paul, C. P., Mishra, S. K., and Bindra, K. S. (2019). Laser Additive Manufacturing using directed energy deposition of Inconel-718 wall structures with tailored characteristics. Vacuum 166, 270–278. doi:10.1016/j.vacuum.2019.05.027
Kablov, E. N., and Petrushin, N. V. (2008). Designing of high-rhenium single crystal Ni-base superalloy for gas turbine blades. Proc. Eleventh Int. Symposium Superalloys, 901–908.
Kaestner, A. P. (2022). MuhRec A new tomography reconstructor. Nucl. Instrum. Methods Phys. Res. Sect. A Accel. Spectrom. Detect. Assoc. Equip. 651, 156–160. doi:10.1016/j.nima.2011.01.129
Kalentics, N., Boillat, E., Peyre, P., Gorny, C., Kenel, C., Leinenbach, C., et al. (2017). 3D laser shock peening - a new method for the 3D control of residual stresses in selective laser melting. Mater. Des. 130, 350–356. doi:10.1016/j.matdes.2017.05.083
Kayacan, R., Varol, R., and Kimilli, O. (2004). The effects of pre- and post-weld heat treatment variables on the strain-age cracking in welded Rene 41 components. Mater. Res. Bull. 39, 2171–2186. doi:10.1016/j.materresbull.2004.08.003
Klingbeil, N. W., Beuth, J. L., Chin, R. K., and Amon, C. H. (2002). Residual stress-induced warping in direct metal solid freeform fabrication. Int. J. Mech. Sci. 44, 57–77. doi:10.1016/s0020-7403(01)00084-4
Lazo, Y., Suárez, L., Fernández, M., and Fernández, L. (2009). Modeling of lattice parameters of the γ and γ′ phases of the superalloys with base nickel by using a multiple linear regression analysis. Superlattices Microstruct. 45, 117–124. doi:10.1016/j.spmi.2009.01.001
Li, C., Liu, Z. Y., Fang, X. Y., and Guo, Y. B. (2018). Residual stress in metal additive manufacturing. Procedia CIRP 71, 348–353. doi:10.1016/j.procir.2018.05.039
Li, K., Zhan, J., Zhang, M., Ma, R., Tang, Q., Zhang, D. Z., et al. (2022). A functionally graded material design from stainless steel to Ni-based superalloy by laser metal deposition coupled with thermodynamic prediction. Mater. Des. 217, 110612. doi:10.1016/j.matdes.2022.110612
Lin, X., Yue, T. M., Yang, H. O., and Huang, W. D. (2005). Laser rapid forming of SS316L/Rene88DT graded material. Mater. Sci. Eng. A 391, 325–336. doi:10.1016/j.msea.2004.08.072
Luo, Y. W., Ma, T., Shao, W. W., Zhang, G. P., and Zhang, B. (2021). Effects of heat treatment on microstructures and mechanical properties of GH4169/K418 functionally graded material fabricated by laser melting deposition. Mater. Sci. Eng. A 821, 141601. doi:10.1016/j.msea.2021.141601
Nadammal, N., Cabeza, S., Mishurova, T., Thiede, T., Kromm, A., Seyfert, C., et al. (2017). Effect of hatch length on the development of microstructure, texture and residual stresses in selective laser melted superalloy Inconel 718. Mater. Des. 134, 139–150. doi:10.1016/j.matdes.2017.08.049
Popovich, V. A., Borisov, E. V., Popovich, A. A., Sufiiarov, V. Sh., Masaylo, D. V., and Alzina, L. (2017). Functionally graded inconel 718 processed by additive manufacturing: Crystallographic texture, anisotropy of microstructure and mechanical properties. Mater. Des. 114, 441–449. doi:10.1016/j.matdes.2016.10.075
Santodonato, L., Bilheux, H. Z., Bailey, B., Bilheux, J., Nguyen, P. T., Tremsin, A. S., et al. (2015). The CG-1D neutron imaging beamline at the Oak Ridge National laboratory high Flux Isotope reactor. Phys. Procedia 69, 104–108. doi:10.1016/j.phpro.2015.07.015
Sasikumar, R., Kannan, A. R., Kumar, S. M., Pramod, R., Kumar, N. P., Shanmugam, N. S., et al. (2022). Wire arc additive manufacturing of functionally graded material with SS 316L and IN625: Microstructural and mechanical perspectives. CIRP J. Manuf. Sci. Technol. 38, 230–242. doi:10.1016/j.cirpj.2022.05.005
Stalling, D., Westerhoff, M., and Hege, H.-C. (2005). Amira: A highly interactive system for visual data analysis. Vis. Handb. 38, 749–767. doi:10.1016/B978-012387582-2/50040-X
Walker, J., Middendorf, J. R., Cesko, C., and Gockel, J. (2022). Multi-material laser powder bed fusion additive manufacturing in 3-dimensions. Manuf. Lett. 31, 74–77. doi:10.1016/j.mfglet.2021.07.011
Wang, H., Moser, J. L., Lara-Curzio, E., and Nandwana, P. (2022). Pressurized tube creep testing of graded transition joints (GTJ) for G91 and 347H base metals. Technical Report. doi:10.2172/1883775
Wang, T., Chen, L., and Liu, Z. (2007). Lattice parameters and local lattice distortions in fcc-Ni solutions. Metall. Mat. Trans. A 38A, 562–569. doi:10.1007/s11661-007-9091-z
Wang, Y., and Shi, J. (2019). Microstructure and properties of inconel 718 fabricated by directed energy deposition with in-situ ultrasonic impact peening. Metall. Mat. Trans. B 50, 2815–2827. doi:10.1007/s11663-019-01672-3
Wen, Y., Zhang, B., Narayan, R. L., Wang, P., Song, X., Zhao, H., et al. (2021). Laser powder bed fusion of compositionally graded CoCrMo-Inconel 718. Addit. Manuf. 40, 101926. doi:10.1016/j.addma.2021.101926
Yan, L., Chen, Y., and Liou, F. (2020). Additive manufacturing of functionally graded metallic materials using laser metal deposition. Addit. Manuf. 31, 100901. doi:10.1016/j.addma.2019.100901
Keywords: superalloy, residual stress, neutron diffraction, neutron imaging, functionally graded material, directed energy deposition, additive manufacturing
Citation: Huang S, Shen C, An K, Zhang Y, Spinelli I, Brennan M and Yu D (2022) Residual stress and microstructure in IN718-René41 graded superalloy fabricated by laser blown directed energy deposition. Front. Met. Alloy 1:1070562. doi: 10.3389/ftmal.2022.1070562
Received: 15 October 2022; Accepted: 01 December 2022;
Published: 23 December 2022.
Edited by:
Zhenzhen Yu, Colorado School of Mines, United StatesReviewed by:
Enrico Salvati, University of Udine, ItalyYang Ren, City University of Hong Kong, Hong Kong SAR, China
Copyright © 2022 Huang, Shen, An, Zhang, Spinelli, Brennan and Yu. This is an open-access article distributed under the terms of the Creative Commons Attribution License (CC BY). The use, distribution or reproduction in other forums is permitted, provided the original author(s) and the copyright owner(s) are credited and that the original publication in this journal is cited, in accordance with accepted academic practice. No use, distribution or reproduction is permitted which does not comply with these terms.
*Correspondence: Shenyan Huang, huangs@ge.com
†These authors have contributed equally to this work