 Yangcheng Zheng1,2
 Yunpeng Wang1*
- 1State Key Laboratory of Organic Geochemistry, Guangzhou Institute of Geochemistry, Chinese Academy of Sciences, Guangzhou, China
- 2University of Chinese Academy of Sciences, Beijing, China
Objectives: Waves of epidemics associated with Omicron variant of Coronavirus Disease 2019 (COVID-19) in major cities in China this year have been controlled. It is of great importance to study the transmission characteristics of these cases to support further interventions.
Methods: We simulate the transmission trajectory and analyze the intervention influences of waves associated with Omicron variant in major cities in China using the Suspected-Exposed-Infectious-Removed (SEIR) model. In addition, we propose a model using a function between the maximum daily infections and the duration of the epidemic, calibrated with data from Chinese cities.
Results: An infection period of 5 days and basic reproduction number R0 between 2 and 8.72 are most appropriate for most cases in China. Control measures show a significant impact on reducing R0, and the earlier control measures are implemented, the shorter the epidemic will last. Our proposed model performs well in predicting the duration of the epidemic with an average error of 2.49 days.
Conclusion: Our results show great potential in epidemic model simulation and predicting the end date of the Omicron epidemic effectively and efficiently.
Introduction
On 24 November 2021, the World Health Organization (WHO) confirmed a new variant of the 2019 Coronavirus (COVID-19) reported by South Africa which was named as Omicron [1]. WHO rated the global risk of Omicron as “very high,” which could lead to a global pandemic [2]. Last winter, Omicron swept across the world, with the maximum number of daily infections exceeding 3.8 million, and a significant increasing rate of Omicron variant in confirmed COVID-19 positive cases was found [3, 4]. Compared to other variants of the SARS-CoV-2 virus, the Omicron variant has very rapid transmission rate that is much more difficult to predict [1–3].
Since 2022, epidemics of varying severity caused by the Omicron variant have occurred in some major cities in China, with Shanghai and Hong Kong experiencing the most severe outbreaks. Since the Omicron outbreaks, China has continued to insist on the dynamic zero policy of COVID and strategies that have generally proven effective [5]. As of the writing of this article, most cities have succeeded in achieving the goal of dynamic zero COVID. With sporadic relapses occurring in other cities in China, there is no indication that the epidemic will disappear in a short time. Therefore, it is of great importance to comprehensively evaluate and study the current Omicron outbreaks in China to draw lessons for further epidemic control measures.
In this paper, we simulate the course of transmission and the influences of interventions using the Suspected-Exposed-Infectious-Removed (SEIR) epidemic model and analyze the epidemiology and statistical characteristics. In addition, we propose a model using a concise function between the maximum daily infections and the duration of each outbreak, which can be used to predict the end date of ongoing and potential outbreaks in other cities or countries.
Methods
Twelve typical cases in major cities or provinces in China that have experienced the Omicron epidemic since 2022 were selected as study cases and their daily infection data before 30 April were collected [6, 7]. Since asymptomatic cases are also infectious, we combined the symptomatic cases and asymptomatic cases into daily infections [8, 9]. We mark the date when the number of cases increases and exceeds 1% of the maximum value as the epidemic start date, and the date when the number of cases falls to less than 1% as the epidemic end date. The duration of each outbreak round is defined as the interval between the start and end dates. According to our definition, most selected cases, except Shanghai, experienced one completed outbreak before 30 April, while Shenzhen and Tianjin experienced two completed rounds. The specific start and end dates of each outbreak are shown in Table 1.
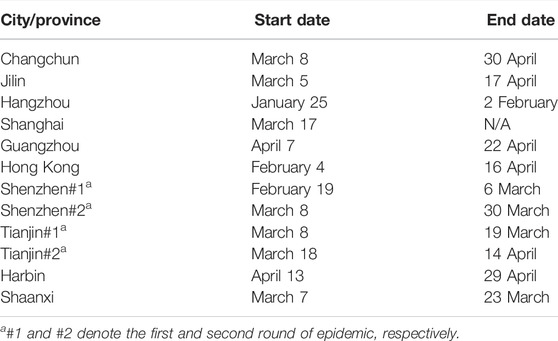
TABLE 1. Selected cases with Omicron outbreaks (China 2022).
The SEIR model is the most commonly used dynamic epidemic model in COVID-19 studies, which divides the population into suspected population (S), exposed population (E), infectious population (I), and removed population (R), whose relationship can be formulated by the following differential equations:
where N is the total population, γ−1 is the infectious period, α−1 is the incubation period, and the time-varying R0(t) is defined as follows:
with R0 being the initial basic reproduction number (defined as the average number of secondary infections caused by a single infected individual in a fully susceptible population [10]) and R1 being the final basic reproduction number, q being a recession coefficient in the exponential function, and Ti being the intervention time when a significant change can be found in
Results
As shown in Figure 1, our model achieves satisfactory results in most selected cases with R2 > 0.99. In the simulation, we tried different values of γ and found that setting γ to 0.2 and corresponding infection duration of 5 days gives the best fitting performance in most selected cases. Under the condition of γ = 0.2, the adjusted epidemiological parameters are shown in Table 2. The initial basic reproduction number R0 ranges from 2.01 (Changchun) to 8.72 (Jilin), and after the intervention period Ti,
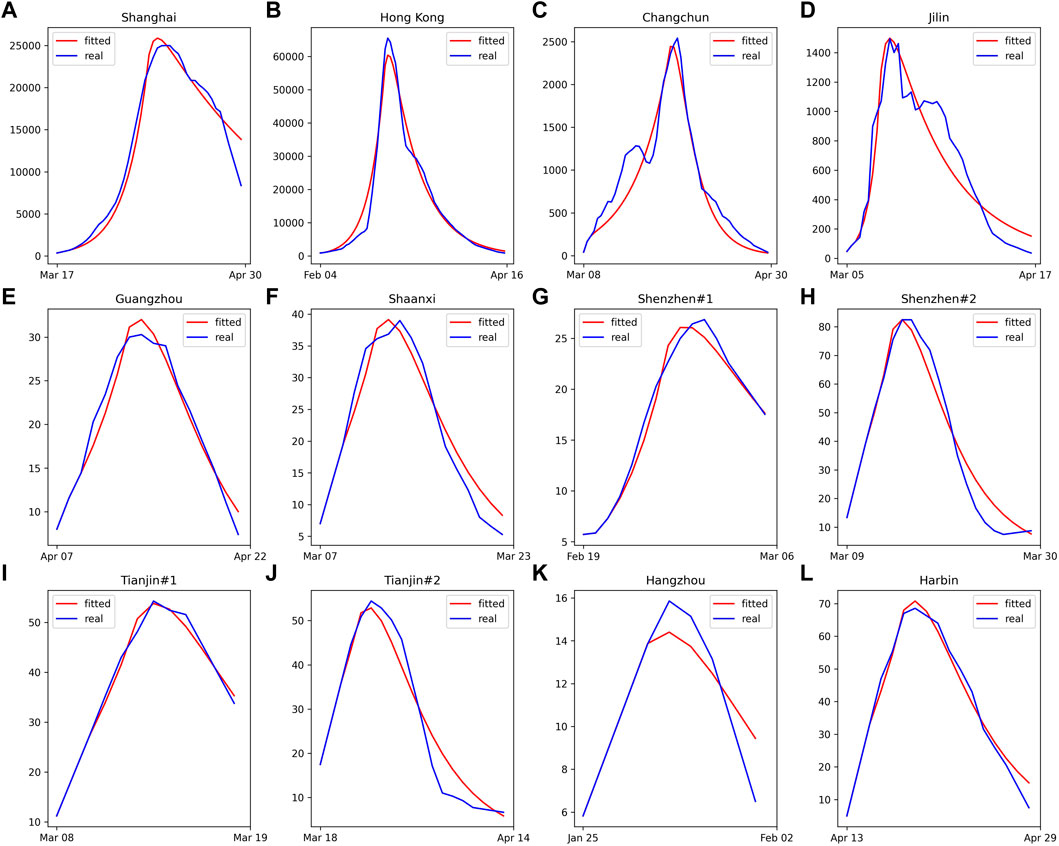
FIGURE 1. The curves of fitted and actual daily new confirmed cases for the selected cities. (A) Shanghai, (B) Hong Kong, (C) Changchun, (D) Jilin, (E) Guangzhou, (F) Shaanxi, (G) Shenzhen round 1, (H) Shenzhen round 2, (I) Tianjin round 1, (J) Tianjin round 2, (K) Hangzhou (L) Harbin (China 2022).
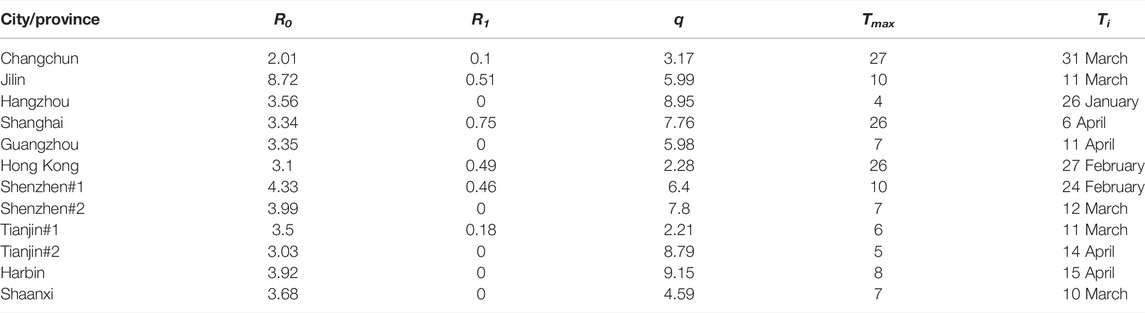
TABLE 2. Epidemiology parameters of selected cases (China 2022).
We take the logarithm of the maximum daily infections based on 10 and establish its linear relationship with the duration of the epidemic in each selected case (Figure 2). For the cases with completed epidemic, we compare the actual duration with the predicted duration (Table 3), and the error ranges from −5.4 to 6.4 days. According to this function, we predicted that daily infections in Shanghai will decrease to less than 260 (1% of the maximum value) on 22 May, 5 days earlier than the actual date of 27 May.
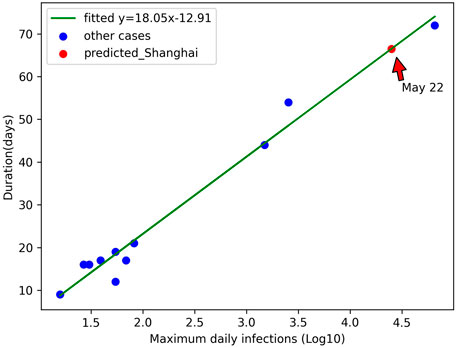
FIGURE 2. Relationship between the maximum daily infections (Log10) and the duration of the epidemic (China 2022).
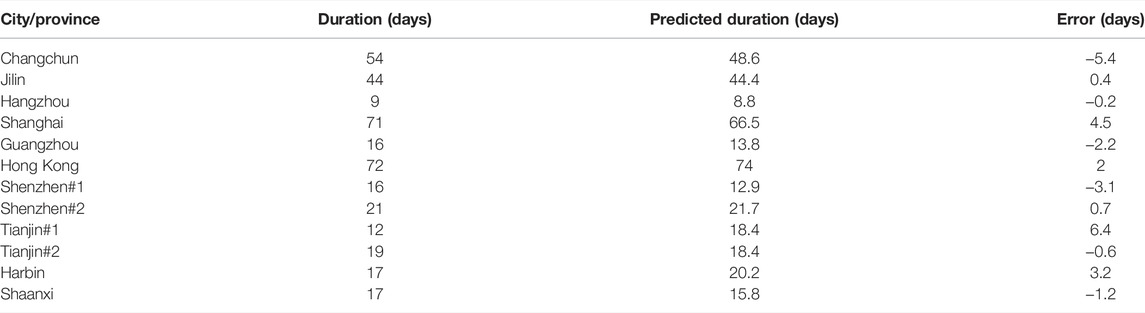
TABLE 3. Selected cases with Omicron outbreaks (China 2022).
Discussion
The validity of the SEIR model depends on accurate estimation of the characteristics of virus transmission [12]. A fixed infection rate γ = 0.2 may contribute to other studies of Omicron using the SEIR model. The initial basic reproduction number R0 reflects the basic capacity of epidemic prevention and control before the intervention. Except in Jilin city, the R0 of the Omicron variant in selected cases ranges from 2 to 4.4, with an average of 3.43. According to a review of the basic reproduction number for Omicron [13], the average effective R0 is 3.4 with a range of 0.88–9.4, which is highly consistent with our results. The high R0 in the case of Jilin city can be attributed to severe cluster infections in the initial stage [14], but the value decreases significantly after 6 days, and the maximum daily infections come four more days later. Some previous studies have evaluated an extremely high value of R0 of Omicron variant in the very early stage when no control measures were implemented. For instance, R0 could be as high as 10 in the United Kingdom, while the Omicron variant was 3.3 times more transmissible than the Delta variant in the case South Africa [4, 15]. The differences between the values of R0 in the cases of China and other countries may be attributed to the rapid and reasonable reactions to the new sporadic relapses in China [16, 17]. The final reproduction number R1 reflects the transmission ability at which virus spreads in the community after the intervention. In most cases where the dynamic zero COVID target has been reached, R1 is zero or close to zero, indicating that the transmission chain has been completely broken. Our simulation functions, especially Eq. 4, are established under the conditions that effective control measures are implemented and a significant decrease in the transmission rate can be found. In addition, other long-term factors such as seasonality, vaccination, reinfection and demographics are not accounted for in our study for brevity [18].
The control measures implemented in China (i.e., mask wearing and routine nucleic acid testing) are important non-pharmaceutical interventions and can effectively prevent community transmission of the virus [19, 20]. The intervention date Ti is the date when
We propose a brief linear function to approximately predict the duration of a complete round of epidemics, with error within 1 week. This method is a nonparametric method that is short enough to avoid the uncertainties introduced by manually setting the epidemiological parameters. It should be noted, however, that this method is only applicable to a single epidemic wave and should be used with caution because it is difficult to judge the maximum point.
Author Contributions
Conceptualization, YZ and YW; methodology, YZ; investigation, YZ and YW; data curation, YZ; writing—original draft preparation, YZ; writing—review and editing, YW; visualization, YZ; funding acquisition, YW. All authors have read and agreed to the published version of the manuscript.
Funding
This research was funded by The Natural Science Foundation of China, grant numbers U1901215 and 42007205, and Natural Science Fund of Guangdong Province, grant number 2021A1515011375. This is contribution No. IS-3266 from GIGCAS.
Conflict of Interest
The authors declare that the research was conducted in the absence of any commercial or financial relationships that could be construed as a potential conflict of interest.
References
1.World Health Organization (2021a). Available at: https://www.who.int/news/item/26-11-2021-classification-of-omicron-(b.1.1.529)-sars-cov-2-variant-of-concern (Accessed June 28, 2022).
2.World Health Organization (2021b). Available at: https://www.who.int/publications/m/item/enhancing-readiness-for-Omicron-(b.1.1.529)-technical-brief-and-priority-actions-for-member-states (Accessed June 28, 2022).
3.World Health Organization (2022). Available at: https://www.worldometers.info/coronavirus/ (Accessed June 28, 2022).
4. Burki, TK. Health of Ukranian Citizens under Threat from Conflict and Displacement. Lancet Respir Med (2022) 10:e49. doi:10.1016/S2213-2600(22)00093-5
5.China Today (2022). Available at: http://www.chinatoday.com.cn/ctenglish/2018/zdtj/202203/t20220316_800279717.html (Accessed June 28, 2022).
6.COVID-19 Coronavirus Pandemic (2022). Available at: https://www.worldometers.info/coronavirus.(accessed on June 28, 2022)
7.Baidu (2022). Available at: https://voice.baidu.com/act/newpneumonia/newpneumonia/ (Accessed June 28, 2022).
8. Gerasimov, A, Lebedev, G, Lebedev, M, and Semenycheva, I. COVID-19 Dynamics: A Heterogeneous Model. Front Public Health (2020) 8:558368. doi:10.3389/fpubh.2020.558368
9. Wang, H, Xu, K, Li, Z, Pang, K, and He, H. Improved Epidemic Dynamics Model and its Prediction for COVID-19 in Italy. Appl Sci (2020) 10:4930. doi:10.3390/app10144930
10. Kissler, SM, Tedijanto, C, Goldstein, E, Grad, YH, and Lipsitch, M. Projecting the Transmission Dynamics of SARS-CoV-2 through the Postpandemic Period. Science (2020) 368:860–8. doi:10.1126/science.abb5793
11. Zheng, Y, and Wang, Y. How Seasonality and Control Measures Jointly Determine the Multistage Waves of the COVID-19 Epidemic: A Modelling Study and Implications. Int J Environ Res Public Health (2022) 19:6404. doi:10.3390/ijerph19116404
12. Sun, J, Chen, X, Zhang, Z, Lai, S, Zhao, B, Liu, H, et al. Forecasting the Long-Term Trend of COVID-19 Epidemic Using a Dynamic Model. Sci Rep (2020) 10:21122. doi:10.1038/s41598-020-78084-w
13. Liu, Y, and Rocklov, J. The Effective Reproductive Number of the Omicron Variant of SARS-CoV-2 Is Several Times Relative to Delta. J Trav Med (2022) 29:taac037. doi:10.1093/jtm/taac03710.1093/jtm/taac037
14.China Daily (2022). Available at: https://www.chinadaily.com.cn/a/202203/11/WS622b1fd4a310cdd39bc8c1a7.html (Accessed June 28, 2022).
15. Nishiura, H, Ito, K, Anzai, A, Kobayashi, T, Piantham, C, and Rodriguez-Morales, A. Relative Reproduction Number of SARS-CoV-2 Omicron (B.1.1.529) Compared with Delta Variant in South Africa. J Clin Med (2021) 11:30. doi:10.3390/jcm11010030
16. Thienemann, F, Pinto, F, Grobbee, DE, Boehm, M, Bazargani, N, Ge, J, et al. World Heart Federation Briefing on Prevention: Coronavirus Disease 2019 (COVID-19) in Low-Income Countries. Glob Heart (2020) 15:31. doi:10.5334/gh.778
17. Ruan, L, Wen, M, Zeng, Q, Chen, C, Huang, S, Yang, S, et al. New Measures for the Coronavirus Disease 2019 Response: A Lesson from the Wenzhou Experience. Clin Infect Dis (2020) 71:866–9. doi:10.1093/cid/ciaa386
18. Smith, BA, Bancej, C, Fazil, A, Mullah, M, Yan, P, and Zhang, S. The Performance of Phenomenological Models in Providing Near-Term Canadian Case Projections in the Midst of the COVID-19 Pandemic: March - April, 2020. Epidemics (2021) 35:100457. doi:10.1016/j.epidem.2021.100457
19. Wang, H, Xu, K, Li, Z, Pang, K, and He, H. Improved Epidemic Dynamics Model and its Prediction for COVID-19 in Italy. Appl Sci (Basel) (2020) 10:4930. doi:10.3390/app10144930
Keywords: COVID-19, China, SEIR model, Omicron, predicting the end of the epidemic
Citation: Zheng Y and Wang Y (2022) Transmission Characteristics and Predictive Model for Recent Epidemic Waves of COVID-19 Associated With OMICRON Variant in Major Cities in China. Int J Public Health 67:1605177. doi: 10.3389/ijph.2022.1605177
Received: 30 June 2022; Accepted: 24 October 2022;
Published: 03 November 2022.
Edited by:
Nino Kuenzli, Swiss Tropical and Public Health Institute (Swiss TPH), SwitzerlandCopyright © 2022 Zheng and Wang. This is an open-access article distributed under the terms of the Creative Commons Attribution License (CC BY). The use, distribution or reproduction in other forums is permitted, provided the original author(s) and the copyright owner(s) are credited and that the original publication in this journal is cited, in accordance with accepted academic practice. No use, distribution or reproduction is permitted which does not comply with these terms.
*Correspondence: Yunpeng Wang, wangyp@gig.ac.cn