1. Introduction
The solar sails are propulsion systems based on the radiation pressure of sunlight applied on the sail itself. At the beginning of the 1920’s, the Soviet Konstantin Tsiolkovsky and his colleague Fridrickh Tsander, who are considered the true pioneers in the astronautical field, wrote “For flight in interplanetary space, I am working on the idea of flying, using tremendous mirrors of very thin sheets, capable of achieving favorable results, using the pressure of sunlight to attain cosmic velocities” [
1,
2]. In 1973, NASA successfully applied solar sail during the mission of the spacecraft Mariner 10, which is dedicated to the exploration of Venus and Mercury.
Until 2010, no solar sails were successfully used in space as primary propulsion systems. On 21 May, 2010, the Japan Aerospace Exploration Agency (JAXA) launched the IKAROS (Interplanetary Kite-craft Accelerated by Radiation Of the Sun) spacecraft, which deployed a 200 m
2 polyimide experimental solar sail. IKAROS had a diagonal spinning square sail made of a 7.5 μm thick sheet of polyamide. The polyamide sheet had a mass of about 10 grams per square meter. A thin-film solar array was embedded to the sail. Eight LCD panels were embedded in the sail, whose reflectance can be adjusted for attitude control [
3,
4]. IKAROS spent six months traveling to Venus, and then began a journey towards the sun [
5,
6]. Despite the losses of Cosmos 1 and NanoSail-D (which were due to failure of their launchers), scientists and engineers around the world have been working on solar sails while most applications created intend to use the sails as cargo transport.
Due to the small pressure level, in order to exploit this propulsion system, a great surface of the sail is required. For the same reason, materials employed for the construction of the sail must show low weight and high reflectivity [
7]. Engines based on ion propulsion for small satellites are able to work according to the principle that a small but constant pressure applied on a wide surface of the sail can produce a satisfying acceleration to the whole structure [
8]. The planned test flight of the Solar Sail Demonstrator, called the “Sunjammer” by its designers in honor of the 1964 Arthur C. Clarke story, in which he coined the term “solar sailing”, had the intent to prove the feasibility of the sailing technology. The demonstration was expected to launch on a Falcon 9 in January 2015. It would have been a secondary payload, released after the placement of the DSCOVR climate satellite at the L1 point. Citing a lack of confidence in its contractor’s ability to deliver, the mission was cancelled in October 2014. In 2016, the Planetary Society’s LightSail 1 spacecraft launched into orbit and transmitted its first signals back to Earth, which kicked off a three-and-a-half week mission to test the CubeSat’s critical functions and deploy a 32 m
2 solar sail. LightSail-1 consisted of three CubeSat units. One unit was occupied by the core, containing all the devices, the equipment, and the control systems, while the remaining two units were occupied by the four folded sail segments. A peculiarity of the project was that the CubeSat would be inserted into a small satellite, Prox 1, and together they will be launched into orbit. The goal of Prox 1 is to demonstrate the possibility of using small satellites to inspect and control other spacecrafts. Now, as engineers prepare for a full systems test of LightSail 2, a successor CubeSat will attempt the first controlled solar sail flight in low-Earth orbit. The Near-Earth Asteroid Scout (NEA Scout) has been a mission jointly developed by NASA’s Marshall Space Flight Center (MSFC) and the Jet Propulsion Laboratory (JPL), which consists of a controllable low-cost CubeSat solar sail spacecraft capable of encountering near-Earth asteroids (NEA). In 2018, NASA’s Near-Earth Asteroid Scout, which is a small satellite designed to study asteroids close to Earth, performed a successful deployment test on June 28th of the solar sail to be launched on Exploration Mission-1 (EM-1). The test was performed in an indoor clean room at the NeXolve facility in Huntsville, Alabama. In its mission, the NEA Scout will perform reconnaissance of an asteroid using a CubeSat and solar sail propulsion, which offers navigation agility during cruise for approaching the target. Propelled by sunlight, the NEA Scout will complete a flyby and observe a small asteroid (<300 feet in diameter), while also taking pictures and observing its position in the space, the asteroid’s shape, rotational properties, spectral class, local dust and debris field, regional morphology, and regolith properties. The data collected will enhance the current understanding of asteroid environments and will yield key information for future human asteroid explorers.
Many different systems have been previously considered for the sails opening. Each system was characterized by the presence of guide rollers, electromechanical actuation devices, or composite booms [
9]. In the actual deployment technology, the main limit is the high weight of the system and the complexity of the deployment mechanism for such huge surfaces. Objective of the present work has been to propose, manufacture, and test an innovative miniaturized self-deploying system actuated by shape memory alloy elements. A self-deploying system based on the NiTi Shape Memory wires has been designed and manufactured in a small-scale prototype. Kapton has always been employed as a sail surface with a thin Al coating. In our experiments, commercial pure Al thin sheets in addition to adhesive kapton film have been used in order to simulate the sail. By testing different configurations, an attempt has been made to improve the achievable flatness of solar sail prototypes after deployment, by varying the number and position of the shape memory elements. The prototypes made have been successful in unfolding in a single heating step, which increases the number of deployments. Through the techniques of Reverse Engineering, it has been possible to obtain virtual models of the manufactured and tested prototypes. On these models, an analysis has been performed to obtain a quantitative measurement of the degree of planarity of the prototypes, with which it has been possible to compare the performance offered by the four configurations. To compare the different configurations of the Box-and-Whisker diagrams, histograms and diagrams with level curves were used. Useful results for the optimization of the best folding solution in terms of the surface/weight reduction and in the planarity degree of the solar sail were achieved.
2. Materials and Methods
The most frequently used materials for the manufacturing of the solar sails are Kapton
® and Mylar
®. Both of them belong to a class of plastic materials with high performance in terms of lightness, flexibility, high resistance temperatures, and chemical agents. These materials are used as substrate and then coated with a thin aluminum film to obtain a more reflective surface. The choice of the materials is fundamental in order to achieve the best performance in terms of a number of possible folds and lightness of the structure [
10] and active surface [
11]. Because of the costs of these materials, it has been necessary to use an alternative material for the construction of prototypes. For this reason, thin films (2.5 μm) of adhesive kapton (1.4 g/cm
3) were applied on thin commercial aluminum films (12 μm). On the aluminum film, some active shape memory alloy elements have been inserted perpendicularly to the bending line. As active materials, shape memory alloy wires of 0.41 and 0.6 mm diameter have been selected. Shape memory alloys are a class of functional materials able to recover the preset shape upon heating above a critical transformation temperature [
12,
13]. The shape recovery is based on the thermo-elastic martensitic transformation occurring in these kind of alloys and the characteristic transformation temperatures are a function of the composition of the alloy and of the thermal and mechanical history of the material [
14]. Typical transformation temperatures for NiTi are 65 °C (alloy H) and 95 °C (alloy M), according to the nomenclature used by the supplier of the alloys (Memory Metalle GmbH). A sketch of an aluminum sail is reported in
Figure 1. It is evident that the presence of silicone employed fasten the shape memory wires to the aluminum sail. In order to set the shape to be recovered while heating, a particular thermal treatment has been performed, which is usually called shape-setting. It consists in heating up to 500 °C while the wire is kept straight on a flat bar, maintained at this temperature for 5 minutes, and quenched in cold water. After this treatment, when bent in a cold condition, the wire is able to recover the preset straight shape upon heating above the activation temperature (95 °C).
Three possible configurations have been studied in which a different distribution of SMA wires and/or a different folding method are taken into account. Configuration 1 provides three deployments, which take place in an orthogonal direction to the dotted lines visible in
Figure 1a. In order to make the outlines, a total of 9 NiTi wires have been used, including 4 wires with a diameter of 0.41 mm and length of 2 cm, shown in yellow, 2 wires with a diameter of 0.41 mm and a length of 4 cm, shown in green, and 3 wires with a diameter of 0.6 mm and a length of 6 cm, shown in red. Following the 3 folds, the sail takes the form of a rectangle of dimensions 8 cm x 6 cm. The surface reduction obtained is, therefore, equal to 52%.
In Configuration 2 (
Figure 1b), to obtain a greater percentage of surface reduction, the arrangement of the wires has been changed in order to have 5 deployments instead of 3 using 11 wires in the NiTi alloy. Each of them had a diameter of 0.41 mm and a length of 20 mm. The final shape of the prototype was an isosceles triangle with a base of 10 cm and height of 5 cm for a surface reduction of 75%. In subsequent tests, it was decided to replace a part of the wires used in configuration 2 with others of greater length and diameter with the aim to obtain a greater degree of planarity. Five wires of the previous configuration have been replaced by 4 wires with a diameter of 0.41 mm and a length equal to 4 cm, and one with a diameter of 0.6 mm and a length equal to 6 cm. In Configuration 3, 11 NiTi wires have been employed: 6 wires with a diameter of 0.41 mm and a length of 2 cm, shown in yellow, 4 wires with a diameter of 0.41 mm and a length of 4 cm, shown in green, 1 wire with a dimeter of 0.6 mm and 6 cm in length, shown in red. This configuration includes 5 deployments and the surface reduction is 75%, which is the same as for the previous configuration. In addition, the folding procedure is performed the same as in Configuration 2). In Configuration 4), the arrangement of wires remains the same as Configuration c), while the folding procedure has been changed. In the first folding method, the lower vertices of the triangle have been folded outwards, unlike that which occurred in Configurations 2) and 3). The second and third step remained unchanged.
Figure 2 shows the folding step of a prototype in configuration 2 (a, b, c) and 4 (d, e, f).
Each configuration has been characterized by means of the final geometry attained after the shape recovery. Due to the softness of the solar sail, no contact measurement can be employed. For this purpose, a Next Engine Desktop 3D Scanner has been used. This device was based on multi-stripe laser triangulation: a multiple laser-stripes are projected by four solid state lasers with a wavelength of 650 nm and is registered through a 3.0 Megapixel CCD image camera. In order to preserve the final geometry, the sail has not been moved according to this procedure. The folded sail was positioned onto a measurement table. A 250 W infrared lamp was placed over the sail and the deployment process was executed (
Figure 3a, the last folding was the first that unfolds). The lamp was removed and the laser scanner unit was mounted on a supporting frame, which allowed an optical path perpendicular to the sail (
Figure 3b). This configuration allowed us to acquire the necessary point cloud by a single scan. Therefore, no merging operation was needed. It is well-known that the alignment and merging of data coming from different scans can affect the final accuracy since the change of the environmental light and the light path. The experimental conditions have been different from the real ones in the space. Although the aluminum foil has a thickness of 0.012 mm, the effect of gravity could affect the opening results. For this reason, the heating and the opening on Earth have been provided with the sail laying on a plane in order to give symmetry to the system.
The data acquired through the ScanStudio have been saved and opened in Geomagic Studio. This environment is dedicated to the full processing of point clouds and general pre-processing operations have been provided: the data have been cleaned by means of isolated points of the background and the original file format has been changed into Standard Triangulation Language (STL). The full customized elaboration has been designed in Wolfram Mathematica 11. This environment has been chosen for its ability to allow a full object-oriented management of mathematical data structures. The system used for the elaboration is a laptop with an Intel Core i7-8565U
[email protected], 16GB LPDDR3 installed memory, nVidia GeForce MX150 with 2 GB DDR5 memory. Required time: opening of the STL geometry 28 s, graphing of the rough geometry 52 s, rotation and translation of data with respect to the regression plane 8 s, plot of height deviations 18 s, contour plot of the height deviations 19 s, histogram of the height deviations 0.3 s, and vector plot of the normal 288 s.
3. Results and Discussion
The data structure has been loaded directly into Mathematica. The STL file has been divided into vertex and polygon data for point height and normal investigations, respectively. The original points for the first configuration are reported in
Figure 4a. The number of the vertices and triangles have been 367,390 and 731,371, respectively, which allow a spatial accuracy of about 0.1 mm. Since they are referred to the measurement system positioning, a rotation and a translation have been applied according to the points regression plane. In this case a slight rotation along x (2.27°) and along y (1.49°) showed a very symmetric deployment of the sails (
Figure 4b). Similar trends have been obtained for the other configurations.
After the alignment, the configurations were the ones reported in
Figure 5. It is evident that the behaviors are deeply different: the reached maximum height ranged between 11 mm (obtained at the fourth configuration) and 64 mm (at the second one). The representation scales are different to highlight local conditions. The main difficulty lies in the corner opening, which is completely achieved only by rightly combining the wire configuration and folding strategy.
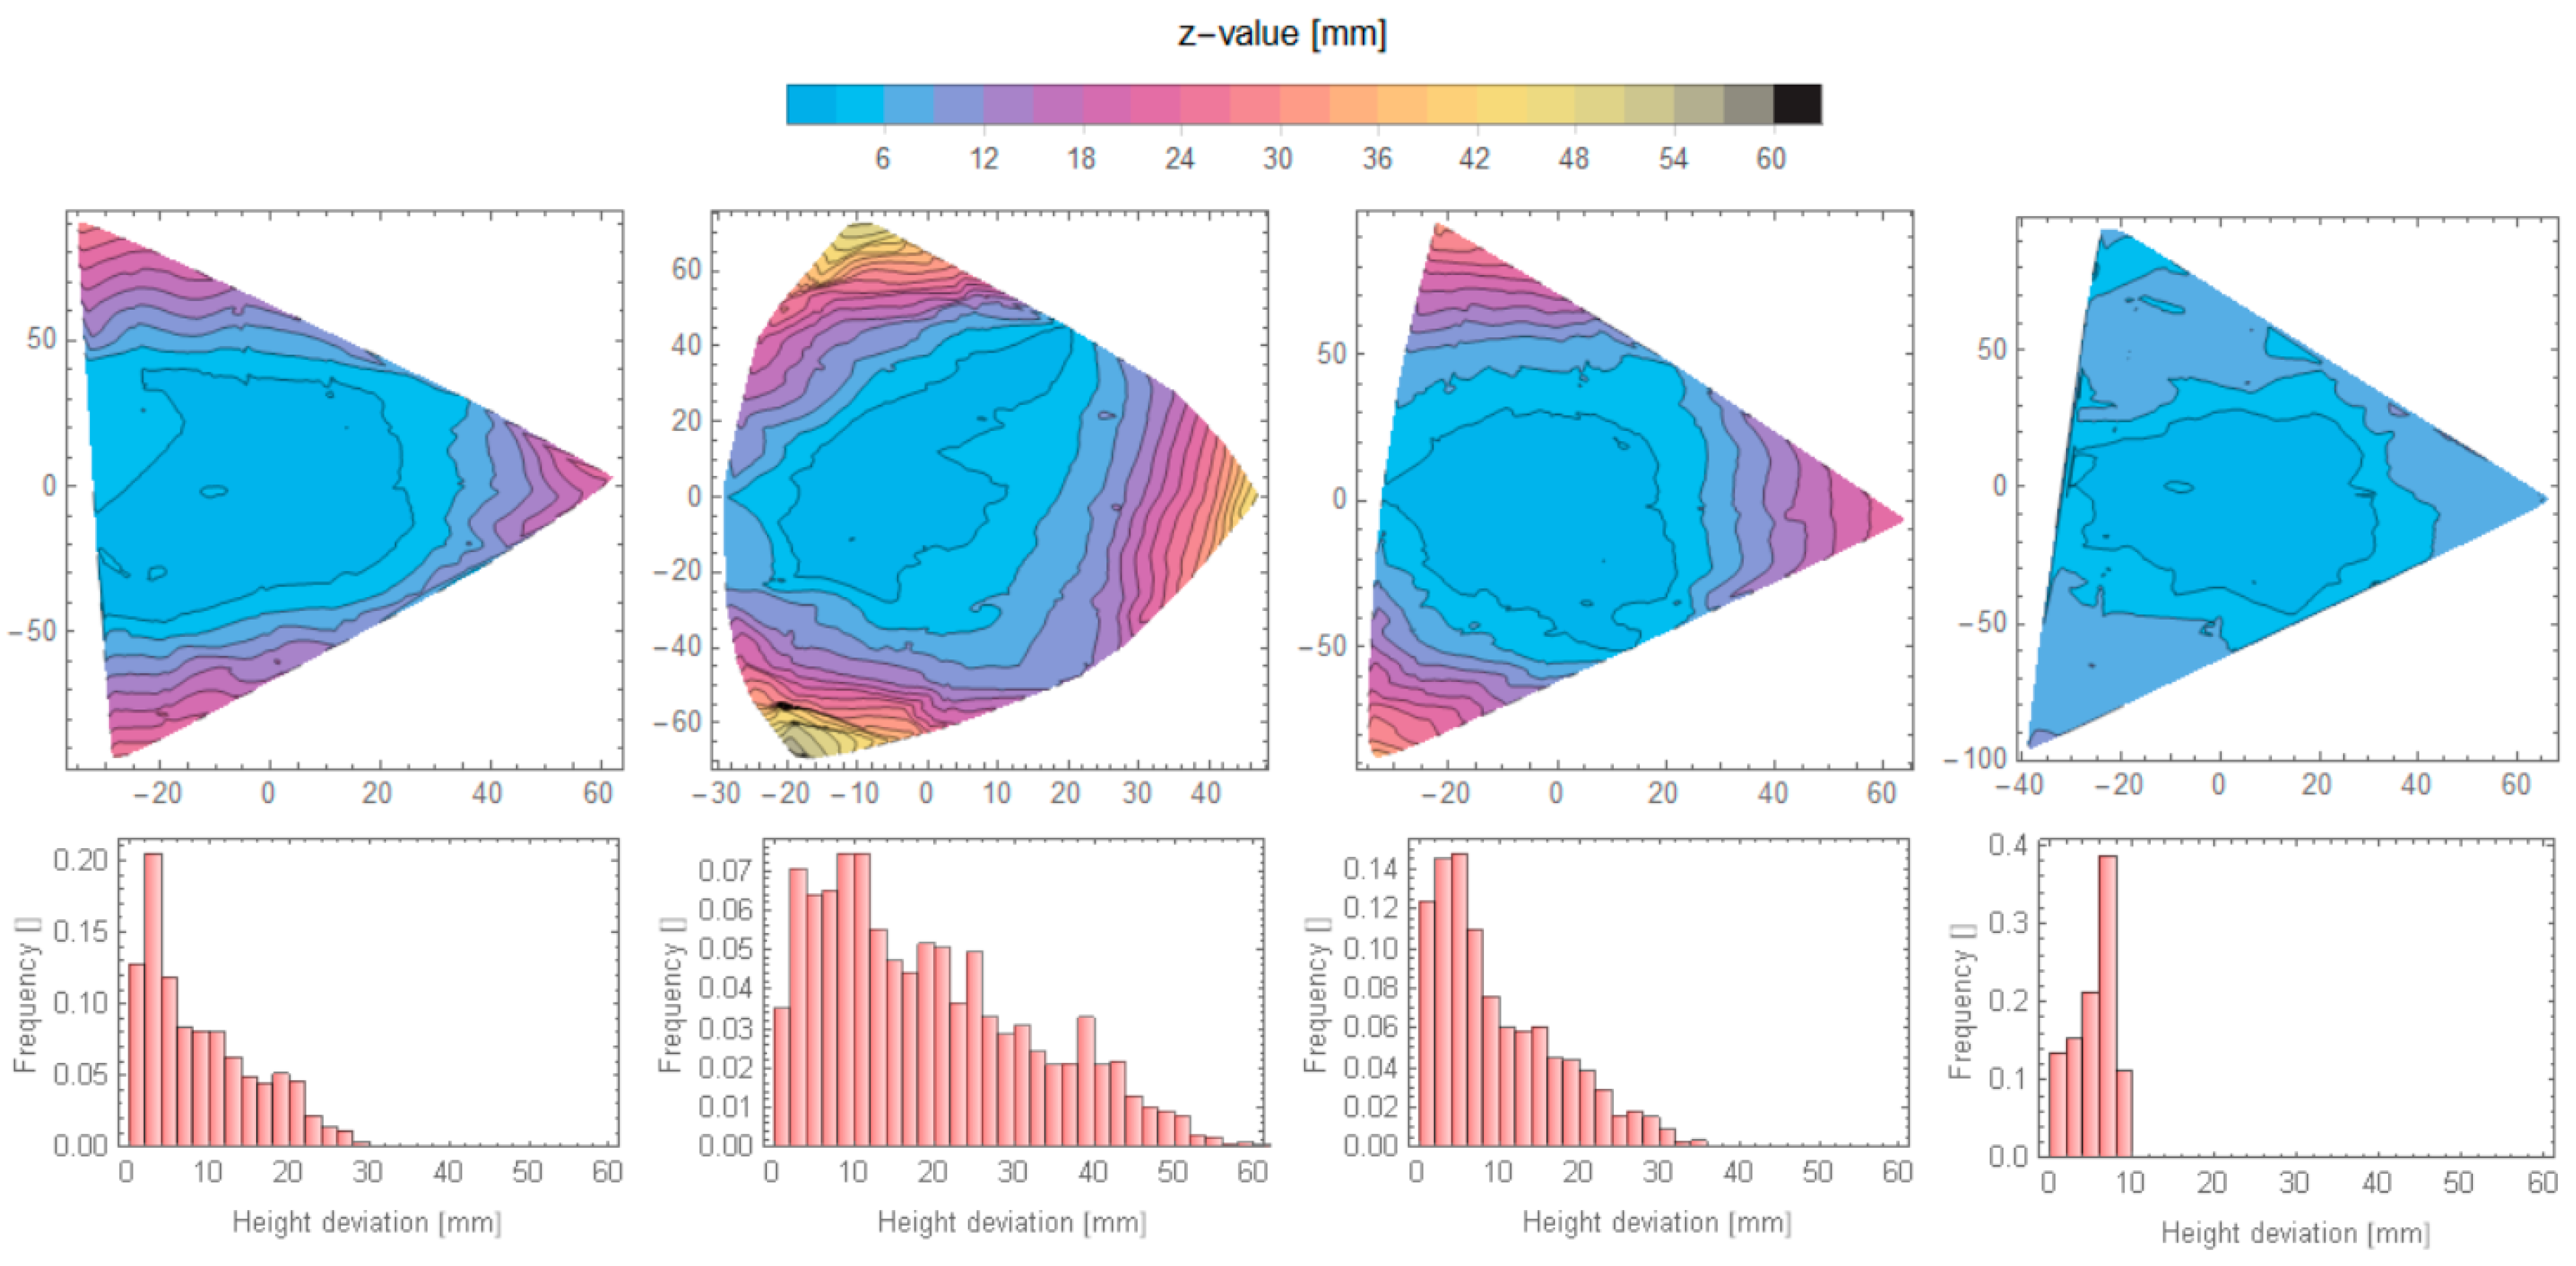
In
Figure 6, the contour graphs have been developed by using the same color scale. In this representation, it is evident that the first three configurations lack in corner complete opening: a long tail was showed in the histograms, which highlighted the needs for a further deployment. Conversely, the last configuration was characterized by a distribution with a main peak at 8 mm height: the sail was mainly flat with a central subsidence.
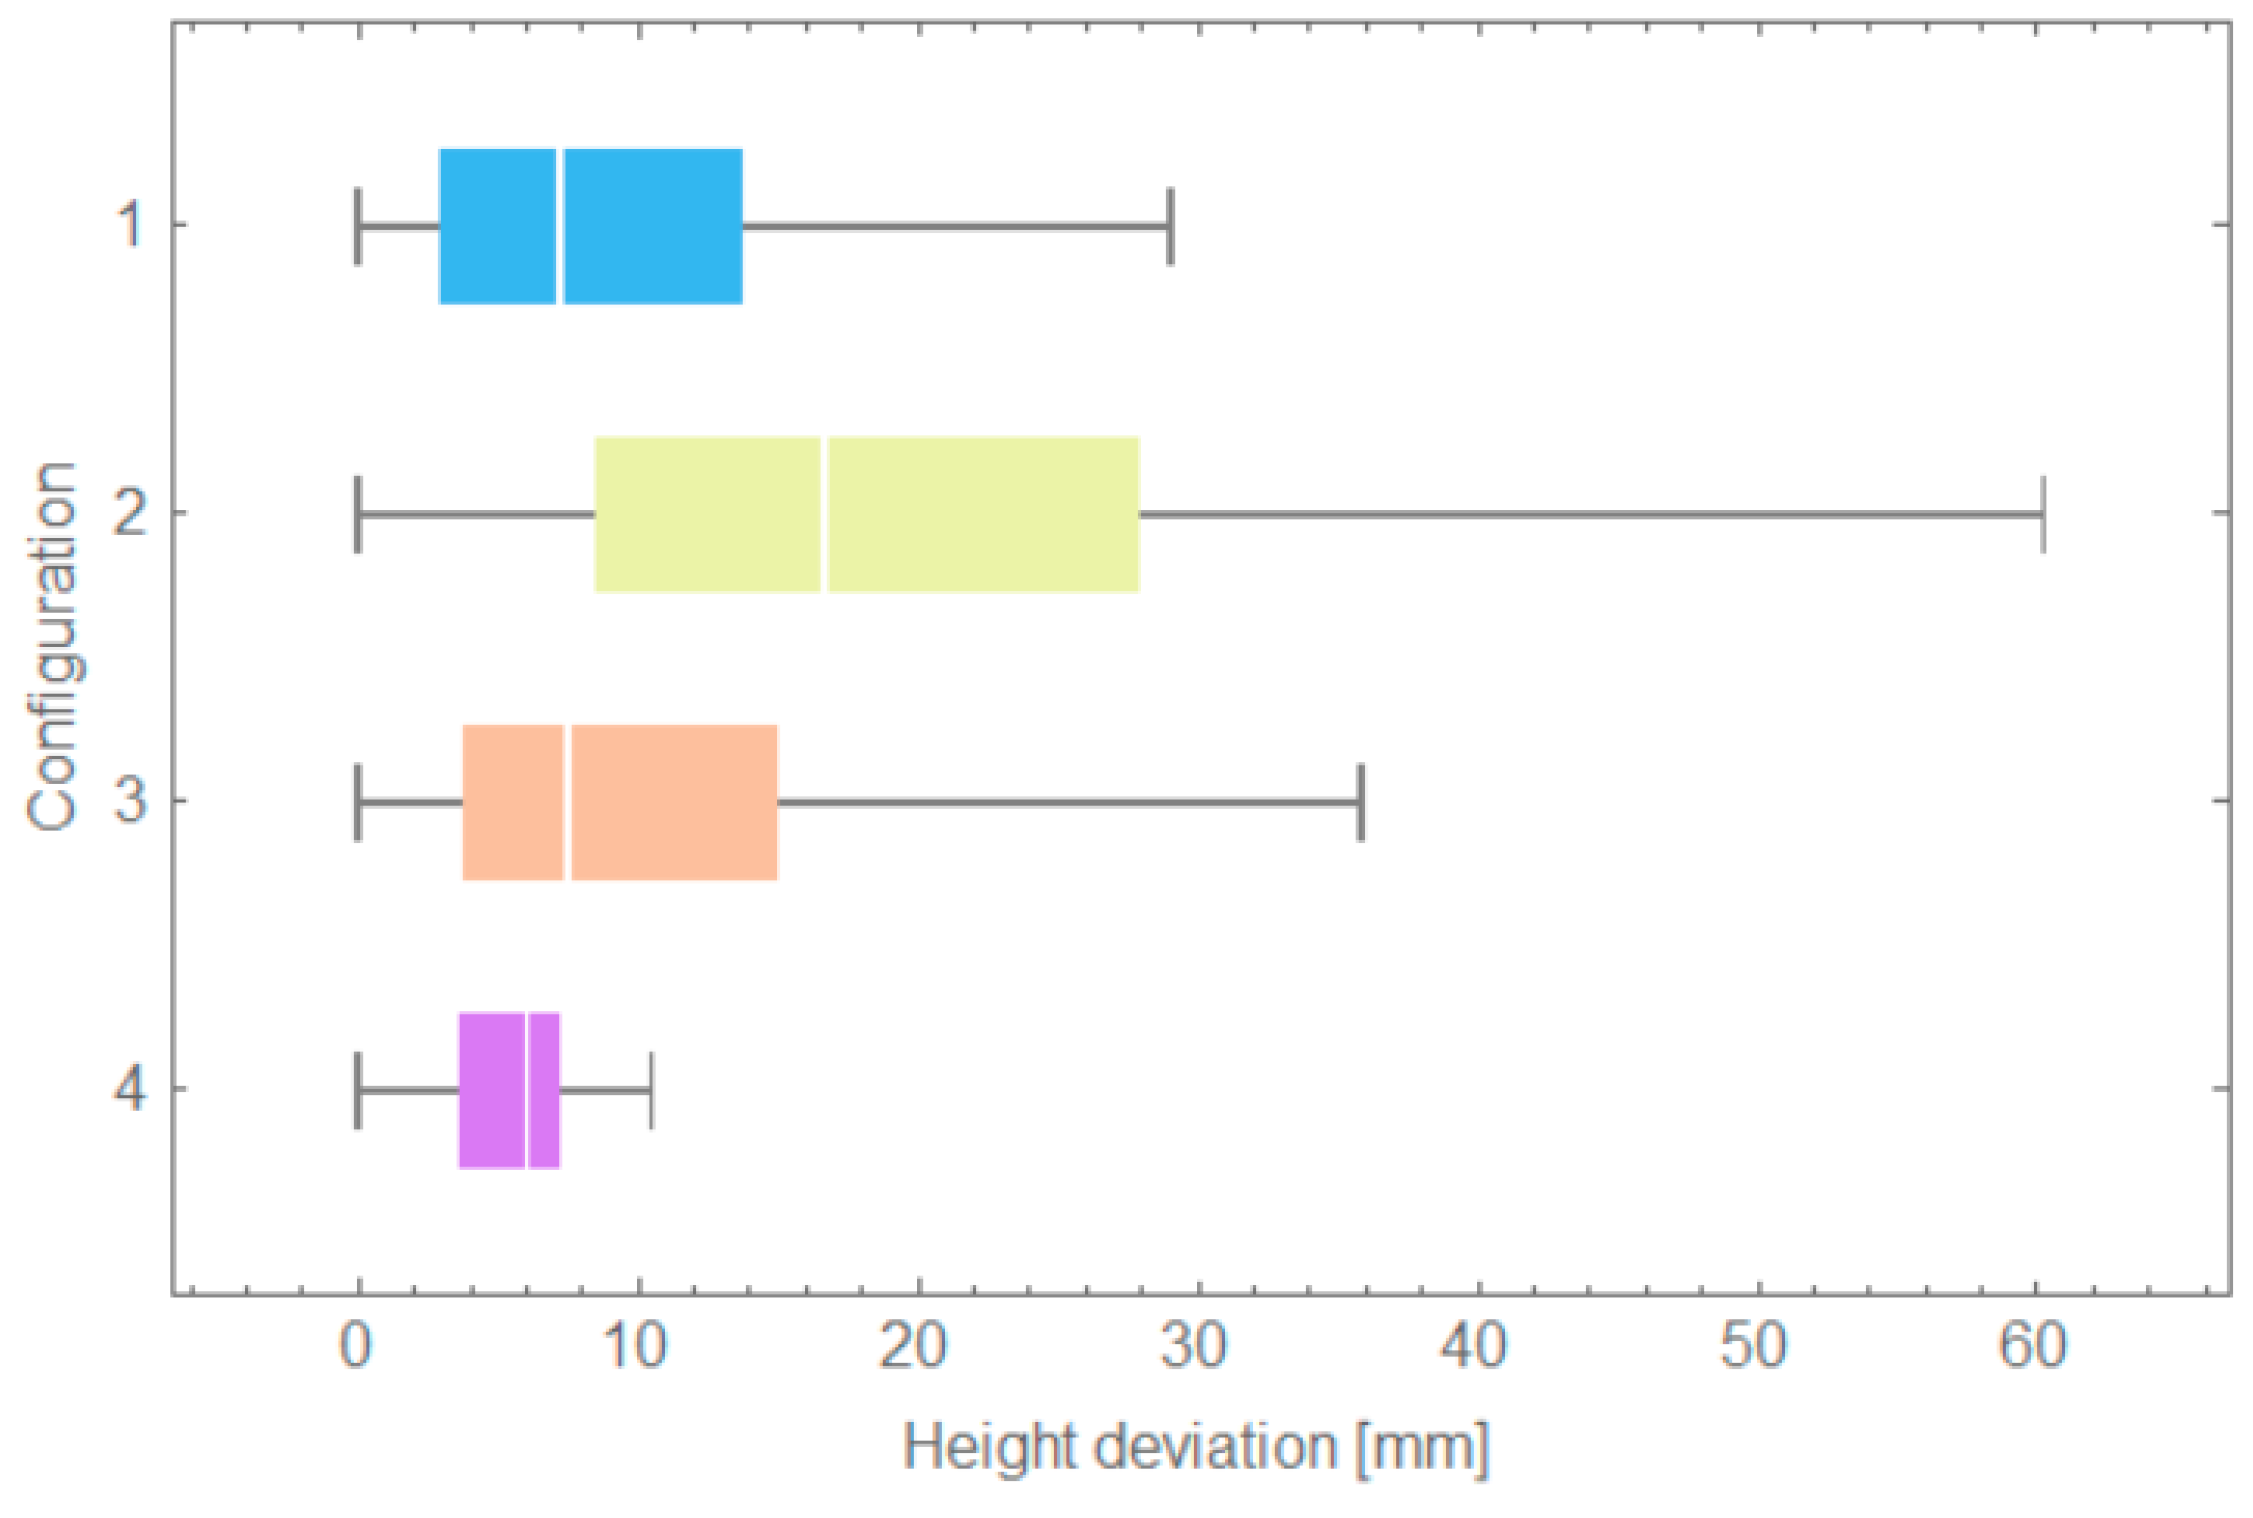
The four behaviors can be summarized by box and whisker diagrams (
Figure 7). The second configuration has shown the worst condition with more than 25% of the heights greater than 28 mm. The configurations 1, 3, and 4 characterized by about the same median (7.2 mm, 7.4 mm, and 6 mm, respectively), show deeply different configurations: only the fourth configuration has been symmetrical and, for this best outcome, it has been assessed that all the point heights lie in ±5 mm.
Now, the polygon data have been used to understand how the normal-to-the-surface are affected by the deployment. For the i-th triangle, the normal has been calculated according to Equation (1).
where p
ij are the triangle vertices. The angle
between the normal
and the axis z can be obtained by Equation (2).
where
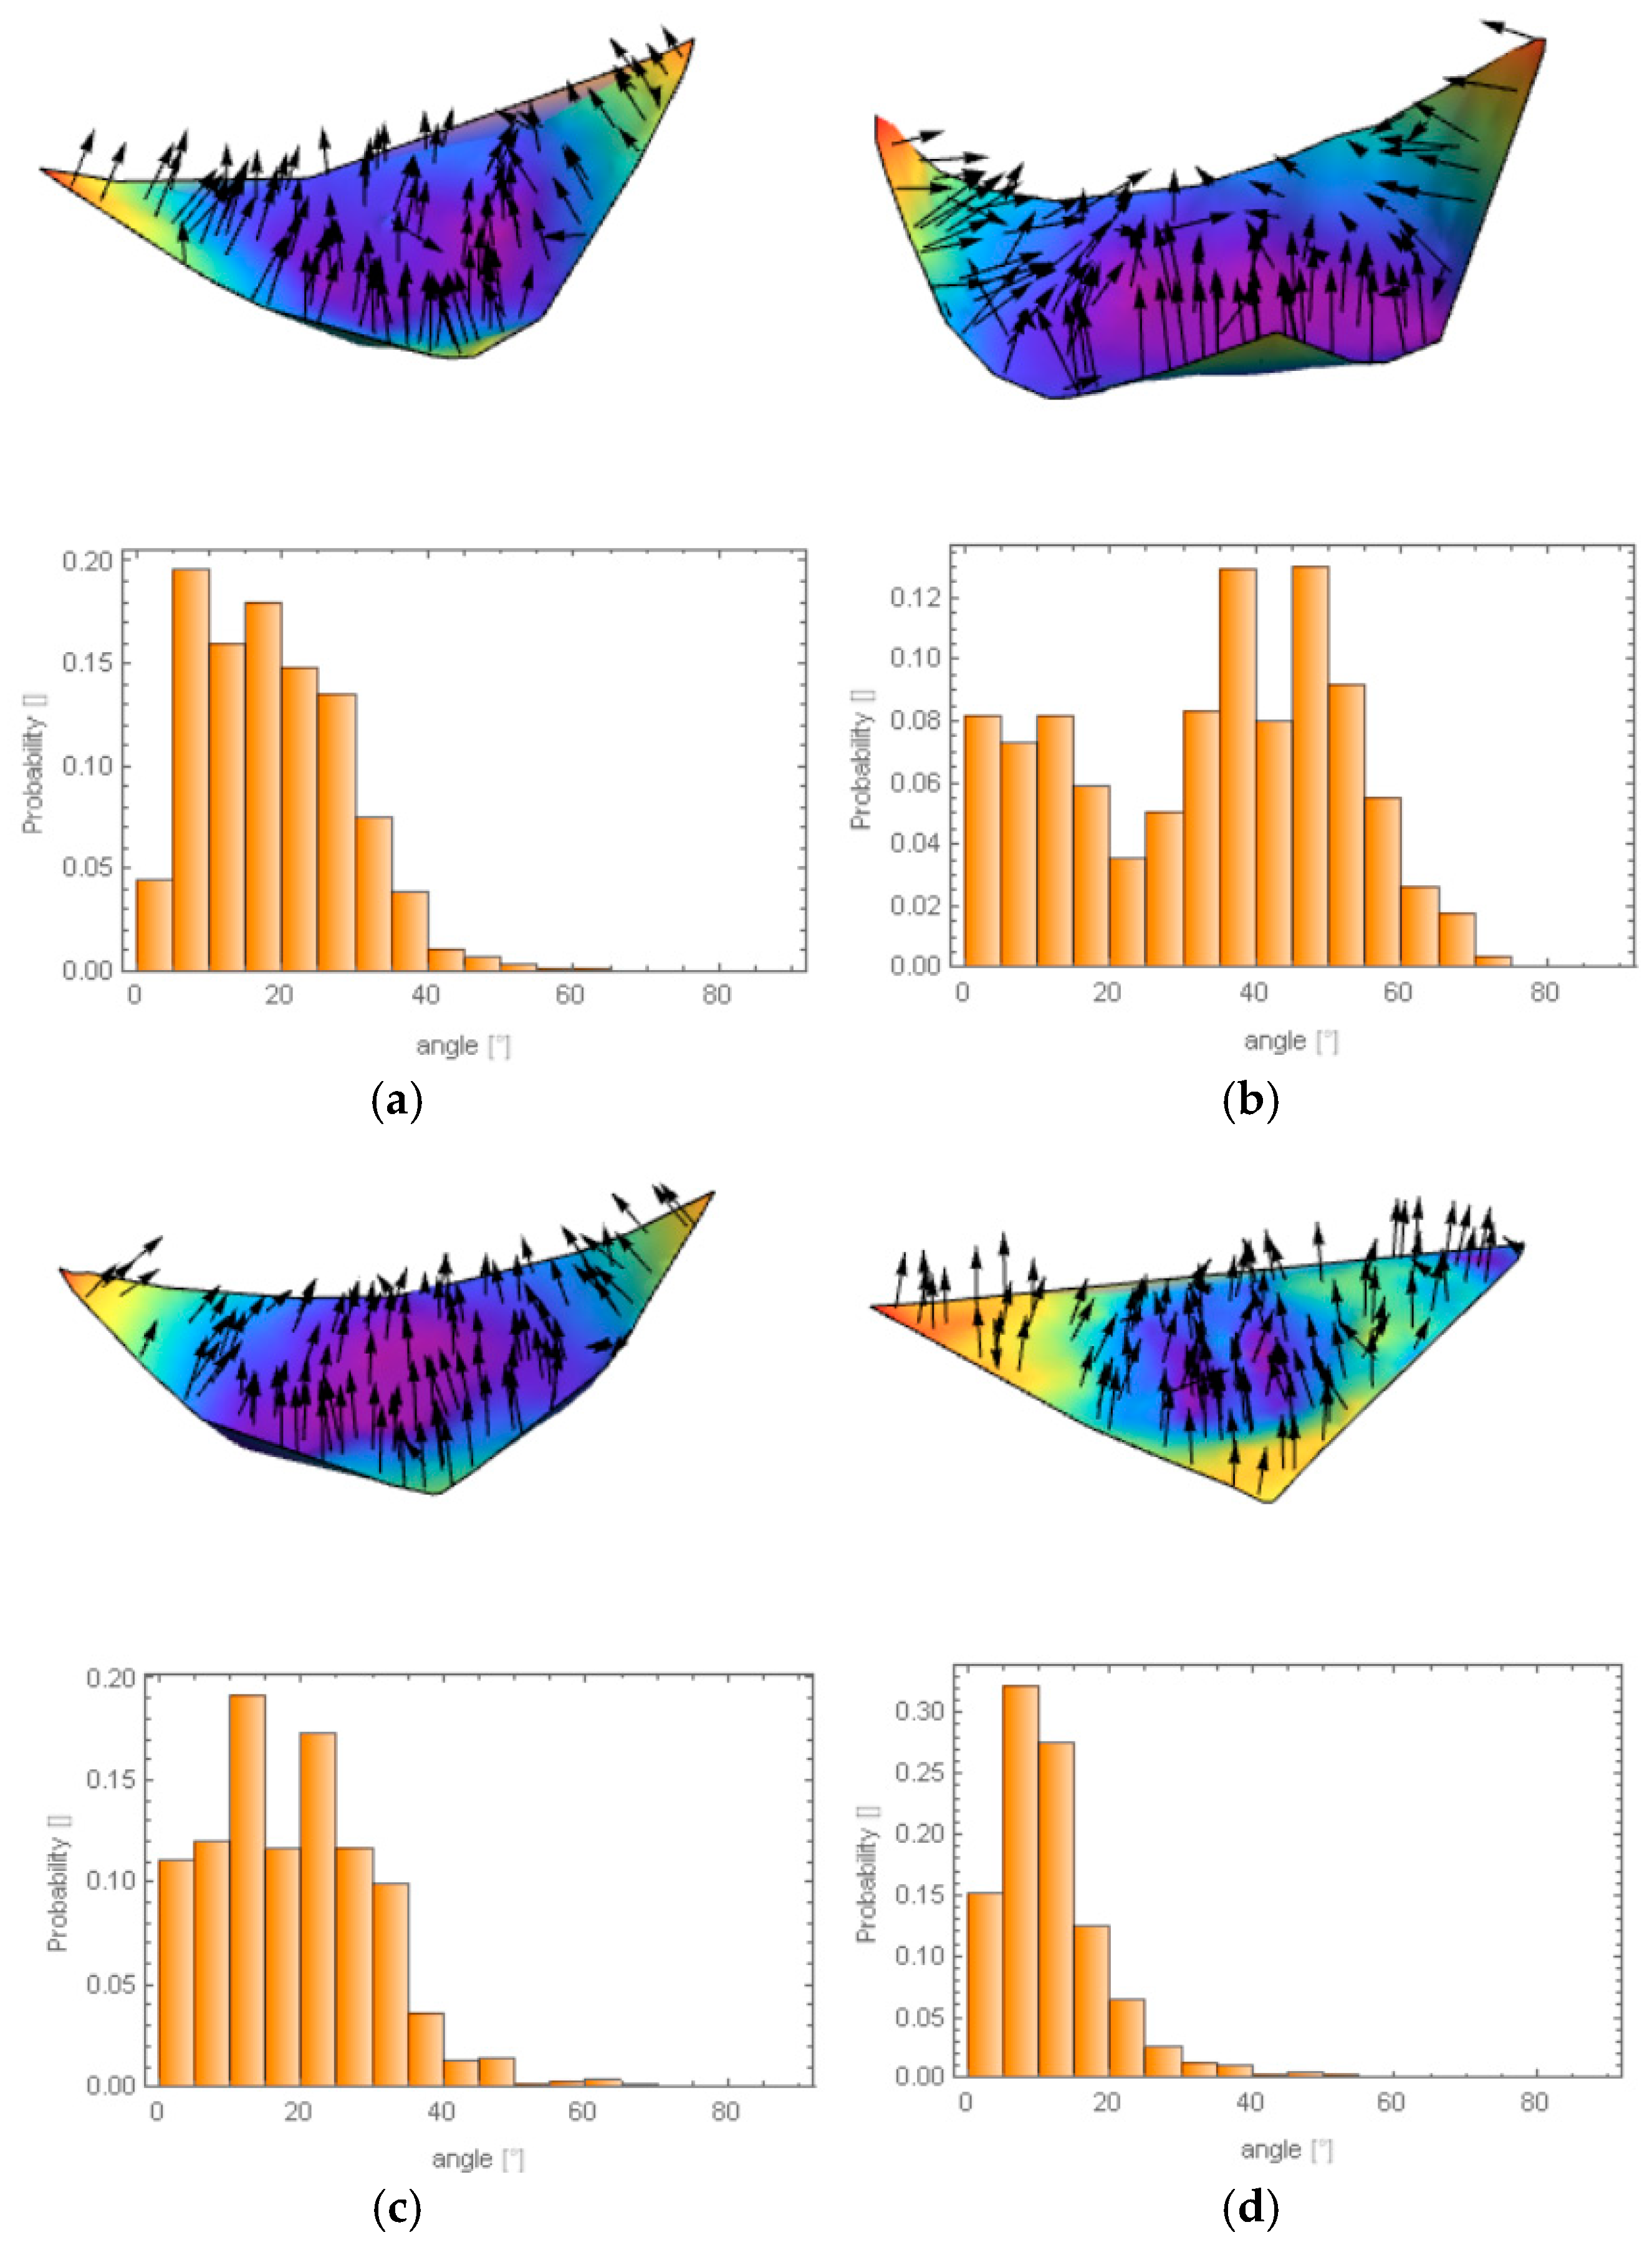
was the versor of the z axis. In
Figure 8, the vector field plots for the different sails have been reported. In order to take into account the area of the i-th triangle, the distribution of the angles has been weighted proportionally to this value, which has been calculated by Equation (3).
The outcomes, reported in the form of histograms in
Figure 8, have shown that the first and the third configurations have a similar normal distribution with the main peak at about 10° and the 80% peak at more than 28°. A mixed distribution has been observed for the second configuration, which claims that a partial deployment occurred. In this case, one half of the distribution has had an angle more than 36°. The best result has been obtained for the fourth configuration: 80% of the normal have an inclination angle less than 16° with a median at 10.5°. Some deviations from the vertical direction have been caused by the wires. In the surrounding area, a local pronounced deformation has been observed.
4. Conclusions
The final goal of this work has been to suggest an alternative method for the solar sail self-deployment based on shape memory alloys. The adoption of shape memory elements replacing standard electromechanical actuators can lead to a simplification of the solar sail systems and an associated weight reduction. Four prototypes have been manufactured and the deployed configurations have been analyzed by a Laser Scanner in order to measure the planarity degree and the critical areas. Four configurations of the solar sails, which are different for folding ways and surface reduction, have been analyzed by means of Box and Whisker diagrams, histogram, and level curves.
Configuration 1 has shown the lower surface reduction (52%) with a satisfactory planarity degree. In configuration 2, the surface reduction has increased (up to 75%) by changing the number of folding (five instead of three) but with worst planarity degree due to an un-optimized length of some SMA wires. In Configuration 3, the length and diameter of the wires have been optimized to reach a good planarity degree, which is similar to configuration 1 but with greater surface reduction. Lastly, in Configuration 4, with the same number and length of wire as Configuration 3, two of five folding sections have been outwards. The Box and Whisker diagrams have confirmed that, in Configuration 4, much narrower data when compared with the other ones have been detected and a lower data scattering from the regression plane have been associated. In addition, the histogram and the level curves have shown that the reached maximum height has been about 10 mm while, in Configuration 2, the highest difference (50 mm) has been detected. From the analysis of the level curves reported in
Figure 6, it has been possible to observe that the most critical areas are the vertices of the triangles in correspondence of which the greater height from the regression plane has been found. From this point of view, the optimization of the folding ways, the number and length of the SMA wire has been successful, which allows us to manage a sail configuration with the following features:
When adopting Laser Scanner reverse engineering, it is possible to optimize the sail deployment or study new configurations minimizing the number of experiments.


