Concept Paper

A Collaborative Approach for an Integrated Modeling of Urban Air Transportation Systems

1
Deutsches Zentrum für Luft- und Raumfahrt (DLR), Lufttransportsysteme, 21079 Hamburg, Germany
2
Deutsches Zentrum für Luft- und Raumfahrt (DLR), Institut für Systemarchitekturen in der Luftfahrt, 21129 Hamburg, Germany
3
Institut für Lufttransportsysteme, Technische Universität Hamburg (TUHH), 21079 Hamburg, Germany
*
Authors to whom correspondence should be addressed.
These authors contributed equally to this work.
Aerospace 2020, 7(5), 50; https://doi.org/10.3390/aerospace7050050
Submission received: 17 March 2020 / Revised: 15 April 2020 / Accepted: 20 April 2020 / Published: 28 April 2020
(This article belongs to the Collection Air Transportation—Operations and Management)

Abstract

:
The current push in automation, communication, and electrical energy storage technologies has the potential to lift urban mobility into the sky. As several urban air mobility (UAM) concepts are conceivable, all relevant physical effects as well as mutual interrelations of the UAM system have to be addressed and evaluated at a sufficient level of fidelity before implementation. Therefore, a collaborative system of systems modeling approach for UAM is presented. To quickly identify physical effects and cross-disciplinary influences of UAM, a pool of low-fidelity physical analysis components is developed and integrated into the Remote Component Environment (RCE) workflow engine. This includes, i. a., the disciplines of demand forecast, trajectory, vertiport, and cost modeling as well as air traffic flow and capacity management. The definition and clarification of technical interfaces require intensive cooperation between specialists with different areas of expertise. To reduce this communication effort, the Common Parametric Aircraft Configuration Schema (CPACS) is adapted and used as central data exchange format. The UAM system module is initially applied for a 24-hour simulation of three generic networks in Hamburg City. After understanding the basic system-level behavior, higher level analysis components and feedback loops must be integrated in the UAM system module for evaluation and optimization of explicit operating concepts.

1. Introduction

Recent technology advances in automation, communication, and electrical energy storage enable new air transport options which have the prospect to radically boost urban mobility. However, the implementation of new urban air transportation concepts faces a great number of barriers. The technology push of new aircraft concepts generates great challenges regarding safety and security. As the number of flights is expected to grow by orders of magnitude [1,2,3], new air traffic control (ATC) architectures are needed for low altitude operations to address this increase in complexity. Another critical aspect is the public, societal acceptance of urban air mobility (UAM), particularly if UAM operation is not affordable to everybody and advantages (in particular of traffic times) and disadvantages (e.g., noise, pollution and the invasion of privacy) vary too widely in-between different social classes. To handle these challenges, collaboration and cooperation between manufacturers, air navigation service providers, lawmakers, and civil-society actors are mandatory from the early beginning.
First, companies and research institutions have already developed roadmaps and blueprints for UAM [4,5,6,7,8]. However, only a small fraction of these ideas and concepts will prevail and be implemented. Therefore, a detailed cost–benefit analysis of these concepts is necessary, taking all relevant physical and social effects with sufficient fidelity into account as well as the mutual interactions of the entire urban air transportation system. A first idea of how to model the entire UAM System is presented in [9]. The present study aims at developing a system capability for the evaluation of different UAM concepts. The short-term goal of developing a UAM system module is to perform comparative analyses of different subsystem designs for the quantifcation of cause–effect relationships on a system level. In the long term, the UAM system module should enable the derivation of key figures for specific UAM market studies. The activities carried out in this paper are highlighted in red in Figure 1.
The first steps to create a new UAM model system from scratch is to collect potential system features and to define the requirements and dependencies of the system (see Figure 1). For the identification and prioritization of cause–effect relations, knowledge of various disciplines has to be linked, which requires intensive cooperation between all parties involved. However, neither the final result—What is the best design for the not yet existing urban air transportation system?—nor the way to get there—What is the best way for the identification and quantification of unknown system dependencies?—are clear. According to the Cynefin framework, which classifies situations, projects, or systems into five domains (obvious, complicated, complex, chaotic, and disorder) to quickly understand the context of operating [10], UAM modeling can therefore be seen as a chaotic project until the level of understanding is increasing (see Figure 2). What is certain is the need for UAM safety standards, which can be related to the risk management framework of civil aviation like the Specific Operations Risk Assessment for Drones (SORA) [11]. However, key challenges like the simultaneous conduction of different UAM services that possibly require cooperation in between and coordination with conventional air traffic control, are not yet addressed by SORA.
To minimize the effort of changing individual analysis methods within the process, the overall model system to be developed should have a modular structure.
In this work, a collaborative system of systems modeling approach is selected and presented in Section 2. Section 3 introduces the developed UAM model system, provides background on individual analysis components, and presents preliminary results: the current state of the UAM system module is applied for the simulation of three generic UAM networks in the metropolitan area of Hamburg, which differ in the number of connected districts and routes. The paper ends with conclusions and an outlook on future work in Section 4.

2. Collaborative Approach for Modeling the Urban Air Transportation System

UAM is associated with both strongly economically motivated promises of use and a wide-ranging problem awareness including legal, ethical as well as safety and security-related issues. Many of these challenges have been addressed individually in recent years. A comprehensive literature analysis regarding promises of use and implementation barriers of urban drone delivery and urban passenger transportation is provided by [12,13]. An overview of current research and developments in UAM is given by [14]. In aeronautical research, for instance, various scientific publications deal with the modeling of UAM sub-disciplines, like UAM demand prediction [15,16,17,18,19], urban airspace management [20,21,22,23,24,25], vehicle design [17,26,27], vertiport design and integration [18,19,24,25,28,29,30], trajectory and network simulation [17,18,30,31,32,33,34], scheduling and de-conflicting [23,25,32,33], cost and revenue modeling [17,19] as well as environmental impact assessments like energy demand [17,25,26,27] and noise evaluations [24,29]. In [17], for instance, the effects of various vehicle power system architectures on the performance of a UAM network were investigated over a metropolitan area. In [19], UAM services were integrated into an existing transport model of the Munich Metropolitan area to analyze the sensitivity of UAM modal share on ticket fares, cruise speed and turn-around times. In total, however, there is a very limited number of interdisciplinary studies on urban air transportation systems.
To overcome the challenge of understanding and modeling the complex, not yet existing, UAM system, collaborative approaches are necessary that combine the knowledge of specialists and system integrators and map the relevant physical effects of UAM. However, a multidisciplinary design and optimization (MDO) of a complex system of systems does not only require a technical approach, which helps the design teams to combine their disciplinary analysis capabilities (2nd MDO generation). In addition, methods of collaboration in teams and knowledge management are mandatory that also integrate experts and their implicit knowledge into the design and simulation process (3rd MDO generation) [35].
The UAM modeling approach of this paper is therefore based on two pillars: For connecting the disciplinary analysis capabilities, the DLR integration software RCE (Remote Component Environment) is used [36,37], which are in favor of improving reusability of multidisciplinary processes. The RCE workflow engine enables the integration of standalone components, with defined inputs and outputs, from local and remote locations into one overall system simulation (compare Figure 3). After establishing a peer-to-peer network, each user can access and execute individual components as a black box, including those running on remote machines. The ability to execute workflows for system modeling based on distributed “black-boxes” facilitates cross-company collaboration without jeopardizing intellectual property. Provided that all input data are available, each component is capable of execution, enabling a simultaneous processing among several computation instances, resulting in a reduction of total simulation time. The RCE software package, freely distributed under open-source license, has already proven its worth outside DLR (especially in the field of unconventional aircraft design) for designing, analyzing and optimizing complex systems.Within the EU-funded AGILE project (Aircraft 3rd Generation MDO for Innovative Collaboration of Heterogeneous Teams of Experts), for example, the integration software RCE has been used in an international consortium, comprising 19 partners from Europe, Canada and Russia, with the objective to collaboratively develop optimized aircraft of high complexity [38]. A selection of representative projects is provided by [37,39].
The essential step in tool integration is the definition of the interfaces between the individual components (input/output definition). If a standardized data model, like the XML based data definition of CPACS (Common Parametric Aircraft Configuration Schema) [41], is used for systems design, the number of interfaces between simulation models can be significantly reduced and, hence, the efficiency of cooperation effort [42]. In Figure 4a,b, these benefits are shown in comparison to an n · ( n 1 ) approach.
The focus of the second pillar is to install a collaborative way of working and to enable communication among scientists with different fields of expertise. “Design Camps” are conducted on a regular basis organized in a series of moderated sessions (for discussion, clarification of technical interfaces and data exchange) among all participants and unmoderated work (for calculations, data research and documentation) in small teams. As urban air mobility has to be designed and modeled from the first sketch to the overall system, interdisciplinary cooperation is of outstanding importance [35]. Applying the fundamentals of concurrent engineering, it was possible to significantly shorten the time for finding reasonable compromises complying with conflicting boundary conditions by working together with physical presence.

3. Urban Air Transportation Model System

The following section presents the developed UAM system model in the current state and the near-future enhancements. Individual analysis components are described in detail and are initially applied in Section 3.2, Section 3.3, Section 3.4, Section 3.5, Section 3.6, Section 3.7, Section 3.8.

3.1. General Setup

The initial step to set up a new model system is to agree on a single data format and a N2-chart that defines the interfaces and connection data between planned and existing components (UAM system elements). Both decisions were made at the initial UAM Design Camp in September 2018 in Hamburg [43]. In the process of forming an N
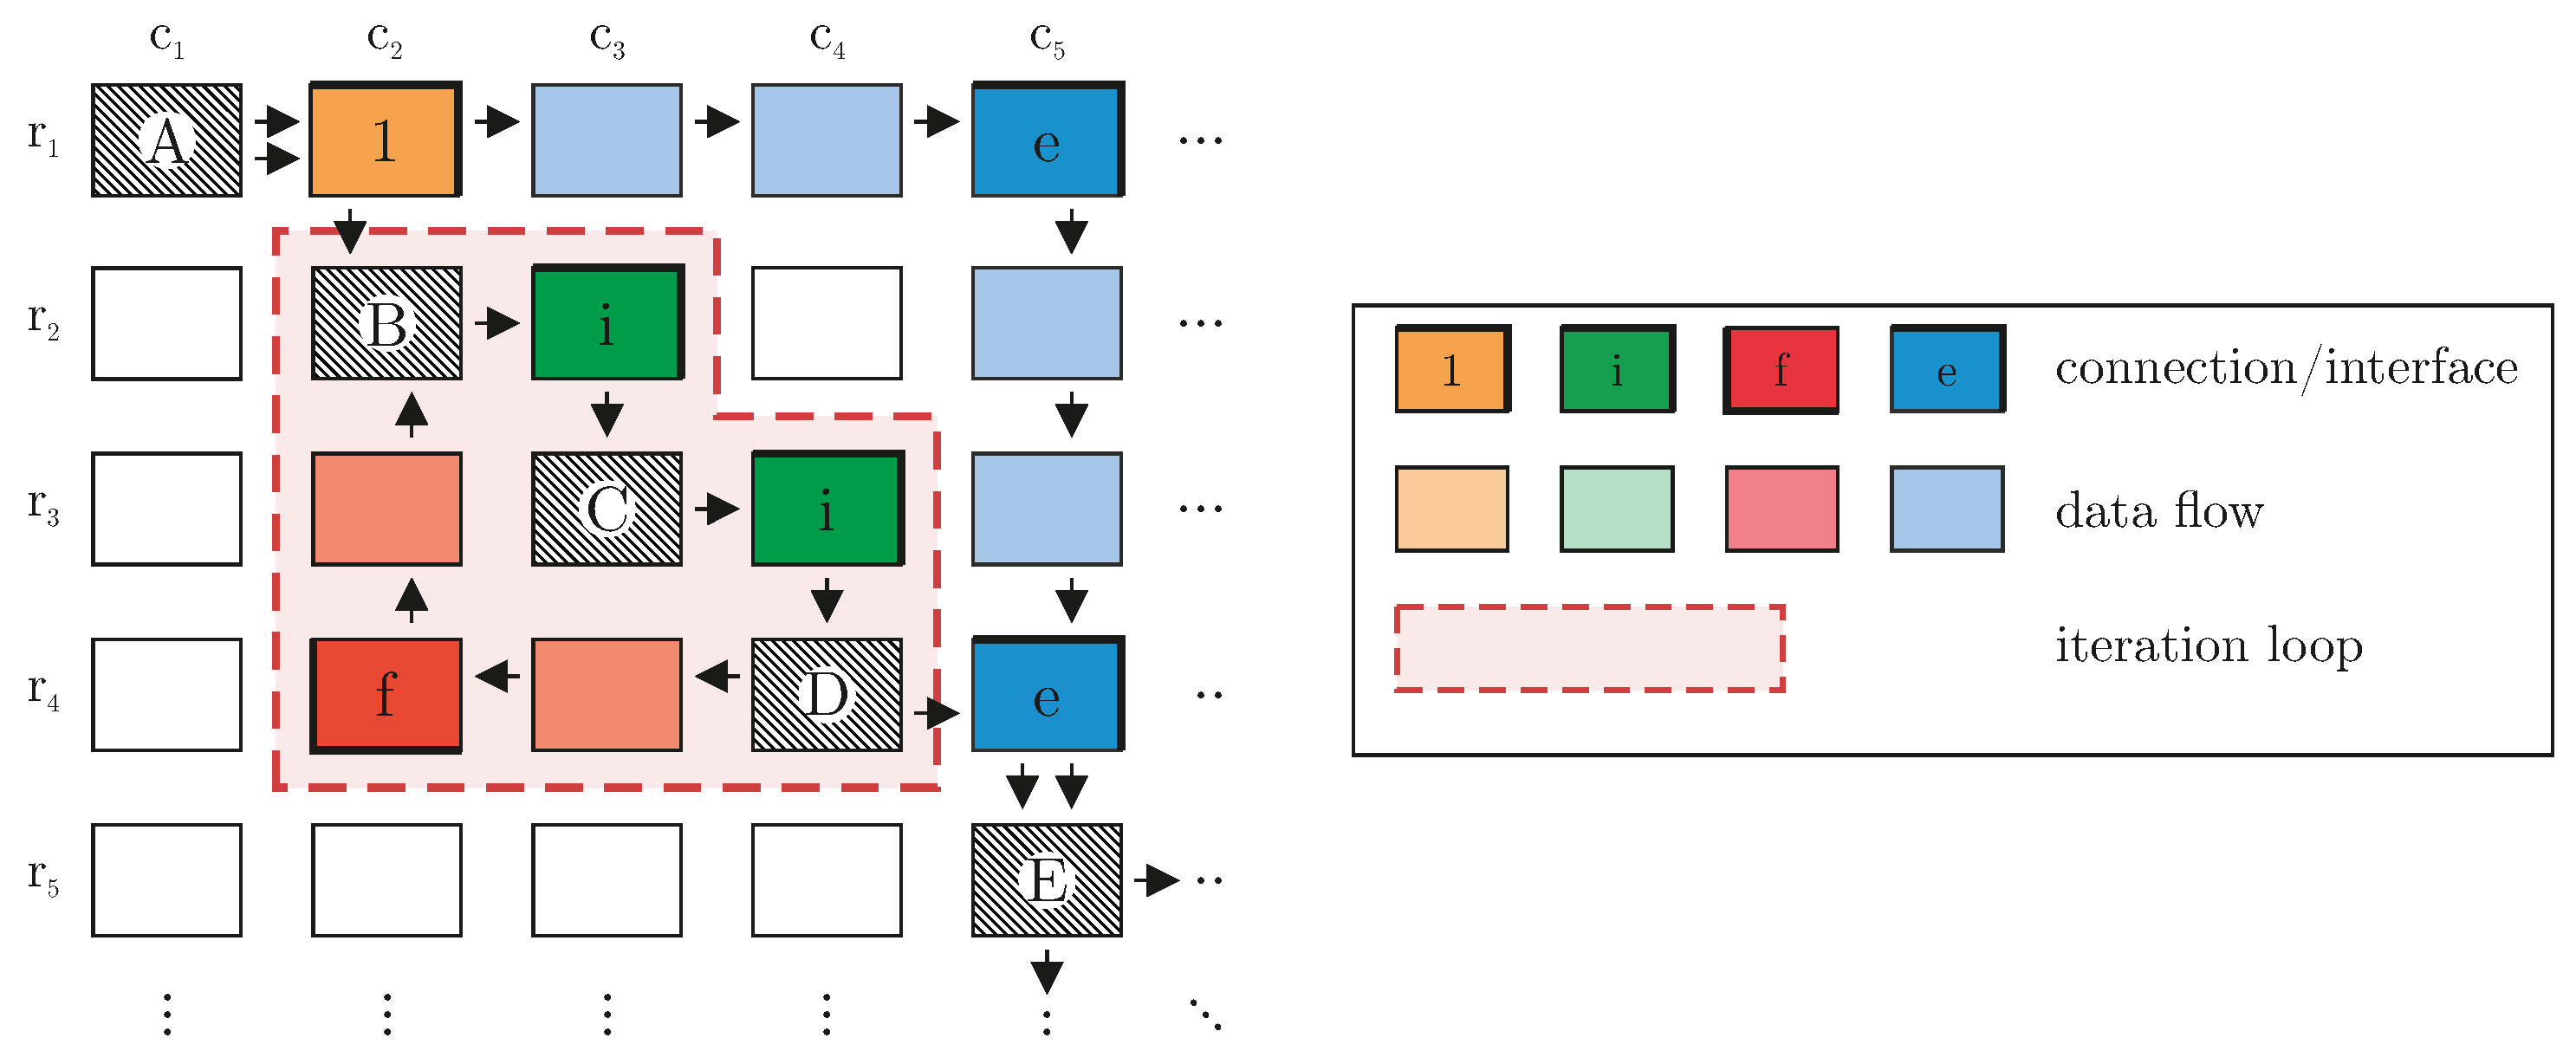
2-chart (see Figure 5), first the N system components are sequenced on the diagonal elements of the matrix, subsequently the identified interdependencies and interactions between these components are marked by off-diagonal elements in the diagram.
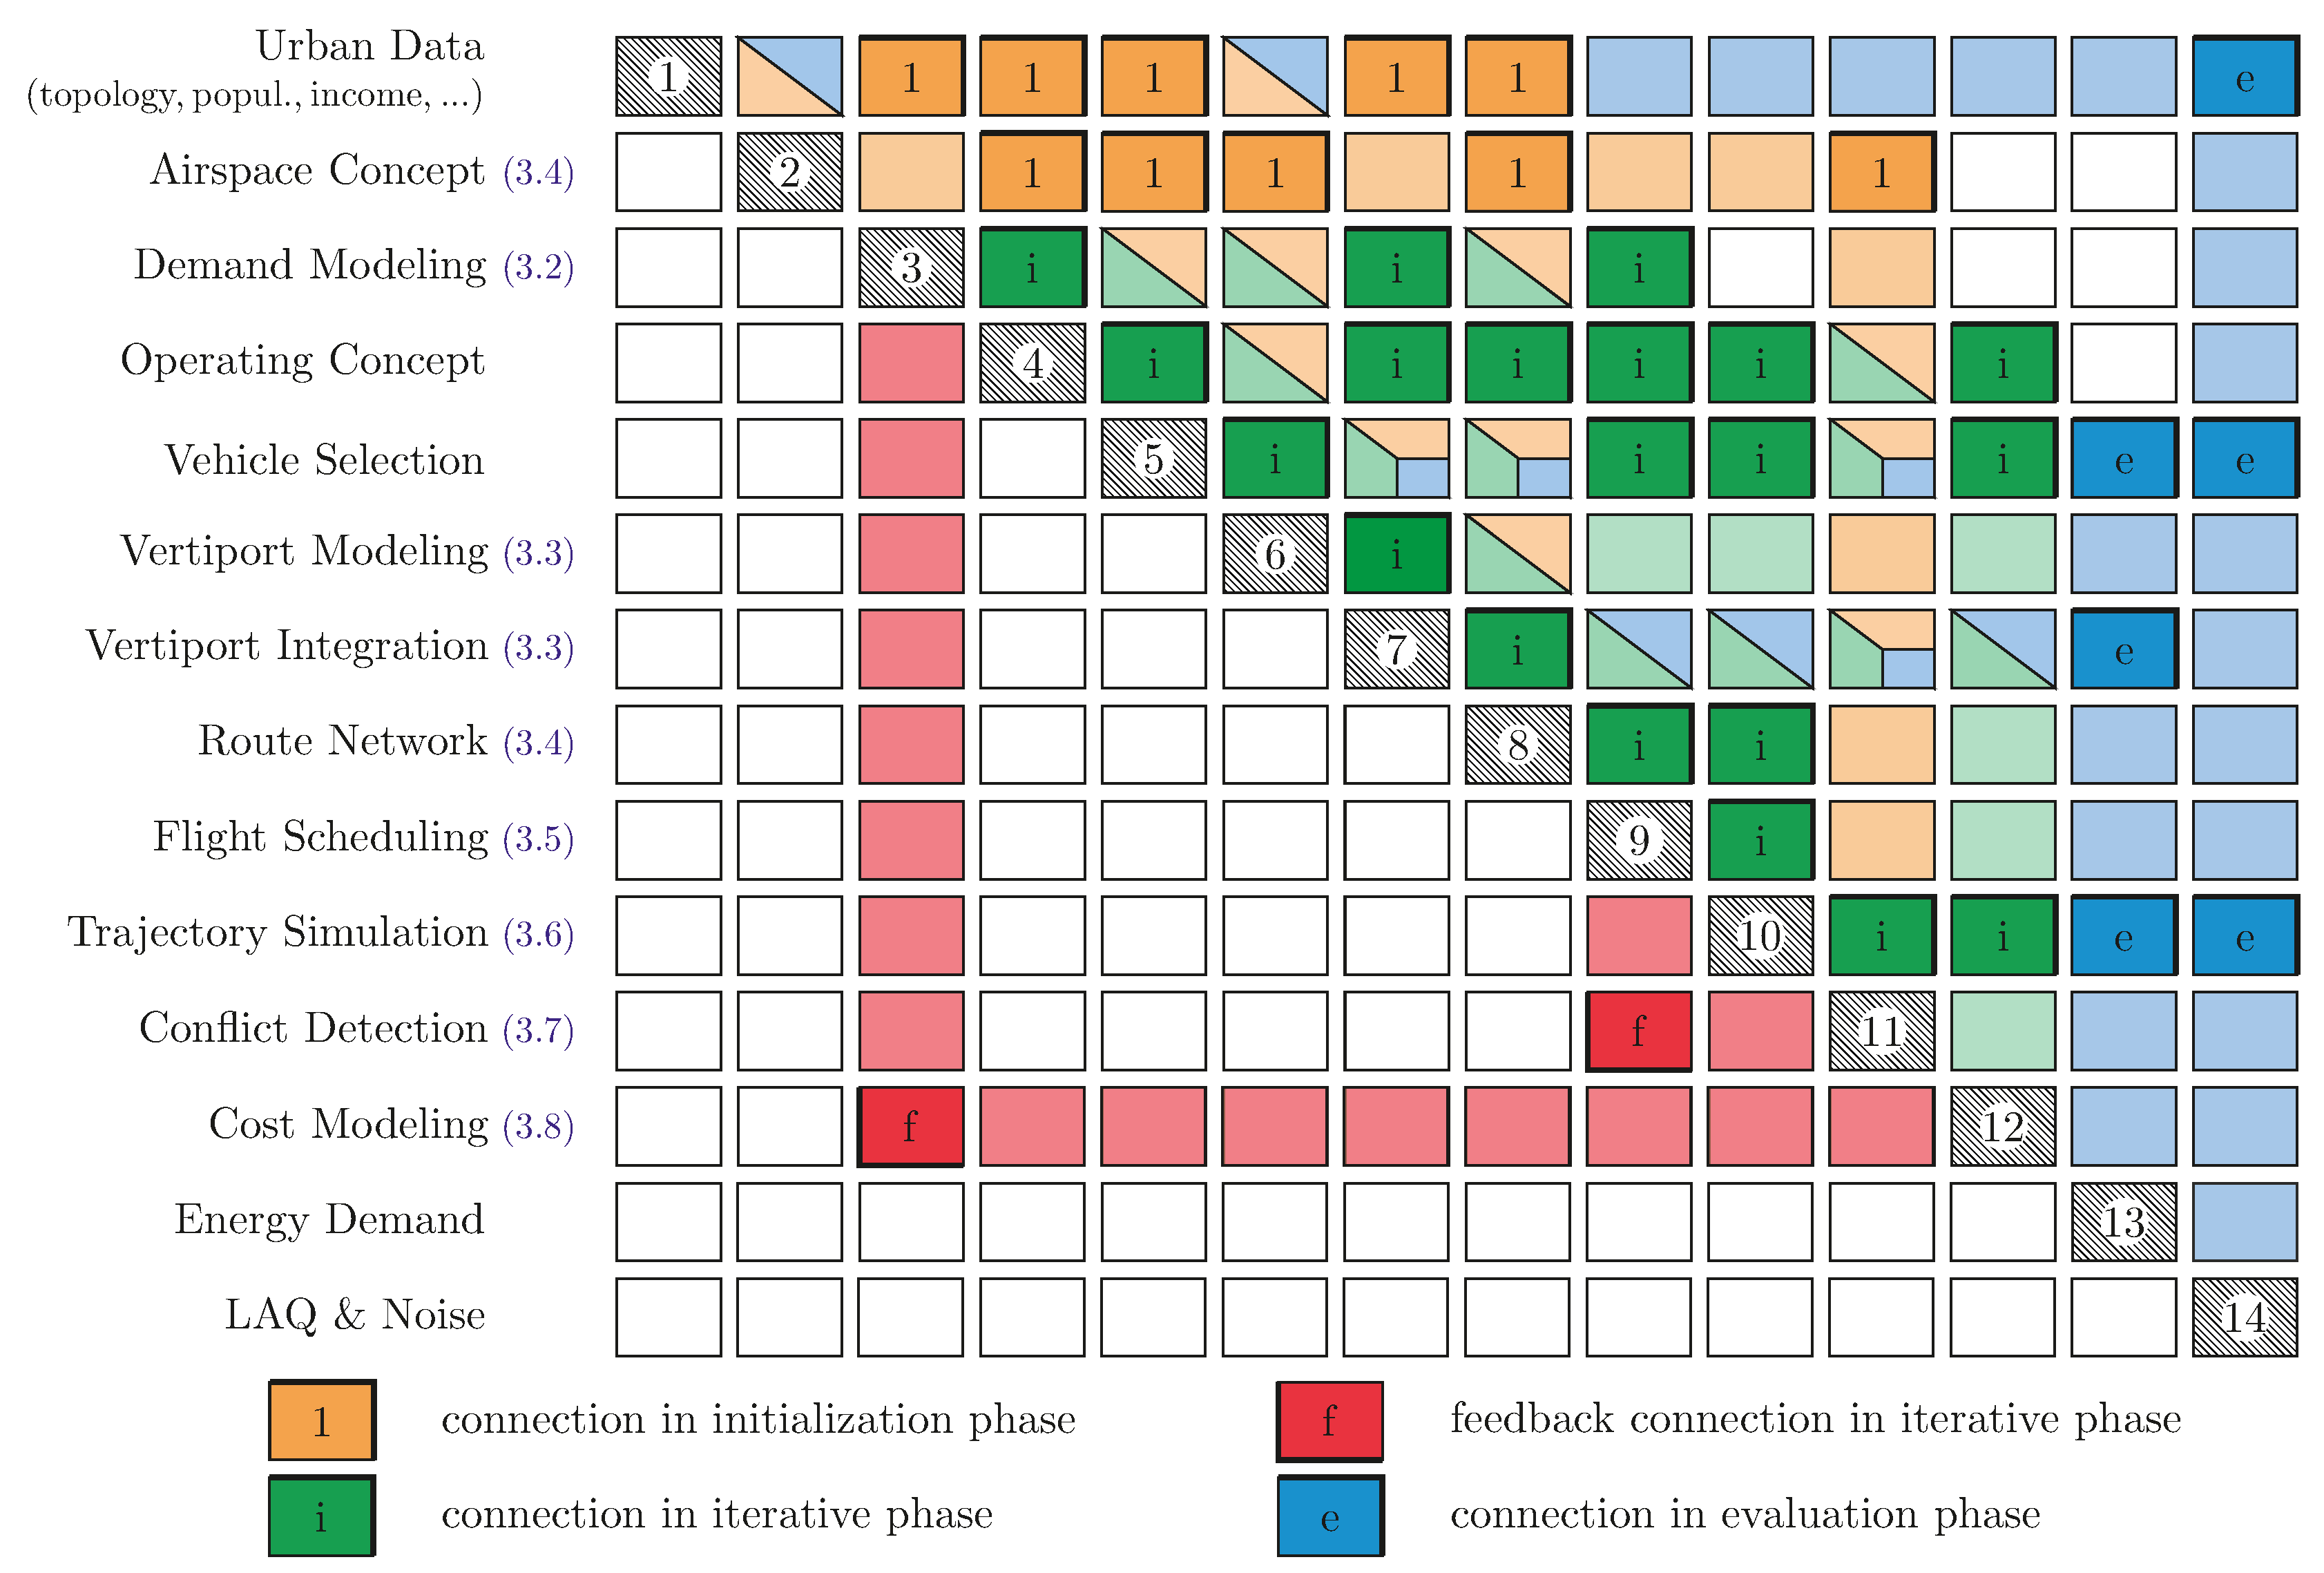
A first overview of the 14 components and the agreed N2-chart map is presented in Figure 6. The applied color code highlights the logical segmentation of the planned UAM workflow into three main phases: initialization phase (orange), iterative phase (green and red) and evaluation phase (blue). During the initialization phase, all relevant data for starting the iteration mode are obtained and calculated. After the iteration loops have passed all cycles, the evaluation phase begins, in which derived results are assessed regarding various criterions. Interdependencies between components (diagonal elements) are marked by four different entries which classify the data connection into ‘initial’, ‘iterative’, ‘evaluation’, and ‘feedback’-information. The symbols ’1’, ’i’, ’e’ indicate a single or recurring data transfer between two components and are positioned above the diagonal. An initial input of component n to m, for instance, is represented by a symbol ‘1’ in row n and column m. In the example shown in Figure 5, component A serves as initial input (’1’) for component B and, thus, as initial input for the iteration loop marked by a red dashed line, inducing the iteration mode. The iteration mode is performed in several cycles until a target condition (e.g., min. deviation or max. number of iteration) is reached. Each cycle is composed of an iterative forward connection (’i’, marked in green above the diagonal), like the input from B to D via component C, and of a feedback connection (’f’, marked in red below the diagonal) in reverse direction, such as the feedback from component ’D’ to component ’B’ in Figure 5. After the iteration loops have passed all cycles, the evaluation phase begins. Here, components A and D serve as input (’e’) for component E. For a better readability, the rows and columns containing a data flow between components are highlighted with faded colors of the same shade as the corresponding connection symbol (see i.a. the data flow from component A ( r 1 c 1 ) to E ( r 5 c 5 ) via connection ’e’ ( r 1 c 5 ) in Figure 5). In the case of various data flow types, the highlighted area might be assigned to two or more connection types, visualized by split fields in terms of color (see Figure 6).
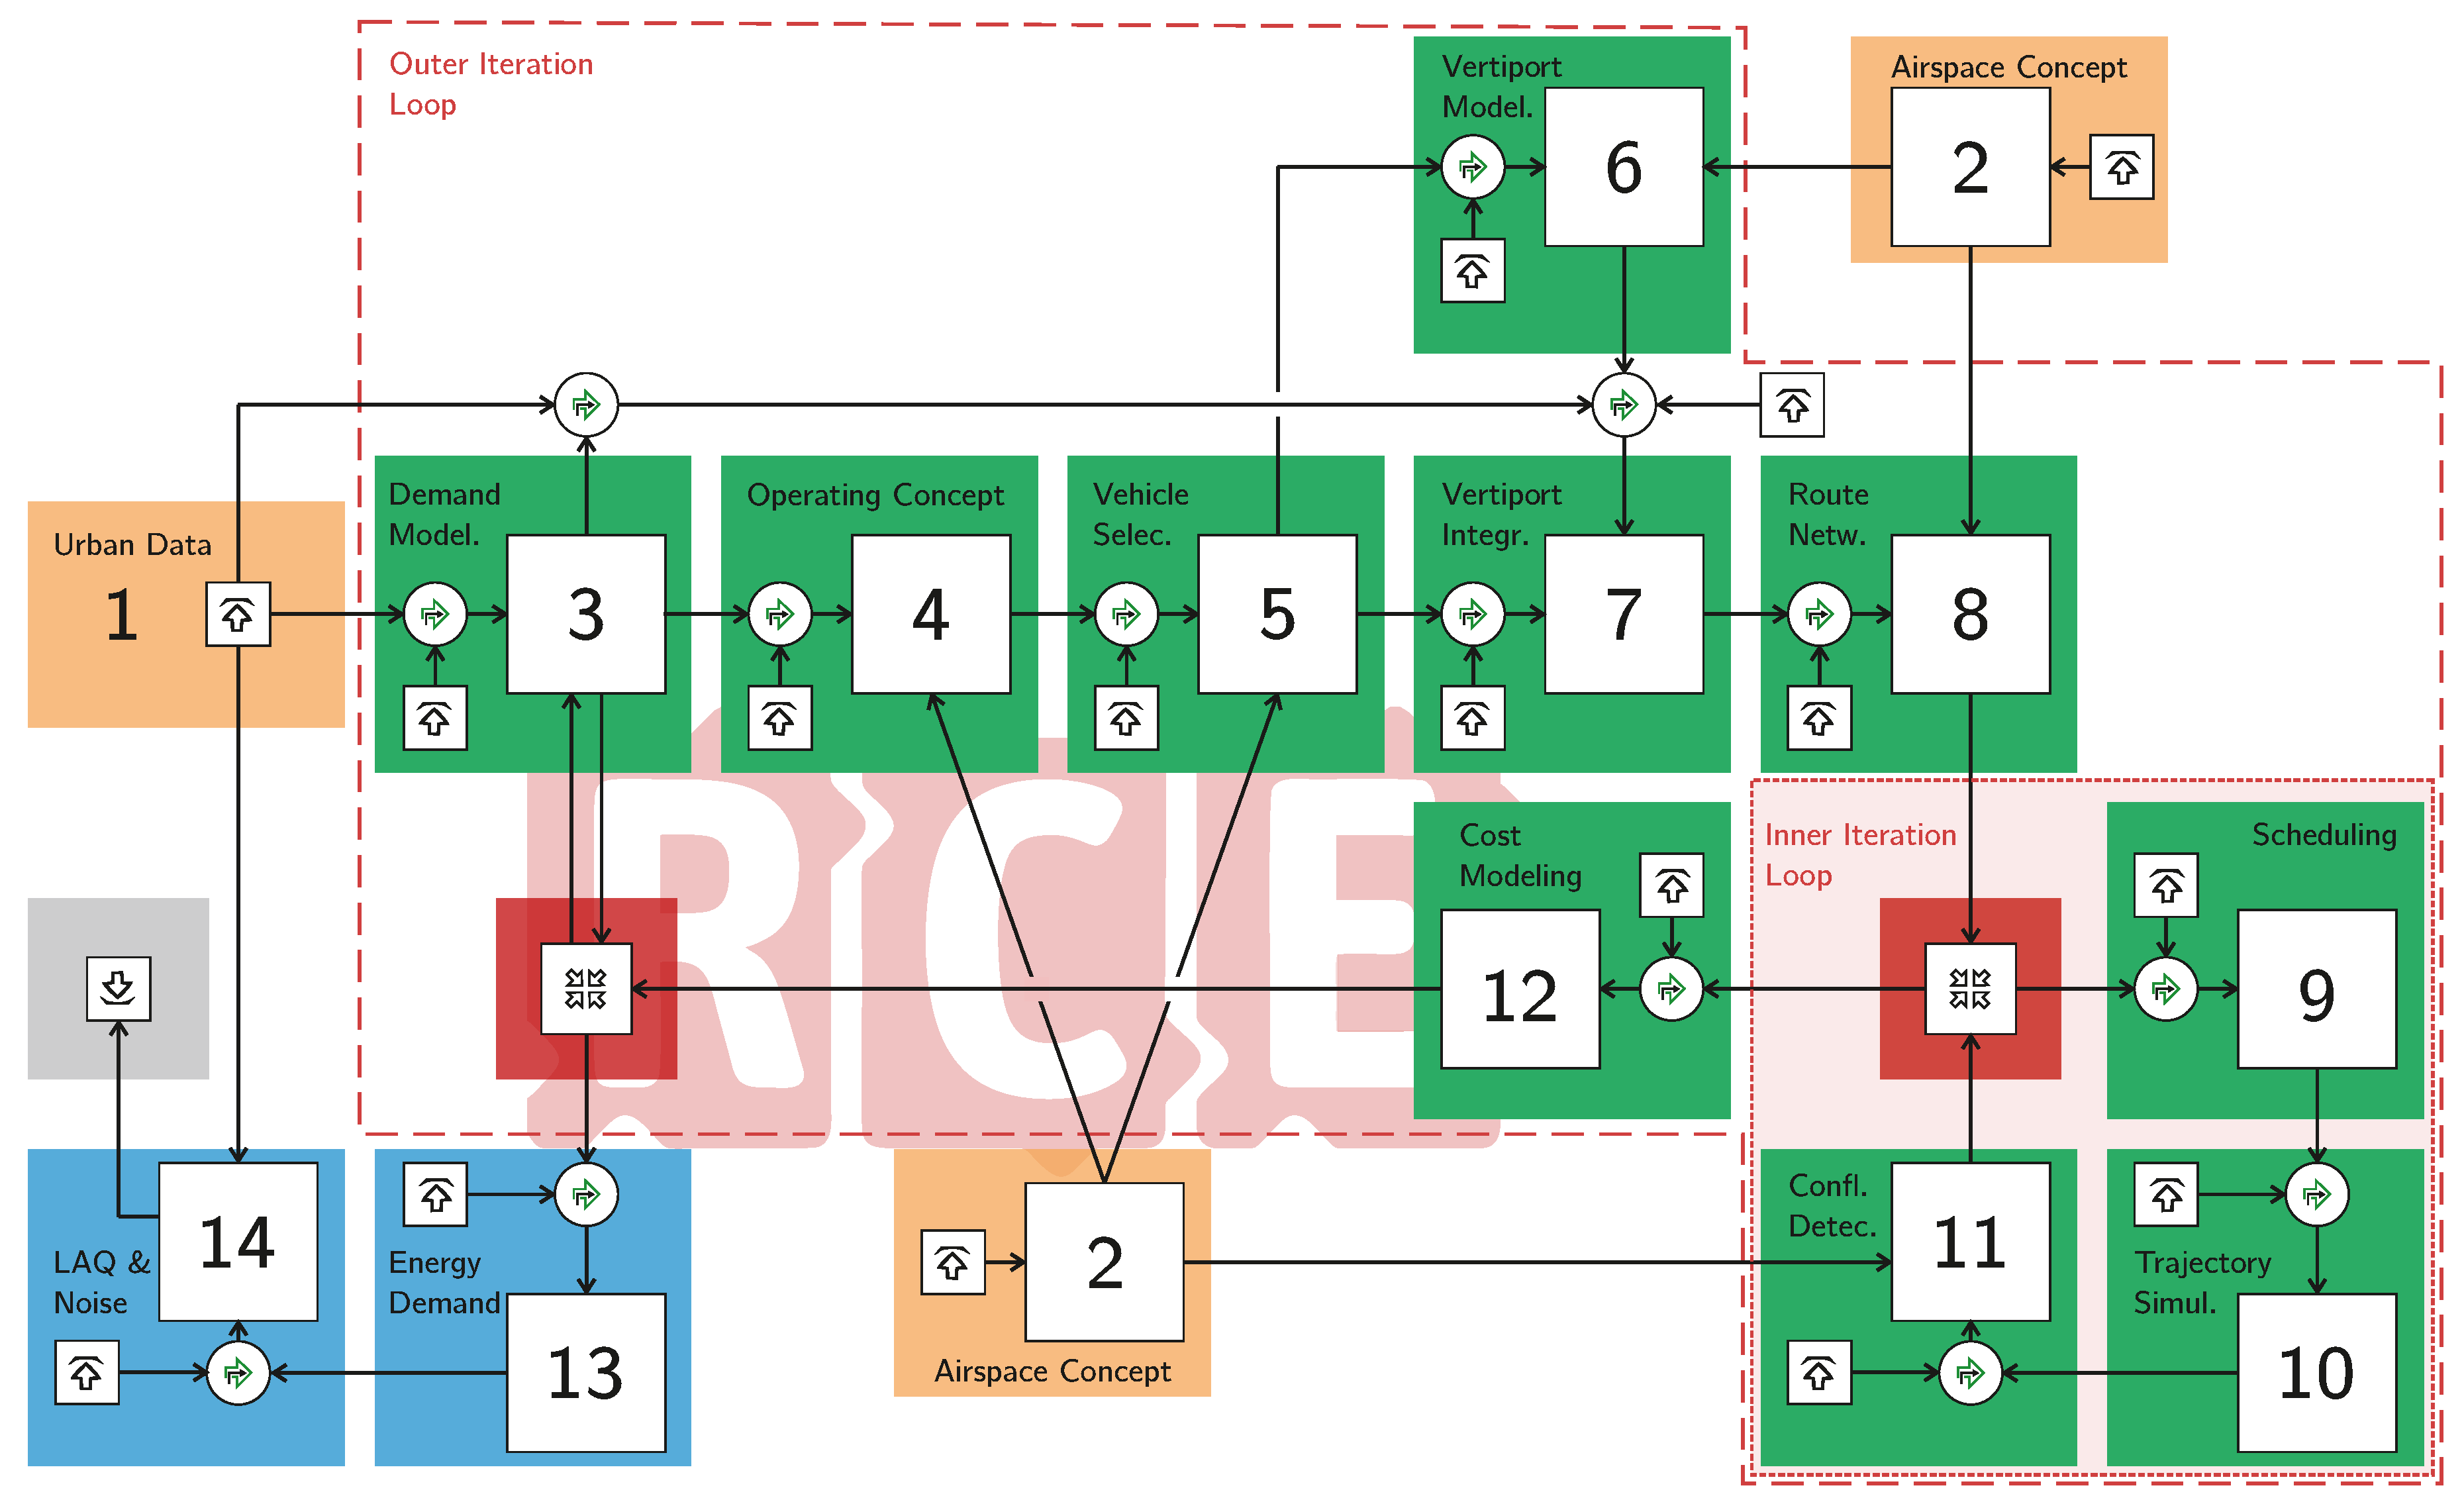
The UAM system module has the following structure (see Figure 6 and Figure 7): Under consideration of urban data such as population and income distribution (component 1), a 24 h UAM demand distribution (component 3; see Section 3.2) is estimated for a given set of origins and destinations. Depending on the origin–destination specific values of demand and the corresponding distances, which in turn depend on the pre-selected airspace concept (component 2; see Section 3.4), an operating concept is selected to be subject of investigation (component 4). In this context, viable options either comprise a scheduled air shuttle service or an on-demand air taxi service. According to this set of assumptions, a compatible vehicle concept (component 5) is chosen from a database. Subsequently, an infrastructure network is created, assigning the required capacities regarding possible landings and departures of different vertiport designs to the respective urban locations (components 6 and 7; see Section 3.3). For vertiport integration, 3D building data are used to identify potential take-off and landing sites; values of required and available urban space are compared to derive a feasible solution. With regard to the boundary conditions imposed by the selected airspace concept, the optimal lateral tracks are identified between all vertiport pairs (component 8; see Section 3.4). Taking the demand into consideration, a flight schedule is created on an hourly basis (component 9; see Section 3.5), according to which 4D trajectory simulations are conducted, superimposing a vertical mission phase profile with the lateral flight tracks (component 10; see Section 3.6). In a post operation step, the resulting entirety of trajectories is checked for possible violations of the predefined spatial separation minimum during cruise flight (component 11; see Section 3.7). For pre-departure deconflicting, detected conflicts will be looped back to flight scheduling (component 9; inner iteration loop). Based on trajectory data of individual flights (e.g., mission time, mission distance and power usage), revenues and expenses are estimated and assessed (component 12; see Section 3.8). As increasing operating costs have a negative impact on UAM demand, an outer design loop (displayed in light green) between components 12 and 3 is planned. In the final evaluation phase (displayed in blue), the ecological footprint of the UAM system is assessed in terms of energy consumption (component 13), local air quality (LAQ), acoustic, and visual noise (component 14).
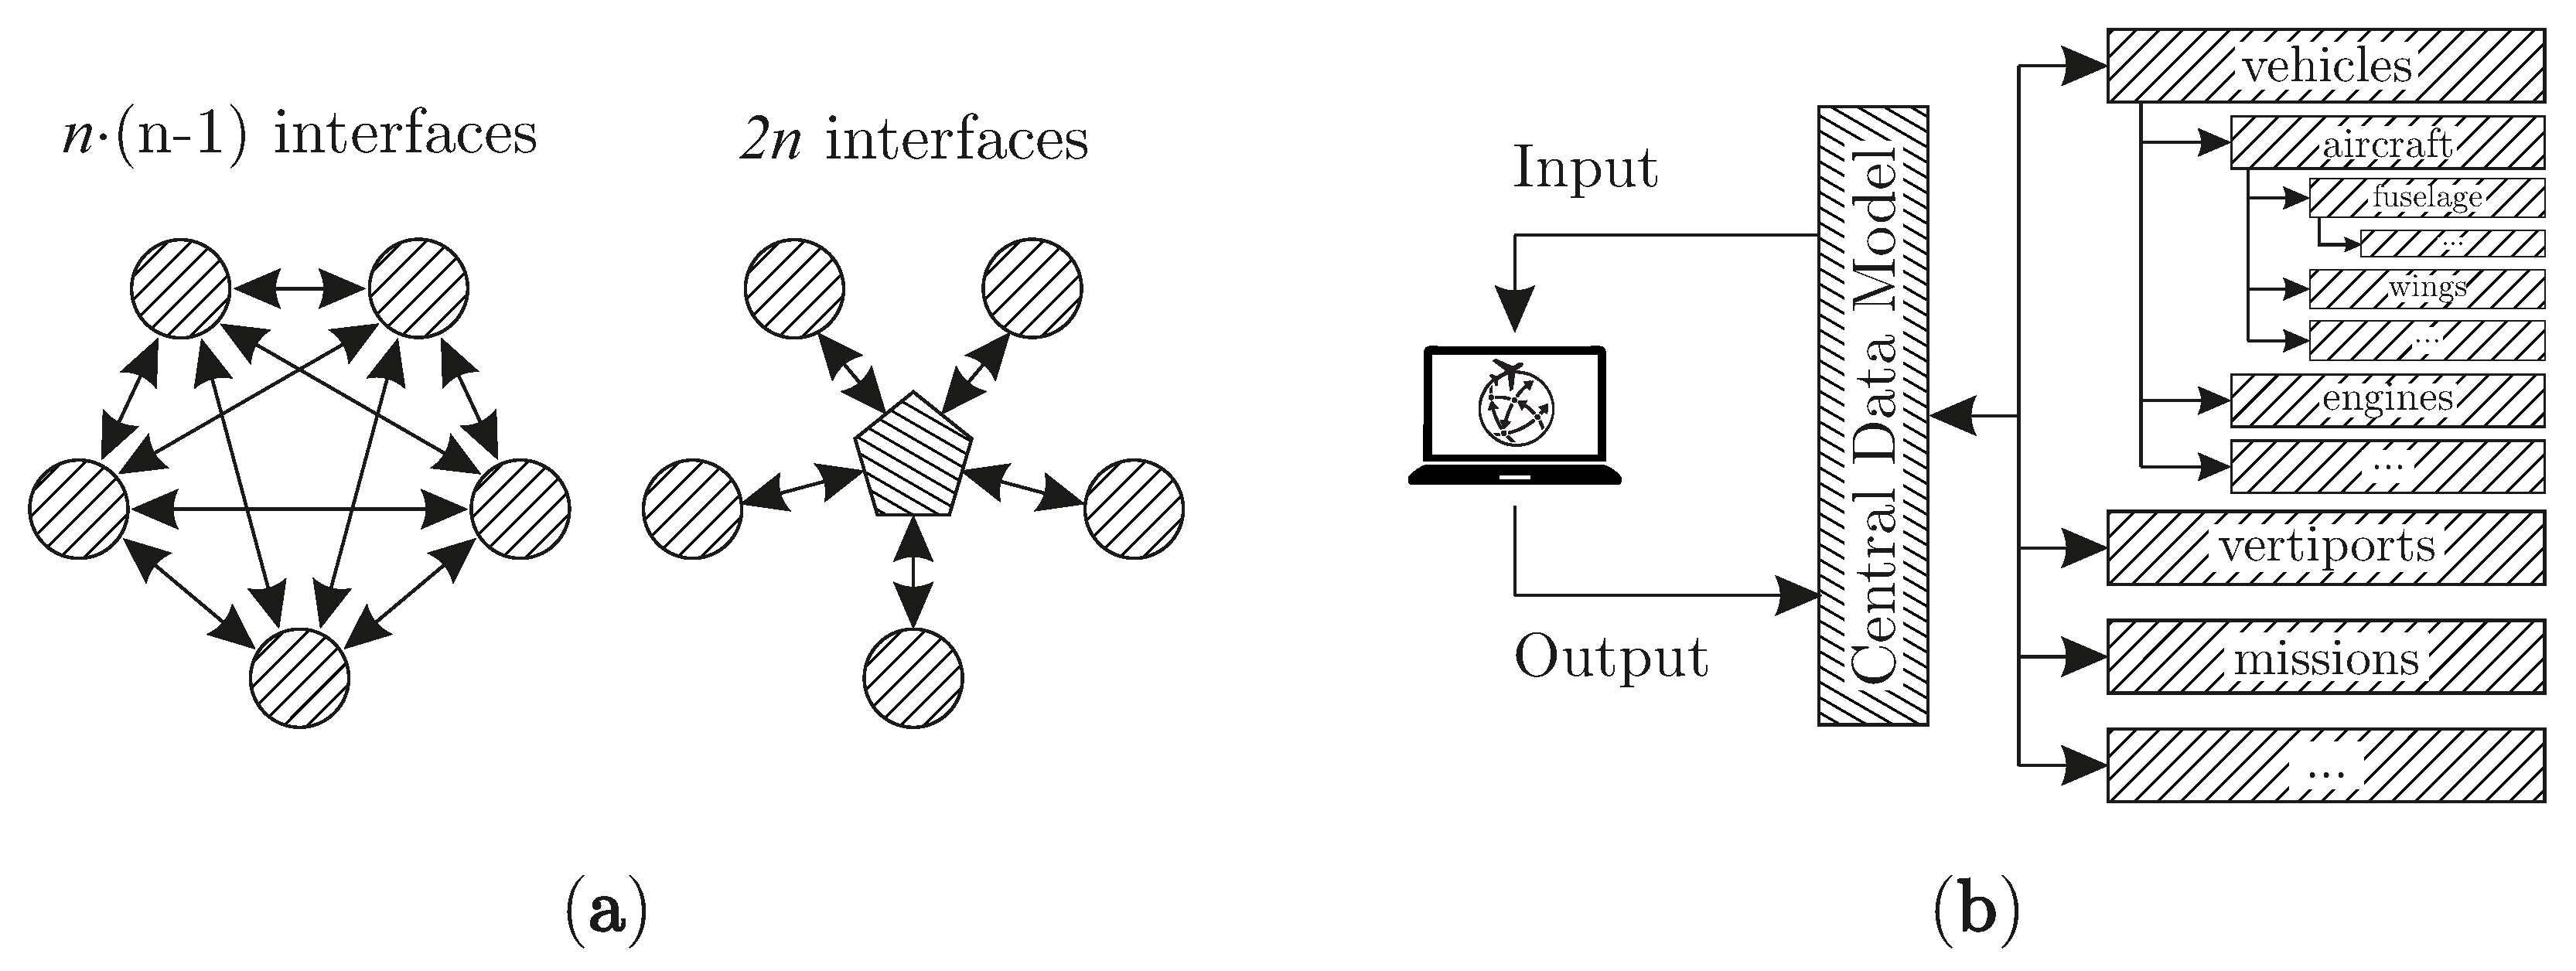
Once the required inputs and available outputs of the individual analysis components have been identified, the data to be exchanged must be integrated into the standard data format. Within this study, CPACS [41] is used and adapted with regard to the UAM requirements. In this context, the data format is supplemented by parameters as demand and vertiport characteristics. As CPACS has been developed for multi-disciplinary design in distributed environments, both product (i.a. vehicle and engine characteristics, fleets and mission) and process information (like set up information of workflows) can be easily described in a structured, hierarchical manner.
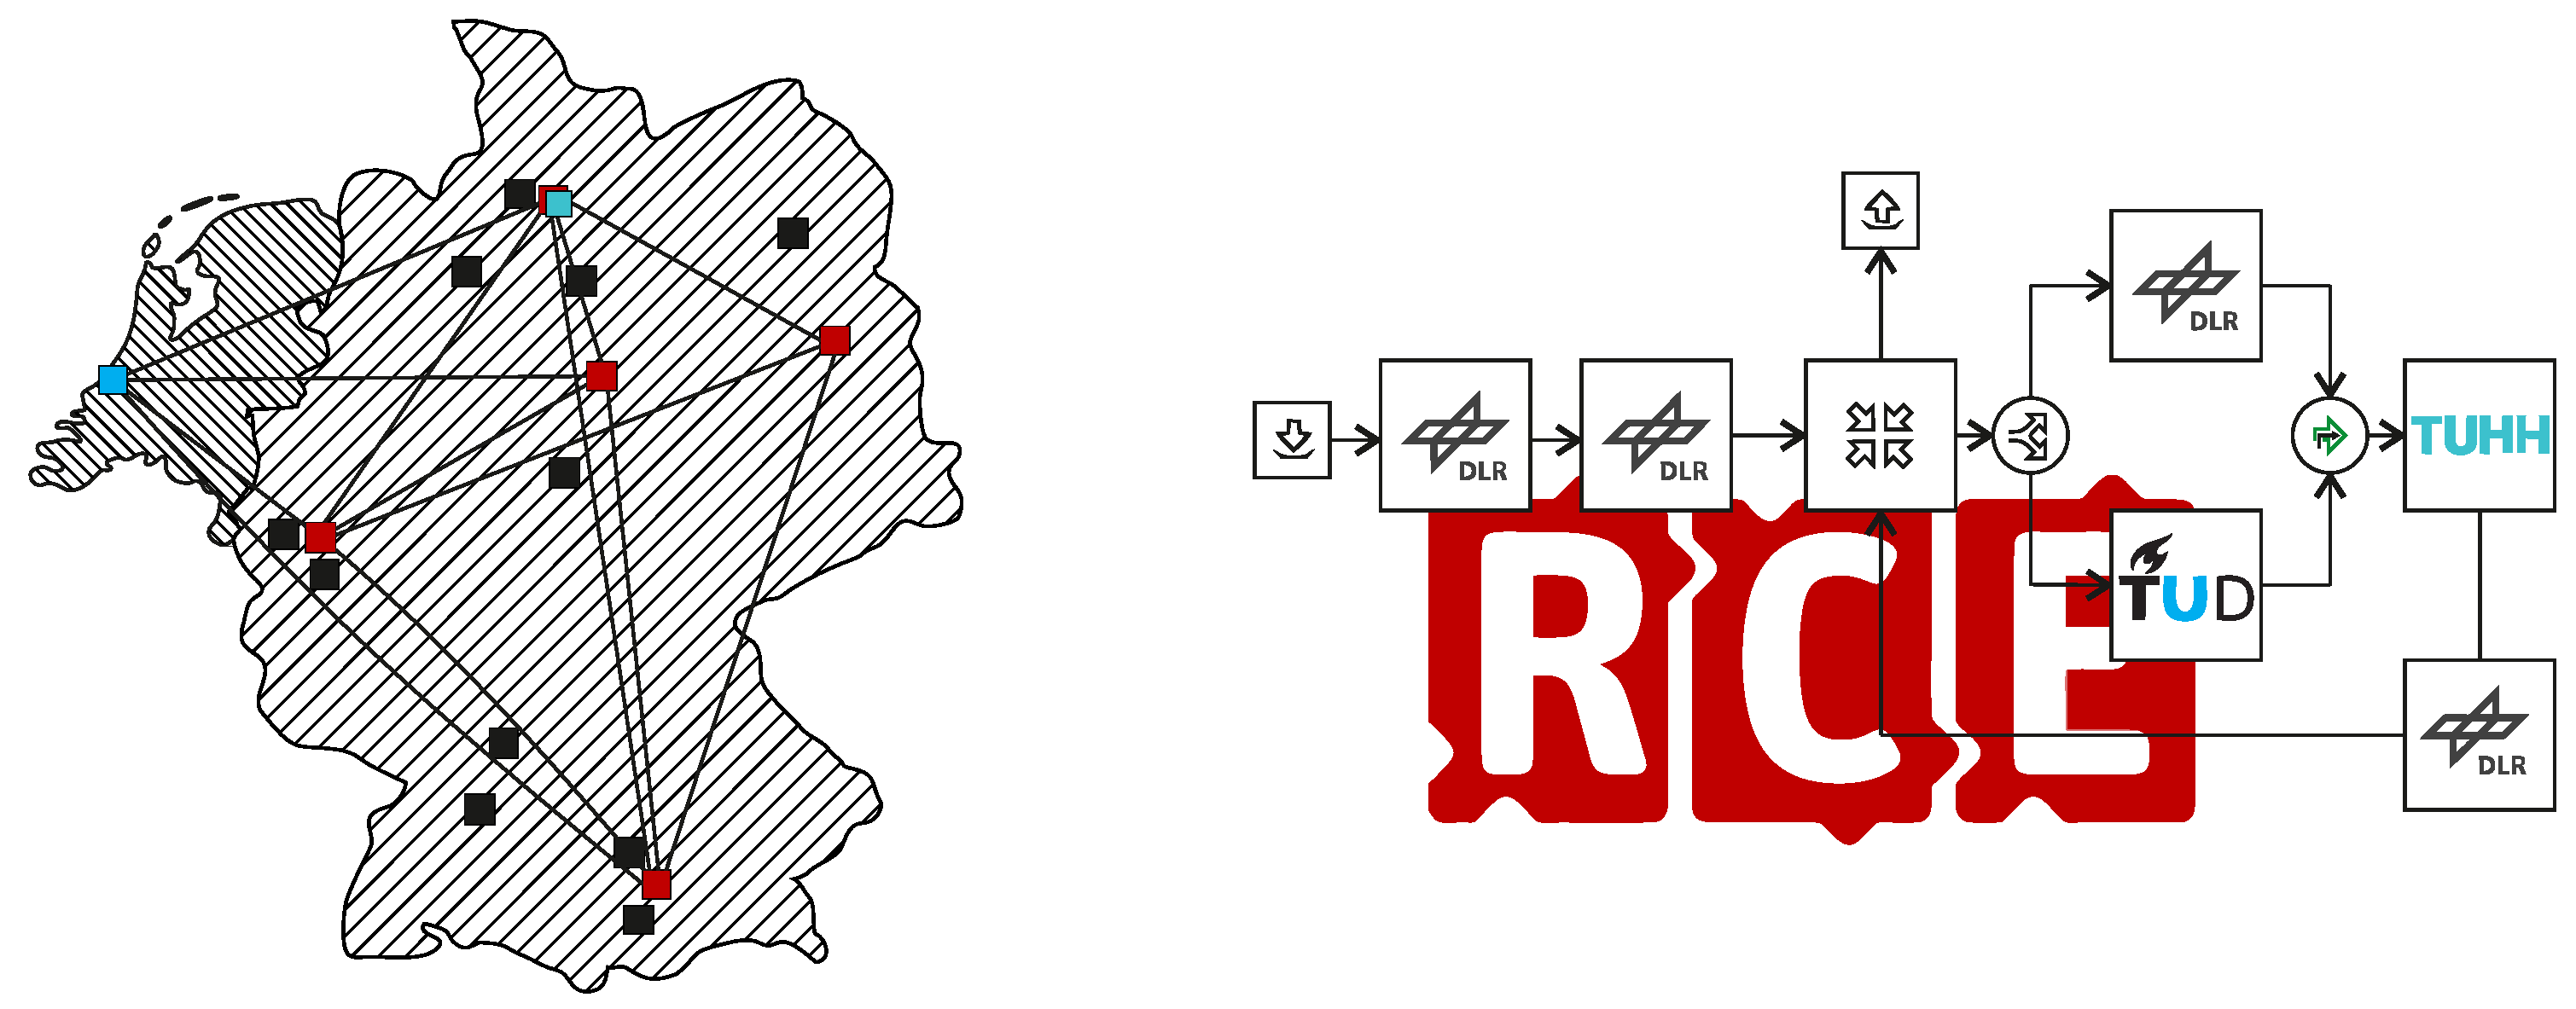
The step of interface definition is followed by setting up and testing the logic and data handling of the entire modeling system. For this reason, a first workflow with ’dummy’ tools has been built within the integration framework RCE (see Figure 7). In parallel, the development of the required UAM components has begun. If possible, existing models of conventional aviation are used and modified with regard to UAM requirements. In the last step, the extended components are integrated into RCE to replace the dummy tools of the UAM workflow successively.
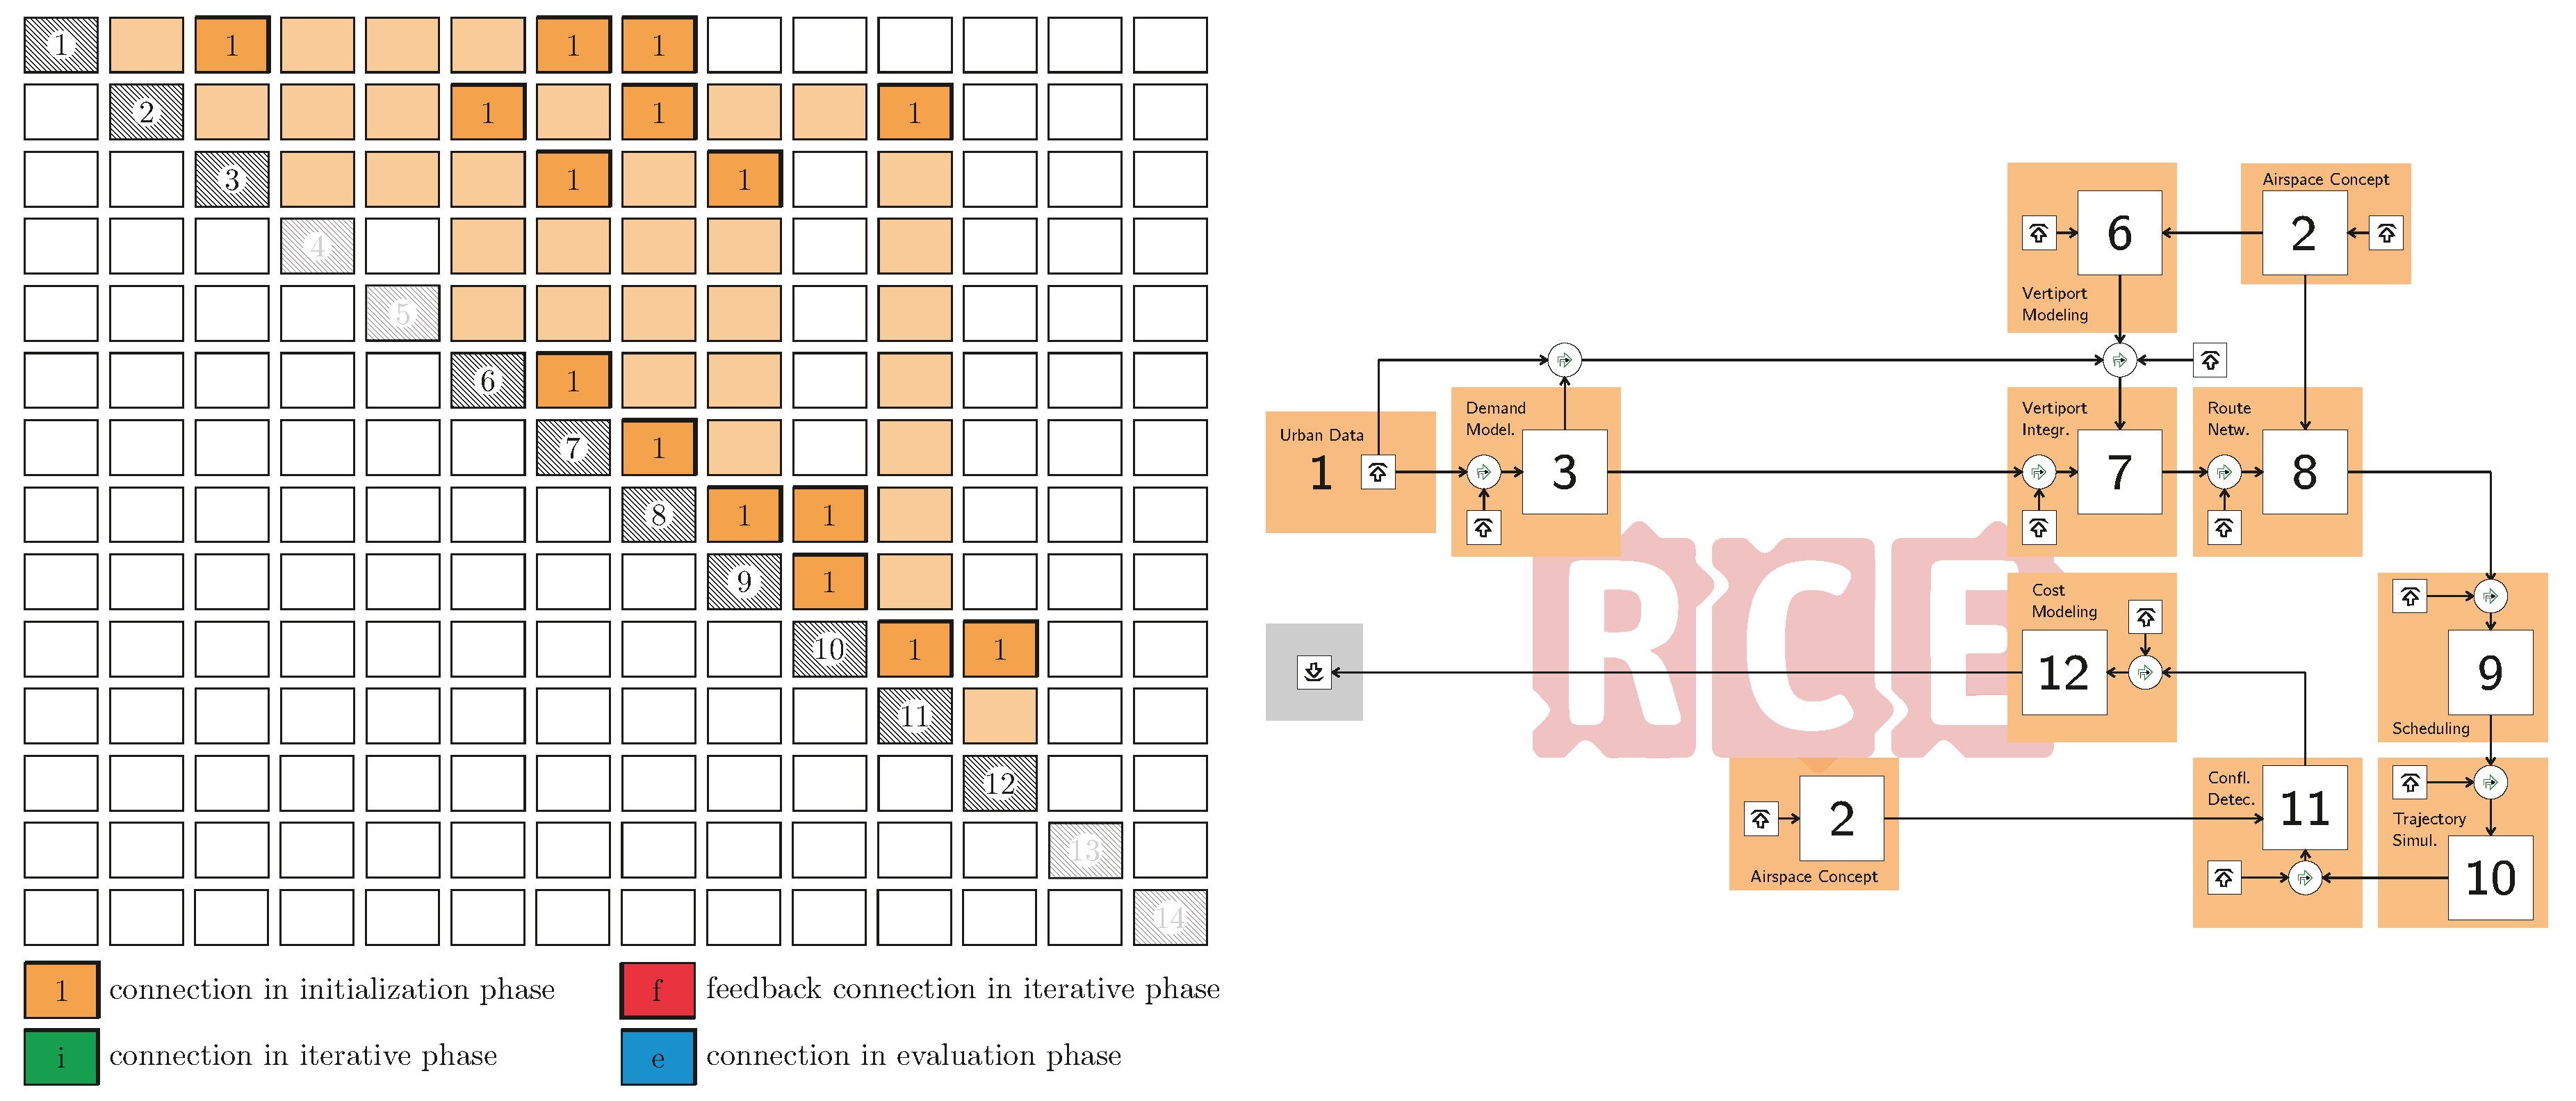
The current state of the UAM system and tool development (first initialization) is schematically shown in Figure 8. The overall structure and arrangement of components are in accordance with Figure 6 and Figure 7. In order to better reflect the current state of development, all dummy-tools are removed in this figure from the RCE workflow. As no feedback connection has been implemented yet, all components are connected by uni-directional data transfer (’1’, orange).
The developed models, which are briefly described in Section 3.2, Section 3.3, Section 3.4, Section 3.5, Section 3.6, Section 3.7, 
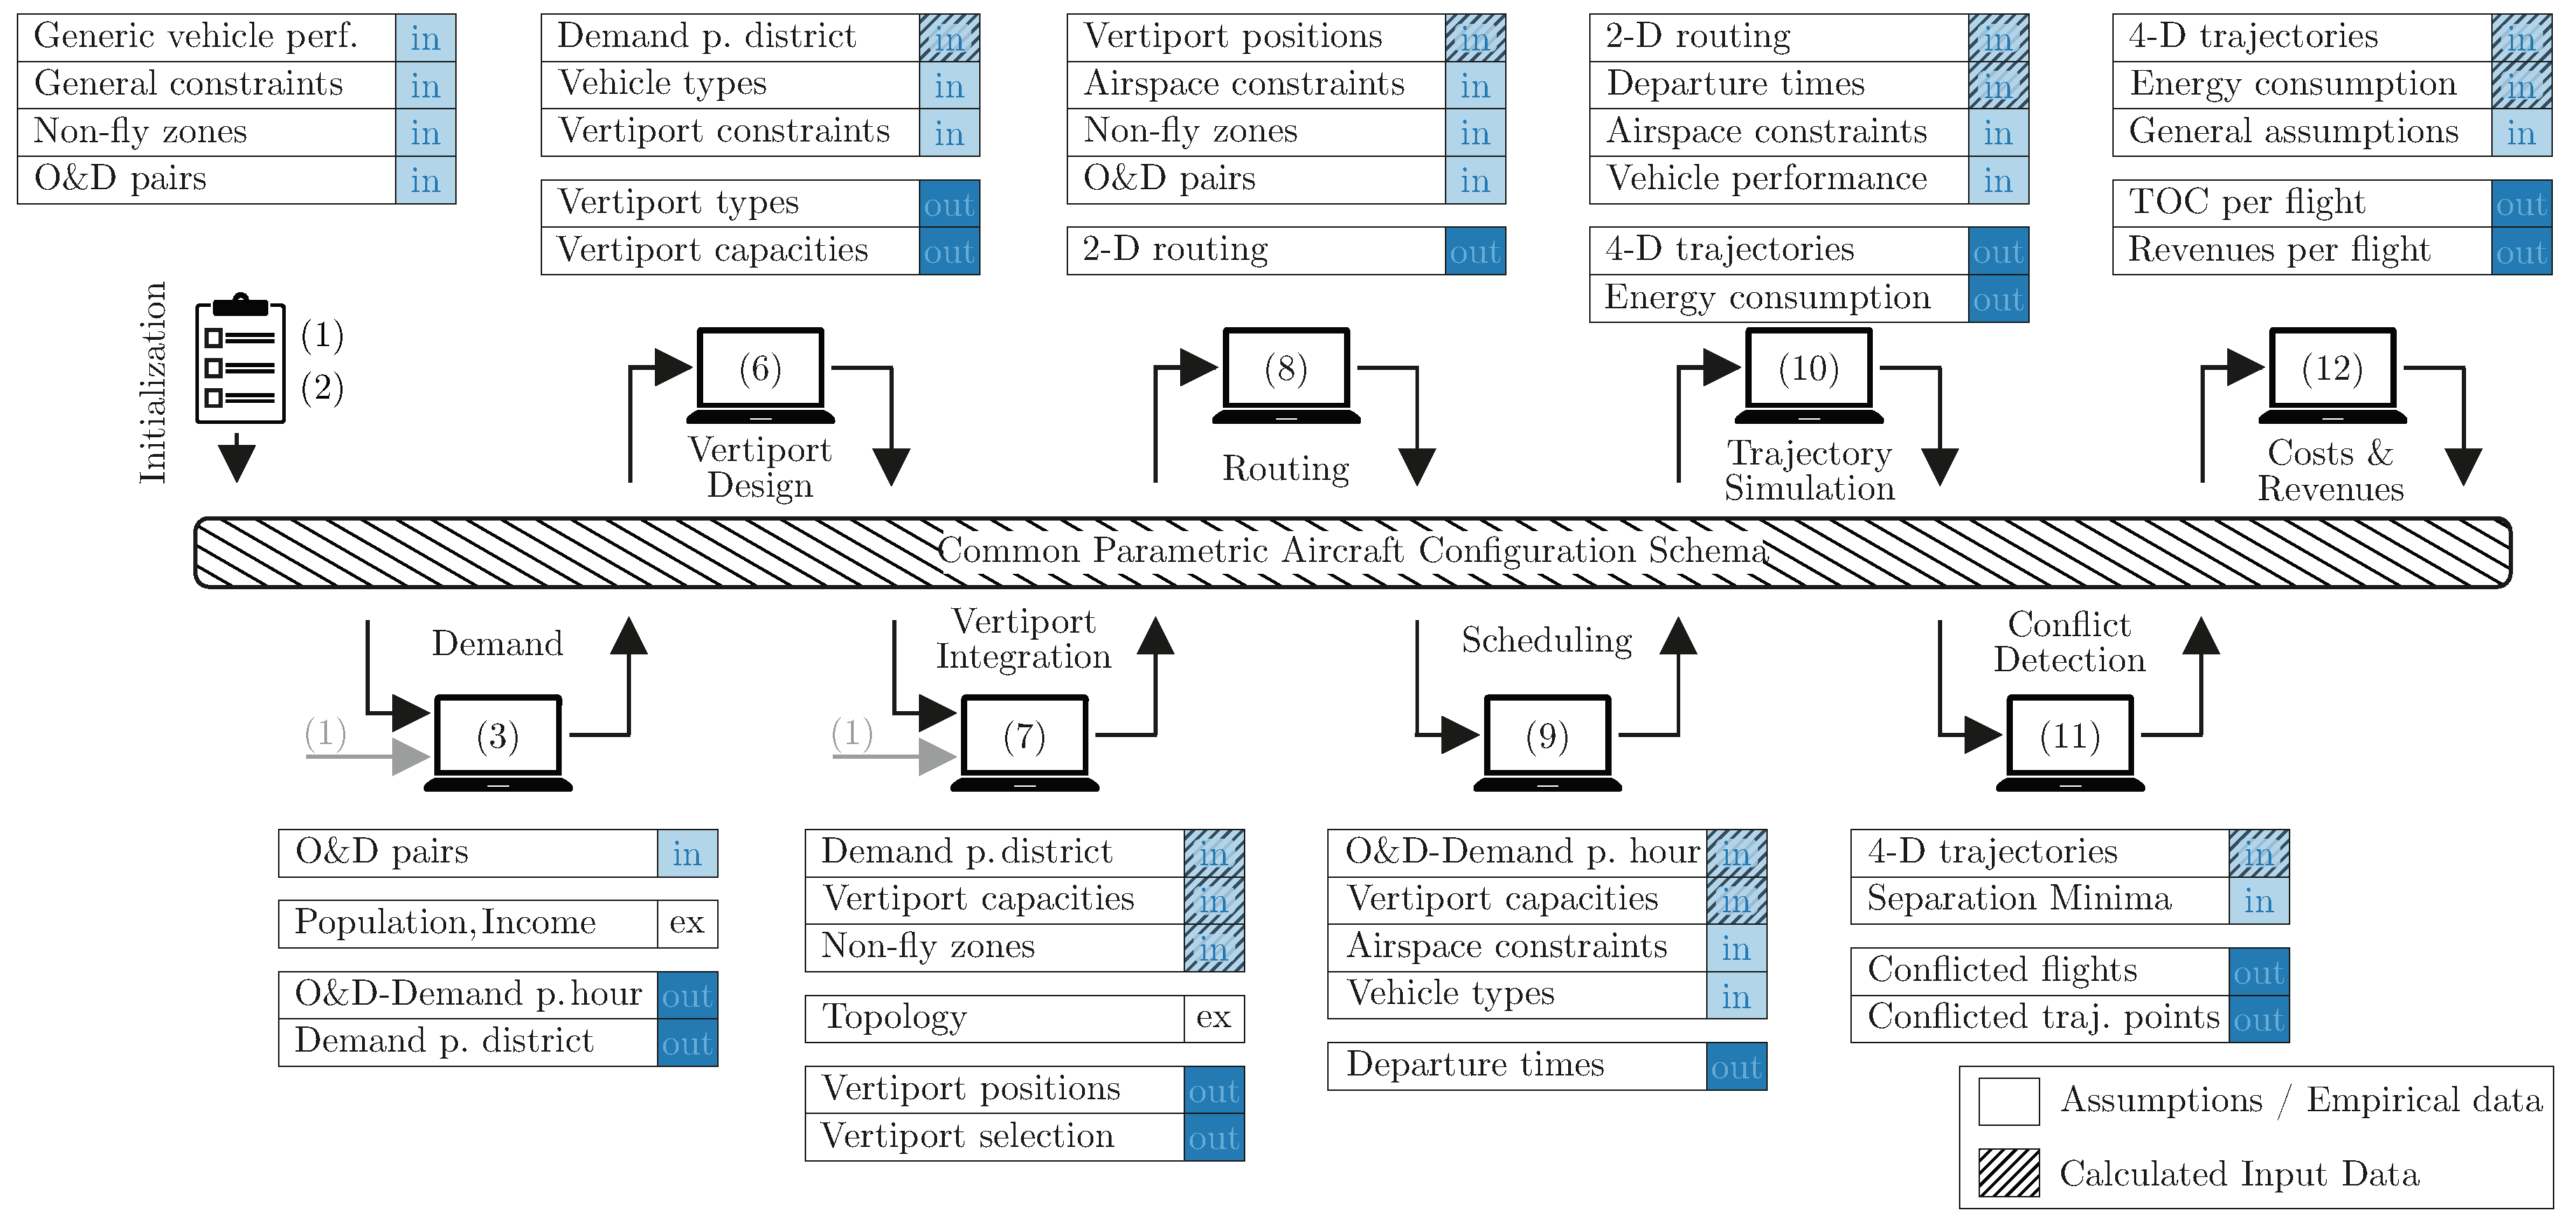
Section 3.8, are applied for the simulation of a generic on-demand air taxi concept in the metropolitan area of Hamburg. An overview on CPACS interfaces of current components is provided in Figure 9. Calculated data are marked by hatching; all other data are either based on assumptions (vehicle performance, vertiport constraints, etc.) or on empirical observations (topology, population and income distribution of Hamburg City). Once an adequate methodology of consideration for these datasets is developed, it is possible to transfer this UAM modeling approach to other metropolitan areas.

3.2. Urban Air Demand Modeling (U-CAST)

The implementation of UAM concepts will fundamentally expand urban mobility and might lead to considerable changes in the demand for individual means of transport. The choice of the traffic mode is strongly influenced by travel costs, travel times and comfort aspects (number of transfers, distance to station, etc.) as well as individual mobility preferences. A multi-modal modeling approach that covers different target groups is therefore essential for forecasting UAM demand. Another challenge of UAM demand modeling is indirect implications like relocation effects. Since the average daily time budget spent by a person for commuting has remained unchanged for decades (Marchetti’s constant) at about one hour [44], every acceleration of the transport system has led to an expansion of the radius of action. As a consequence, commuting distances and leisure routes increased in the past with higher travel speeds—an effect that will most likely also occur for UAM systems if UAM’s share of the total transport volume reaches a certain level.
An initial estimate of the UAM demand is carried out, i. a., by [15,16,17,18,19]. Based on a survey, the willingness of commuters to pay for UAM was estimated in five US metropolitan areas by [15]. Future markets for interurban air mobility (up to 300 km) were analyzed worldwide by [16]. Therefore, they integrated a gravity model into the existing DLR air passenger demand forecasting model D-CAST [45,46], which simulates the number of passengers as well as changes in the number of connected cities between 4435 settlements worldwide based on various socio-economic scenarios. For simulating mobility preferences, an agent-based approach was proposed by [18,19], who extended the multi-modal transport simulation MATSim for UAM services. In their current version, the UAM extension provides UAM infrastructure, vehicles, and airspace usage.
Within this study, a simplified UAM demand forecast model (U-CAST) is developed, which is derived from D-CAST [45,46]. In the current modeling phase (January 2020), the general UAM mobility demand between two districts is modeled as a function of the population and income distributions, district type classification, key indicators of everyday mobility in Germany [
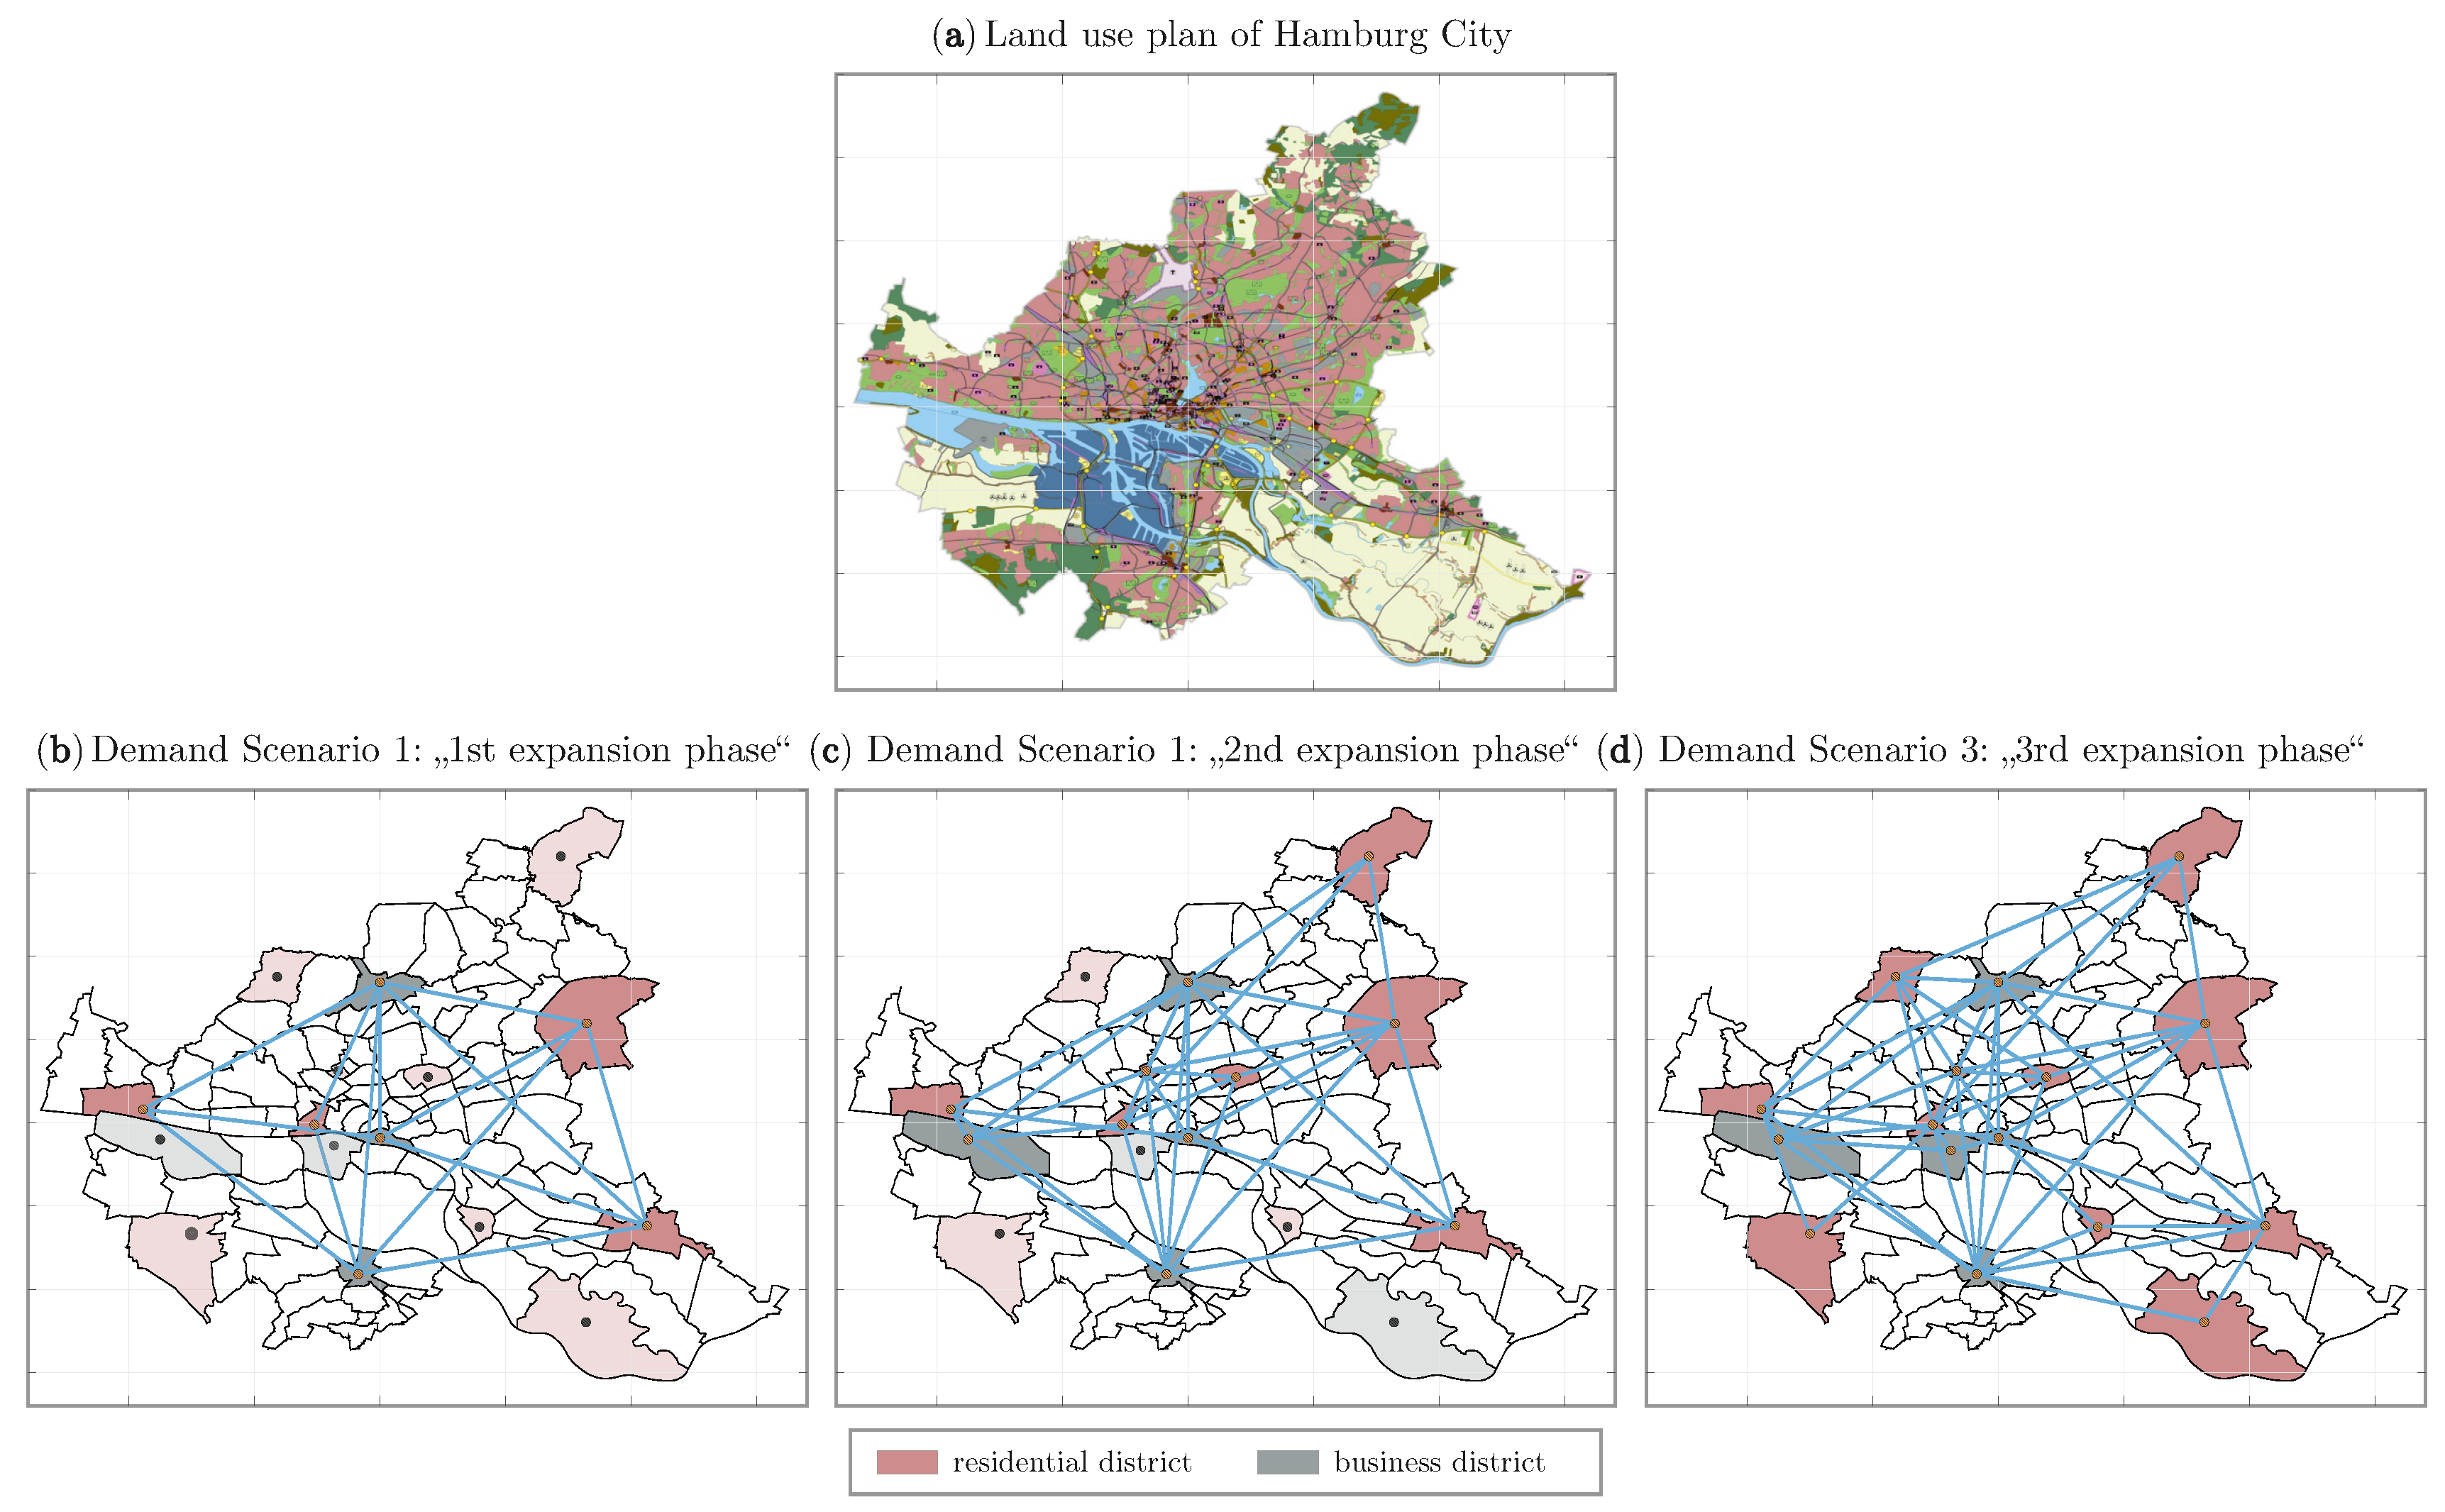
47], and the UAM travel time saving potential relative to alternative modes of transport. Therefore, an urban database of Hamburg was set up, which contains information on the topography, population and income distribution of all 104 districts of Hamburg City (see Figure 10a) [48,49].
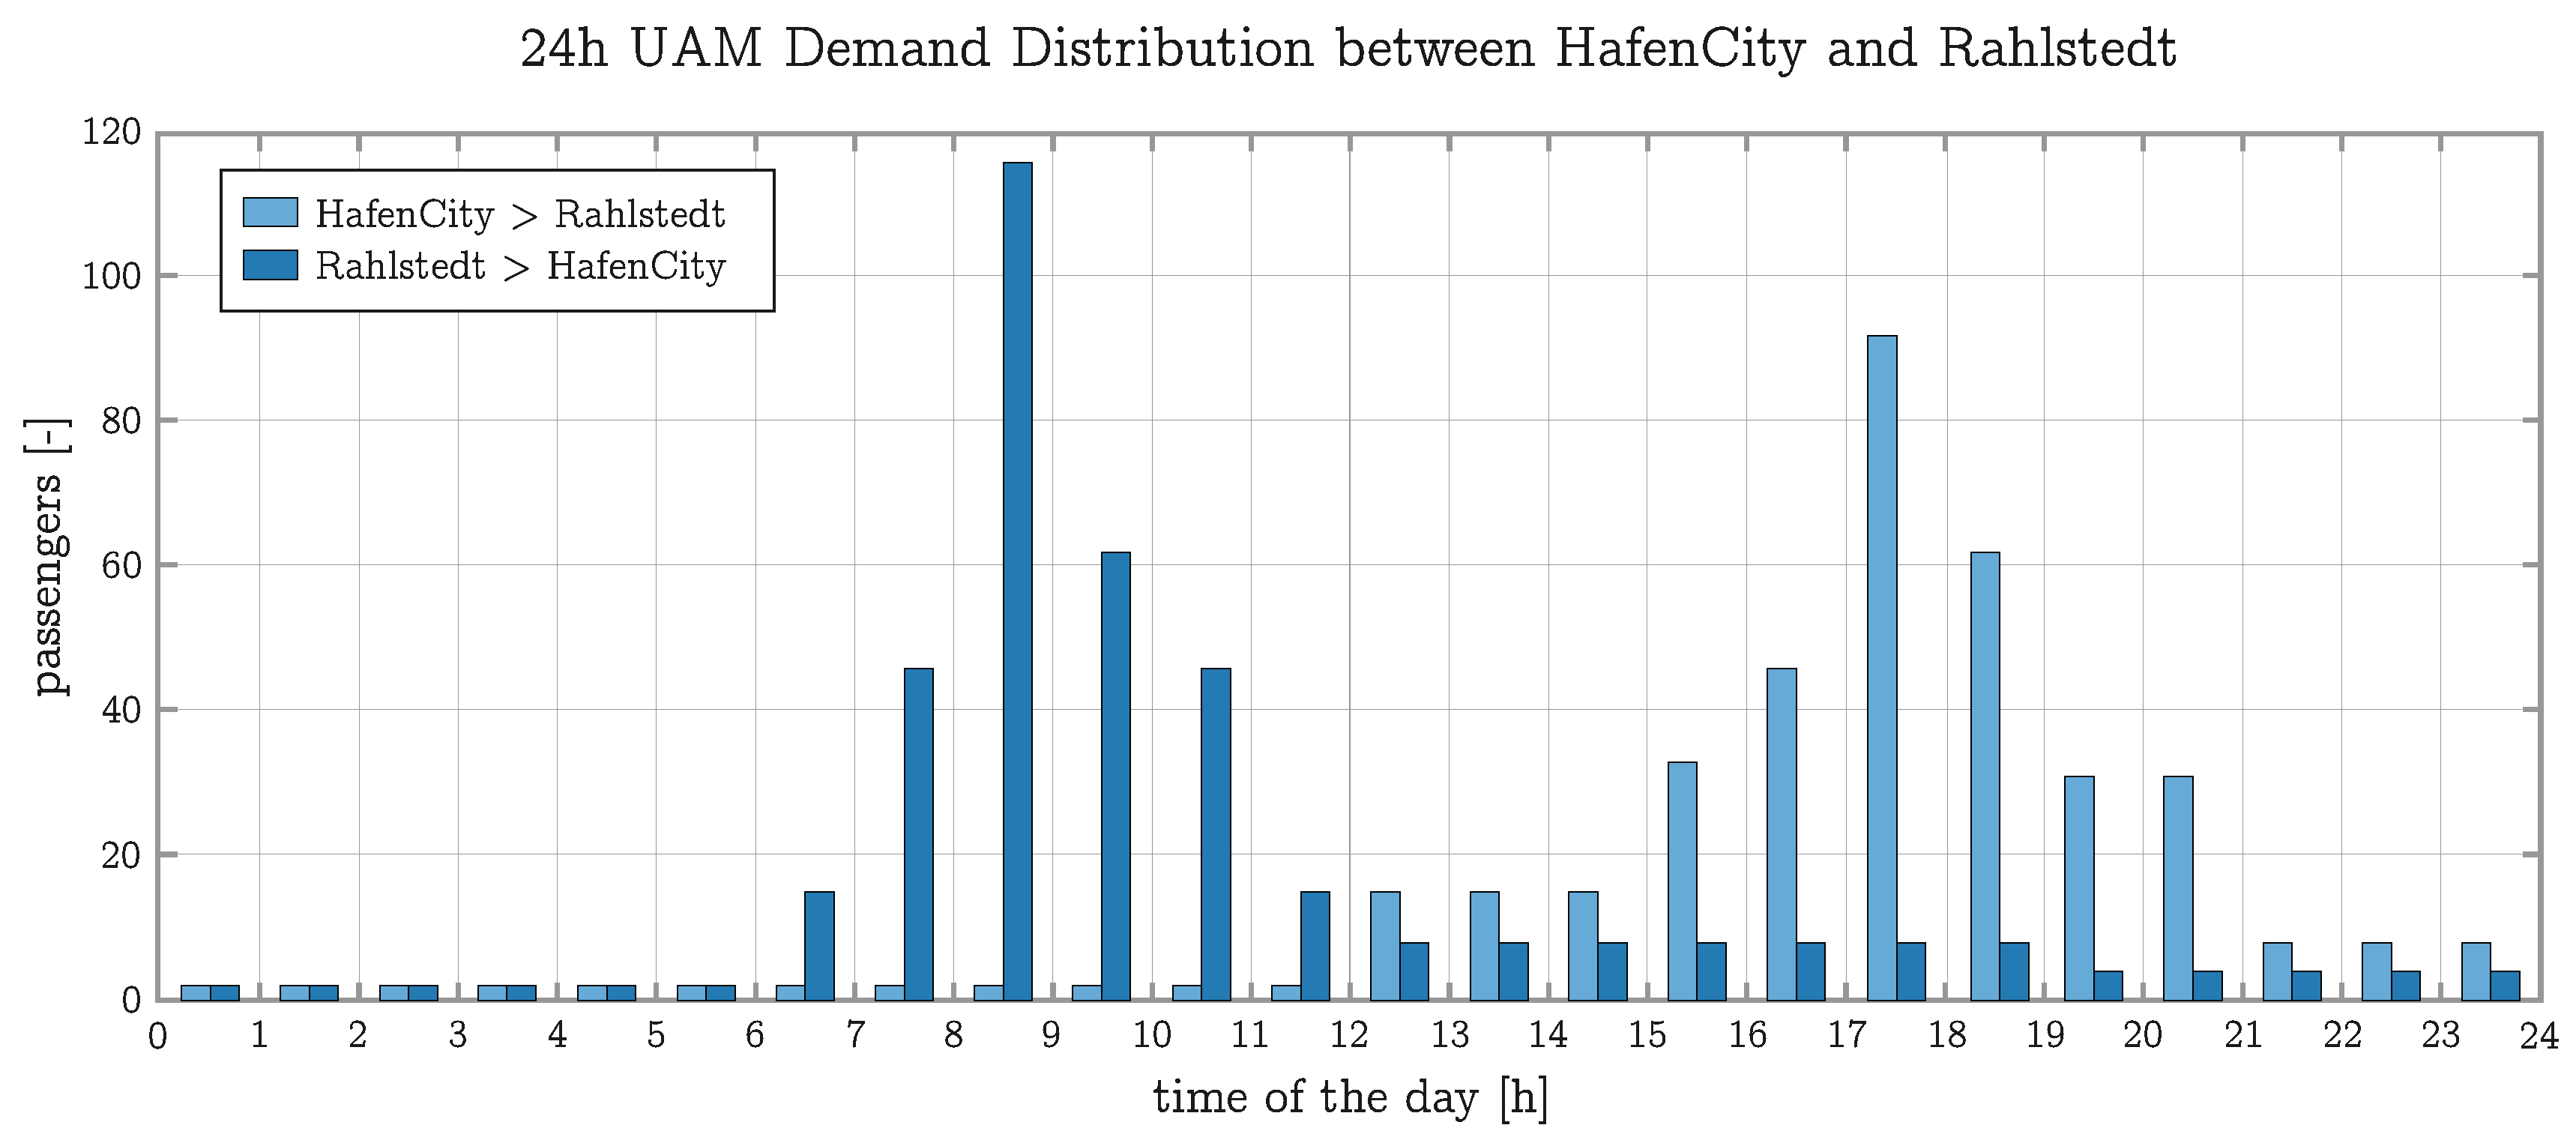
Since the planned UAM simulation is based on a 24-hour period, the resulting UAM demand of each route must be broken down to an hourly basis. In order to roughly estimate the number of arrivals and departures for the individual districts over the day, a categorization parameter is introduced for different types of districts (working district, shopping and nightlife district, residential neighborhood, etc.). Categories other than “working quarters” and “residential areas” are not yet included within this study (see Figure 10). Traffic peaks are generally assumed in the morning or evening hours. For an exemplary district, which is assigned to the category of a working district (e.g., “HafenCity”), the possible air traffic is assumed to be mainly incoming in the morning hours, when people come to work, and outgoing in the evening hours, when people return to the living quarters. For a “residential neighborhood” (e.g., “Rahlstedt”), it is vice versa (compare Figure 11).
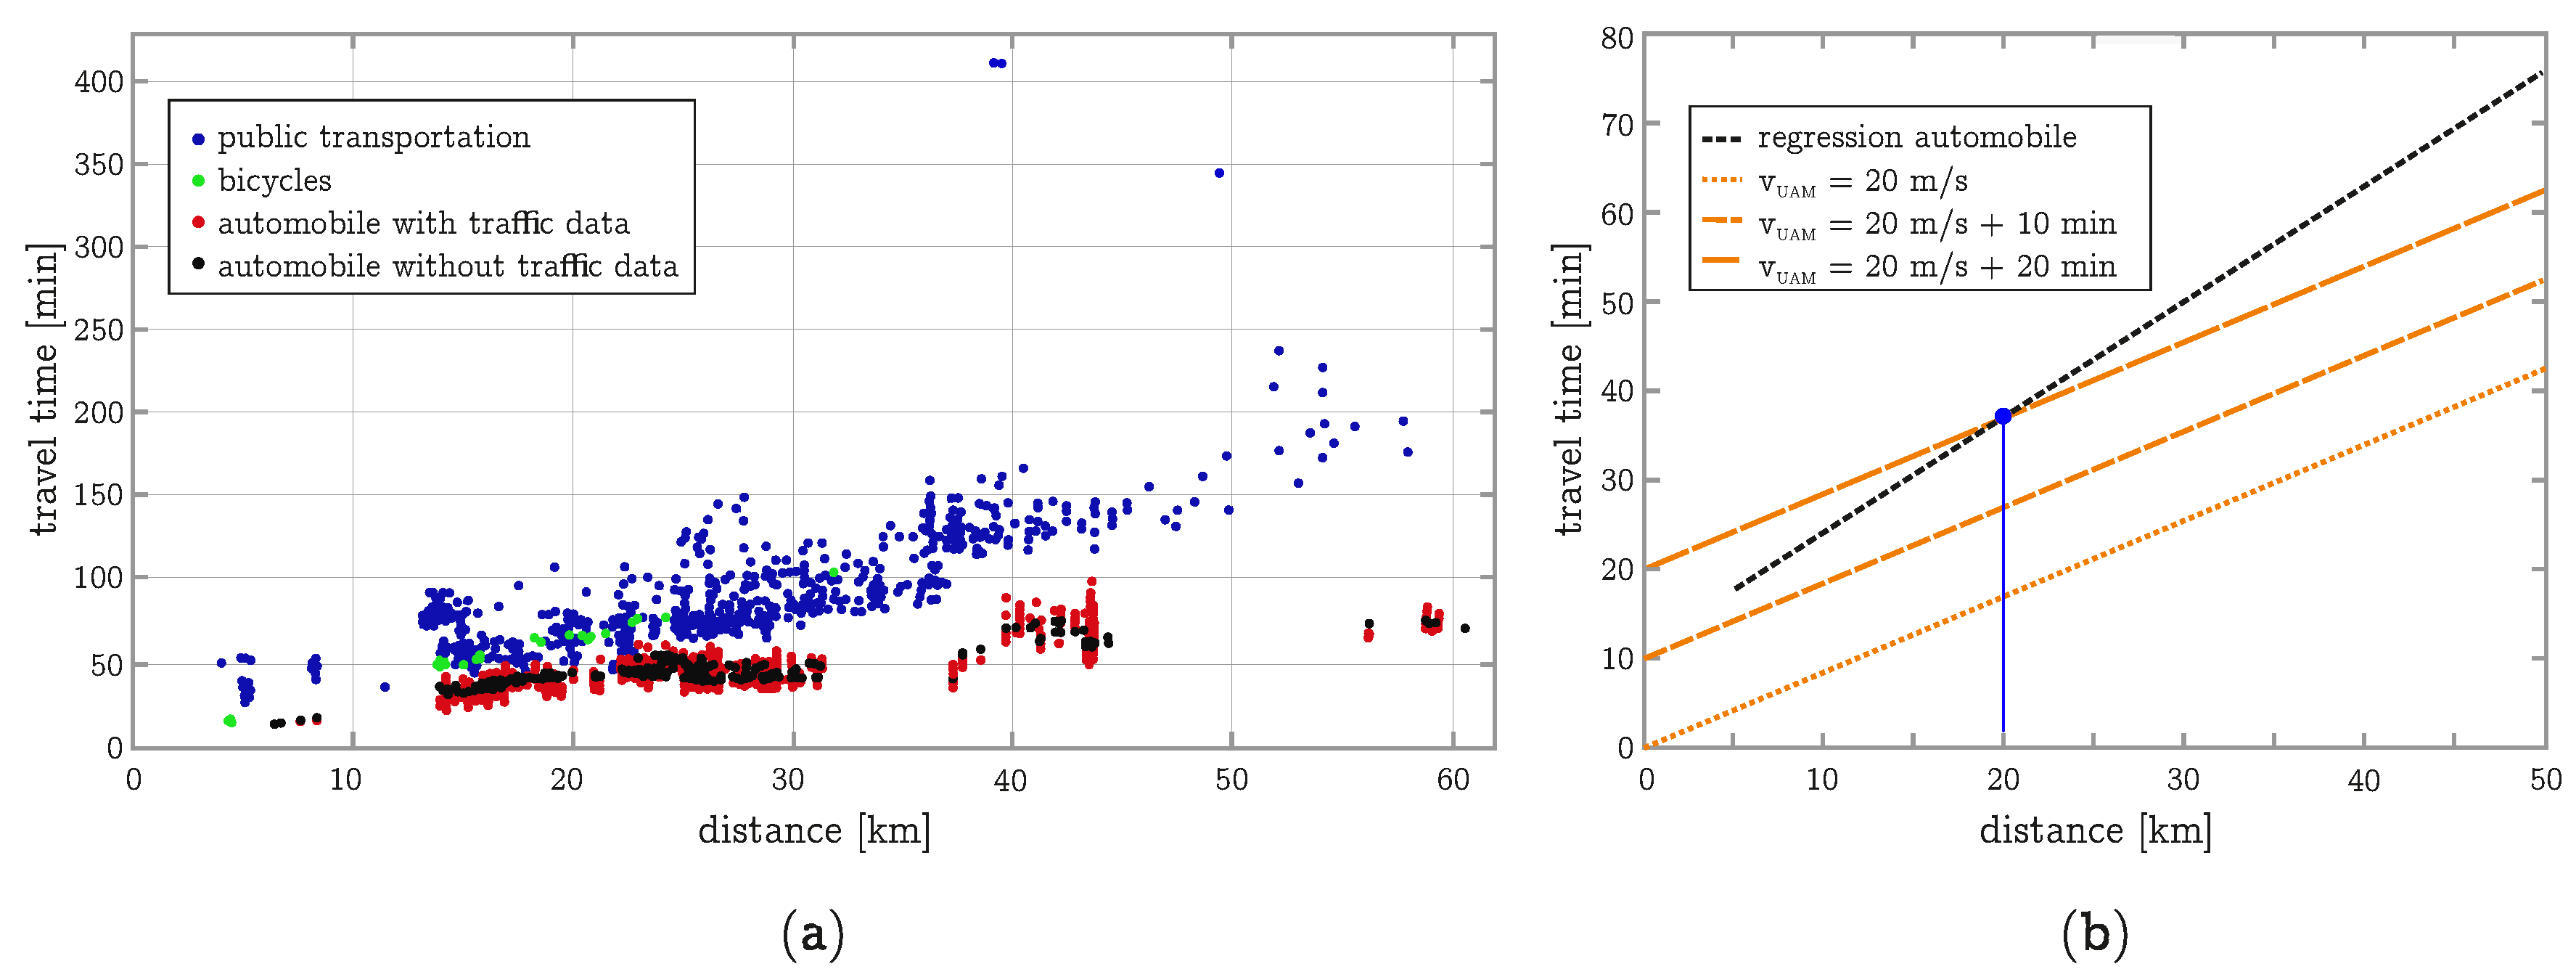
To simulate the UAM time saving potential, an automated query of “Google Maps” was created by [51], which provides information such as travel times and distances for different modes of transport [52]. The automated query was carried out for different traffic modes (automobile, bicycle, public transportation) on selected routes every 15 minutes within a one-week period in 2018 (see Figure 12a). The query was carried out from 30 July 2018 to 6 August 2018 during a particularly hot and dry summer in Hamburg City. The empirically obtained travel time data were used to derive a linear regression for each transport mode. Since many people go on holiday in August, travel times (especially by car) might be underestimated. As an example, the linear regression of the travel time ( t c a r ) as function of the travel distance (d) is given in Equation (1) and visualized in Figure 12b:
t c a r = 0.0013 · d + 11
In Figure 12b, the estimated UAM travel time is depicted under the assumption of a comparatively low average cruising speed of 20 m/s (no consideration of take-off and landing phases). This leads to considerable time savings (orange dotted line). If a time expenditure of 10 min is added to cover take-off, landing and turnaround, there would still be a considerable time saving potential on almost all the routes. For a time expenditure of 20 min, a time saving potential exists for values of distance beyond 20 km, as highlighted by a blue mark in Figure 12b. The presented simulations, however, are carried out with a higher cruise speed of 30 m/s.
In the following sections, three different UAM scenarios are discussed, which vary in their number of connected districts, routes, and passengers (see Figure 10 and Table 1):
A first plausibility check of the results was conducted according to data from the Statistical Office for Hamburg and Schleswig-Holstein [53]. According to [53], 14.2 million taxi journeys were made in Hamburg in 2016, which corresponds to an average of 38,900 journeys per day. If we assume that each of the taxis carries 1.2 or 1.5 passengers on average, our UAM scenarios would lead to equivalent shares according to Table 2.

3.3. Vertiport Design and Integration

Design of the vertiports and their integration plays a crucial role for the acceptance and potential success of UAM concepts. There are several aspects that are influenced by the design and allocation of ground infrastructure, such as: trip times, UAM costs, noise exposure, etc. The design and physical dimensions are primarily determined by the vehicle. In this study, we focus on VTOL (Vertical Take-off and Landing) vehicles, since STOL (Short Take-off and Landing) vehicles—even with ambitious climb performance—have significant space requirements as shown e.g., in [54]. The required space, especially in populated areas, would have significant impact on the ticket price due to land prices, if the land is available at all. On the other hand, runway orientation is determined by prevailing wind conditions and has a substantial impact on the availability of UAM services.
With respect to vertiport design, the space requirements are estimated following the design of helicopter landing pads. In a first approach, the UAM network might use existing landing pads [55]. From the authors’ point of view, this concept will not provide the capacities necessary to meet the traffic numbers envisaged for UAM—mainly because the landing pads provide—if at all—a limited number of parking positions. Basic requirements on land use for landing pads and parking positions are described in [56] based on helicopter regulations. An integrated approach for the derivation of vertiport space requirements on the basis of a conceptual vertiport capacity model (including number and layout of touchdown and lift-off pads, taxiways, gates, and parking pads) is given in [28]. For UAM, in order to meet the envisaged capacity, there are more futuristic concepts under investigation (see i. a. [57]).
In this study, two models for vertiport design and integration are described:
  • “Level 0”: In this approach, the vertiport is not modeled in its physical dimensions, i.e., vertiports are modeled as a single source (or sink, respectively) with a defined capacity
  • “Level 1”: In this approach, the model consists of two submodels: the vertiport design component and the vertiport allocation component. As a result, the vertiport(s) are allocated in an urban environment according to the dimensions of the vehicle. Capacities of the vertiports and expected traffic movements define the number of vertiports needed.
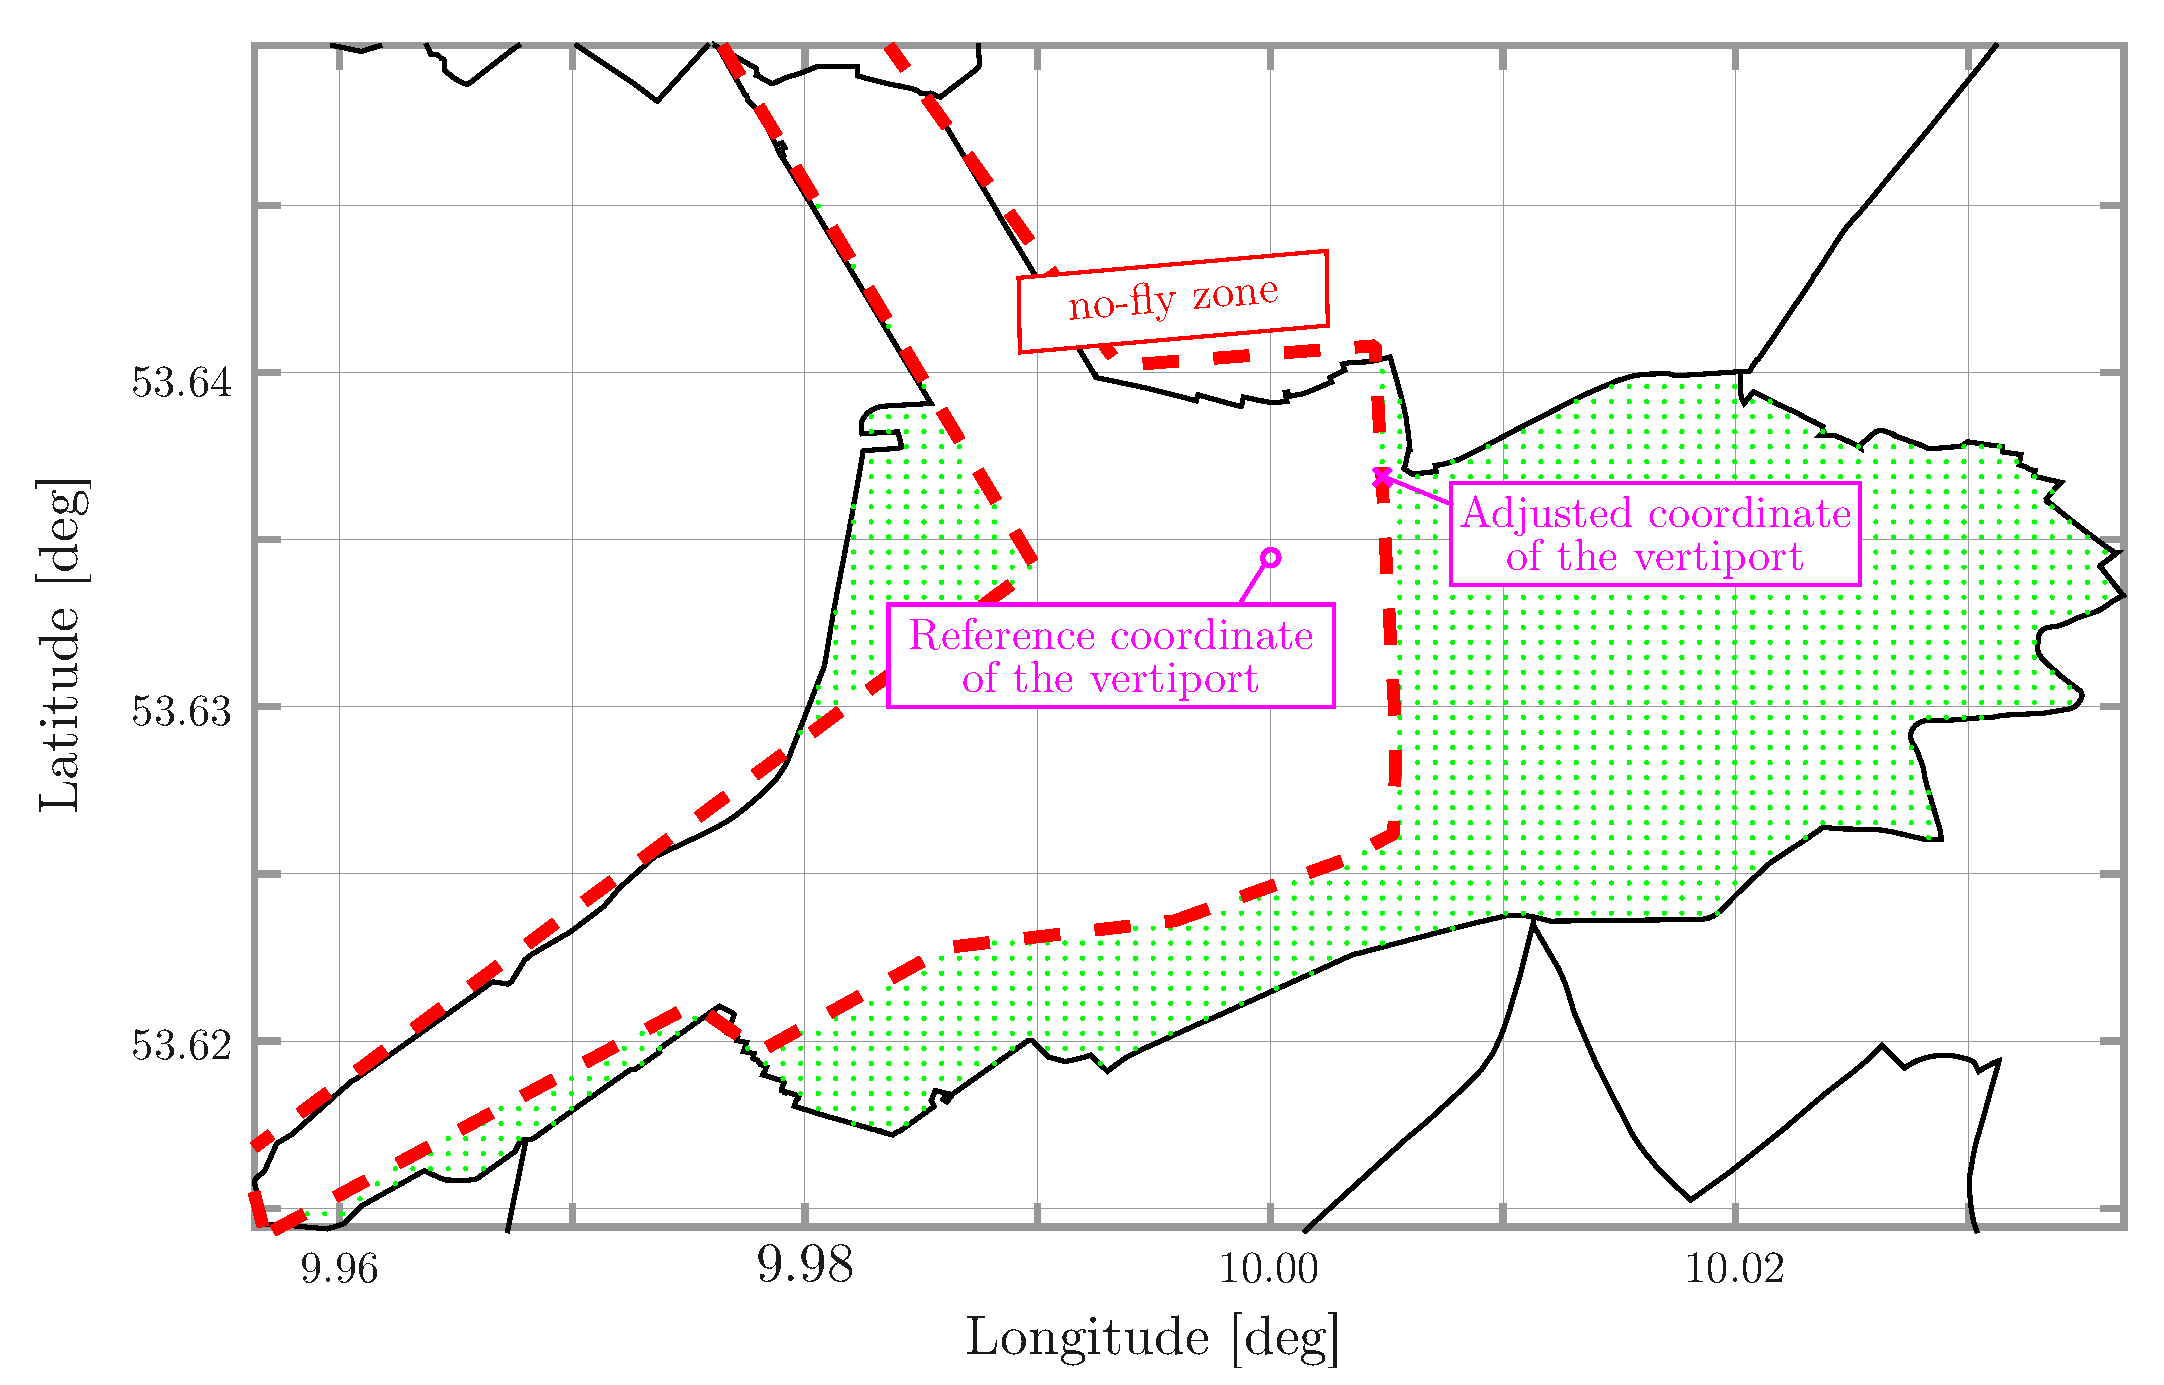
“Level 0” approach: The simple approach (Level 0) models vertiports as a single point with defined (e.g., infinite) capacity. Under the assumption that demand is provided for a specific area, e.g., a district of a city, the model allocates the vertiport at the center of gravity of the area covered by this district. In Figure 13, this point is labeled as “Reference coordinate of the vertiport”. If the coordinates are within a restricted airspace, labeled as “no-fly zone” in Figure 13, the point is shifted outside with minimum distance to the reference point.
“Level 1” approach: The UAM toolkit currently consists of two infrastructure components, a vertiport design tool (component 6 in 
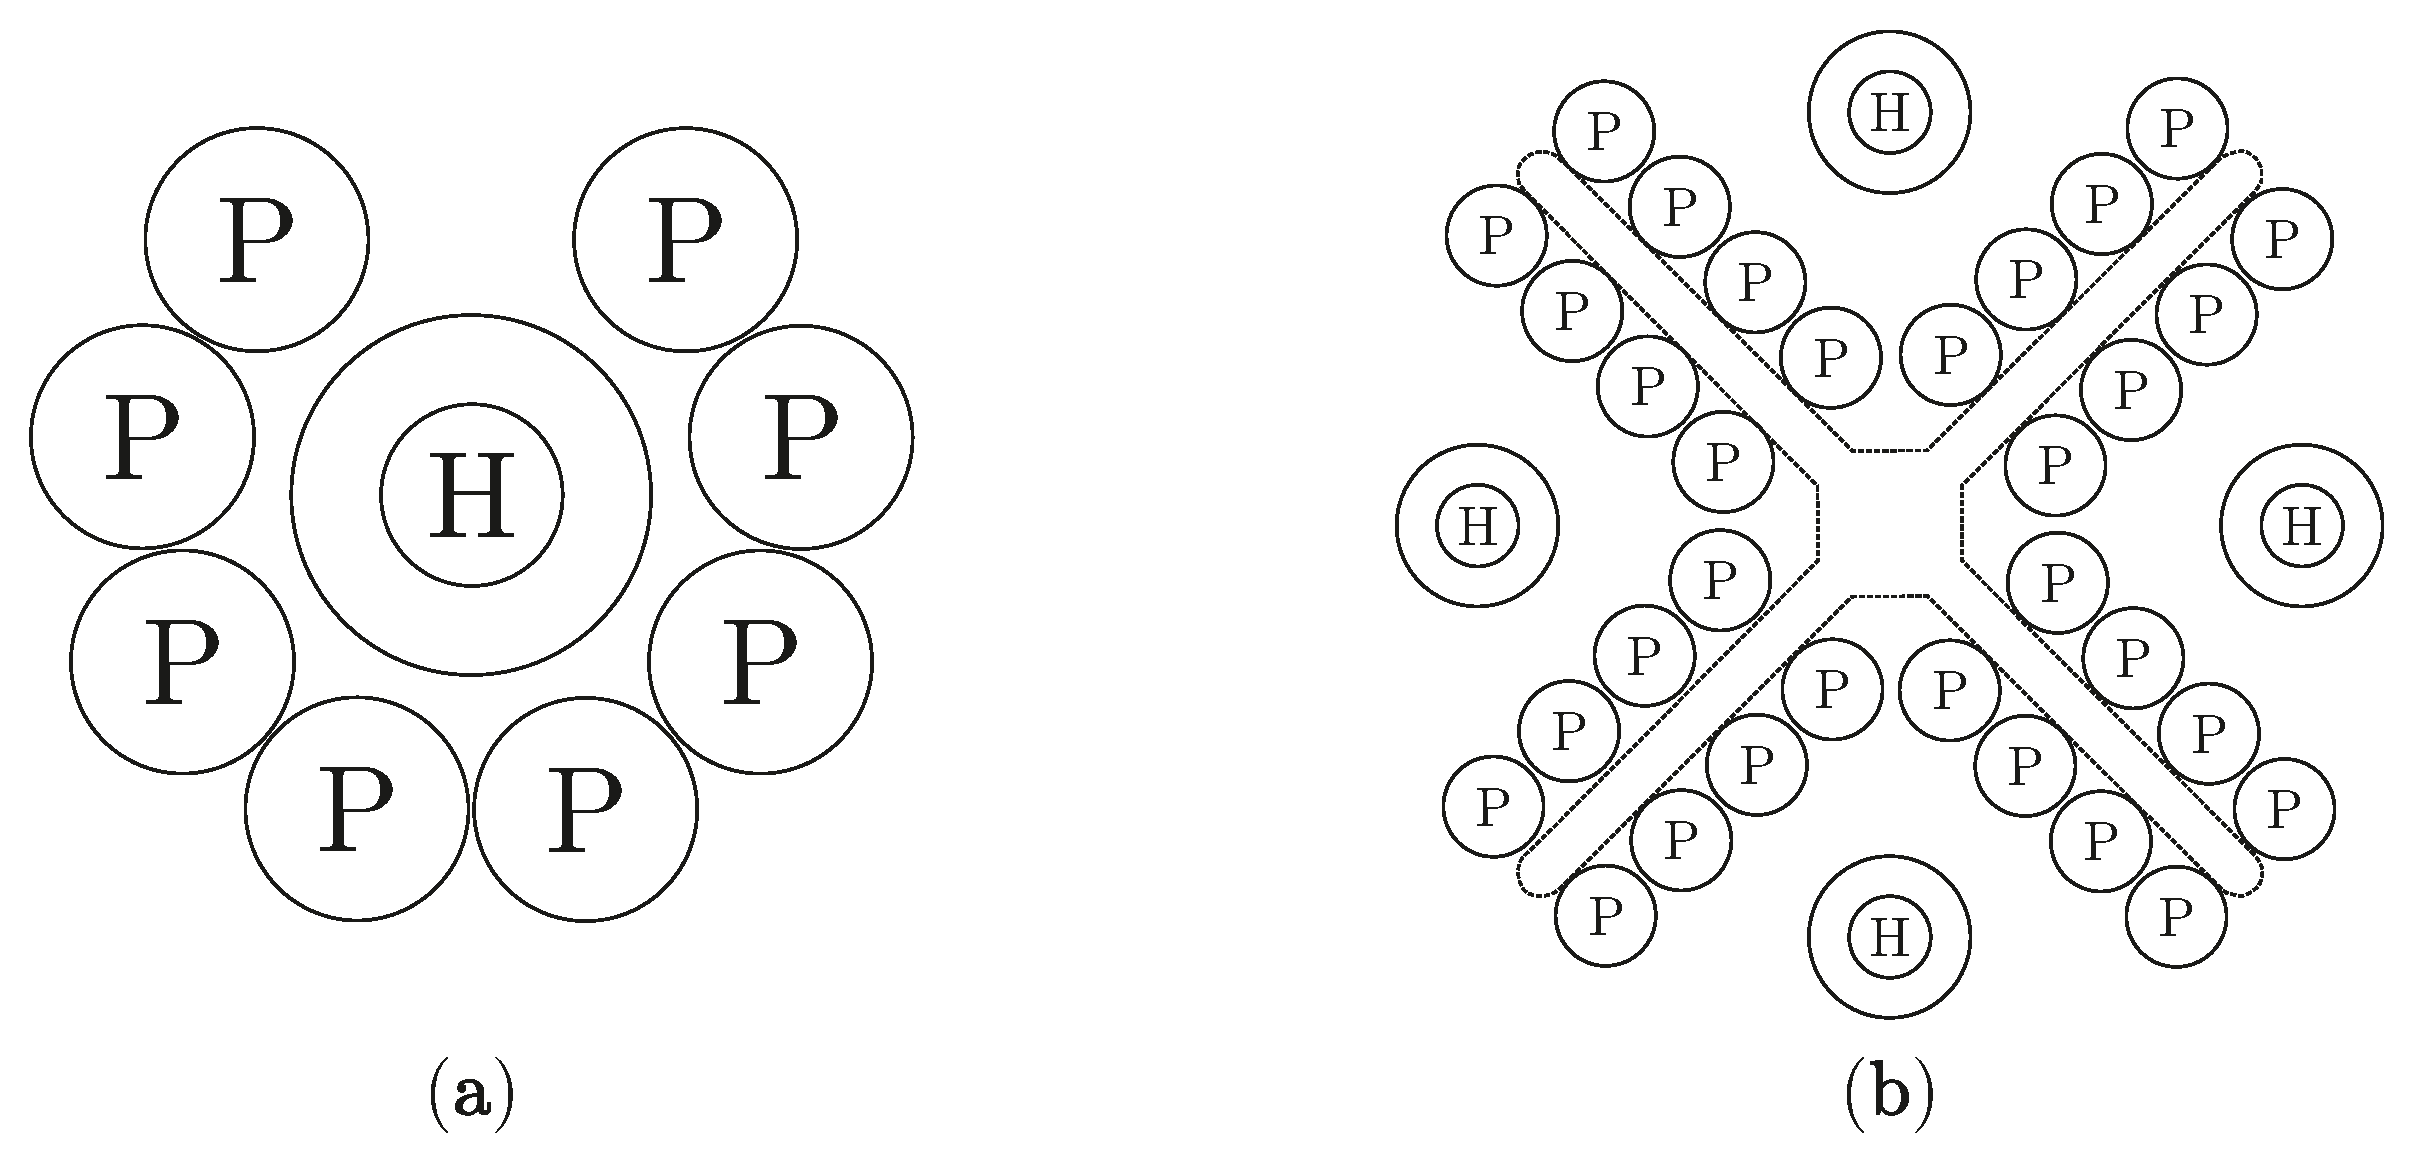
Figure 8) and a vertiport integration tool (component 7). The Vertiport Design component calculates the available capacities (maximum possible number of take-offs and landings per hour) for different vertiport concepts as well as the space requirements and land use required based on vehicle-specific parameters (e.g., the dimensions of the aircraft), simplified turn-around processes and the number and arrangement of parking ( n P ) and take-off positions ( n H ; so called vertipads). In the overall UAM simulation, the component can therefore be used to answer the question to what extent the optimum number of parking positions per vertipad is influenced by the operating concept (compare [28]). Two exemplary vertiport arrangement options are shown in Figure 14 for a vertiport (H) with n H take-off and landing areas and 8 · n H parking positions (P).
The Vertiport Integration component deals with the research area of the spatial distribution of take-off and landing sites (so-called vertiports) within the individual districts. For the Hamburg metropolitan region, the State Office for geo-information and surveying provides 3D building data with varying degrees of detail [59]. These data are available in the form of individual files for defined regions. Depending on the demand situation and the aircraft characteristics, the 3D data are used for a first identification of potential take-off and landing sites. Nevertheless, a manual check of the current status of landuse (municipal park, playground, parking sight, etc.) is still required.
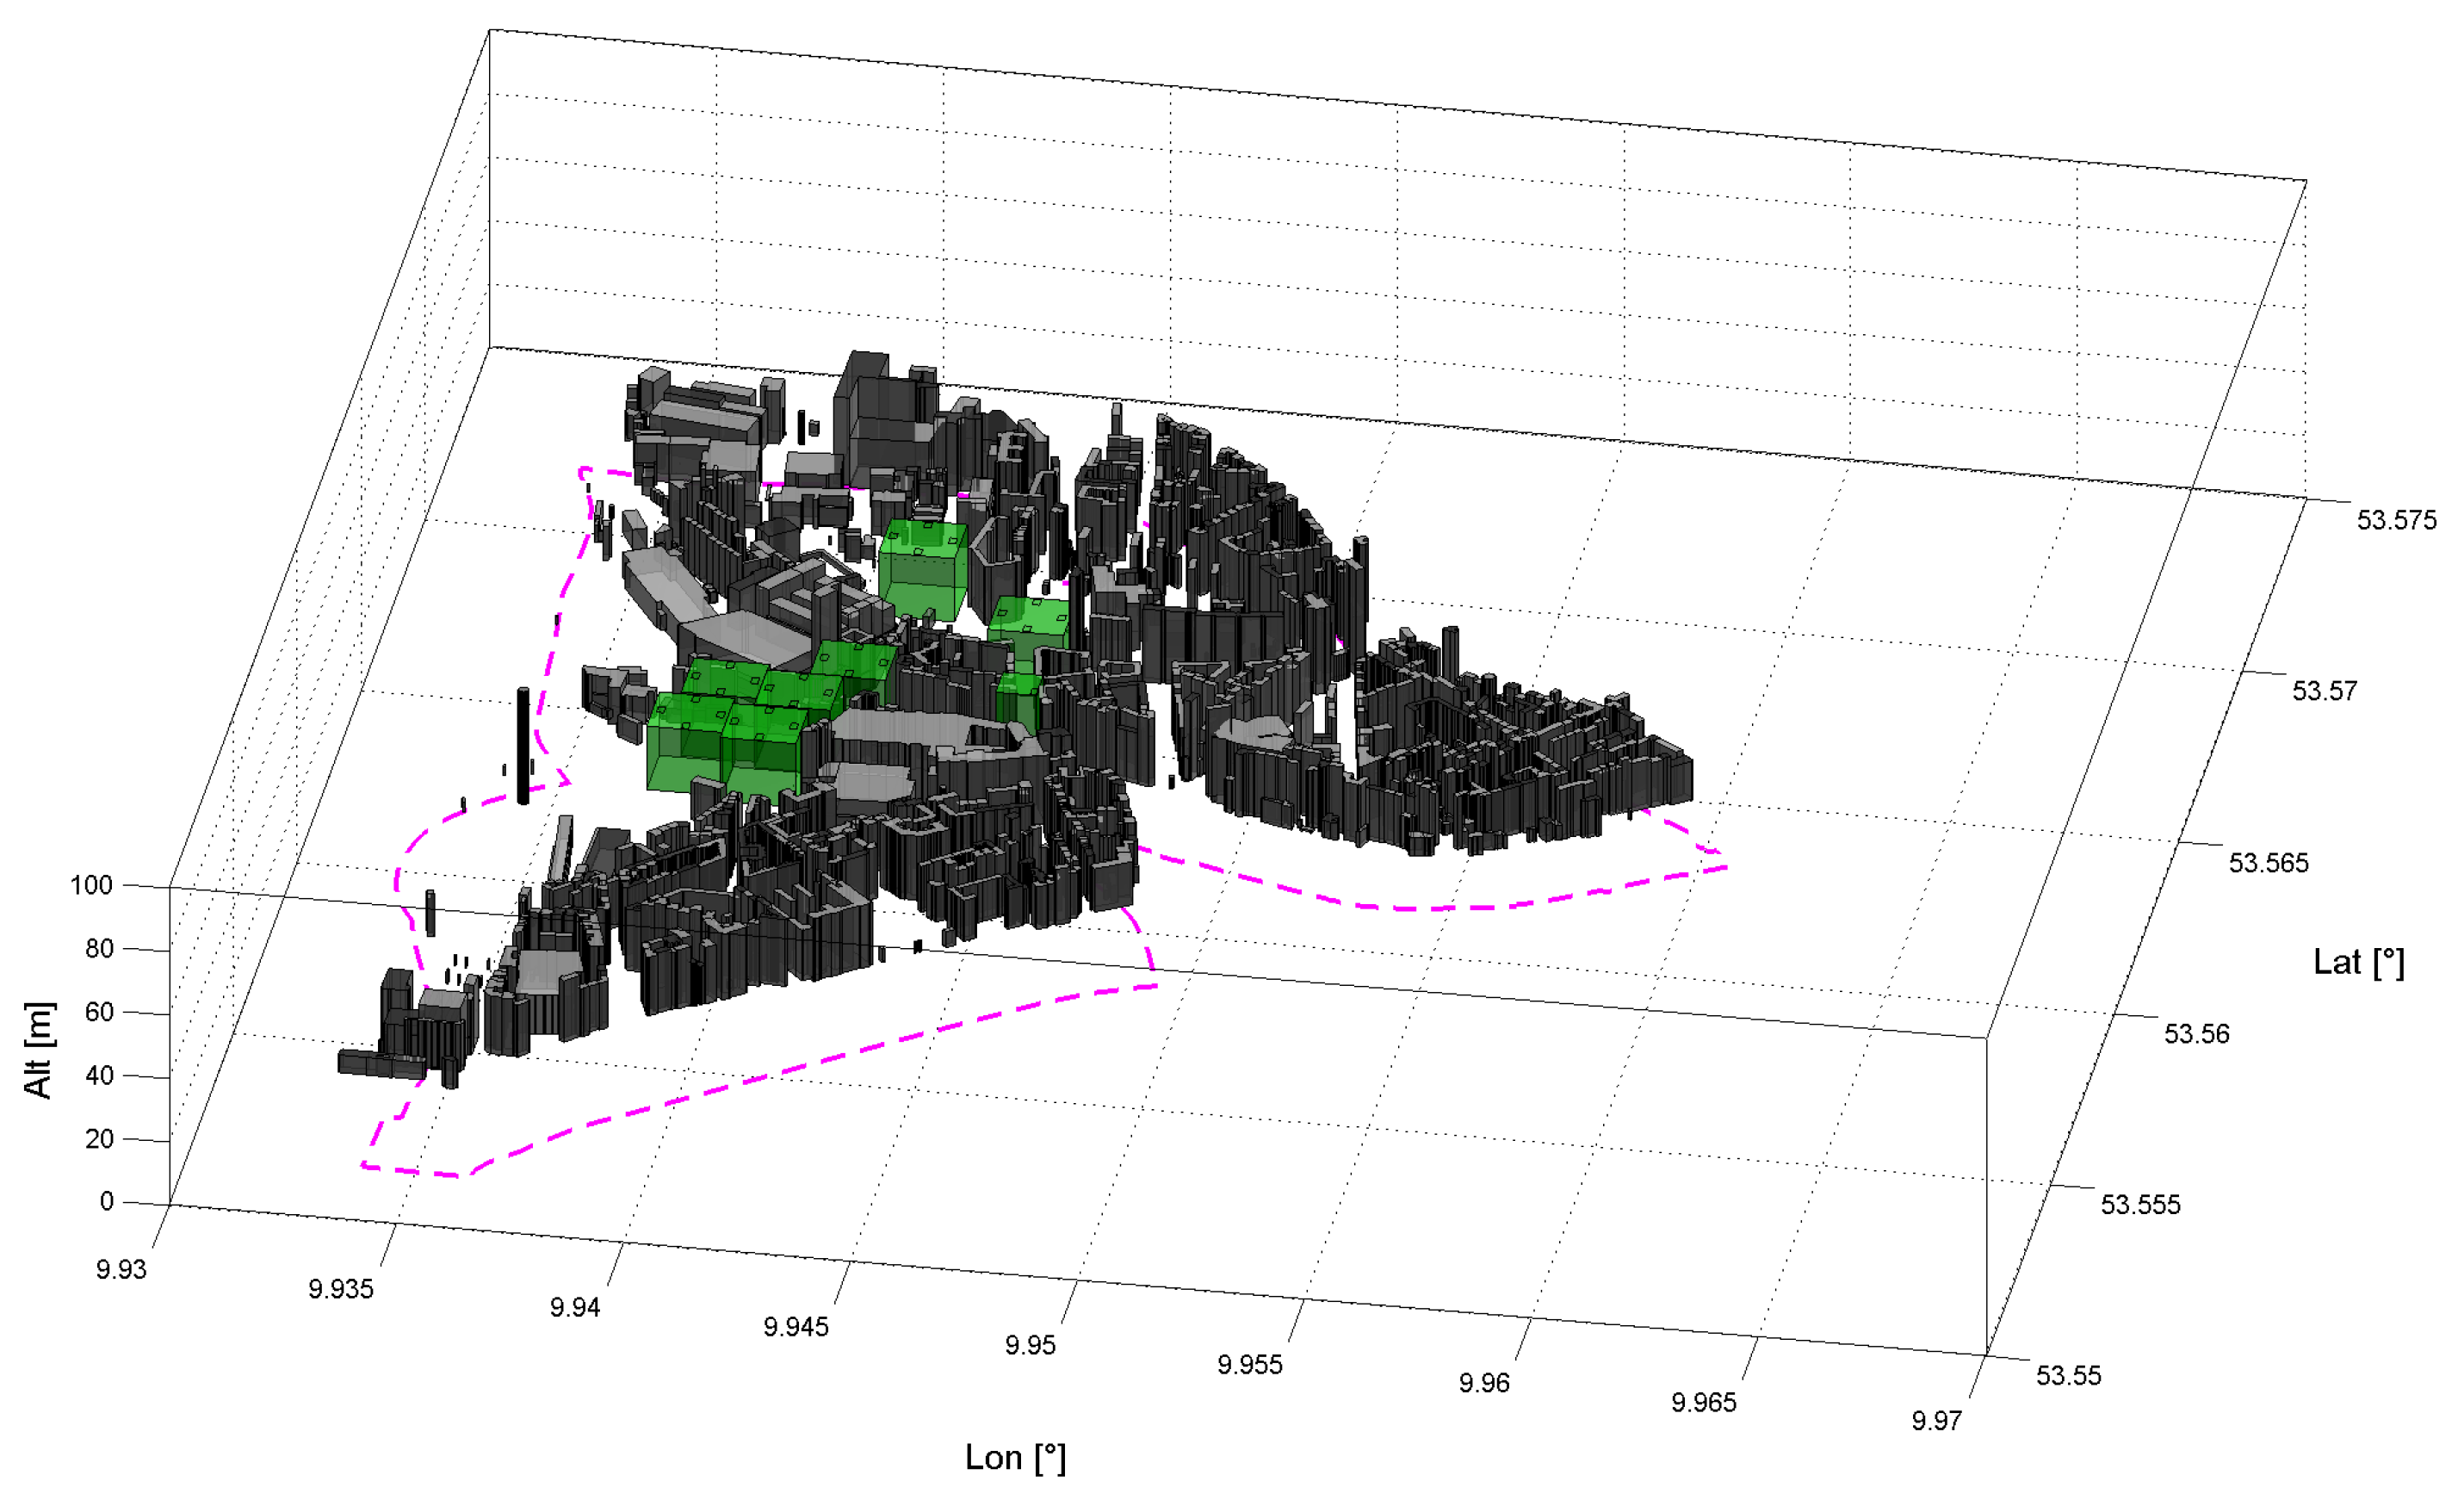
For the district “Altona-Nord” and a fictitious demand situation, Figure 15 exemplarily shows identified locations for possible vertiports locations, depicted as green cuboids. The demand for take-offs and landings can be covered by seven vertiports with four vertipads respectively, marked as squares, as well as one smaller vertiport with only one vertipad. At present, it is assumed that the construction of Vertiports will be carried out in specially designed, newly erected buildings. This means that the use of existing buildings (e.g., use of space on larger buildings) is not represented in the overall simulation at this stage. In addition, open spaces (so-called Obstacle Clearance Zones) around the Vertiports are not considered yet.
These assumptions would require vertical approach and departure routes as well as corresponding position and navigation accuracies, which must be met by the aircraft systems. Furthermore, the integration of further databases with information on traffic routes, waterways, nature reserves, etc. is necessary and the subject of current work. In addition, atmospheric effects as turbulence and wind gust and their interaction with urban topography might be important subjects for vertiport positioning, as well as downwash and its backlash from buildings. In the next steps, corresponding vertiports in commuter catchment areas such as Lüneburg, Bad Segeberg, and Buxtehude will also be designed in order to represent the expected traffic flows realistically. Here, we assume an on-demand UAM concept in which all vehicles fly along defined urban flight routes. The first step in defining these urban flight routes is to specify the individual position of the vertiports (as sources and sinks of the urban air transport system). At the current stage of simulation, a single reference point per quarter of Hamburg is assumed as take-off and landing coordinates. The general position of the reference point is defined as the centroid of each quarter, if there is no conflict with a no-fly zone. Otherwise, the reference point is relocated to the closest feasible position (see Figure 13). To avoid capacity bottlenecks of the ground infrastructure during the first simulation run, the number of start and parking positions of each vertiport is assumed to be infinite.

3.4. Urban Air Routing

An established concept of airspace organization in conventional aviation is given by ATS route networks, which are defined by sets of waypoints and directed connections in between. The movement of aircraft along these designated routes enables a channelized air traffic flow and therefore helps maintaining spatial separation for collision avoidance. Nevertheless, the concept was originally developed for aircraft with fixed wings rather than for rotary wings. The latter show significantly different flight performance and therefore have their own requirements, as they fly with lower speeds and are capable of hovering and starting vertically. It is recommendable to adapt airspace organization structure to the properties of the new vehicles and to the capabilities of the latest airspace monitoring and guidance technologies. Especially in the light of a shared use of urban airspace by PAVs (Passenger Air Vehicles) and UAVs (Unmanned Air Vehicles) in the future, it seems mandatory to develop new procedures in order to meet the requirements due to the presumed high densities.
In the course of previous investigations, several concepts were proposed in order to organize urban airspace for high density use by PAVs and UAVs, as presented in [
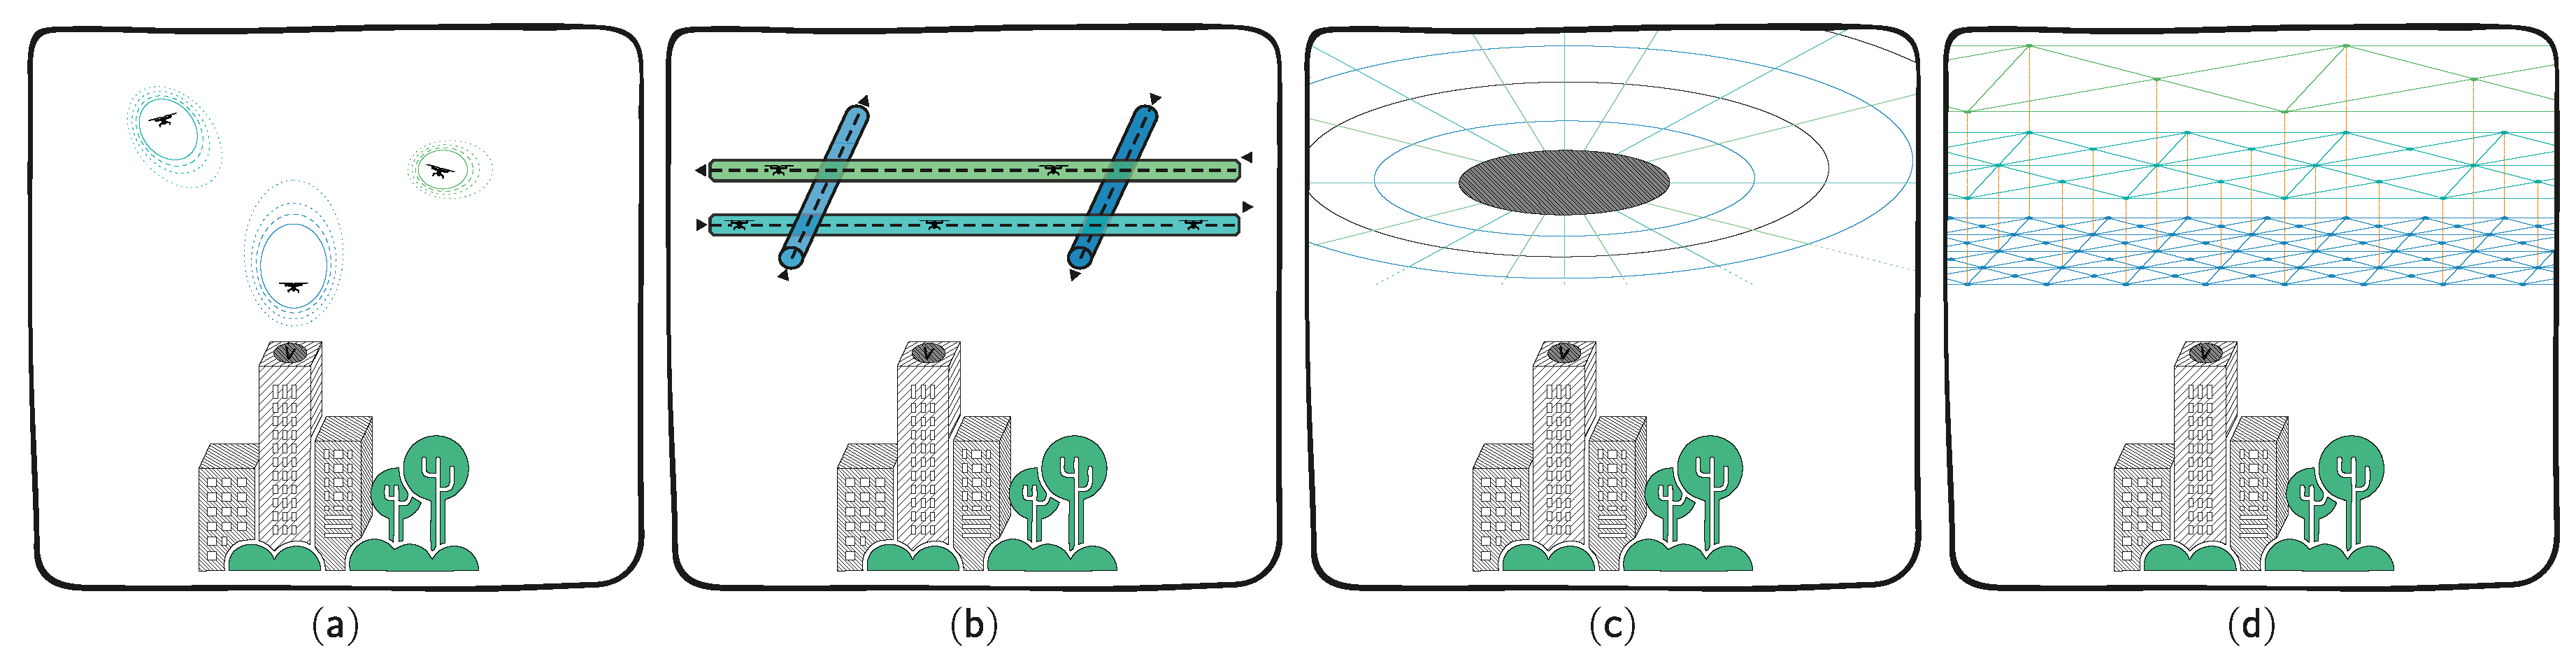
21]. A feasible option is a Free-Flight-inspired concept, which—aside from physical constraints—allows a free choice of flight velocity, altitude, and flight track. Such a concept holds high potential for flight movements to reduce energy consumption due to optimized tracks; nevertheless, it requires high efforts in airspace monitoring and conflict management throughout all phases of flight. A suitable approach for implementation is presented in [22], which proposes a density-based airspace management system that opens up the airspace equally for lowly-equipped and highly-equipped UAS by assigning a safety ellipsoid to each airspace user. As the size of this ellipsoid (see Figure 16a) is depending on navigation, communication and the capability to detect other airspace users (cooperative and uncooperative), the concept creates an incentive for manufacturers and operators to invest in performance-related technology without excluding poorly equipped airspace users from entering the urban airspace.
Another airspace organization concept is based on the idea of the hemispheric rule, which has been applied in aviation for decades. It assigns altitudes to the aircraft depending on its bearing, focusing the main traffic direction on each flight level and therefore reducing the potential of conflicts (see Figure 16b). A similar concept is represented by division of airspace into radial and concentric zones, in which the traffic is channelized regarding the direction of flight. The latter two options both have a limitation of degrees of freedom in trajectory design in common, affecting the possible efficiency for an increased safety. The last presented option is the introduction of an urban grid of waypoints with multiple layers in altitude. In order to take increasing travel speeds with higher altitudes into account, the mesh size between the nodes is increasing with the level of altitude.
In the course of this study, the airspace is organized in a fixed route network between selected origin–destination pairs (see Section 3.2). In accordance with [60], zones with limited permission of air traffic operation have been identified for the city of Hamburg, so called no-fly zones, depicted as red polygons in Figure 17 that were primarily chosen for reasons of safety concerns (airports of Hamburg, industrial sites and power plants, crowded public facilities like football stadiums, etc.) and represent a preliminary selection that might be expanded in future revisions—for instance, taking criteria as noise into consideration.
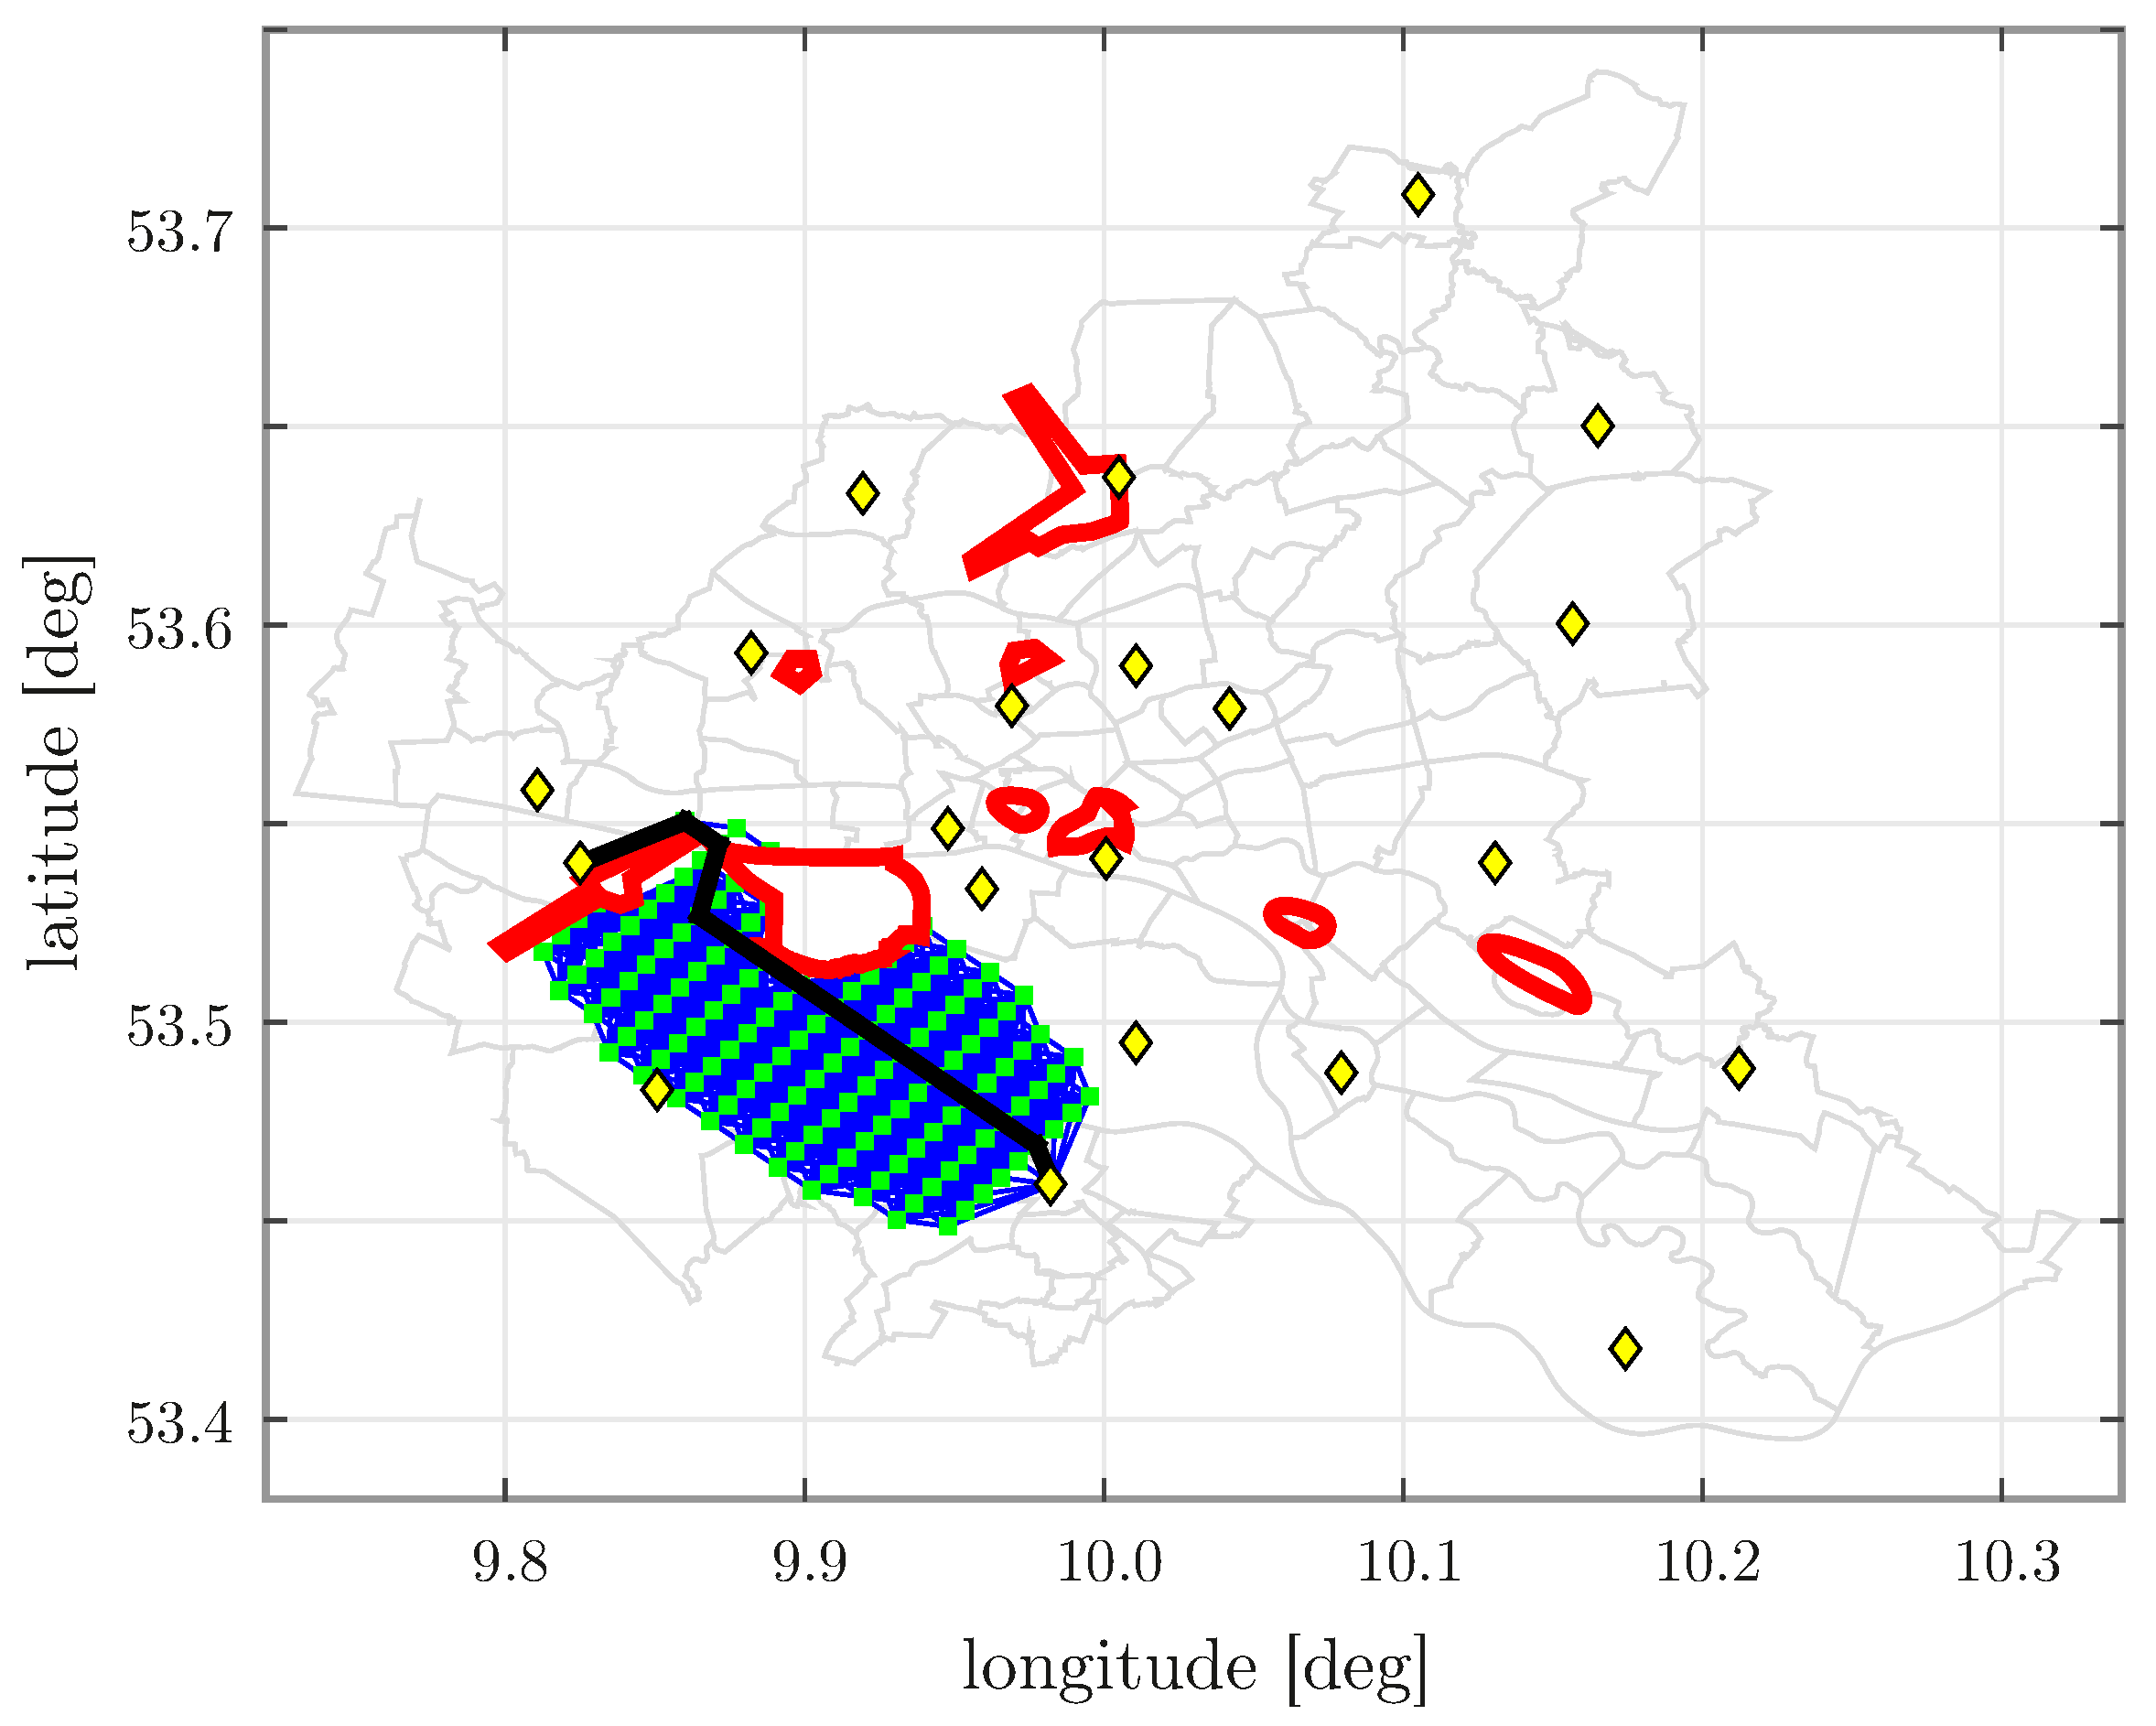
Since there are no atmospheric effects such as wind taken into consideration, the lateral tracks avoiding the no-fly zones can be determined and used permanently throughout this study. In order to find the respective optimal routing for each specific origin–destination pair (OD), a set of potential waypoints (green diamonds) is created, which are connected by edges (blue lines). This graph generation is carried out according to the method presented by [61]. In a first step, the orthodrome is calculated between origin and destination, waypoints are generated in intervals of 1000 m ground distance along the track. Subsequently, in each of these potential waypoints, a node array is generated perpendicularly to the direct connection OD, such that the maximum detour from origin to destination via the outmost node is up to 6% higher than the direct connection. As a result, an area is obtained which is applied as search space for the optimal track. All nodes and edges crossing one of the defined no-fly zones are detected and eliminated from this graph, before applying a Dijkstra-Algorithm [62] in order to find the shortest lateral path through the search space. In order to avoid collisions between oncoming and intersecting vehicles, lateral tracks are shifted vertically according to a “quadrocircular rule” (see Section 3.6 and Figure 16b).
Currently, tracks are determined individually per OD pair; interactions between OD-specific tracks are not yet taken into account. This issue could be addressed by defining a global search space (generic grid, compare Figure 16d) in combination with an agent based simulation, implementing an active collision avoidance.

3.5. Flight Planning/Scheduling and ATM

In the context of UAM, there is no common understanding for flight planning and scheduling yet. Nevertheless, several sub-functions and domains of air traffic management (ATM) are related to this area—for instance, trajectory and separation management, (dynamic) airspace management and flight rules according to specific UAV mission definitions. The focus of this study is on creation of schedules for urban flights (flight plan preparation and registration) as well as their surveillance in an urban area itself (see Section 3.7).
As air taxi services are expected to be provided “on call” at short notice (“On-Demand-Service”; see 
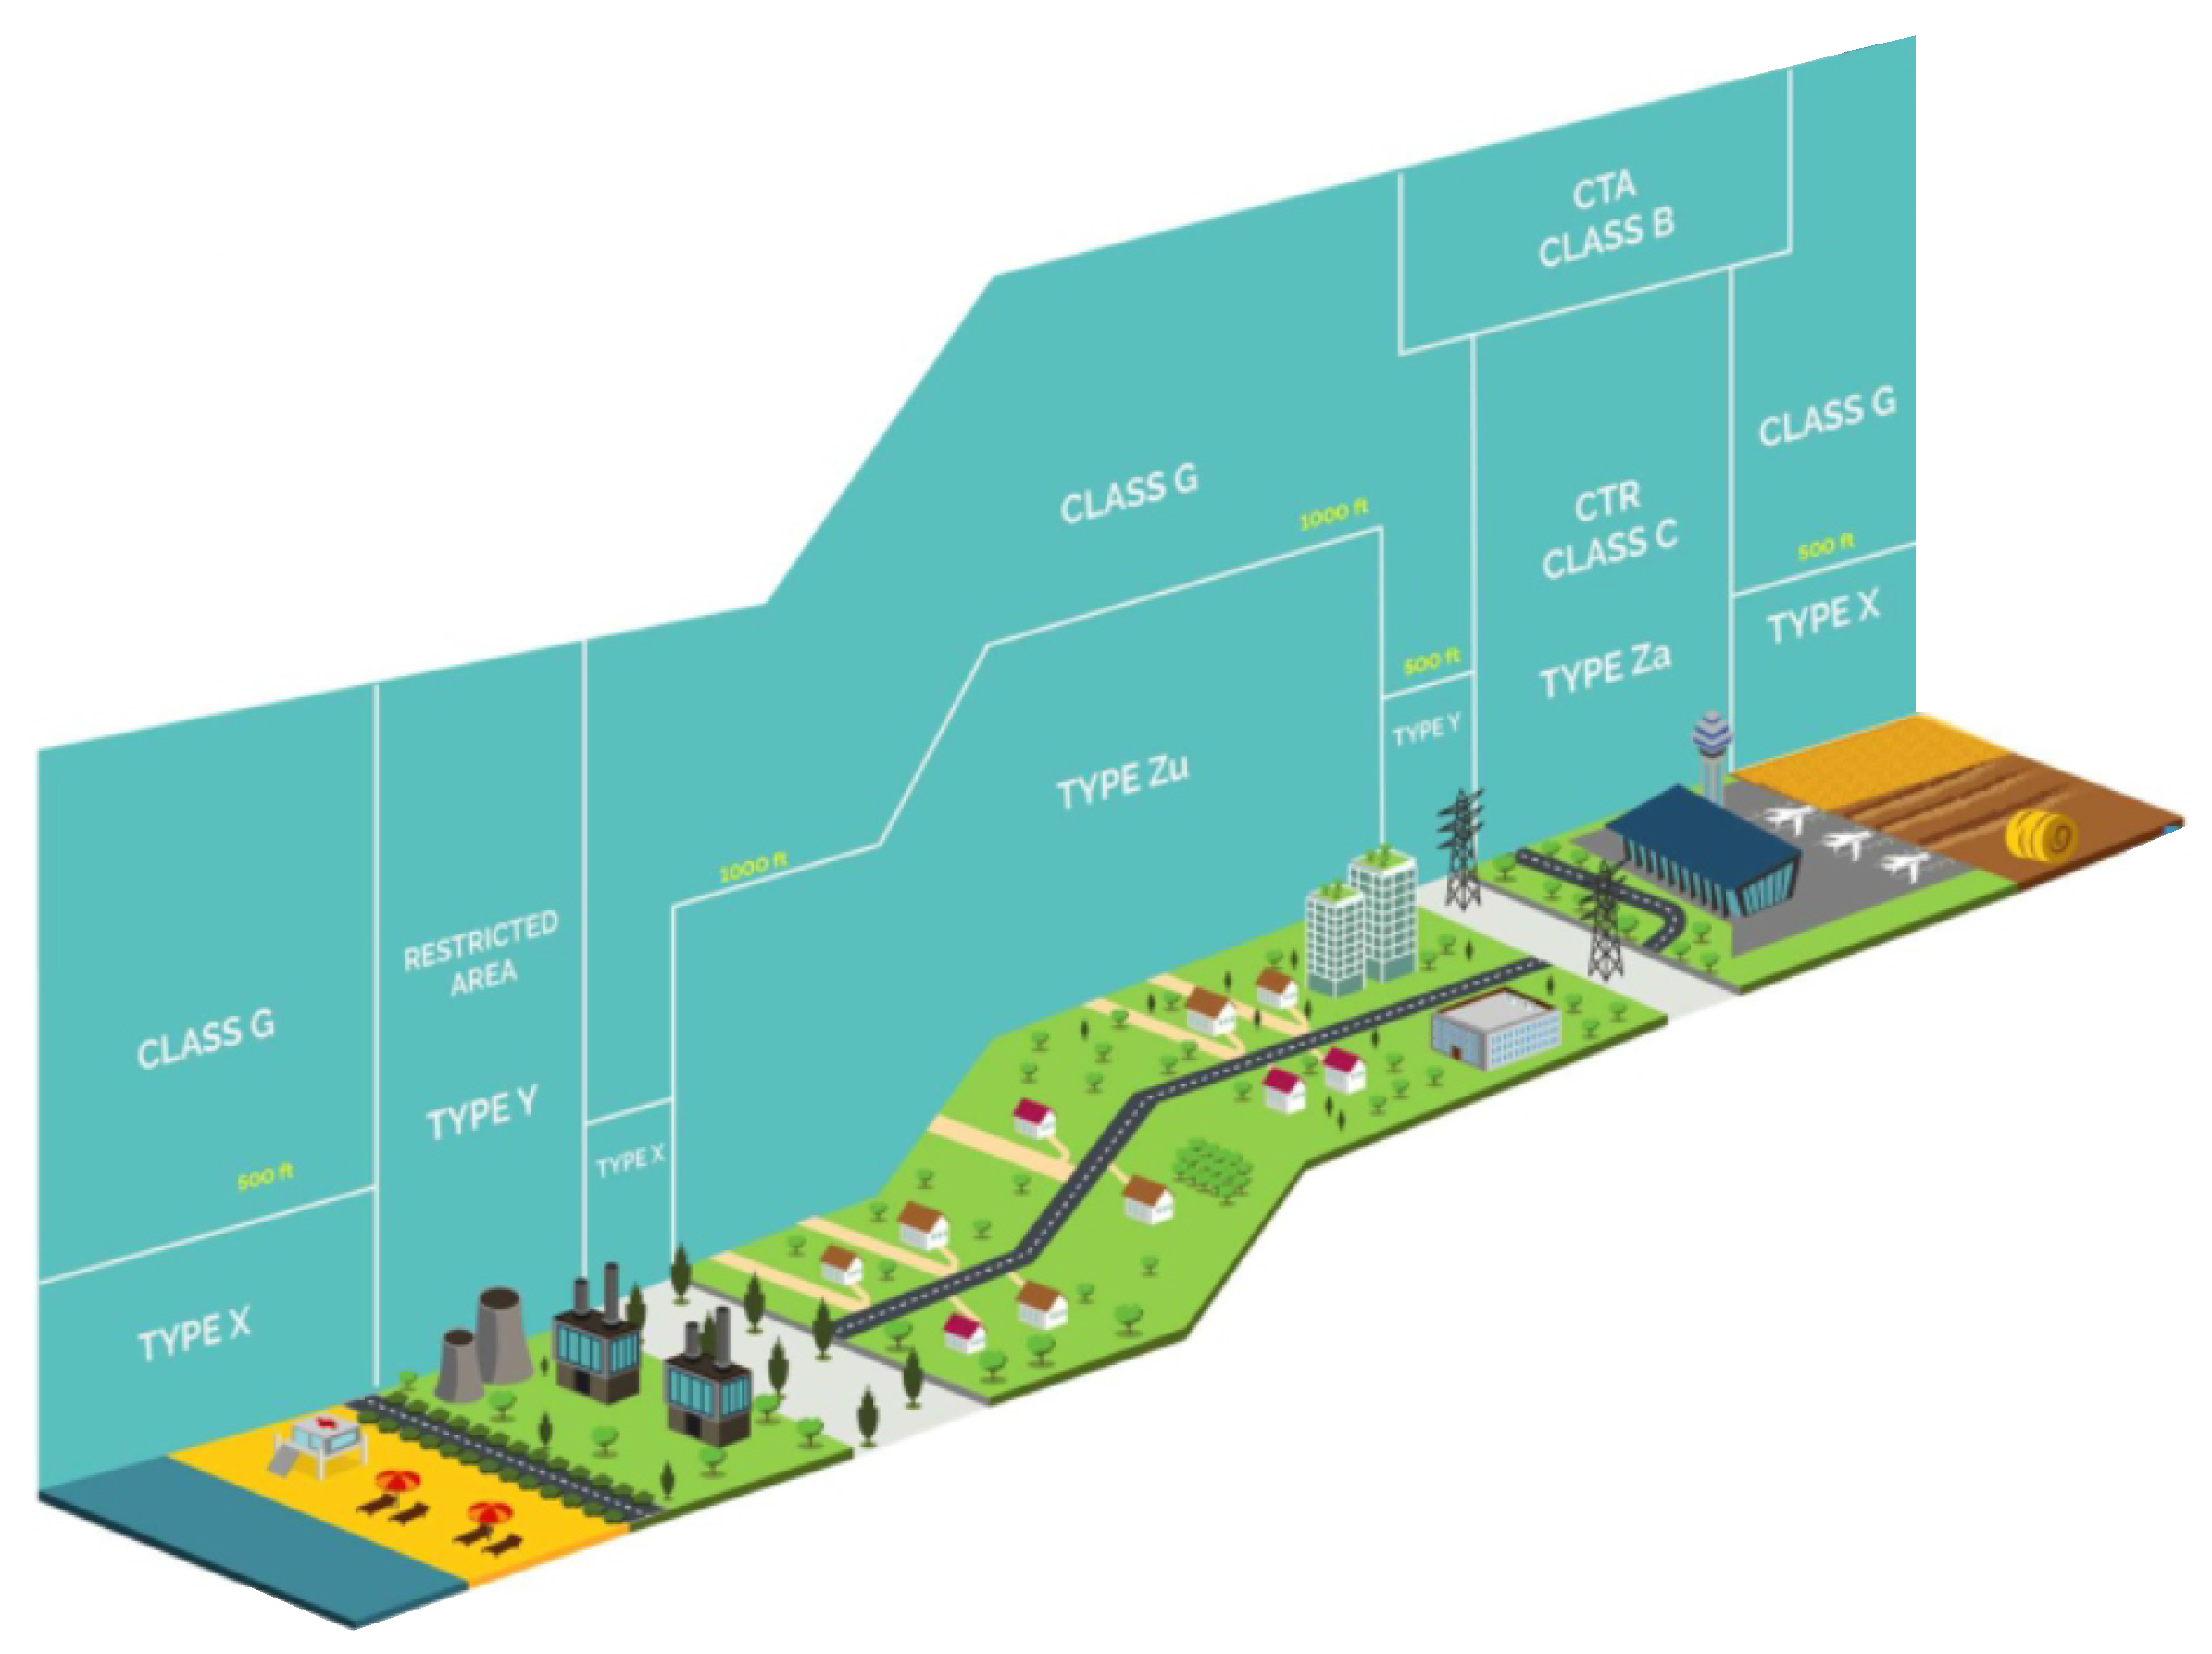
Section 3.8), a flexible and efficient short-term mission management is one of the main requirements of UAM. Unmanned tasks such as search and rescue and cargo transport within a metropolitan area show similar requirements. Even though On-Demand UAM is linked to an ultra-short planning phase—in contrast to conventional aviation—a flight plan is mandatory according to the Standardised European Rules of the Air (SERA) [63] for all flights that are classified to airspaces with the corresponding risk category ‘Y’ (high) and ‘Z’ (highest; see Figure 18). These categories require safety-critical, access-controlled services or advisory notices. For the highest risk classification for instance, a conflict resolution is needed before flight and in flight.
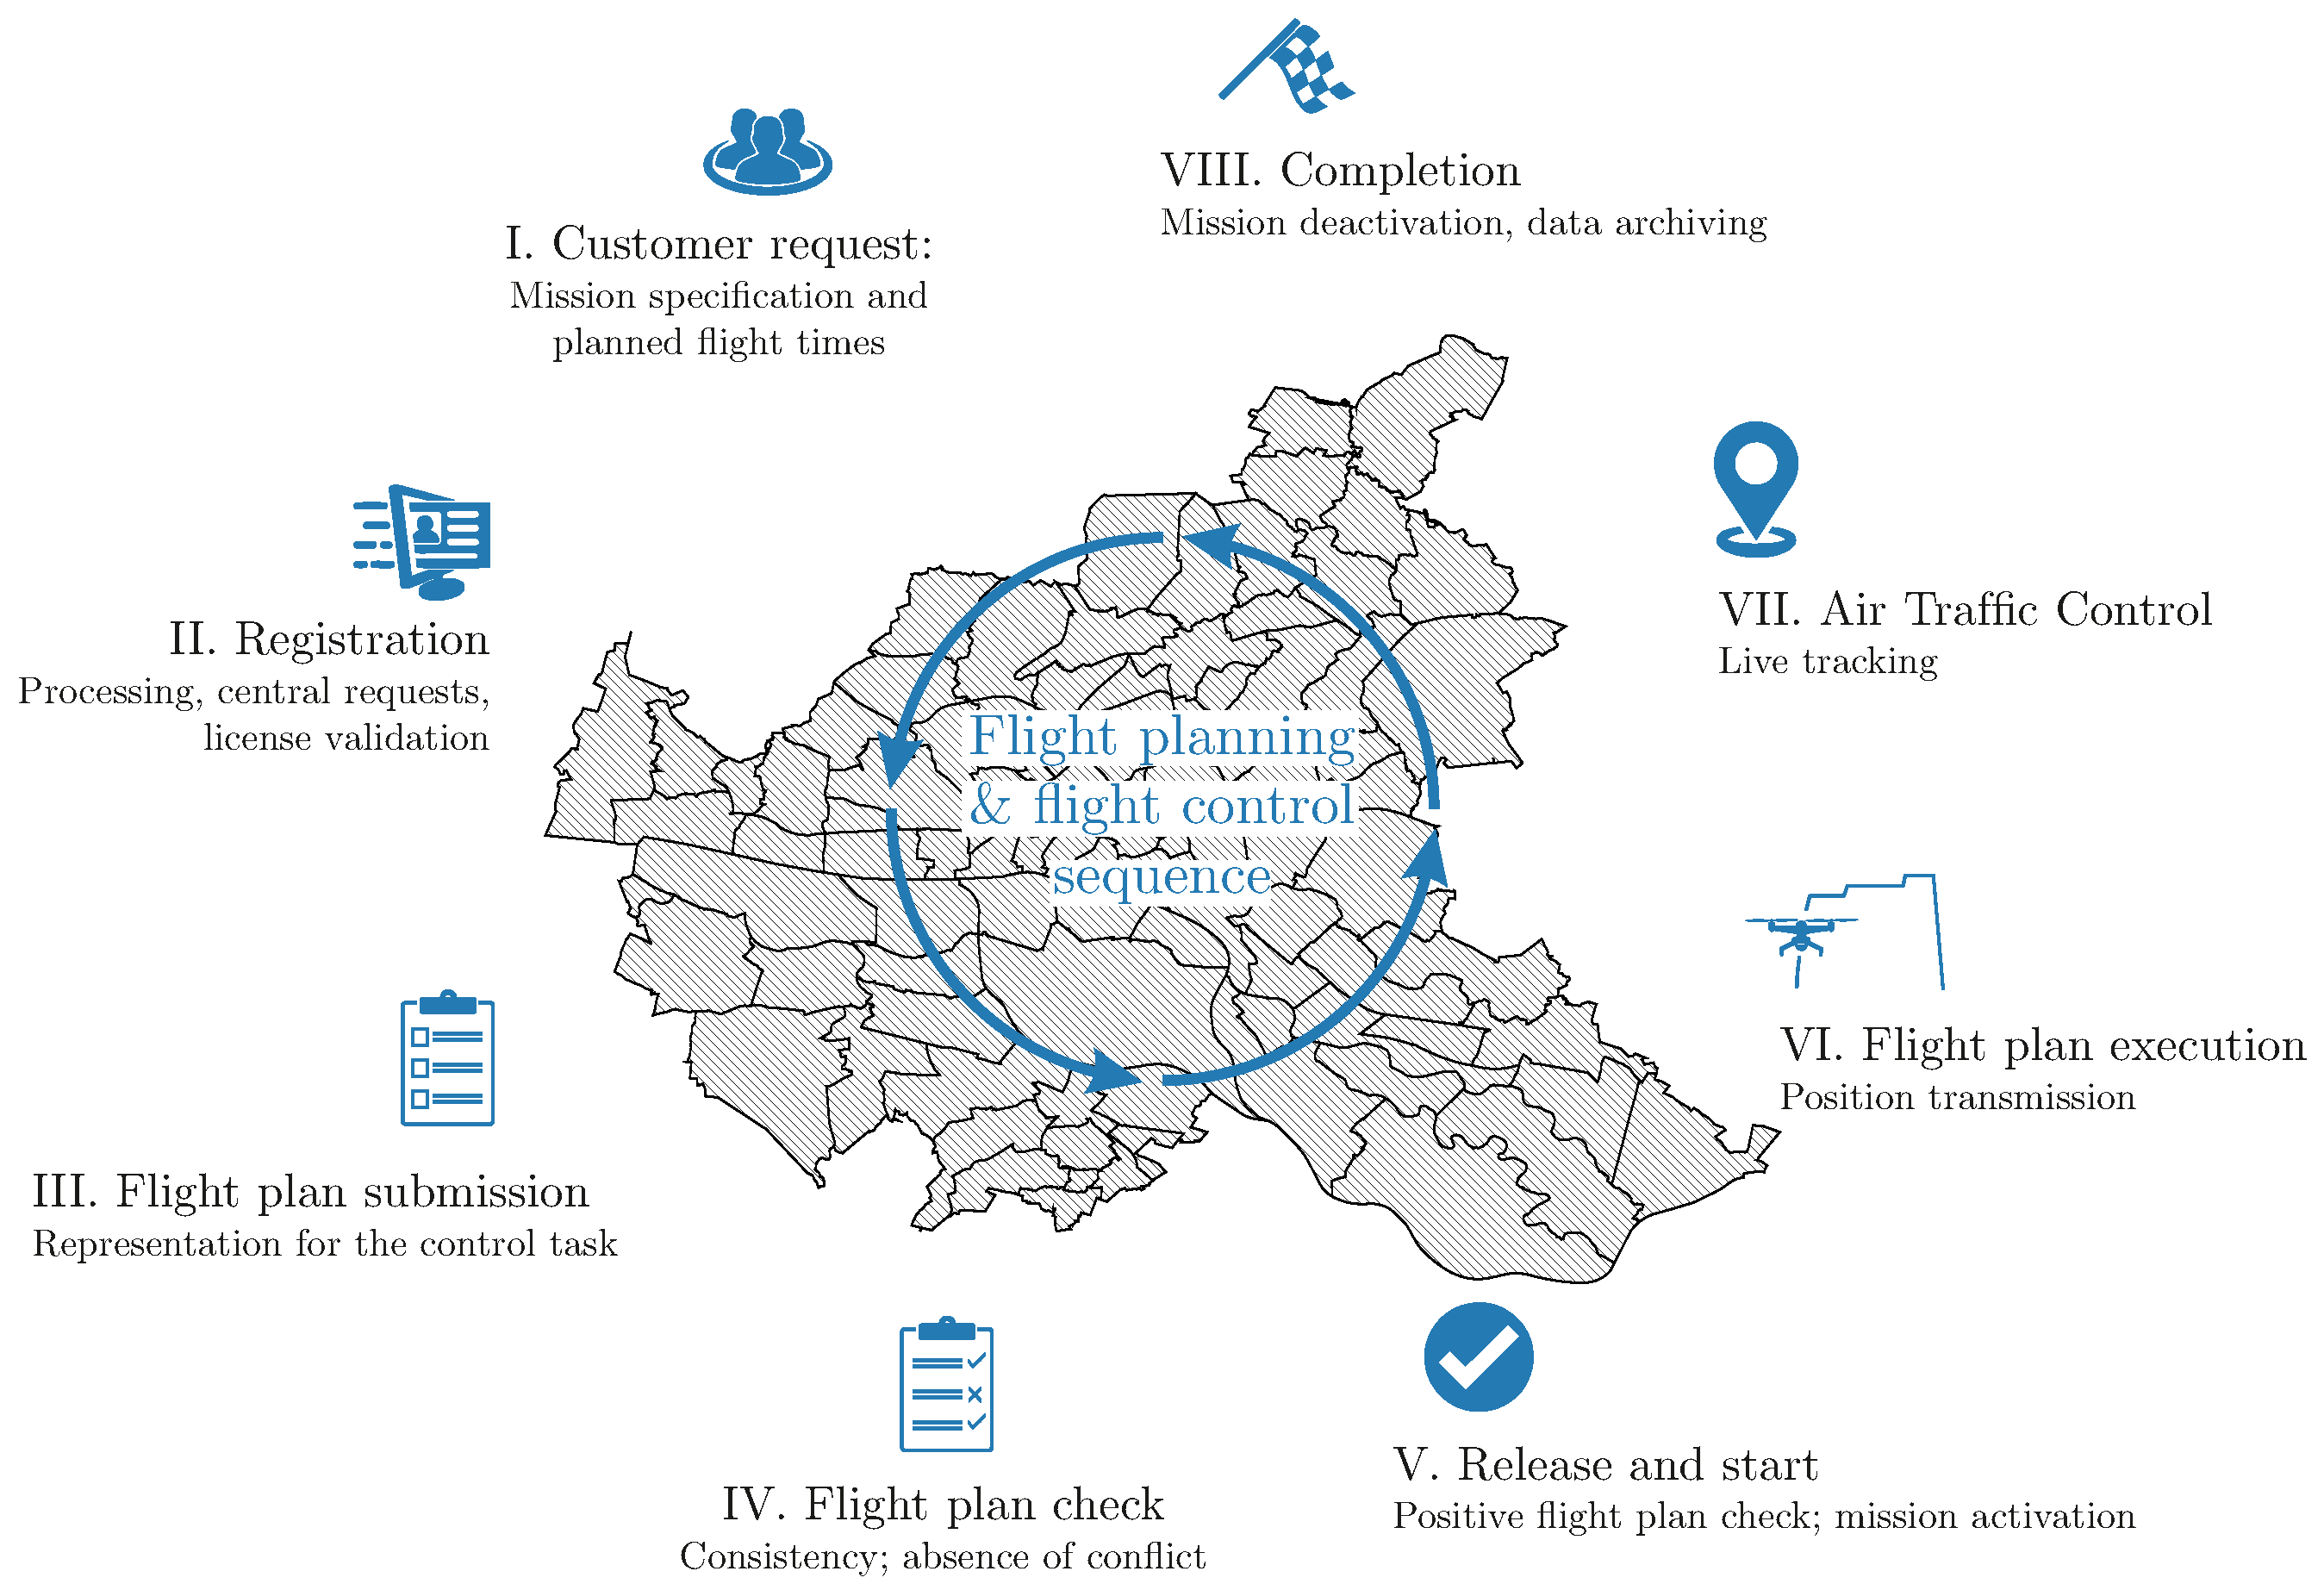
In order to check the alternating flight plans of the whole UAM system continuously, a processing step of the operational plan is required in addition to the tasks of modern Air Traffic Flow Management. A possible mission-related flight planning and control sequence is shown in Figure 19. This comprises eight steps, which describe all necessary sub-steps from customer request for a mission task and completion of the mission: (i) customer inquiry, (ii) registration, (iii) task flight plan, (iv) flight plan check, (v) clearance and take-off, (vi) flight execution, (vii) flight control, and (viii) flight termination and closure.
A high-level overview of NASA’s initial airspace integration concepts is provided by [20]. To address UAM airspace integration barriers, NASA plans to investigate different procedures for congestion, disruption, and separation management. In addition, research work will be carried out on interoperability and on implementing a continuous network-wide scheduling. A sequencing and scheduling algorithm for on-demand UAM arrivals is introduced, i. a., by [25,32]. For separating eVTOLs safely and with minimal delay [25], a mixed-integer linear program was utilized that calculates the optimal required time of arrival, taking into account the remaining battery charge and vertiport capacity. In [32], a highly-autonomous resolver algorithm that was originally designed for traditional aviation, was adapted to UAM-specific vehicles, missions, and conflict resolution.
Within this study, a simplified UAM scheduling tool (component 9) is developed. This tool creates a network-wide flight plan for the route structure described in Section 3.2 and Section 3.4. As a first step, the estimated 24-hour UAM demand distributions of each route (input from component 3; see Figure 8 and Figure 11), is broken down into separate flight movements. Relating to Figure 19, this step can be referred to block I: customer request. For this purpose, time windows for take-off on an hourly base for sequenced flights are generated for each route in accordance with the given minimum separation restriction and a maximum separation time needed to successfully allocate all requested flight movements planned within this hour. Here, we apply arbitrary separation minima of 600 m in horizontal and of 50 m in vertical dimension; temporal separation standards are not yet implemented (see Section 3.7). Relating to Figure 19, this step can be referred to block II and III: registration and submission.
In the current version, the UAM demand is allocated to a minimum number of vehicles resulting in maximum values of seat load factor (LF). Nevertheless, if demanded, flights are also scheduled for requests of single customers. As the simulation considers solely one aircraft type (with four seats), the occurring values of LF vary in a range of 25–100%, which influence revenues of ride-sharing services (see Section 3.8). The choice of the vehicle class (regarding its passenger capacity) therefore has a major influence on the choice of the UAM pricing system (Section 3.8) and the UAM demand (Section 3.2) according to its price elasticity. This correlation is planned to be considered in the UAM system modeling (see outer iteration in Figure 6 and Figure 7).
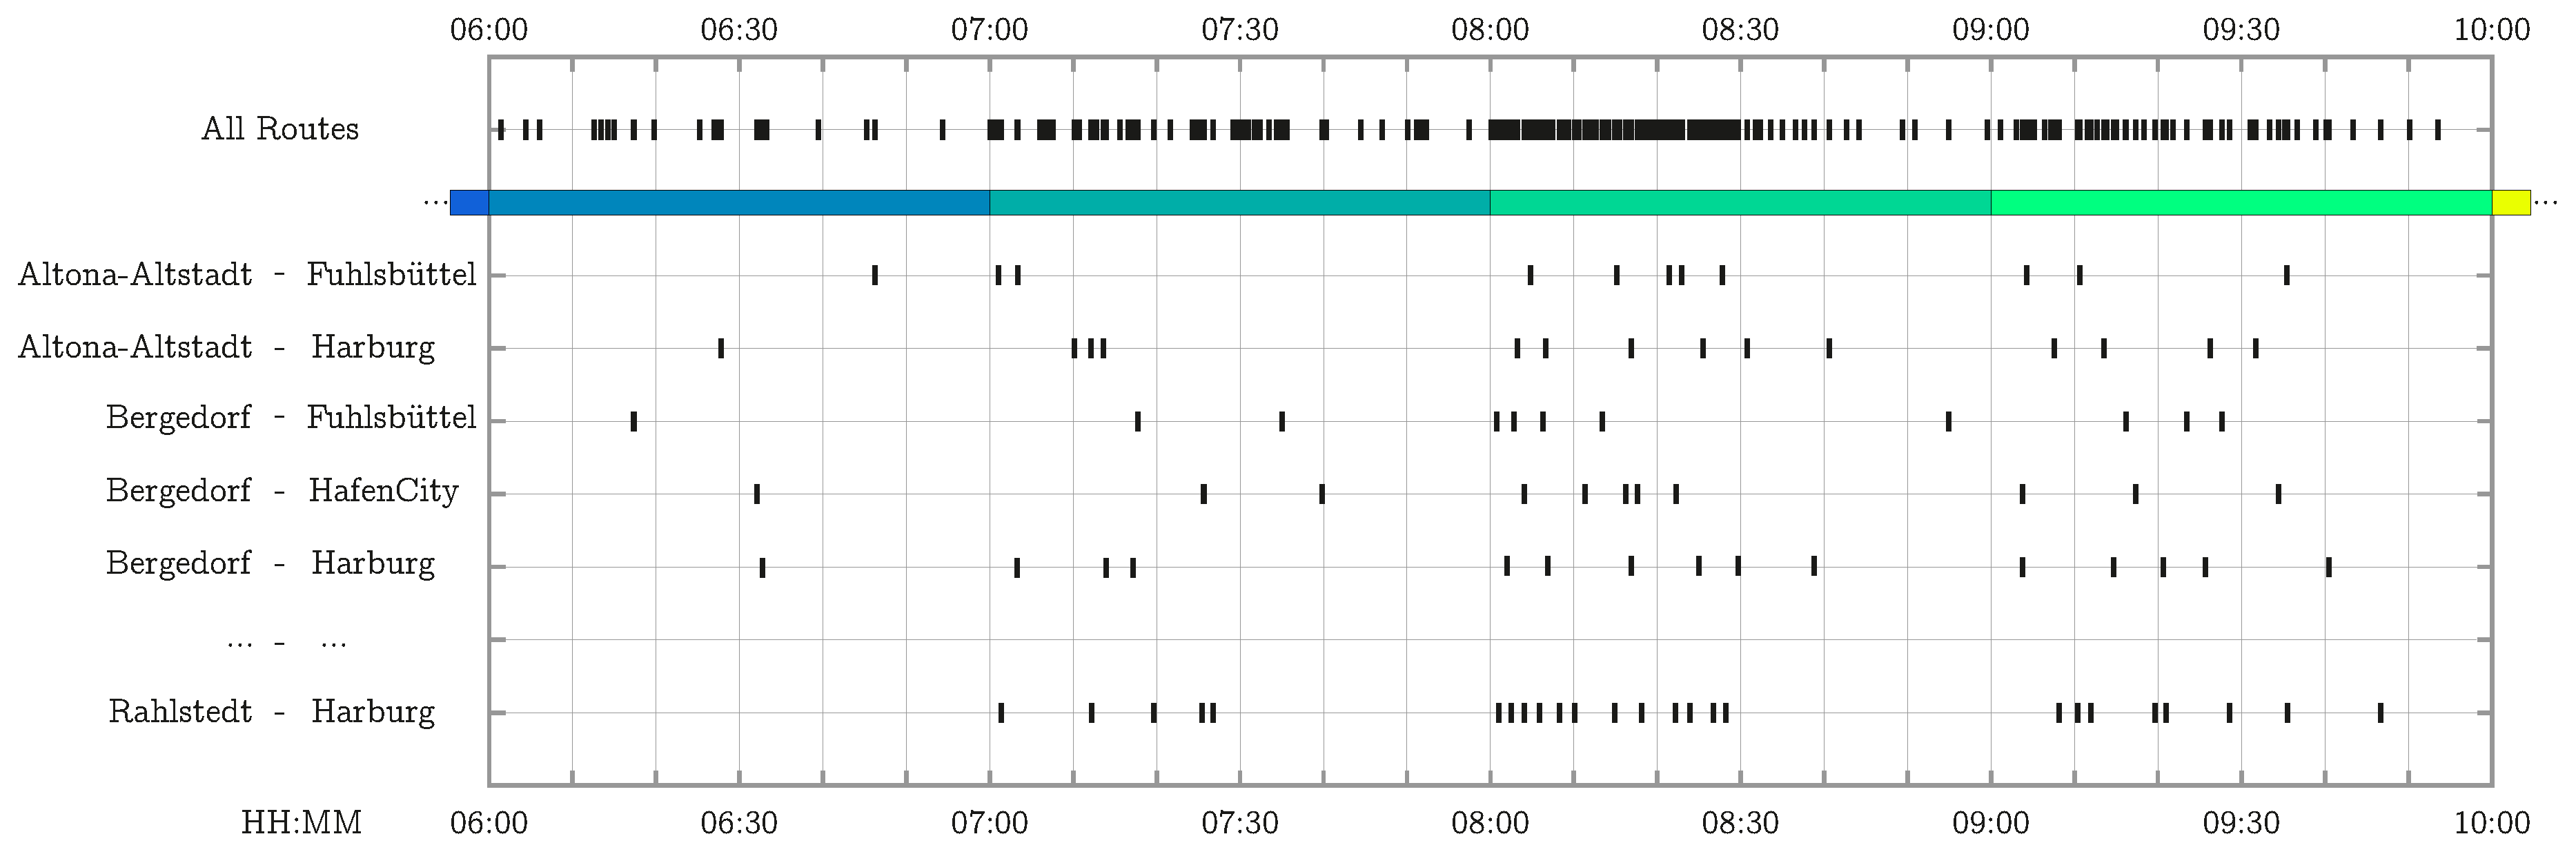
The second step of the tool is the allocation of an explicit vertiport departure time (“available slot”), which corresponds to block IV (flight plan check) in Figure 19. If all slots are occupied in the requested time window for take-off, the flight will be delayed until either a free slot is available or a maximum defined waiting time is exceeded. In case of a successful allocation, the departure of the flight is determined stochastically within the selected time interval. Otherwise, the flight is canceled.
For the first UAM expansion phase, scheduled departure times are plotted in Figure 20 over a time interval from 6:00 a.m. to 10:00 a.m.
As the capacity of all vertiports is assumed to be infinite, a reallocation of departure times is not necessary. The total number of flights of all UAM expansion phases is shown in Table 3. In scenario 3, almost 2000 flight movements are scheduled for Hamburg City, which corresponds to an average of about 80 flights per hour.
For future works, it is planned to implement an agent-based simulation approach into the UAM system model for resource management, de-conflicting and viability assessment. Each agent is assumed to represent one vehicle that has a set of several properties concerning the location, availability, performance envelope, capacity and its current condition (energy level, maintenance cycle). Furthermore, this establishes the required simulation capabilities to assess the robustness of the modeled system. A degraded system being exposed to meteorological disturbing factors for instance, such as a locally occurring convective cell, could be assessed in terms of its remaining transport capacity and punctuality. In addition, possible counter measures with regard to limited predictability of such events should be object of investigation.

3.6. Flight Trajectories

The Urban Trajectory Calculation Module (uTCM) is a simplified tool extraction from the Trajectory Calculation Module (TCM) [64], following a kinematic approach. Based on the tracks of the route network (see Section 3.4), the four-dimensional trajectories are calculated by superimposing the lateral tracks with a standardized vertical flight profile. As depicted in 
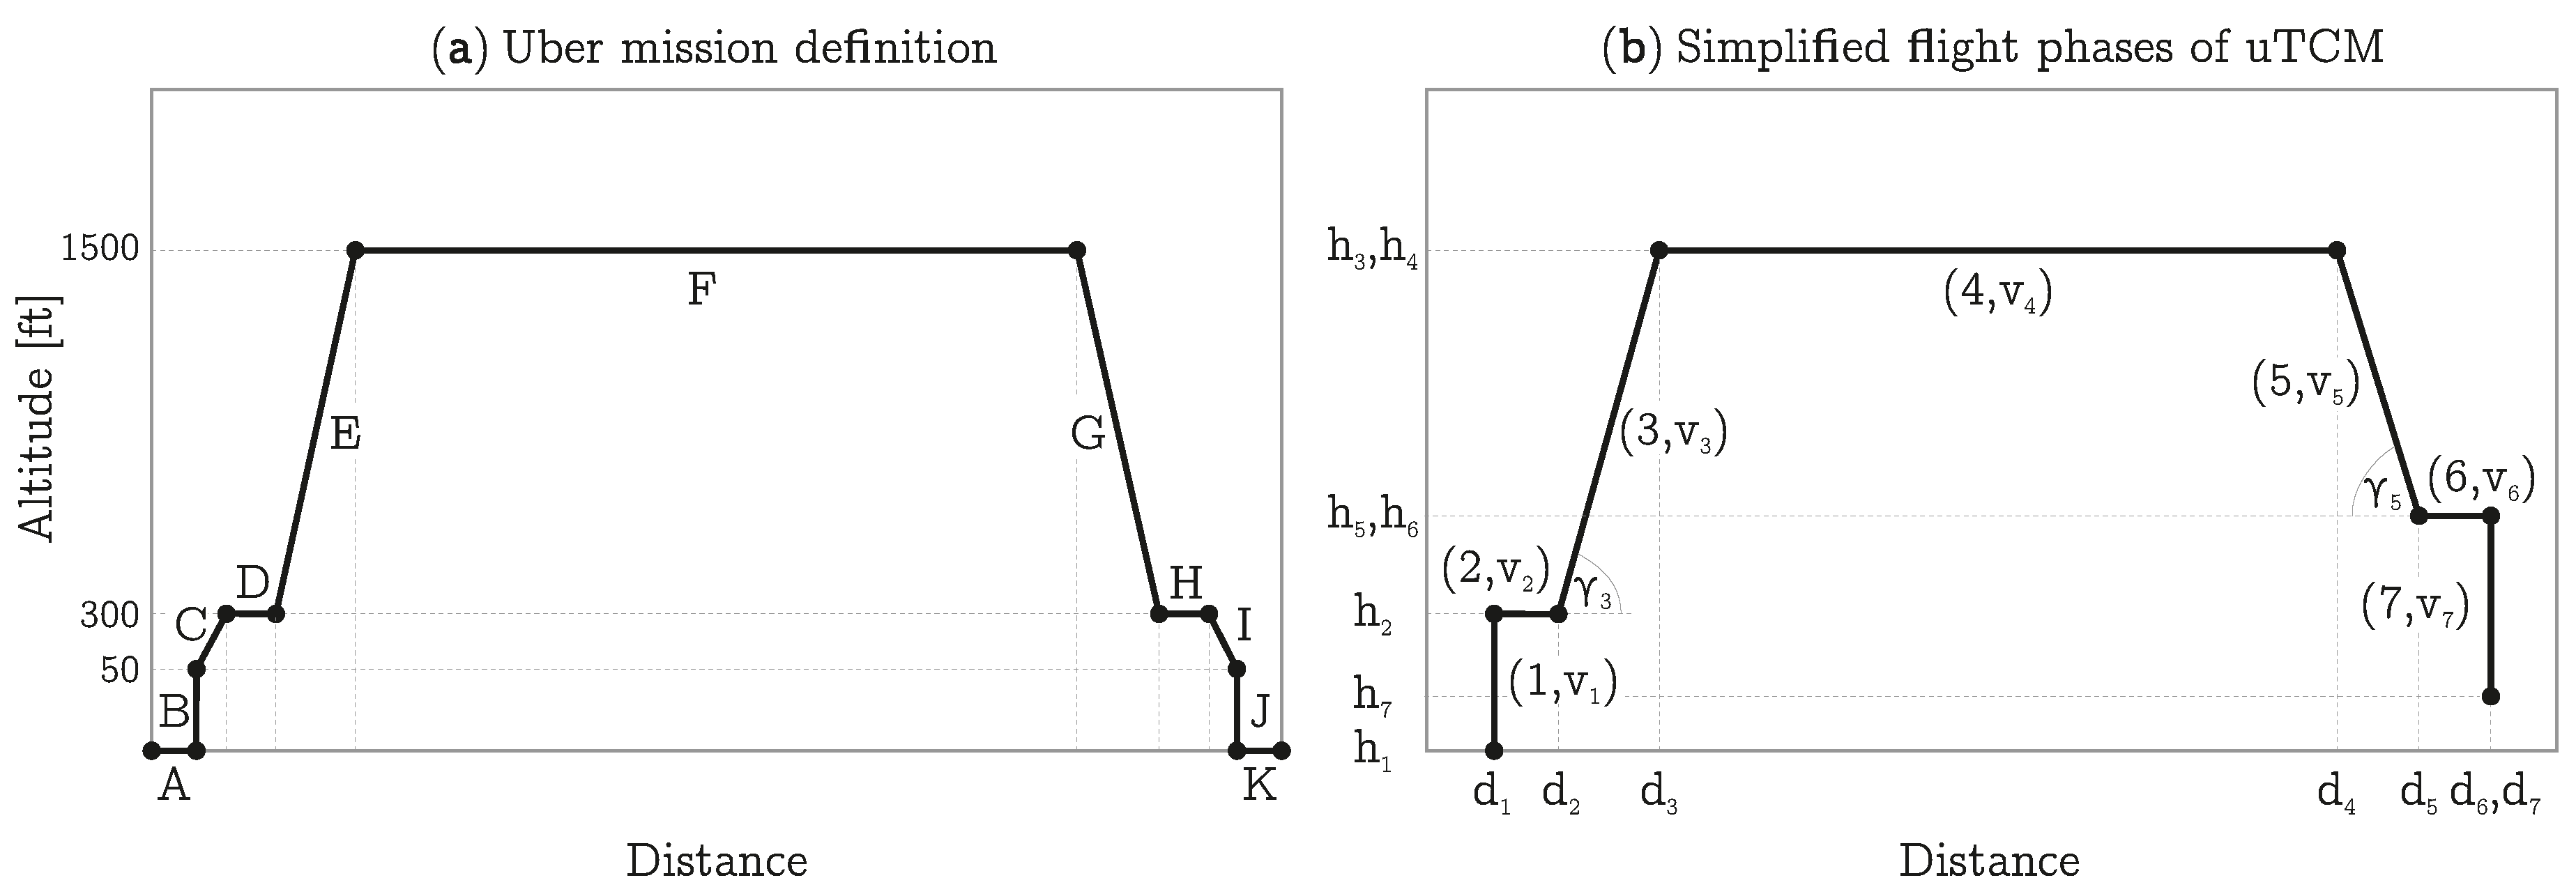
Figure 21b, the applied flight profile consists of seven generic flight phases, which are derived from the Uber mission definition for Electric Vertical Takeoff and Landing (eVTOL) aircraft operation (see Table 4 and Figure 21a) [65].
The profile starts with a constant vertical speed v 1 , inducing an initial climb phase (phase 1) from h 1 to h 2 in altitude, which corresponds to a combination of Uber flight phases B and C in Table 4. After departure terminal procedures (phase 2, Uber phase D), the vehicle climbs at constant speed v 3 and climb angle γ 3 to cruise altitude h 3 (phase 3, Uber phase E). The cruise phase (phase 4, Uber phase F) is characterized by constant altitude h 3 , h 4 and cruise speed v 4 . In order to determine the top-of-descent at the end of phase 4, the following phases are evaluated reversely (phases 5 to 7, Uber phases G to J) to their execution during a mission. In phase 5 (Uber phase G), the vehicle is directed to descend to altitude h 5 at constant speed v 5 with a flight path angle γ 5 . In future investigations, as soon as the simulation environment allows a consideration of procedures for ground handling and clearance for take-off and approach, an optional loiter phase (phase 6, Uber phase H) is planned to be part of the mission profile, in which the vehicle remains on constant altitude h 6 at reduced speed v 6 until permission for landing at the target vertiport (set on altitude h 7 ) is granted, depending on capacity modeling of the corresponding vertiport. In the course of these investigations, however, after reaching h 2 , the vehicle directly descends (phase 7, Uber phases I, J) from h 5 , h 6 to h 7 assuming a constant vertical speed v 7 . Depending on the level of detail in vertiport modeling, the mission profile may be extended by ground taxi phases (A+K) in future revisions. Speed and altitude are chosen according to the vehicle definition (see Table 5; compare Table 4). Nevertheless, the applied values merely represent estimations and are not based on flight envelopes that were verified in terms of feasible performance data. Based on Regulation (EU) 2018/1139 of the European Parliament and of the Council, air taxies operated remotely or unmanned (fully automatic) will most probably be assigned to the EASA category certified with an MTOM of more than 150 kg. A specification for certified UAS is currently only available in draft form on the part of JARUS (CS-UAS) [11].
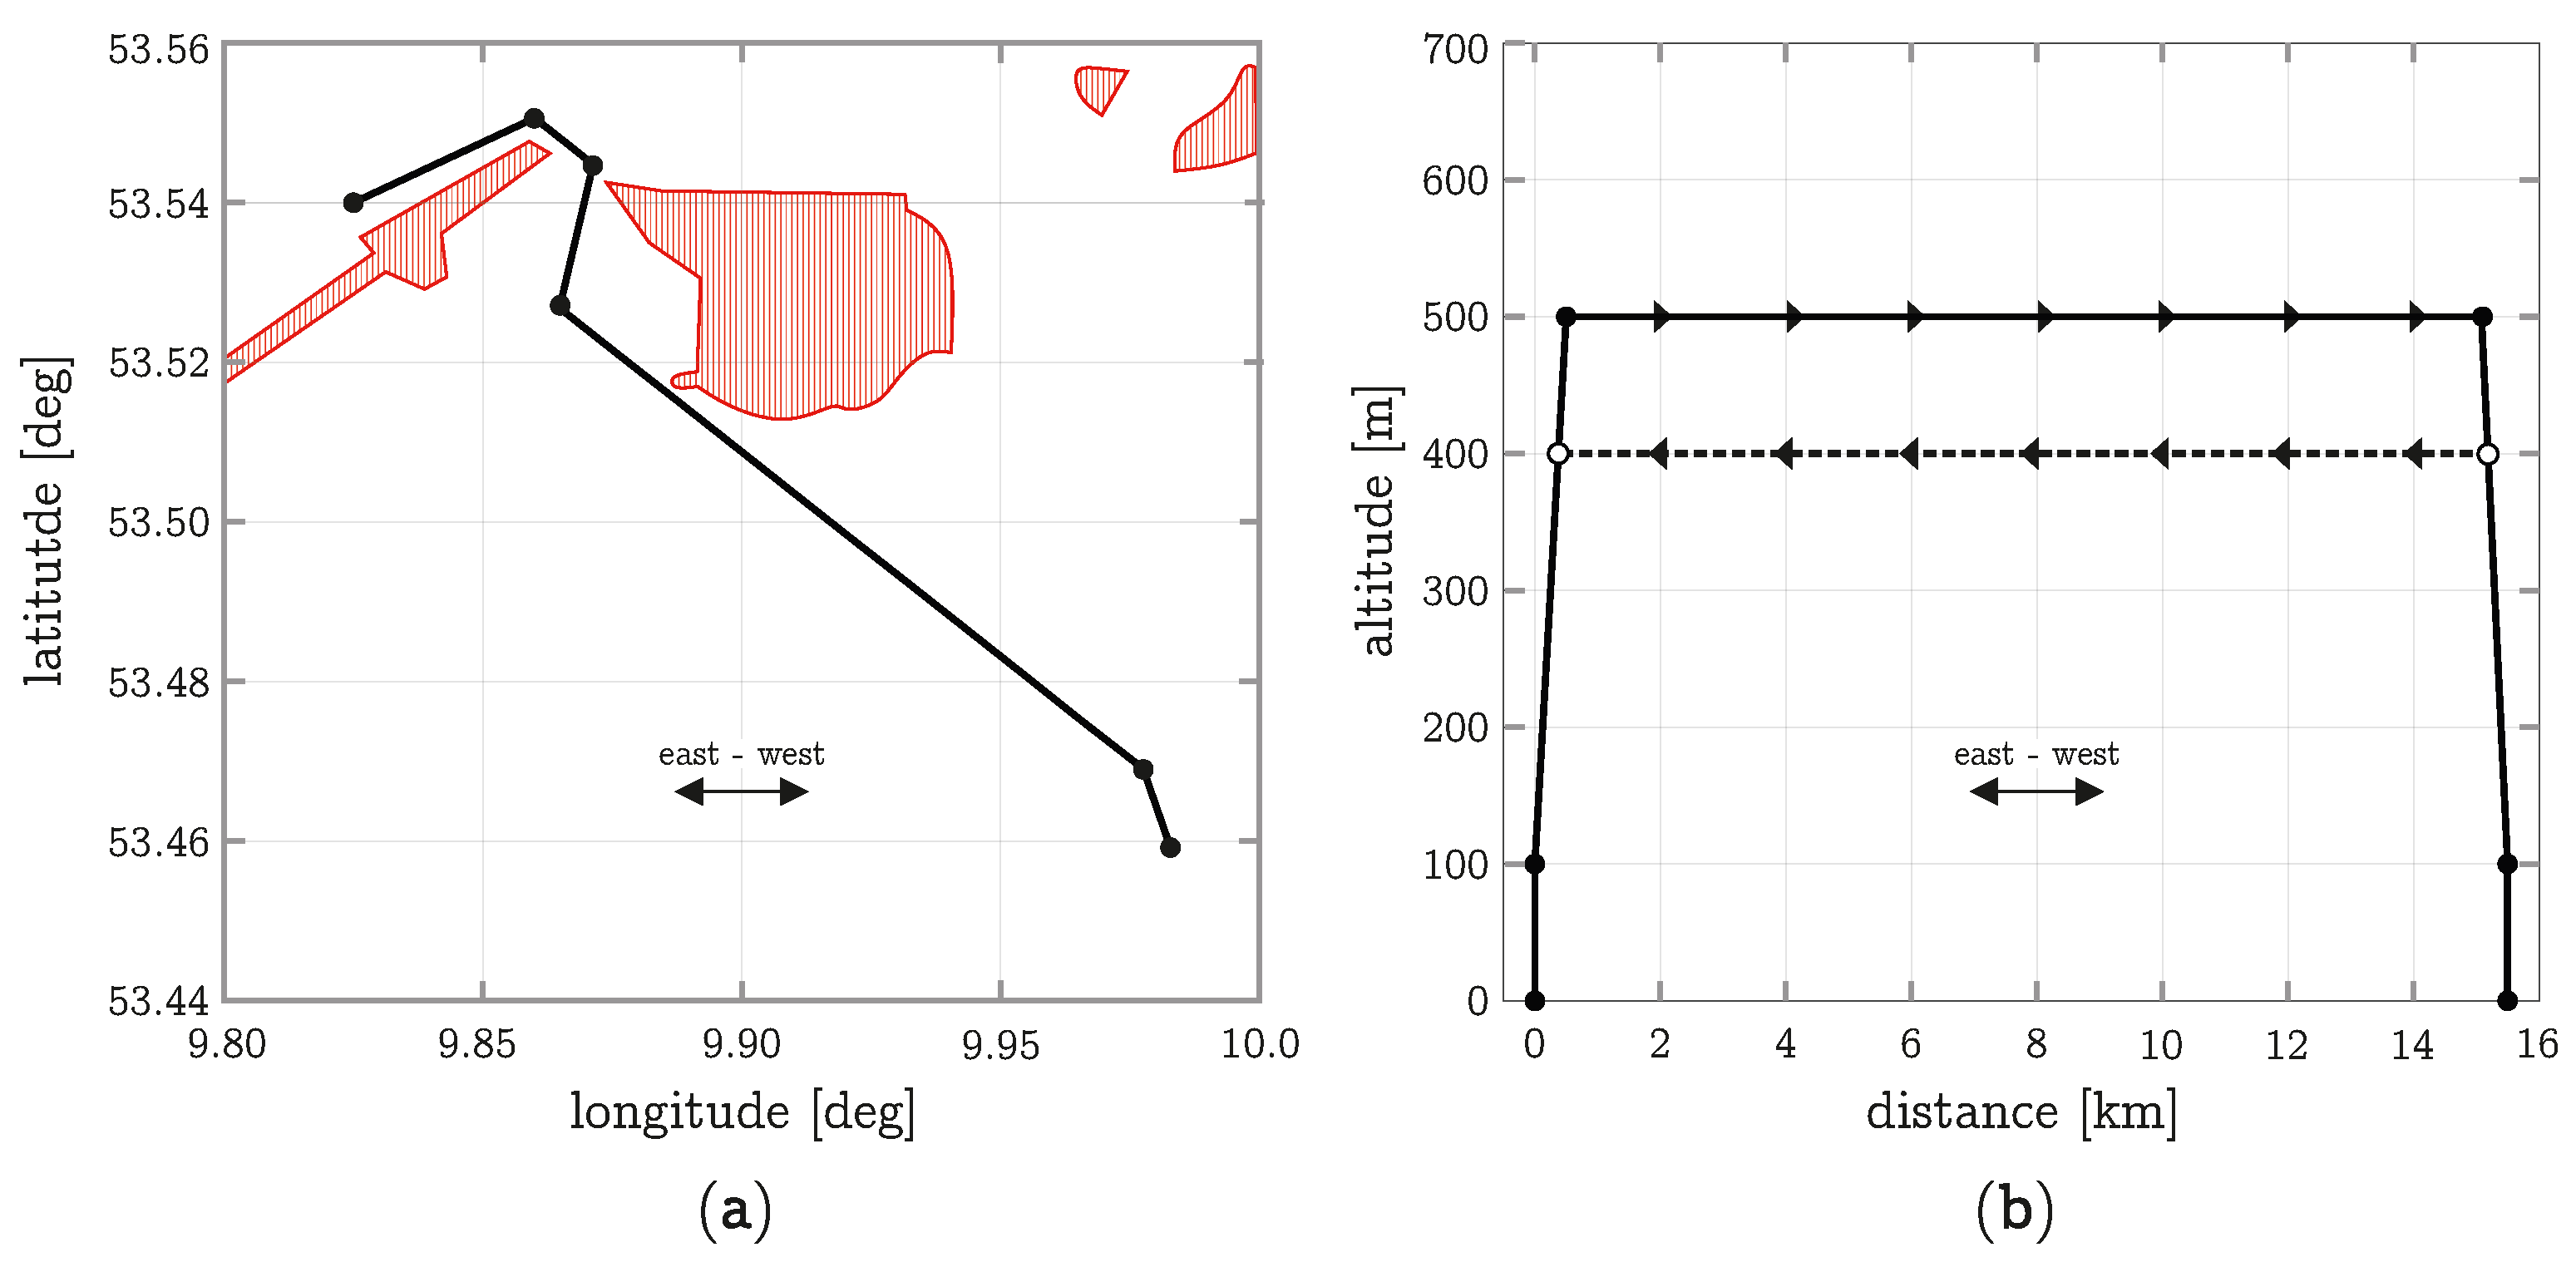
An exemplary vertical and lateral flight profile of the route from Hamburg-Finkenwerder to Hamburg-Harburg is shown in Figure 22. The lateral path of the flight trajectory runs along the optimized route plotted in 
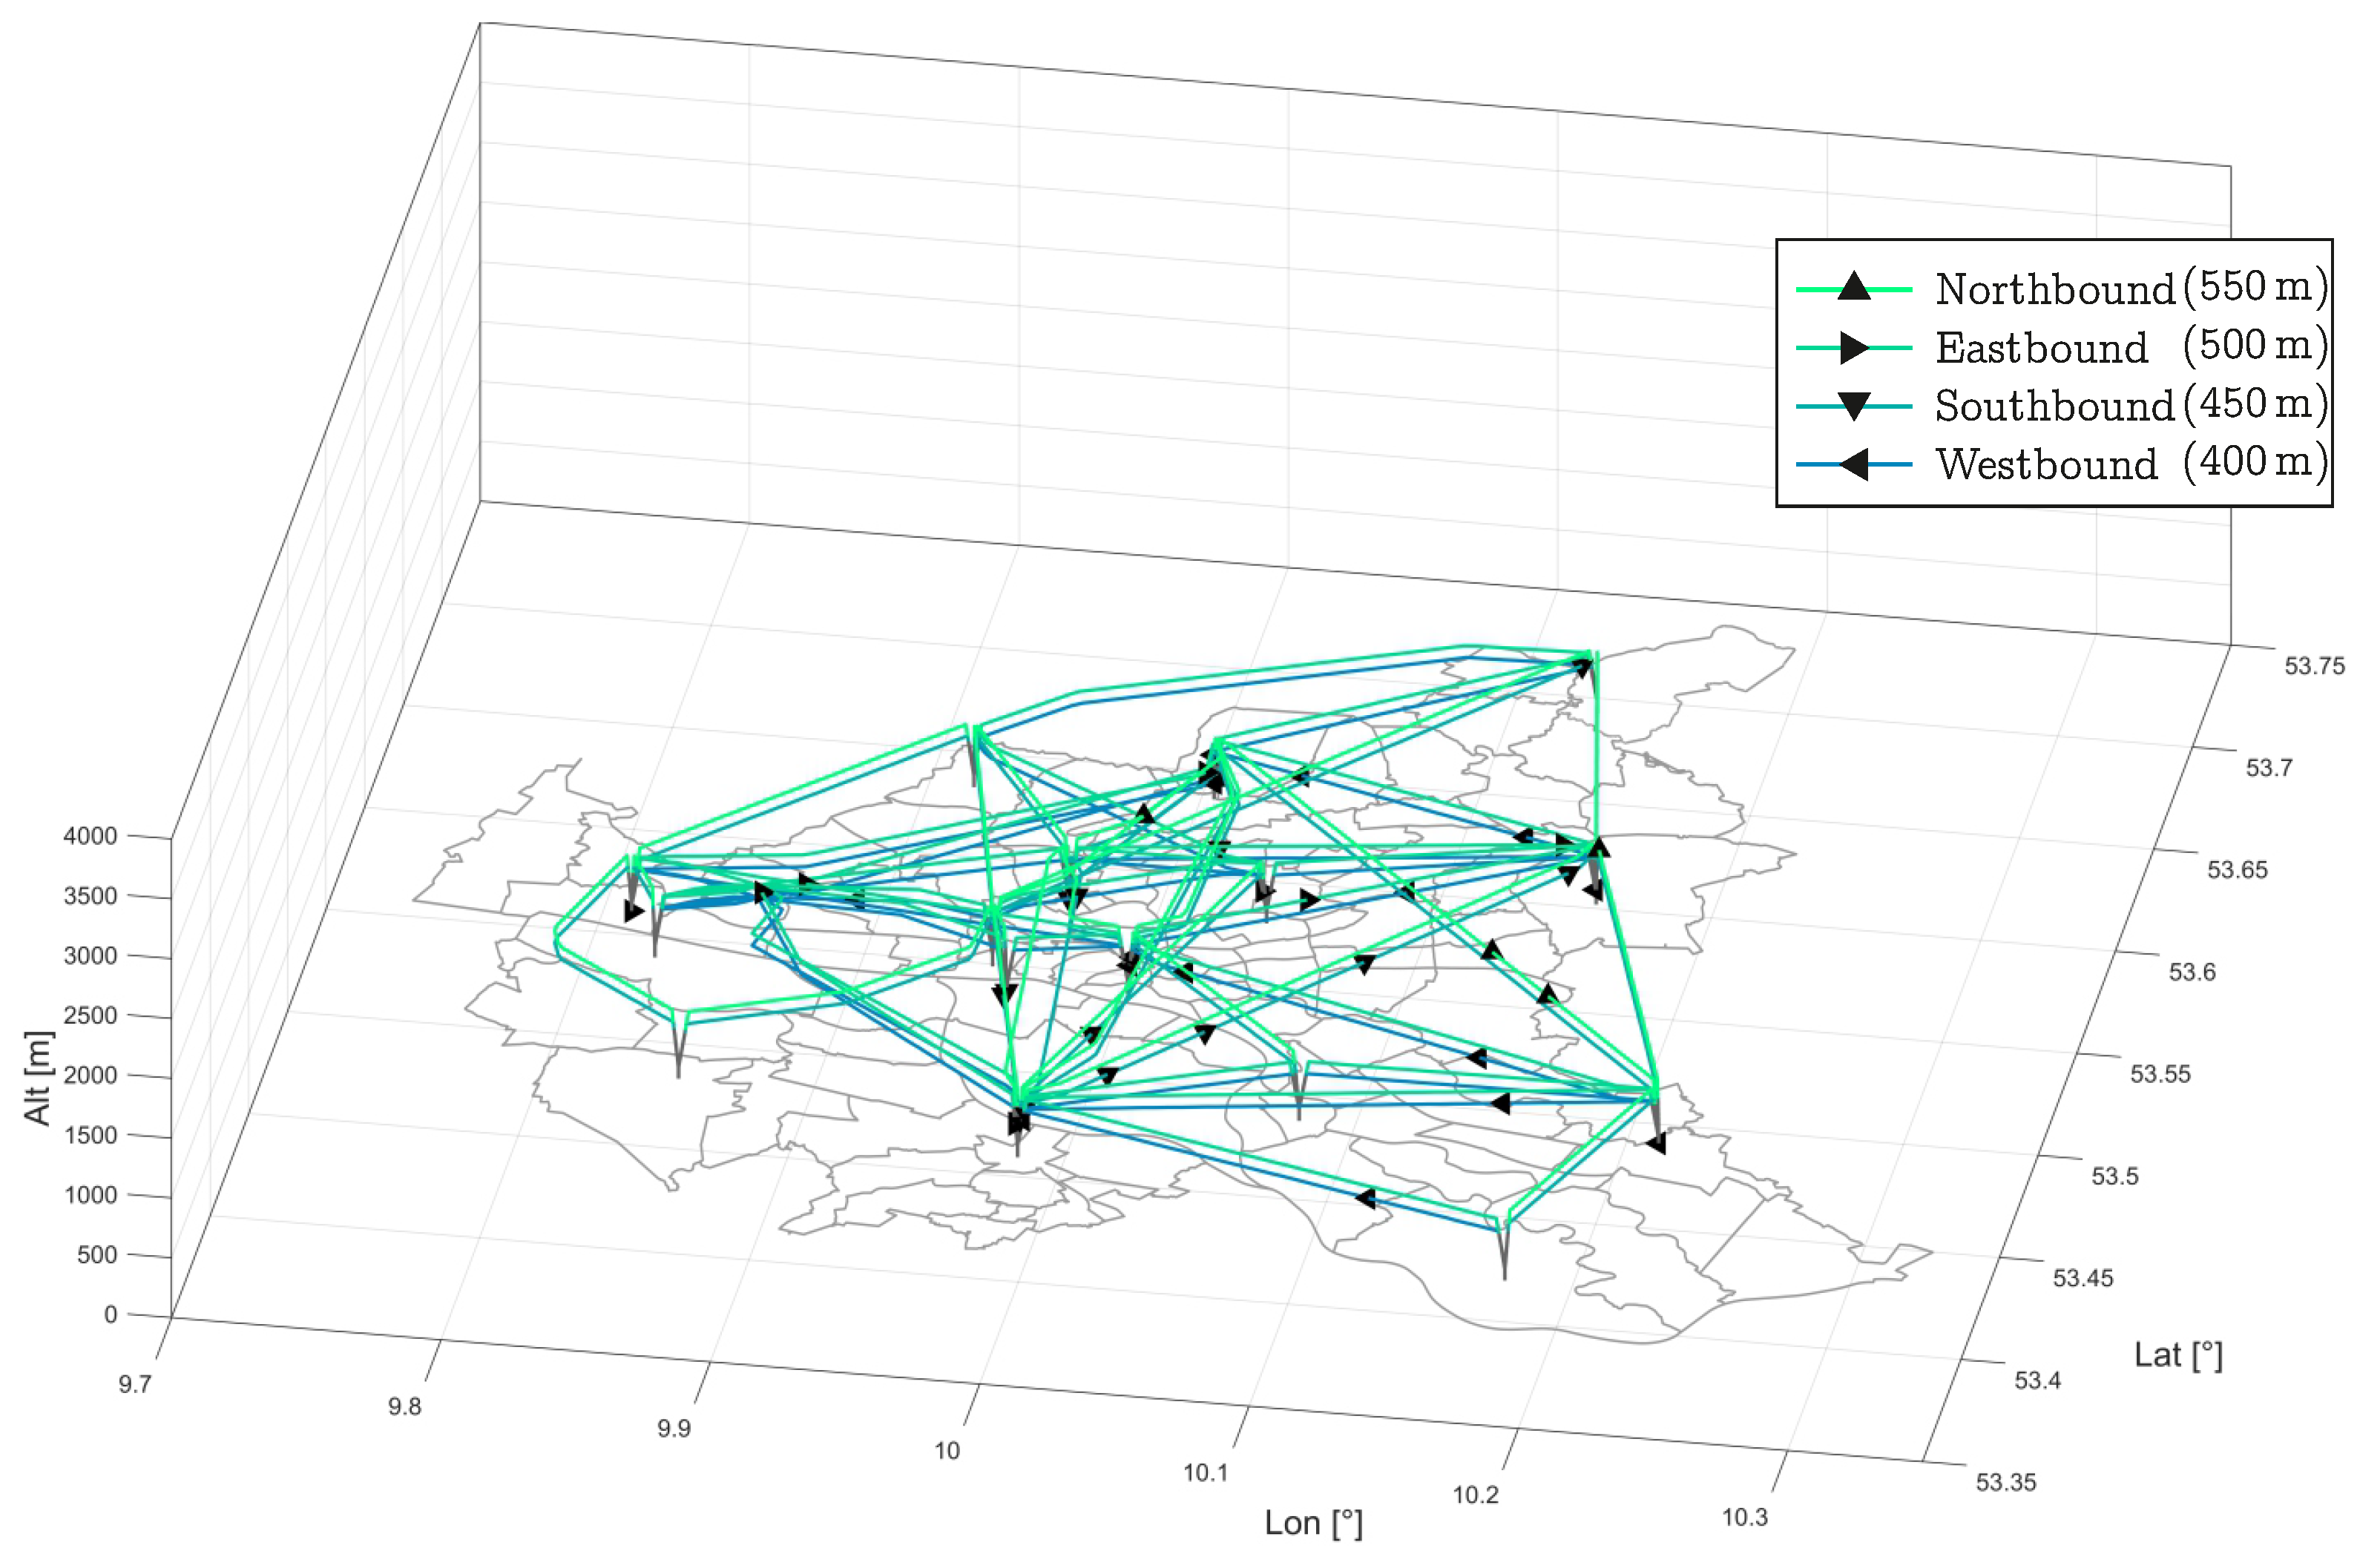
Figure 17. In order to avoid collisions between oncoming and intersecting vehicles, the principle of the “quadrocircular rule” is applied as a basic measure, which defines a split of flight levels for North, East, South and West tracks, providing a minimum vertical separation of 50 m [21]:
  • Northbound: Magnetic track 315 to 044 odd hundreds plus 50 m  (here: 550 m)
  • Eastbound: Magnetic track 045 to 134 odd hundreds        (here: 500 m)
  • Southbound: Magnetic track 135 to 224 even hundreds plus 50 m  (here: 450 m)
  • Westbound: Magnetic track 225 to 314 even hundreds        (here: 400 m)
A snapshot of the trajectory simulation scenario 3 (third expansion phase) is plotted in 
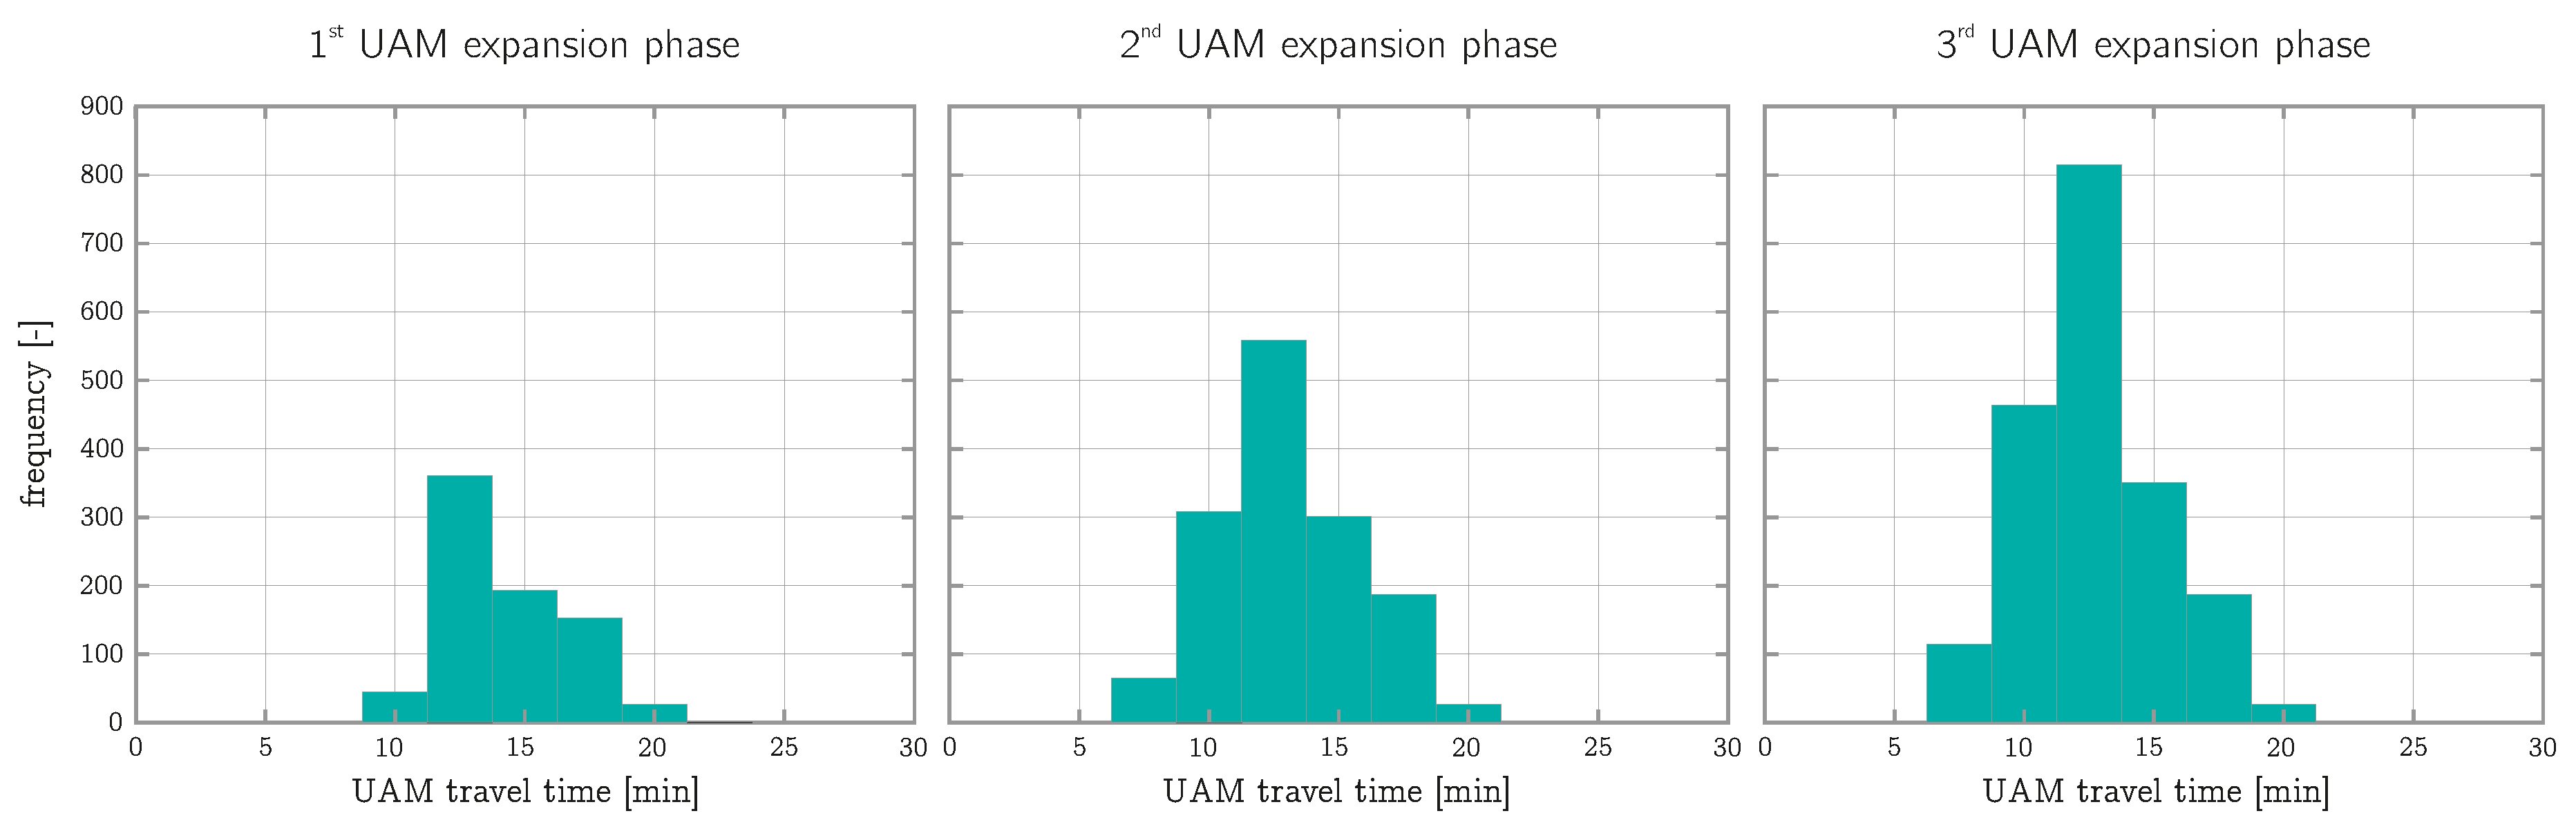
Figure 23. Each single vehicle is represented by a black triangle, which indicates the main heading of the flight, and moves along a specific route. In Figure 24, the bar charts depict the frequency distributions of the resulting travel times for all scenarios. The average travel time is about 14 min per flight, whereas the mean distance is 12 km, which is significantly higher than the average distance of 6.6 km for taxi rides in Hamburg in the year 2016 [53]. On the other hand, the mission distance is lower than design range of full electric drive vehicles, which is typically assumed to be in a range of 50–100 km.

3.7. Conflict Detection

The particular challenge in urban air traffic management is to safely manage a large number of vehicles in a congested and populated area. To avoid collisions in the air, urban air vehicles must be separated at all times, like conventional aircraft. However, due to substantial differences in vehicle performance and automation, existing ATM concepts [66] must either be adapted for UAM or completely redesigned. Nevertheless, we assume that all conceivable UTM concepts require separation minima [4], which should be small enough to enable dense traffic in urban areas and large enough to allow collision avoidance in case of loss of separation. A predicted loss of separation between two vehicles is considered as conflict that can either be prevented strategically by airspace design, or be resolved tactically by modifying the flight schedule and routing. The tactical options, however, might cause delays. A first sensitivity analysis on the impact of separation standards on the delay is presented in [32], in which the separation standards, the sequencing specifications and the arrival planning horizon are varied in a network of 20 vertiports in the Dallas-Fort Worth metroplex. By reducing the spatial separation from 0.3 nmi to 0.1 nmi and the temporal separation from 60 s to 45 s, the total delay decreased by 7.3% and 28.4%. The number of conflicts decreased by 26% and 17%, respectively. A combination of variable and fixed (baseline) separation criteria is proposed in [23]. An autonomous multi-agent algorithm with cooperative self separation, applied to a non-intersecting route network in New York City is presented in [33]. This study investigates a network of route segments among seven vertiports, based on a horizontal separation of 0.3 nmi. However, the applicability of this approach to a large number of vehicles in a complex and congested network still has to be verified.
Within this study, a simple conflict detection component for UAM (component 11 in Figure 6 and Figure 8) was derived from the Network Flow Environment (NFE) Conflict Detection Tool [67,68]. The tool detects conflicts between planned trajectories (see Section 3.6) based on different urban air traffic concepts and separation standards (toolinput from component 2). For efficient conflict detection, the urban airspace is partitioned into grid elements and only trajectory points of neighboring elements are analyzed.
Here, we apply an arbitrary separation minimum of 50 m (≈165 ft) in vertical direction and of 600 m (≈2 000 ft) in horizontal direction. The latter corresponds to a maximum time of 10 s for a collision avoidance maneuver between two head-on flights with a constant cruising speed of 30 m/s [23]. Conflicts are detected above the minimum flight level of 400 m (≈1 300 ft) with a sampling time of one minute. Results are given in Table 6 for the selected three scenarios and conflicting trajectory points are exemplarily plotted in 
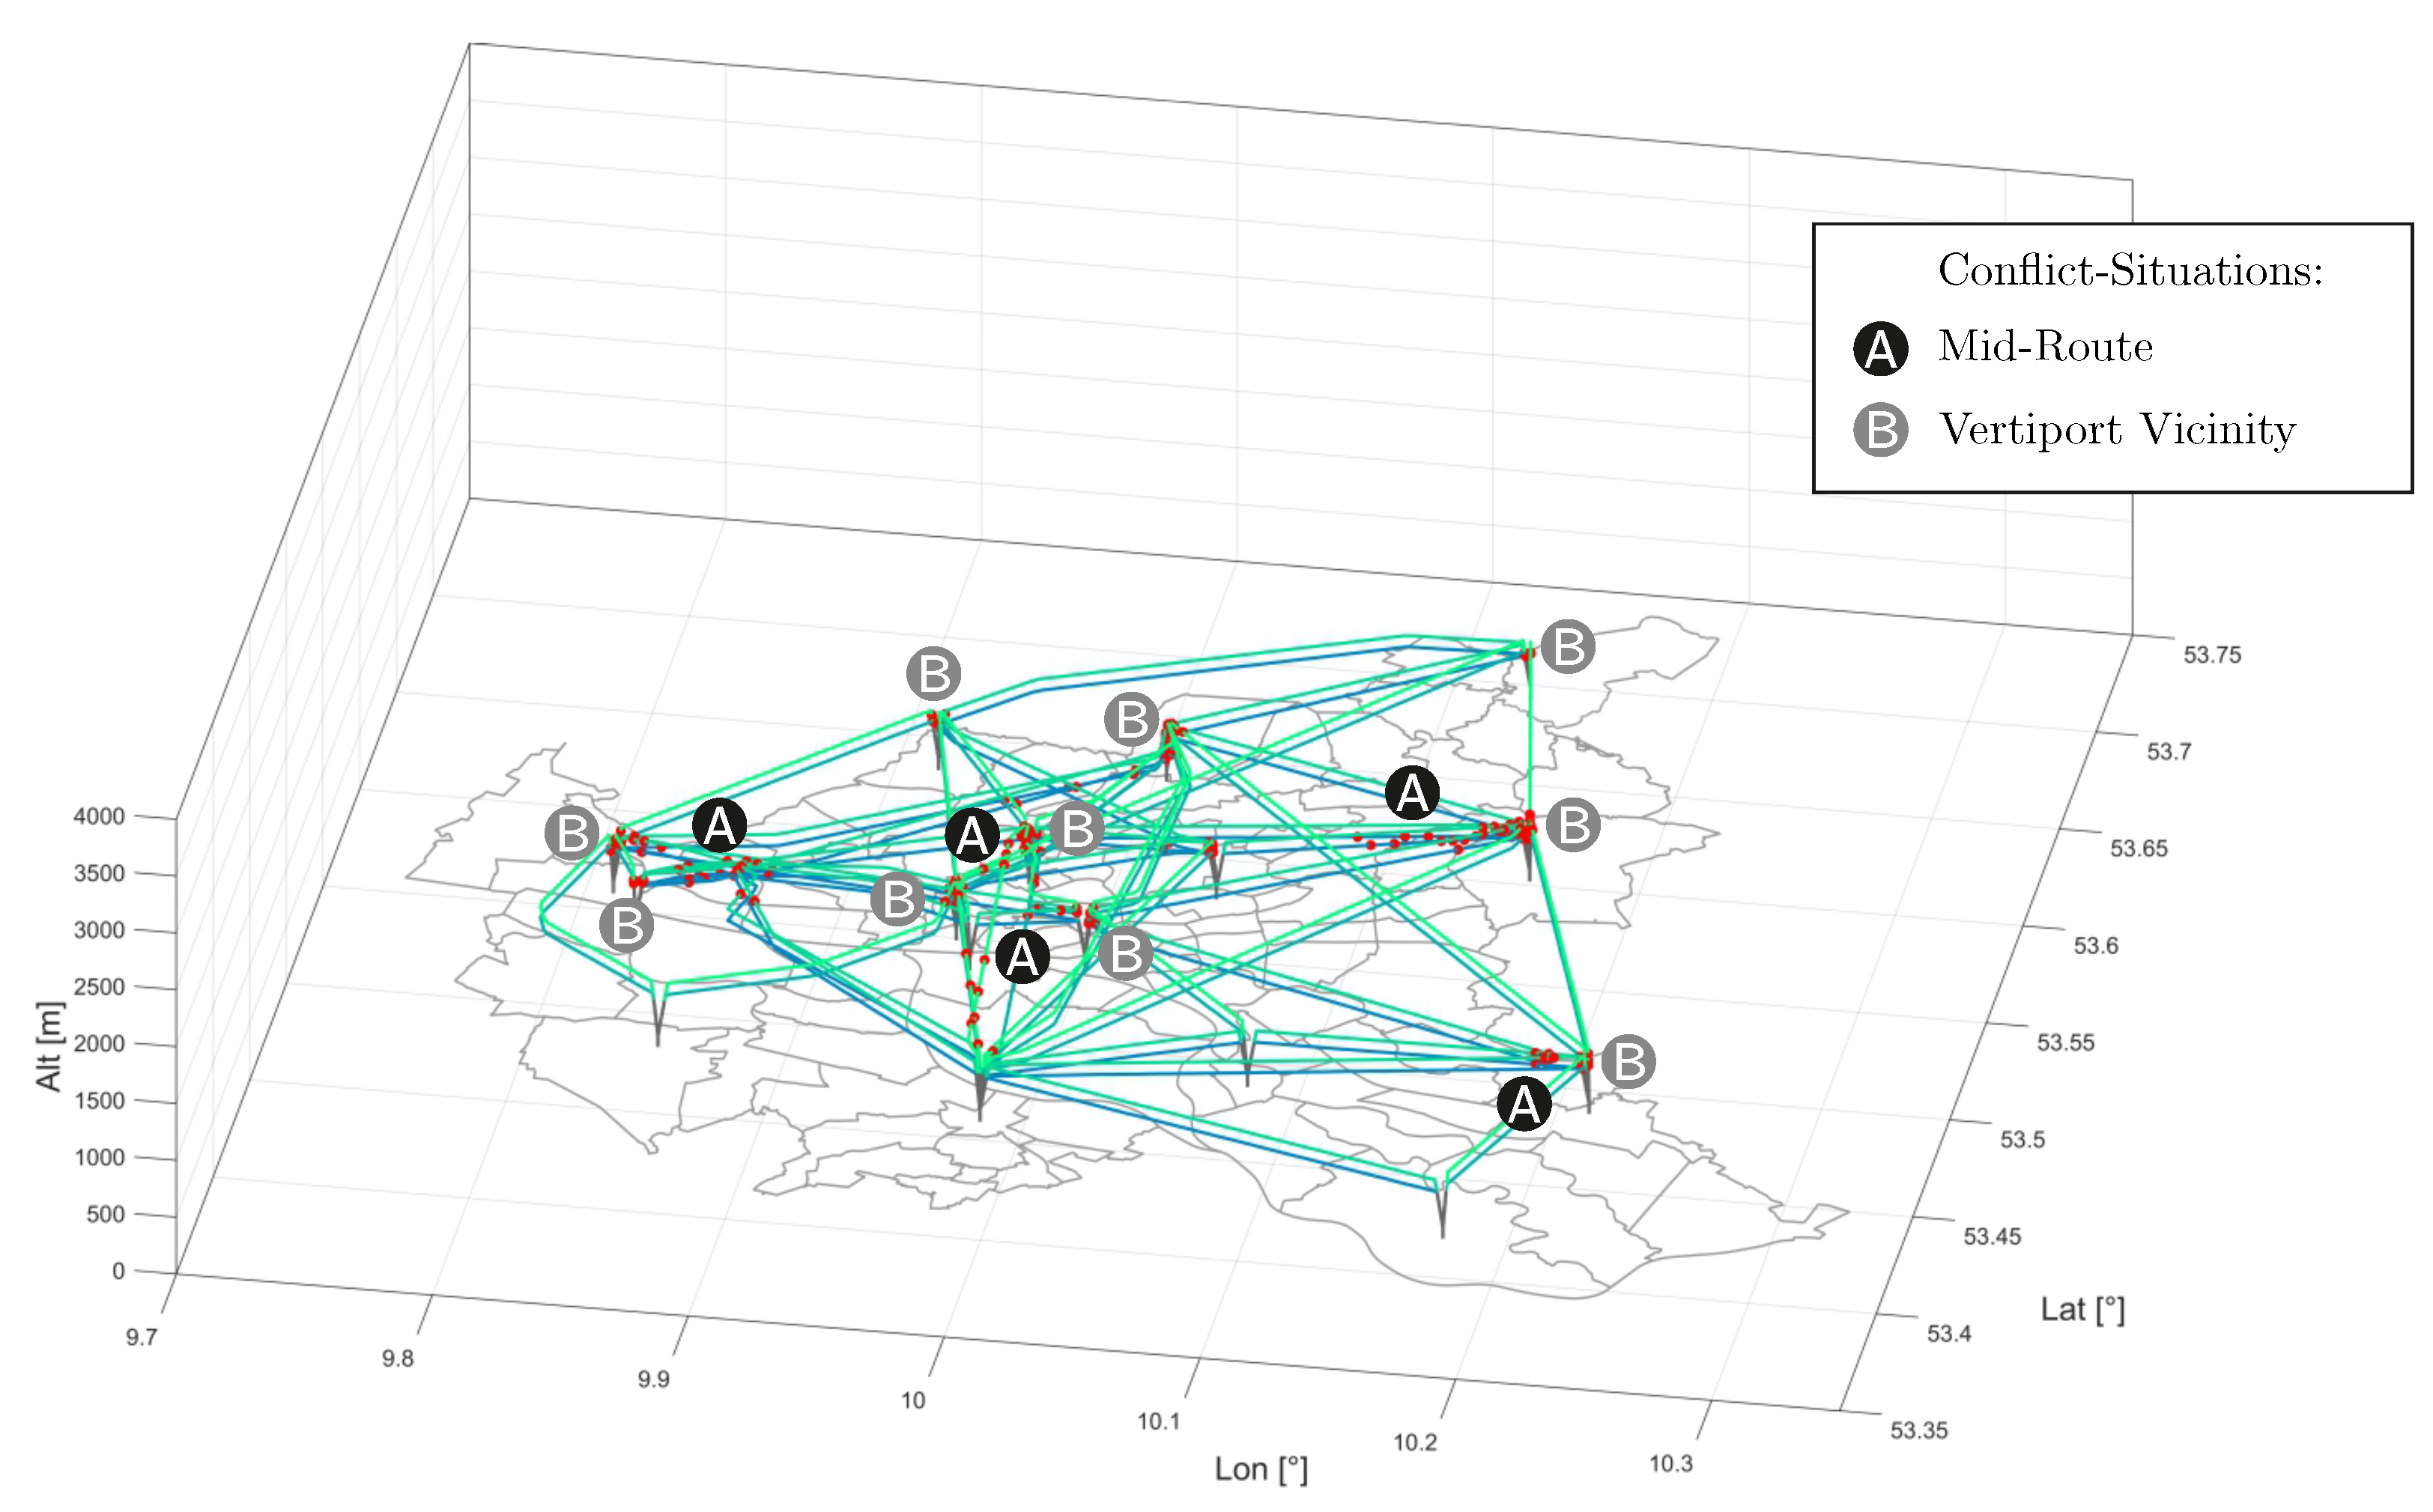
Figure 25 for the third expansion phase (scenario 3). As an average over all expansion phases, conflicts arise in about 5.8% of all flights. In expansion phase 1, the number of trajectory points comprising a loss of separation have a share of 0.4% with a maximum number of one conflict per trajectory. In expansion phases 2 and 3, however, the relative share of conflicted trajectory points is slightly higher with a value of 0.7%. In addition, the trajectories show an accumulation in conflict occurrence. In the subset of trajectories with at least one loss of separation, the average number of detected conflicts can be identified to 1.2 (scenario 2), respectively 1.21 (scenario 3). In one distinct case, a single flight with a maximum number of four conflicts could be observed in the course of this study. Within the subset of generally conflicted flights, the share of trajectories with multiple conflicts could be identified to 12.8% in scenario 2, respectively to 16.1% in scenario 3.
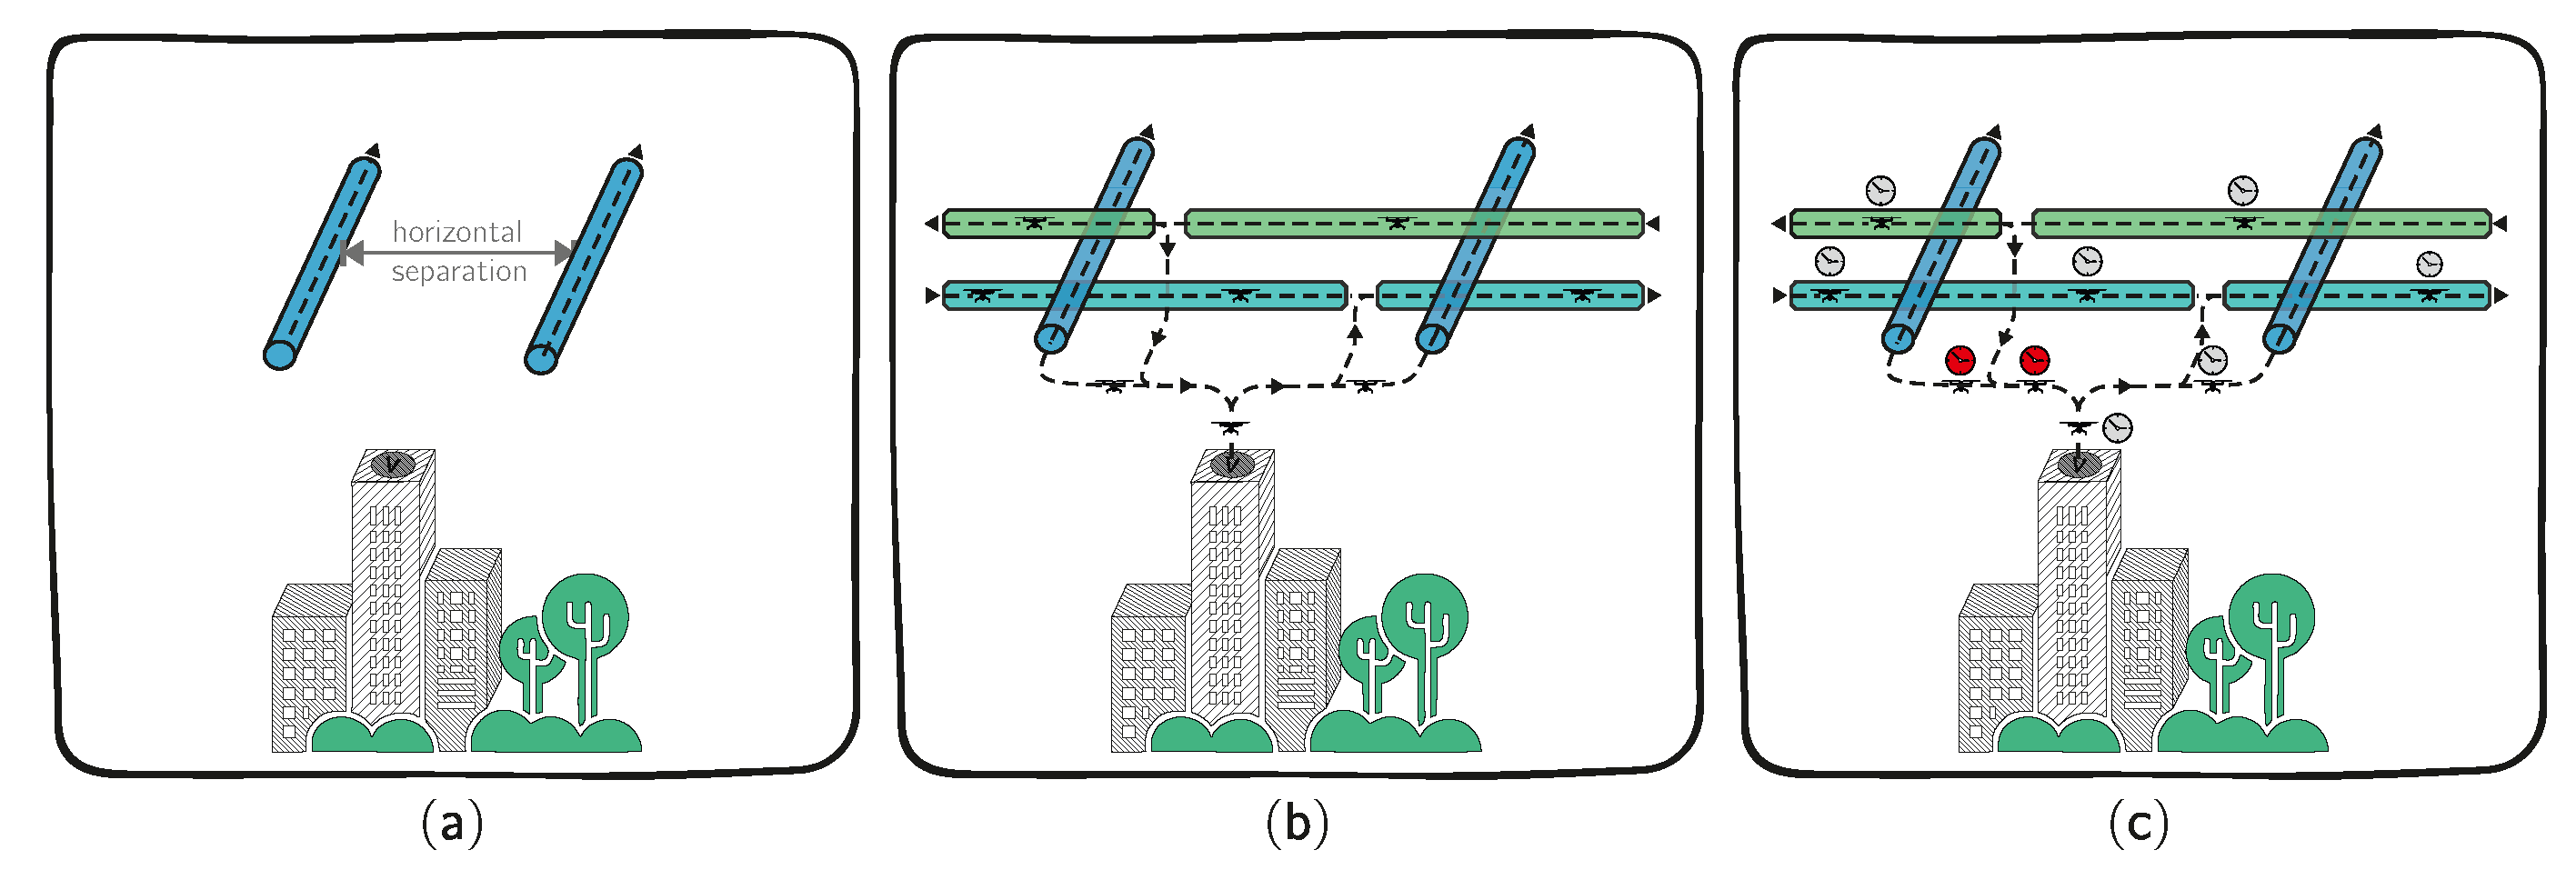
The detected conflict situations can be classified into two categories with various causing effects (compare Figure 25 and Figure 26):
(a)
Mid-Route conflicts. Although the quadrocircular rule is implemented, a set of routes with similar values of bearing between origin and destination will be assigned to the same flight level, yielding a potential loss of separation in an area of converging (or even intersecting) tracks. A consideration of interdependencies among the tracks in terms of collision prevention has not been implemented to this state of the model (see Section 3.4).
(b)
Vertiport vicinity conflicts. Since there has been no implementation of special procedures in vertiport proximity, such as arrival and departure routes or an optimized scheduling and sequencing, the airspace around vertiports holds a particularly high potential of conflicts. First, investigations on suitable measures are presented in [25].
In order to minimize the number of remaining conflicts, they should be resolved by the overall UAM system module before departure. Therefore, an iteration is planned between flight scheduling (component 9), flight trajectory simulation (component 10), and conflict detection (component 11) (see inner iteration in Figure 6). In the final state, a sensitivity analysis should be conducted to assess the capacity of different UATS designs.

3.8. UAM Cost and Revenue Modeling

In UAM, the research on cost modeling is still at the beginning [19,34]. In the field of ground based autonomous mobility systems on the other hand, there have been already several investigations on cost modeling with transferable results in certain aspects. A crucial parameter for determination of passenger specific UAM fare is represented by the operating mode, which can be classified into three categories, as presented in [69]:
  • line-based mass transit (in UAM: scheduled air shuttle)
  • taxi (in UAM: on-demand air taxi)
  • private vehicle (here: neglected)
In the case of a line-based public transportation system that operates on a fixed time schedule, such as trains or aircraft, the cost structure is commonly based on a ticket system, scaling the fare mainly to the passenger kilometers. As a result, it is in the interest of the operator to provide a route network and a time-schedule that results in high load factors. If the operational mode is designed as a conventional taxi service, an individual passenger or a self-organized group of passengers is assumed to take the ride. Mobility services in conventional taxi mode are mostly based on cost structures that solely take the vehicle kilometers into account. It provides assets of private mobility, but allocates all costs to the passenger. As a consequence, it is financially not desirable for the operator to increase the load factor of the vehicle. Modern ride-sharing services as for example UBER or the German company MOIA are considered as sub-category of a taxi service in the context of this study. The idea of the ride-sharing concept is to offer a pooling service, which allows for providing low-priced taxi rides. As the cost structure of this option has characteristics of a ticket system, it is in the interest of the operator to realize high load factors. Within this study, an Urban Operating Cost (UOC) component has been developed in order to describe and evaluate revenues and expenses of urban flight movements. Therefore, existing approaches for direct operating cost (DOC) modeling of conventional aviation [70,71] have been combined with those of autonomous ground-based mobility [69,72]. Based on trajectory data of individual flights (e.g., mission time, mission distance and power usage; see Section 3.6) as well as financial assumptions (e.g., the unit price for energy U e , the vehicle price per operating empty weight P O W E or the insurance rate f i n s 
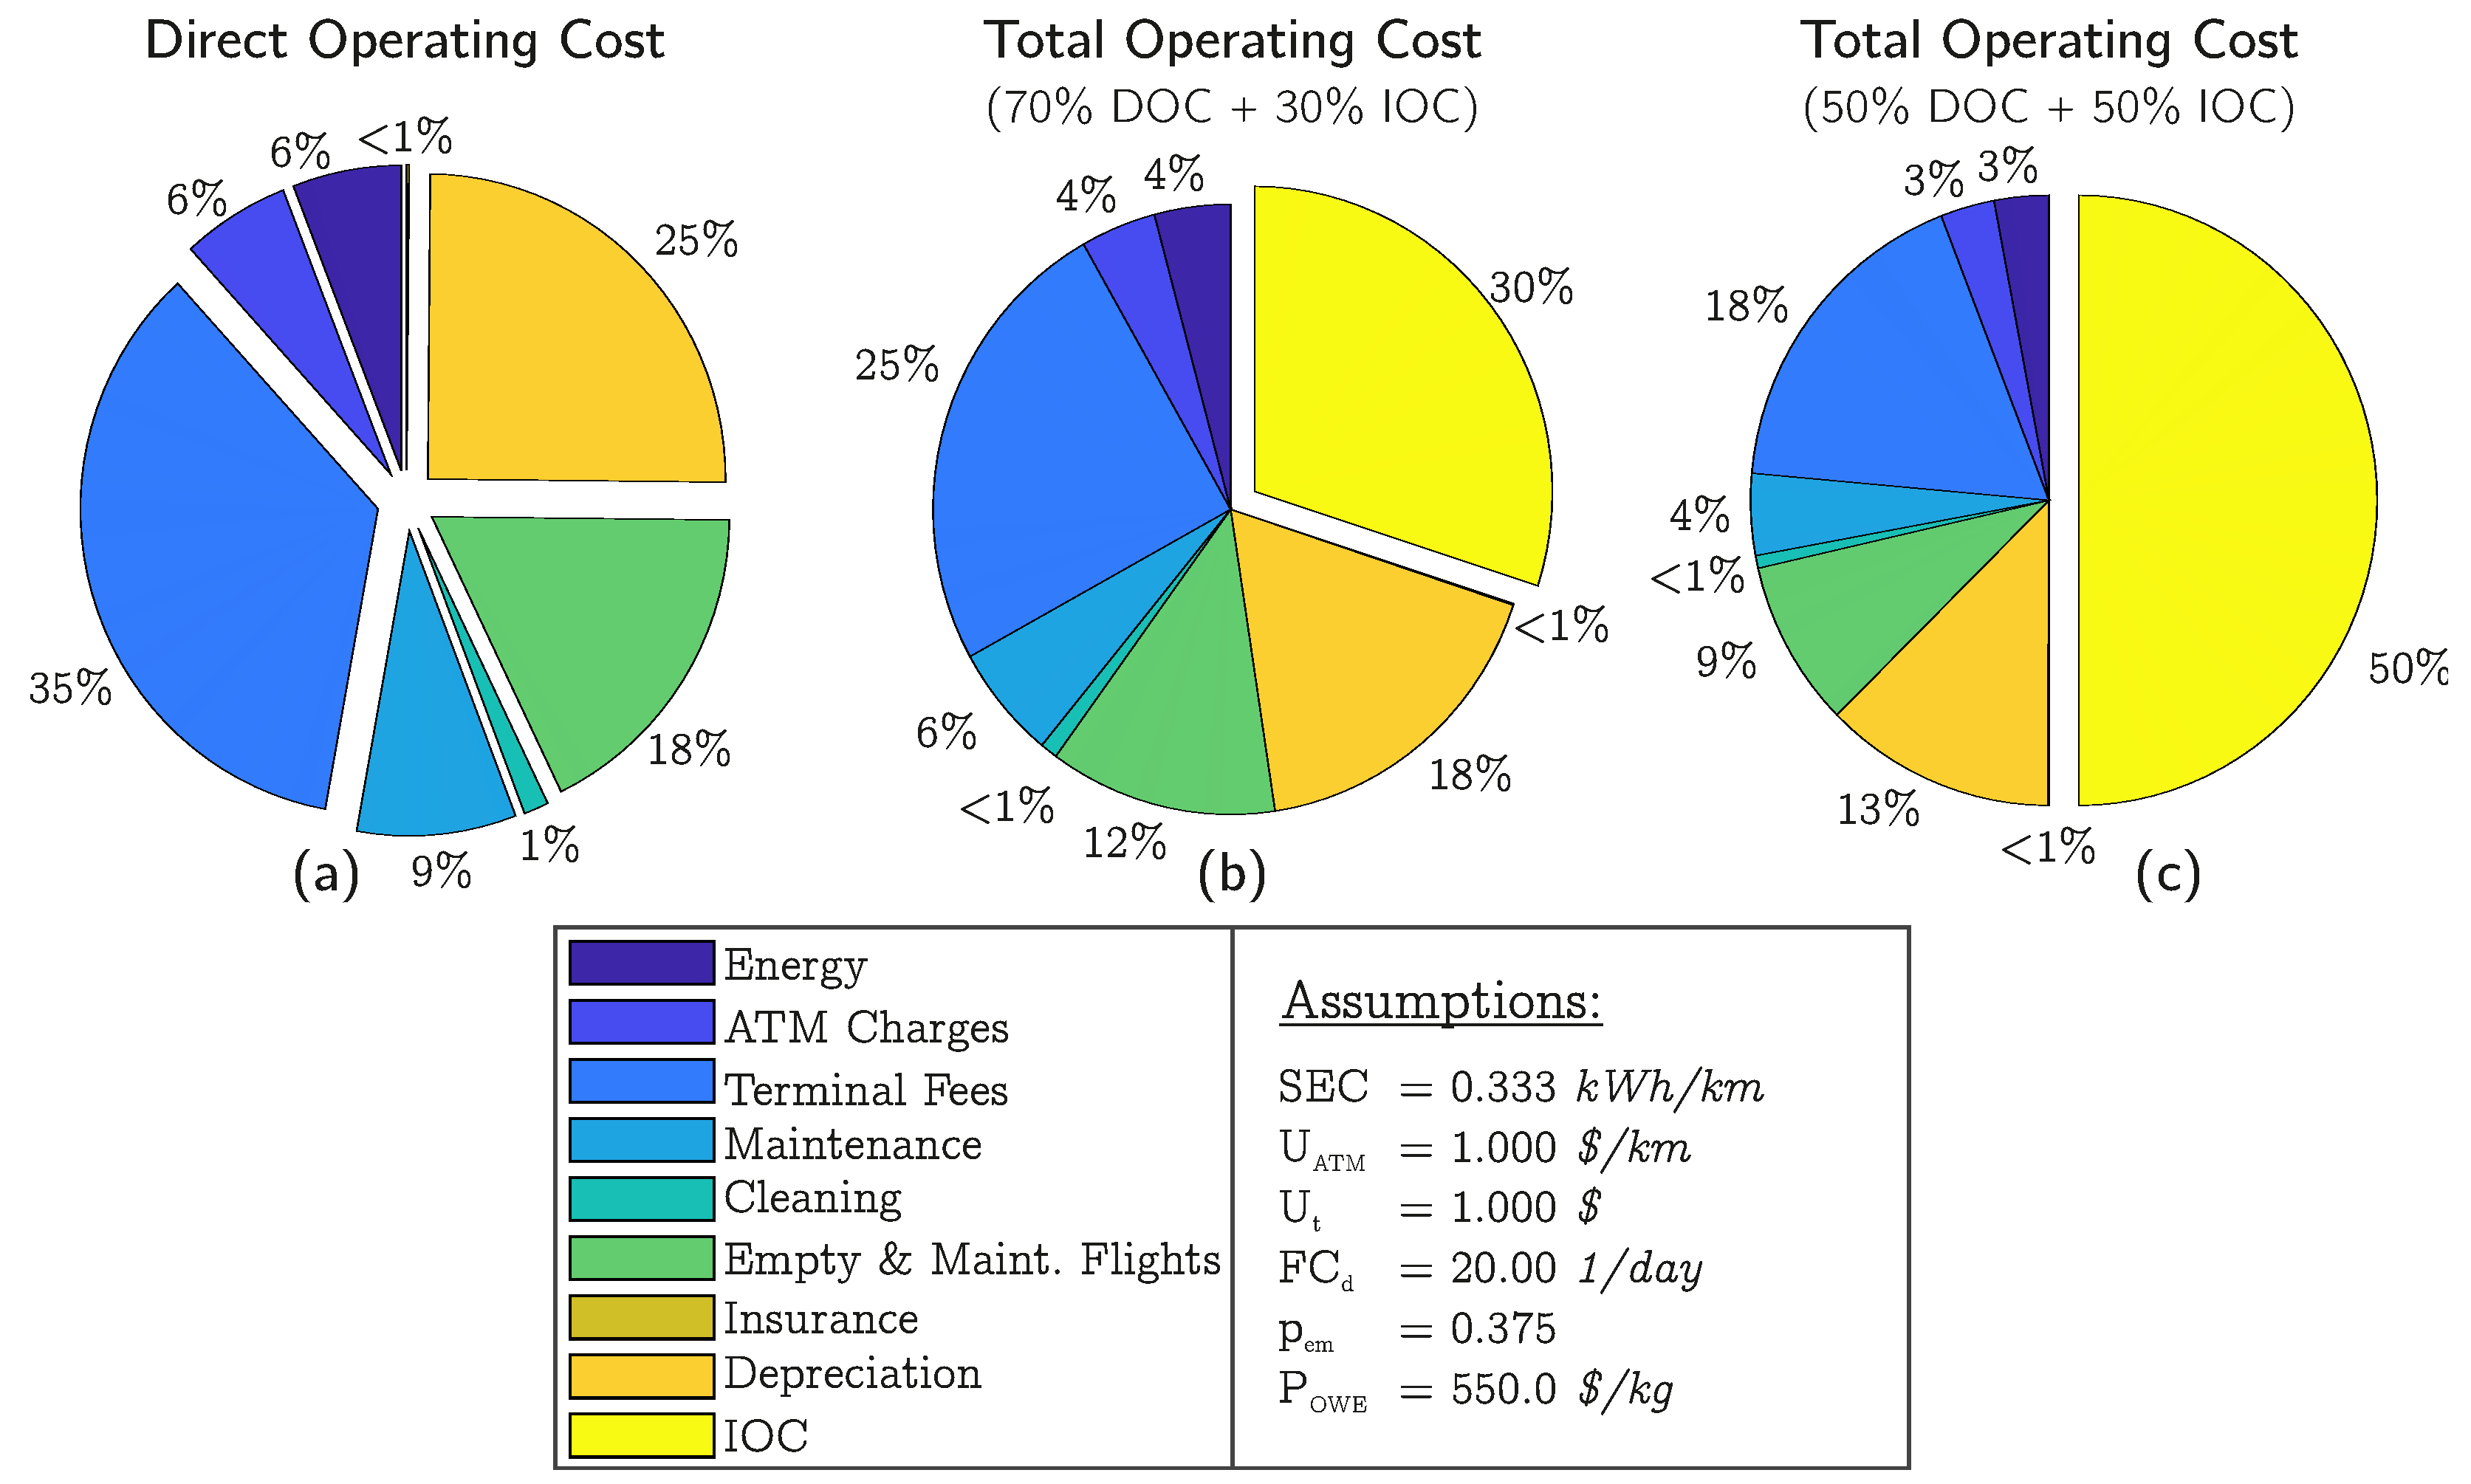
), the UAC component roughly determines costs with regard to (i) energy consumption, (ii) urban air traffic control, (iii) terminal fees (iv) maintenance, (v) cleaning, (vi) empty and maintenance flights, (vii) depreciation, and (viii) insurance.
The identification of costs highly depends on the underlying assumptions. Regarding energy for instance, the average consumer price in Germany was identified to 0.30€/kWh in the year 2018 [73]. Taking a discount for major industrial customers into consideration [74], the price can be estimated to 0.16€/kWh, respectively 0.18 $/kWh. To evaluate the impact of individual assumptions, a series of sensitivity analyses has been carried out. For instance, the unit charges for air traffic control ( U A T C ) and terminal usage ( U t ) are varied in a range between 0.25 and 2 (see Table 7) due to the high number of uncertainties. In conventional European aviation, all expenses caused by air navigation services (costs for infrastructure, staff, aviation meteorological service, etc.) have to be covered by revenues, which are mainly en-route and terminal charges. Costs are therefore apportioned among the conducted flights and unit rates are regularly adjusted, depending on the volume of flights during a reporting period. Since there is no reliable information on the degree of automation and the human–computer interaction in the future system of UAM-ATC, further uncertainties arise.
In order to allocate the maintenance and depreciation costs to individual flights, the daily number of flight cycles per vehicle ( F C d ) is varied parametrically. The integration of an agent-based simulation approach into the UAM system model (see outlook of Section 3.5) will provide improved possibilities regarding derivation of daily flight cycles and operating times. Maintenance costs are roughly estimated for different types of maintenance events i based on the labor cost level ( U m ), the number of technicians ( n m , i ) as well as its duration ( t m , i ) and interval ( f m , i ). Since the predominant direction of traffic significantly varies in the course of a day (see Figure 11), the unavoidable occurrence of empty and maintenance flights induce additional costs for energy as well as for navigation and terminal services. The value of its percentage share ( p e m ) is highly influenced by the demand and the vertiport network design, as, for example, a shortage of locally available landing positions might induce the necessity for a parked vehicle to lift-off. A proper initial guess for estimating p e m can be derived from financial reports of conventional taxi industry. According to [53], merely 47.5% of the travel distance covered by taxis in Hamburg City was actually occupied by passengers.
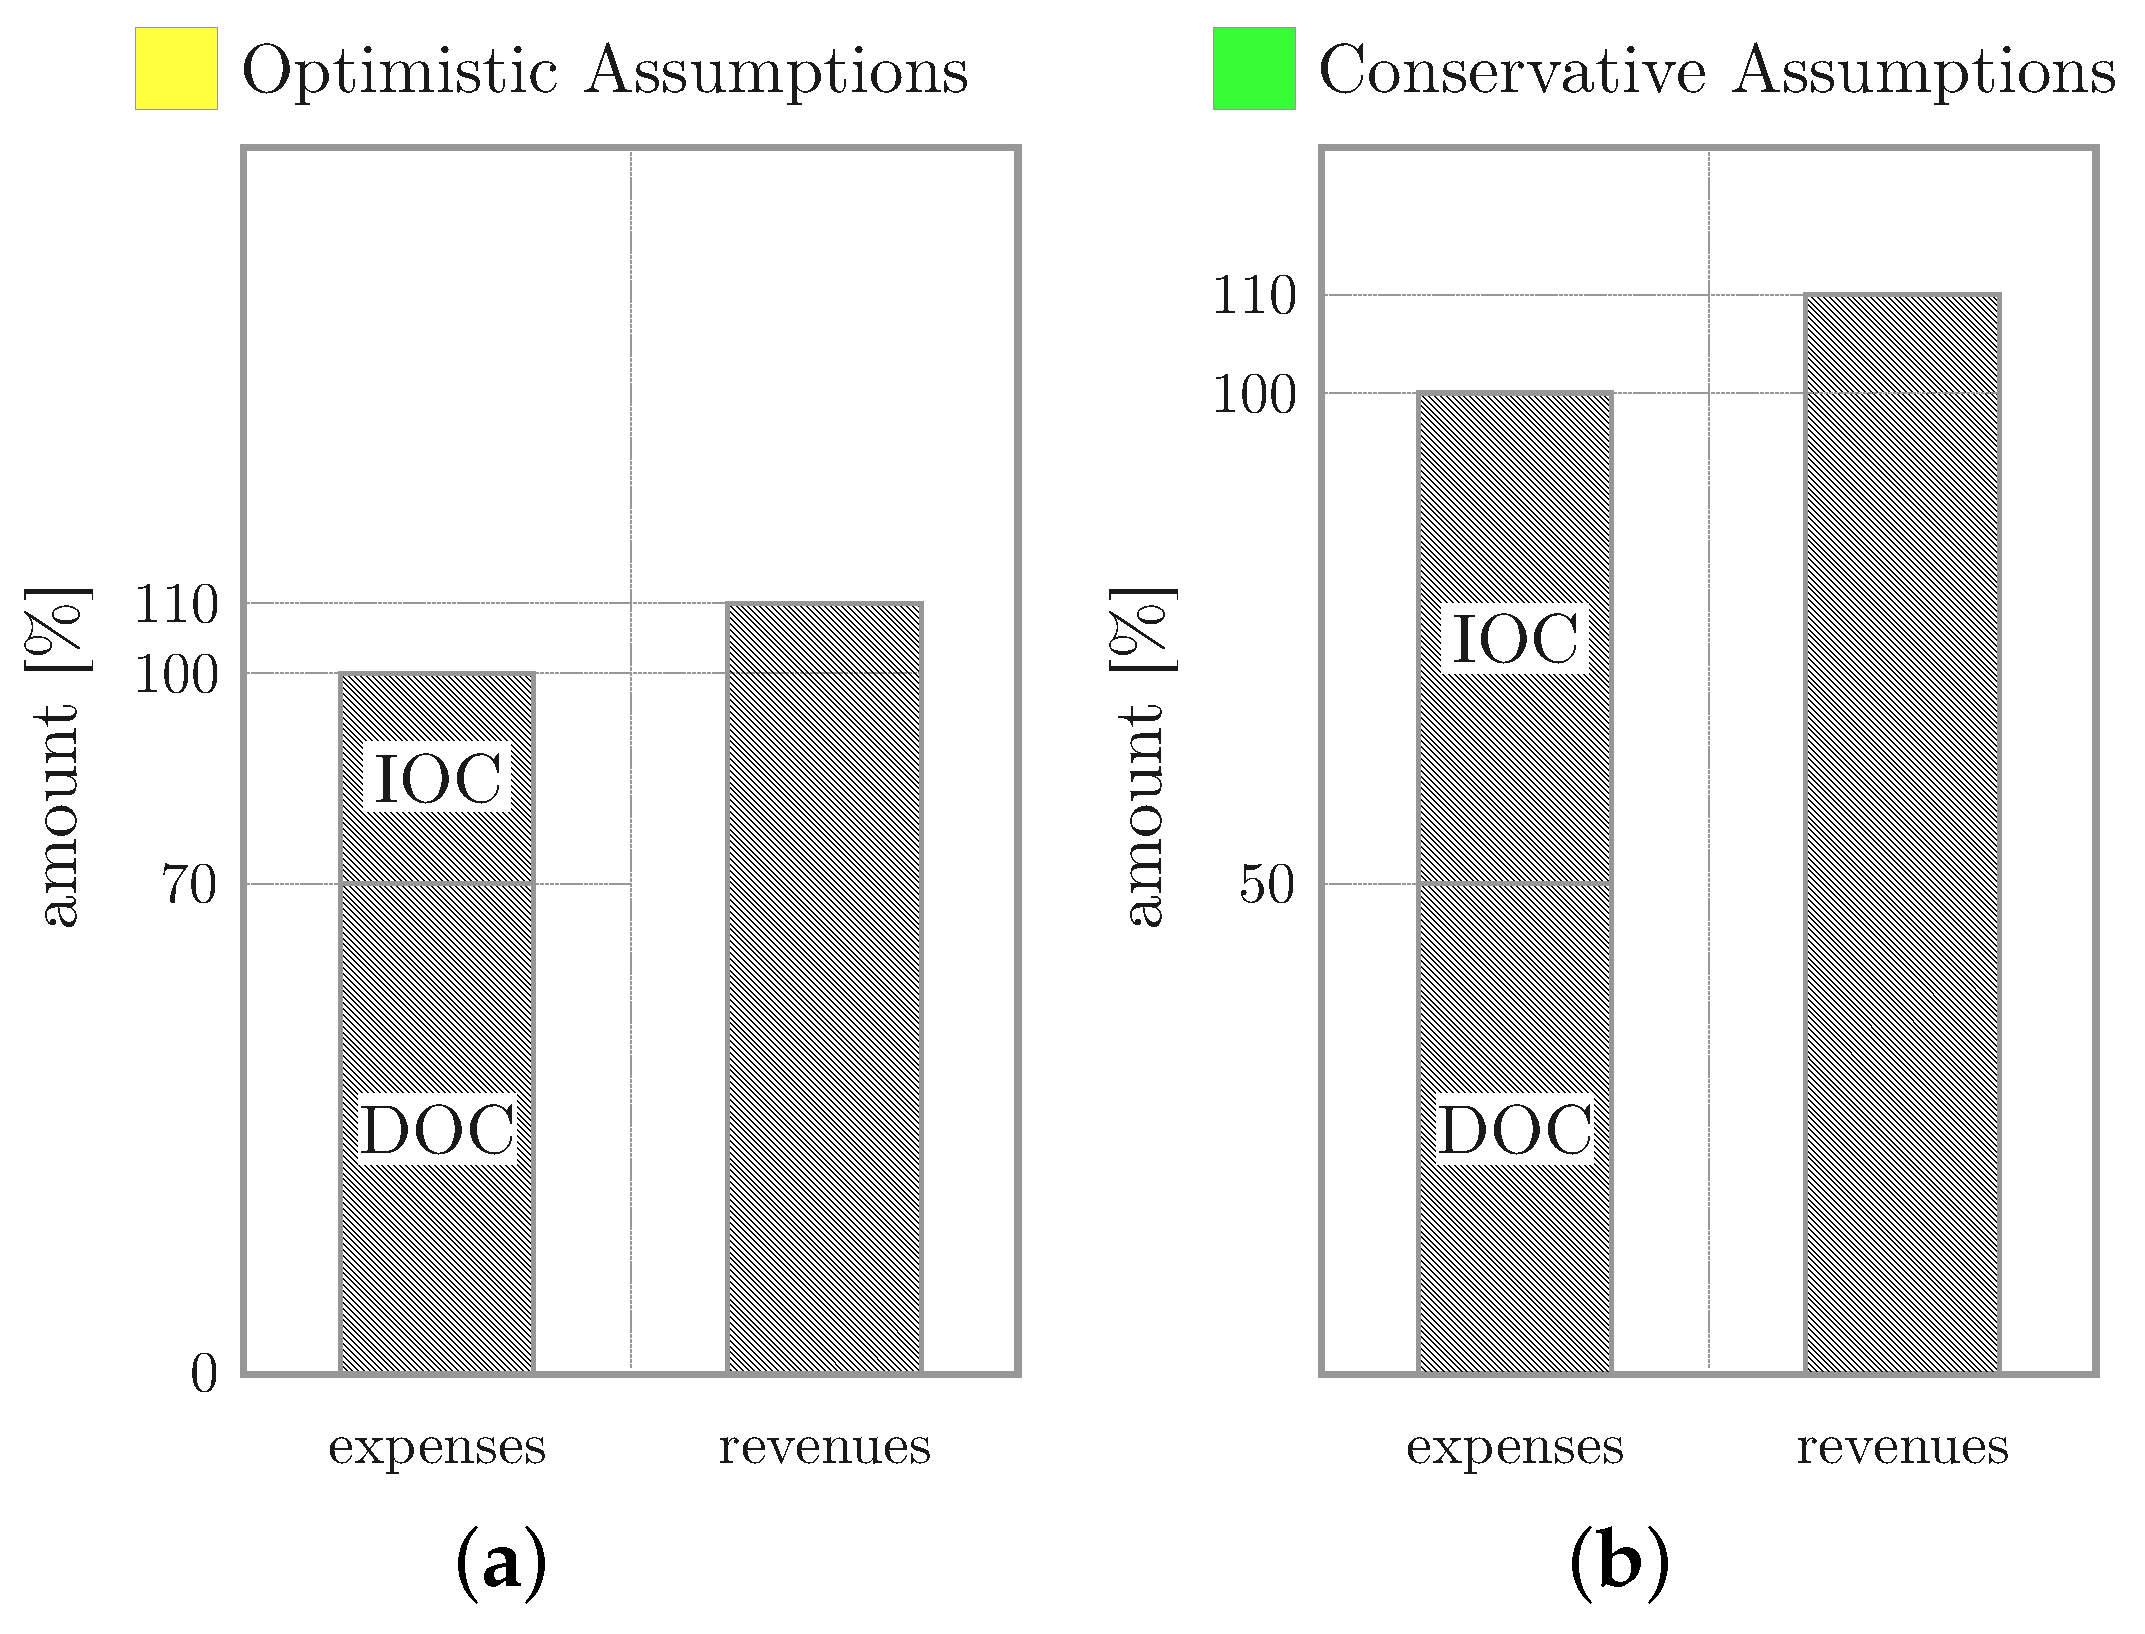
Indirect operating costs (IOC), such as taxes and expenses for administration, security and marketing activities, are calculated on a percentage basis for two different cost assumptions (compare Figure 27). In the optimistic case, it is assumed that the IOCs account for 30% of the total operating cost (TOC). In the conservative case, IOC and DOC are on the same scale. The targeted profit margin for UAM is set to 10 percent [19].
At the current state, the calculation of revenues is solely implemented for the operation mode ’on-demand air taxi’. After studying air fares from VOOM in Saõ Paulo and the heliport network, we assume a maximum air fare of about 10 $ per kilometer [75]. However, to ensure an affordability of UAM services for a large number of citizens, the price per kilometer should be on a similar scale as taxi rides. Current prices for taxi rides in Munich, for instance, are in the range of €1.70–2.00 per kilometer [19]. Consequently, air fares are varied within this study between 1–10 $/km. To increase the economic efficiency of ultra-short routes, a base fare per take-off is also integrated into our revenue module and modified within 1–10 $ per flight.
It is a complex challenge to deduce costs for UAM without precise information on both the market volume as well as the future design of the UAM system. Nevertheless, initial results are exemplarily presented in the following which are needed to perform comparative studies that aim at quantifying specific cause–effect relations in system design. Therefore, it has to be explicitly mentioned that the calculation of economic efficiency is still based on very strong assumptions. At this early stage, it is therefore not possible to draw any conclusions concerning the reasonability, the benefits, and the economic viability of urban air mobility for Hamburg. For the optimistic and the conservative cost scenarios, exemplary results are illustrated in Figure 28 for an eVTOL flight distance of 11 km.
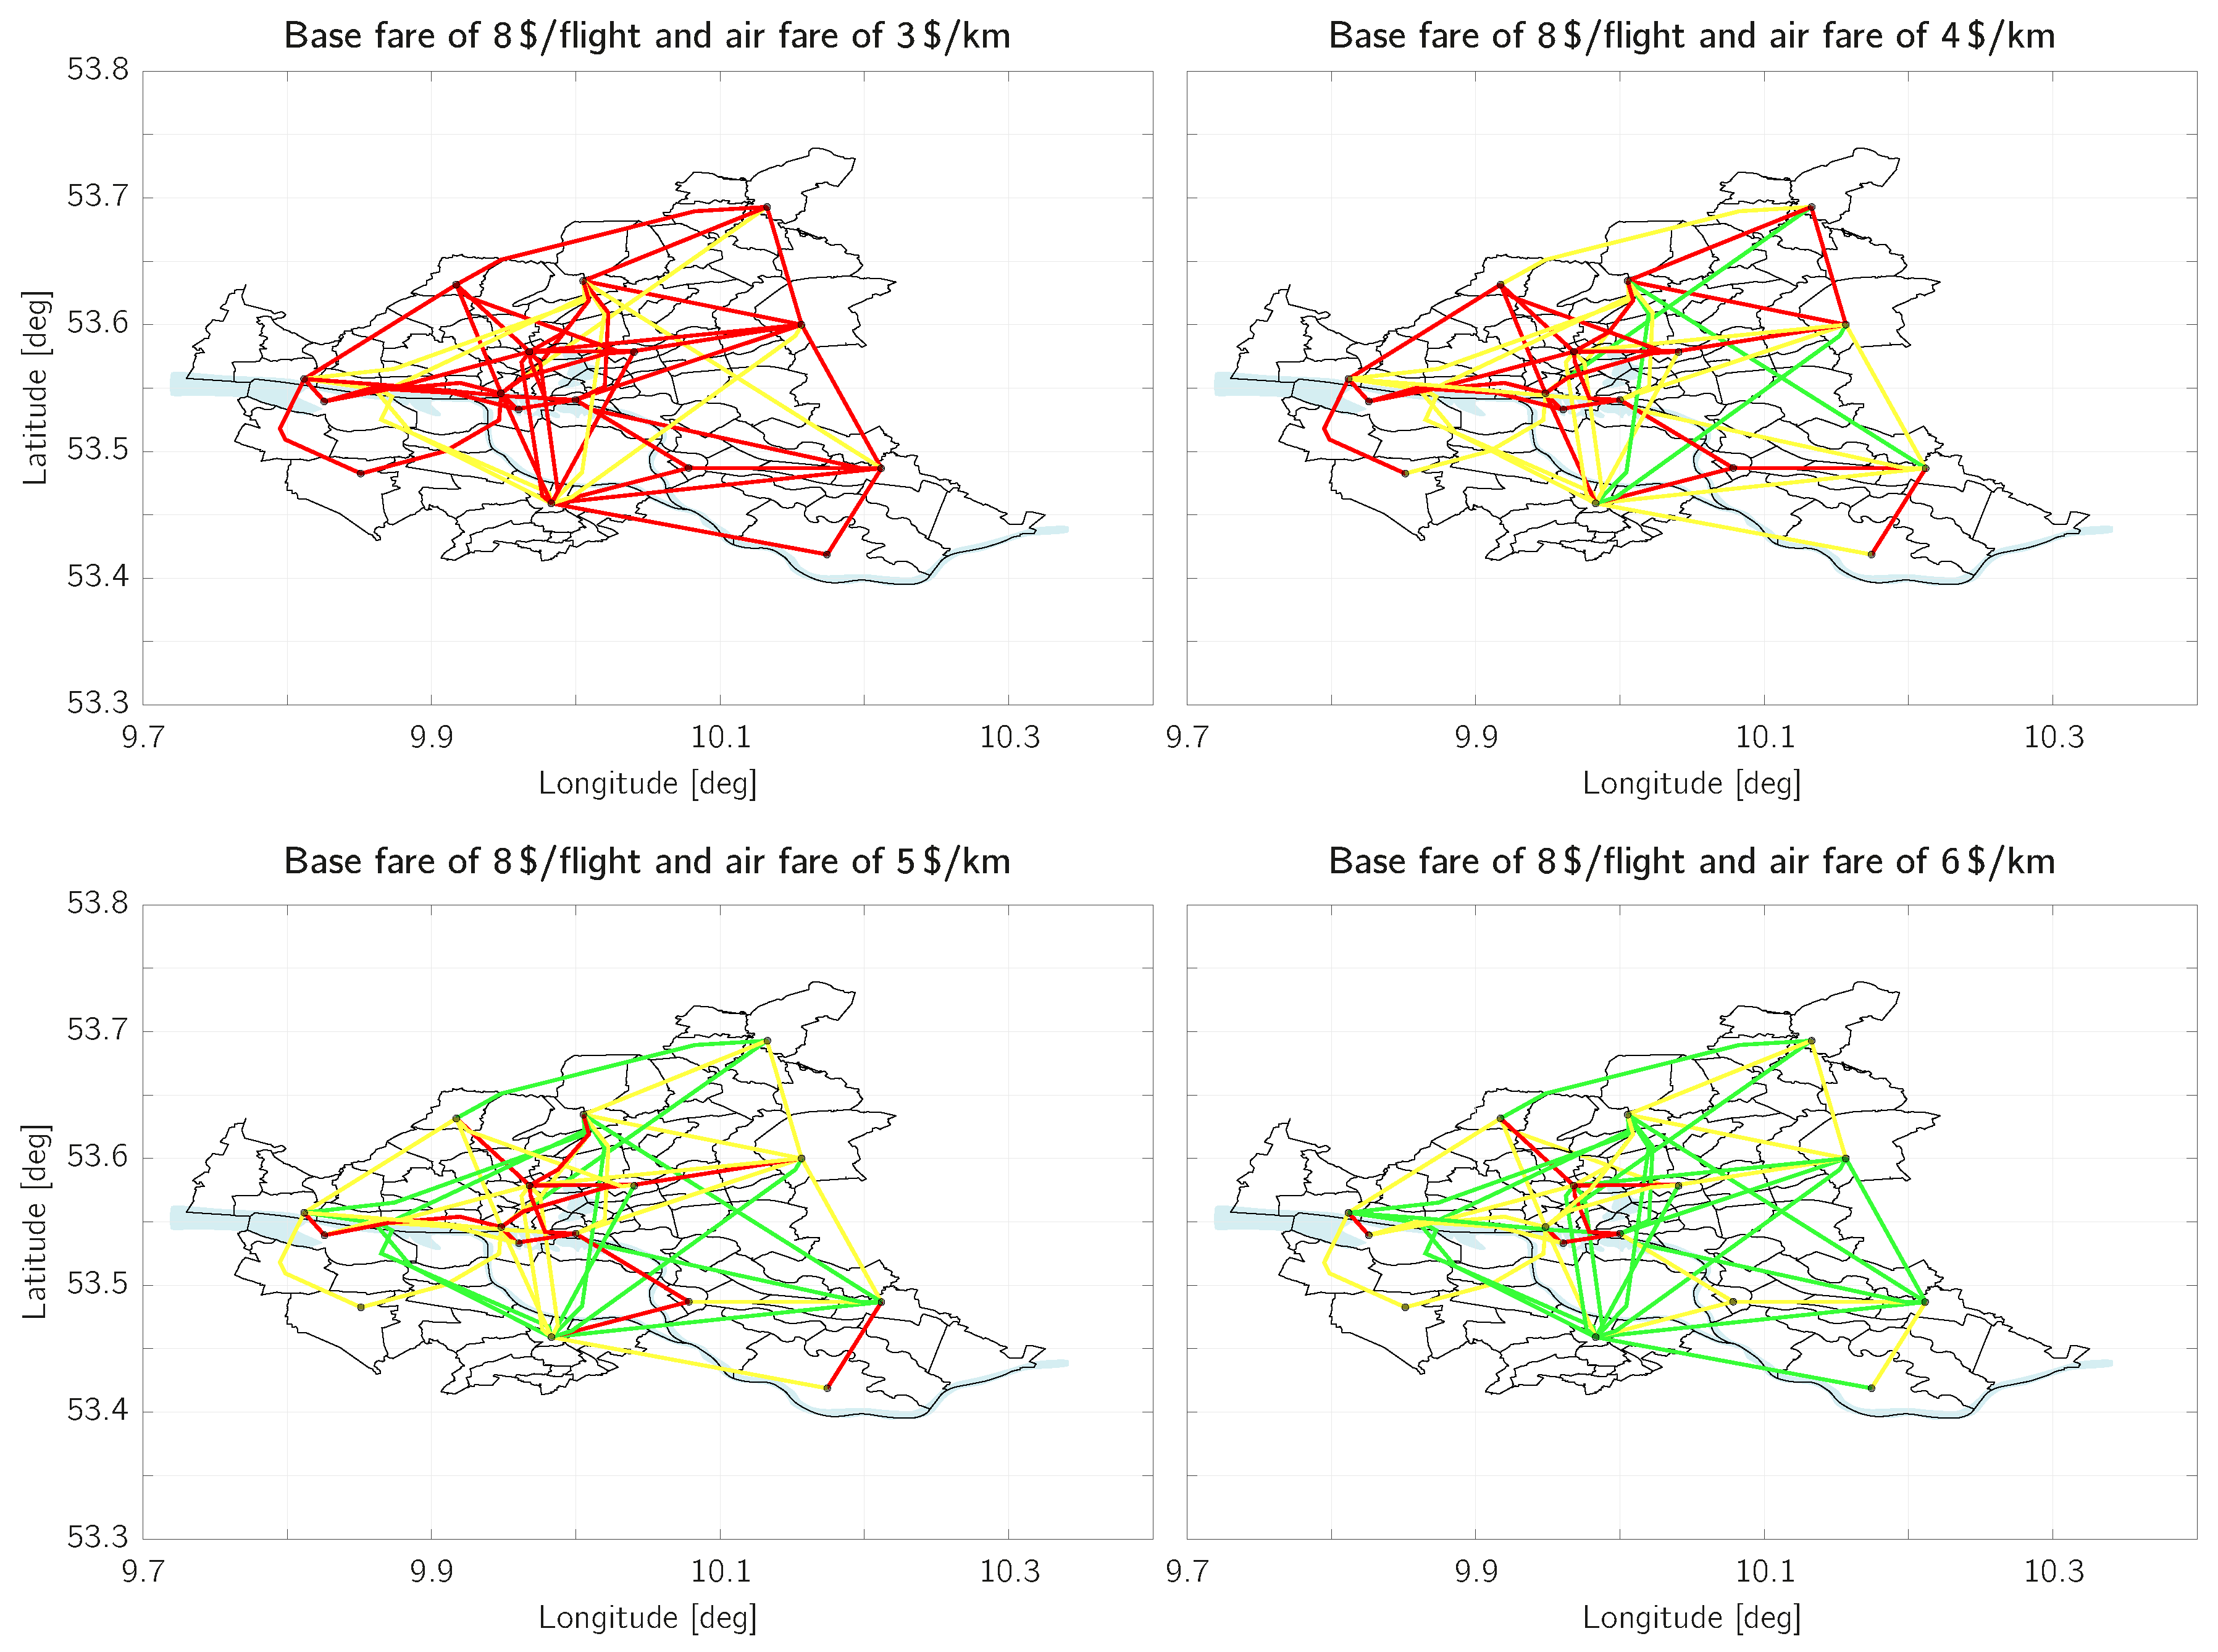
For the third scenario, initial results are exemplarily plotted in Figure 29 assuming a constant base fare of 8 $ per flight and air fares of 3–6 $/km. Based on optimistic assumptions, an air fare of minimum 5 
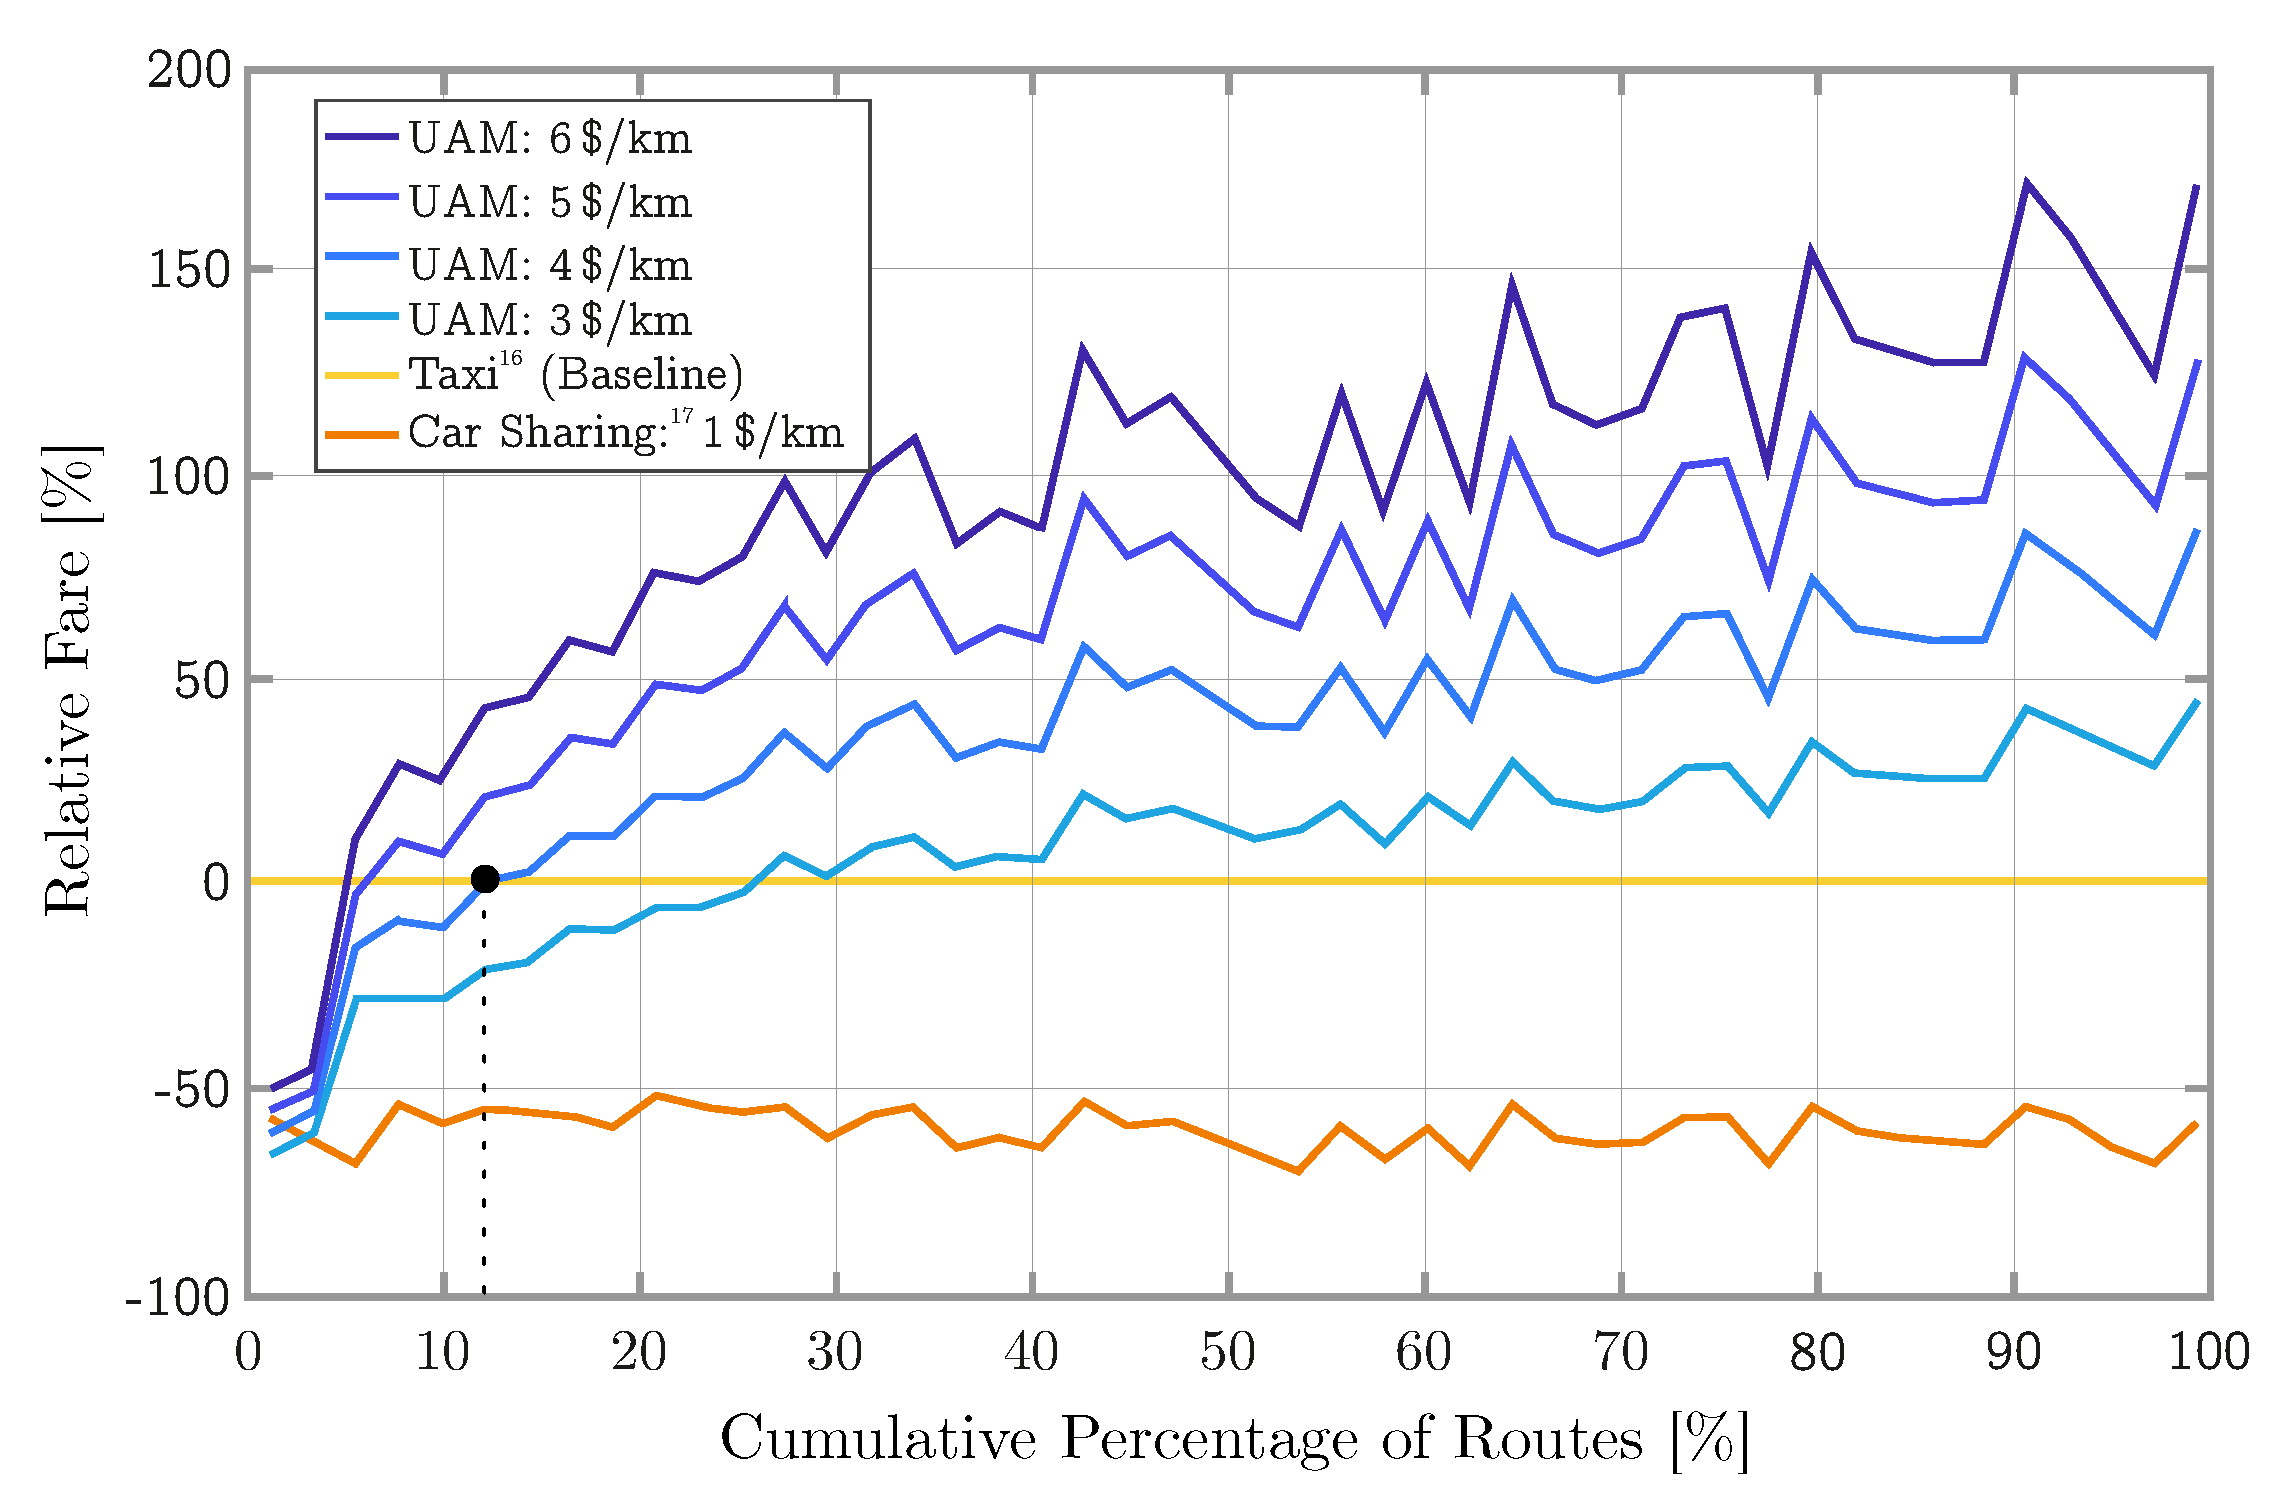
$/km is necessary to cover the TOC in about 70% of the examined route network. A comparison of fares between existing ground-based on-demand mobility and conceivable on-demand UAM services is shown in Figure 30. Although UAM fares are expected to be significantly higher in absolute numbers than for ground-based services, such as taxis (taxi rates in Hamburg range in between 1.5€/km and 2.45€/km [76]) and car sharing services (an exemplary service rate of the provider MILES ranges between 0.89€/km and€1.19 /km [77]), there is a subset of routes in 12% (air fare of 4 
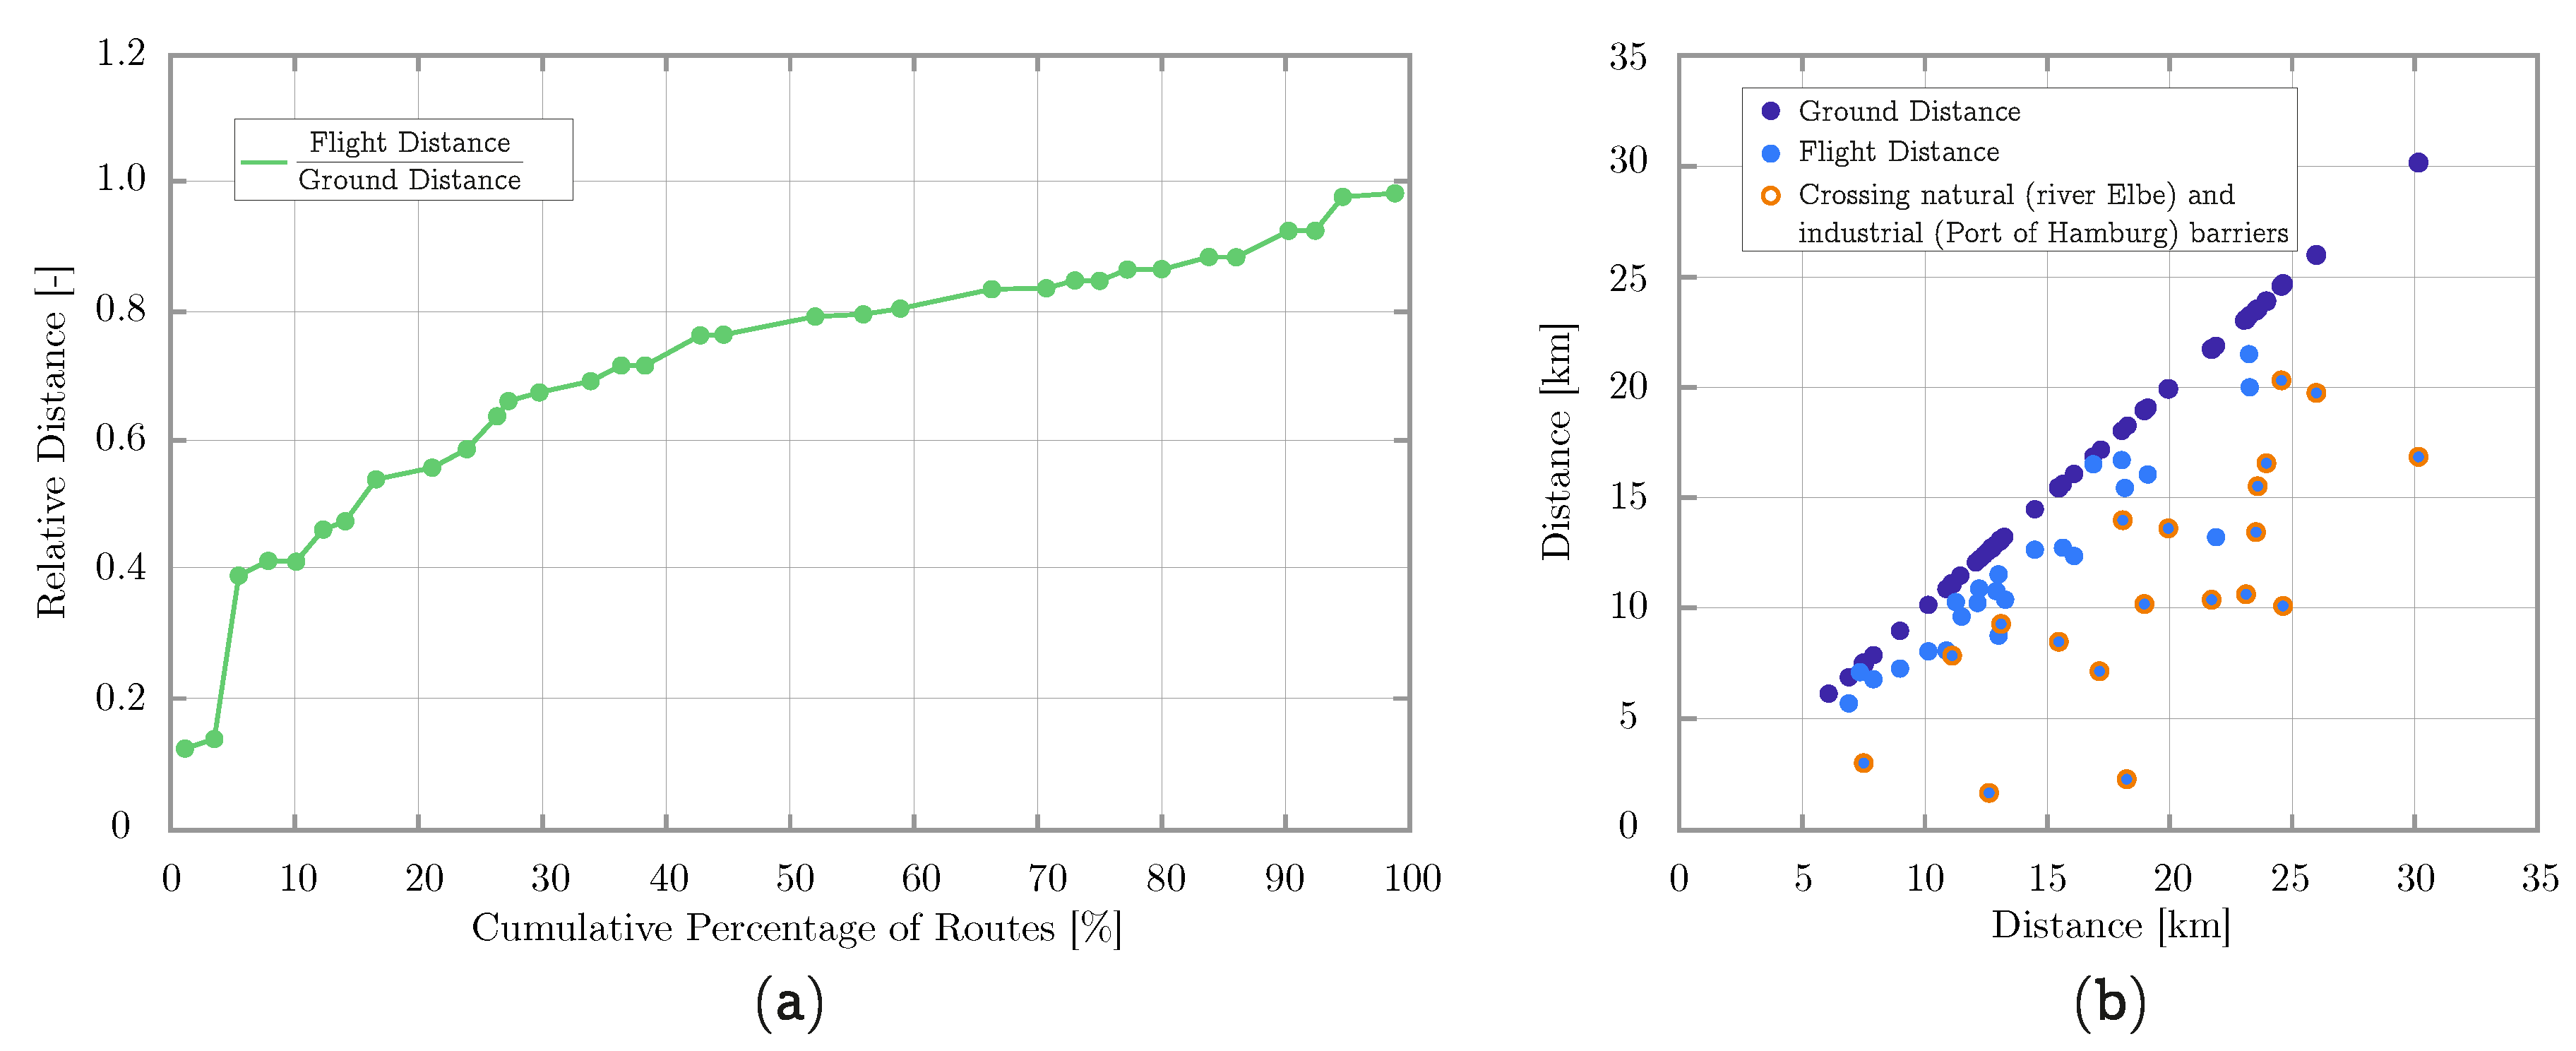
$/km), respectively 26% (air fare of 3 $/km) in which a distance reduction due to a more direct routing (see Figure 31) can compensate the higher costs of UAM. Particularly high savings in distance are achievable when crossing the river Elbe (natural barrier) and the port of Hamburg (industrial barrier), which cause bottlenecks to Hamburg’s transport system.
To enable the derivation of key figures for specific UAM market studies, a door-to-door multi-modal simulation has to be performed in the future (public transport), including the consideration of ways to and from vertiports, which are currently not taken into account. An important source of charges that has not been considered so far is represented by construction and upkeeping of required ground infrastructure. These costs induced by a vertiport network are hard to quantify at this early stage in design process as they are highly affected, among others, by the amount, design and varieties of vertiports (a large number of small vertiports with a single take-off position (e.g., on rooftops) vs. a lower number of seperate buildings with several parking and take-off positions; see Section 3.3), land prices and building regulations. Furthermore, charges for security, noise, and emissions should be implemented in further studies. Since there is a distinct expected interdependency between the pricing and the demand for UAM, it is also planned for future works to create a feedback-loop between components 3 and 12 within the presented UAM system model (see outer iteration in Figure 6 and Figure 7). Questions of public acceptance and justice should also be addressed, as comparably high expected prices for UAM services might result in limited accessibility to this transport mode for high shares of population.

4. Conclusions and Outlook

The main goal of the study at hand is to develop a collaborative approach for the integrated design, modeling, and evaluation of UAM concepts. To quickly identify physical effects and cross-disciplinary influences of UAM, a basic pool of low-fidelity analysis components is developed and integrated into a system of systems. The pool of UAM analysis capabilities includes, i. a., the modeling disciplines of demand, trajectory, ground infrastructure and cost as well as air traffic flow and capacity management. The DLR software RCE is used for connecting the analysis capabilities regarding various disciplines. Its ability of executing workflows based on distributed “black-boxes” while maintaining the integrity of intellectual property facilitates cross-company collaboration. The interface definition between interacting RCE components is based on the standardized data format CPACS. This data schema supports the workflow driven MDO development by supporting both product and process information. The efforts of implementing a viable data format meeting the complex requirements of the developed modeling approach could be minimized by adapting the already existing CPACS schema, which has been well tested in conventional aviation. However, as the data exchange during the execution of the RCE workflow require storage and retrieval times, a dynamic simulation of large traffic scenarios might be challenging. Therefore, it has to be discussed in future works whether the inner iteration loop (components 9–11) should be integrated as stand-alone components for implementing an agent-based simulation.
A subject to particularly high uncertainty is the public’s general willingness of using UAM, especially in the light of presumably higher charges in comparison to current transportation modes. Subsequently, it is a challenging task to derive specific transportation costs without precise information on both the market volume as well as the future design of the UAM system. A general objective of the present study is to create a basis to perform comparative studies in the future that aim at quantifying specific cause–effect relations in system design. In order to achieve that, it is necessary to conduct a high number of sensitivity studies. For this purpose, a fast prediction of demand and cost scenarios seems to be necessary.
The current state of the UAM system module is applied for a 24-hour simulation of three generic air taxi networks in the metropolitan area of Hamburg, which differ in the number of connected districts and routes. In scenario 3, a daily demand of 4890 passengers is roughly estimated and 2100 flights are scheduled, which corresponds to an equivalent share of 8.4% of taxi rides in Hamburg. For each flight, a 4D trajectory simulation is performed. A Dijkstra algorithm is used to find the shortest lateral route avoiding all zones with limited permission of air. As a basic measure for collision avoidance between oncoming and intersecting vehicles, the principle of the “quadrocircular rule” is applied, which defines a split of flight levels for North, East, South, and West tracks. Conflicts are detected during cruise flight for an arbitrary separation minimum of 600 m in horizontal and of 50 m in vertical dimension. For pre-departure deconflicting, an iteration is planned between flight scheduling, trajectory simulation and conflict detection. The description and evaluation of revenues and expenses of urban flight movements is based on existing approaches for DOC modeling of conventional aviation and those of autonomous ground-based mobility. Based on the assumptions made, a minimum air fare of 5 $/km is necessary for profitable operation in about 70% of the investigated route network, which is significantly higher than for ground-based services. However, there is a subset of routes in which a distance reduction due to a more direct routing (crossing natural and industrial barriers) compensate the higher costs of UAM. Nevertheless, due to the comparably high expected prices for UAM services and the resulting limited accessibility of this transport mode to high shares of population, questions of public acceptance and justice must be addressed in future work. One objective even in the early stages of the design of explicit UAM systems is therefore to avoid an unbalanced distribution of benefits (time savings, etc.) and disadvantages (e.g., noise, pollution and invasion of privacy) between different social classes of the population. In order to create a transferability of the presented UAM modeling approach to other metropolitan areas, the proposed methodology is based on generic scenarios. With the availability of new input data (scenarios), which can comprise better input data validity for Hamburg or any other cities, the approach can be used to derive new output.
The collaboration aspect is the main focus of the present study. The definition and clarification of technical interfaces among the individual components requires intensive cooperation between specialists with different areas of expertise. To facilitate the communication effort, interface definitions of a central data exchange format are defined initially. The use of modular system and a single data format is the first step to build up an MDO process for UAM. After understanding the basic system-level behavior and performance, the individual components can be independently developed or replaced by higher-fidelity analysis components. Furthermore, it is important to integrate missing disciplines, which include acoustic and visual noise, effects due to downwash as well as energy consumption and disruptive management, into the UAM system simulation. This enables the derivation of key figures for specific UAM market studies.

Author Contributions

Conceptualization: V.G., N.D., M.N., M.S., J.B., B.L., A.L. & I.T.; Data Curation: M.N. & N.D.; Investigation and Visualisation: M.N., N.D., M.S., J.B., B.L., A.L. & I.T.; Methodology and Software: M.N. (Section 3.1 and Section 3.8), N.D. (Section 3.1 and Section 3.3), M.S. (Section 3.4 and Section 3.8), J.B. (Section 3.7), B.L. (Section 3.6), A.L. (Section 3.5) & I.T. (Section 3.2); Supervision: V.G.; Validation: M.N. & M.S.; Writing—Original Draft Preparation: M.N., N.D. & M.S., based on contributions by J.B., B.L., A.L., I.T. & V.G.; Writing—Review and Editing: M.N., N.D. & M.S.; All authors have read and agreed to the published version of the manuscript.

Funding

This research received no external funding.

Conflicts of Interest

The authors declare no conflict of interest.

Abbreviations

The following abbreviations are used in this manuscript:
ATCAir Traffic Control
ATMAir Traffic Management
CPACSCommon Parametric Aircraft Configuration Schema
DLRGerman Aerospace Center
DOCDirect Operating Cost
eVTOLElectric Vertical Takeoff and Landing
IOCIndirect Operating Cost
LAQLocal Air Quality
LFLoad Factor
MDOMultidisciplinary Design and Optimization
RCERemote Component Environment
ODOrigin Destination
ODMOn-Demand Mobility
PAVPassenger Aerial Vehicle
SERAStandardised European Rules of the Air
SORASpecific Operations Risk Assesment of Unmanned Systems
UAMUrban Air Mobility
UATMUnmanned Air Traffic Management System
UAVUnmanned Aerial Vehicle

References

  1. Booz Allen Hamilton: Urban Air Mobility (UAM) Market Study. 5 October 2018. Available online: https://ntrs.nasa.gov/archive/nasa/casi.ntrs.nasa.gov/20190001472.pdf (accessed on 14 June 2019).
  2. Crown Consulting Inc.; Ascension Global; Georgia Tech.; McKinsey& Company. Urban Air Mobility (UAM) Market Study. November 2018. Available online: https://www.nasa.gov/sites/default/files/atoms/files/uam-market-study-executive-summary-pr.pdf (accessed on 10 June 2019).
  3. Roland Berger. Urban Air Mobility: The Rise of a New Mode of Transportation; Roland Berger: Munich, Germany, November 2018; Available online: https://www.rolandberger.com/publications/publication_pdf/Roland_Berger_Urban_Air_Mobility.pdf (accessed on 12 June 2019).
  4. German Aerospace Center (DLR). DLR Blueprint: Concept for Urban Airspace Integration; German Aerospace Center: Braunschweig, Germany; Brunswick: Lake Forest, IL, USA, December 2017. [Google Scholar]
  5. UBER Elevate. Fast-Forwarding to a Future of On-Demand Urban Air Transportation; Uber Technologies. Inc.: San Francisco, CA, USA, 2016. [Google Scholar]
  6. Airbus. Blueprint for the Sky: The Roadmap for the Safe Integration of Autonomous Aircraft; A3 by Airbus LLC: Sunnyvale, CA, USA, 2018. [Google Scholar]
  7. Federal Aviation Administration. Integration of Civil Unmanned Aircraft Systems (UAS) in the National Airspace System (NAS) Roadmap; FAA: Washington, DC, USA, July 2018. [Google Scholar]
  8. EmbraerX, Atech and Harris. Flight Plan 2030: An Air Traffic Managment Concept for Urban Air Mobility; EmbraerX, Atech and Harris: Melbourne, FL, USA, May 2019. [Google Scholar]
  9. Gollnick, V.; Niklaß, M.; Swaid, M.; Berling, J.; Dzikus, N. A Methodology and first results to assess the potential of urban air mobility concepts. In Proceedings of the Aerospace Europe Conference, AEC2020, Bordeaux, France, 25–28 February 2020. [Google Scholar]
  10. Kurtz, C.F.; Snowden, D.J. The new dynamics of strategy: Sense-making in a complex and complicated world. IBM Syst. J. 2003, 42, 3. [Google Scholar] [CrossRef]
  11. Joint Authorities for Rulemaking of Unmanned Systems: ARUS guidelines on Specific Operations Risk Assessment (SORA). 2017. Available online: http://jarus-rpas.org/sites/jarus-rpas.org/files/jar_doc_06_jarus_sora_v1.0.pdf (accessed on 10 June 2019).
  12. Biehle, T.; Kellermann, R. Mind the Gap: Concepts and Pathways for a Societally Acceptable Future of UAS in Europe; White Paper; Sky Limits: Berlin, Germany, July 2019. [Google Scholar]
  13. Kellermann, R.; Biehle, T.; Fischer, L. Drones for parcel and passenger transportation—A literature review. Transp. Res. Interdiscip. Perspect. 2020. [Google Scholar] [CrossRef]
  14. Straubinger, A.; Rothfeld, R.; Shamiyeh, M.; Büchter, K.-D.; Kaiser, J.; Ploetner, K.O. An Overview of Current Research and Developments in UAM. In Proceedings of the 23rd ATRS, Amsterdam, The Netherlands, 2–5 July 2019. [Google Scholar]
  15. Binder, R.B.; Garrow, L.A.; German, B.J.; Mokhtarian, P.L.; Daskilewicz, M.J.; Douthat, T.H. If You Fly It, Will Commuters Come Predicting Demand for Urban Air Trips. In Proceedings of the Aviation Technology, Integration, and Operations Conference, Atlanta, GA, USA, 25–29 June 2018. [Google Scholar] [CrossRef]
  16. Becker, K.; Terekhov, I.; Niklaß, M.; Gollnick, V. A global gravity model for air passenger demand between city pairs and future interurban air mobility markets identification. In Proceedings of the Aviation Technology, Integration, and Operations Conference, Atlanta, GA, USA, 25–29 June 2018. [Google Scholar] [CrossRef] [Green Version]
  17. Kohlman, L.W.; Patterson, M.D.; Raabe, B.E. Urban Air Mobility Network and Vehicle Type—Modeling and Assessment; NASA Technical Report; NASA/TM—2019–220072; NASA Langley Research Center: Hampton, VA, USA, 2019. [Google Scholar]
  18. Rothfeld, R.; Balac, M.; Ploetner, K.O.; Antoniou, C. Agent-based Simulation of Urban Air Mobility. In Proceedings of the 2018 Modeling and Simulation Technologies Conference, Atlanta, GA, USA, 25–29 June 2018. [Google Scholar] [CrossRef] [Green Version]
  19. Ploetner, K.O.; Al Haddad, C.; Antoniou, C.; Frank, F.; Fu, M.; Kabel, S.; Llorca, C.; Moeckel, R.; Moreno, A.T.; Pukhova, A.; et al. Long-term application potential of urban air mobility complementing public transport: An upper Bavaria example. In Proceedings of the Deutscher Luft- und Raumfahrtkongress, Darmstadt, Germany, 30 Sepember–2 October 2019. [Google Scholar]
  20. Thipphavong, D.P.; Apaza, R.D.; Barmore, B.E.; Battiste, V.; Burian, B.K.; Dao, Q.V.; Feary, M.S.; Go, S.; Goodrich, K.H.; Homola, J.R.; et al. Urban Air Mobility Airspace Integration Concepts and Considerations. In Proceedings of the 2018 Modeling and Simulation Technologies Conference, Atlanta, GA, USA, 25–29 June 2018. [Google Scholar] [CrossRef] [Green Version]
  21. Sunil, E.; Hoekstra, J.; Ellerbroek, J.; Bussnik, F.; Nieuwenhuisen, D.; Vidosavljevic, A.; Kern, S. Metropolis: Relating Airspace Structure and Capacity for Extreme Traffic Densities. ATM Semin. 2015, 11. Available online: https://hal-enac.archives-ouvertes.fr/hal-01168662 (accessed on 25 October 2018).
  22. Geister, D.; Korn, B. Density based Management Concept for Urban Air Traffic. In Proceedings of the 37th AIAA/IEEE Digital Avionics Systems Conference (DASC), London, UK, 23–27 Sepember 2018. [Google Scholar]
  23. Cotton, W.B.; Wing, D.J. Airborne Trajectory Management for Urban Air Mobility. In Proceedings of the 2018 Modeling and Simulation Technologies Conference, Atlanta, GA, USA, 25–29 June 2018. [Google Scholar] [CrossRef] [Green Version]
  24. Vascik, P.D.; Hansman, R.J. Scaling constraints for urban air mobility operations: Air traffic control, ground infrastructure, and noise. In Proceedings of the 2018 Modeling and Simulation Technologies Conference, Atlanta, GA, USA, 25–29 June 2018. [Google Scholar] [CrossRef]
  25. Kleinbekman, I.C.; Mitici, M.A.; Wei, P. EVTOL Arrival Sequencing and Scheduling for On-Demand Urban Air Mobility. In Proceedings of the 37th Digital Avionics Systems Conference, London, UK, 23–27 September 2018. [Google Scholar] [CrossRef] [Green Version]
  26. Silva, C.; Johnson, W.; Antcliff, K.R.; Patterson, M.D. VTOL urban air mobility concept vehicles for technology development. In Proceedings of the 2018 Modeling and Simulation Technologies Conference, Atlanta, GA, USA, 25–29 June 2018. [Google Scholar] [CrossRef] [Green Version]
  27. Shamiyeh, M.; Rothfeld, R.; Hornung, M. A performance benchmark of recent personal air vehicle concepts for urban air mobility. In Proceedings of the 31th ICAS, Belo Horizonte, Brazil, 9–14 September 2018. [Google Scholar]
  28. Vascik, P.D.; Hansman, R.J. Development of Vertiport Capacity Envelopes and Analysis of Their Sensitivity to Topological and Operational Factors. In Proceedings of the AIAA Scitech 2019 Forum, San Diego, CA, USA, 7–11 January 2019. [Google Scholar] [CrossRef]
  29. Terekhov, I.; Niklaß, M.; Dzikus, N.; Gollnick, V. Assessing noise effects of the urban air transportation system. In Proceedings of the AIAA/CEAS Aeroacoustics Conference, Atlanta, GA, USA, 25–29 June 2018. [Google Scholar] [CrossRef] [Green Version]
  30. Lim, E.; Hwang, H. The Selection of Vertiport Location for On-Demand Mobility and Its Application to Seoul Metro Area. Int. J. Aeronaut. Space Sci. 2018, 20, 260–272. [Google Scholar] [CrossRef]
  31. Pinto Neto, E.C.; Baum, D.M.; de Almeida Junior, J.R.; Camargo Junior, J.B.; Cugnasca, P.S. Trajectory-based urban air mobility operations simulator. arXiv 2019, arXiv:1908.08651. [Google Scholar]
  32. Bosson, C.S.; Lauderdale, T.A. Simulation Evaluations of an Autonomous Urban Air Mobility Network Management and Separation Service. In Proceedings of the 2018 Aviation Technology, Integration, and Operations Conference, Atlanta, GA, USA, 25–29 June 2018. [Google Scholar] [CrossRef] [Green Version]
  33. Yang, X.; Deng, L.; Wei, P. Multi-Agent Autonomous On-Demand Free Flight Operations in Urban Air Mobility. In Proceedings of the AIAA Aviation 2019 Forum, Dallas, TX, USA, 17–21 June 2019. [Google Scholar] [CrossRef]
  34. Patterson, M.D.; Antcliff, K.R.; Kohlman, L.W. A Proposed Approach to Studying Urban Air Mobility Missions Including an Initial Exploration of Mission Requirements. In Proceedings of the 75th Annual Forum and Technology Display, Phoenix, AZ, USA, 14–17 May 2018. [Google Scholar]
  35. Moerland, E.; Becker, R.-G.; Nagel, B. Collaborative understanding of disciplinary correlations using a low-fidelity physics-based aerospace toolkit. Ceas Aeronaut. J. 2015, 6, 441–454. [Google Scholar] [CrossRef] [Green Version]
  36. Seider, D.; Fischer, P.M.; Litz, M.; Schreiber, A.; Gerndt, A. Open Source Software Framework for Applications in Aeronautics and Space. In Proceedings of the IEEE Aerospace Conference, Big Sky, MT, USA, 3–10 March 2012. [Google Scholar]
  37. Boden, B.; Flink, J.; Mischke, R.; Schaffert, K.; Weinert, A.; Wohlan, A.; Schreiber, A. RCE: An Integration Environment for Engineering and Science. An Integration Environment for Engineering and Science. arXiv 2019, arXiv:1908.03461. [Google Scholar]
  38. Ciampa, P.D.; Prakasha, P.S.; Torrigiani, F.; Walther, J.-N.; Timmermans, H.; Rajpal, D.; van Gent, I.; la Rocca, G.; Voskuijl, M. Streamlining Cross-Organizational Aircraft Development: Results from the AGILE Project. In Proceedings of the AIAA Aviation 2019 Forum, Dallas, TX, 17–21 June 2019. [Google Scholar] [CrossRef]
  39. Boden, B.; Flink, J.; Mischke, R.; Schaffert, K.; Weinert, A.; Wohlan, A.; Ilic, C.; Wunderlich, T.; Liersch, C.M.; Goertz, S.; et al. Distributed Multidisciplinary Optimization and Collaborative Process Development Using RCE. In Proceedings of the AIAA Aviation 2019 Forum, Dallas, TX, USA, 17–21 June 2019. [Google Scholar] [CrossRef] [Green Version]
  40. Niklaß, M. Ein systemanalytischer Ansatz zur Internalisierung der Klimawirkung der Luftfahrt. Ph.D. Thesis, Hamburg University of Technology (TUHH), Hamburg, Germany, 2019. [Google Scholar]
  41. Nagel, B.; Böhnke, D.; Gollnick, V.; Schmollgruber, P.; Rizzi, A.; La Rocca, G.; Alonso, J.J. Communication in Aircraft Design: Can we establish a common language? In Proceedings of the 28th ICAS, Brisbane, Australia, 23–28 September 2012. [Google Scholar]
  42. Boehnke, D. A Multi-Fidelity Workflow to Derive Physics-Based Conceptual Design Methods. Ph.D. Thesis, Hamburg University of Technology (TUHH), Hamburg, Germany, 2015. [Google Scholar]
  43. Gollnick, V.; Dzikus, N.; Niklaß, M.; Terekhov, I.; Swaid, M.; Berling, J.; Lührs, B.; Lau, A.; Radde, M. Ein Gesamtkonzept zur Urbanen Luftmobilität am Beispiel Hamburg; German Aerospace Center and Hamburg University of Technology: Hamburg, Germany, December 2018. [Google Scholar]
  44. Marchetti, C. Anthropological invariants in travel behavior. Technol. Forecast. Soc. Chang. 1994, 47, 75–88. [Google Scholar] [CrossRef] [Green Version]
  45. Terekhov, I. Forecasting Air Passenger Demand between Settlements Worldwide Based on Socio-Economic Scenarios. Ph.D. Thesis, Hamburg University of Technology (TUHH), Hamburg, Germany, 2017. [Google Scholar]
  46. Terekhov, I.; Evans, A.; Gollnick, V. Forecasting a Global Air Passenger Demand Network Using Weighted Similarity-Based Algorithms. In Complex Networks VII. Studies in Computational Intelligence; Springer: Cham, Switzerland, 2016; Volume 644. [Google Scholar]
  47. Nobis, C.; Kuhnimhof, T. Mobilität in Deutschland—MiD Ergebnisbericht; FE-NR. 70.904/15; Studie von Infas, DLR, IVT und Infas 360 im Auftrag des Bundesministers für Verkehr und digitale Infrastruktur: Bonn/Berlin, Germany, 2018. [Google Scholar]
  48. Statistisches Amt für Hamburg und Schleswig-Holstein. Bevölkerung in Hamburg am 31.12.2016—Auszählung aus dem Melderegister; Kennziffer: AI/S1-j16HH; Statistisches Amt für Hamburg und Schleswig-Holstein: Hamburg, Germany, 2017. [Google Scholar]
  49. Statistisches Amt für Hamburg und Schleswig-Holstein. Statisik Informiert: Lohn- und Einkommenssteuerstatistik in Hamburg am 2013; Kennziffer: VIII/2017; Statistisches Amt für Hamburg und Schleswig-Holstein: Hamburg, Germany, 2017. [Google Scholar]
  50. Freie und Hansestadt Hamburg, Behörde für Stadtentwicklung und Wohnen: Flächennutzungsplan. Available online: https://www.hamburg.de/flaechennutzungsplan/4111188/flaechennutzungsplan-hintergrund/ (accessed on 6 August 2019).
  51. Holst, D. Analyse von Reisezeiten Verschiedener Verkehrsträger für die Bewertung Urbaner Lufttransportsysteme. Bachelor’s Thesis, Hamburg University of Technology (TUHH), Hamburg, Germany, 2018. [Google Scholar]
  52. Google: Map Data. Available online: http://maps.google.com/ (accessed on 6 August 2018).
  53. Statistisches Amt für Hamburg und Schleswig-Holstein. Die Wirtschaftliche Lage des Hamburger Taxengewerbes 2016; Statistisches Amt für Hamburg und Schleswig-Holstein: Hamburg, Germany, November 2017. [Google Scholar]
  54. Antcliff, K.R. Silicon Valley as an Early Adopter for Civil VTOL Operations. In Proceedings of the 16th AIAA Aviation Technology, Integration, and Operations Conference, Washington, DC, USA, 13–17 June 2016. [Google Scholar] [CrossRef] [Green Version]
  55. Vascik, P.D.; Hansman, R.J. Evaluation of Key Operational Constraints Affecting On-Demand Mobility for Aviation In The Los Angeles Basin: Ground Infrastructure, Air Traffic Control In addition, Noise. In Proceedings of the 17th AIAA Aviation Technology, Integration, and Operations Conference, Denver, CO, USA, 5–9 June 2017. [Google Scholar] [CrossRef]
  56. Rex, A. VTOL & Vertiports—A look at the future. In Proceedings of the USHST 2018 Infrastructure Summit, Washington, DC, USA, 14–15 February 2018. [Google Scholar]
  57. Volocopter: Volocopter Zeigt Lufttaxi-Infrastruktur. Infrastruktur für Lufttaxi-Großbetrieb in Städten. Available online: https://press.volocopter.com/index.php/volocopter-zeigt-lufttaxi-infrastruktur (accessed on 6 August 2019).
  58. Pille, R. Konzeptionelle Auslegung von Start- und Landeplätzen in Urbanen Lufttransportsystemen. Bachelor’s Thesis, Hamburg University of Technology (TUHH), Hamburg, Germany, 2019. [Google Scholar]
  59. Landesbetrieb Geoinformation und Vermessung: 3D-Stadtmodell LoD1DE Hamburg. Available online: http://suche.transparenz.hamburg.de/dataset/3d-stadtmodell-lod1-de-hamburg1 (accessed on 23 February 2017).
  60. SESAR CORUS Project: U-Space—Concept of Operations—Enhanced Overview. 2019, Ed. 01.01.03. Available online: https://www.sesarju.eu/sites/default/files/documents/u-space/CORUS%20ConOps%20vol1.pdf (accessed on 20 November 2019).
  61. Swaid, M.; Lührs, B.; Linke, F.; Gollnick, V.; Cai, K.Q. Wind-optimal ATS Route Redesign: A Methodology and its Application to Route A461 in China. In Proceedings of the 16th AIAA Aviation Technology, Integration, and Operations Conference, Washington, DC, USA, 13–17 June 2016. [Google Scholar] [CrossRef]
  62. Dijkstra, E.W. A note on two problems in connexion with graphs. Numer. Math. 1959, 1, 269–271. [Google Scholar] [CrossRef] [Green Version]
  63. European Commission. Regulation No 923/2012 OJ L 281. 2012, pp. 18–19. Available online: https://eur-lex.europa.eu/LexUriServ/LexUriServ.do?uri=OJ:L:2012:281:0001:0066:EN:PDF (accessed on 28 April 2019).
  64. Lührs, B. Erweiterung Eines Trajektorienrechners zur Nutzung Meteorologischer Daten für die Optimierung von Flugzeugtrajektorien. Master’s Thesis, Hamburg University of Technology (TUHH), Hamburg, Germany, 2014. [Google Scholar]
  65. Uber Elevate: EVTOL Vehicle Requirements and Missions. 2018. Available online: https://s3.amazonaws.com/uber-static/elevate/Summary+Mission+and+Requirements.pdf (accessed on 6 August 2019).
  66. ICAO: Doc 4444. Procedures for Air Navigation Services—Air Traffic Management, 16th ed.; ICAO: Montreal, QC, Canada, November 2016. [Google Scholar]
  67. Berling, J.; Lau, A.; Gollnick, V. European Air Traffic Flow Management with Strategic Deconfliction. In Operations Research Proceedings (GOR (Gesellschaft für Operations Research e.V.)); Dörner, K., Ljubic, I., Pflug, G., Tragler, G., Eds.; Springer: Cham, Switzerland, 2015. [Google Scholar]
  68. Lau, A.; Budde, R.; Berling, J.; Gollnick, V. The Network Flow Environment: Slot Allocation Model Evaluation With Convective Nowcasting. In Proceedings of the 29th ICAS, St. Petersburg, Russia, 7–12 September 2014. [Google Scholar]
  69. Bösch, P.M.; Becker, F.; Becker, H.; Axhausen, K.W. Cost-based analysis of autonomous mobility services. Transp. Policy 2018, 64. [Google Scholar] [CrossRef]
  70. Liebeck, R.H.; Andrastek, D.A.; Chau, J.; Girvin, R.; Lyon, R.; Rawdon, B.K.; Scott, P.W.; Wright, R.A. Advanced Subsonic Airplane Design and Economic Studies NASA CR-195443; McDonnell Douglas Aerospace: Long Beach, CA, USA, 1995. [Google Scholar]
  71. Thorbeck, J. TU Berlin DOC Method as Proposed in Lecture Notes “Flugzeugentwurf”; Technical University of Berlin: Berlin, Germany, 2012. [Google Scholar]
  72. Litman, T. Autonomous Vehicle Implementation Predictions—Implications for Transport Planning; Victoria Transport Policy Institute: Victoria, BC, Canada, 2020. [Google Scholar]
  73. Bundesnetzagentur für Elektrizität, Gas, Telekommunikation, Post und Eisenbahnen; Bundeskartellamt. Monitoringbericht; Bundesnetzagentur: Bonn, Germany, 2019. [Google Scholar]
  74. ECOFYS; Fraunhofer-ISI; GWS. Stromkosten der Energieintensiven Industrie. Ein Internationaler Vergleich—Zusammenfassung der Ergebnisse; ECOFYS/Fraunhofer-ISI/GWS: Berlin, Germany, July 2015. [Google Scholar]
  75. Voom: On-Demand Helicopter Service. Available online: https://www.voom.flights/en/regions/sao_paulo (accessed on 30 November 2017).
  76. Freie und Hansestadt Hamburg: Beförderungsentgelte für Taxenfahrten in Hamburg. Available online: https://www.hamburg.de/taxi/2936756/taxi-fahrpreise/ (accessed on 13 November 2019).
  77. MILES Mobility GmbH: Carsharing Preise nach Kilometern. Available online: https://miles-mobility.com/preise/ (accessed on 13 November 2019).
Figure 1. Required design tasks to create a new overall model system for urban air transportation. The focus of this paper is highlighted in red.
Aerospace 07 00050 g001
Figure 2. First, approaches of UAM modeling can be characterized as a chaotic project according to the Cynefin framework (inspired by [10]).
Aerospace 07 00050 g002
Figure 3. DLR’s interdisciplinary and distributed work (left) is supported by the software framework RCE [36] which facilitates cross-company collaboration without jeopardizing intellectual property (right). The illustrated collaboration is taken from [40].
Aerospace 07 00050 g003
Figure 4. (a) uni-directional vs. central model approach [42] and (b) handling of the data structure.
Aerospace 07 00050 g004
Figure 5. N2-Chart definition.
Aerospace 07 00050 g005
Figure 6. N2-Chart providing current and planned connections between components in the UAM workflow. A single data transfer between two components is indicated by ’1’ and ’e’; a recurring data transfer within an iteration is marked with ’i’ and ’f’. Rows and columns containing a data flow between components are highlighted with faded colors of the same shade as the corresponding connection symbol. Parenthesized numbers (3.2)–(3.8) indicate sub-sections with detailed component description.
Aerospace 07 00050 g006
Figure 7. Initial architecture of the urban air mobility system workflow in RCE. Naming, reference number and color code of individual components correspond to the N2-Chart of Figure 6.
Aerospace 07 00050 g007
Figure 8. Current N2-Chart (left) and current workflow (right) of the urban air mobility system (first initialization). The structure and arrangement of components are in accordance with Figure 6 and Figure 7. As no feedback connection is implemented yet, all components are connected by a single data transfer (’1’, orange). In order to better reflect the current state of development, all dummy-tools are removed.
Aerospace 07 00050 g008
Figure 9. Current overview of CPACS interfaces (inputs and outputs) of individual components. Calculated input data are marked by hatching, external data input is indicated as [ex] (compare Figure 6, Figure 7 and Figure 8).
Aerospace 07 00050 g009
Figure 10. (a) Land use plan of Hamburg City [50] and (bd) origin–destination pairs of selected UAM scenarios.
Aerospace 07 00050 g010
Figure 11. Estimated 24 h UAM demand distribution between the business district HafenCity and the residential neighborhood Rahlstedt.
Aerospace 07 00050 g011
Figure 12. (a) collected travel time in Hamburg as a function of travel distance for different transport modes (according to [51]) and (b) corresponding regression curve for automobile and UAM.
Aerospace 07 00050 g012
Figure 13. Derivation of coordinates for take-off and landing positions outside possible no-fly zones for the administrative district “Hamburg-Fuhlsbüttel”.
Aerospace 07 00050 g013
Figure 14. Visualization of two generic vertiport concepts [58], differing in the number of vertipads (H) and parking positions (P): (a) Eight parking positions are circularly arranged around a single vertipad. (b) Four vertipads and 36 parking positions are arranged in a way to minimize the cross-sectional area of the vertiport for a given minimum clearance between vertipads.
Aerospace 07 00050 g014
Figure 15. Example for the distribution of take-off and landing areas in the district “Altona-Nord”.
Aerospace 07 00050 g015
Figure 16. Visualization of various airspace organization concepts according to the classification of [21]: (a) free-flight; (b) layers; (c) zones; and (d) tubes.
Aerospace 07 00050 g016
Figure 17. Representation of the shortest connection for the route “Harburg–Finkenwerder” (black line), using an optimization algorithm and avoiding no-fly zones (red polygons).
Aerospace 07 00050 g017
Figure 18. Very low-level airspace classification. Reproduced with permission from Eurocontrol, [60].
Aerospace 07 00050 g018
Figure 19. Flight planning and control sequence. The execution of a very low level mission is subject to a procedural sequence which includes the steps described for flight planning end execution (in analogy to the UTM operating concept by DFS).
Aerospace 07 00050 g019
Figure 20. Scheduled departure times of the first UAM expansion phase between 6:00 a.m. and 10:00 a.m.
Aerospace 07 00050 g020
Figure 21. Comparison of (a) the Uber mission definition [65] with (b) the generic flight phases of the urban trajectory calculation module (uTCM).
Aerospace 07 00050 g021
Figure 22. Example of a vertical (a) and lateral (b) flight profile for the route “Finkenwerder-Harburg” with a main flight direction to the east and west, respectively. No-fly zones are illustrated in red.
Aerospace 07 00050 g022
Figure 23. Snapshot of the 24 h flight trajectory simulation of scenario 3. Each single vehicle is represented by a black triangle, which indicates the main heading of the flight, and moves along a specific route.
Aerospace 07 00050 g023
Figure 24. Frequency distributions of UAM travel times for the three scenarios.
Aerospace 07 00050 g024
Figure 25. Planned aircraft trajectories and detected conflicts in scenario 3. Blue line: trajectory, red circle: conflict, grey line: Hamburg districts.
Aerospace 07 00050 g025
Figure 26. Vizualization of future work in UATM modeling: Conflicts can be prevented by implementing (a) lateral separation standards between air tracks, (b) standardized departure and arrival procedures for vertiports, and (c) re-scheduling of conflicted flights.
Aerospace 07 00050 g026
Figure 27. Assessment of UAM’s viability: Indirect Operating Costs (IOC) are estimated relative to Direct Operating Costs (DOC) for optimistic (a) and conservative (b) cost assumptions. A flight is considered profitable if revenues exceed expenses by 10%.
Aerospace 07 00050 g027
Figure 28. Rough estimation of direct operating costs (a) and total operating costs for an eVTOL flight over 11 km for (b) optimistic and (c) conservative cost assumptions.
Aerospace 07 00050 g028
Figure 29. Initial approximation of the economic viability of the routes of the third scenario for a constant base fare of 8 $ per flight and varying air fares (green: viable under conservative assumptions, yellow: viable under optimistic assumptions, red: unviable).
Aerospace 07 00050 g029
Figure 30. Comparison of fares between taxi (yellow), car-sharing (orange) and conceivable on-demand UAM services (different shades of blue) in Hamburg City for the investigated route network (3rd UAM expansion phase). Black circle: Exemplary mark of the 12% route subset, in which a UAM induced distance reduction compensates the higher air fare of 4 $/km compared to conventional taxis.
Aerospace 07 00050 g030
Figure 31. Relative (a) and absolute (b) distances of ground- and air-based on-demand mobility for the investigated route network (3rd UAM expansion phase). The highest distance savings are achievable when crossing the natural barrier of the Elbe river and the industrial barrier of the Port of Hamburg.
Aerospace 07 00050 g031
Table 1. Total UAM demand expressed as number of potential passengers for the three expansion phase scenarios under consideration.
Expansion PhaseDistrictsRoutesPassengers
(1)7282052
(2)11603702
(3)16924890
Table 2. Estimation of UAM passenger numbers and the equivalent shares of taxi rides for three stages of expansion.
Expansion PhaseUAM PassengersEquivalent Shares of Taxi Rides
1.2 Pax per Taxi1.5 Pax per Taxi
(1)20524.4%3.5%
(2)37027.9%6.3%
(3)489010.5%8.4%
Table 3. Number of scheduled flights for the expansion phase scenarios under consideration.
Expansion PhaseDistrictsRoutesPassengersFlightsAverage LF
(1)728205277666.1%
(2)11603072144963.9%
(3)16924890196362.3%
Table 4. Uber mission definition for eVTOL aircraft operation [65].
PhaseSegmentVertical Speed
ft/min (m/s)
Horizontal Speed
mph (km/h)
Ending Altitude
ft (m)
UberuTCM
(A)-Ground Taxi0 (0)3 (4.8)0 (0)
(B)1Hover Climb0 to 500 (0 to 2.5)0 (0)50 (15)
(C)1Transition + Climb500 (2.5)0 to 1.2 · v stall 300 (90)
(D)2Departure Procedures0 (0)1.2 · v stall 300 (90)
(E)3Accel + Climb500 (2.5)1.2 · v stall to 150 (240)1500 (450)
(F)4Cruise0 (0)150 (240)1500 (450)
(G)5Decel + Descent500 (2.5)150 (240) to 1.2 · v stall 300 (90)
(H)6Arrival Procedures0 (0)1.2 · v stall 300 (90)
(I)7Transition + Descent500 to 300 (2.5 to 2)1.2 · v stall to 050 (15)
(J)7Hover Descend300 to 0 (2 to 0)0 (0)0 (0)
(K)-Ground Taxi0 (0)3 (4.8)0 (0)
Table 5. Simplified flight performance assumptions of the generic vehicle.
Number of seats4
Climb speed (0–100 m)2.5 m/s
Climb speed (from 100 m)2.5 m/s
Cruise speed30 m/s
Descent speed (up to 100 m)2.5 m/s
Descent speed (0–100 m)2.5 m/s
EASA Categoriycertified
Table 6. Flights and conflicts in three scenarios. A flight is considerd to be conflicted if the distance to at least one other aircraft falls below the separation minima. The conflicted flight pairs are the flights which are in conflict with each other. The conflicted points are the trajectory points of all flights which have at least one conflict.
Performed FlightsConflicted FlightsConflicts per Conflicted FlightConflicted Points
Scenario 177638 (4.9%)1.000.4%
Scenario 21 44986 (5.9%)1.200.7%
Scenario 31 963118 (6.0%)1.210.7%
Table 7. UAM assumptions for the DOC estimation per flight.
Cost ComponentMain EquationFixed AssumptionsVaried Assumptions
(1)Energy * C e = U e · S E C · d · m rel U e = 0.18 $ k W h S E C = 0.25 ; 0.5 k W h k m
m rel = m O W E m M T O W + L F 1 m O W E m M T O W --
(2)ATC Charges C A T C = U A T C · m M T O W 50 0.5 · d - U A T C 0.25 ; 2 $ k m
(3)Terminal Fees C t = U t · m M T O W 50 0.7 - U t 0.25 ; 2 $
(4)Maintenance ** C m = U m · i n m , i · t m , i · f m , i F C d U m = 50 $ h F C d 15 ; 30 1 d a y
n m , i = 1 ; 2 ; 4 -
t m , i = 0.5 ; 4 ; 48 h -
f m , i = 1 1 ; 1 45 ; 1 365 1 d a y -
(5)Cleaning C c = U c · F C d 1 - U c 5 ; 10 $ d a y
(6)Empty/Maint. Flights C e m = p e m · C e + C A T C + C t - p e m 0.25 ; 0.5
(7)Depreciation C d = P O W E · m O W E · a F C d · 365 d a y s a = 0.2 P O W E 100 ; 1000 $ k g
(8)Insurance C i = C d · f i n s f i n s = 0.005 -
a: annuity rate [ ] ; p e m : percentage share of empty & maint. flights [ ] ; d: distance [ k m ] ; P O W E : vehicle price per m O W E [ $ / k g ] ; f m , i : interval of main. event i [ 1 / d a y ] ; t m , i : duration of maint. event i [ h ] ; f i n : insurance rate [ ] ; U A T C : unit cost for air traffic control [ ( $ ) / ( k m ) ] ; F C d : flight cycles per day [1/day]; U c : unit cost for cleaning [ ( $ ) / ( d a y ) ] ; LF: load factor [ ] ; U e : unit cost for energy [ ( $ ) / ( k W h ) ] ; m M T O W : maximum take-off weight [ k g ] ; U m : labor cost for maint. [ $ / h ] ; m O W E : operating empty weight [ k g ] ; U t : unit cost for terminal usage [ $ ] ; m rel : relative weight [ ] ; SEC: specific energy consumption [ ( k W h ) / ( k m ) ] [27]; n m , i : number of technicians for maint. event i [ ] ; * For the sake of ease, nonlinear effects in energy consumption due to starting and landing are neglected.; ** This estimation of maintenance costs is highly uncertain (effects of automation and material expenses are not considered).

