Article

Optimizing Nitrogen Fertilization to Improve Qualitative Performances and Physiological and Yield Responses of Potato (Solanum tuberosum L.)

Dipartimento di Agricoltura, Alimentazione e Ambiente (Di3A), University of Catania, via Valdisavoia 5, 95123 Catania, Italy
*
Author to whom correspondence should be addressed.
Agronomy 2020, 10(3), 352; https://doi.org/10.3390/agronomy10030352
Submission received: 18 February 2020 / Revised: 27 February 2020 / Accepted: 29 February 2020 / Published: 4 March 2020
(This article belongs to the Special Issue Herbaceous Field Crops Cultivation)

Abstract

:
Potato is often produced by adopting high nitrogen (N) external inputs to maximize its yield, although the possible agronomic and qualitative benefits of a N over-fertilization to the crop are scarcely demonstrated. Therefore, our aim was to determine, over two years, the effect of three N fertilization rates (0, 140 and 280 kg ha−1, referred to as N0, N140 and N280) simultaneously on the crop physiology, yield components, N use efficiency and tuber chemical composition of cv. Bellini. Throughout the field monitoring, our data highlighted that N140 provided an improvement of the crop physiology, as expressed in terms of leaf photosynthesis rate and Soil Plant Analysis Development (SPAD) readings, than the other N fertilization rates. In addition, regardless of year and as compared to N0 and N280, the supply of 140 kg N ha−1 also ensured the highest yield and an intermediate value of the nitrogen use efficiency (59.1 t ha−1 and 37.1 kg tuber dry weight kg N−1, respectively), together with nutritionally relevant tuber qualitative traits, i.e. high levels of dry matter, starch (by an enzymatic/spectrophotometric method), total polyphenols (by Folin-Ciocalteu assay) and ascorbic acid [by high-performance liquid chromatography (HPLC) analysis], and a low nitrate amount (by an ion-selective electrode method) (16.6%, 634-3.31-0.61 and 0.93 g kg−1 of dry matter, respectively). Therefore, although a certain interaction between N fertilization rate and year was observed, our findings demonstrated that a conventional N fertilization rate (280 kg ha−1) is unnecessary from both agronomic and qualitative standpoints. This is of considerable importance in the perspective to both limit environmental pollution and improve growers’ profits by limiting N external inputs to potato crops.

1. Introduction

The efforts of modern agriculture are primarily focused on reducing the environmental impact of crop-management practices, while ensuring both high and stable yields and high produce quality. In this way, the balance of nitrogen (N) supply by fertilization is fundamental for establishing sustainable farming systems, given its role as both an environmental pollutant [1] and an essential plant macronutrient to promote crop quantitative and qualitative performances [2]. Sufficient N availability has a positive effect on plant growth and development, being involved in protein and chloroplast structure; while an excessive N supply leads to an over-emphasis on vegetative growth and a detrimental effect of root or fruit development [3]. Therefore, the efficient use of N is fundamental with respect to potential impacts on both environmental safety and crop performance.
Since Mediterranean soils are often characterized by low organic matter and thus low N reserves [4], growers often adopt irrational N fertilization programs in order to maximize the productivity of several crops, including potato (Solanum tuberosum L.) [5]. This is the most important non-grain food in the world, resulting fourth in terms of production quantity [6]. In the Mediterranean Basin, potato cultivation occupies an area of about 1 Mha producing ~31 Mt of tubers [6]. Compared with Northern European countries, tuber yields in the Mediterranean area are low. This is because the environmental (most importantly water availability and temperature) and agro-economic conditions are less favourable than those in the Northern European countries where most of the cultivars have been developed [7]. In southern Italy (Sicily, Campania and Apulia), as in other Mediterranean coastal areas, such as North African countries, Cyprus and Turkey, the potato crop is not grown in the usual main cycle (spring–summer), owing to the high temperatures and considerable demand for irrigation water, but is mostly cropped in a winter–spring cycle (planting from November to January and harvesting from March to early June) with the aim of obtaining an early product [8,9,10]. This is highly appreciated for its specific qualitative traits [11,12] and so profitably exported to northern European countries for fresh consumption [13]. In addition, early potato tubers are also increasingly serving as feedstock for industrial products [14,15]. This makes early potato production even more attractive in the Mediterranean Basin. However, the potential yield is never fully obtained in natural productive systems since biotic and abiotic factors may negatively affect plant growth and tuber development [16]. This growing season cycle is often characterized by a relatively low temperature, a short photoperiod and limited solar radiation, which are conditions with an appreciable effect on plant growth, substantially modifying the morphological and phenological characteristics of the plants (for example, most potato cultivars do not flower) compared to those cultivated in the spring–summer cycle [17]. Apart from the cultivar choice, crop protection and irrigation, an important agronomic measure for improving early potato production is represented by an adequate nutrient management [16]. Particularly, due to the high nutritional requirements during vegetative growth and tuber bulking, as well as to meet the quality standards demanded by both the fresh vegetable market and processing industry, early potato growers typically rely heavily on the use of inorganic fertilizers to maximize their incomes. Potato is known to have a relatively low N uptake efficiency ranging between 50% and 60% [18], due to its shallow root system which is less efficient in taking up N than other crops like wheat, maize or sugar beet [19]. Therefore, it needs adequate levels of N for a fast plant cycle and plant growth rate [8], in order to promote both earliness and high-profitable yields [13]. Indeed, N has positive effect on both the number of emerging leaves and the rate of leaf expansion and, hence, on the canopy development of the plant [20] and on the photosynthesis efficiency by increasing the intercepted radiation [21,22]. This has a decisive impact on dry matter partitioning to the tubers, tuber bulking and, of course, on tuber yield [23]. By contrast, N over-fertilization may promote an excessive stolon and leaf growth at the expense of tuber development/maturity and quality [24]. Fertilizers are generally used inefficiently by the crop, also due to large N losses through seepage or percolation, particularly when conventional irrigation methods, e.g. furrows or sprinklers, are used [25]. Hence, in the latest years the improvement of N use efficiency for the potato crop is a priority for researchers [19,26,27]. Several N fertilization rates have been suggested as optimal for potato production; in some European countries and the USA the recommended N fertilization rates vary from 70 to 330 kg ha−1, and the most economically efficient rates from 147 to 201 kg ha−1 [24]. Nevertheless, literature still lacks on comprehensive studies including several aspects, from physiology to yield and quality responses of potato crop in relation to N fertilization. In addition, despite some works dealing with main potato crop response to N fertilization [10,16,20,21,24,28], no attempts have been focused on defining the effects of different N fertilization rates on both the crop physiology, yield and tuber chemical composition of early potato. Indeed, the environmental conditions associated with early potato production substantially modify the morphology and phenology of the crop, and thus the tubers are essentially immature and so differ qualitatively from those produced in the main crop cycle [11]. As a result, little of the literature describing the characteristics of main crop potatoes can be used to make inferences regarding early potato cultivation. Taking into account all these considerations, in the present research we have investigated whether it is possible to reduce the N fertilization rate, while keeping yield reduction to a minimum and having positive effects on certain tuber qualitative traits. In this respect, this study represents the first comprehensive approach to detect simultaneously agronomic and qualitative performances of this crop under different N fertilization rates. Since the annual weather variations have also a considerable influence over these traits, the experiments were replicated over two years in a major potato production area in the Mediterranean Basin.

2. Materials and Methods

2.1. Field Experimental Design, Plant Material and Management Practices

The experiment spread over two years (2014 and 2015) at a commercial farm located on the coastal plain of Siracusa (37°01′ N, 15°12′ E, 30 m above sea level). The soil, moderately deep, is classified as calcixerollic xerochrepts type [29], with pH 7.7 and a soil composition of 48% sand (2–0.02 mm), 18% silt (0.02–0.002 mm), 34% clay (<0.002 mm), 6% limestone, 1.8% organic matter, 0.2% total nitrogen, 28 mg kg−1 of available P2O5 and 180 mg kg−1 of exchangeable K2O. The soil characteristics may be considered strongly representative of the potato cultivation area in Sicily [30,31]. A layer, 0.25 m thick (from −0.05 to −0.30 m), where about 90% of active potato roots were located, was considered for the soil analysis. Soil minerals analyses were obtained according to procedures approved by the Italian Society of Soil Science [32], whereas the remaining analyses were carried out using widely employed and adopted methods in Italy [33].
Disease-free, non-pre-sprouted “seed” tubers of cv. Bellini, from a single seed lot, were manually planted on 18 January 2014 and 25 January 2015. This cultivar was recently introduced for conventional production of early potato in the Mediterranean Basin, where it has shown a good adaptation to the pedoclimatic conditions. It has yellow skin and pulp, and is a B cooking type (i.e., multi-purpose cooking) according to the EAPR (European Association for Potato Research) cooking-type scale.
In this experiment three nitrogen fertilization rates were compared: 0 (as control), 140 and 280 kg N ha−1, hereafter referred to as N0, N140 and N280, respectively. In particular, N280 represents the conventional N fertilization rate commonly adopted by Sicilian producers for enhancing yields; while N140 was formulated on the basis of the N uptake by potato crop with target yields of 40–50 t ha−1 [34], the available soil N during the growing season (equal to 70 kg ha−1; see Section 2.4) and N fertilization efficiency (equal to 90%, due to the modality of N fertilization).
A randomized complete-block design with four replicates was adopted. Each plot size was 4.2 × 4.2 m, with 84 plants and consisted of six rows. Whole tubers were planted at 0.3 m intervals in rows 0.70 m apart, corresponding to a planting density of 4.76 plants m−2. The two external rows and two plants on each row-end were used as border to minimize contamination from adjacent nitrogen treatments. The two middle rows per plot were harvested to assess the yield. N was soil-applied incorporated by mineral source (ammonium nitrate, at 26% of N) and the total amount was split in 2 applications (10 and 40 d after transplant). Besides the different nitrogen fertilization rates, prior to planting, all plots received the same base fertilization consisting of 80 kg P2O5 ha−1 and 140 kg K2O ha−1 as mineral superphosphate (19% of P2O5) and potassium sulphate (50% of K2O), respectively. The experimental field had been cultivated in a potato-lettuce(fennel)-carrot rotation for almost 20 years, as commonly used in the cultivation area. Obviously, in both years, the previous crop was carrot (fertilized with 120 kg N ha−1), and the area used for our experiments was different to avoid cumulative effects of nitrogen fertilizer treatments over years. Drip irrigation was provided once the accumulated daily evaporation rate (derived from measurements of an unscreened class A-Pan evaporimeter) had reached about 30 mm. Over the crop cycle 220 (2014) and 160 mm (2015) irrigation water were provided. Five (2014) and four (2015) irrigation applications were performed. Weed and pest control followed standard commercial practice.

2.2. Crop Physiology

The physiological measurements were made from the youngest fully expanded leaf (usually the 3rd or 4th leaf from the apex). They were determined at 80, 90, 111 and 119 days after planting (DAP) in 2014 and at 89, 107, 116 and 123 DAP in 2015. At each time point, measurements per each N fertilization rate were taken in duplicate on the same leaves of five plants per plot, previously marked for the purpose. Leaf Soil Plant Analysis Development (SPAD) readings were performed using a portable absorbance-based chlorophyll meter (SPAD-502 model, Konica Minolta, Sakai, Osaka, Japan). The measurements were conducted between 10:00 and 12:00 h (local solar time). The SPAD readings provide an indication of crop greenness and N requirements, while having a strong and non-linear correlation with chlorophyll foliar content in potato [35]. Photosynthesis rate was measured by a LI-6200 closed gas-exchange system (LI-Cor Inc., Lincoln, NE, USA) using a 250 cm3 chamber in the closed circuit mode. Instantaneous gas-exchange measurements were made in the morning (at 10:00 and 12:00), closely matching the respective growth chamber CO2 conditions, under clear sunny meteorological conditions. Days on which photosynthesis rate was measured were typically clear sunny days characterized by a Photosynthetically Active Radiation (PAR) ≤1800 mmol photons m−2 s−1. Air temperatures varied only slightly during each measuring hour, but ranged between 19 and 28 °C during the period of measurements.

2.3. Crop Yield and Its Components

In both years, for the determination of yield and its components, tubers (from each plot and replicate) were harvested manually when about 70% of haulms were fully desiccated (i.e., at 125 and 130 DAP in 2014 and 2015, respectively), and the number and weight of both marketable and unmarketable tubers per plant were determined. Tubers which were greened, misshapen or displayed pathological damage were classed as unmarketable, as well as those with weight lower than 20 g. This allowed the calculation of the number of tubers per plant (NTP), mean tuber weight (MTW) and marketable yield (MY). The yield of unmarketable tubers was very low (below 1.0%) and hence excluded from the data.

2.4. Nitrogen Crop Uptake and Nitrogen Efficiency Indices

For the determination of crop N uptake (CNU), only the N in tubers was considered under the assumption that contents in roots were negligible and contents in the aboveground shoot mass had been mostly translocated before dieback of the haulm [36]. Nitrogen concentration was determined by the Kjeldahl method, using fresh tubers collected at harvest, which were oven-dried and finely ground through a mill (IKA, Labortechnick, Staufen, Germany) with a 1.0 mm sieve.
The efficiency of N was calculated in terms of NUE (Nitrogen Use Efficiency), NUtE (Nitrogen Utilization -Efficiency) and NUpE (Nitrogen Uptake Efficiency). Firstly, available soil nitrogen was calculated as the sum of mineral N (NO3-N and NH4-N) in the 0–0.40 m soil layer at sowing, plus the N released through mineralization during the growing season, and the N supplied through fertilization [37]. The initial mineral nitrogen content of the soil profile (0–0.40 m) was set at 1.2% of total N, determined by the Kjeldahl method. N soil mineralization per month was calculated according to Gariglio et al. [38], from total N content corrected by an N mineralization factor as a function of soil temperature. On the basis of this procedure and considering the losses for volatilization, leaching and microbial mineralization [39], the quantity of available mineral nitrogen in the soil (NA) for the crop cycle was equal to about 70 kg ha−1 in both years. This N availability was similar to that recently reported by Ierna and Mauromicale [18], in field experiments carried out in the same cultivation area.
Therefore, the following indices were calculated:
NUE [expressed as kg tuber dry matter content (DM) kg N] = marketable dry tuber yield/NA
NUpE (expressed as kg N kgN−1) = CNU/NA
NUtE (expressed as kg tuber DM kg N−1) = marketable dry tuber yield/CNU
Fertilizer use efficiency (FUE) was also calculated by using the following formula:
FUE (expressed as kg kg−1) = [yield of fertilized plot (kg) − yield of unfertilized plot (kg)]/N fertilizer rate applied (kg)

2.5. Tuber Chemical Composition

A total of 24 samples (2 years × 3 N fertilization rates × 4 replicates) were analyzed per each chemical determination. Each sample consisted of 15 marketable tubers, which were washed with tap water, dried with tissue paper, diced and immediately blended using a domestic food processor at 0 °C (Kenwood Multipro, Milan, Italy). Finally, per each replicate an amount (500 g) of the resulting slurry was freeze-dried (Christ freeze drier, Osterode am Harz, Germany) and stored at −20 °C until analysis of ascorbic acid, total polyphenols, antioxidant activity, starch and simple sugars, while the remaining portion was oven-dried at 65 °C (Binder, Milan, Italy), until a constant weight was reached, in order to determine the DM. Then, the dehydrated material was used for the determination of total protein and nitrate.
Kits for the enzymatic and spectrophotometric determination of total starch and simple sugars were obtained from Megazyme International Ireland Ldt. (Bray, Co. Wicklow, Ireland), as well as sugars standards. 5-O-caffeoylquinic acid (used as standard for the determination of total polyphenols content) was obtained from Extrasynthese (Lyon, France). All the other reagents and solvents adopted were purchased from Sigma-Aldrich (Milan, Italy) and were of analytical or high-performance liquid chromatography (HPLC) grade. Bidistilled water was used throughout this research.
Total protein content was determined according to Snyder and Desborough [40], reading the absorbance at 595 nm with a Shimadzu 1601 ultraviolet (UV)-visible spectrometer (Shimadzu Corp., Tokyo, Japan).
For analysis of simple sugars (glucose, fructose and sucrose), sample preparation was carried out following the protocol described in Megazyme Assay Kit K-SUFRG [41], while total starch determination was performed according to the protocol described in Megazyme Total Starch Assay Kit AA/AMG [41].
The ascorbic acid determination was carried out by HPLC as described by Lombardo et al. [42].
Total polyphenols content was quantified spectrophotometrically as reported by Lombardo et al. [12]; using the same extracts, the antioxidant activity was evaluated and expressed as percentage inhibition of DPPH (2,2-diphenyl-1picrylhydrazyl) [43], obtained by the following equation: [AC0–AS30/AC0] × 100, where AC0 is the absorbance of a blank control at the beginning of the assay and AS30 the sample absorbance after 30 min.
Nitrate content determination was performed using an ion selective electrode method [44].
Excepted for DM and antioxidant activity, reported as %, all the other chemical traits were expressed as g kg−1 of DM.

2.6. Statistical Analysis

Given the normality of distributions (Shapiro and Wilks test) [45] and the homogeneity of variances (Levene’s test) [46], the data were generally subjected to a two-way analysis of variance (ANOVA), based on a factorial combination of three N fertilization rates × two years, By contrast, for the data of photosynthesis rate and SPAD readings ANOVA was performed separately per year (since the considered measurement times did not intercept the same phenological phases in both years) and was based on a factorial combination of three N fertilization rates × four measurement times. Means were separated by a least significant difference (LSD) test, when the F-test was significant. For DM and antioxidant activity, the % values were subjected to Bliss transformation prior to analysis and then to ANOVA; however, untransformed data (thus expressed as %) for these traits were reported and discussed. All calculations and analyses were performed using CoStat® version 6.003 (CoHort Software, Monterey, CA, USA).

2.7. Weather Conditions

Meteorological data were monitored during each growing season (from January to May) in the years of study by a meteorological station (Mod. Multirecorder 2.40; EGT, Florence, Italy) sited within 250 m of the experimental field. The total rainfall during 2014 (January–May) was below average (68 mm versus a long-term mean of 179 mm), while the mean minimum temperature was significantly higher as compared to the long-term period (12.5 versus 9.8 °C) (Table 1). Total rain recorded (160 mm) in 2015 did not substantially differed from the long-term climate, experiencing about 92 mm more rain than in the first year. In both 2014 and 2015, the mean daily minimum temperature was higher than long-term average. By contrast, mean daily maximum temperature was slightly below that recorded in the long-term period (17.3 versus 18.8 °C) in 2015 (Table 1).

3. Results and Discussion

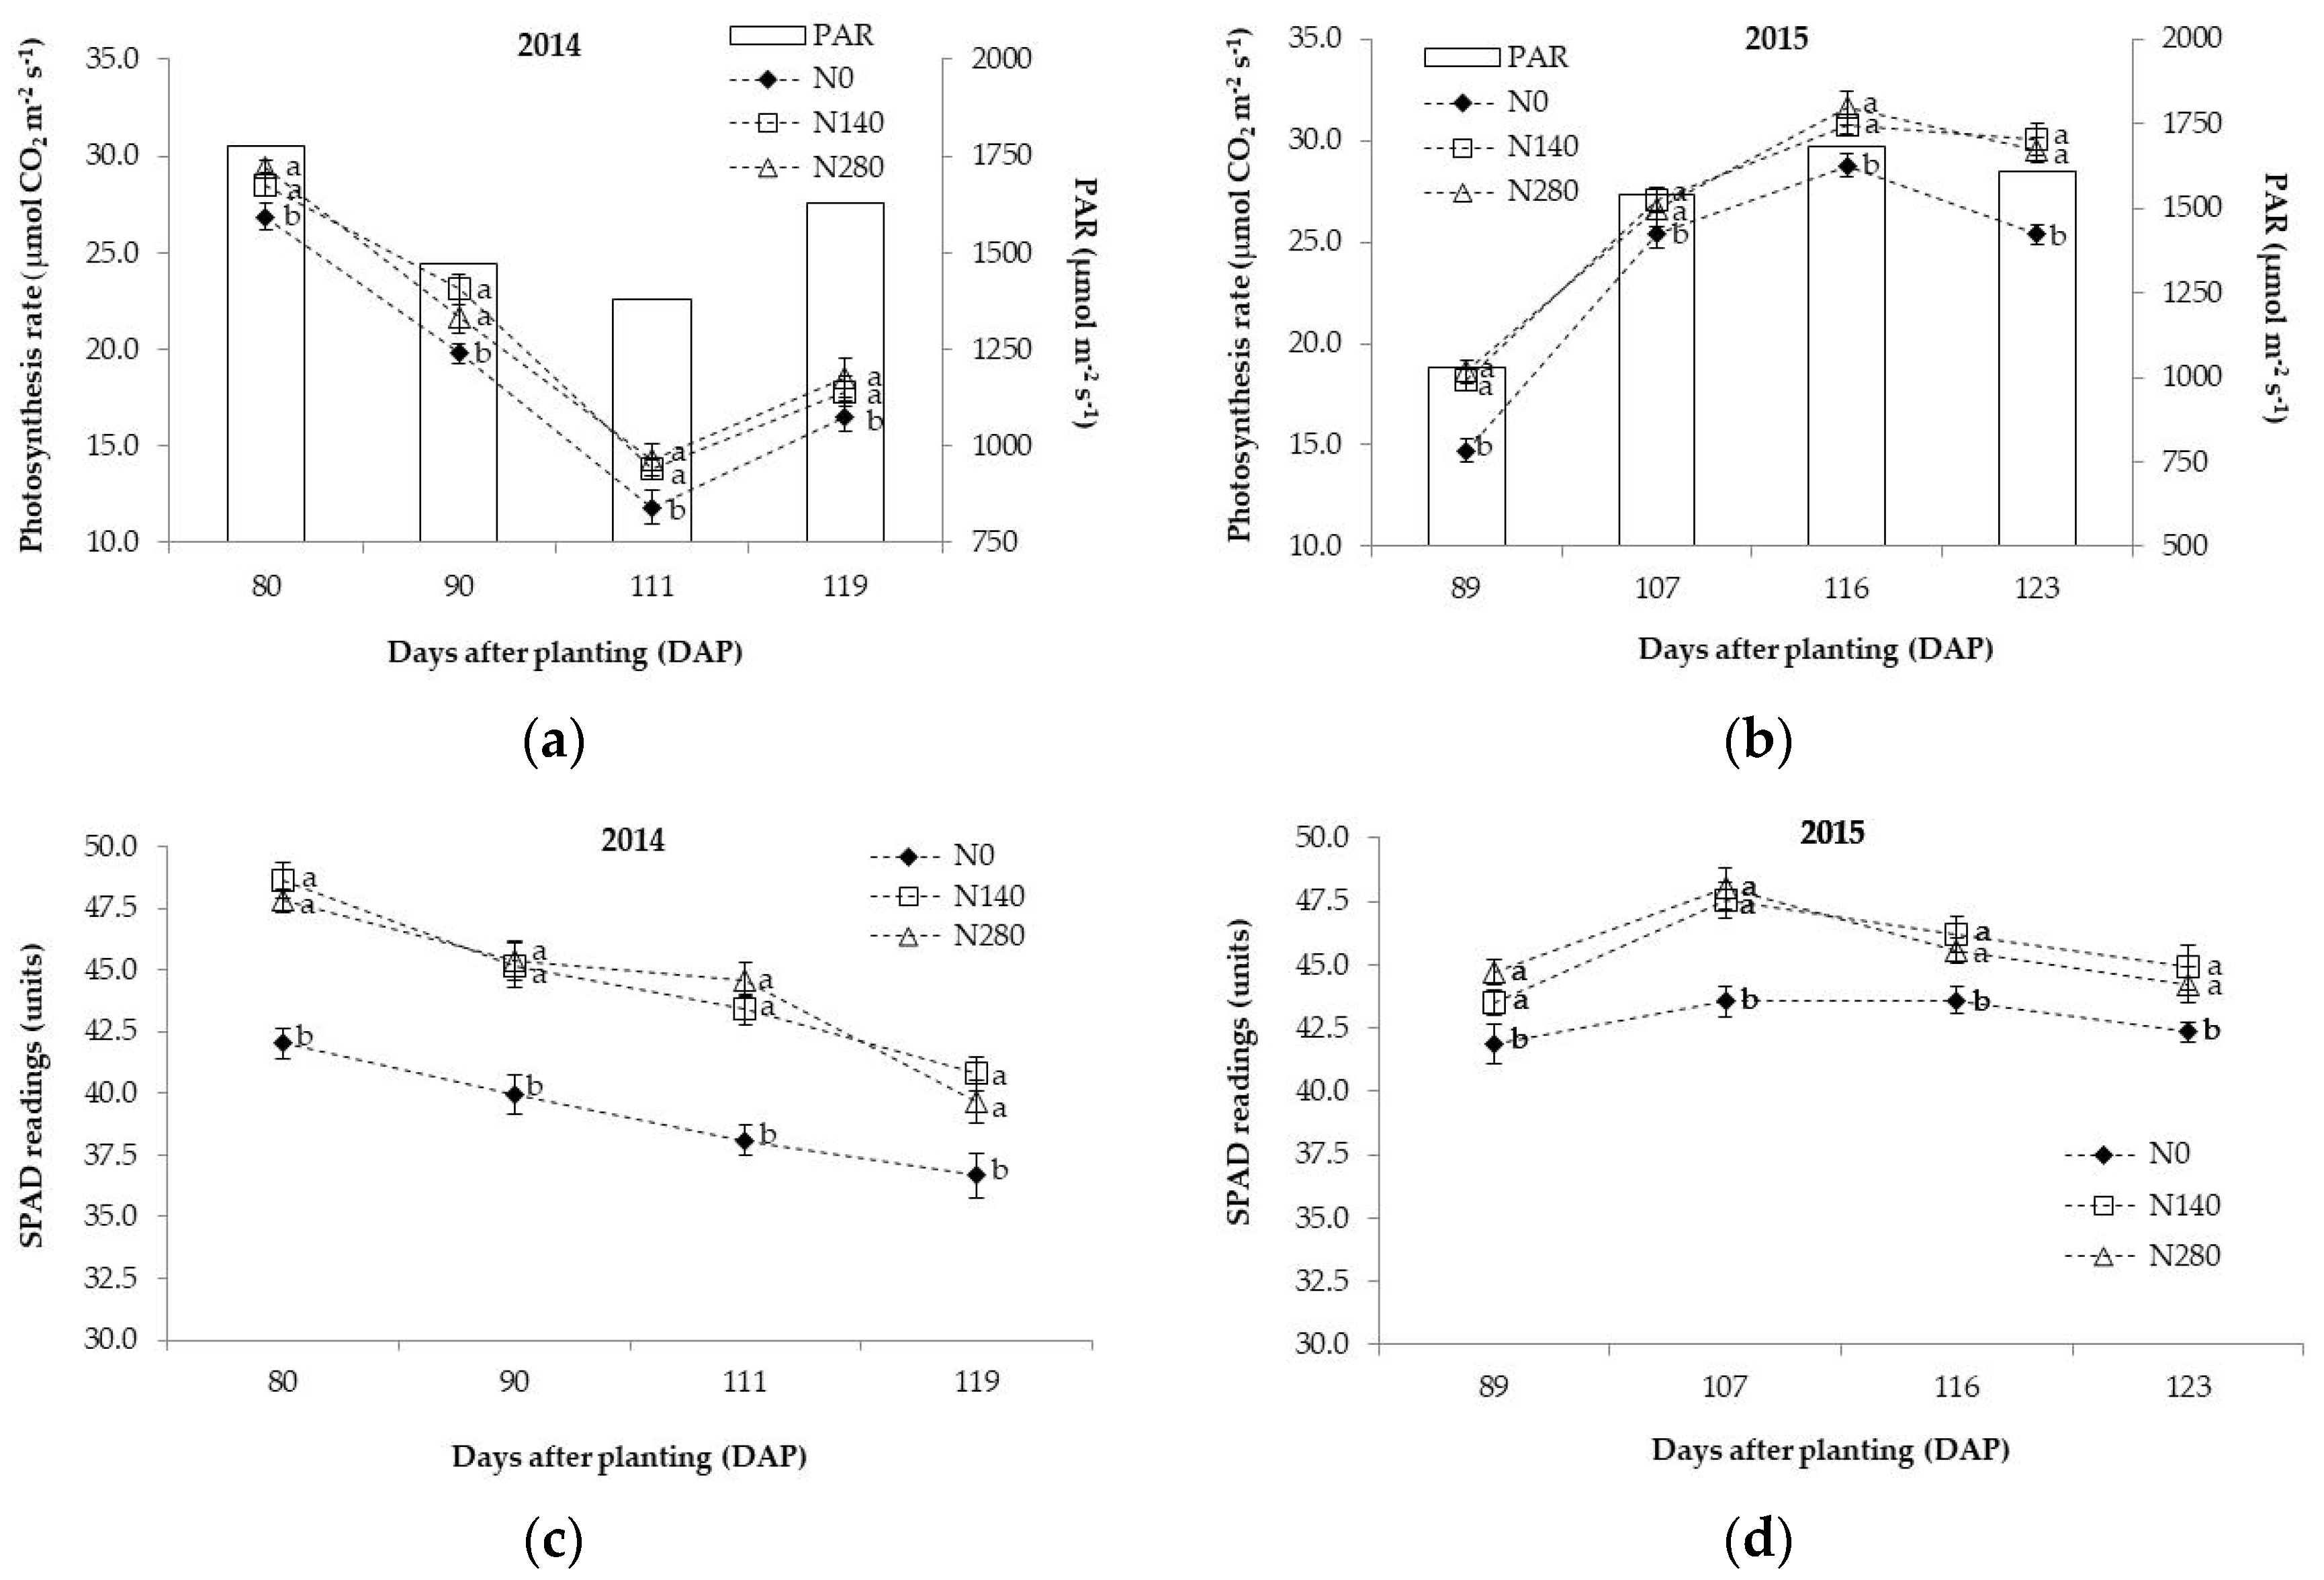
3.1. Physiological Traits

According to ANOVA results (Table 2) and regardless of the specific yearly trend, at each measurement time leaves from N0 plots displayed a lower photosynthetic rate than those from the N fertilized plots (i.e., N140 and N280) (Figure 1). This can be related to the decisive impact of N fertilization on the canopy development of the plant [20], as here expressed by the influence of N fertilization rate on the level of aboveground dry biomass (Table 3). Indeed, this was higher in the N fertilized plots than in N0 ones (Table 4). The differences in terms of photosynthetic rate between N140 and N280 plots were not significant across all the measurement times (Figure 1). It is likely that this depended on the increased stomatal resistance in the N280 plants, resulting from their higher evapotraspirative demand due to their higher aboveground dry biomass. A similar trend was highlighted for SPAD values, a non-destructive and instant indicator of potato plant N status [22]. Indeed, at each measurement time, in both 2014 and 2015 N0 plants had the lowest SPAD values than those fertilized. Nevertheless throughout the field monitoring, no statistical differences were observed between N140 and N280 in terms of SPAD readings (Figure 1). This indicates that N140 may represent a threshold over that early potato does not benefit from higher N fertilization rate (N280) in terms of SPAD readings improvement.
For both the physiological traits under study, it was evident a different annual trend (Figure 1). In 2014 the photosynthesis rate significantly declined from 80 to 119 DAP by an extent between 37.0 (N280) and 38.5% (N0). By contrast in 2015, with increasing plant age, photosynthesis rate exhibited a bell-shaped curve (Figure 1), increasing up to a complete canopy developing (116 DAP) and declining thereafter (123 DAP). Reason for the different trend of photosynthesis rate in the two years primarily is that the considered measurement times did not intercept the same crop phenological phases in both years. Indeed, due to the highest mean temperatures during the initial months (late January and February) in 2014, potato plants emerged 10 days early than in 2015 (data not shown), and therefore potato leaves had a presumable fully photosynthetic capacity earlier in 2014. This may explain why potato plants recorded a high photosynthesis rate early (at 80 DAP) in 2014, while similar values (equal to about 28 μmol CO2 m−2 s−1) were reached later in 2015 (between 107 and 116 DAP). The different annual trend of photosynthesis rate may be also related to the PAR values registered at each measurement time, since a strongly and positive correlation between these parameters was highlighted in both 2014 and 2015 (respectively, r = 0.94 and 0.99, p < 0.01).
The SPAD readings showed a similar trend to that of the photosynthesis rate recorded in the same year (Figure 1). According to literature data [22,47], in 2014 the SPAD values decreased linearly and significantly with plant age, with a more marked reduction for the fertilized plots than unfertilized ones (17% vs. 13%) from 80 to 119 DAP (Figure 1). This could be related to N remobilization from the oldest to the youngest leaves [47]. By contrast, this decreasing tendency of SPAD values across the field monitoring was less evident in 2015 (Figure 1). Indeed, SPAD readings time-course is also largely dependent on many external factors, among which weather conditions and light intensity are important [48]. The effect of meteorological conditions experienced in 2014, characterized by higher mean temperatures throughout the monitoring period, caused higher SPAD values at 80 DAP (46.2 SPAD units, on the average of N fertilization rates) than those reported by Mauromicale et al. [22]. Indeed, air temperature together with solar radiation is the main external factor affecting physiological processes, among which foliar chlorophyll concentration. As a consequence, in 2015 early potato plants reached a similar SPAD values only at 107 DAP.
Finally, based on our results and regardless of the yearly trend, a conventional N fertilization rate (N280), commonly adopted in the Mediterranean Basin, was not associated to an improvement of both photosynthesis rate and SPAD value in the early potato crop.

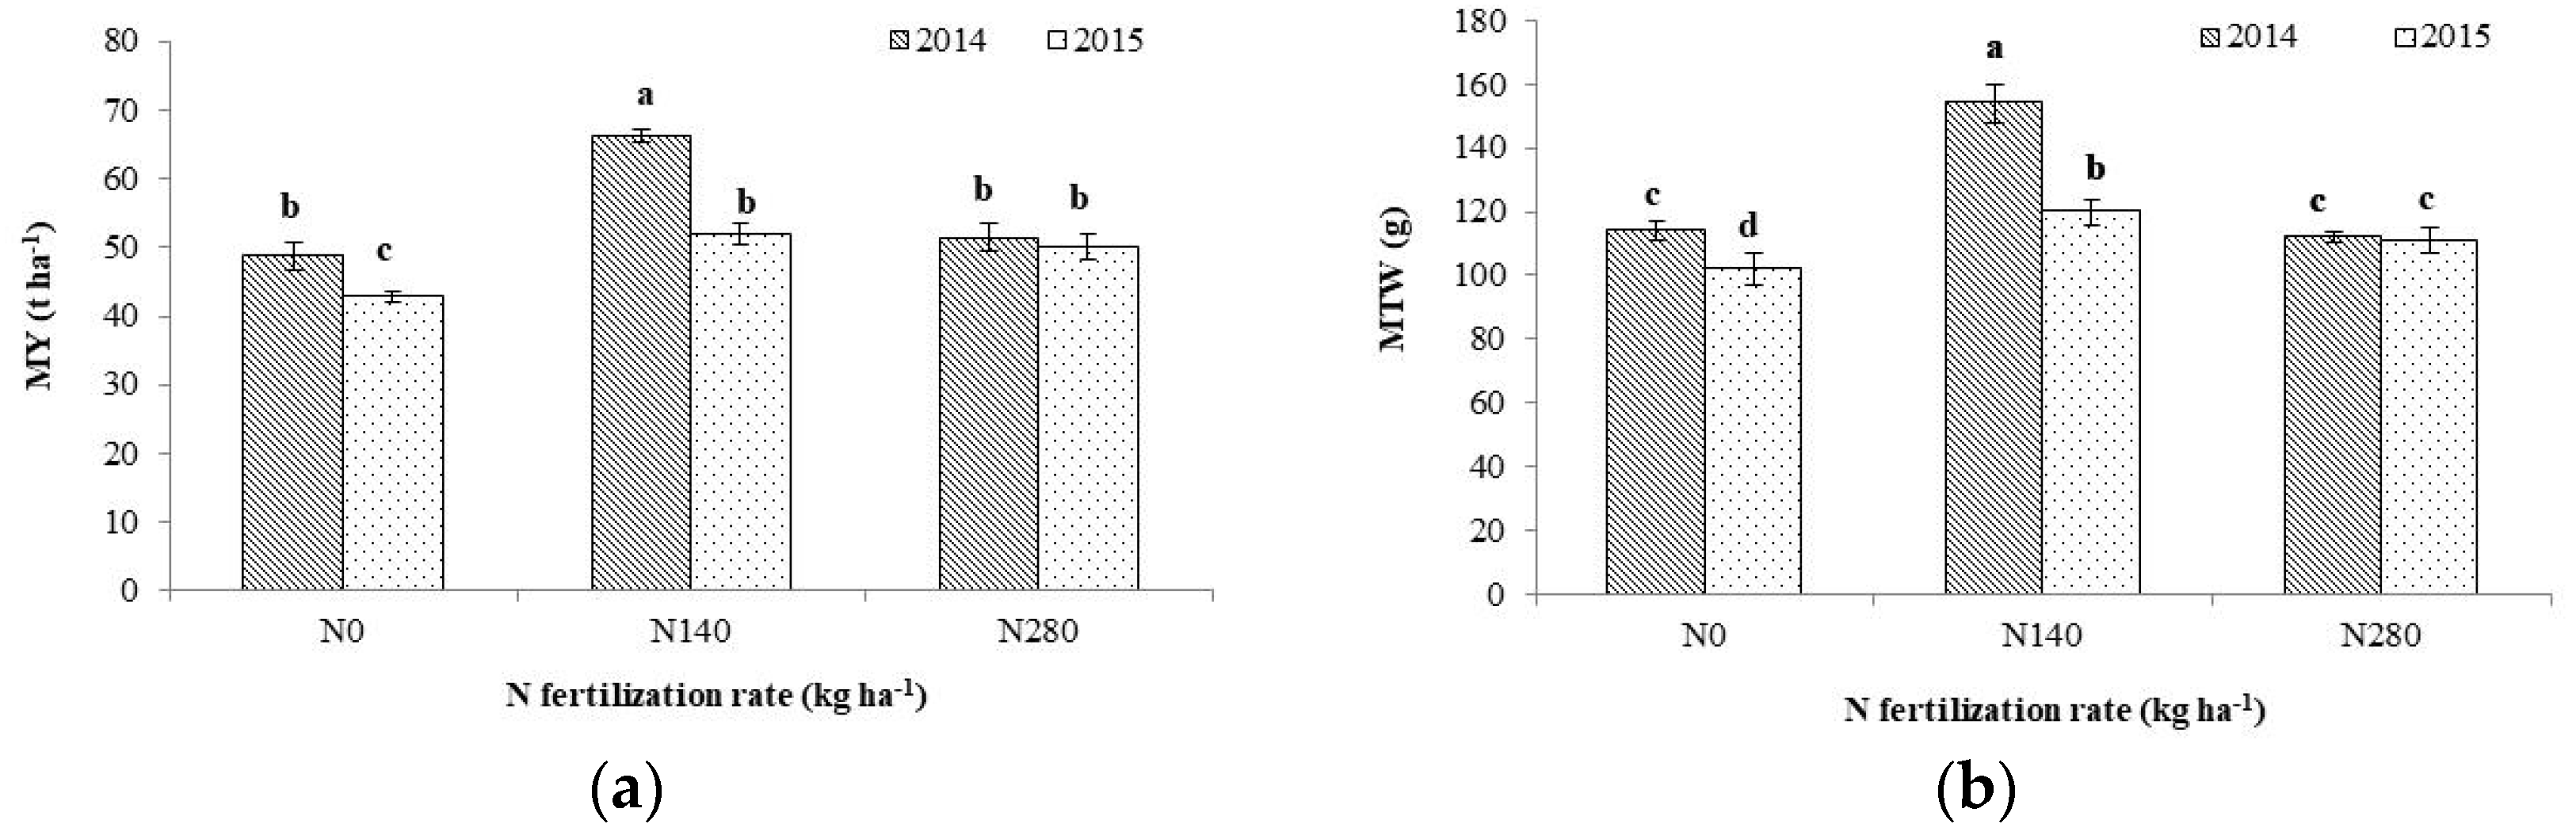
3.2. Aboveground Dry Biomass and Yield Components

Aboveground dry biomass and yield components were all influenced by the N fertilization rate, while ‘N fertilization rate × year’ interaction was significant only for MY and MTW (Table 3).
Regardless of year, as highlighted in a work carried out by Fontes et al. [24], N0 plots reported the lowest MYs (45.8 t ha−1) than the N fertilized ones (55.0 t ha−1, on average) (Table 4).
On the basis of our results on MY, N140 represented the best treatment. However, the reasonable values reached under N0 (abundantly above the Italian mean yield equal to 27.7 t ha−1, according to data provided by FAO) [6] may be ascribed to the residual soil fertility (about 70 kg ha−1 in both years) of the studied cultivation area, where every year conspicuous amounts of N fertilizers were applied to vegetable crops. On the contrary, we demonstrated as an over-fertilization to the early potato is not necessary, since N280 either decreased (in 2014) or maintained stable (in 2015) the MY as compared to N140 (Figure 2). In researches carried out in similar Mediterranean environments [13,49], potato yields increased with increasing nitrogen rate up to 120 kg ha−1, but did not change further with higher N fertilization rates. In particular, the high MY (66.3 t ha−1) achieved by N140 plots in 2014 is attributable to the highest MTW reported (Figure 2). Indeed, several researchers [35,50] have highlighted as sufficient N fertilizer amounts reduced the small size tuber fraction. In addition, N140 showed an intermediate canopy development (here expressed by the level of ADB) between N0 and N280, which was able to ensure acceptable values of photosynthesis rate and therefore high MYs (Table 4). By contrast, the higher ADB observed for N280 plots may explain the lowest MY values recorded (Table 4), since tuberization can even be suppressed or delayed by high N supply in favour of higher shoot growth [51]. This may have reduced the carbohydrate translocation in the tubers, as demonstrated by the lower MTW under N280 in both years.
Regardless of N fertilization rate, the MY reduction from 2014 to 2015 is attributable to the decrease of the MTW (Figure 2). Indeed, the correlation analysis between MY and MTW showed a very strong correlation (R2 = 0.98 ***), while that between MY and NTP was not significant (R2 = 0.06). This observed year-to-year variation in MY could be attributable to the meteorological conditions experienced throughout the field trials (Table 1). Basically, as compared to the long-term period, the more favourable mean air temperatures experienced in 2014 may have improved crop productivity by sustaining the increase in MTW (Figure 2); by contrast, the NTP was unaffected by seasonal conditions. Indeed, according to De la Morena et al. [52], N has the greatest impact on the average tuber weight rather than the other components of potato yields.

3.3. Crop Nitrogen Uptake and N Efficiency Indices

It is particularly crucial to estimate both crop N uptake and N efficiency indices for potato crop, considering that it has a shallow and slow-growing root system with possible repercussions for nutrients uptake. On the whole, our results on CNU were comparable with those reported by Darwish et al. [48] obtained also in the Mediterranean environment. Here, as expected, CNU was higher in the N fertilized plots (148 kg ha−1, on average) than in N0 (113 kg ha−1) (Table 4), but the magnitude of the effect of N fertilization rate was year-dependent. Indeed, in 2014 CNU was highest under N140, while in 2015 under N280 (Table 5). The highest CNU reported for the N140 plots may also explain the highest MYs observed (Figure 2). In general, CNU decreased from 2014 to 2015 (Table 5). Indeed, N uptake is favored when irrigation or soil humidity is close to 100% of maximum evapotranspiration [53], but high rainfall (as experienced in 2015) may lead to significantly higher N leaching losses [54].
Accordingly, the three N efficiency indices studied (NUE, NUpE, NUtE) tended to decline with increasing N fertilization rates (Table 4), but the extent of the impairment was year-dependent (Table 5) as also reported by Xu et al. [55] and Meise et al. [35]. The low NUE values of potato, as compared to other crops, can be related to its shallow rooting system that leads to a restricted uptake and, thus, use of N [56]. In addition, the water regime can significantly affect the NUE [16]. This may explain the general decrease of NUE from 2014 to 2015, since the higher rainfall in 2015 may have promoted nitrate leaching out of the rooting zone. NUE depends on two processes: the uptake efficiency (NUpE, the ability to remove N from the soil) and the utilization efficiency (NUtE, the ability to use the absorbed N to produce yield) [36]. Indeed, our results on NUE were strongly correlated with those of NUpE (r2 = 0.99 ***) and NUtE (r2 = 0.89 ***). Therefore, the lowest NUE values under N280 may be associated with the reduced N uptake ability and the lowered transport/redistribution of nutrients, resulting in lower yields than N140. Also Tyler et al. [57] and Zvomuya et al. [58] revealed decreasing values of both NUpE and NUtE with growing N fertilization amounts.
From an agronomic fertilizer use efficiency standpoint, N140 was most efficient than N280 in both years (125.7 vs. 9.6 kg kg−1 in 2014 and 64.3 vs. 25.7 kg kg−1 in 2015). Since agronomic fertilizer FUE is defined as the increase in yield of the harvested portion of the crop per unit of fertilizer applied, our results suggest that applying N fertilizer in high amounts (N280) might have resulted in more N losses. In 2014 the wider difference, in terms of FUE, between N140 and N280 is directly correlated to the trend of yield and its components (particularly, MTW) as compared to 2015.

3.4. Tuber Chemical Traits

The results about the effects of N fertilization rate on the chemical parameters of early potato tubers were reported in Table 4 and Table 6.
Overall, the tuber chemical traits, except for the total protein and soluble sugars content, was significantly affected by ‘N fertilization rate x year’ interaction. Firstly, N fertilization rate influenced the tuber DM level, one of the most important traits of potato tubers in the context of domestic cooking and industrial processing quality [59]. In both years the DM for N280 did not differ significantly from that shown for N140 (Table 6). Indeed, nitrogen is essential for potato canopy growth, but its over-supply could delay maturity and thus may reduce DM and starch levels [16]. In addition, a higher N fertilization rate results in tubers with immature skin prone to bruising and susceptibility to shatter bruise [60]. The range in DM (<20%) here observed was consistent with previous results reported in literature [41], making our samples more suitable for processing into boiled and frozen products according to the classification given by Cacace et al. [61]. A variation in the DM values over the two years was also observed and it can be ascribed to the meteorological conditions (temperature and rainfall). In particular, the cooler temperatures experienced in 2015 may be responsible for a longer time necessary for the interception of global solar radiation flux density and conversion of intercepted radiation into DM [62].
Sugars make a major contribution to the overall tuber DM, mostly deposited in the form of starch. This was found markedly affected by the ‘N fertilization rate x year’ interaction (Table 6). In both years, it was decreased by the conventional fertilization rate (N280) (592 and 569 g kg−1 of DM in 2014 and 2015, respectively), confirming the trend here reported for the tuber DM level. By contrast, tubers grown under N140 had comparable starch levels compared to those unfertilized (N0). A previous study reported an inverse relationship between nitrogen fertilization rate and levels of DM and starch [63]. This is in agreement with the “carbon/nitrogen balance” theory [64], which proposes that when N availability limits plant growth the metabolism shifts towards carbon rich compounds, such as starch. Potato tubers also contain considerable amount of soluble sugars, mainly sucrose, glucose and fructose, which have impact on their processing [59]. In particular, high amounts of sucrose (a non-reducing sugar), glucose and fructose (reducing sugars) in potato tubers are undesired for processing at high temperatures because reducing sugars are precursors of the Maillard reaction and sucrose is the main source of reducing sugars during its enzyme-catalyzed hydrolysis [65]. In this study, sucrose was the most and fructose the least abundant (Table 4). Their level, similar to the data reported by Lombardo et al. [41], was significantly influenced only by the N fertilization rate. This result is consistent with the above-cited “carbon/nitrogen balance” theory [64], since potato tubers grown under limited N availability (N0 in the present study) accumulated more soluble sugars than those grown under N140 and N280 (Table 4).
Although potato tubers are commonly regarded as a source of sugars, they also contain a good level of protein that can vary due to several pre-harvest factors [66]. In this study, this qualitative parameter was strongly influenced by the N fertilization rate and, as expected, it was significantly higher in the tubers grown under N280 (100 g kg−1 DM) than in those grown under N140 and N0 (86 and 82 g kg−1 DM, respectively; Table 4). Indeed, according to Wang et al. [67], a low fertilization supply decreased tuber nitrogenous compounds due to the dilution effect caused by higher DM accumulation.
The conventional N fertilization rate (N280), commonly adopted in the Mediterranean Basin for potato cultivation, also markedly enhanced the nitrate level in the early potato tubers (Table 4 and Table 6). The higher nitrate level experienced in 2014 are in agreement with Sadej and Namiotko [68]. Indeed, both the higher temperatures and lower total rainfall in 2014 may have favoured the uptake of nitrates by plants. Although nitrate content is less crucial for tuber quality than DM level, it may impair food safety due to possible hazard to human health driven by the increasing volume of potato tubers consumption [69]. Therefore, also due to the lack of threshold limits in European Union (EU) legislation, some countries have already introduced inland regulations limiting nitrate content in commercialized potato tubers. As an instance, in Germany (the most important market for the exported Mediterranean early potato) only tubers with less than 200 mg kg−1 of fresh weight are accepted. Here, no value exceeded such threshold limit since the maximum level of tuber nitrate content was 1.15 g kg−1 DM under N280, with a DM of 16.3%, which corresponds to 189 mg kg−1 of fresh weight. However, the optimized fertilization rate (140 kg N ha−1) is preferable with a perspective of a lower nitrate level in the tubers (0.93 g kg−1 DM, on average of years) combined with an acceptable productive yield and a minor environmental pollution.
Potato tubers are, due to their consumption rate, one of the major sources of antioxidant compounds in the human diet. The early potato tubers contain high levels of ascorbic acid and polyphenols [11,28]. The ascorbic acid is an inhibitor of enzymatic browning, therefore its presence helps to reduce some post-harvest qualitative losses [70,71]; while the polyphenols are associated with a range of health-promoting properties [72]. Here, ascorbic acid and total polyphenol amounts were both influenced by ‘N fertilization rate × year’ interaction (Table 6). In particular, it is apparent from our results that in both years the conventional N fertilization rate (280 kg N ha−1) had a negative effect on the level of ascorbic acid (Table 6). A major amount of the soil N available to the crop may likely stimulate leaf growth, and thereby enhance the photosynthetic rate and the production of the sugars needed for ascorbic acid synthesis [11], but at the same time the increased plant foliage to high N fertilization rates may reduce the light intensity and accumulation of ascorbic acid in plant shaded parts [73]. Hence, the choice of the N fertilization rate may have a significant effect on the balance between these two phenomena, i.e., leaf growth and shading, and thereby on the ascorbic acid synthesis and accumulation in potato tubers. In this regard, N140 seems to be the right compromise with the aim of obtaining tubers with high health-promoting properties, since the conventional N fertilization rate (N280) increased the concentration of nitrates and simultaneously decreased that of ascorbic acid (Table 6). The differences among the studied N fertilization rates on the ascorbic acid accumulation was particularly notable in 2015 (Table 6), probably due to the higher rainfall level and lowest minima air temperatures experienced (Table 1).
The content of total polyphenols was also evaluated in the present study (Table 4 and Table 6). Consistently with the results obtained for the ascorbic acid, in both 2014 and 2015 N0 tubers showed the highest total polyphenol amounts compared to those of N140 and N280. Our results are in agreement with Lachman et al. [74], which report an increase in the total polyphenols content under low N supply or deficiency due to the increased activity of phenylalanine ammonia lyase (PAL), the key-enzyme for their biosynthesis. With respect to human health, increasing the total polyphenol content through the proper choice of N fertilization rate could be of importance in diets which are dominated by potatoes. Also for the total polyphenols content, the differences among the tested N fertilization rates were notably evident in 2015 as a response to the meteorological conditions during the field trials. In particular, this may be due to the higher level of precipitation experienced in 2015 (Table 1), as total polyphenol content is known to be enhanced by high humidity [75]. Finally, the N fertilization rate also affected the antioxidant activity of early potato tubers (Table 4 and Table 6). This parameter tended to be higher in N0 tubers grown than in N140 and N280 ones, confirming the trend observed for both ascorbic acid and total polyphenol levels. However, it is noteworthy that N140 tubers displayed a higher antioxidant activity than N280 ones (58.3% vs. 54.4%, on average of years). In addition, all the N fertilization rates under study harboured greater antioxidant activity in 2015, as a response to the abiotic stresses induced by meteorological conditions. This was also corroborated by the larger difference between N0 and N280, as highlighted for the total polyphenols content (Table 4 and Table 6).

4. Conclusions

Recently, agronomic research has increasingly been directed at finding management practices that maximize crop production and enhance product quality, while minimizing the environmental impact. This is particularly true for the potato, a crop that requires significant external inputs during both vegetative growth and tuber bulking, to meet the yield and qualitative standard levels demanded by either the fresh market or processing industry. Hence, potato growers often tend to use huge amounts of inorganic (especially nitrogenous) fertilizers to maximize their incomes. In this sense, for the first time, this study provided comprehensive data on both agronomic, N use efficiency and tuber qualitative traits of the early crop potato under different N fertilization rates with the aim to investigate whether it is possible to reduce the N fertilization rate without implications on the aforementioned characteristics. In particular, we highlighted that an optimal N fertilization rate (140 kg ha−1, based on soil nitrogen balance, crop rotation and potato requirements) may ensure a high yield and a limited reduction of N use efficiency, combined with important nutritional traits of the tubers, e.g., a high level of dry matter, starch, total polyphenols and ascorbic acid, and a low nitrate amount, as compared to the unfertilized and over-fertilized plots. These results may have positive repercussions for potato cultivation, allowing farmers to increase their incomes through better tuber quality and lower production costs. In addition, our findings are relevant in the perspective to limit environmental pollution by reducing the N fertilization rate to the early potato crop, since growers often adopt N over-fertilization (280 kg ha−1 or more) without a scientifically supported basis. Taking into account that the experimental field-trials were carried in a typical potato cultivation area in Sicily (soil characteristics, climate, crop rotation and management), which is also representative of the potato cultivation in the Mediterranean basin, we reasonably considered the fertilization rate of 140 kg N ha−1 as a recommendable target dose in similar soils, with a N availability equal to ~70 kg ha−1. Future research studies are, however, necessary to assess the behavior of other cultivars, as well as to deepen insights into the possible interaction of N fertilization with other agronomic practices (e.g., irrigation) in terms of yield, N use efficiency and tuber quality performances of early potato crop.

Author Contributions

All the authors equally contributed to the research plan and to write the manuscript. In particular, G.M. was responsible for funding acquisition; S.L. and G.P. were responsible for laboratory analyses of samples and validation of analytical methods. All authors have read and agreed to the published version of the manuscript.

Funding

This research was funded by “Utilizzo integrato di approcci tecnologici innovativi per migliorare la shelf-life e preservare le proprietà nutrizionali di prodotti agroalimentari (SHELF-LIFE)”, project cod. PON02_00451_3361909.

Acknowledgments

The authors particularly thank Angelo Litrico (Catania University) for his excellent technical assistance in conducting the field trial.

Conflicts of Interest

The authors declare no conflict of interest.

References

  1. Savci, S. An agricultural pollutant: Chemical fertilizer. Int. J. Environ. Sci. Dev. 2012, 3, 77–80. [Google Scholar] [CrossRef] [Green Version]
  2. Stefanelli, D.; Goodwin, I.; Jones, R. Minimal nitrogen and water use in horticulture: Effects on quality and content of selected nutrients. Food Res. Int. 2010, 43, 1833–1843. [Google Scholar] [CrossRef]
  3. Mengel, K.; Kirkby, E.A.; Kosegarten, H.; Appel, T. Principles of Plant Nutrition; Kluwer Academic Publishers: Dordrecht, The Netherlands, 2001. [Google Scholar]
  4. Ryan, J.; Masri, S.; Ceccarelli, S.; Grando, S.; Ibrikci, H. Differential responses of barley landraces and improved barley cultivars to nitrogen-phosphorus fertilizer. J. Plant Nutr. 2008, 31, 381–393. [Google Scholar] [CrossRef]
  5. Karyotis, T.; Güçdemir, İ.; Akgül, S.; Panagopoulos, A.; Karyoti, K.; Demir, S.; Kasacı, A. Nitrogen fertilization plans for the main crops of Turkey to mitigate nitrates pollution. Eurasian J. Soil Sci. 2014, 3, 13–24. [Google Scholar] [CrossRef] [Green Version]
  6. FAO Statistical Database. Available online: http://www.faostat.org/ (accessed on 5 July 2019).
  7. Frusciante, L.; Barone, A.; Carputo, D.; Ranalli, P. Breeding and physiological aspects of potato cultivation in the Mediterranean region. Potato Res. 1999, 42, 265–277. [Google Scholar] [CrossRef]
  8. Ierna, A.; Pandino, G.; Lombardo, S.; Mauromicale, G. Tuber yield, water and fertilizer productivity in early potato as affected by a combination of irrigation and fertilization. Agric. Water Manag. 2011, 101, 35–41. [Google Scholar] [CrossRef]
  9. Cantore, V.; Wassar, F.; Yamac, S.S.; Sellami, M.H.; Albrizio, R.; Stellacci, A.M.; Todorovic, M. Yield and water use efficiency of early potato grown under different irrigation regimes. Int. J. Plant Prod. 2014, 8, 409–428. [Google Scholar]
  10. Meise, P.; Seddig, S.; Uptmoor, R.; Ordon, F.; Schum, A. Impact of nitrogen supply on leaf water relations and physiological traits in a set of potato (Solanum tuberosum L.) cultivars under drought stress. J. Agron. Crop. Sci. 2018, 204, 59–374. [Google Scholar] [CrossRef]
  11. Lombardo, S.; Lo Monaco, A.; Pandino, G.; Parisi, B.; Mauromicale, G. The phenology: Yield and tuber composition of ‘early’ crop potatoes: A comparison between organic and conventional cultivation systems. Renew. Agric. Food Syst. 2013, 28, 50–58. [Google Scholar] [CrossRef]
  12. Lombardo, S.; Pandino, G.; Mauromicale, G. The influence of growing environment on the antioxidant and mineral content of “early” crop potato. J. Food Compos. Anal. 2013, 32, 28–35. [Google Scholar] [CrossRef]
  13. Ierna, A.; Mauromicale, G. Potato growth, yield and water productivity response to different irrigation and fertilization regimes. Agric. Water Manag. 2018, 201, 21–26. [Google Scholar] [CrossRef]
  14. Izmirlioglu, G.; Demirci, A. Enhanced bio-ethanol production from industrial potato waste by statistical medium optimization. Int. J. Mol. Sci. 2015, 16, 24490–24505. [Google Scholar] [CrossRef] [Green Version]
  15. Jagatee, S.; Behera, S.; Dash, P.K.; Sahoo, S.; Mohanty, R.C. Bioprospecting starchy feedstocks for bioethanol production: A future perspective. JMRR 2015, 3, 24–42. [Google Scholar]
  16. Koch, M.; Naumann, M.; Pawelzik, E.; Gransee, A.; Thiel, H. The importance of nutrient management for potato production Part I: Plant nutrition and yield. Potato Res. 2019. [Google Scholar] [CrossRef] [Green Version]
  17. Mauromicale, G.; Signorelli, P.; Ierna, A.; Foti, S. Effects of intraspecific competition on yield of early potato grown in Mediterranean environment. Am. J. Potato Res. 2003, 80, 281–288. [Google Scholar] [CrossRef]
  18. Ierna, A.; Mauromicale, G. Sustainable and profitable nitrogen fertilization management of potato. Agronomy 2019, 10, 582. [Google Scholar] [CrossRef] [Green Version]
  19. Milroy, S.P.; Wang, P.; Sodras, V.O. Defining upper limits of nitrogen uptake and nitrogen use efficiency of potato in response to crop N supply. Field Crop. Res. 2019, 239, 38–46. [Google Scholar] [CrossRef]
  20. Ospina, C.A.; Lammerts van Bueren, E.T.; Allefs, J.J.H.M.; Engel, B.; van der Putten, P.E.L.; van der Linden, C.G.; Struik, P.C. Diversity of crop development traits and nitrogen use efficiency among potato cultivars grown under contrasting nitrogen regimes. Euphytica 2014, 199, 13–29. [Google Scholar] [CrossRef]
  21. Vos, J.; van der Putten, P.E.L. Effect of nitrogen supply on leaf growth, leaf nitrogen economy and photosynthetic capacity in potato. Field Crop. Res. 1998, 59, 63–72. [Google Scholar] [CrossRef]
  22. Mauromicale, G.; Ierna, A.; Marchese, M. Chlorophyll fluorescence and chlorophyll content in field-grown potato as affected by nitrogen supply, genotype, and plant age. Photosynthetica 2006, 44, 76–82. [Google Scholar] [CrossRef]
  23. Ahmed, A.; Zaki, M.; Shafeek, M.; Helmy, Y.; El-Baky, M.A. Integrated use of farmyard manure and inorganic nitrogen fertilizer on growth, yield and quality of potato (Solanum tuberosum L.). Int. J. Curr. Microbiol. App. Sci. 2015, 4, 325–349. [Google Scholar]
  24. Fontes, P.C.R.; Braun, H.; Busato, C.; Cecon, P.R. Economic optimum nitrogen fertilization rates and nitrogen fertilization rate effects on tuber characteristics of potato cultivars. Potato Res. 2010, 53, 167–179. [Google Scholar] [CrossRef]
  25. Foti, S.; Mauromicale, G.; Ierna, A. Influence of irrigation regimes on growth and yield of potato cv. Spunta. Potato Res. 1995, 38, 307–318. [Google Scholar] [CrossRef]
  26. Getahun, B.B. Potato breeding for nitrogen-use efficiency: Constraints, achievements, and future prospects. J. Crop. Sci. Biotechnol. 2018, 21, 269–281. [Google Scholar] [CrossRef]
  27. Tiwari, J.K.; Plett, D.; Garnett, T.; Chakrabarti, S.K.; Singh, R.K. Integrated genomics, physiology and breeding approaches for improving nitrogen use efficiency in potato: Translating knowledge from other crops. Funct. Plant Biol. 2018, 45, 587–605. [Google Scholar] [CrossRef] [Green Version]
  28. Bélanger, G.; Walsh, J.R.; Richards, J.E.; Milburn, P.H.; Ziadi, N. Yield response of two potato cultivars to supplemental irrigation and N fertilization in New Brunswick. Am. J. Potato Res. 2000, 77, 11–21. [Google Scholar] [CrossRef]
  29. Soil Survey Staff. Soil Taxonomy: A Basic System of Soil Classification for Making and Interpreting Soil Surveys, 2nd ed.; U.S. Gov. Print. Office: Washington, DC, USA, 1999.
  30. Fierotti, G.; Dazzi, C.; Raimondi, S. Carta dei suoli della Sicilia 1:250.000; Regione Siciliana and Università degli Studi di Palermo: Palermo, Italy, 1988. [Google Scholar]
  31. Foti, S. Early potatoes in Italy with particular reference to Sicily. Potato Res. 1999, 42, 229–240. [Google Scholar] [CrossRef]
  32. Italian Society of Soil Science. Metodi Normalizzati di Analisi del Suolo; Edagricole: Bologna, Italy, 1985. [Google Scholar]
  33. UNICHIM. Analisi dei Terreni Agrari; Unichim: Milano, Italy, 1985. [Google Scholar]
  34. Mauromicale, G.; Ierna, A. Patata primaticcia. In Fisionomia e profili di qualità dell’orticoltura meridional; Bianco, V.V., La Malfa, G., Tudisca, G., Eds.; Arti Grafiche Siciliane: Palermo, Italy, 1999; pp. 275–296. [Google Scholar]
  35. Uddling, J.; Gelang-Alfredsson, J.; Piikki, K.; Pleijel, H. Evaluating the relationship between leaf chlorophyll concentration and SPAD-502 chlorophyll meter readings. Photosynth. Res. 2007, 91, 37–46. [Google Scholar] [CrossRef]
  36. Meise, P.; Seddig, S.; Uptmoor, R.; Ordon, F.; Schum, A. Assessment of yield and yield components of starch potato cultivars (Solanum tuberosum L.) under nitrogen deficiency and drought stress conditions. Potato Res. 2019, 62, 193–220. [Google Scholar] [CrossRef]
  37. Moll, R.H.; Kamprath, E.J.; Jackson, W.A. Analysis and interpretation of factors which contribute to efficiency of nitrogen utilization. Agron. J. 1982, 74, 562–564. [Google Scholar] [CrossRef]
  38. Gariglio, N.F.; Pilatti, R.A.; Baldi, B.L. Using nitrogen balance to calculate fertilization in strawberries. HortTechnology 2000, 10, 147–150. [Google Scholar] [CrossRef] [Green Version]
  39. Ceccon, P.; Fagnano, M.; Grignani, C.; Monti, M.; Orlandini, S. Agronomia; Edises: Napoli, Italy, 2017. [Google Scholar]
  40. Snyder, J.C.; Desborough, S.L. Rapid estimation of potato tuber total protein content with coomassie brilliant blue g-250. Appl. Genet. 1978, 52, 135–139. [Google Scholar] [CrossRef] [PubMed]
  41. Lombardo, S.; Pandino, G.; Mauromicale, G. The effect on tuber quality of an organic versus a conventional cultivation system in the early crop potato. J. Food Comp. Anal. 2017, 62, 189–196. [Google Scholar] [CrossRef]
  42. Lombardo, S.; Pandino, G.; Mauromicale, G. The nutraceutical response of two globe artichoke cultivars to contrasting NPK fertilizer regimes. Food Res. Int. 2015, 76, 852–859. [Google Scholar] [CrossRef]
  43. Brand-Williams, W.; Cuvelier, M.E.; Berset, C. Use of a free radical method to evaluate antioxidant activity. Lebensm. Wiss. Technol. 1995, 22, 25–30. [Google Scholar] [CrossRef]
  44. Wilhelm, W.W.; Arnold, S.L.; Schepers, J.S. Using a nitrate specific ion electrode to determine stalk nitrate-nitrogen concentration. Agron. J. 2000, 92, 186–189. [Google Scholar]
  45. Shapiro, S.S.; Wilk, M.B. Analysis of variance test for normality (complete samples). Biometrika 1965, 52, 591–611. [Google Scholar] [CrossRef]
  46. Levene, H. Robust tests for equality of variances. In Contributions to Probability and Statistics; Olkin, I., Ghurye, S.G., Hoeffding, W., Madow, W.G., Mann, H.B., Eds.; Stanford University Press: Stanford, CA, USA, 1960; pp. 278–292. [Google Scholar]
  47. Busato, C.; Fontes, P.C.R.; Braun, H.; Cecon, P.R. Seasonal variation and threshold values for chlorophyll meter readings on leaves of potato cultivars. J. Plant Nutr. 2010, 33, 2148–2156. [Google Scholar] [CrossRef]
  48. Gianquinto, G.; Goffart, J.P.; Olivier, M.; Guarda, G.; Colauzzi, M.; Dalla Costa, L.; Delle Vedove, G.; Vos, J.; MacKerron, D.K.L. The use of hand-held chlorophyll meters as a tool to assess the nitrogen status and to guide nitrogen fertilization of potato crop. Potato Res. 2004, 47, 35–80. [Google Scholar] [CrossRef]
  49. Darwish, T.M.; Atallah, T.W.; Hajhasan, S.; Haidar, A. Nitrogen and water use efficiency of fertigated processing potato. Agric. Water Manag. 2006, 85, 95–104. [Google Scholar] [CrossRef]
  50. Badr, M.A.; El-Tohamy, W.A.; Zaghloul, A.M. Yield and water use efficiency of potato grown under different irrigation and nitrogen levels in an arid region. Agric. Water Manag. 2012, 110, 9–15. [Google Scholar] [CrossRef]
  51. Zebarth, B.J.; Rosen, C.J. Research perspective on nitrogen bmp development for potato. Am. J. Potato Res. 2007, 84, 3–18. [Google Scholar] [CrossRef]
  52. De la Morena, I.; Guillén, A.; del Moral, L.F.G. Yield development in potatoes as influenced by cultivar and the timing and level of nitrogen fertilization. Am. Potato J. 1994, 71, 165–173. [Google Scholar] [CrossRef]
  53. Dalla Costa, L.; Delle Vedove, G.; Gianquinto, G.; Giovanardi, R.; Peressotti, A. Yield, water use efficiency and nitrogen uptake in potato: Influence of drought stress. Potato Res. 1997, 40, 19–34. [Google Scholar] [CrossRef]
  54. Neumann, A.; Torstensson, G.; Aronsson, H. Nitrogen and phosphorus leaching losses from potatoes with different harvest times and following crops. Field Crop. Res. 2012, 133, 130–138. [Google Scholar] [CrossRef]
  55. Xu, G.; Fan, X.; Miller, A.J. Plant nitrogen assimilation and use efficiency. Annu. Rev. Plant Biol. 2012, 63, 153–182. [Google Scholar] [CrossRef] [Green Version]
  56. Iwama, K. Physiology of the potato: New insights into root system and repercussions for crop management. Potato Res. 2008, 51, 333–353. [Google Scholar] [CrossRef]
  57. Tyler, K.B.; Broadbent, F.E.; Bishop, J.C. Efficiency of nitrogen uptake by potatoes. Am. Potato J. 1983, 60, 261–269. [Google Scholar] [CrossRef]
  58. Zvomuya, F.; Rosen, C.J.; Creighton Miller, J. Response of Russet Norkotah clonal selections to nitrogen fertilization. Am. J. Potato Res. 2002, 79, 231–239. [Google Scholar] [CrossRef]
  59. Solaiman, A.H.M.; Nishizawa, T.; Roy, T.S.; Rahman, M.; Chakraborty, R.; Choudhury, J.; Choudhury, J.; Sarkar, M.D.; Hasanuzzama, M. Yield, dry matter: Specific gravity and color of three Bangladesh local potato cultivars as influenced by stage of maturity. J. Plant Sci. 2015, 10, 108–115. [Google Scholar] [CrossRef] [Green Version]
  60. Dean, B.B.; Thomton, R.E. The Specific Gravity of Potatoes; Washington State Univ. Cooperative Extension Bulletin #1541: Pullman, WA, USA, 1992. [Google Scholar]
  61. Cacace, J.E.; Huarte, M.A.; Monti, M.C. Evaluation of potato cooking quality in Argentina. Am. Potato J. 1994, 71, 145–153. [Google Scholar] [CrossRef]
  62. Pereira, A.B.; Villa Nova, N.A.; Ramos, V.J.; Pereira, A.R. Potato potential yield based on climatic elements and cultivar characteristics. Bragantia 2008, 67, 327–334. [Google Scholar] [CrossRef] [Green Version]
  63. Locascio, S.J.; Wiltbank, W.J.; Gull, D.D.; Maynard, D.N. Fruit and vegetable quality as affected by nitrogen nutrition. In Nitrogen in Crop Production; Hauck, R.D., Ed.; American Society of Agronomy: Madison, WI, USA, 1984; pp. 617–641. [Google Scholar]
  64. Bryant, J.P.; Chapin, F.S.; Klein, D.R. Carbon/nutrient balance of boreal plants in relation to vertebrate herbivory. Oikos 1983, 40, 357–368. [Google Scholar] [CrossRef] [Green Version]
  65. van Eck, H.A. Genetics of morphological and tuber traits. In Potato Biology and Biotechnology: Advances and Perspectives; Vreugdenhil, D., Bradshaw, J., Gebhardt, C., Govers, F., MacKerron, D.K.L., Taylor, M., Ross, H., Eds.; Elsevier: Oxford, UK, 2007; pp. 91–111. [Google Scholar]
  66. Bártová, V.; Bárta, J.; Diviš, J.; Švajner, J.; Peterka, J. Crude protein content in tubers of starch processing potato cultivars in dependence on different agro-ecological conditions. J. Cent. Eur. Agric. 2009, 10, 57–66. [Google Scholar]
  67. Wang, Z.; Li, S.; Malhi, S. Effects of fertilization and other agronomic measures on nutritional quality of crops. J. Sci. Food Agric. 2008, 88, 7–23. [Google Scholar] [CrossRef]
  68. Sadej, W.; Namiotko, A. Nitrates content in potato tubers cultivated under various fertilization systems. Ecol. Chem. Eng. A 2011, 18, 1123–1130. [Google Scholar]
  69. Santamaria, P. Nitrate in vegetable: Toxicity, content, intake and EC regulation. J. Sci. Food Agric. 2006, 86, 10–17. [Google Scholar] [CrossRef]
  70. Licciardello, F.; Lombardo, S.; Rizzo, V.; Pitino, I.; Pandino, G.; Strano, M.G.; Muratore, G.; Restuccia, C.; Mauromicale, G. Integrated agronomical and technological approach for the quality maintenance of ready-to-fry potato sticks during refrigerated storage. Postharvest Biol. Technol. 2018, 136, 23–30. [Google Scholar] [CrossRef]
  71. Rizzo, V.; Amoroso, L.; Licciardello, F.; Mazzaglia, A.; Muratore, G.; Restuccia, C.; Lombardo, S.; Pandino, G.; Strano, M.G.; Mauromicale, G. The effect of sous vide packaging with rosemary essential oil on storage quality of fresh-cut potato. LWT Food Sci. Technol. 2018, 94, 111–118. [Google Scholar] [CrossRef]
  72. Brown, C.R. Antioxidants in potato. Am. J. Potato Res. 2005, 82, 163–172. [Google Scholar] [CrossRef]
  73. Lee, S.K.; Kader, A. Preharvest and postharvest factors influencing vitamin C content of horticultural crops. Postharvest Biol. Technol. 2000, 20, 207–220. [Google Scholar] [CrossRef] [Green Version]
  74. Lachman, J.; Hamouz, K.; Čepl, J.; Pivec, V.; Šulc, M.; Dvořák, P. The effect of selected factors on polyphenol content and antioxidant activity in potato tubers. Chem. Listy 2006, 100, 522–527. [Google Scholar]
  75. Hamouz, K.; Čepl, J.; Dvořák, P. Influence of environmental conditions on the quality of potato tubers. Hortic. Sci. 2005, 32, 89–95. [Google Scholar] [CrossRef] [Green Version]
Figure 1. Photosynthesis rate and SPAD readings of early potato leaves as affected by ‘N fertilization rate x measurement data’ interaction. Different letters within each measurement time (expressed as day after planting, DAP) indicate statistically significant differences among the N fertilization rates (least significant difference (LSD) test, p < 0.05).
Agronomy 10 00352 g001
Figure 2. Marketable yield (MY) and mean tuber weight (MTW) of early potato as affected by ‘N fertilization rate x year’ interaction. Data are mean ± standard deviation of four individual plots (n = 4). Different letters within each parameter indicate statistically significant differences (LSD test, p < 0.05).
Agronomy 10 00352 g002
Table 1. Rainfall, mean minima and maxima temperatures during the ‘early’ potato growing season in the years of study as compared to the long-term period (1977–2006).
Month20142015Long-Term Period
Rainfall (mm)Min. Air Temp. (°C)Max. Air Temp. (°C)Rainfall (mm)Min. Air Temp. (°C)Max. Air Temp. (°C)Rainfall (mm)Min. Air Temp. (°C)Max. Air Temp. (°C)
January2111.116.5468.815.2657.115.4
February2311.016.9738.513.7387.616.2
March1510.716.6319.516.1258.817.7
April813.219.7013.418.73110.920.2
May116.422.01015.322.82014.424.3
Total/mean6812.518.316011.417.31799.818.8
Table 2. Summary of statistical significance from analysis of variance for photosynthesis rate and Soil Plant Analysis Development (SPAD) readings.
Source of Variation
VariableYearNitrogen Fertilization Rate (N)Measurement Time (M)(N) × (M)
Photosynthesis Rate2014*******
*******
SPAD Readings2015*********
********
*, ** and *** indicate significant at p < 0.05, 0.01 and 0.001, respectively. For both years, degrees of freedom were equal to 2–3 and 6 for (N), (M) and (N) × (M) interaction, respectively.
Table 3. Summary of statistical significance from analysis of variance for the aboveground dry biomass, yield components, N efficiency indices and tuber chemical characteristics.
Source of Variation
Variable aNitrogen fertilization Rate (N)Year (Y)(N) × (Y)
ADB***NS
MY******
MTW*********
NTP**NSNS
CNU********
NUE******
NUpE*********
NUtENS*****
FUE********
DM**NS*
Starch*******
Sucrose*****NS
Glucose**NSNS
Fructose**NSNS
Total protein***NSNS
Total polyphenols*******
Nitrate*******
Ascorbic acid********
Antioxidant activity********
*, ** and *** indicate significant at p < 0.05, 0.01 and 0.001, respectively; NS = not significant. Degrees of freedom were equal to: 1 for (Y); 2 for both (N) and (N) × (Y) interaction. a ADB: Aboveground Dry Biomass; MY: Marketable Yield; MTW: Mean Tuber Weight; NTP: Number of Tubers Plant−1; CNU: Crop Nitrogen Uptake; NUE: Nitrogen Use Efficiency; NUtE: Nitrogen Utilization Efficiency; NUpE: Nitrogen Uptake Efficiency; FUE: Fertilizer Use Efficiency; DM: Dry Matter.
Table 4. Aboveground dry biomass, yield components, N efficiency indices and tuber chemical characteristics of “early” potato as affected by the main effects. Different letters between years or among N fertilization rates within the same row show significant differences (LSD test, p < 0.05).
YearN Fertilization Rate
Variable20142015N0N140N280
ADB (t ha−1 DM)1.02 ± 0.02 a0.85 ± 0.04 b0.78 ± 0.02 c0.99 ± 0.03 b1.10 ± 0.03 a
MY (t ha−1) a55.5 ± 1.2 a48.3 ± 2.0 b45.8 ± 1.0 c59.1 ± 1.3 a50.8 ± 2.0 b
MTW (g)127 ± 4 a111 ± 6 b108 ± 4 b137 ± 4 a112 ± 5 b
NTP (no. plant−1)9.7 ± 0.3 a9.6 ± 0.2 a9.4 ± 0.3 b9.6 ± 0.2 b10.1 ± 0.4 a
CNU (kg ha−1)145 ± 5 a128 ± 3 b113 ± 4 b147 ± 4 a148 ± 5 a
NUE (kg tuber DW kg N−1)66.0 ± 1.0 a56.6 ± 1.3 b113.3 ± 0.9 a46.8 ± 0.4 b23.8 ± 1.0 c
NUpE (kg N kg N−1)0.98 ± 0.08 a0.85 ± 0.036 b1.61 ± 0.09 a0.70 ± 0.08 b0.42 ± 0.04 c
NUtE (kg tuber DW kg N−1)64.4 ± 0.7 a64.3 ± 0.6 a70.3 ± 0.8 a66.6 ± 0.6 a56.2 ± 0.7 b
FUE (kg kg−1)67.7 ± 1.3 a45.0 ± 1.0 b-95.0 ± 1.6 a17.7 ± 1.0 b
Dry matter (DM) (%)16.8 ± 1.0 a16.8 ± 0.9 a17.2 ± 1.0 a16.6 ± 0.5 b16.4 ± 0.6 b
Starch (g kg−1 DM)632 ± 8 a604 ± 7 b640 ± 8 a634 ± 6 a580 ± 6 b
Sucrose (g kg−1 DM)11.7 ± 0.5 a11.9 ± 0.6 a13.1 ± 0.6 a11.4 ± 0.4 b11.0 ± 0.3 b
Glucose (g kg−1 DM)6.1 ± 0.1 a5.9 ± 0.3 a6.7 ± 0.4 a5.8 ± 0.2 b5.6 ± 0.3 b
Fructose (g kg−1 DM)2.0 ± 0.2 a2.1 ± 0.3 a2.4 ± 0.4 a1.8 ± 0.1 b1.9 ± 0.1 b
Total protein(g kg−1 DM)89 ± 4 a90 ± 3 a82 ± 4 b86 ± 4 b100 ± 5 a
Total polyphenols (g kg−1 DM)3.17 ± 0.07 b3.83 ± 0.10 a3.86 ± 0.09 a3.31 ± 0.08 b3.33 ± 0.07 b
Nitrate (g kg−1 DM)1.03 ± 0.7 a0.88 ± 0.09 b0.86 ± 0.09 c0.93 ± 0.06 b1.08 ± 0.04 a
Ascorbic acid (g kg−1 DM)0.60 ± 0.05 a0.63 ± 0.05 a0.71 ± 0.04 a0.61 ± 0.07 b0.52 ± 0.08 c
Antioxidant activity (%inhibition DPPH)55.6 ± 1.2 b61.1 ± 1.2 a62.3 ± 1.2 a58.3 ± 1.0 b54.4 ± 1.3 c
Data are mean ± standard deviation, n = 12 and 8 for year and N fertilization rate, respectively.a See Table 3 for the list of acronyms.
Table 5. CNU, NUE, NUpE, NUtE and FUE as affected by ‘N fertilization rate × year’ interaction. Different letters within each column indicate significant statistical differences (LSD test, p < 0.05).
YearN Fertilization RateCNU (kg ha−1)NUE (kg Tuber DM kg N−1)NUpE (kg N kg N−1)NUtE (kg Tuber DM kg N−1)FUE (kg kg−1)
2014N0120.5 ± 2.5 d122.1 ± 1.3 a1.72 ± 0.06 a70.9 ± 2.3 a-
N140162.6 ± 3.0 a52.0 ± 1.8 c0.77 ± 0.08 c67.1 ± 2.0 b125.7 ± 2.0 a
N280150.9 ± 4.0 b23.8 ± 1.0 e0.43 ± 0.05 e55.2 ± 1.9 d9.6 ± 0.3 d
2015N0104.8 ± 2.9 e104.5 ± 1.8 b1.5084 ± 0.05 b69.7 ± 1.6 a-
N140132.2 ± 3.0 c41.6 ± 1.5 d0.63 ± 0.05 d66.0 ± 2.5 b64.3 ± 1.2 b
N280145.7 ± 2.2 bc23.8 ± 1.2 e0.42 ± 0.05 e57.1 ± 2.5 c25.7 ± 1.8 c
Data are mean ± standard deviation of 4 individual plots (n = 4).
Table 6. Chemical composition of early potato tubers as affected by the interaction between year and nitrogen fertilization rate. Different letters within each column indicate statistically significant differences (LSD test, p < 0.05).
YearN Fertilization RateDry Matter (DM) (%)Starch (g kg−1 DM)Nitrate (g kg−1 DM)Ascorbic Acid (g kg−1 DM)Total Polyphenols (g kg−1 DM)Antioxidant Activity (%inhibition DPPH)
2014N017.5 ± 1.0 a647 ± 4 ab0.94 ± 0.06 c0.67 ± 0.02 b3.42 ± 0.11 b58.2 ± 1.2 bc
N14016.5 ± 1.5 cd657 ± 8 a1.01 ± 0.03 b0.58 ± 0.04 d3.04 ± 0.05 c55.9 ± 0.4 c
N28016.3 ± 0.9 d592 ± 9 cd1.15 ± 0.09 a0.54 ± 0.06 e3.05 ± 0.08 c52.5 ± 0.8 d
2015N017.0 ± 0.5 b632 ± 5 b0.78 ± 0.06 e0.75 ± 0.04 a4.31 ± 0.20 a66.4 ± 0.7 a
N14016.8 ± 0.7 bc612 ± 11 c0.85 ± 0.04 d0.64 ± 0.03 c3.58 ± 0.13 b60.7 ± 0.6 b
N28016.6 ± 0.1 c569 ± 10 d1.02 ± 0.04 b0.49 ± 0.05 f3.61 ± 0.07 b56.3 ± 0.4 c
Data are mean ± standard deviation of four individual plots (n = 4).

