Article

Antioxidant and Neuroprotective Activity of Extra Virgin Olive Oil Extracts Obtained from Quercetano Cultivar Trees Grown in Different Areas of the Tuscany Region (Italy)

1
Department for Life Quality Studies, Alma Mater Studiorum-University of Bologna, 40126 Bologna, Italy
2
Department of Pharmacy, University of Pisa, 56126 Pisa, Italy
3
School of Biosciences and Veterinary Medicine, University of Camerino, 62032 Camerino, Italy
4
Department of Pharmacy, University “G. d’Annunzio” of Chieti-Pescara, Via dei Vestini, 66100 Chieti, Italy
5
Center for Advanced Studies and Technology (CAST), University “G.d’Annunzio” of Chieti-Pescara, Via dei Vestini, 66100 Chieti, Italy
6
School of Science and Technology, Chemistry Division, University of Camerino, V.S. Agostino 1, 62032 Camerino, Italy
7
Department of Clinical and Experimental Medicine, University of Pisa, 56126 Pisa, Italy
8
School of Pharmacy, University of Camerino, 62032 Camerino, Italy
*
Author to whom correspondence should be addressed.
These authors contributed equally to this work.
Antioxidants 2021, 10(3), 421; https://doi.org/10.3390/antiox10030421
Submission received: 11 February 2021 / Revised: 2 March 2021 / Accepted: 5 March 2021 / Published: 10 March 2021

Abstract

:
Neurodegenerative diseases are driven by several mechanisms such as inflammation, abnormal protein aggregation, excitotoxicity, mitochondrial dysfunction and oxidative stress. So far, no therapeutic strategies are available for neurodegenerative diseases and in recent years the research is focusing on bioactive molecules present in food. In particular, extra-virgin olive oil (EVOO) phenols have been associated to neuroprotection. In this study, we investigated the potential antioxidant and neuroprotective activity of two different EVOO extracts obtained from Quercetano cultivar trees grown in two different areas (plain and hill) of the Tuscany region (Italy). The different geographical origin of the orchards influenced phenol composition. Plain extract presented a higher content of phenyl ethyl alcohols, cinnammic acids, oleacein, oleocanthal and flavones; meanwhile, hill extract was richer in lignans. Hill extract was more effective in protecting differentiated SH-SY5Y cells from peroxide stress thanks to a marked upregulation of the antioxidant enzymes heme oxygenase 1, NADPH quinone oxidoreductase 1, thioredoxin Reductase 1 and glutathione reductase. Proteomic analysis revealed that hill extract plays a role in the regulation of proteins involved in neuronal plasticity and activation of neurotrophic factors such as BDNF. In conclusion, these data demonstrate that EVOOs can have important neuroprotective activities, but these effects are strictly related to their specific phenol composition.

1. Introduction

In the “era” of the economic prosperity, the non-communicable diseases such as cardiovascular diseases, neurodegenerative diseases, cancer, obesity and diabetes, are collectively accountable for almost 70% of all deaths worldwide [1].
The complexity of these diseases makes it difficult to fight them with single-target molecules. Indeed, the research is shifting its strengths on multitarget compounds [2,3] and in recent years it is focusing on bioactive molecules naturally present in food as potential “weapons” against chronic degenerative diseases. On the base of these premises, nutrition could represent a key factor of lifestyle for counteracting the development and progression of such pathologies. In particular, the Mediterranean diet, rich in vegetables, cereals, fruits, legumes and monounsaturated fatty acids mainly derived from olive oil, has been associated with a reduced incidence of neurodegenerative diseases and enhanced cognitive performance [4,5].
Neurodegenerative diseases represent an increasingly public health problem, especially in the aging population. These pathologies are multifactorial non communicable diseases driven by several but linked mechanisms such as inflammation, abnormal protein aggregation, excitotoxicity, oxidative stress and mitochondrial dysfunction [6,7,8,9,10]. In addition, the accumulation of proteins and lipids modified by the excessive production of reactive oxygen species (ROS) leads to a self-feeding loop [11]. Oxidative stress consists in an imbalance condition where the production of reactive species (mainly ROS) exceeds their detoxification, leading to an abnormal accumulation of radical species and oxidative damages. Furthermore, oxidative stress triggers and is triggered by mitochondrial dysfunction [12]. Stated the key role played by mitochondria in energy metabolism and modulation of redox homeostasis, their dysfunction might contribute to the pathogenesis of neurodegeneration. Due to its high oxygen requirements, relative poorness of antioxidant defenses, elevated levels of unsaturated fatty acids and abundance in iron content, the brain is particularly sensible to oxidative stress [13,14]. Consequently, neurons are prone to oxidative injury and the physiological process of aging together with the aging-associated diseases share the promotion of a redox imbalance [15]. Of note, neurons are cells characterized by limited self-renewal, implying that damages can accumulate over time [13]. Regardless of how oxidative stress is caused, when encountered, cells counteract the damaging effect of this condition by activating the endogenous antioxidant defense system, which is unfortunately compromised in the context of neurodegeneration. Extensive studies during the past decade have proven the notion that the transcription factor NF-E2-related factor 2 (Nrf2) is an essential element for up-regulating the antioxidant defense system [16,17,18].
In addition, neuronal growth and survival are ensured by the neurotrophic signaling pathway and alteration of specific neurotrophic factors leads to brain degeneration [19]. In particular, the brain-derived neurotrophic factor (BDNF) is essential for the survival and normal functioning of mature neurons and its level are markedly depressed in neurodegenerative diseases [20,21,22]. These relationships suggest the BDNF and the Nrf2 signaling pathway are potential targets for supporting neuronal survival and regeneration of impaired neuronal structures and synaptic connectivity.
Unfortunately, to date, no therapeutic strategies are available for neurodegenerative diseases.
It has been suggested that the positive role of the Mediterranean diet is probably related to the presence of a huge quantity and different phenols [23,24]. One of the main source of phenols from the Mediterranean diet is the consumption of extra-virgin olive oil (EVOO) in amounts going from 30 to 50 g/day [25], representing the principle fat consumed in the Mediterranean diet [26]. In vitro and in vivo studies demonstrated preventive and protective properties of EVOO against neurodegeneration. The major polar phenolic compounds present in EVOO such as oleacein (dialdehydic form of decarboxymethyl elenolic acid linked to hydroxytyrosol, 3,4-DHPEA-EDA), oleuropein aglycone isomer (3,4-DHPEA-EA), oleocanthal (the dialdehydic form of decarbox-ymethylelenolic acid linked to tyrosol, p-HPEA-EDA), ligstroside aglycon (p-HPEA-EA), hydroxytyrosol (3,4-DHPEA), tyrosol (p-HPEA), have been demonstrated to possess anti-inflammatory [27], anti-microbial and anti-viral activities [28], to counteract oxidative stress and modulate survival signaling pathways [29]. Many factors can influence EVOO phenolic composition and concentration including cultivars, climate conditions, ripening stage of the olives but also olive oil production processes and storage [30,31]. Therefore, the definition of an exact phenolic content is hard and referring to different studies the amount could range from 200 to 1000 mg/kg [28,30,32,33,34,35]. Furthermore, the specific phenolic pattern of different EVOOs could influence their biological activity such as neuroprotection.
In this study, we investigated the potential antioxidant and neuroprotective effects of two different EVOO extracts obtained from Quercetano cultivar trees grown in two different areas of the Tuscany region (Italy). In particular, we characterized the extracts by HPLC-DAD/MS and evaluated their neuroprotective activity against H2O2-induced oxidative stress in differentiated SH-SY5Y cells. Moreover, proteomics combined with pathways analyses, was used to investigate the molecular events related to the protective effects and to gain insight into the underlying mechanisms of neuroprotection.

2. Materials and Methods

2.1. Chemicals

3-(4,5-dimethylthiazol-2-yl)-2,5diphenyl-tetrazolium bromide (MTT), 2,7-dichlorodihydrofluorescein diacetate (DCFH-DA), H2O2, dimethyl sulfoxide (DMSO), monochlorobimane (MCB), Phosphate Buffered Saline (PBS), Dulbecco’s modified Eagle’s medium (DMEM), penicillin/streptomycin, primers listed in Table 1, all trans retinoic acid (RA), Lactate Dehydrogenase Activity Assay Kit and all other chemicals of the highest analytical grade were purchased from Sigma-Aldrich (Milano, Italy). Fetal bovine serum (FBS) was purchased from Euroclone (Milano, Italy).

2.2. EVOO Sample Extraction

EVOO samples were obtained from the fruits of the olive cultivar Quercetano (Olea europaea L.) which were picked at the same stage of maturity during the same month season 2019 in two olive groves located at different altitude (hill, plain) and with some different soil type (clay, silt, sandy) in Tuscany region (Italy). The phytoextracts of hill and plain EVOOs were prepared essentially as previously described [36,37]. Briefly, EVOO (3 g) was mixed with n-hexane (12 mL) and acetonitrile (15 mL). The resulting mixture was homogenized using a vortex mixer and centrifuged at 4000 rpm for 5 min, at 25 °C. Then, the acetonitrile phase was collected and evaporated under reduced pressure, to obtain the phytoextracts.

2.3. Analysis of Phenolic Substances

The extracts to be analyzed were weighted (7–19 mg) and then each one was dissolved in 0.46 mL methanol/water solution (6:4 v/v), added with 0.04 mL of internal standard solution (syringic acid in methanol, at 100 mg/L) and with 0.5 mL of hexane to remove possible triacylglycerols left. The biphasic system was shaken with the help of a vortex for 2 min, then centrifuged and then hexane upper phase removed. The hydro-methanolic solution was filtered and then analyzed by HPLC-DAD/MS with the condition reported in Ricciutelli et al., 2017 [38]. Quantification of the phenolic substances hydroxytyrosol, tyrosol, ferulic acid, p-coumaric acid, vanillic acid, 3,4-DHPEA-EDA, p-HPEA-EDA, 3,4-DHPEA-EA, p-HPEA-EA, pinoresinol, acetoxypinoresinol, luteolin, apigenin was performed according to [39]. Briefly, HPLC-DAD analysis, that was used for the quantification, was performed monitoring different wavelengths: 260 nm for vanillic acid, 280 nm for tyrosol, hydroxytyrosol, secoiridoids derivatives (namely 3,4-DHPEA-EDA, p-HPEA-EDA, 3,4-DHPEA-EA, p-HPEA-EA), pinoresinol, acetoxypinoresinol and syringic acid; 310 nm for p-coumaric acid, 325 nm for ferulic acid, 338 nm for apigenin and 350 nm for luteolin. Secoiridoid derivatives were quantified using tyrosol calibration curve. Mass spectrometer was used only for confirmation of the identity of the analytes.

2.4. Cell Culture and Treatments

The SH-SY5Y human neuroblastoma cell line was obtained from Sigma-Aldrich (Milan, Italy). Cells were grown in DMEM supplemented with 10% (v/v) FBS, 2 mM glutamine, 50 U/mL of penicillin and 50 μg/mL of streptomycin and maintained at 37 °C in a humidified incubator with 5% CO2 as reported in [40]. Cell differentiation was induced reducing serum levels of the medium to 1% with 10 µM of RA for seven days prior to treatments. Differentiated SH-SY5Y were treated with plain and hill extracts for 24 h. Extracts were dissolved in DMSO. The control group was treated with an equivalent volume of the vehicle alone. Oxidative stress was induced exposing cells to 700 µM H2O2 for different times depending on the assay.

2.5. MTT and Lactate Dehydrogenase Activity Assays

Cells were treated with different concentrations of plain and hill extracts (1 µg/mL–500 µg/mL) for 24 h. The induction of oxidative stress was achieved with 700 µM of H2O2 for 1 h. Cell viability was evaluated by measuring formazan formation as previously reported [41]. Cells were incubated with 0.5 mg/mL of MTT solution for 1 h at 37 °C. After incubation, MTT was removed and 100 µL of DMSO were added, the absorbance was recorded at λ = 595 nm using a microplate spectrophotometer (VICTOR3 V Multilabel Counter; PerkinElmer, Wellesley, MA, USA). Lactate dehydrogenase (LDH) activity was evaluated in the culture medium and the test was performed using the Lactate Dehydrogenase Activity Assay Kit according to the manufacturer’s instructions.

2.6. Intracellular ROS Production Assay

The fluorescent probe DCFH-DA was used to monitor the production of intracellular reactive oxygen species [42]. Differentiated SH-SY5Y were treated with different concentrations of plain and hill extracts for 24 h and then incubated with 10 µg/mL DCFH-DA in DMEM w/o FBS for 30 min. After DCFH-DA removal, cells were incubated with 200 µM H2O2 for 15 min. Cell fluorescence was measured using 485 nm excitation and 535 nm emission with a microplate spectrofluorometer (VICTOR3 V Multilabel Counter).

2.7. Intracellular GSH Levels Assay

The levels of reduced glutathione (GSH) were evaluated by a fluorometric assay, using the fluorescent probe MCB [43]. Briefly, after treatments, differentiated SH-SY5Y were incubated with 50 µM MCB in serum-free medium for 30 min at 37 °C. After incubation, fluorescence was measured at 355 nm (excitation) and 460 nm (emission) with a microplate spectrofluorometer (VICTOR3 V Multilabel Counter; PerkinElmer).

2.8. RNA Extraction

Total RNA was extracted using RNeasy Mini Kit (QIAGEN GmbH, Hilden, Germany), following the manufacturer’s protocol. The yield and purity of the RNA were measured using NanoVue Spectrophotometer (GE Healthcare, Milano, Italy).

2.9. Analysis of mRNA Levels by Reverse Transcriptase Polymerase Chain Reaction

cDNA was obtained by reverse transcribing mRNA starting from 1 μg of total RNA using iScript cDNA Synthesis Kit (BIO-RAD, Hercules, CA, USA), following the manufacturer’s protocol. The subsequent polymerase chain reaction (PCR) was performed in a total volume of 10 μL containing 2.5 μL (12.5 ng) of cDNA, 5 μL SsoAdvanced Universal SYBR Green Supermix (BIO-RAD) and 0.5 μL (500 nM) of each primer (Sigma-Aldrich). The primers used are reported in Table 1, 18S rRNA was used as reference gene.

2.10. Proteomic Analysis

For proteomic analysis, differentiated SH-SY5Y cells were treated with plain and hill extracts (10 μg/mL) for 24 h as described above. At the end of treatments, cells were collected and washed with PBS. After centrifugation (1000× g for 5 min), the resulting pellets were immediately frozen and stored at −80 °C until use. For proteomic studies, each condition was performed in triplicate.
Cell pellets were resuspended in rehydration solution [44] and protein contents of resulting protein extracts were measured with an RC-DC Protein Assay from Bio-Rad.
The 2DE was carried out as previously described [45]. Briefly, 200 µg of proteins were filled up to 450 μL in rehydration solution. Immobiline Dry-Strips (GE Health Care Europe; Uppsala, Sweden); 18 cm, nonlinear gradient (pH 3–10) were rehydrated overnight in the sample and then transferred to the Ettan IPGphor Cup Loading Manifold (GE Healthcare) for isoelectrofocusing (IEF). The second dimension (Sodium Dodecyl Sulphate-Polyacrylamide Gel Electrophoresis; SDS-PAGE) was carried out by transferring the proteins to 12% polyacrylamide, running at 16 mA per gel and 10 °C for about 16 h, using the Protean® Plus Dodeca Cell (Bio-Rad). The gels were stained with Ruthenium II tris (bathophenanthroline disulfonate) tetrasodium salt (Cyanagen Srl, Bologna, Italy) (RuBP). ImageQuant LAS4010 (GE Health Care) was used for the acquisition of images. The analysis of images was performed using Same Spot (v4.1, TotalLab; Newcastle Upon Tyne, UK) software. The spot volume ratios among the three different conditions (Control, hill, plain) were calculated using the average spot normalized volume of the three biological replicates performed in duplicate. The software included statistical analysis calculations.

2.11. Spot Digestion and Protein Identification

The gel pieces were trypsin digested and analyzed by LC-MS as previously described [46]. Each digested spot sample was analyzed by LC-MS/MS using a Proxeon EASY-nLCII (Thermo Fisher Scientific, Milan, Italy) chromatographic system coupled to a Maxis HD UHR-TOF (Bruker Daltonics GmbH, Bremen, Germany) mass spectrometer. The raw data were processed using PEAKS Studio v7.5 software (Bioinformatic Solutions Inc, Waterloo, ON, Canada) using the function “correct precursor only”. The mass lists were searched against the nextprot database including isoforms (version as of June 2017; 42,151 entries) using 10 ppm and 0.05 Da as the highest error tolerances for parent and fragment ions, respectively. Carbamidomethylation of cysteines was selected as fixed modification and oxidation of methionines and deamidation of asparagine and glutamine as variable modifications allowing two missed cleavages.

2.12. Bioinformatic Analysis

For gene ontology analysis, including differential molecular function and biological processes, PANTHER software (Protein Analysis Through Evolutionary Relationships; http://www.pantherdb.org/genes/batchIdSearch.jsp (accessed 3 January 2021), was used to classify genes into distinct categories of molecular functions and biological processes. Proteins differentially expressed obtained both from hill vs Control and plain vs Control comparisons were functionally analyzed using QIAGEN’s Ingenuity Pathway Analysis (IPA, QIAGEN Redwood City, USA, www.qiagen.com/ingenuity, Build version: 321501M Content version: 21249400, accessed 15 January 2021) with the aim to determine the predominant canonical pathways and interaction network involved. Swiss-Prot accession numbers and official gene symbols were inserted into the software along with corresponding comparison ratios and p values. Based on known associations in the literature, canonical pathways associated with differentially expressed proteins were defined. A comparison of the different analyses was created and the upstream regulators whose activity appears to change in a significant manner according to the activation z-score value were shown. Finally, the impact of activated or inhibited regulators on downstream functions and diseases were investigated. The use of an algorithm allowed to merge upstream and downstream results from the upstream regulator, through one or more iterations. The networks were merged only if the overlap of protein targets was possible and of statistical significance (Fisher’s Exact Test). Higher scoring hypotheses were those with more consistent causal paths represented by a high Consistency Score.

2.13. Western Blot Analysis

Western blot (WB) was performed in order to validate peculiar increase of expression of both DPYSL2 and BDNF found in hill with respect to plain and Control samples with 2-DE and RT-PCR, respectively. Aliquots of protein samples (5 μg for DPYSL2 and 50 μg for BDNF) were mixed with Laemmli solution, run in 4–15% polyacrylamide gels (Mini-PROTEAN® Precast Gels, Biorad, Hercules, CA, USA) using a mini-Protean Tetracell (Biorad, Hercules, CA, USA) and transferred onto nitrocellulose membranes (0.2 μm) using a Trans-Blot Turbo transfer system (Biorad) as previously described [45]. Anti-DPYSL2 (Cell Signaling Technology, Beverly, MA, USA) and anti-BDNF (Genetex, Irvine, CA, USA) antibodies were used at 1:1000 dilution. Moreover, an anti-β-actin (Merck KGaA, Darmstadt, Germany), was used for internal normalization. HRP-goat anti-rabbit secondary antibody was used at 1:10,000 dilution. Immunoblots were developed using the enhanced chemiluminescence detection system (ECL). The chemiluminescent images were acquired using LAS4010 (GE Health Care Europe, Upsala, Sweden). The immunoreactive specific bands were quantified using Image Quant-L software.

2.14. Statistical Analysis.

All analyses were performed at least in triplicate and values were expressed as mean ± standard error. In experiments with SH-SY5Y cell cultures, one-way ANOVA was used to compare differences among groups followed by Dunnett’s or Bonferroni’s test (Prism 5; GraphPad Software, San Diego, CA, USA). Differences at the level p < 0.05 were considered statistically significant. In 2DE experiments, a comparison among the different treatments was performed. The significance of the differences of normalized volume for each spot was calculated by the software Same Spot including the analysis of variance (ANOVA test). The protein spots significantly differentially expressed were cut out from the gel and identified by LC-MS analysis.

3. Results

3.1. Phenolic Content

The soil characteristic of the hill and plain orchards are reported in Table 2. Interestingly, the two soils were very different in terms of silt, sandy, pH and mineral composition.
The analysis of phenolic components of EVOOs extracts from the hill and plain orchards shows a similar qualitative composition, but a different quantitative composition. In particular, the total phenol content is higher in the plain than in the hill extract (Table 3). Moreover, phenyl ethyl alcohols (tyrosol, hydroxytyrosol), oleacein (3,4-DHPEA-EDA), oleocanthal (p-HPEA-EDA), cinnammic acids (p-coumaric acid, ferulic acid), flavones (luteolin, apigenin) are higher in the plain extract, vice versa lignans (pinoresinol, acetoxypinoresinol), oleuropein aglycon isomer (3,4-DHPEA-EA) and ligstroside aglycon (p-HPEA-EA) are higher in hill extract.

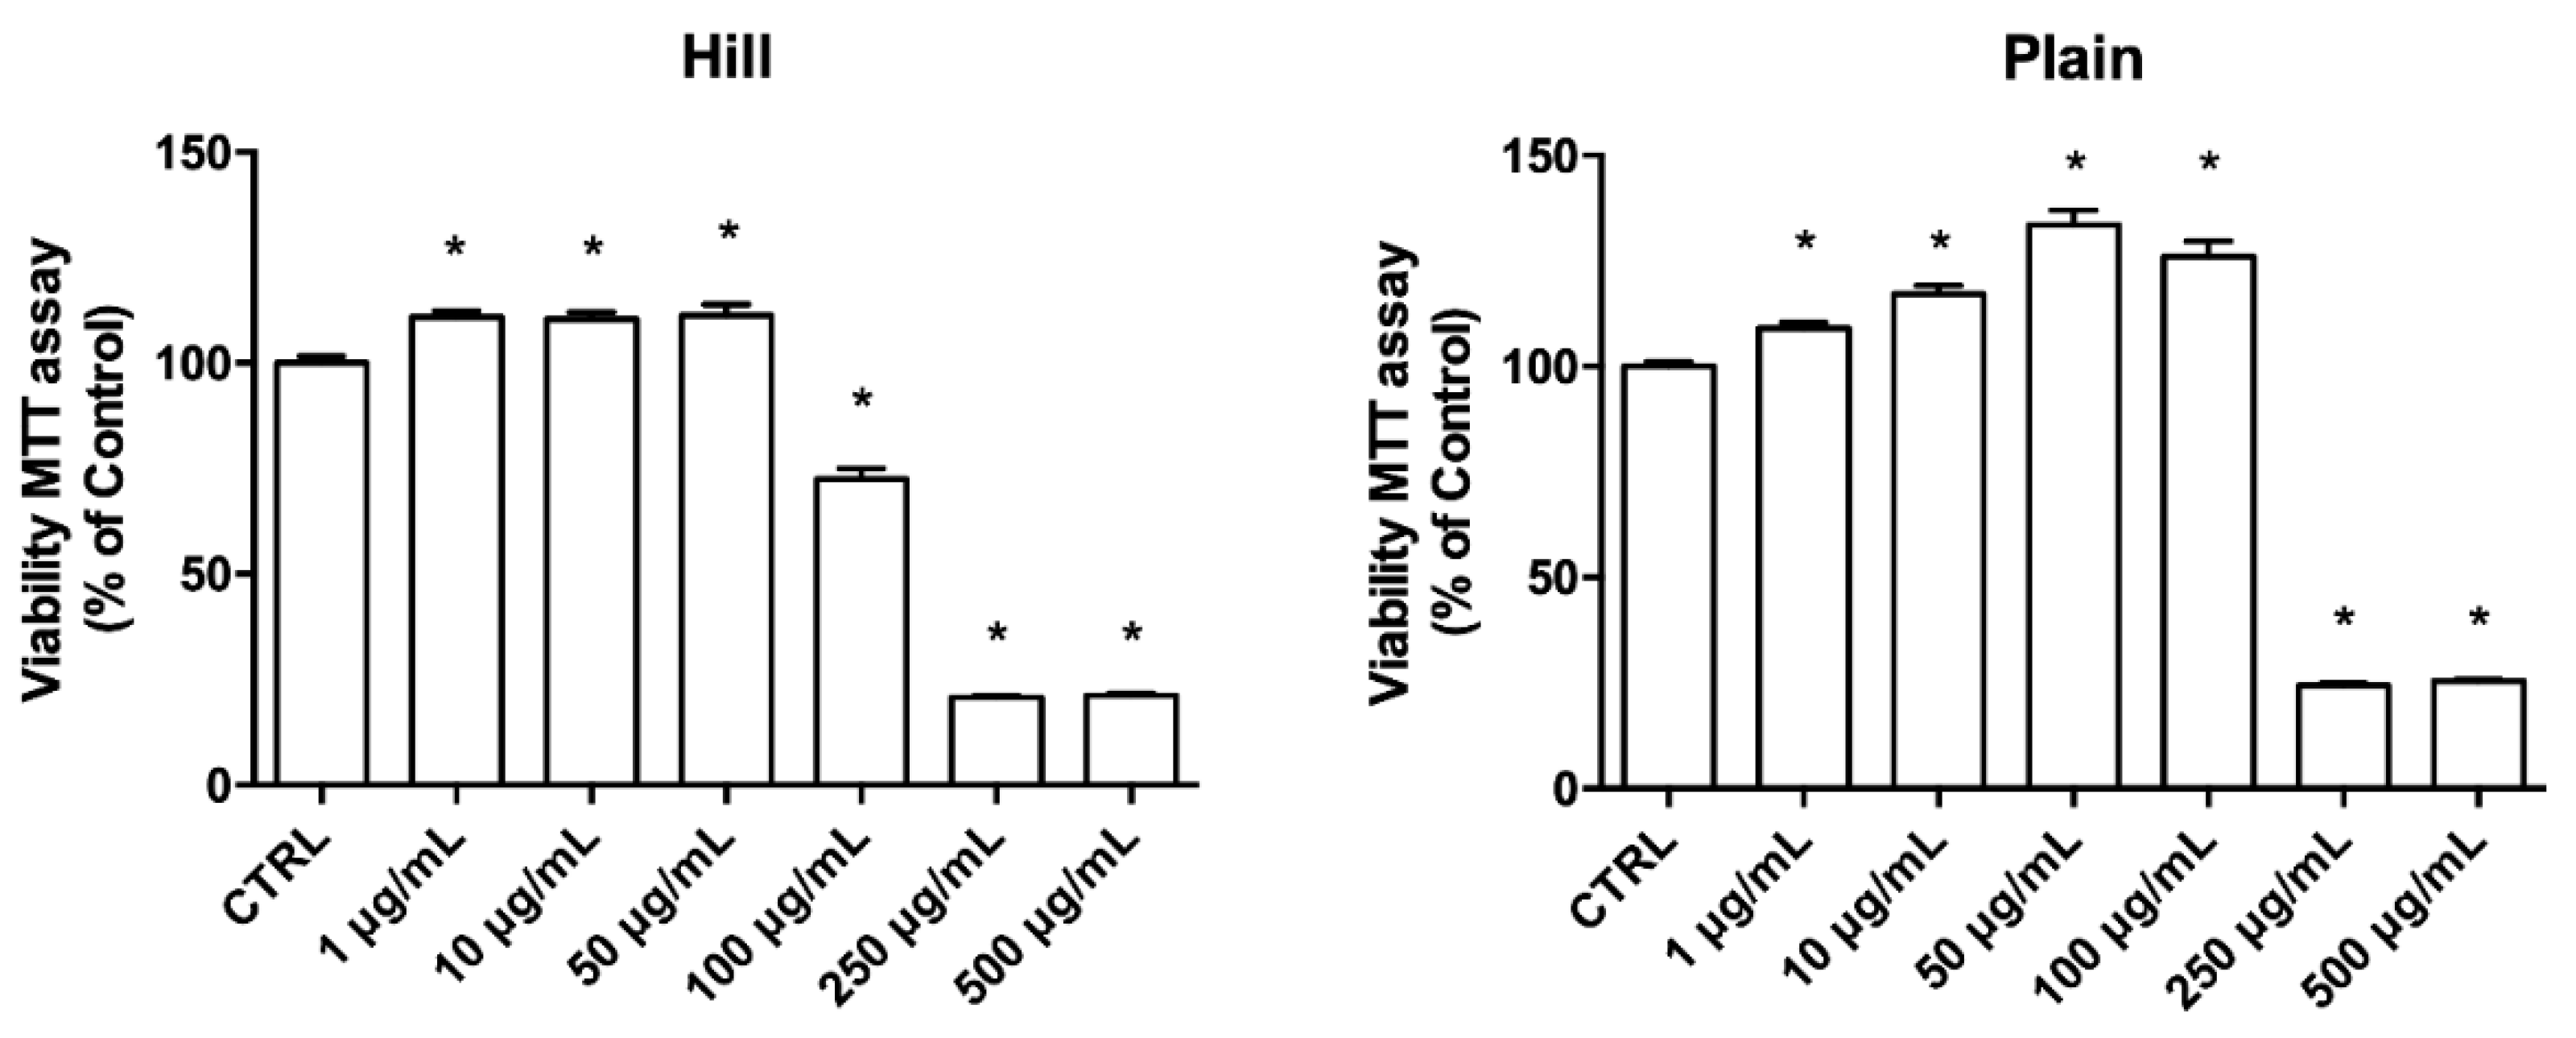
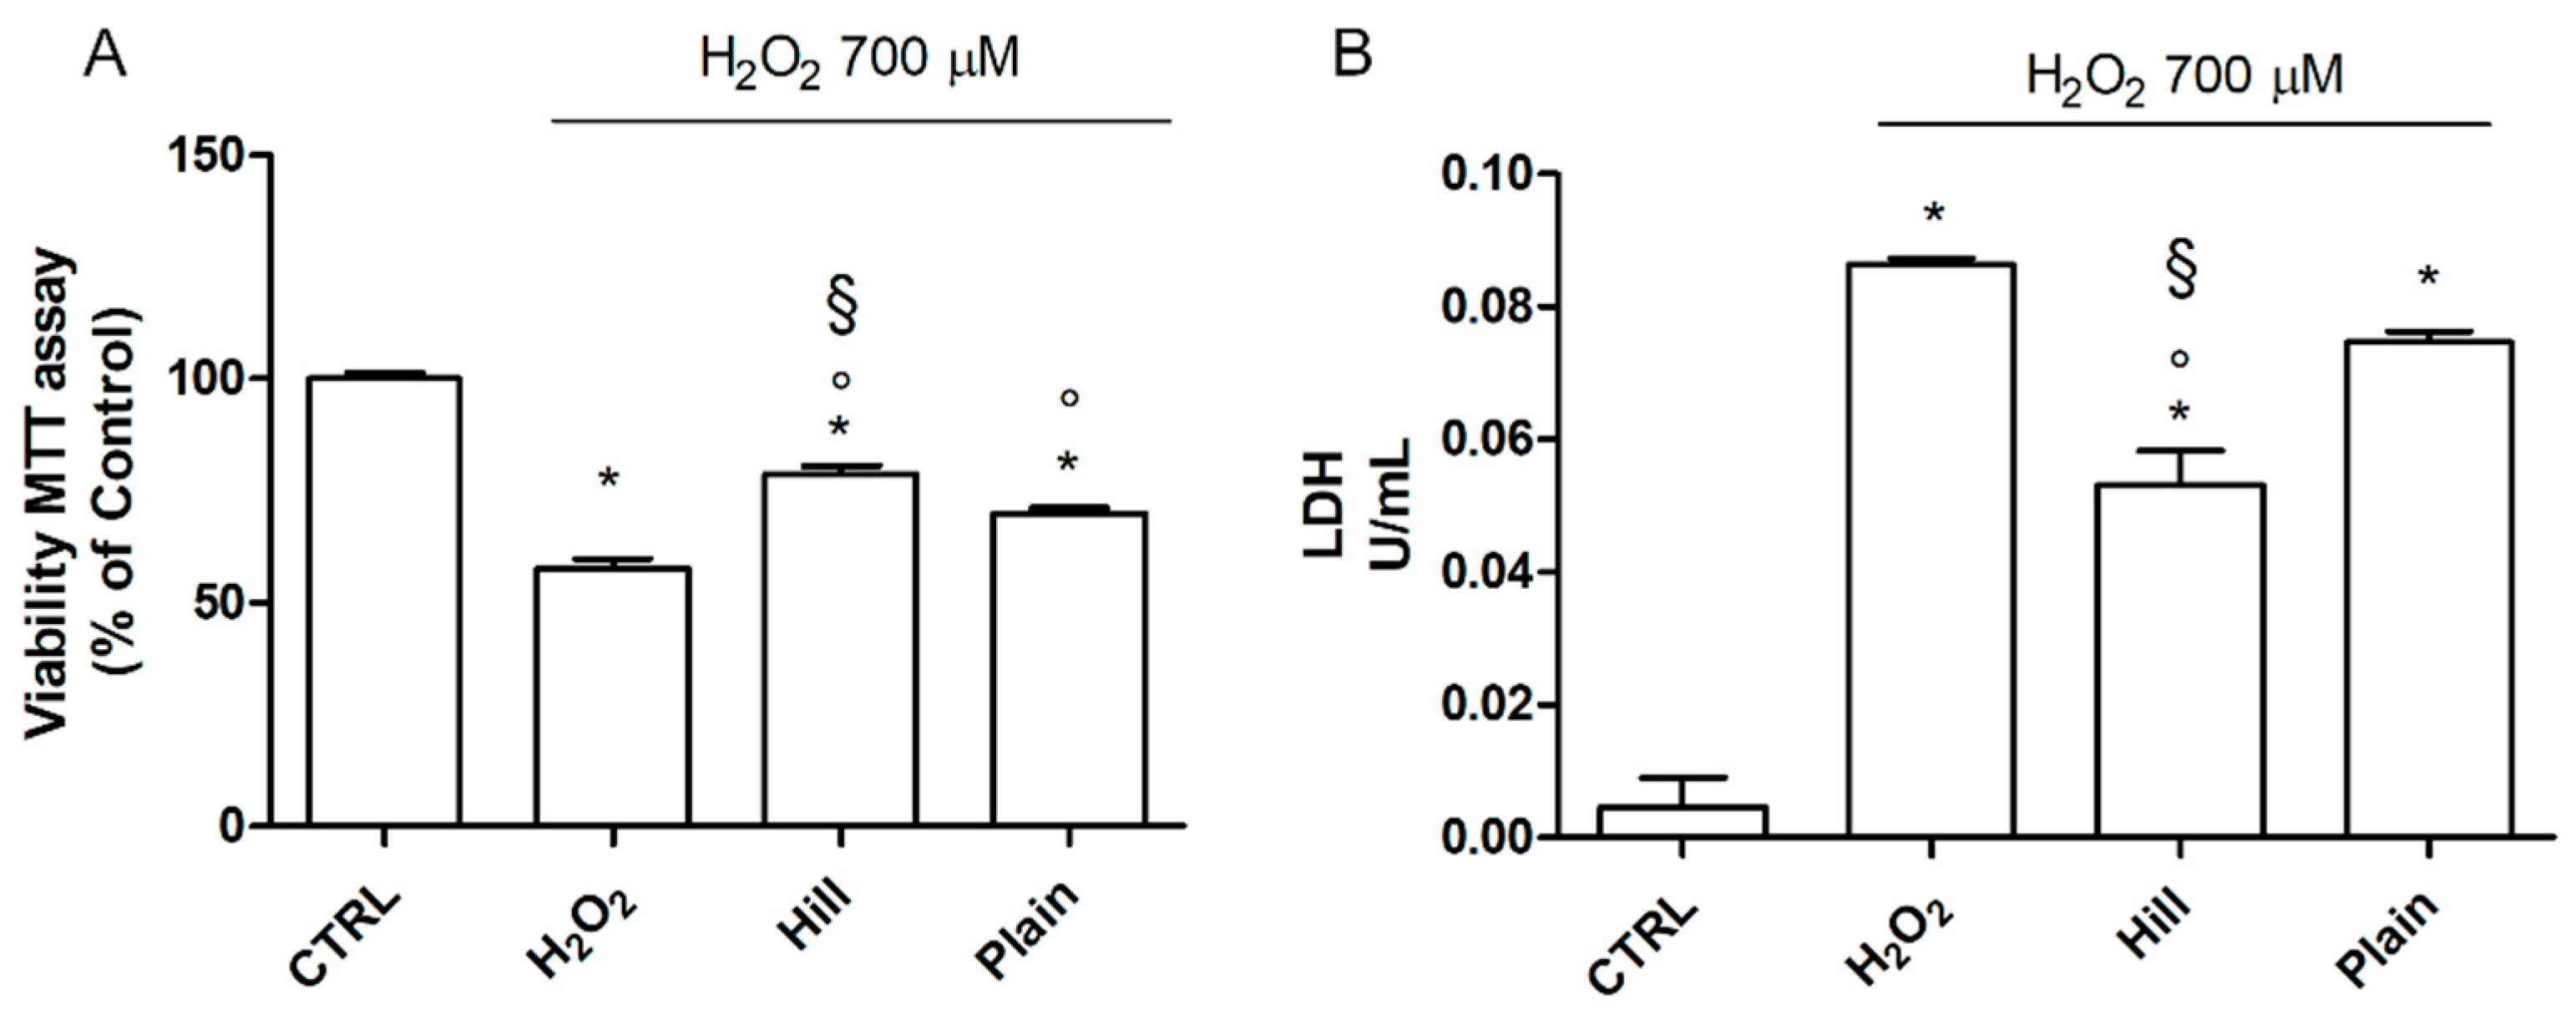
3.2. EVOO Extracts—Mediated Neuroprotection against Oxidative Damage

To assess the potential cytotoxicity of the EVOO extracts, differentiated SH-SY5Y cells were exposed to increasing concentrations of the extracts for 24 h (Figure 1). Treatment with the hill extract led to a significant decrease of cell viability in respect to control cells at concentrations higher than 50 µg/mL, meanwhile treatment with the plain extract significantly reduced cell viability at concentrations higher than 100 µg/mL. Interestingly, both extracts significantly increased cell viability at the lowest concentrations.
To assess the neuroprotective activity of the extracts, SH-SY5Y cell were pretreated with 10 µg/mL of the extracts and after 24 h were exposed to H2O2 to induce oxidative stress (Figure 2). This extract concentration was selected as it is one order of magnitude lower than the toxic concentration and can be considered safe. Peroxide induced a strong and significant reduction of cell viability in respect to control cells, meanwhile both hill and plain extracts were able to significantly increase cell viability in respect to cells exposed to H2O2 (Figure 2A). Of note, the hill extract significantly increased cell viability in respect to the plain extract. Concerning LDH release, a marker of no-specific cell damage, H2O2 triggered a strong and significant increase of LDH release in respect to control cells (Figure 2B). Only the hill extract was able to significantly reduce the activity of LDH in the culture medium in respect to H2O2 exposed cells, confirming the higher antioxidant activity of the hill in respect to the plain extract.

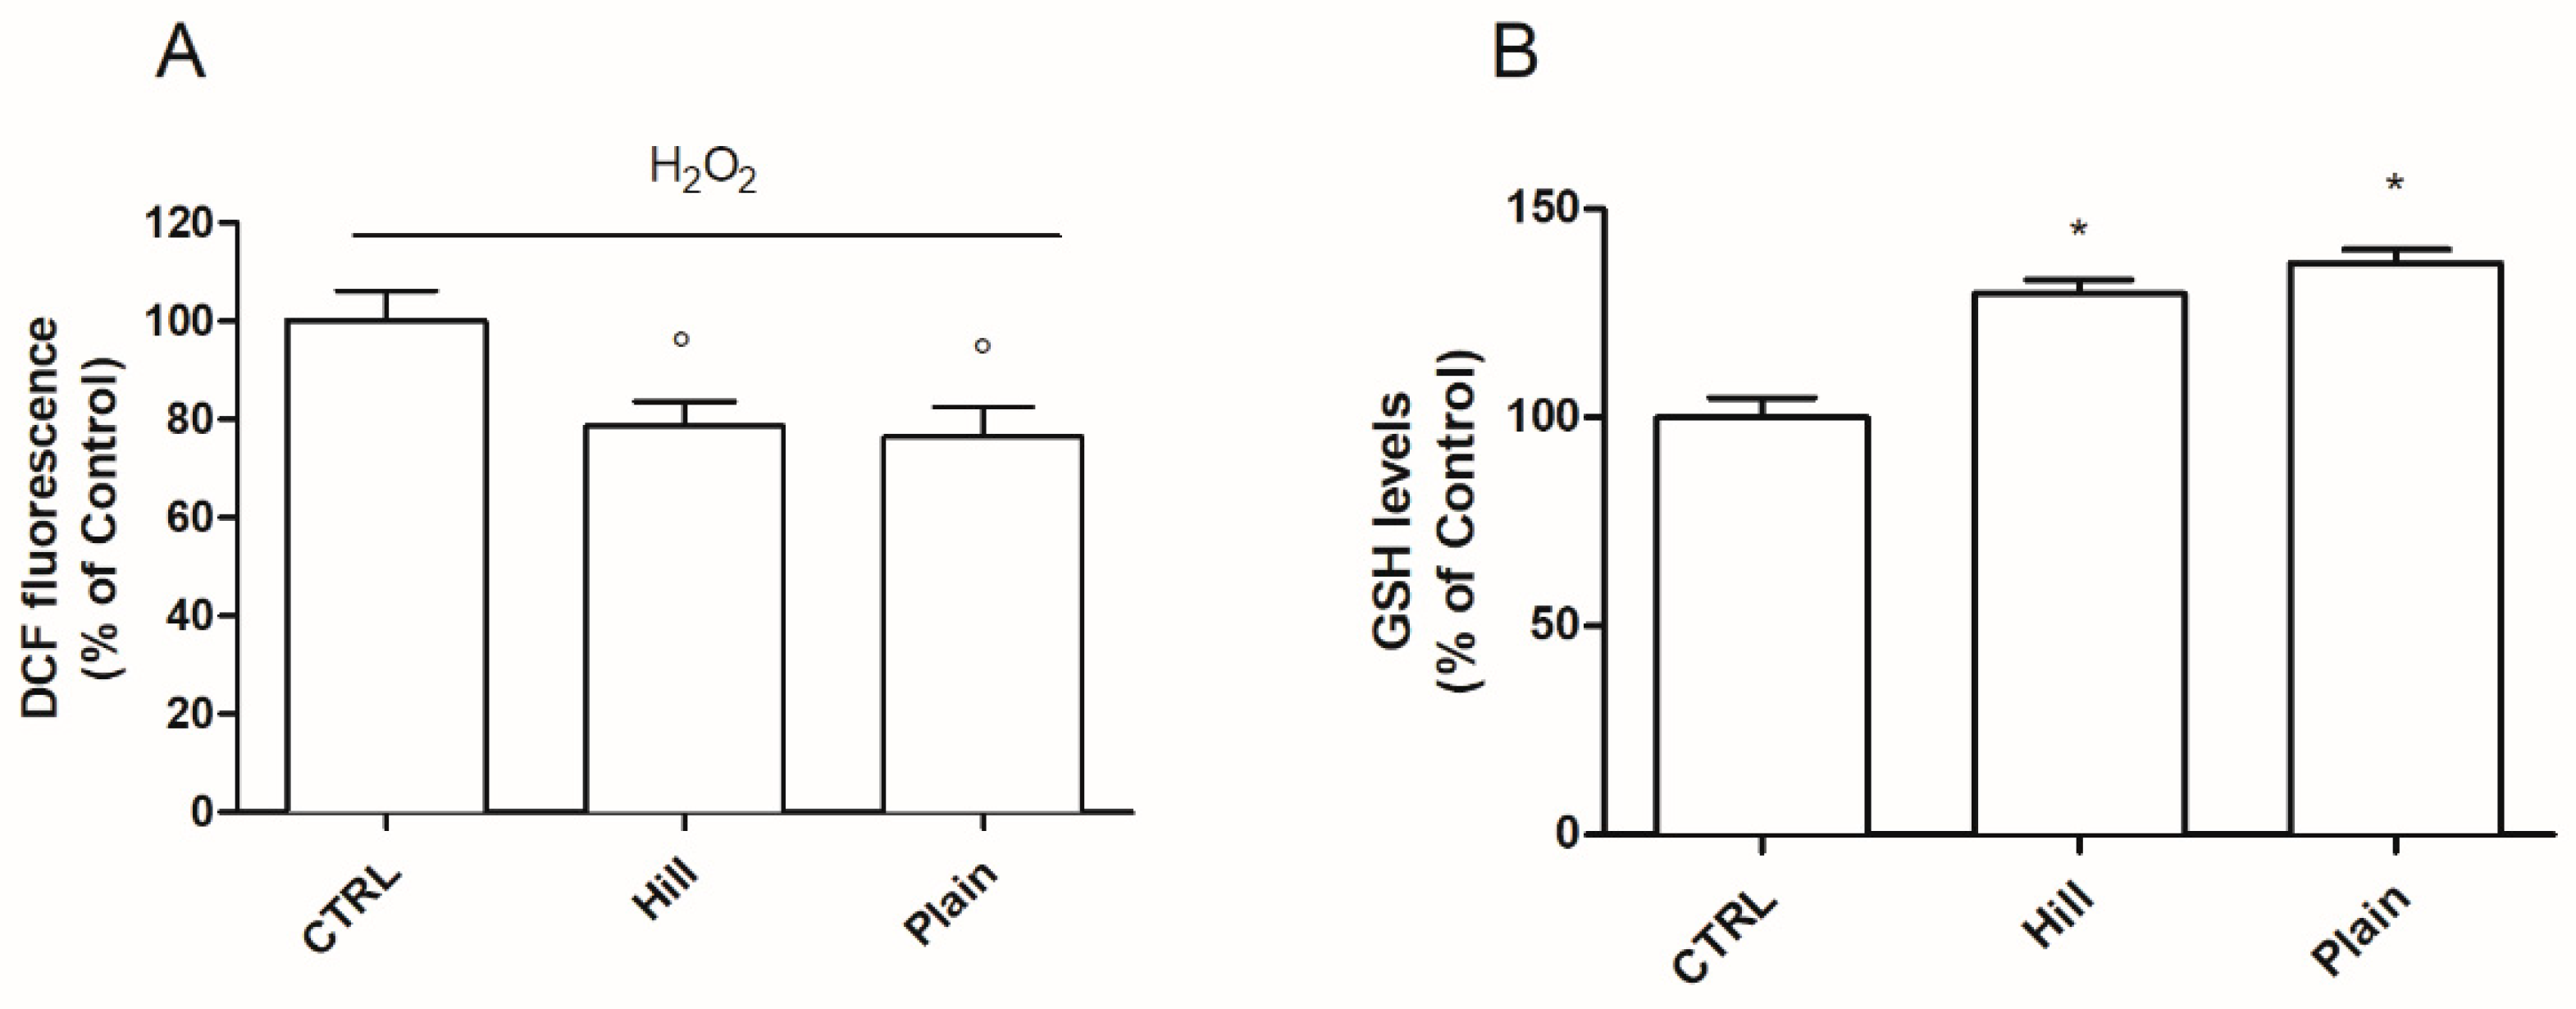
3.3. Antioxidant Properties of Hill and Plain Extracts

The potential antioxidant activity of hill and plain extracts was investigated through the assessment of intracellular ROS and reduced glutathione (GSH) levels, the main endogenous intracellular antioxidant [47] (Figure 3).
The ability of plain and hill extracts to counteract H2O2-induced ROS production was evaluated by the DCFH-DA assay. Differentiated SH-SY5Y cells were treated with 10 µg/mL of hill and plain extracts for 24 h and then exposed to H2O2. As reported in Figure 3A, both extracts significantly reduced ROS levels in respect to H2O2 treated cells. Then, SH-SY5Y cells were treated with EVOO extracts for 24 h and GSH basal levels were measured by the MCB assay (Figure 3B). In agreement with the previous data, both extracts were able to significantly increase GSH levels compared to control cells.

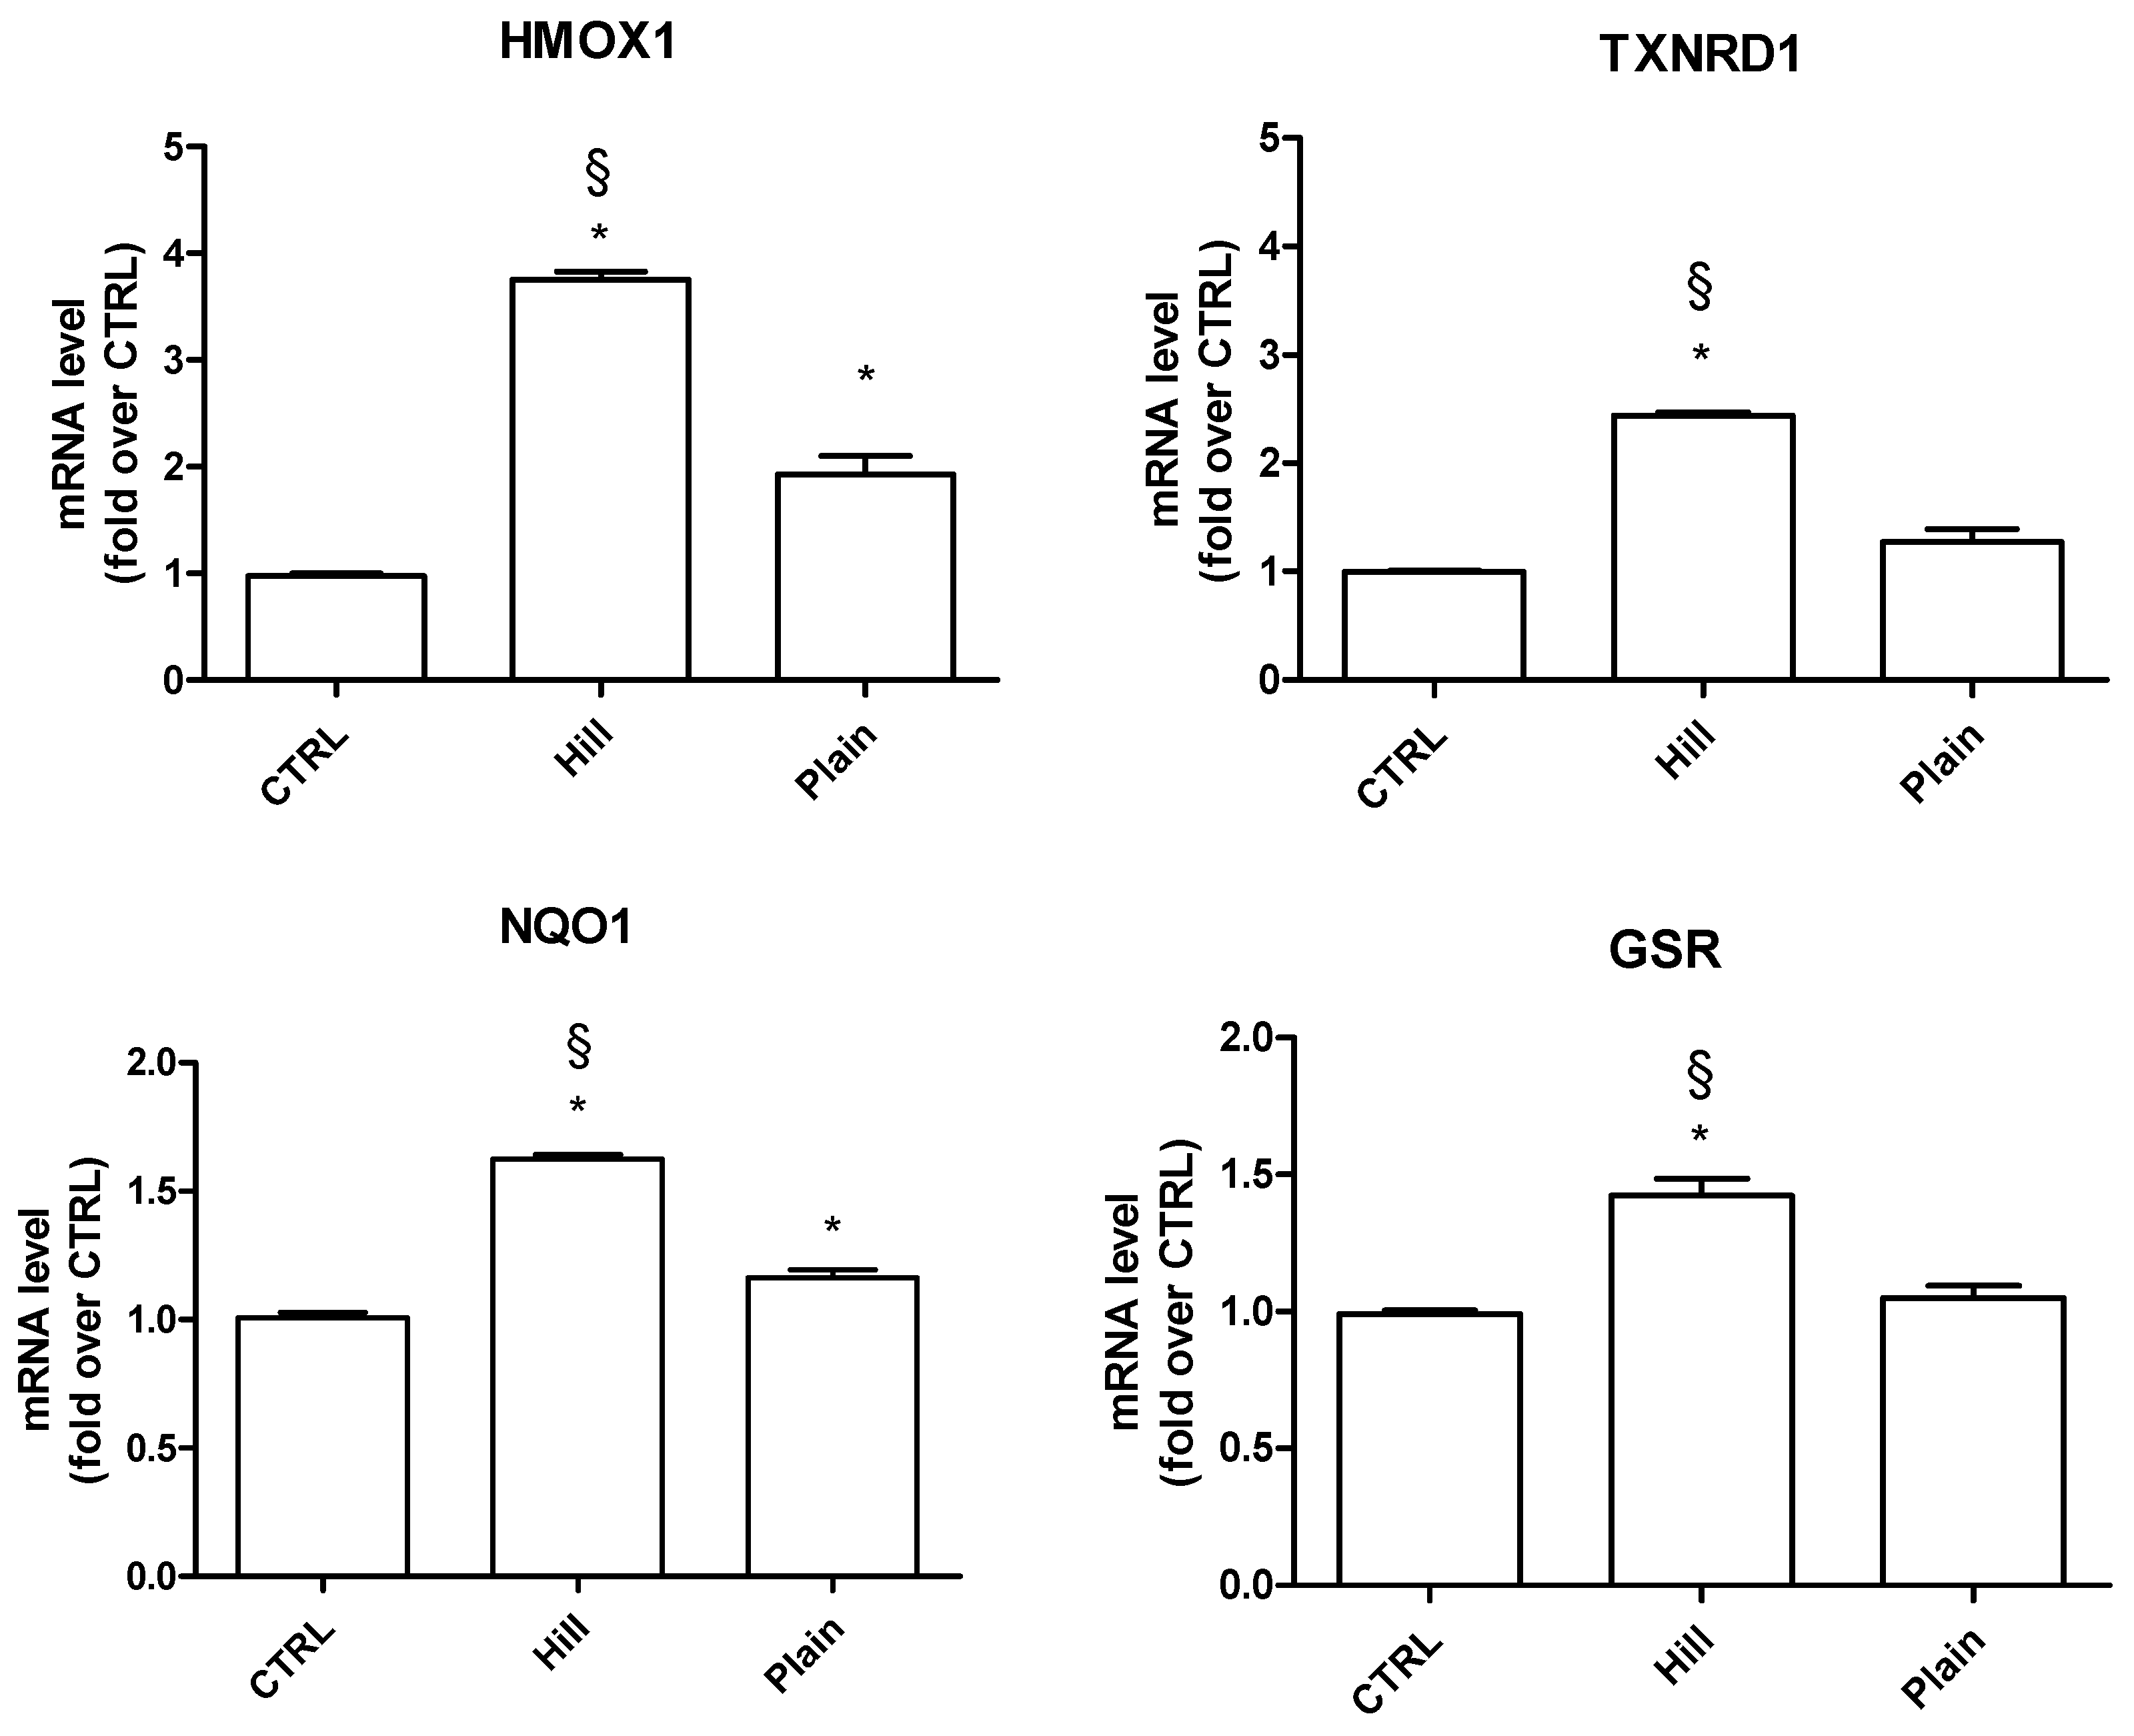
3.4. Modulation of Antioxidant and Pro-Survival Genes by Plain and Hill Extracts

Since the hill extract demonstrated a higher neuroprotective activity against oxidative stress compared to the plain extract, we next drilled down the mechanism underlying such protection.
To this purpose, we measured the expression of Nrf2-driven antioxidant genes, heme oxygenase 1 (HMOX1), thioredoxin reductase 1 (TXNRD1), NADPH quinone oxidoreductase 1 (NQO1) and glutathione reductase (GSR) in SH-SY5Y cells after treatment with the extracts (Figure 4). The plain extract was able to significantly increase the expression of HMOX1 and NQO1 genes in respect to control cells. On the other hand, the hill extract not only significantly upregulated all four of the genes in respect to control, but it also significantly increased their expression in respect to the plain extract, suggesting a higher ability of the hill extract to enhance the antioxidant defense system.
Since neurotrophins, such as BDNF, play a fundamental role in neuronal survival [19], we investigated the effect of the treatment with the extracts on BDNF gene expression (Figure 5). Once again, the hill extract demonstrated a higher bioactivity significantly upregulating BDNF gene in respect both to control and plain extract treated cells. The plain extract did not influence the expression of this neurotrophin.

3.5. Protein Expression Analysis

Figure 6A illustrates a representative two-dimensional electrophoresis (2DE) image of differentiated SH-SY5Y cell proteins. An average of 1220 ± 120 spots was found within a nonlinear pH range from 3 to 10. Comparative analysis was performed between hill or plain extract treated and control cell samples. Venn diagram (Figure 6B) shows the number of common and exclusive proteins between the two comparisons. One-hundred fifteen protein spots were found differentially expressed in hill extract treated cells with comparison to control cells, of which 26 spots were also differentially expressed in plain extract treated cells compared to control cells. Spots, which showed a significant fold change of expression ≥ 1.2 were subsequently subjected to nano-LC-ESI-MS/MS analysis and identified. Table 4 reports the list of identified proteins, which are exclusive of hill extract treated cells together with their MW, pI, peptides and coverage values of MS/MS, ratio and p values. A list of common proteins both to hill and plain extract treated cells is shown in Table 5. More than one identification was reported for some spots when MW and pI were not distinguishable.

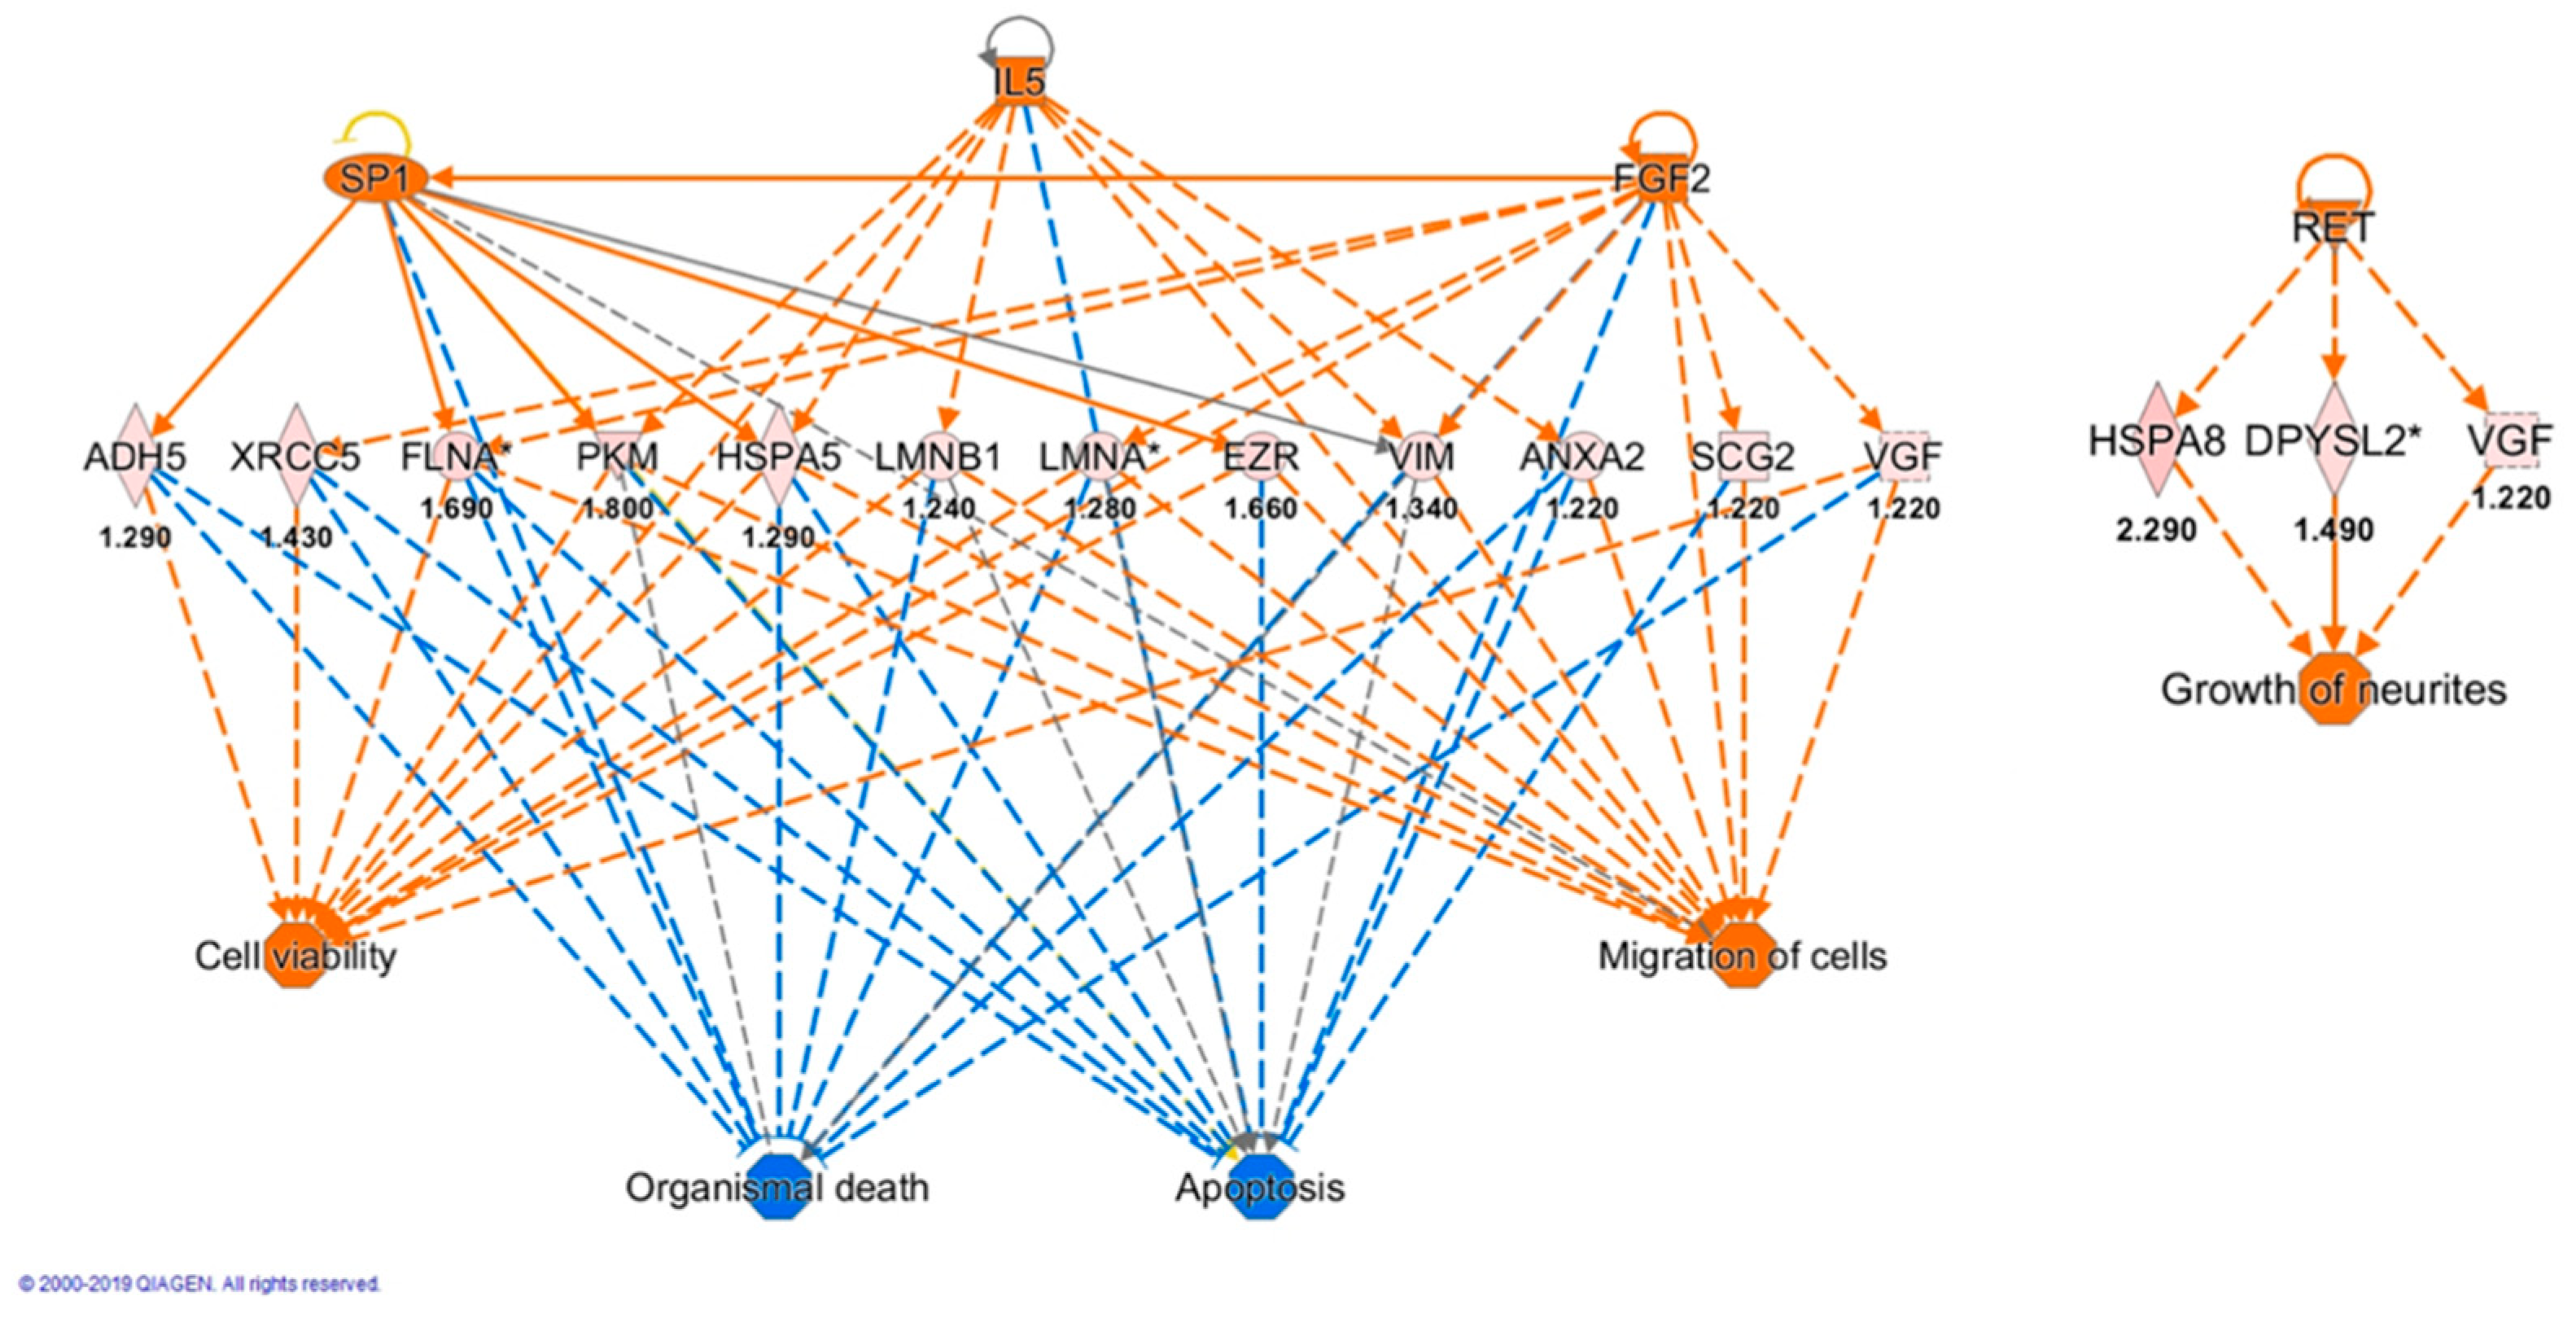
3.6. Bioinformatic Analysis

Using both PANTHER gene classification and Ingenuity Pathway Analysis (IPA) software, we found that the main biological processes, in which the deregulated proteins of hill and plain extract treated SH-SY5Y cells are involved, included “biogenesis,” “metabolic process”, and “cellular process.”
All proteins found differentially expressed in hill extract treated cells were analyzed by IPA to discover the most enriched canonical pathways, possible upstream regulators and downstream effects. The software generated two main networks, “Gene expression, RNA damage and repair, RNA post-transcriptional modifications” and “Cellular development, cellular growth and proliferation, nervous system development and function” with 46 and 32 score values, respectively.
The downstream analysis unveiled key biological and cellular functions such as organismal survival, nervous system development, cell death and survival, gene expression and RNA damage and repair. Moreover, all proteins found differentially expressed concurred in an upstream analysis to predict activation or inhibition of potential transcription factors or molecules. Table 6 shows a list of top upstream regulators based on p-value. Moreover, an algorithm connection among upstream regulators, data set molecules and downstream functions or diseases, generated four main regulators with high consistency scores. The following regulators, fibroblast growth factor 2 (FGF2), interleukin-5 (IL5) and transcription factor Sp1 (SP1) revealed that the functional categories most impacted by the presence of the hill EVOO extracts were apoptosis, organismal death, cell viability and migration with consistency score of 13568 (Figure 7). This analysis presumed SP1, IL5 and FGF2 activate 5 to 7 proteins and 2 functions (cell viability and migration) whereas they inhibit organismal death and apoptosis. In addition, the proto-oncogene tyrosine-protein kinase receptor (RET) regulator leads to activation of neurite growth (consistency score = 1732) through increased expression of dihydropyrimidinase-related protein 2 (DPYSL2), heat shock protein A8 (HSPA8) and neurosecretory protein VGF (VGF) (Figure 7). RET regulator also activates RET itself.

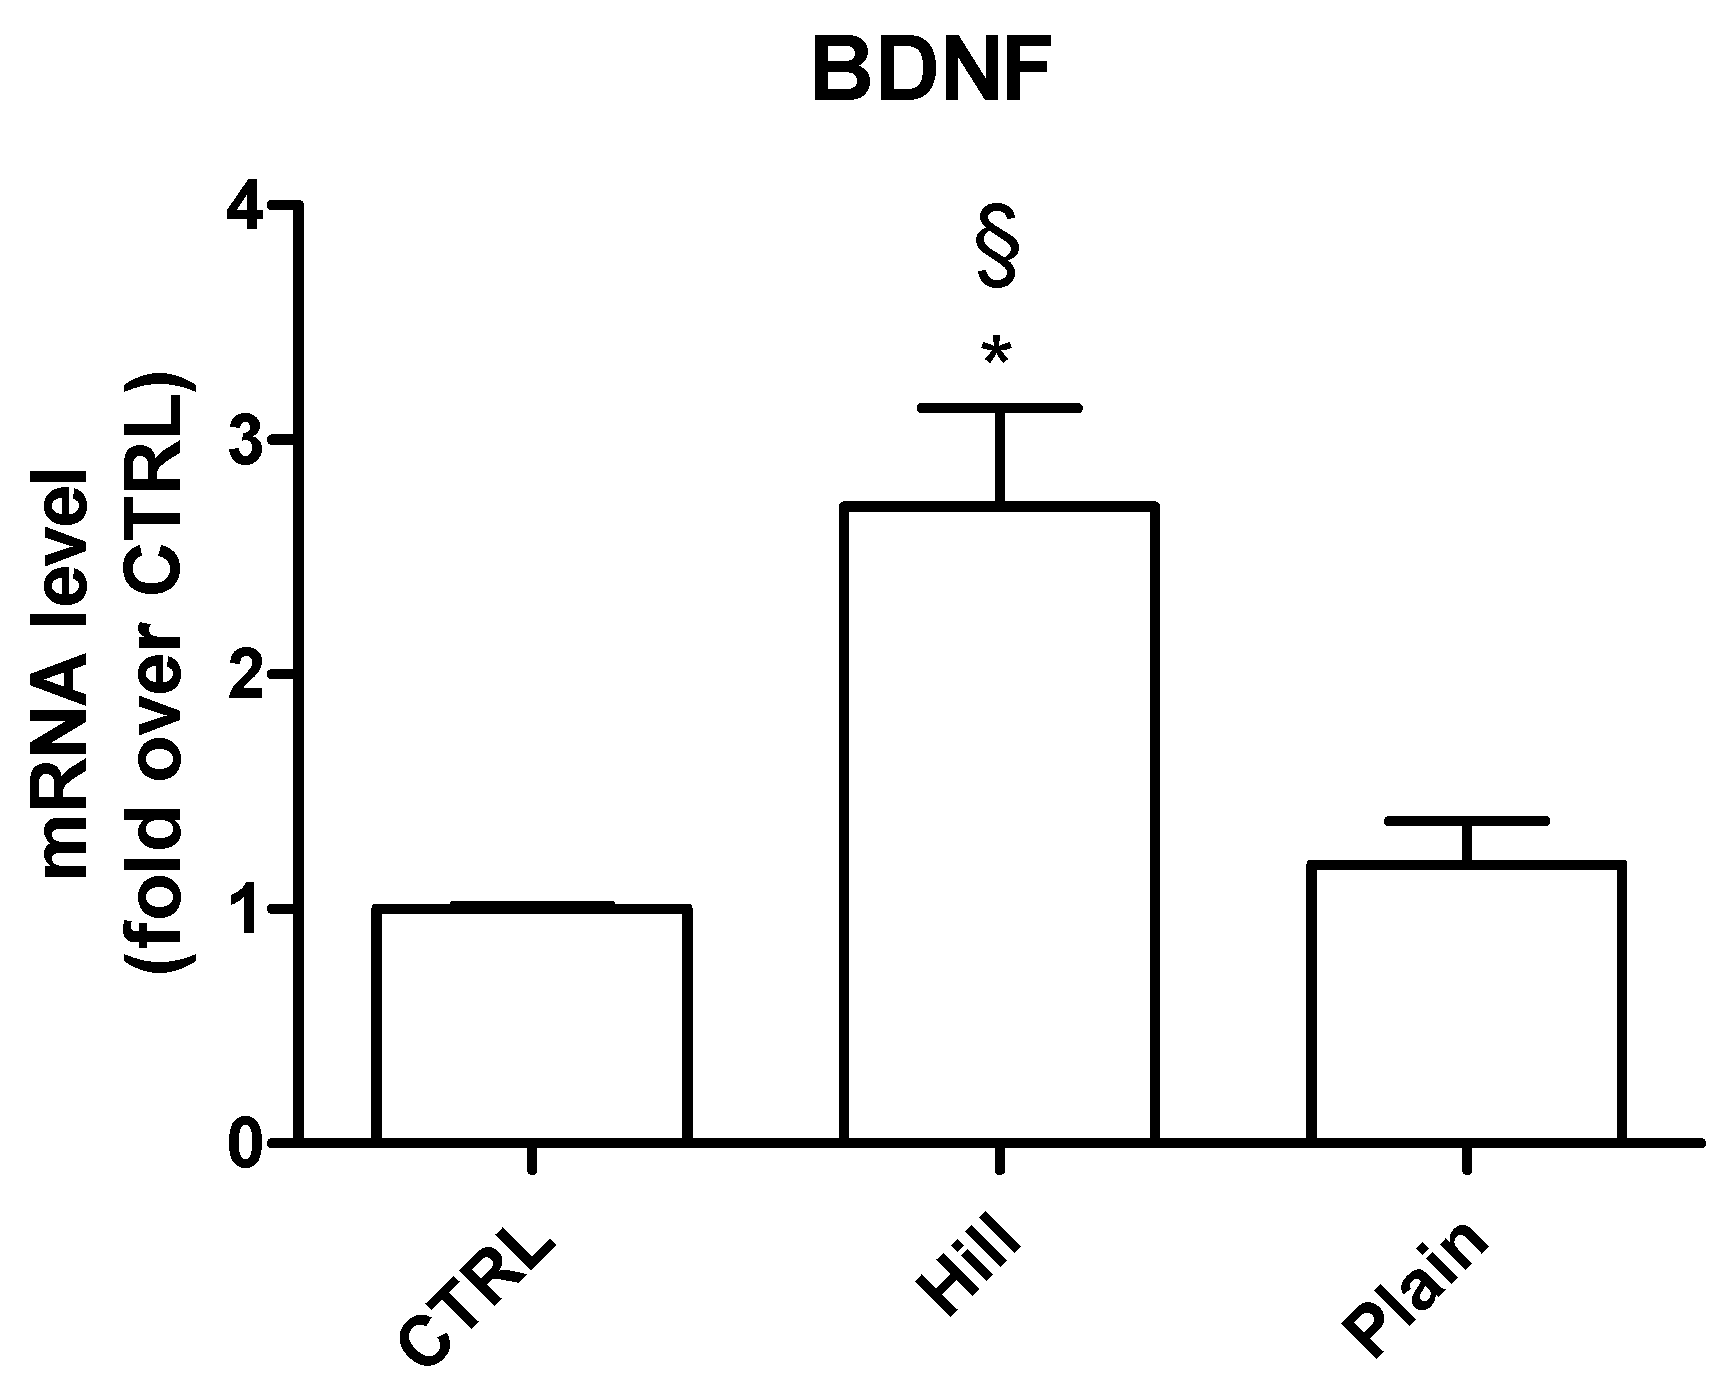
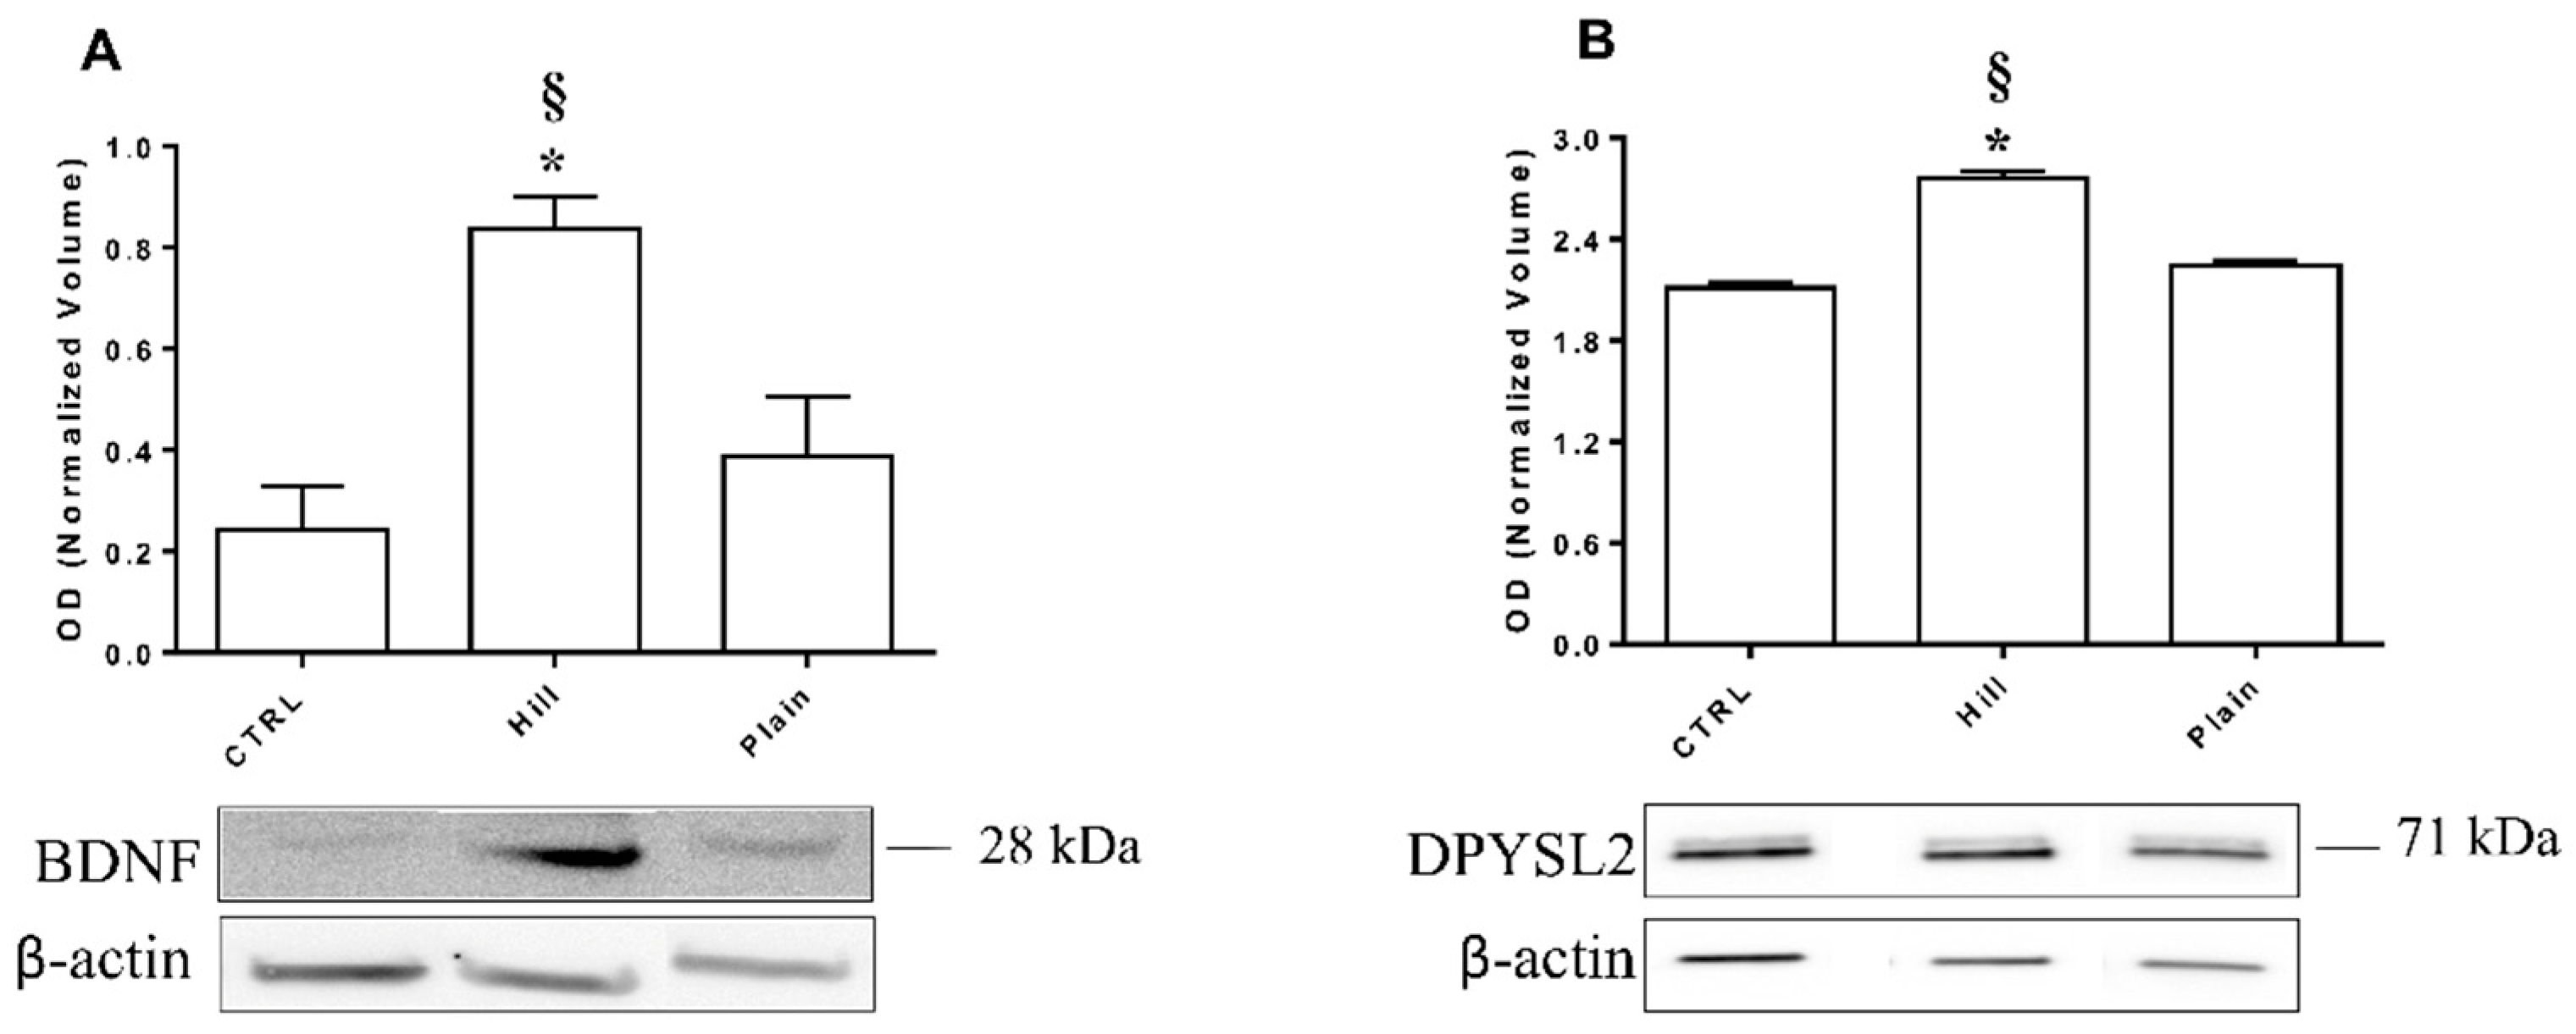
3.7. Validation of BDNF and DPYSL2 Expression in SH-SY5Y Cells Treated with Hill and Plain EVOO Extracts

Western blot analysis was used to validate the different expression level of the BDNF protein in hill and plain extract treated cells as suggested by RT-PCR data. Moreover, the different expression level of DPYSL2 was assayed to validate 2DE data. For each tested protein, the optical density of the immunoreactive band was normalized by the optical density of the β-actin immunoreactive band. Representative immunoblots and bar graphs of normalized density values are shown in Figure 8. A single immunoreactive band with apparent molecular weight of approximately 28 kDa and 71 kDa was obtained for BDNF and DPYSL2, respectively. In particular, the protein recognized by the anti-BDNF antibody likely corresponds to unglycosilated pre-pro-BDNF. BDNF and DPYSL2 expression was affected by cell treatment with EVOO extracts, but only the hill extract caused a significant increased expression of BDNF compared both to control and plain extract. On the other hand, both EVOO extracts were able to significantly increase DPYSL2 expression (p < 0.001) compared to control.

4. Discussion

Quercetano is an endemic cultivar typical of a specific area of Tuscany named “Piana Versiliese”. Quercetano is a millennial tree characterized by small fruits resistant to olive fly thanks to their slow maturation. Due to the characteristics of “Piana Versiliese” Quercetano olive trees grow both in the hill and plain and are influenced by changes in microclimate, soil composition and water availability. Here, we report the characterization of two Quercetano EVOO extracts, hill and plain and their different neuroprotective activity in SH-SY5Y cells.
The different geographical origin of the orchards influenced both the total phenol content and the quantity of single phenols. These results are in agreement with other studies that evidenced how environmental factors such as temperature, soil moisture, water status, light and nitrogen, affect the biosynthesis of phenols and their bioaccumulation [48,49,50,51].
In particular, the plain extract presented a higher content of phenyl ethyl alcohols, cinnamic acids, oleacein (3,4-DHPEA-EDA) and oleocanthal (p-HPEA-EDA) and flavones, meanwhile hill extract was richer in lignans and oleuropein and ligstroside aglycons derivatives (3,4-DHPEA-EA and p-HPEA-EA, respectively). These data are in agreement with the results of Agiomyrgianaki et al. [52], that investigated the composition of EVOO extracts obtained from olives of the same cultivar grown in different geographical areas of Greece. They observed that the total hydroxytyrosol and lignans, pinoresinol and 1-acetoxytyrosol, were the most influential variables in discriminating the Greek olive oil samples according to the different geographical divisions.
The potential antioxidant activity of the extracts has been investigated using the neuroblastoma cell line SH-SY5Y differentiated with retinoic acid. These cells are considered as neuronal precursors and differentiate into more mature neuronal phenotypes under selected growth conditions such as retinoic acid [53,54]. For this reason, they are widely utilized in in vitro studies to dissect out pathogenetic mechanisms of neurodegenerative disorders [55,56].
Of note, the treatment with both extracts increased cell viability of differentiated SH-SY5Y cells. This effect is probably due to an enhancement of the mitochondrial respiration. In fact, MTT assay measures cell viability in terms of reductive activity as enzymatic conversion of the tetrazolium compound to water insoluble formazan crystals by dehydrogenases occurring in the mitochondria of living cells [57]. This hypothesis is supported by the data of Grewal et al. [58], that demonstrated the treatment with ligstroside and, at a lower extent, with 3,4-DHPEA-EDA enhanced mitochondrial respiration in SH-SY5Y-APP695 cells, a cellular model of early AD.
Both extracts showed a good activity in counteracting H2O2 induced oxidative stress, even if the hill extract was significantly more effective than the plain extract. In particular, the hill extract showed a higher ability to increase cell viability in respect to cells exposed to peroxide and to decrease LDH release. On the other hand, the two extracts had comparable effect in reducing intracellular ROS levels and increasing GSH levels. To better characterize the antioxidant mechanism underpinned by this higher protective activity of the hill extract, we evaluated the expression of four fundamental antioxidant enzymes, namely HMOX1, NQO1, TXNRD1 and GR. HMOX1 catalyzes the degradation of heme to biliverdin, which is subsequently converted to bilirubin by biliverdin reductase and both biliverdin and biliverdin reductase have antioxidant and anti-inflammatory activity [59,60]. NQO1 catalyzes the two-electron reduction of quinones and protects cells from the dangerous effects of semiquinones produced by the one-electron reduction of quinones catalyzed by cytochrome P450 reductase. The semiquinones are known to enter in the redox cycling to generate oxygen free radicals [61]. TXNRD1 is a member of the pyridine nucleotide disulfide oxidoreductase family and catalyzes the reduction of oxidized thioredoxin, using NADPH as the electron donor [62]. Glutathione reductase catalyzes the NADPH-dependent reduction of oxidized glutathione to reduced glutathione and plays a key role in providing adequate levels of reduced GSH [63]. Interestingly, the expression of these antioxidant enzymes is regulated by nuclear factor erythroid 2-related factor 2 (Nrf2) through the binding to the antioxidant response elements (ARE), a characteristic sequence present in the promoter region of antioxidants and phase II enzymes including HMOX1, NQO1, TXNRD1 and GSR [64,65,66]. The hill extract demonstrated a markedly higher ability in boosting up the endogenous antioxidant defense system in respect to the plain extract. Indeed, the hill extract upregulated all four enzymes meanwhile the plain extract just slightly increased the expression of HMOX1 and NQO1. We hypothesize that the different effects of the extracts on the expression of these enzymes could be related to their different phenol composition. The hill extract is characterized by a higher content of the lignans, pinoresinol and acetoxypinoresinol, oleuropein aglycone and ligstroside aglycon. Li et al. [67] showed pinoresinol activates the transcription factor Nrf2 and, in agreement with our data, increases the expression of one of its downstream targets, NQO1. Ligstroside derivatives belong to the secoiridoid class of biophenols, which are molecules exclusively present in plants belonging to the Olearaceae group including Olea europaea [68]. In SH-SY5Y-APP695 cells, Grewal et al. [58] demonstrated ligstroside increases the activity of glutathione peroxidase 1, another downstream target of Nrf2 suggesting the higher expression of antioxidant enzymes induced by the hill extract could be associated to a higher presence of compounds able to activate the Nrf2 pathway. Other plant-derived compounds including curcumin, sulforaphane, gamma oryzanol and resveratrol exert neuroprotective and antioxidant activity via Nrf2 [69,70,71,72]. Gamma oryzanol, in particular, could be considered for future studies in comparison to EVOOs since found mainly in rice bran oil.
Moreover, the hill extract, but not the plain extract, significantly increased the expression of BDNF. The neurotrophin BDNF is one of the most studied and well characterized neurotrophic factor in the CNS. BDNF interacts with tropomyosin-related kinase B (TrkB) and p75 cellular receptors and supports maintenance of normal brain function, neurite outgrowth and synaptic plasticity [73,74]. Several lines of evidence indicate BDNF levels play an important role in the pathogenesis of several neurodegenerative diseases, including Alzheimer’s disease (AD) [75]. In the brain of AD patients or aged subjects, BDNF expression levels are lower compared with healthy subjects [76,77]. In vitro, BDNF protects neurons against Aβ1–42 and Aβ25–35 induced toxicity [78] and promotes the de-phosphorylation of tau protein [79].
Given the higher neuroprotective activity shown by the hill in respect to the plain extract in SH-SY5Y cells, we performed a proteomic analysis to identify further molecular pathways modulated by these extracts. Proteomic data suggested a beneficial effect of both extracts. In fact, both hill and plain extracts induced differential expression of proteins belonging to categories involved in metabolic and cellular processes, biogenesis and cellular component organization and response to stimulus. Particularly, an increase of proteins involved in redox balance, antioxidant defenses (CS, NDUFAF7, UQCRC2) and mitochondrial morphology (IMMT) was observed while cancer promotion proteins (DIABLO, TCPT) decreased. These expression changes agree with our functional results and documented roles of EVOO polyphenols in protecting neuronal cells [80]. Indeed, these polyphenols possess the ability to restore the redox balance and hence, the optimal neuronal function, not only as antioxidants but also as mild pro-oxidants, with ensuing upregulation of cell antioxidant defenses [80]. In consideration of the major proteome changes induced by treating SH-SY5Y cells with the hill extract, we focused our attention on related findings. In cells treated with the hill extract, a large part of the eighty-nine exclusive deregulated proteins belongs to classes of RNA binding, translational and cytoskeletal proteins. Of note, the highest expression increase was observed for proteins, which are involved in cytoplasmic RNA trafficking, pre-mRNA splicing (HNRNPA3, NONO) and neuronal differentiation and maintenance (ELAVL3). IPA enrichment analysis unveiled cellular processes and components affected by the hill EVOO extract. In particular, IPA revealed inhibition of such signaling cascades as those triggered by eNOS, VEGF and ILK suggested the hill extract components were able to induce a deregulation of neuronal cell proteins able to counteract oxidative stress, proliferative and angiogenetic effects potentially promoted by their activation. On the other hand, IPA analysis also revealed activation of Unfolded Protein Response (UPR) and BAG2 pathways, resulting from enhanced transcription of ER chaperones (HSPA1A/HSPA1B, HSPA4, HSPA5, HSPA8), folding enzymes (UBQLN2) and other components of the protein degradation machinery (PSMA2, PSMD2) therefore, suggesting a potential role of the hill extract in reducing the accumulation of misfolded proteins. In addition, IPA upstream regulator analysis pointed out activation of four main regulators (FGF2, IL5, SP1 and RET) with high confidence score. Specifically, FGF2, IL5 and SP1, through twelve target proteins, promote cell viability and migration and, on the other side, inhibit apoptosis and organismal death confirming the protective role of hill extract. In addition, a regulatory role of SP1 for neuronal development and synaptogenesis has been suggested in mice astrocytes [81].
Further to this point, RET regulator activation suggested by overexpression of dihydropyrimidinase-related protein 2 (DPYSL2), neurosecretory protein VGF (non-acronymic) and heat shock cognate 71 kDa protein (HSPA8) induced activation of neurite growth function, also called neuritogenesis. Neuritogenesis is a complex task regulated by an interplay of various neurotrophic factors. Recently, Moutinho et al. [82] have demonstrated that a human VGF-derived antidepressant neuropeptide promotes neurite outgrowth in SH-SY5Y cells in association with BDNF suggesting the important role of these peptides in neuroplasticity linked with learning, memory, depression and chronic pain. Moreover, overexpression of DPYSL2 can induce neural stem cells to differentiate into neurons. In fact, DPYSL2 is considered a novel regulator for neural stem cell differentiation in rats playing a pivotal role in neuronal development and polarity [83]. Similar effects have been also described for the above mentioned ELAVL3. Indeed, Ogawa et al. [84] observed a Elavl3-/- mouse model develops a deficit in axonal transport, abnormalities in neuronal polarity of Purkinje cells and a slowly progressive axonal degeneration. Therefore, the increase of VGF, DPYSL2 and ELAVL3 observed in our cells suggests the hill extract may favor a reprogramming of neuronal cells to activate the neurogenesis machinery which, in turn, may promote a protection from neuronal injury. Concerning neurogenesis, a positive synergic effect of FGF2 and BDNF has been described in dopaminergic motoneurons [85]. In animal models of Parkinson’s disease (PD), BDNF enhances the survival of dopaminergic neurons, improves dopaminergic neurotransmission and motor performance [86]. Moreover, as previously underlined, neurotrophins prevent cell death and support neuronal proliferation and maturation enhancing both growth and function of affected neurons in Alzheimer’s disease (AD) and PD [75,86,87]. Despite the under threshold of BDNF z-score value derived by IPA, both transcript and protein expression analysis by PCR and WB confirmed a significant increase of the neurotrophic factor expression in SH-SY5Y cells treated with the hill extract.
Overall, these results suggest a peculiar effect of the hill compared to the plain extract, particularly for triggering the over-expression of key antioxidant enzymes, regulating the expression of proteins involved in neuronal plasticity and potentially activating neurotrophic factors. Both quality and particularity of EVOO depend on several factors [88,89,90] and among them the cultivar is the main. However, we demonstrated that the environmental conditions and soil can deeply affect even the composition of EVOOs obtained from the same cultivar. In respect to the polar polyphenolic composition, the hill extract was characterized by a higher percentage of lignanes and of two secoiridos, namely 3,4-DHPEA-EA and p-HPEA-EA, even if the plain extract contains a higher percentage of total secoiridoids.
Recent evidence suggests a correlation between specific components of extracts and neuronal plasticity. Yu et al. [91] observed that lignan pinoresinol improves memory impairment in a mouse model of dementia influencing the regulatory mechanisms involved in synaptic plasticity, thus making it a promising candidate agent to treat AD. In addition, a neuroprotective and anti-inflammatory activity of pure lignans or lignans extracted from Viburnum erosum have been described [92]. Moreover, different studies [58,93,94,95] have described the comparable effects of secoiridoids. In fact, ligstroside-fed mice show improved spatial working memory and enhanced cognitive function [58]. In addition, both in aged and early AD mice, ligstroside expands the lifespan with outstanding performance on mitochondrial bioenergetics [58]. Finally, a role of oleuropein aglycone on α-synuclein aggregation has been reported [94]. Indeed, a recent study has highlighted oleuropein aglycone stabilizes the monomeric α-synuclein and favors the growth of non-toxic aggregates [94]. The evidence reported in literature, which assign lignans and secoiridoids among promising candidates to treat brain disorders, are in line with molecular and function changes observed in SH-SY5Y cells treated with the hill EVOO extract.

5. Conclusions

Our data highlight the impact of climatic areas on EVOO phenolic composition and, consequently, how this influences the antioxidant and neuroprotective effects of EVOO extracts. In particular, the hill EVOO extract was more effective in counteracting the oxidative stress and boosting up the endogenous antioxidant system in respect to the plain EVOO extract. Moreover, proteomic analysis revealed that the hill extract also modulates important molecular pathways related to neuronal survival and neurogenesis. Future studies are needed to characterize the role of individual compounds whose content is significantly higher in hill extract, in respect to the plain extract, in the biological activity observed.

Author Contributions

Conceptualization, A.L., S.H., L.G. and C.A.; Data curation, L.Z., M.R.M. and D.F.; Formal analysis, M.C.B., L.G. and C.A.; Funding acquisition, S.H. and M.R.M.; Investigation M.C.B., L.Z., D.B., M.R., S.S., M.D., M.M., D.F., L.G. and C.A.; Supervision, L.G. and C.A.; Writing—original draft, M.C.B., L.G. and C.A.; Writing—review and editing, M.R.M., A.L. and S.H. All authors have read and agreed to the published version of the manuscript.

Funding

This research was funded by MIUR-PRIN 2015, grant number 20152HKF3Z and RFO 2019 University of Bologna to Silvana Hrelia.

Institutional Review Board Statement

Not applicable.

Informed Consent Statement

Not applicable.

Data Availability Statement

The data used to support the findings of this study are available upon request to the authors.

Acknowledgments

Our deepest gratitude goes to “Presidio e comunità slow food dell’olivo Quercetano” and “ELAIA-Associazione Olivicoltori apuo versiliesi” for their support and to Cristina Ronchieri and Nicola Guicciardi for donating us hill and plain EVOOs, respectively.

Conflicts of Interest

The authors declare no conflict of interest.

References

  1. Bennett, J.E.; Stevens, G.A.; Mathers, C.D.; Bonita, R.; Rehm, J.; Kruk, M.E.; Riley, L.M.; Dain, K.; Kengne, A.P.; Chalkidou, K.; et al. NCD Countdown 2030: Worldwide trends in non-communicable disease mortality and progress towards Sustainable Development Goal target 3.4. Lancet 2018, 392, 1072–1088. [Google Scholar] [CrossRef] [Green Version]
  2. De Simone, A.; Bartolini, M.; Baschieri, A.; Apperley, K.Y.P.; Chen, H.H.; Guardigni, M.; Montanari, S.; Kobrlova, T.; Soukup, O.; Valgimigli, L.; et al. Hydroxy-substituted trans-cinnamoyl derivatives as multifunctional tools in the context of Alzheimer’s disease. Eur. J. Med. Chem. 2017, 139, 378–389. [Google Scholar] [CrossRef]
  3. Minarini, A.; Milelli, A.; Tumiatti, V.; Rosini, M.; Simoni, E.; Bolognesi, M.L.; Andrisano, V.; Bartolini, M.; Motori, E.; Angeloni, C.; et al. Cystamine-tacrine dimer: A new multi-target-directed ligand as potential therapeutic agent for Alzheimer’s disease treatment. Neuropharmacology 2012, 62, 997–1003. [Google Scholar] [CrossRef] [PubMed]
  4. Féart, C.; Samieri, C.; Barberger-Gateau, P. Mediterranean diet and cognitive function in older adults. Curr. Opin. Clin. Nutr. Metab. Care 2010, 13, 14–18. [Google Scholar] [CrossRef] [Green Version]
  5. Feart, C.; Samieri, C.; Barberger-Gateau, P. Mediterranean diet and cognitive health: An update of available knowledge. Curr. Opin. Clin. Nutr. Metab. Care 2015, 18, 51–62. [Google Scholar] [CrossRef] [PubMed]
  6. Motori, E.; Puyal, J.; Toni, N.; Ghanem, A.; Angeloni, C.; Malaguti, M.; Cantelli-Forti, G.; Berninger, B.; Conzelmann, K.K.; Götz, M.; et al. Inflammation-induced alteration of astrocyte mitochondrial dynamics requires autophagy for mitochondrial network maintenance. Cell Metab. 2013, 18, 844–859. [Google Scholar] [CrossRef] [PubMed] [Green Version]
  7. Beal, M.F. Energetics in the pathogenesis of neurodegenerative diseases. Trends Neurosci. 2000, 23, 298–304. [Google Scholar] [CrossRef]
  8. Epstein, F.H.; Lipton, S.A.; Rosenberg, P.A. Excitatory Amino Acids as a Final Common Pathway for Neurologic Disorders. N. Engl. J. Med. 1994, 330, 613–622. [Google Scholar] [CrossRef]
  9. Merad-Boudia, M.; Nicole, A.; Santiard-Baron, D.; Saillé, C.; Ceballos-Picot, I. Mitochondrial impairment as an early event in the process of apoptosis induced by glutathione depletion in neuronal cells: Relevance to Parkinson’s disease. Biochem. Pharmacol. 1998, 56, 645–655. [Google Scholar] [CrossRef]
  10. Hensley, K.; Carney, J.M.; Mattson, M.P.; Aksenova, M.; Harris, M.; Wu, J.F.; Floyd, R.A.; Butterfield, D.A. A model for β-amyloid aggregation and neurotoxicity based on free radical generation by the peptide: Relevance to Alzheimer disease. Proc. Natl. Acad. Sci. USA 1994, 91, 3270–3274. [Google Scholar] [CrossRef] [Green Version]
  11. Liu, Z.; Zhou, T.; Ziegler, A.C.; Dimitrion, P.; Zuo, L. Oxidative Stress in Neurodegenerative Diseases: From Molecular Mechanisms to Clinical Applications. Oxid. Med. Cell. Longev. 2017, 2017. [Google Scholar] [CrossRef]
  12. Wang, X.; Wang, W.; Li, L.; Perry, G.; Lee, H.G.; Zhu, X. Oxidative stress and mitochondrial dysfunction in Alzheimer’s disease. Biochim. Biophys. Acta Mol. Basis Dis. 2014, 1842, 1240–1247. [Google Scholar] [CrossRef] [Green Version]
  13. Butterfield, D.A.; Di Domenico, F.; Barone, E. Elevated risk of type 2 diabetes for development of Alzheimer disease: A key role for oxidative stress in brain. Biochim. Biophys. Acta Mol. Basis Dis. 2014, 1842, 1693–1706. [Google Scholar] [CrossRef] [Green Version]
  14. Angeloni, C.; Malaguti, M.; Barbalace, M.C.; Hrelia, S. Bioactivity of olive oil phenols in neuroprotection. Int. J. Mol. Sci. 2017, 18, 2230. [Google Scholar] [CrossRef] [Green Version]
  15. Hrelia, P.; Sita, G.; Ziche, M.; Ristori, E.; Marino, A.; Cordaro, M.; Molteni, R.; Spero, V.; Malaguti, M.; Morroni, F.; et al. Common Protective Strategies in Neurodegenerative Disease: Focusing on Risk Factors to Target the Cellular Redox System. Oxid. Med. Cell. Longev. 2020, 2020. [Google Scholar] [CrossRef]
  16. Kobayashi, M.; Yamamoto, M. Molecular mechanisms activating the Nrf2-Keap1 pathway of antioxidant gene regulation. Antioxid. Redox Signal. 2005, 7, 385–394. [Google Scholar] [CrossRef] [PubMed]
  17. Itoh, K.; Chiba, T.; Takahashi, S.; Ishii, T.; Igarashi, K.; Katoh, Y.; Oyake, T.; Hayashi, N.; Satoh, K.; Hatayama, I.; et al. An Nrf2/small Maf heterodimer mediates the induction of phase II detoxifying enzyme genes through antioxidant response elements. Biochem. Biophys. Res. Commun. 1997, 236, 313–322. [Google Scholar] [CrossRef] [PubMed]
  18. Venugopal, R.; Jaiswal, A.K. Nrf1 and Nrf2 positively and c-Fos and Fra1 negatively regulate the human antioxidant response element-mediated expression of NAD(P)H:quinone oxidoreductase1 gene. Proc. Natl. Acad. Sci. USA 1996, 93, 14960–14965. [Google Scholar] [CrossRef] [Green Version]
  19. Sampaio, T.B.; Savall, A.S.; Gutierrez, M.E.Z.; Pinton, S. Neurotrophic factors in Alzheimer’s and parkinson’s diseases: Implications for pathogenesis and therapy. Neural Regen. Res. 2017, 12, 549–557. [Google Scholar] [PubMed]
  20. Holsinger, R.M.D.; Schnarr, J.; Henry, P.; Castelo, V.T.; Fahnestock, M. Quantitation of BDNF mRNA in human parietal cortex by competitive reverse transcription-polymerase chain reaction: Decreased levels in Alzheimer’s disease. Mol. Brain Res. 2000, 76, 347–354. [Google Scholar] [CrossRef]
  21. Phillips, H.S.; Hains, J.M.; Armanini, M.; Laramee, G.R.; Johnson, S.A.; Winslow, J.W. BDNF mRNA is decreased in the hippocampus of individuals with Alzheimer’s disease. Neuron 1991, 7, 695–702. [Google Scholar] [CrossRef]
  22. Michalski, B.; Fahnestock, M. Pro-brain-derived neurotrophic factor is decreased in parietal cortex in Alzheimer’s disease. Mol. Brain Res. 2003, 111, 148–154. [Google Scholar] [CrossRef]
  23. Scarmeas, N.; Stern, Y.; Tang, M.X.; Mayeux, R.; Luchsinger, J.A. Mediterranean diet and risk for Alzheimer’s disease. Ann. Neurol. 2006, 59, 912–921. [Google Scholar] [CrossRef] [Green Version]
  24. Scarmeas, N.; Stern, Y.; Mayeux, R.; Luchsinger, J.A. Mediterranean diet, alzheimer disease, and vascular mediation. Arch. Neurol. 2006, 63, 1709–1717. [Google Scholar] [CrossRef] [Green Version]
  25. Corona, G.; Spencer, J.; Dessì, M. Extra virgin olive oil phenolics: Absorption, metabolism, and biological activities in the GI tract. Toxicol. Ind. Health 2009, 25, 285–293. [Google Scholar] [CrossRef]
  26. Bach-Faig, A.; Berry, E.M.; Lairon, D.; Reguant, J.; Trichopoulou, A.; Dernini, S.; Medina, F.X.; Battino, M.; Belahsen, R.; Miranda, G.; et al. Mediterranean diet pyramid today. Science and cultural updates. Public Health Nutr. 2011, 14, 2274–2284. [Google Scholar] [CrossRef] [PubMed] [Green Version]
  27. Bitler, C.M.; Viale, T.M.; Damaj, B.; Crea, R. Hydrolyzed olive vegetation water in mice has anti-inflammatory activity. J. Nutr. 2005, 135, 1475–1479. [Google Scholar] [CrossRef]
  28. Tripoli, E.; Giammanco, M.; Tabacchi, G.; Di Majo, D.; Giammanco, S.; La Guardia, M. The phenolic compounds of olive oil: Structure, biological activity and beneficial effects on human health. Nutr. Res. Rev. 2005, 18, 98–112. [Google Scholar] [CrossRef]
  29. Giusti, L.; Angeloni, C.; Barbalace, M.C.; Lacerenza, S.; Ciregia, F.; Ronci, M.; Urbani, A.; Manera, C.; Digiacomo, M.; Macchia, M.; et al. A proteomic approach to uncover neuroprotective mechanisms of oleocanthal against oxidative stress. Int. J. Mol. Sci. 2018, 19, 2329. [Google Scholar] [CrossRef] [PubMed] [Green Version]
  30. Cicerale, S.; Conlan, X.A.; Sinclair, A.J.; Keast, R.S.J. Chemistry and health of olive oil phenolics. Crit. Rev. Food Sci. Nutr. 2009, 49, 218–236. [Google Scholar] [CrossRef] [Green Version]
  31. Carrasco-Pancorbo, A.; Cerretani, L.; Bendini, A.; Segura-Carretero, A.; Gallina-Toschi, T.; Fernández-Gutiérrez, A. Analytical determination of polyphenols in olive oils. J. Sep. Sci. 2005, 28, 837–858. [Google Scholar] [CrossRef]
  32. Parkinson, L.; Cicerale, S. The health benefiting mechanisms of virgin olive oil phenolic compounds. Molecules 2016, 21, 1734. [Google Scholar] [CrossRef] [Green Version]
  33. Kalogeropoulos, N.; Tsimidou, M.Z. Antioxidants in greek virgin olive oils. Antioxidants 2014, 3, 387–413. [Google Scholar] [CrossRef] [PubMed] [Green Version]
  34. Di Lecce, G.; Piochi, M.; Pacetti, D.; Frega, N.G.; Bartolucci, E.; Scortichini, S.; Fiorini, D. Eleven monovarietal extra virgin olive oils from olives grown and processed under the same conditions: Effect of the cultivar on the chemical composition and sensory traits. Foods 2020, 9, 904. [Google Scholar] [CrossRef]
  35. Pacetti, D.; Boarelli, M.C.; Giovannetti, R.; Ferraro, S.; Conti, P.; Alfei, B.; Caprioli, G.; Ricciutelli, M.; Sagratini, G.; Fedeli, D.; et al. Chemical and sensory profiling of monovarietal extra virgin olive oils from the italian marche region. Antioxidants 2020, 9, 330. [Google Scholar] [CrossRef] [Green Version]
  36. Polini, B.; Digiacomo, M.; Carpi, S.; Bertini, S.; Gado, F.; Saccomanni, G.; Macchia, M.; Nieri, P.; Manera, C.; Fogli, S. Oleocanthal and oleacein contribute to the in vitro therapeutic potential of extra virgin oil-derived extracts in non-melanoma skin cancer. Toxicol. In Vitro 2018, 52, 243–250. [Google Scholar] [CrossRef] [PubMed] [Green Version]
  37. Palla, M.; Digiacomo, M.; Cristani, C.; Bertini, S.; Giovannetti, M.; Macchia, M.; Manera, C.; Agnolucci, M. Composition of health-promoting phenolic compounds in two extra virgin olive oils and diversity of associated yeasts. J. Food Compos. Anal. 2018, 74, 27–33. [Google Scholar] [CrossRef]
  38. Ricciutelli, M.; Marconi, S.; Boarelli, M.C.; Caprioli, G.; Sagratini, G.; Ballini, R.; Fiorini, D. Olive oil polyphenols: A quantitative method by high-performance liquid-chromatography-diode-array detection for their determination and the assessment of the related health claim. J. Chromatogr. A 2017, 1481, 53–63. [Google Scholar] [CrossRef]
  39. Caprioli, G.; Boarelli, M.C.; Ricciutelli, M.; Sagratini, G.; Fiorini, D. Micro-scaled Quantitative Method to Analyze Olive Oil Polyphenols. Food Anal. Methods 2019, 12, 1133–1139. [Google Scholar] [CrossRef]
  40. Nzekoue, F.K.; Angeloni, S.; Navarini, L.; Angeloni, C.; Freschi, M.; Hrelia, S.; Vitali, L.A.; Sagratini, G.; Vittori, S.; Caprioli, G. Coffee silverskin extracts: Quantification of 30 bioactive compounds by a new HPLC-MS/MS method and evaluation of their antioxidant and antibacterial activities. Food Res. Int. 2020, 133, 109128. [Google Scholar] [CrossRef]
  41. Antognoni, F.; Potente, G.; Mandrioli, R.; Angeloni, C.; Freschi, M.; Malaguti, M.; Hrelia, S.; Lugli, S.; Gennari, F.; Muzzi, E.; et al. Fruit quality characterization of new sweet cherry cultivars as a good source of bioactive phenolic compounds with antioxidant and neuroprotective potential. Antioxidants 2020, 9, 677. [Google Scholar] [CrossRef] [PubMed]
  42. Angeloni, C.; Teti, G.; Barbalace, M.C.; Malaguti, M.; Falconi, M.; Hrelia, S. 17β-Estradiol enhances sulforaphane cardioprotection against oxidative stress. J. Nutr. Biochem. 2017, 42, 26–36. [Google Scholar] [CrossRef] [PubMed]
  43. Angeloni, C.; Malaguti, M.; Rizzo, B.; Barbalace, M.C.; Fabbri, D.; Hrelia, S. Neuroprotective Effect of Sulforaphane against Methylglyoxal Cytotoxicity. Chem. Res. Toxicol. 2015, 28, 1234–1245. [Google Scholar] [CrossRef]
  44. Ciregia, F.; Bugliani, M.; Ronci, M.; Giusti, L.; Boldrini, C.; Mazzoni, M.R.; Mossuto, S.; Grano, F.; Cnop, M.; Marselli, L.; et al. Palmitate-induced lipotoxicity alters acetylation of multiple proteins in clonal β cells and human pancreatic islets. Sci. Rep. 2017, 7. [Google Scholar] [CrossRef] [PubMed] [Green Version]
  45. Ciregia, F.; Giusti, L.; Da Valle, Y.; Donadio, E.; Consensi, A.; Giacomelli, C.; Sernissi, F.; Scarpellini, P.; Maggi, F.; Lucacchini, A.; et al. A multidisciplinary approach to study a couple of monozygotic twins discordant for the chronic fatigue syndrome: A focus on potential salivary biomarkers. J. Transl. Med. 2013, 11. [Google Scholar] [CrossRef] [Green Version]
  46. Ciregia, F.; Giusti, L.; Ronci, M.; Bugliani, M.; Piga, I.; Pieroni, L.; Rossi, C.; Marchetti, P.; Urbani, A.; Lucacchini, A. Glucagon-like peptide 1 protects INS-1E mitochondria against palmitate-mediated beta-cell dysfunction: A proteomic study. Mol. Biosyst. 2015, 11, 1696–1707. [Google Scholar] [CrossRef]
  47. Espinosa-Diez, C.; Miguel, V.; Mennerich, D.; Kietzmann, T.; Sánchez-Pérez, P.; Cadenas, S.; Lamas, S. Antioxidant responses and cellular adjustments to oxidative stress. Redox Biol. 2015, 6, 183–197. [Google Scholar] [CrossRef] [Green Version]
  48. Kubasek, W.L.; Ausubel, F.M.; Shirley, B.W. A light-independent developmental mechanism potentiates flavonoid gene expression in Arabidopsis seedlings. Plant Mol. Biol. 1998, 37, 217–223. [Google Scholar] [CrossRef]
  49. Azuma, A.; Yakushiji, H.; Koshita, Y.; Kobayashi, S. Flavonoid biosynthesis-related genes in grape skin are differentially regulated by temperature and light conditions. Planta 2012, 236, 1067–1080. [Google Scholar] [CrossRef]
  50. Hernández, I.; Alegre, L.; Munné-Bosch, S. Drought-induced changes in flavonoids and other low molecular weight antioxidants in Cistus clusii grown under Mediterranean field conditions. Tree Physiol. 2004, 24, 1303–1311. [Google Scholar] [CrossRef] [Green Version]
  51. Olsen, K.M.; Slimestad, R.; Lea, U.S.; Brede, C.; Løvdal, T.; Ruoff, P.; Verheul, M.; Lillo, C. Temperature and nitrogen effects on regulators and products of the flavonoid pathway: Experimental and kinetic model studies. Plant Cell Environ. 2009, 32, 286–299. [Google Scholar] [CrossRef] [PubMed]
  52. Agiomyrgianaki, A.; Petrakis, P.V.; Dais, P. Influence of harvest year, cultivar and geographical origin on Greek extra virgin olive oils composition: A study by NMR spectroscopy and biometric analysis. Food Chem. 2012, 135, 2561–2568. [Google Scholar] [CrossRef]
  53. Pezzini, F.; Bettinetti, L.; Di Leva, F.; Bianchi, M.; Zoratti, E.; Carrozzo, R.; Santorelli, F.M.; Delledonne, M.; Lalowski, M.; Simonati, A. Transcriptomic Profiling Discloses Molecular and Cellular Events Related to Neuronal Differentiation in SH-SY5Y Neuroblastoma Cells. Cell. Mol. Neurobiol. 2017, 37, 665–682. [Google Scholar] [CrossRef] [PubMed] [Green Version]
  54. Borriello, A.; Cucciolla, V.; Criscuolo, M.; Indaco, S.; Oliva, A.; Giovane, A.; Bencivenga, D.; Iolascon, A.; Zappia, V.; Della Ragione, F. Retinoic acid induces p27 Kip1 nuclear accumulation by modulating its phosphorylation. Cancer Res. 2006, 66, 4240–4248. [Google Scholar] [CrossRef] [Green Version]
  55. Cheung, Y.T.; Lau, W.K.W.; Yu, M.S.; Lai, C.S.W.; Yeung, S.C.; So, K.F.; Chang, R.C.C. Effects of all-trans-retinoic acid on human SH-SY5Y neuroblastoma as in vitro model in neurotoxicity research. Neurotoxicology 2009, 30, 127–135. [Google Scholar] [CrossRef] [PubMed]
  56. Constantinescu, R.; Constantinescu, A.T.; Reichmann, H.; Janetzky, B. Neuronal differentiation and long-term culture of the human neuroblastoma line SH-SY5Y. In Neuropsychiatric Disorders an Integrative Approach; Springer: Vienna, Austria, 2007; pp. 17–28. [Google Scholar]
  57. Mosmann, T. Rapid colorimetric assay for cellular growth and survival: Application to proliferation and cytotoxicity assays. J. Immunol. Methods 1983, 65, 55–63. [Google Scholar] [CrossRef]
  58. Grewal, R.; Reutzel, M.; Dilberger, B.; Hein, H.; Zotzel, J.; Marx, S.; Tretzel, J.; Sarafeddinov, A.; Fuchs, C.; Eckert, G.P. Purified oleocanthal and ligstroside protect against mitochondrial dysfunction in models of early Alzheimer’s disease and brain ageing. Exp. Neurol. 2020, 328, 113248. [Google Scholar] [CrossRef]
  59. Murphy, K.E.; Park, J.J. Can co-activation of Nrf2 and neurotrophic signaling pathway slow Alzheimer’s disease? Int. J. Mol. Sci. 2017, 18, 1168. [Google Scholar] [CrossRef] [PubMed] [Green Version]
  60. Joshi, G.; Johnson, J.A. The Nrf2-ARE pathway: A valuable therapeutic target for the treatment of neurodegenerative diseases. Recent Pat. CNS Drug Discov. 2012, 7, 218–229. [Google Scholar] [CrossRef] [Green Version]
  61. Dinkova-Kostova, A.T.; Abramov, A.Y. The emerging role of Nrf2 in mitochondrial function. Free Radic. Biol. Med. 2015, 88, 179–188. [Google Scholar] [CrossRef] [Green Version]
  62. Park, Y.S.; Misonou, Y.; Fujiwara, N.; Takahashi, M.; Miyamoto, Y.; Koh, Y.H.; Suzuki, K.; Taniguchi, N. Induction of thioredoxin reductase as an adaptive response to acrolein in human umbilical vein endothelial cells. Biochem. Biophys. Res. Commun. 2005, 327, 1058–1065. [Google Scholar] [CrossRef]
  63. Coppola, G.; Choi, S.H.; Santos, M.M.; Miranda, C.J.; Tentler, D.; Wexler, E.M.; Pandolfo, M.; Geschwind, D.H. Gene expression profiling in frataxin deficient mice: Microarray evidence for significant expression changes without detectable neurodegeneration. Neurobiol. Dis. 2006, 22, 302–311. [Google Scholar] [CrossRef] [PubMed] [Green Version]
  64. Klaassen, C.D.; Reisman, S.A. Nrf2 the rescue: Effects of the antioxidative/electrophilic response on the liver. Toxicol. Appl. Pharmacol. 2010, 244, 57–65. [Google Scholar] [CrossRef] [PubMed] [Green Version]
  65. Vauzour, D.; Buonfiglio, M.; Corona, G.; Chirafisi, J.; Vafeiadou, K.; Angeloni, C.; Hrelia, S.; Hrelia, P.; Spencer, J.P.E. Sulforaphane protects cortical neurons against 5-S-cysteinyl-dopamine-induced toxicity through the activation of ERK1/2, NrF-2 and the upregulation of detoxification enzymes. Mol. Nutr. Food Res. 2010, 54, 532–542. [Google Scholar] [CrossRef] [PubMed]
  66. Morris, G.; Walker, A.J.; Walder, K.; Berk, M.; Marx, W.; Carvalho, A.F.; Maes, M.; Puri, B.K. Increasing Nrf2 Activity as a Treatment Approach in Neuropsychiatry. Mol. Neurobiol. 2021. [Google Scholar] [CrossRef]
  67. Li, A.L.; Li, G.H.; Li, Y.R.; Wu, X.Y.; Ren, D.M.; Lou, H.X.; Wang, X.N.; Shen, T. Lignan and flavonoid support the prevention of cinnamon against oxidative stress related diseases. Phytomedicine 2019, 53, 143–153. [Google Scholar] [CrossRef]
  68. Bendini, A.; Cerretani, L.; Carrasco-Pancorbo, A.; Gómez-Caravaca, A.M.; Segura-Carretero, A.; Fernández-Gutiérrez, A.; Lercker, G. Phenolic molecules in virgin olive oils: A survey of their sensory properties, health effects, antioxidant activity and analytical methods. An overview of the last decade. Molecules 2007, 12, 1679–1719. [Google Scholar] [CrossRef]
  69. Dai, W.; Wang, H.; Fang, J.; Zhu, Y.; Zhou, J.; Wang, X.; Zhou, Y.; Zhou, M. Curcumin provides neuroprotection in model of traumatic brain injury via the Nrf2-ARE signaling pathway. Brain Res. Bull. 2018, 140, 65–71. [Google Scholar] [CrossRef]
  70. Tarozzi, A.; Angeloni, C.; Malaguti, M.; Morroni, F.; Hrelia, S.; Hrelia, P. Sulforaphane as a Potential protective phytochemical against neurodegenerative diseases. Oxid. Med. Cell. Longev. 2013, 2013. [Google Scholar] [CrossRef]
  71. Rungratanawanich, W.; Cenini, G.; Mastinu, A.; Sylvester, M.; Wilkening, A.; Abate, G.; Bonini, S.A.; Aria, F.; Marziano, M.; Maccarinelli, G.; et al. γ-oryzanol improves cognitive function and modulates hippocampal proteome in mice. Nutrients 2019, 11, 753. [Google Scholar] [CrossRef] [PubMed] [Green Version]
  72. Brandes, M.S.; Gray, N.E. NRF2 as a Therapeutic Target in Neurodegenerative Diseases. ASN Neuro 2020, 12. [Google Scholar] [CrossRef]
  73. Patapoutian, A.; Reichardt, L.F. Trk receptors: Mediators of neurotrophin action. Curr. Opin. Neurobiol. 2001, 11, 272–280. [Google Scholar] [CrossRef]
  74. Poo, M. Neurotrophins as synaptic modulators. Nat. Rev. Neurosci. 2001, 2, 24–32. [Google Scholar] [CrossRef] [PubMed]
  75. Colucci-D’amato, L.; Speranza, L.; Volpicelli, F. Neurotrophic factor bdnf, physiological functions and therapeutic potential in depression, neurodegeneration and brain cancer. Int. J. Mol. Sci. 2020, 21, 7777. [Google Scholar] [CrossRef]
  76. Fahnestock, M.; Garzon, D.; Holsinger, R.M.D.; Michalski, B. Neurotrophic factors and Alzheimer’s disease: Are we focusing on the wrong molecule? In Proceedings of the Journal of Neural Transmission, Supplement; Springer: Wien, Austria, 2002; pp. 241–252. [Google Scholar]
  77. Siegel, G.J.; Chauhan, N.B. Neurotrophic factors in Alzheimer’s and Parkinson’s disease brain. Brain Res. Rev. 2000, 33, 199–227. [Google Scholar] [CrossRef]
  78. Arancibia, S.; Silhol, M.; Moulière, F.; Meffre, J.; Höllinger, I.; Maurice, T.; Tapia-Arancibia, L. Protective effect of BDNF against beta-amyloid induced neurotoxicity in vitro and in vivo in rats. Neurobiol. Dis. 2008, 31, 316–326. [Google Scholar] [CrossRef] [PubMed]
  79. Elliott, E.; Atlas, R.; Lange, A.; Ginzburg, I. Brain-derived neurotrophic factor induces a rapid dephosphorylation of tau protein through a PI-3Kinase signalling mechanism. Eur. J. Neurosci. 2005, 22, 1081–1089. [Google Scholar] [CrossRef]
  80. Casamenti, F.; Stefani, M. Olive polyphenols: New promising agents to combat aging-associated neurodegeneration. Expert Rev. Neurother. 2017, 17, 345–358. [Google Scholar] [CrossRef]
  81. Hung, C.Y.; Hsu, T.I.; Chuang, J.Y.; Su, T.P.; Chang, W.C.; Hung, J.J. Sp1 in Astrocyte is Important for Neurite Outgrowth and Synaptogenesis. Mol. Neurobiol. 2020, 57, 261–277. [Google Scholar] [CrossRef]
  82. Moutinho, D.; Veiga, S.; Requena, J.R. Human VGF-Derived Antidepressant Neuropeptide TLQP62 Promotes SH-SY5Y Neurite Outgrowth. J. Mol. Neurosci. 2020, 70, 1293–1302. [Google Scholar] [CrossRef]
  83. Xiong, L.L.; Qiu, D.L.; Xiu, G.H.; Al-Hawwas, M.; Jiang, Y.; Wang, Y.C.; Hu, Y.; Chen, L.; Xia, Q.J.; Wang, T.H. DPYSL2 is a novel regulator for neural stem cell differentiation in rats: Revealed by Panax notoginseng saponin administration. Stem Cell Res. Ther. 2020, 11. [Google Scholar] [CrossRef] [PubMed]
  84. Ogawa, Y.; Kakumoto, K.; Yoshida, T.; Kuwako, K.I.; Miyazaki, T.; Yamaguchi, J.; Konno, A.; Hata, J.; Uchiyama, Y.; Hirai, H.; et al. Elavl3 is essential for the maintenance of Purkinje neuron axons. Sci. Rep. 2018, 8. [Google Scholar] [CrossRef]
  85. Singh, M.; Kakkar, A.; Sharma, R.; Kharbanda, O.P.; Monga, N.; Kumar, M.; Chowdhary, S.; Airan, B.; Mohanty, S. Synergistic Effect of BDNF and FGF2 in Efficient Generation of Functional Dopaminergic Neurons from human Mesenchymal Stem Cells. Sci. Rep. 2017, 7. [Google Scholar] [CrossRef] [PubMed] [Green Version]
  86. Palasz, E.; Wysocka, A.; Gasiorowska, A.; Chalimoniuk, M.; Niewiadomski, W.; Niewiadomska, G. BDNF as a promising therapeutic agent in parkinson’s disease. Int. J. Mol. Sci. 2020, 21, 1170. [Google Scholar] [CrossRef] [Green Version]
  87. Sarchielli, E.; Marini, M.; Ambrosini, S.; Peri, A.; Mazzanti, B.; Pinzani, P.; Barletta, E.; Ballerini, L.; Paternostro, F.; Paganini, M.; et al. Multifaceted roles of BDNF and FGF2 in human striatal primordium development: An in vitro study. Exp. Neurol. 2014, 257, 130–147. [Google Scholar] [CrossRef]
  88. Rached, M.B.; Galaverna, G.; Cirlini, M.; Boujneh, D.; Zarrouk, M.; Guerfel, M. Pedologic factors affecting virgin olive oil quality of “Chemlali” olive trees (Olea europaea L.). J. Oleo Sci. 2017, 66, 907–915. [Google Scholar] [CrossRef] [Green Version]
  89. Caruso, G.; Gucci, R.; Urbani, S.; Esposto, S.; Taticchi, A.; Di Maio, I.; Selvaggini, R.; Servili, M. Effect of different irrigation volumes during fruit development on quality of virgin olive oil of cv. Frantoio. Agric. Water Manag. 2014, 134, 94–103. [Google Scholar] [CrossRef]
  90. Caruso, G.; Gucci, R.; Sifola, M.I.; Selvaggini, R.; Urbani, S.; Esposto, S.; Taticchi, A.; Servili, M. Irrigation and fruit canopy position modify oil quality of olive trees (cv. Frantoio). J. Sci. Food Agric. 2017, 97, 3530–3539. [Google Scholar] [CrossRef] [Green Version]
  91. Yu, J.; Kwon, H.; Cho, E.; jeon, J.; Kang, R.H.; Youn, K.; Jun, M.; Lee, Y.C.; Ryu, J.H.; Kim, D.H. The effects of pinoresinol on cholinergic dysfunction-induced memory impairments and synaptic plasticity in mice. Food Chem. Toxicol. 2019, 125, 376–382. [Google Scholar] [CrossRef]
  92. In, S.J.; Seo, K.H.; Song, N.Y.; Lee, D.S.; Kim, Y.C.; Baek, N.I. Lignans and neolignans from the stems of Vibrunum erosum and their neuroprotective and anti-inflammatory activity. Arch. Pharm. Res. 2015, 38, 26–34. [Google Scholar] [CrossRef]
  93. Dinda, B.; Dinda, M.; Kulsi, G.; Chakraborty, A.; Dinda, S. Therapeutic potentials of plant iridoids in Alzheimer’s and Parkinson’s diseases: A review. Eur. J. Med. Chem. 2019, 169, 185–199. [Google Scholar] [CrossRef] [PubMed]
  94. Borah, P.; Sanjeev, A.; Mattaparthi, V.S.K. Computational investigation on the effect of Oleuropein aglycone on the α-synuclein aggregation. J. Biomol. Struct. Dyn. 2020, 1–12. [Google Scholar] [CrossRef] [PubMed]
  95. Casamenti, F.; Grossi, C.; Rigacci, S.; Pantano, D.; Luccarini, I.; Stefani, M. Oleuropein Aglycone: A Possible Drug against Degenerative Conditions. In Vivo Evidence of its Effectiveness against Alzheimer’s Disease. J. Alzheimer’s Dis. 2015, 45, 679–688. [Google Scholar] [CrossRef] [PubMed]
Figure 1. Viability of differentiated SH-SY5Y treated with EVOO extracts. Cells were treated with increasing concentrations (1 to 500 µg/mL) of EVOO extracts for 24 h and the cellular viability was measured by MTT assay as described in Materials and Methods. Each bar represents means ± SEM of at least three independent experiments. Data were analyzed by one-way ANOVA followed by Dunnett’s test. * p < 0.05 with respect to CTRL.
Antioxidants 10 00421 g001
Figure 2. Neuroprotective activity of EVOO extracts against H2O2 in SH-SY5Y cells. Cells were treated with 10 µg/mL of the EVOO extracts for 24 h and then exposed to H2O2. (A) Cell viability was measured by MTT assay and (B) LDH was measured as LDH activity in in the culture medium as described in Materials and Methods. Each bar represents means ± SEM of at least three independent experiments. Data were analyzed by one-way ANOVA followed by Bonferroni’s test. * p < 0.05 with respect to CTRL; ° p < 0.05 with respect to H2O2; § p < 0.05 with respect to plain.
Antioxidants 10 00421 g002
Figure 3. Antioxidant capacity of EVOO extracts. Cells were treated with 10 µg/mL of hill and plain extracts for 24 h (A) The intracellular ROS levels were measured with the peroxide-sensitive probe DCFH-DA as reported in Materials and Methods. Data are expressed as percentage of H2O2. (B) The intracellular GSH levels were evaluated using the fluorescent probe monochloro bimane (MCB) as described in Materials and Methods. Data are expressed as percentage of control (CTRL). Each bar represents means ± SEM of at least three independent experiments. Data were analyzed by one-way ANOVA followed by Dunnett’s test or Bonferroni’s test. * p < 0.05 with respect to CTRL; ° p < 0.05 with respect to H2O2.
Antioxidants 10 00421 g003
Figure 4. Expression of antioxidant enzymes in SH-SY5Y cells treated with the extracts. Cells were treated with hill and plain extracts (10 µg/mL) for 6 h. Real time-PCR was performed to detect HMOX1, TXNRD1, NQO1 and GSR mRNA levels. Data are expressed as relative abundance compared to untreated cells. Each bar represents mean ± SEM of three independent experiments. Data were analyzed with a one-way ANOVA followed by the Bonferroni’s test. * p < 0.05 vs. CTRL; § p < 0.05 vs. plain.
Antioxidants 10 00421 g004
Figure 5. Expression of BDNF in SH-SY5Y cells treated with the extracts. Cells were treated with hill and plain extracts (10 µg/mL) for 24 h. Real time-PCR was performed to detect BDNF mRNA levels. Data are expressed as relative abundance compared to untreated cells. Each bar represents mean ± SEM of three independent experiments. Data were analyzed with one-way ANOVA followed by the Bonferroni’s test. * p < 0.05 vs. CTRL; § p < 0.05 vs. plain.
Antioxidants 10 00421 g005
Figure 6. 2DE representative images of differentiated SH-SY5Y cell proteins treated with Hill (A) and Plain (B) extracts. Venn diagram (C) of different comparisons. (A,B) SH-SY5Y proteins were separated in a 3–10 nonlinear gradient. SDS-PAGE was performed using 12% acrylamide. Gels were stained with ruthenium. (C) Venn diagram highlighting the distribution of identified differentially expressed proteins in hill and plain extracts as compared to control. Both unique and overlapping proteins are reported as actual number and percentage (Venny 2.0.2).
Antioxidants 10 00421 g006
Figure 7. Regulator network generated by IPA. Upstream regulators (SP1, IL5, FGF2 and RET) are displayed in the top tier while functions are displayed in the bottom tier. The data set proteins connecting regulators and lower functions are shown in the middle tier where the fold change value of each protein expression is reported below the gene name. The predicted regulators had a z-score (activation score) > 1.9 and a Fisher’s exact p-value < 0.05. Dashed lines are indirect effects and the protein shape indicates the protein class (defined by IPA). Orange and cyan connecting lines indicate activation and inhibition, respectively. Similarly, activated and inhibited downstream functions are orange and cyan. * More than one spot was identified for this protein.
Antioxidants 10 00421 g007
Figure 8. WB analysis of BDNF (A) and DPYSL2 (B) expression in SH-SY5Y cells treated with and without EVOO extracts. Representative immunoblot images and histograms of band normalized OD are shown. Data are presented as mean ± SEM of three independent experiments. Data were analyzed with a one-way ANOVA followed by the Bonferroni’s test. * p < 0.05 vs. CTRL; § p < 0.05 vs. plain.
Antioxidants 10 00421 g008
Table 1. List of primers for real-time PCR in SH-SY5Y cells.
Gene5′-Forward-3′5′-Reverse-3′RefSeq Accession No.
HMOX1CAACAAAGTGCAAGATTCTGTGCATTCACATGGCATAAAGNM_002133
BDNFCAAAAGTGGAGAACATTTGCAACTCCAGTCAATAGGTCAGNM_001143811
NQO1AGTATCCACAATAGCTGACGTTTGTGGGTCTGTAGAAATGNM_000903
GSRGACCTATTCAACGAGCTTTACCAACCACCTTTTCTTCCTTGNM_000637
TXNRD1AGACAGTTAAGCATGATTGGAATTGCCCATAAGCATTCTCNM_001093771
18S rRNACAGAAGGATGTAAAGGATGGTATTTCTTCTTGGACACACCNM_022551
Table 2. Type of soil in hill and plain orchards a.
Soil CategoriesHillPlain
% ± SEM% ± SEM
Clay8.7 ± 0.08 *8.4 ± 0.08
Silt38 ± 0.46 ***46.1 ± 0.50
Sandy53.3 ± 0.68 **45.6 ± 0.94
pH5.4 ± 0.04 ***6.9 ± 0.05
Ppm ±Ppm ±
K110 ± 0.83 ***54.7 ± 0.44
Mg73.7 ± 0.47 ***63.6 ± 0.37
Ca1188 ± 10.29 ***1428 ± 15.46
P48 ± 0.36 ***34 ± 0.22
Total N2600 ± 24.02 ***3000 ± 27.71
a Asterisks after the phenolic substance’s name indicate the level of significance (One way ANOVA, Tukey’s test for pairwise comparison) in the difference between Hill and Plain extracts: * p < 0.05; ** p < 0.01; *** p < 0.001; Analyses were carried out by the “Regional laboratory for soil analysis and plant production” http://www.agriligurianet.it (accessed 21 January 2021).
Table 3. Concentration of the main polar phenolic components in hill and plain EVOO’s extracts.
Phenolic Compound HillPlain
(μg/g ± SD)
Hydroxytyrosol **678.21 ± 24.272167.85 ± 93.35
Tyrosol **771.82 ± 38.751697.46 ± 123.03
Vanillic acid **6.83 ± 0.344.05 ± 0.15
p-Coumaric acid **3.22 ± 0.1910.30 ± 0.67
ferulic acid *0.56 ± 0.040.89 ± 0.05
3,4-DHPEA-EDA **803.33 ± 46.122610.92 ± 169.48
p-HPEA-EDA1102.60 ± 71.261316.25 ± 95.03
Pinoresinol **1819.41 ± 51.98664.64 ± 23.78
Acetoxypinoresinol **1854.62 ± 133.241018.40 ± 80.94
Luteolin64.27 ± 4.1585.78 ± 6.19
3,4-DHPEA-EA *330.78 ± 9.45244.55 ± 8.75
p-HPEA-EA **756.07 ± 54.32251.74 ± 20.01
Apigenin *25.08 ± 1.0840.08 ± 2.02
Asterisks after the phenolic substance’s name indicate the level of significance (One way ANOVA, Tukey’s test for pairwise comparison) in the difference between Hill and Plain extracts: * p < 0.05; ** p < 0.01; 3,4-DHPEA-EDA: dialdehydic form of decarboxymethyl elenolic acid linked to hydroxytyrosol (oleacein); p-HPEA-EDA: dialdehydic form of decarboxymethylelenolic acid linked to tyrosol (oleocanthal); 3,4-DHPEA-EA: isomer of oleuropein aglycone; p-HPEA-EA: ligstroside aglycon.
Table 4. List of differentially expressed proteins, which are exclusive of hill extract treated cells.
Spot n.Protein NameIDGeneCoverage (%)PeptidesUnic PeptideMW (kDa)pIRatio (Hill/Ctrl)p-Value
2417Heterogeneous nuclear ribonucleoprotein A3P51991HNRNPA3291010399.17.840.017
2514ELAV-like protein 3, Iso 1,2Q14576ELAVL311, 113139/389.37.30.012
1601Non-POU domain-containing octamer-binding proteinQ15233NONO1444549.04.590.03
1030Pyruvate dehydrogenase phosphatase regulatory subunit, mitochondrial, Iso 1Q8NCN5PDPR433995.72.480.017
1278Heat shock 70 kDa protein 1A, Iso 1,2P0DMV8HSPA1A136166/705.4/5.52.30.011
1278Heat shock 70 kDa protein 1BP0DMV9HSPA1B1361705.42.30.011
1278Heat shock cognate 71 kDa proteinP11142HSPA8341814715.32.290.011
1367Dihydropyrimidinase-related protein 3, Iso LCRMP-4Q14195DPYSL3281414745.92.200.022
1606Pyruvate kinase PKM, Iso M2P14618PKM381818587.91.80.034
1085Membrane primary amine oxidase, Iso 1,2Q16853AOC332284/706.0/7.11.80.023
1085Vitamin D-binding protein, Iso 1,3P02774GC82253/555.1/5.41.770.023
894Filamin-A, Iso 1,2P21333FLNA4772805.71.690.016
1136EzrinP15311EZR1052695.91.660.005
895Filamin-A, Iso 1,2P21333FLNA3662805.71.540.01
1093ATP-dependent 6-phosphofructokinase, muscle type, Iso 1, 3P08237PFKM159985/938.21.500.005
945Prolyl 3-hydroxylase 3Q8IVL6P3H3644825.81.500.008
1427Dihydropyrimidinase-related protein 2, Iso 1,2 Q16555DPYSL215/165562/585.9/5.71.490.033
2475Eukaryotic translation initiation factor 2 subunit 1P05198EIF2S13077365.01.460.029
569Hypoxia up-regulated protein 1Q9Y4L1HYOU14532321115.11.450.014
781Heat shock 70 kDa protein 4P34932HSPA4321818945.11.390.044
1485Very long-chain specific acyl-CoA dehydrogenase, mitochondrial, Iso 1,2,3P49748ACADVL42270/687.7/8.71.380.001
1280Heterogeneous nuclear ribonucleoprotein M, Iso 1,2P52272HNRNPM188877/748.8/ 8.91.360.019
1371Probable ATP-dependent RNA helicase DDX17, Iso 1,2,3,4Q92841DDX1784480/728.5/ 8.81.360.019
1371Calcium-binding mitochondrial carrier protein Aralar2, Iso 1,2 Q9UJS0SLC25A131788748.71.360.019
2074VimentinP08670VIM271010535.01.340.004
95226S proteasome non-ATPase regulatory subunit 2Q13200PSMD21910101005.11.340.017
808Insulin-degrading enzymeP14735IDE3331176.21.330.043
121678 kDa glucose-regulated proteinP11021HSPA5463030725.01.290.003
2374Alcohol dehydrogenase class-3P11766ADH51844397.61.290.037
2417Heterogeneous nuclear ribonucleoproteins A2/B1, Iso B1P22626HNRNPA2B11233378.91.290.037
1413Prelamin-A/C, Iso A,CP02545LMNA95574/656.5/6.41.280.023
1650Non-POU domain-containing octamer-binding proteinQ15233NONO2599549.01.280.041
901Programmed cell death 6-interacting protein, Iso 1,2Q8WUM4PDCD6IP21111196 1.280.006
1371Heterogeneous nuclear ribonucleoprotein M, Iso 1,2P52272HNRNPM16/178877/758.8/8.91.270.023
1461Asparagine--tRNA ligase, cytoplasmicO43776NARS311313635.91.260.037
1467Prelamin-A/C, Iso A,CP02545LMNA16/199974/656.5/6.41.260.043
811Neutral alpha-glucosidase AB, Iso 1,2Q14697GANAB1088106/109 1.260.001
1012Gelsolin, Iso 1,2,3,4P06396GSN63385/805.7/5.51.240.041
1363Lamin-B1P20700LMNB1332020665.11.240.03
1330Beta-catenin-like protein 1, Iso 1,4Q8WYA6CTNNBL172265/614.9/5.01.240.03
1330Ubiquilin-2Q9UHD9UBQLN2522655.11.240.03
1084Neurosecretory protein VGFO15240VGF1466674.71.220.013
1084Secretogranin-2P13521SCG21477714.61.220.013
2593Elongation factor 1-delta, Iso 1,2P29692EEF1D2666314.9/6.01.160.015
1427Phosphoacetylglucosamine mutase, Iso 1,2,3O95394PGM363359/625.8/5.61.070.023
3410Proteasome subunit alpha type-2P25787PSMA23977267.10.810.002
2315Actin, cytoplasmic 1P60709ACTB1144425.20.750.014
2315Actin, cytoplasmic 2P63261ACTG11144425.30.750.014
1979Ribonuclease inhibitorP13489RNH11966504.70.730.017
2230DNA-directed RNA polymerases I and III subunit RPAC1, Iso 1,2O15160POLR1C17/164439/385.3/5.60.670.007
2830Voltage-dependent anion-selective channel protein 2, Iso 1,2,3P45880VDAC215/163333/307.5/6.80.660.023
Table 5. List of common differentially expressed proteins.
Spot n. Protein Name ID Gene Coverage (%) PeptidesUnic PeptidesMW
(kDa)
pI Ratio (Plain/Ctrl) Ratio (Hill/Ctrl) p-Value
2164Heterogeneous nuclear ribonucleoprotein D0 Iso 1,3 Q14103 HNRNPD 9/10 2238/327.6/8.21.771.440.005
2164Citrate synthase mitochondrial O75390 CS 833527.4 1.771.440.005
2164Protein arginine methyltransferase NDUFAF7 mitochondrial Q7L592NDUFAF7 833497.3 1.771.440.005
2164Cytochrome b-c1 complex subunit 2. mitochondrial P22695 UQCRC2 1444487.7 1.771.440.005
1001Pre-mRNA-splicing factor ATP-dependent RNA helicase DHX15 O43143 DHX15 1499917.11.721.490.009
5503MICOS complex subunit MIC60, Iso 1,2, 4 Q16891 IMMT 31/31 17183/ 82 5.7/6.11.661.750.019
1057X-ray repair cross-complementing protein 5 P13010 XRCC5 1377835.5 1.621.430.0006
199326S proteasome regulatory subunit 7 P35998 PSMC2 381414485.71.581.230.005
881Elongation factor 2 P13639 EEF2 966956.4 1.581.290.033
726Vinculin, Iso 1,2 P18206 VCL 16/15 99116/124 5.8/5.5 1.381.630.028
2654Annexin A2, Iso 1,2 P07355 ANXA2 46/44 181838/40 7.5/ 8.5 1.241.220.036
3761Adenine phosphoribosyltransferase, Iso 1,2 P07741 APRT 23/31 3319/145.7/6.7 0.870.810.036
3761DNA-directed RNA polymerase II subunit RPB7 P62487 POLR2G 2333195.3 0.870.810.036
3549Eukaryotic translation initiation factor 3 subunit K, Iso 1,2 Q9UBQ5 EIF3K 112225/244.8. 4.7 0.70.730.013
3549Proteasome subunit beta type-6 P28072 PSMB6 1844254.90.70.730.013
3549Translationally-controlled tumor protein P13693 TPT1 3455194.8 0.70.730.013
3977Diablo homolog. Mitochondrial, Iso 1,2 Q9NR28 DIABLO 27/34 6627/214.7/4.8 0.580.520.003
3977Ras-related protein Rap-2a P10114 RAP2A 1022204.73 0.580.520.003
Table 6. List of top eight upstream regulators obtained by IPA analysis of differentially expressed proteins in hill extract treated SH-SY5Y cells.
Upstream RegulatorMolecule TypeActivation z-Scorep-Value of OverlapTarget Molecules
TP53Transcription regulator0.2958.48 × 10−11ACADVL, ACTB, ADH5, ANXA2, CS, EZR, GC, GSN, HNRNPA2B1, HSPA1A/HSPA1B, HSPA8, NARS1,
PDCD6IP, PFKM, PGM3, PKM, PSMA2, PSMD2, RAP2A, SLC25A13, UBQLN2, VCL, VIM, XRCC5
MAPTOther 7.74 × 10⁻⁹ACTB, ACTG1, CS, DPYSL2, DPYSL3, EEF2, HSPA1A/HSPA1B, HSPA5, HSPA8, PKM, PSMD2
BDNFGrowth factor0.292.53 × 10−7ANXA2, DPYSL3, EEF1D, EEF2, FLNA, HSPA5, RNH1, VGF, VIM
IL5Cytokine2.2361.25 × 10−3ANXA2, HSPA5, LMNB1, PKM, VIM
SP1Transcription regulator2.2115.07 × 10−3ADH5, EZR, FLNA, HSPA5, PKM, VIM
FGF2Growth factor2.3911.1 × 10−3FLNA, LMNA, SCG2, VGF, VIM, XRCC5
RETKinase2.1861.6 × 10−5DPYSL2, HSPA1A/HSPA1B, HSPA8, UBQLN2, VGF
MYCTranscription regulator2.1851.32 × 10−5ACTB, EEF2, EIF2S1, EZR, FLNA, HNRNPA2B1, HNRNPD, NARS1, PFKM, PKM, POLR2G, VDAC2, VIM
Publisher’s Note: MDPI stays neutral with regard to jurisdictional claims in published maps and institutional affiliations.

