Review of Vibration-Based Structural Health Monitoring Using Deep Learning


Department of Mechanical Engineering, Hanyang University, Seoul 04763, Korea
*
Author to whom correspondence should be addressed.
Appl. Sci. 2020, 10(5), 1680; https://doi.org/10.3390/app10051680
Submission received: 9 January 2020
/
Revised: 16 February 2020
/
Accepted: 25 February 2020
/
Published: 2 March 2020
(This article belongs to the Special Issue Vibration-Based Structural Health Monitoring)
Abstract
:With the rapid progress in the deep learning technology, it is being used for vibration-based structural health monitoring. When the vibration is used for extracting features for system diagnosis, it is important to correlate the measured signal to the current status of the structure. The measured vibration responses show large deviation in spectral and transient characteristics for systems to be monitored. Consequently, the diagnosis using vibration requires complete understanding of the extracted features to discard the influence of surrounding environments or unnecessary variations. The deep-learning-based algorithms are expected to find increasing application in these complex problems due to their flexibility and robustness. This review provides a summary of studies applying machine learning algorithms for fault monitoring. The vibration factors were used to categorize the studies. A brief interpretation of deep neural networks is provided to guide further applications in the structural vibration analysis.
1. Introduction
Vibration originates from many different sources, including fluid flow, magnetic fields, translating and rotating elements, imbalances, interactions and frictional contacts. The vibration mode depends on the structural properties, geometry and boundary conditions, which may change with time. Consequently, the transient variation of the vibration response shows large statistical deviations. Despite the difficulties with interpretation of the measured values, the response provides important information about the status of a structure. Advances in engineering technology have increased the size and complexity of structures. To minimize the costs induced by unexpected failure, the need for continuous structural health monitoring is increasing. Using vibration to monitor structural integrity allows for robust, efficient and straightforward implementation. However, using vibration for fault inspection requires understanding of multidisciplinary research fields. According to Worden and Manson [1], the fundamental issue with structural health monitoring is to identify whether a system has departed from the normal state. Rytter [2] proposed a four-level method to identify damage: (1) determination of the existence of damage to the structure; (2) determination of the location of the damage in the structure; (3) quantification of the degree of damage; (4) estimation of the life expectancy of a structure influenced by damage.
Several attempts have been made to apply machine learning to structural health monitoring. Rapid advances have led to the application of deep learning [3] for vibration-based health diagnosis. Kar and Mohanty [4] and Singh and Sa’ad Mohammed [5] used Fourier and wavelet transforms of the vibration signal to detect defects in gearbox and induction machines. Konar et al. [6] investigated the efficiency of selecting features and usage as learning patterns for inspection. Data-driven methods have been used for the fault diagnosis of complex engineering systems. They require little understanding of the kinematics and physics of the tested system [7]. This data-driven approach requires two steps: feature extraction and fault classifier design. Time, frequency and time–frequency analysis is widely used to extract features of the vibration responses of a rotating machine. This method provides a very accurate diagnostic performance at the laboratory scale. This high level of accuracy depends on the physical properties, size or position when applied to actual operating systems. The vibration was also used to monitor the health of composite laminate structures. The natural frequency, damping, mode shapes curvature, transfer function and frequency response are used to analyze the transient responses. Defects have been diagnosed by using the time of flight for the propagation of a high-frequency guided wave transmitted to a structure. Low-frequency vibration has disadvantages for localization because the entire structure is excited [8]. High-frequency surface wave propagation can be utilized for precise measurement, but the requirement of a high-voltage power source increases the costs of the monitoring system.
Inverse analysis method was proposed to analyze the fracture of structures. The lifespan of the structure decreases with the growing crack. Inverse problems were used to estimate the location of an unknown damage in a structure [9,10]. Khatir et al. [11,12,13,14,15] proposed an optimal technique by applying an inverse problem to FEM. Zenzen et al. [16] used frequency response functions (FRF) to find the position and quantity of damage in truss structure based on genetic algorithm (GA) and bat algorithm (BA). The algorithms with better accuracy and computational time were identified. Tiachacht et al. [17] modified the Cornwell indicator (CI). This modified Cornwell indicator (MCI) improved in accuracy and localization compared to the CI.
Design of a fault classifier requires condition monitoring for offline training. Failure data in the field are difficult to obtain owing to the limited availability. Required data for training are generated from laboratory testbeds or from a smaller system to acquire labelled data for training. Testbed data are not guaranteed to those expected in the actual system data. To fill this gap, many deep-learning-based approaches have been proposed. Recent progress in machine learning technology has rapidly expanded its application to vibration-based structural health monitoring. This review summarizes recent attempts at actual applications. This information will be useful for proposals of relevant methods for specific systems requiring inspection and maintenance. Studies using deep learning for health monitoring with respect to vibration characteristics are introduced.
2. Early Health Monitoring Using Vibration Responses
Many attempts have been made to monitor faults or the health condition of a dynamic system by using deviations in the vibration characteristics. In order to diagnose the health condition of a machine, researchers have used signal processing techniques to analyze the vibration response, such as fast Fourier transform [18,19,20,21], envelope [22,23,24], cepstrum [25,26,27,28,29] and wavelet [30,31,32,33] analysis. The processed signals provided information on the spectral response of a machine. Before deep learning was widely applied to health monitoring, conventional classifiers such as the artificial neural network (ANN) [34,35,36,37,38], support vector machines (SVMs) [39,40,41,42], principal component analysis (PCA) [43,44,45,46] and k-means [47,48,49,50] algorithm used the processed data as features.
Magalhães et al. [51] studied the aging and degradation of a bridge. To carry out an ambient vibration test, twelve force balance accelerometers were installed inside the deck box girder to measure the lateral and vertical accelerations. They monitored the time evolution of the natural frequency with the surrounding temperature, natural frequency variation with the RMS values of the vertical acceleration, average day evolution of the modal damping ratios and natural frequency change during the working days to observe possible changes in the status of the bridge. Regression analysis and PCA permit the detection of very small frequency shifts. Kessler et al. [52] used the frequency response to detect damage in composite materials. They manufactured composite specimens with holes, reduced modulus and delamination and used a laser vibrometer to measure vibrations. Each specimen was adhered to two lead zirconate titanate (PZT) wafers for excitation. The extent of damage and reduction in natural frequency strongly corresponded to the clamped composite plates. The finite element model (FEM) has been used to compare the frequency responses in experiments. To identify the damage to a structure, many numbers and types of sensors have been used. Waldron et al. [53] used operational deflection shapes (ODSs), which visualize the vibration displacement or velocity of a structure that is excited by a specific structural loading. They tested two aluminum beams in the healthy and damaged cases. The prepared a scanning laser Doppler vibrometer (SLDV) to measure the vibration and mounted a mass actuator on the beam. FEM simulations showed that the damage localization was more accurate at a higher frequency range.
Neural networks have been applied to health monitoring in many cases [54,55,56,57,58,59,60]. Paya et al. [61] successfully applied the wavelet transform (using D4 orthogonal wavelets) to preprocessing six different types of vibration signals from a model drive-line. ANNs are inspired by the thought process of the human brain. Neurons are interconnected to each other in the brain, and nodes serve the same role in an ANN. ANNs have been used to determine different kinds of faults and differentiate between single and multiple faults. Roy et al. [62] vibrated a structure with ultrasound-guided waves and diagnosed the integrity of a structure by using an unsupervised machine learning algorithm and physics-based temperature compensation. They used PZT to transmit and record guided waves on a thin aluminum plate. Fatigue was generated by a crack along the edge of a center hole. A Tonetone-burst signal was generated by PZT transducers at a center frequency of 250 kHz. Unsupervised ANN was used to detect the damage. A temperature compensation was implemented based on physical insight. They showed that the influence of applied loads needs to be filtered [63].
Lemistre and Balageas [64] used Lamb waves to localize damage. They attached a carbon/epoxy resin plate to PZT to serve as transducer and receiver. They performed a discrete wavelet transform (DWT) to determine the time delay due to damage to the plate. The inserted Lamb wave was diffracted by an object-caused time delay between the main burst and specific outgoing mode. Two types of modes (SH0 and A0) showed good results. SH0 ensured more reliability and robustness. The localization extent fitted well to the actual damage extent. Zhan et al. [65] diagnosed the impulsive vibration applied to a transformer tank by a sudden short circuit in a winding machine. Because the impulse signal applied to the transformer has a large nonlinearity, they applied the Hilbert–Huang transform (HHT) [66] to the analysis in the time–frequency domain. The fault occurred in the winding machine when the response in the 800–1000 Hz band became large.
The impact vibration from a fault can be used for diagnosis. The impulse response has been analyzed to determine the natural frequency response of a system, which is advantageous for comparing normal and abnormal conditions in the frequency domain. The noise due to vibration generated by a machine has also been used for health monitoring. Duan and Wang [67] used empirical mode decomposition (EMD) to remove the aliasing effect to find the condition of an on-load tap changer (OLTC). The energy spectral similarity of the Lorentz information measure (LIM) was used for the fault diagnosis. LIM compares the energy distribution of the vibration response with the state of the machine. With their proposed method, they further confirmed that a certain state abnormality occurs depending on the degree of similarity and distinction between the normal and fault states. The results were applicable to the OLTC, and the model is actually used in industry guidelines. Because the training process for deep learning requires a huge amount of data, various attempts have been made to apply it in fields where securing a sufficiently large dataset is difficult [68,69,70,71]. Simulations have been used to accumulate large amounts of training data to discriminate actual data.
3. Application of Machine Learning to System Identification by Vibration Responses
Machine learning algorithms were used to verify applicability of vibration-based health monitoring, including k-means, PCA, agglomerative clustering and density-based spatial clustering of application with noise (DBSCAN). The method that was applied to identify the bolt clamping force and their accuracies are compared for illustration in this section [72].
The k-means algorithm requires setup of k cluster centroids. The distance from each centroid is calculated and allocated to the nearest cluster. This operation is called clustering. After allocation, the centroid is reassigned in each cluster. The basic concept of the k-means algorithm is to converge the cluster by repeating the above process using the newly-designated centroids.
With PCA, the principal component of correlated data is calculated. Instead of analyzing each component of data, it analyzes a principal component through data distribution. By the PCA, the direction vector with the largest variance of the data is calculated. Therefore, the result obtained by PCA returns the same number of vertical vectors as the system dimension. PCA replaces p measured variables x1, x2, ⋯, xp, by m derived variables, z1, z2, ⋯, zm. All possible variance of linear functions, zk, is given as [73]:
where is the eigenvector of x. z1 shows maximum possible variance among all possible linear functions. z2 is the second largest possible variance orthogonal to z1. The constraint to normalize the variance is defined as:
or equivalently, , using standard vector notation.
In case of the agglomerative clustering algorithms, all data are initially set to clusters. When the distance between the data is closer than the specified value, it is merged into the same cluster. Hierarchical and nonhierarchical methods exist for calculating the distance of data in a cluster during a merge process [74]. The hierarchical method, such as agglomerative clustering, proceeds with the memory of the previous cluster when clustering again after the merger. The relationship between clusters is used in the clustering process. The nonhierarchical method such as k-means clustering and DBSCAN considers the clustered data in exactly the same group. There are methods to calculate the minimum, maximum and mean distance between all points in different clusters [75]. The algorithm ends when the number of clusters falls below the initially set value.
DBSCAN algorithm performs clustering based on the density of data [76]. When a certain number of data exist within a radius of data points, the core point is designated with border points in the surrounding points. When the calculation is applied to all data, and if the border point of the core point (c1) is the same as the core point (c2) of another cluster, it falls into the same group and shares all the border points. Data not included in any cluster are considered as a noise. In the case of DBSCAN, there is no configuration process for the number of clusters. It is possible to find clusters with geometric shapes and outliers for detection by noisy measurements [77].
The use of clustering for status identification using vibration responses is an effective methodology, as was illustrated for the clamping force estimation during bolt tightening process [72]. Figure 1 shows the vibration responses induced at the nut-runner when the bolt was tightened using different torques. During the bolt tightening, the magnitude of the vibration response increases and lasts for a short period of time. With these short vibration responses, the clamping force in the bolt was identified accurately compared to those using the tightening torque. For this purpose, various features were calculated.
During the clamping process, the axial force and the boundary stiffness of the bolt increased. With the increasing axial force, a shift in the resonance frequency occurs in the bolt vibration responses. The increasing bolt resonant responses are transmitted to the nut-runner. The accelerometer was used to measure the nut-runner vibration responses. The cepstrum analysis was used to analyze the vibration characteristics of the nut-runner after exclusion of the harmonic motor rotation components generated during the tightening process. During the fastening process, the nut-runner responses related to the bolt vibration occur in a relatively high frequency band, as visualized in Figure 2. It is not straightforward to explicitly determine the difference according to the change of the clamping force in the transient responses. This is more clearly presented through the cepstrum analysis. The real cepstrum was used as:
where DCT is the discrete cosine transform and X(f) is the Fourier transform of the transient signal. The discrete cosine transform is defined as:
where k = 1, 2, ⋯, N, y is the measured signal, N is length of signal and is Kronecker delta.
Figure 3 shows the identified clamping force from the distance between the data formed by each clustering algorithm using the data with the largest clamping force as a reference. As can be seen from the identified results, the classification of the vibration responses using machine learning was performed with high accuracy that was not possible by the other approaches. Although the initial setting parameters of each method are different and the empirical method should be used to derive the optimal value, the suggested algorithms still can give a precise estimation with simple vibration measurements.
In addition to k-means clustering algorithm introduced through [72], the results in Figure 3 discriminate features derived using PCA, agglomerative clustering and DBSCAN. The k-means algorithm and the PCA confirm that the distribution of the identified results is relatively small. The PCA confirms that there is only one outlier. The agglomerative clustering shows that the dispersion of the discrimination increases as the tightening force increases. The DBSCAN shows an even spread in all tightening forces. The accuracy of the identified results may increase significantly with the use of deep learning algorithms, as discussed in the following sections.
4. Brief Introduction to Deep Learning and Its Future Applications in Vibration Analysis
This section introduces categories of deep learning that can be applied to many areas of vibration-based monitoring. Patterson and Gibson [78] defined four major architectures:
- Unsupervised pretrained networks (UPNs);
- Convolutional neural networks (CNNs);
- Recurrent neural networks;
- Recursive neural networks (RNNs).
A UPN gives a computer unlabeled data for training. The computer learns and organizes the data by itself to teach patterns in the data to the user. The UPN works with unsupervised pretrained input data to get the weights for the first layer. The performance of this training progressively improves to the output layer of the whole network, which is sorted by experience. Typical architectures for UPNs include the autoencoder, DBN and GAN. An autoencoder reduces the dimensions of a dataset and reconstructs the output data form. A DBN is made up of multiple restricted Boltzmann machine (RBM) layers that extract higher-level features of the input vector. While an autoencoder uses backpropagation for weights, an RBM learns stochastically. A GAN is composed of two networks: the discriminator and the generator. The generator creates results from the input data and lets the discriminator distinguish if it is real or created. Over multiple iterations, both networks evolve together.
In machine learning research, many acronyms are used that give information on the layers. The names and characteristics of examples of UPN applications are given here. Ng [79] proposed a sparse autoencoder (SAE) that uses more nodes for the hidden layers than the input layer. Vincent et al. [80] proposed a denoising autoencoder (DAE) that puts some noise in the input layer to prevent unlearning during training. Later, Vincent et al. [81] layered multiple DAEs to develop the stacked DAE (SDAE). Rifai et al. [82] proposed the contractive autoencoder (CAE), which is robust against small variations and outperforms the DAE at feature extraction. Kingma and Welling [83] proposed a generative model of autoencoders called the variational autoencoder (VAE).
Many architectures have been proposed to improve upon early models of the GAN. Radford et al. [84] proposed a deep convolutional generative adversarial network (DCGAN) to stabilize the training ability of GAN with a convolution layer. Mao et al. [85] proposed a least-squares GAN (LSGAN) that uses the least-squares loss instead of the sigmoid cross-entropy loss in the discriminator to overcome the vanishing gradient. Zhao et al. [86] replaced the discriminator network with an autoencoder, which they called an energy-based GAN (EBGAN). Arjovsky et al. [87] adopted the Wassertein distance for the loss function to solve mode collapse.
CNNs are widely used in image recognition. A representative CNN is composed of convolution, pooling, and fully connected layers. In the convolution layer, features are obtained from a small part of the data. The pooling layer reduces the number of parameters for a large image. The fully connected layer computes the class score as the output. There are many variations of the CNN architecture. LeCun et al. [88] proposed the Lenet classic CNN architecture. Kryzhevsky et al. [89] successfully applied a CNN for the first time in computer vision with AlexNet. Many attempts have been made to stack deep layers. Simonyan and Zisserman [90] showed the importance of depth for a CNN called VGGNet with Nineteen layers and Szegedy et al. [91] used a twenty-two layer CNN called GoogLeNet with many variation of filters in one layer. As the number of layer increase, gradient vanishing occurs. He et al. [92] used a residual block to solve gradient vanishing in ResNet, which has over 1000 layers. Huang et al. [93] proposed DenseNet; ResNet combines features through summation, while DenseNet combine features by concatenation.
The main concept of a recurrent neural network is the consideration of time steps. A recurrent neural network has a direction for hidden layer nodes. Recurrent neural networks can train regardless of the sequence length on both the input and output layers. Recurrent neural networks can be used to process time sequential data such as voice, text and raw vibration data. Hochreiter and Schmidhuber [94] proposed long short-term memory (LSTM) to solve the vanishing gradient problem of recurrent neural networks. LSTM units control the amount of memory content with the output gate. Chung et al. [95] proposed the GRU without any control.
An RNN is similar to recurrent neural networks in that it is good at dealing with sequential data. Recurrent neural networks are also called RNNs in the literature; to distinguish between the architectures, only the recursive neural network is abbreviated as RNN in this paper. An RNN models hierarchical structures in a tree fashion, which is overly time-consuming and costly. This has led to a lack of attention being given to RNNs. Because an RNN processes all information of the input sequence, a specific tree fashion is the same as a recurrent neural network.
Table 1 describes the advantages and drawbacks of each deep learning technique. In the case of deep learning using vibration signals, determining the appropriate architecture as well as preprocessing has a big influence on the results.
5. Health Monitoring Using Machine Vibrations
Power sources are important devices that need maintenance requirements to be estimated. Vibration occurs because of magnetic fields generated during power conversion. Harmonic vibration occurs without an external excitation device. The vibration characteristics depend on the efficiency of the power conversion. The rotation of elements also generates harmonic vibrations without excitation devices. Because rotating components have a strong influence on the vibration characteristics, the resulting signal processing needs to consider relevant variations.
The ambient excitation has been used to monitor large structures. Structural vibration is induced by variations in the surrounding environment (e.g., running vehicles, wind and interaction with nearby structures). The calculation of the vibration response requires transient vibration energy transfers to be considered. In addition, the vibration characteristics of the surrounding environment should be understood and correlated with the monitored structure.
Excitation occurs throughout the frequency band when the system is excited by external forces amplified by an impact or random signal. The excitation can be performed at a predetermined frequency to observe the behavior in a specific mode. This direct excitation provides an advantage in terms of the interpretation of results and assumptions for the desired mechanical deformations.
Zhao et al. [96] reviewed the health monitoring of machines using deep learning. They explained each deep learning technique and described an example application. The purpose of their paper was to provide a vibration approach to monitoring structures and to determine the appropriate method according to the cause and interpretation of the vibration response.
6. Power Source-Induced Vibration
Research on using deep learning in the health monitoring of moving parts in transportation systems, plants and manufacturing processes is increasing. Wang et al. [97] measured the vibrations of hydraulic cylinders on steel platforms to monitor five states: normal, blockage, leakage, cavitation and impulsion. The vibration signal of the hydraulic system provided sufficient state information for fault diagnosis with the sliding window spectrum feature (SWSF) of a deep belief network (DBN). The feature extraction was fast and effective with the SWSF. The DBN allowed a large amount of data with redundancy and nonlinearity to be processed. Wen et al. [98] used an accelerometer to measure the vibration at the end face of an axial piston hydraulic pump to compare two conditions: piston shoes and swashplate (PS) and valve plate (VP) wear. Wen et al. used a convolutional neural network (CNN), which could easily distinguish grayscale images by using the transient variation of the vibration response to represent a pixel value, as shown in Figure 4. It can be seen that the pattern of normal state and the pattern of failure are different. They compared the results with the speeded up robust features (SURF)-based PNN carried out in [99] and found that their method outperformed. Two types of vibration occurred during stationary motion, and the spectral characteristics needed to be analyzed.
Szabó and Bakucz [100] applied a deep learning algorithm to a large gas engine that experienced abnormal vibration due to knocking. Knocking is an abnormal engine combustion process that should be prevented. Vibration was applied for a short time and monitored. They analyzed the chaoticity of the knocking by applying the DBN to distinguishing between the vibration caused by the valve and combustion during engine operation and the vibration caused by knocking. Luo et al. [101] detected the impact signal generated by defects to predict the failure of a machine during the production process, as shown in Figure 5. To solve the inverse problem, denoising, deconvolution and interpolation are used [102]. In the presented flow chart, deep learning is defined by the BPNN layer in step 4. If GA and MCI are used instead of BPNN, they can be defined as general inverse problems and SVM, PCA and k-means can be defined as machine learning. Deep learning was applied to analyze the dynamic characteristics. The impulse responses were difficult to analyze because of the harmonics and noise generated during the machining process. A deep autoencoder was used to distinguish between the normal vibration response and the impact vibration due to defects; 288 days of the transient vibration signal were used for learning and verification. Günnemann and Pfeffer [103] used the imbalance data of structure-borne noise from engine excitation to predict damage to the engine without measuring the vibration of the engine. The measured transient responses were transformed into the frequency domain with the Fourier transform. The 1D CNN was applied to the sequence of frequency values. The magnitude of the vibration due to engine failure was relatively small compared to the normal signal. These signal characteristics induced an imbalance in the labeling of data during the training process. There is a method of fitting a large amount of data or weighting to a small number of data. They applied two methods to the same dataset. Huang et al. [104] used the generated sound for effective labeling to evaluate the quality of the vehicle interior noise. To record the interior noise, they set up a microphone above the driver’s seat. The internal noise of the vehicle was analyzed with the discrete wavelet transform (DWT) to derive eight sound quality factors (sound pressure level, A-weighted sound pressure level, loudness, sharpness, roughness, fluctuation strength, articulation index and tonality) under the idle and running conditions. Prediction accuracy was compared by evaluation of their method with using multiple linear regression (MLR), back-propagation neural network (BPNN), general regression neural network (GRNN) and SVM.
In addition to signal measurement, deep learning has also been proposed for condition diagnosis. Xie et al. [105] utilized the speed variation to identify the vibration status of the locomotive absorber on a high-speed train. Knowing whether the fault features are stable or restricted by the number of samples is a difficult practical problem for approaches based on dynamic models. For high-speed trains, securing enough training data for deep learning models is difficult. To distinguish 208 actual cases of speed data, they generated fourteen thousand input situations. Although the actual measurement accuracy was not very high, they realized a much higher accuracy than with backpropagation (BP) or SVM.
Pujani [106] solved a similar problem for helicopter vibration. Numerical modeling was performed using a baseline model and ReLU networks because of the difficulty with securing enough input properties for applying deep learning to differentiating the vibration response of the helicopter to various states. The proposed model was compared with those from the Stanford Autonomous Helicopter Project [107]. Experience has shown that the acceleration of the helicopter in the up and down directions was the most difficult to predict. Thus, they focused on the vertical acceleration of the helicopter. The model provided more precise predictions than the linear acceleration model, linear lag model and quadratic lag model. The acceleration due to the flight state was nonlinear, which made the prediction with conventional models difficult. Deep learning models are appropriate for such nonlinear systems.
So far, cases where deep learning was applied to the discrimination, prediction, and diagnosis of moving mechanical systems have been examined. By measuring the dynamic characteristics of the system according to its movement based on vibration and sound, features can be extracted by various methods and applied to deep learning to distinguish the desired response or between the abnormal and normal responses at the same time. Various attempts have been made in vibration signal analysis to combine signal processing methods with deep learning to outperform conventional discrimination methods.
7. Vibration of a Rotating Object
Many research groups have applied deep learning to rotating systems because of their significance to securing the safety of industrial construction. For rotating parts, directly monitoring the vibration response is not a straightforward process because of the difficulties with installing equipment and delivering the measured signal. An indirect method is required to monitor the vibration of rotating objects based on those of the supporting structure. The training availability and convergence ability increase when a huge amount of data is available. The rotation signal fits very well to the characteristics of deep learning. In the case of a rotating system used in a machine, different signals of the same state can be generated in a relatively short time. It is advantageous that the rotating speed is easily detected in the frequency domain. The important mechanical components for rotation are gears and bearings. This section introduces cases where deep learning was applied to diagnosing gears, bearings, their accessories and attached systems.
Dai et al. [108] applied a novel diagnosis method of applying a stacked sparse denoising autoencoder (SSDAE) to a rolling bearing. The experimental stand consisted of a fan end bearing, electronic motor, drive end bearing, torque transducer and dynamometer, as shown in Figure 6. At Case Western Reserve University (CWRU), Smith and Randall [109] carried out an experiment where the nonlinear and nonstationary vibrational signals were decomposed by ensemble empirical mode decomposition (EEMD). As shown in Figure 7, four types of health conditions with three fault datasets were used to validate the performance of the proposed method and demonstrate its effectiveness compared with the other stack form. Tao et al. [110] applied various types of deep learning to the spur gear to compare their performances at monitoring failure. Several types of tooth breakage were measured. He et al. [111] used deep learning to diagnose the failure of a transmission chain. They verified the method using the dataset of the bearing and the gearbox and classified it with a very high accuracy. Zhang et al. [112] proposed deep convolutional neural networks with wide first-layer kernels (WDCNN), which use a wide kernel in the first layer to suppress high-frequency noise and extract features. Small kernel was used for multilayer nonlinear mapping. Horizontal flips, random crops/scales and color jitter are widely used for data enhancement; the training samples were augmented by cutting and overlapping data. They used the proposed method to diagnose faults in a motor mechanical system.
Qian et al. [113] studied how to overcome the difficulty of applying a deep learning model that was constructed with a small change in the measured trained vibration responses or when the load changed during actual application. Transfer learning solves these problems under robust work conditions. The constructed training dataset should be trained again when a new vibration signal is encountered. Therefore, they replaced the training of new target datasets with adaptive batch normalization (AdaBN), which has three steps: processing the vibration response into regular and differential frequency spectra, applying a DNN in advance with a stacked autoencoder (SAE) and modifying a trained network to diagnose a sample of the target dataset. They applied this method to find faults in gears and bearings.
There have been numerous cases in which various feature extraction methods and deep learning with different layers were applied to the fault diagnosis of gears and bearings [114,115,116,117,118,119,120,121,122,123,124], which have been summarized in several reviews [125,126,127]. The condition of flying vehicles needs to be predicted for maintenance and early warning of failure. Chen et al. [128] simulated engine operation in an aircraft to failure. The turbofan engine is an important element and is the largest and most complex subsystem in an aircraft, so knowing the current status in real-time is important. They applied a fault prognosis convolutional neural network (FP-CNN) to the measured vibration response at NASA AMES Lab to predict the remaining useful life (RUL). Intelligent fault diagnosis techniques improve the efficiency of fault diagnosis by replacing time-consuming and unreliable human interpretation. Deep learning has been applied to improve the accuracy of intelligent fault diagnosis. Fu et al. [129] applied deep learning to the vibration response generated by the cutting of an end mill. The vibration generated during aluminum processing with a three-tooth end mill cutter attached to the spindle housing was measured. The specific frequency of the chatter generated during the process was measured. This corresponded to the natural frequency measured by the impact test. Fu et al. used the Mel-frequency cepstral coefficient (MFCC) and wavelet as well as the raw data for input features. MFCC uses the concept of the cepstrum, which is an effective method for signal processing the vibrations from rotating components in a milling machine. They obtained a much better performance compared with the deep learning error with k-means and DBN.
Data-driven methods have been used for health monitoring by sensing and data analysis. Noise and the irregular length of data or sampling make classification with a regression model difficult. Zhao et al. [130] proposed a convolutional bidirectional long short-term memory (CBLSTM) network that features both a CNN and long short-term memory (LSTM). Local information is extracted by the CNN. Then, time series data are encoded by LSTM. The bidirectional LSTM extracts long-term dependencies from the time series data and uses bidirectionality to take advantage of the past and future contexts. They predicted actual tool wear with raw data and compared the performance of CBLSTM with other types of discrimination. Zhao et al. applied the proposed method to computer numerical control (CNC) dry milling and acquired data by measuring vibration responses in different directions.
The bogie is an important component in high-speed trains that directly affects the safety and comfort of the train operation. Depending on the condition of the bogie, large vibrations may occur in the train, which can lead to accidents such as derailment or overturning. Zhao et al. [131] suggested applying deep learning to the existing method for diagnosing bogie faults. The advantages of deep learning by comparison with the firefly artificial neural network (FANN), particle swarm optimization neural network (PSONN) and genetic artificial neural network (GANN). They applied dynamic modeling to high-speed trains and diagnosed eight states of bogie vibrations. Collecting actual vibrations from a train with a failed bogie system is very difficult and dangerous. Therefore, the multibody dynamics software SIMPACK was used to simulate high-speed trains. Many sensors were mounted on the bogie, and measurements were carried out for diagnosis.
So far, examples of deep learning for diagnosing the vibration of a rotating object have been introduced. Gears and bearings were the main focus of study, and breakage was the main cause. The specific frequency component that occurs at this time does not overlap with the rotation frequency, so the failure occurrence can be easily determined.
8. Ambient Excitation
Until now, this paper has introduced machine systems that move during health monitoring. This section introduces health monitoring methods that utilize the vibration characteristics of the target system caused by the external environment of the mechanical system.
The fiber recognition system is a hybrid fiberoptic acoustic sensor (DAS) that is used in various fields. Machine learning methods that use features extracted manually by professional knowledge are commonly applied to data that change at times. Wu et al. [132] tried to apply deep learning to recognizing the DAS signal. The background noise was mainly measured in the basement of the farm through which the pipe with the cable passed, but there was some interference from country lanes. Traffic noise passing through the ground was mainly collected, and the noise level of the surrounding factory was measured as shown in Figure 8. Regular impulse signals from the forging plant or small but continuous vibration of the fabricating plant or sand washing plant were measured. To measure this external excitation, CNN was introduced, and its performance was compared with other discrimination methods, as shown in Figure 9. They did not consider complex excitation sources for the pipe, but each noise source was measured with high accuracy.
Han et al. [133] applied deep learning to diagnosing the condition of a wind-driven machine like wind turbines. The experimental platform consisted of a wind tunnel, direct drive wind turbine test bench, accumulator and DAQ system. The experiment was conducted on 10 defects. The performance of the CNN layer was varied, and the deep adversarial convolutional neural network (DACNN), which is the deep learning model of the CNN combined with the generative adversarial network (GAN), was applied to the discrimination. Zhang et al. [134] used deep learning to distinguish between coal and rock in the coal mining process. The coal is moved after being mined and falls on the belt, which can be used to examine the different vibrations and sounds of coal and stones. They improved the accuracy by discriminating between the signals generated by accelerometers and microphones attached to the belt individually or with both at the same time.
Tamilselvan et al. [135] performed aircraft wing structure diagnosis and DBN-based health incident classification to determine the engine condition and compared the performance with SVM. Aircraft wings are exposed to large changes in temperature and humidity and to a high-speed and high-pressure environment, so there is a high risk of breakage. During flight, the wings vibrate because of wind; this was measured with a vibration sensor attached to the wing. They applied DBN to the vibration signal for fault classification. Galloway et al. [136] proposed using deep learning for an automated fault detection method to maintain tidal power equipment. Vibration data were gathered from a tidal turbine’s nacelle. By improving the performance of feature-based methods, their network classified ideal and fault conditions with 100% accuracy. The fault diagnosis of bogie vibration data is important, but the error mechanism is very complicated and the signal characteristics are not clear, so applying traditional signal processing methods is difficult. Hu et al. [137] applied deep learning to diagnose faults in bogies. With knowledge and diagnostic experience, deep learning is no longer needed to solve this problem. At different speeds, each fault of high-speed trains was diagnosed with very high discrimination accuracy. Dong et al. [138] applied deep learning to the small fault diagnosis of the front-end speed controlled wind generator (FSCWG) for which early diagnosis is difficult owing to the time-varying and nonstationary characteristics. The vibration signal was measured at the wind turbine of the wind farm. For the FSCWG, the complicated implicit layer was diagnosed from the vibration signals generated by various small fault patterns. The results were compared with those of a neural network and SVM, which are frequently used for fault diagnosis. Guo et al. [139] focused on the growing problem of structural deterioration, especially bridges. Bridges can be easily damaged by persistent traffic, wind loading, material aging, environmental corrosion, earthquakes and so on. These phenomena cause complex structural environmental noise, so detecting the deformation of the bridge is difficult. To diagnose the damage level and location, a large amount of training data is required. Guo et al. installed wireless sensor networks on a bridge to generate a large number of unlabeled examples to train a feature extractor based on the sparse coding algorithm. Their proposed method demonstrated higher accuracy than existing methods.
9. External Excitation and Resulting Vibrations
This section introduces several studies that have applied deep learning to health monitoring in which the system was directly excited and its response was measured. Zhao et al. [140] introduced the modal macro strain (MMS), the sensing technology of a long-gauge distributed fiber Bragg grating (FBG) and deep learning. They modeled a basalt fiber-reinforced polymer (BFRP) composite pipeline with the finite element method. Random signals were loaded to the pipe in the direction perpendicular to the wall. The location of the excitation was 0.2 m away from the pipe support, as shown in Figure 10. The longitudinal and circumferential distributions of the MMS were measured to locate the damage, load excitation and support.
The schematic diagram of the applied CNN is shown in Figure 11. Conventional image-based damage identification shows only the external damage. The introduced method of using dynamic responses is suited for complicated structures and environments and can overcome this limitation. Abdeljaber et al. [141] used the Qatar University (QU) grandstand simulator to develop a 1-D CNN for a horizontal girder made of steel. The bolt joints were loosened, and a modal shaker was used to vibrate the structure. A deep-learning-based damage detection system was used to localize the damage in real time. Raw vibration data were used to extract the optimal damage-sensitive features.
Monitoring only the natural frequencies of a cantilever beam is not effective because the temperature or vibration amplitude can affect the variation in natural frequencies. Onchis [142] chose deep learning for noninvasive monitoring of the cantilever beam conditions. The vibration data were measured to obtain extended time–frequency signatures. The undamaged beam and two types of damaged beams with different temperatures were characterized. The results showed that the proposed method can eliminate the ambient effect (i.e., temperature) and determine if the beam is damaged or not. Lin et al. [143] proposed using a deep CNN for a novel detection method of structural damage to a simply supported beam. In a simulation, a beam was subjected to a burst of random excitation, and different damage levels were simulated by a reduction in the bending rigidity. The results show that the CNN had high accuracy in noisy environment; it could identify multiple points of damage and learned hierarchical features layer by layer. Lin et al. pointed out the importance of big data, which can implicitly consider all the factors. Thus, deep learning can be used for classification with excellent performance, reduced computation time and wide applicability. Oliveira et al. [144] used an electromechanical impedance (EMI)-PZT to monitor structural damage in aluminum structures. This application of EMI-PZT to a CNN was the first trial in this field of research. The proposed method outperformed the currently developed structural health monitoring approach.
10. Conclusions
Table 2 summarizes the research using deep learning for structural health monitoring that were referenced in this review. A combination of various signal preprocessing methods and deep learning architectures is being studied for vibration-based monitoring. Structural health monitoring using vibration response has the elements necessary for classification by deep learning, such as a clear distinction between normal and abnormal status. Data processing can be used for data augmentation. In addition to ongoing developments in researches of deep learning, various and effective condition diagnostics are expected to be proposed.
Khatir et al. [15] presented a damage indicator based on normalized modal strain energy indicator (nMSEDI) and compared the performance of the local frequencies change ratio (LFCR). Computational (CPU) time of LFCR based on FEM was about 60 s and nMSEDI took about 0.28 s. Wu et al. [132] used 1-D CNN + SVM method with 358 samples per second processing speed. Inverse analysis has the advantage of short computation time because the amount of data calculation is smaller than that of deep learning. However, deep learning has the advantage of being able to perform health monitoring on complex structures with high accuracy.
Advances in machine learning technology have rapidly increased its application in vibration-based structural health monitoring, as summarized in this review. Since AlexNet’s success in 2012, interest in deep learning has been increasing rapidly. Based on this trend, research on the possibility of applying deep learning to structural health monitoring has also increased. A database search showed that the number of works reported in the area of structural health monitoring with deep learning has been increasing each year from 279 in 2012 to 323, 402, 440, 433, 524 and 661 in 2013–2018, respectively. A further increase is expected in 2019. The use of structural vibrations for fault diagnosis is advantageous for intrinsic diagnosis of the installation responses. For practical applications, issues related to nonlinearity, nonstationarity and time variation should be resolved. Deep-learning-based algorithms commonly utilize big data. Consequently, they are advantageous in terms of robustness. The amount of data used for discrimination is large to filter out unnecessary information. However, it is important to ensure converged results and to overcome the problem of an aperiodic abnormality signal being generated. Studies are actively ongoing to use data augmentation or directly applying vibration to a system to detect an abnormal signal. The vibration responses are obtained in the time domain. The raw data were used for categorization and feature extraction. Signal processing (e.g., Fourier transform, Hilbert transform and wavelet transform) was also used. Deep learning is a multilayered neural network that can be fabricated in various ways, depending on how the layer is constructed. The deep learning algorithms established their own features that characterize the subject. Production of high-accuracy results is expected in a fast and efficient manner. Therefore, the use of deep learning to analyze unstructured data such as voice, video, photo and sensor measurements is increasing. Data labeling is not required for unsupervised learning. Data labeling requires a lot of time and effort in specific applications. Deep learning is expected to be a tool for solving complicated vibration problems and contributing to efficient structural health monitoring. This summary is intended to be used in future studies as a possible guideline when newly emerged machine learning algorithms are used for vibration-based structural integrity monitoring.
Funding
This research was supported by the Bio & Medical Technology Development Program of the National Research Foundation (NRF) funded by the Korean government (MSIT) [grant number 2019M3E5D1A01069363].
Conflicts of Interest
The authors declare no conflict of interest.
References
- Worden, K.; Manson, G. The application of machine learning to structural health monitoring. Philos. Trans. R. Soc. A 2007, 365, 515–537. [Google Scholar] [CrossRef] [PubMed]
- Rytter, A. Vibrational Based Inspection of Civil Engineering Structures; Department of Building Technology and Structural Engineering, Aalborg University: Aalborg, Denmark, 1993. [Google Scholar]
- Deng, L.; Yu, D. Deep learning: Methods and applications. Found. Trends Signal Process. 2014, 7, 197–387. [Google Scholar] [CrossRef] [Green Version]
- Kar, C.; Mohanty, A.R. Vibration and current transient monitoring for gearbox fault detection using multiresolution Fourier transform. J. Sound Vib. 2008, 311, 109–132. [Google Scholar] [CrossRef]
- Singh, G.K.; Sa’ad Ahmed, S.A.K. Vibration signal analysis using wavelet transform for isolation and identification of electrical faults in induction machine. Electr. Power Syst. Res. 2004, 68, 119–136. [Google Scholar] [CrossRef]
- Konar, P.; Panigrahy, P.S.; Chattopadhyay, P. Tri-Axial Vibration Analysis Using Data Mining for Multi Class Fault Diagnosis in Induction Motor. In Proceedings of the Conference on Mining Intelligence and Knowledge Exploration, Hyderabad, India, 9–11 December 2016; pp. 553–562. [Google Scholar] [CrossRef]
- Oh, H.; Jung, J.H.; Jeon, B.C.; Youn, B.D. Scalable and Unsupervised Feature Engineering Using Vibration-Imaging and Deep Learning for Rotor System Diagnosis. IEEE Trans. Ind. Electron. 2018, 65, 3539–3549. [Google Scholar] [CrossRef]
- Khan, A.; Ko, D.-K.; Lim, S.C.; Kim, H.S. Structural vibration-based classification and prediction of delamination in smart composite laminates using deep learning neural network. Compos. Part B Eng. 2019, 161, 586–594. [Google Scholar] [CrossRef]
- Khatir, S.; Wahab, M.A. A computational approach for crack identification in plate structures using XFEM, XIGA, PSO and Jaya algorithm. Theor. Appl. Fract. Mech. 2019, 103, 102240. [Google Scholar] [CrossRef]
- Khatir, S.; Wahab, M.A. Fast simulations for solving fracture mechanics inverse problems using POD-RBF XIGA and Jaya algorithm. Eng. Fract. Mech. 2019, 205, 285–300. [Google Scholar] [CrossRef]
- Khatir, S.; Dekemele, K.; Loccufier, M.; Khatir, T.; Wahab, M.A. Crack identification method in beam-like structures using changes in experimentally measured frequencies and Particle Swarm Optimization. Cr. Mec. 2018, 346, 110–120. [Google Scholar] [CrossRef]
- Khatir, S.; Belaidi, I.; Serra, R.; Wahab, M.A.; Khatir, T. Damage detection and localization in composite beam structures based on vibration analysis. Mechanika 2015, 21, 472–479. [Google Scholar] [CrossRef] [Green Version]
- Samir, K.; Brahim, B.; Capozucca, R.; Wahab, M.A. Damage detection in CFRP composite beams based on vibration analysis using proper orthogonal decomposition method with radial basis functions and cuckoo search algorithm. Compos Struct 2018, 187, 344–353. [Google Scholar] [CrossRef]
- Khatir, S.; Belaidi, I.; Khatir, T.; Hamrani, A.; Zhou, Y.L.; Wahab, M.A. Multiple Damage Detection in Composite Beams Using Particle Swarm Opttmization and Genetic Algorithm. Mechanika 2017, 23, 514–521. [Google Scholar]
- Khatir, S.; Wahab, M.A.; Boutchicha, D.; Khatir, T. Structural health monitoring using modal strain energy damage indicator coupled with teaching-learning-based optimization algorithm and isogoemetric analysis. J. Sound Vib. 2019, 448, 230–246. [Google Scholar] [CrossRef]
- Zenzen, R.; Belaidi, I.; Khatir, S.; Wahab, M.A. A damage identification technique for beam-like and truss structures based on FRF and Bat Algorithm. Cr. Mec. 2018, 346, 1253–1266. [Google Scholar] [CrossRef]
- Tiachacht, S.; Bouazzouni, A.; Khatir, S.; Wahab, M.A.; Behtani, A.; Capozucca, R. Damage assessment in structures using combination of a modified Cornwell indicator and genetic algorithm. Eng. Struct. 2018, 177, 421–430. [Google Scholar] [CrossRef]
- Melhem, H.; Kim, H. Damage detection in concrete by Fourier and wavelet analyses. J. Eng. Mech. 2003, 129, 571–577. [Google Scholar] [CrossRef]
- Kar, C.; Mohanty, A. Gearbox health monitoring through multiresolution Fourier transform of vibration and current signals. Struct. Health Monit. 2006, 5, 195–200. [Google Scholar] [CrossRef]
- Gao, R.X.; Yan, R. Non-stationary signal processing for bearing health monitoring. Int. J. Manuf. Res. 2006, 1, 18–40. [Google Scholar] [CrossRef]
- Wang, Y.; Loh, K.J.; Lynch, J.P.; Fraser, M.; Law, K.; Elgamal, A. Vibration monitoring of the Voigt Bridge using wired and wireless monitoring systems. In Proceedings of the 4th China-Japan-US symposium on structural control and monitoring, Hangzhou, China, 16–17 October 2006; pp. 16–17. [Google Scholar]
- Yu, D.-J.; Ren, W.-X. EMD-based stochastic subspace identification of structures from operational vibration measurements. Eng. Struct. 2005, 27, 1741–1751. [Google Scholar] [CrossRef]
- Li, R.; He, D. Rotational machine health monitoring and fault detection using EMD-based acoustic emission feature quantification. IEEE Trans. Instrum. Meas. 2012, 61, 990–1001. [Google Scholar] [CrossRef]
- Pines, D.; Salvino, L. Structural health monitoring using empirical mode decomposition and the Hilbert phase. J. Sound Vib. 2006, 294, 97–124. [Google Scholar] [CrossRef]
- Satyam, M.; Rao, V.S.; Devy, C. Cepstrum Analysis: An Advanced Technique in Vibration Analysis of Defects in Rotating Machinery. Def. Sci. J. 1994, 44, 53–60. [Google Scholar] [CrossRef] [Green Version]
- Dackermann, U.; Smith, W.A.; Randall, R.B. Damage identification based on response-only measurements using cepstrum analysis and artificial neural networks. Struct. Health Monit. 2014, 13, 430–444. [Google Scholar] [CrossRef]
- Li, H.; Zhang, Y.; Zheng, H. Gear fault detection and diagnosis under speed-up condition based on order cepstrum and radial basis function neural network. J. Mech. Sci. Technol. 2009, 23, 2780–2789. [Google Scholar] [CrossRef]
- Sheng, X.; Zhong, Y. Gearbox fault diagnosis based on Cepstrum and Envelop demodulation. Machinery 2011, 38, 70–73. [Google Scholar]
- Balsamo, L.; Betti, R.; Beigi, H. A structural health monitoring strategy using cepstral features. J. Sound Vib. 2014, 333, 4526–4542. [Google Scholar] [CrossRef]
- Smith, C.; Akujuobi, C.M.; Hamory, P.; Kloesel, K. An approach to vibration analysis using wavelets in an application of aircraft health monitoring. Mech. Syst. Signal Process. 2007, 21, 1255–1272. [Google Scholar] [CrossRef]
- Yen, G.G.; Lin, K.-C. Conditional health monitoring using vibration signatures. In Proceedings of the 38th IEEE Conference on Decision and Control (Cat. No. 99CH36304), Čačak, Serbia, 7–10 December 1999; pp. 4493–4498. [Google Scholar]
- Javed, K.; Gouriveau, R.; Zerhouni, N.; Nectoux, P. Enabling health monitoring approach based on vibration data for accurate prognostics. IEEE Trans. Ind. Electron. 2014, 62, 647–656. [Google Scholar] [CrossRef] [Green Version]
- Hou, Z.; Noori, M.; Amand, R.S. Wavelet-based approach for structural damage detection. J. Eng. Mech. 2000, 126, 677–683. [Google Scholar] [CrossRef] [Green Version]
- Jayaswal, P.; Verma, S.; Wadhwani, A. Application of ANN, fuzzy logic and wavelet transform in machine fault diagnosis using vibration signal analysis. J. Qual. Maint. Eng. 2010, 16, 190–213. [Google Scholar] [CrossRef]
- Greitzer, F.L.; Kangas, L.J.; Terrones, K.M.; Maynard, M.A.; Wilson, B.W.; Pawlowski, R.A.; Sisk, D.R.; Brown, N.B. Gas turbine engine health monitoring and prognostics. In Proceedings of the International Society of Logistics (SOLE) 1999 Symposium, Las Vegas, NA, USA, 30 August–2 September 1999; pp. 1–7. [Google Scholar]
- Wang, D.; Huang, S. Health monitoring and diagnosis for flexible structures with PVDF piezoelectric film sensor array. J. Intell. Mater. Syst. Struct. 2000, 11, 482–491. [Google Scholar] [CrossRef]
- Osornio-Rios, R.A.; Amezquita-Sanchez, J.P.; Romero-Troncoso, R.J.; Garcia-Perez, A. MUSIC-ANN analysis for locating structural damages in a truss-type structure by means of vibrations. Comput. Aided Civ. Infrastruct. Eng. 2012, 27, 687–698. [Google Scholar] [CrossRef]
- Neves, A.; González, I.; Leander, J.; Karoumi, R. Structural health monitoring of bridges: A model-free ANN-based approach to damage detection. J. Civ. Struct. Health Monit. 2017, 7, 689–702. [Google Scholar] [CrossRef] [Green Version]
- Konar, P.; Chattopadhyay, P. Bearing fault detection of induction motor using wavelet and Support Vector Machines (SVMs). Appl. Soft. Comput. 2011, 11, 4203–4211. [Google Scholar] [CrossRef]
- Soualhi, A.; Medjaher, K.; Zerhouni, N. Bearing health monitoring based on Hilbert–Huang transform, support vector machine, and regression. IEEE Trans. Instrum. Meas. 2014, 64, 52–62. [Google Scholar] [CrossRef] [Green Version]
- Saravanan, N.; Siddabattuni, V.K.; Ramachandran, K. A comparative study on classification of features by SVM and PSVM extracted using Morlet wavelet for fault diagnosis of spur bevel gear box. Expert. Sys. Appl. 2008, 35, 1351–1366. [Google Scholar] [CrossRef]
- Bulut, A.; Singh, A.K.; Shin, P.; Fountain, T.; Jasso, H.; Yan, L.; Elgamal, A. Real-time nondestructive structural health monitoring using support vector machines and wavelets. In Proceedings of the Advanced Sensor Technologies for Nondestructive Evaluation and Structural Health Monitoring, San Diego, CA, USA, 1–2 March 2006; pp. 180–189. [Google Scholar]
- Park, S.; Lee, J.-J.; Yun, C.-B.; Inman, D.J. Electro-mechanical impedance-based wireless structural health monitoring using PCA-data compression and k-means clustering algorithms. J. Intell. Mater. Syst. Struct. 2008, 19, 509–520. [Google Scholar] [CrossRef]
- Tong, F.; Tso, S.; Hung, M. Impact-acoustics-based health monitoring of tile-wall bonding integrity using principal component analysis. J. Sound Vib. 2006, 294, 329–340. [Google Scholar] [CrossRef]
- Malhi, A.; Gao, R.X. PCA-based feature selection scheme for machine defect classification. IEEE Trans. Instrum. Meas. 2004, 53, 1517–1525. [Google Scholar] [CrossRef]
- Golinval, J.-C.; De Boe, P.; Yan, A.; Kerschen, G. Structural damage detection based on PCA of vibration measurements. In Proceedings of the 58th Meeting of the Society for Machinery, Failure Prevention Tech, Virginia Beach, Virginia, 25–30 April 2004. [Google Scholar]
- Tian, J.; Azarian, M.H.; Pecht, M. Anomaly detection using self-organizing maps-based k-nearest neighbor algorithm. In Proceedings of the European Conference of the Prognostics and Health Management Society, Turin, Italy, 1–3 July 2020. [Google Scholar]
- Diez, A.; Khoa, N.L.D.; Alamdari, M.M.; Wang, Y.; Chen, F.; Runcie, P. A clustering approach for structural health monitoring on bridges. J. Civ. Struct. Health Monit. 2016, 6, 429–445. [Google Scholar] [CrossRef] [Green Version]
- Yiakopoulos, C.; Gryllias, K.C.; Antoniadis, I.A. Rolling element bearing fault detection in industrial environments based on a K-means clustering approach. Expert. Syst. Appl. 2011, 38, 2888–2911. [Google Scholar] [CrossRef]
- Alamdari, M.M.; Rakotoarivelo, T.; Khoa, N.L.D. A spectral-based clustering for structural health monitoring of the Sydney Harbour Bridge. Mech. Syst. Signal Process. 2017, 87, 384–400. [Google Scholar] [CrossRef]
- Magalhães, F.; Cunha, A.; Caetano, E. Vibration based structural health monitoring of an arch bridge: From automated OMA to damage detection. Mech. Syst. Signal Process. 2012, 28, 212–228. [Google Scholar] [CrossRef]
- Kessler, S.S.; Spearing, S.M.; Atalla, M.J.; Cesnik, C.E.; Soutis, C. Damage detection in composite materials using frequency response methods. Compos. Part B Eng. 2002, 33, 87–95. [Google Scholar] [CrossRef]
- Waldron, K.; Ghoshal, A.; Schulz, M.; Sundaresan, M.; Ferguson, F.; Pai, P.; Chung, J. Damage detection using finite element and laser operational deflection shapes. Finite Elem. Anal. Des. 2002, 38, 193–226. [Google Scholar] [CrossRef]
- Mangal, L.; Idichandy, V.; Ganapathy, C. ART-based multiple neural networks for monitoring offshore platforms. Appl. Ocean Res. 1996, 18, 137–143. [Google Scholar] [CrossRef]
- Feng, M.Q.; Bahng, E.Y. Damage assessment of jacketed RC columns using vibration tests. J. Struct. Eng. 1999, 125, 265–271. [Google Scholar] [CrossRef]
- Zubaydi, A.; Haddara, M.; Swamidas, A. Damage identification in a ship’s structure using neural networks. Ocean Eng. 2002, 29, 1187–1200. [Google Scholar] [CrossRef]
- Abu-Mahfouz, I. Drilling wear detection and classification using vibration signals and artificial neural network. Int. J. Mach. Tools Manuf. 2003, 43, 707–720. [Google Scholar] [CrossRef]
- Su, H.; Chong, K.T. Induction machine condition monitoring using neural network modeling. IEEE Trans. Ind. Electron. 2007, 54, 241–249. [Google Scholar] [CrossRef]
- Rafiee, J.; Arvani, F.; Harifi, A.; Sadeghi, M. Intelligent condition monitoring of a gearbox using artificial neural network. Mech. Syst. Signal Process. 2007, 21, 1746–1754. [Google Scholar] [CrossRef]
- Waszczyszyn, Z.; Ziemiański, L. Neural networks in mechanics of structures and materials–new results and prospects of applications. Comput. Struct. 2001, 79, 2261–2276. [Google Scholar] [CrossRef]
- Paya, B.; Esat, I.; Badi, M. Artificial neural network based fault diagnostics of rotating machinery using wavelet transforms as a preprocessor. Mech. Syst. Signal Process. 1997, 11, 751–765. [Google Scholar] [CrossRef]
- Roy, S.; Chang, F.; Lee, S.; Pollock, P.; Janapati, V. A novel machine-learning approach for structural state identification using ultrasonic guided waves. In Safety, Reliability, Risk and Life-Cycle Performance of Structures and Infrastructures; CRC Press: Boca Raton, FL, USA, 2013; pp. 321–328. [Google Scholar]
- Roy, S.; Lonkar, K.; Janapati, V.; Chang, F.-K. Physics based temperature compensation strategy for structural health monitoring. In Proceedings of the 8th International Workshop on Structural Health Monitoring, Brisbane, Australia, 5–8 December 2017. [Google Scholar]
- Lemistre, M.; Balageas, D. Structural health monitoring system based on diffracted Lamb wave analysis by multiresolution processing. Smart Mater. Struct. 2001, 10, 504. [Google Scholar] [CrossRef]
- Zhan, C.; Ji, S.; Liu, Y.; Zhu, L.; Shi, Y.; Ren, F. Winding Mechanical Fault Diagnosis Technique of Power Transformer Based on Time-Frequency Vibration Analysis. In Proceedings of the 2018 Condition Monitoring and Diagnosis (CMD), Perth, Australia, 23–26 September 2018; pp. 1–6. [Google Scholar]
- Yan, R.; Gao, R.X. Hilbert–Huang Transform-Based Vibration Signal Analysis for Machine Health Monitoring. IEEE Trans. Instrum. Meas. 2006, 55, 2320–2329. [Google Scholar] [CrossRef]
- Duan, R.; Wang, F. Fault Diagnosis of On-Load Tap-Changer in Converter Transformer Based on Time–Frequency Vibration Analysis. IEEE Trans. Ind. Electron. 2016, 63, 3815–3823. [Google Scholar] [CrossRef]
- Wang, J.; Perez, L. The effectiveness of data augmentation in image classification using deep learning. Convolutional Neural. Netw. Vis. Recognit. 2017, 11. Available online: https://s3.amazonaws.com/academia.edu.documents/55344950/data_augmentation.pdf?response-content-disposition=inline%3B%20filename%3DThe_Effectiveness_of_Data_Augmentation_i.pdf&X-Amz-Algorithm=AWS4-HMAC-SHA256&X-Amz-Credential=AKIAIWOWYYGZ2Y53UL3A%2F20200302%2Fus-east-1%2Fs3%2Faws4_request&X-Amz-Date=20200302T044054Z&X-Amz-Expires=3600&X-Amz-SignedHeaders=host&X-Amz-Signature=8dcde12bdd37417c6a738530f006a6e13ffc872cea7a2543a24a96ec9f4ccaef (accessed on 27 February 2020).
- Gan, Z.; Henao, R.; Carlson, D.; Carin, L. Learning deep sigmoid belief networks with data augmentation. In Proceedings of the Artificial Intelligence and Statistics, Cadiz, Spain, 9–11 May 2016; pp. 268–276. [Google Scholar]
- Zhong, Z.; Zheng, L.; Kang, G.; Li, S.; Yang, Y. Random erasing data augmentation. arXiv 2017, arXiv:1708.04896. [Google Scholar]
- Antoniou, A.; Storkey, A.; Edwards, H. Data augmentation generative adversarial networks. arXiv 2017, arXiv:1711.04340. [Google Scholar]
- Toh, G.; Gwon, J.; Park, J. Determination of Clamping Force Using Bolt Vibration Responses during the Tightening Process. Appl. Sci. 2019, 9, 5379. [Google Scholar] [CrossRef] [Green Version]
- Joliffe, I.; Morgan, B. Principal component analysis and exploratory factor analysis. Stat. Methods Med. Res. 1992, 1, 69–95. [Google Scholar] [CrossRef]
- Müller, A.C.; Guido, S. Introduction to Machine Learning with Python: A Guide for Data Scientists; O’Reilly Media, Inc.: Sebastopol, CA, USA, 2016. [Google Scholar]
- Müllner, D. Modern hierarchical, agglomerative clustering algorithms. arXiv 2011, arXiv:1109.2378. [Google Scholar]
- Ester, M.; Kriegel, H.-P.; Sander, J.; Xu, X. A density-based algorithm for discovering clusters in large spatial databases with noise. In Proceedings of the Kdd, Portland, OR, USA, 2–4 August 1996; Volume 96, pp. 226–231. [Google Scholar]
- Kut, A.; Birant, D. Spatio-temporal outlier detection in large databases. J. Comput. Inf. Technol. 2006, 14, 291–297. [Google Scholar]
- Patterson, J.; Gibson, A. Deep Learning: A Practitioner’s Approach; O’Reilly Media, Inc.: Sebastopol, CA, USA, 2017. [Google Scholar]
- Ng, A. Sparse Autoencoder. Available online: http://ailab.chonbuk.ac.kr/seminar_board/pds1_files/sparseAutoencoder.pdf (accessed on 27 February 2020).
- Vincent, P.; Larochelle, H.; Bengio, Y.; Manzagol, P.-A. Extracting and composing robust features with denoising autoencoders. In Proceedings of the 25th international conference on Machine learning, Helsinki, Finland, 5–9 July 2008; pp. 1096–1103. [Google Scholar]
- Vincent, P.; Larochelle, H.; Lajoie, I.; Bengio, Y.; Manzagol, P.-A. Stacked denoising autoencoders: Learning useful representations in a deep network with a local denoising criterion. J. Mach. Learn. Res. 2010, 11, 3371–3408. [Google Scholar]
- Rifai, S.; Vincent, P.; Muller, X.; Glorot, X.; Bengio, Y. Contractive auto-encoders: Explicit invariance during feature extraction. In Proceedings of the 28th International Conference on International Conference on Machine Learning, Bellevue, WA, USA, 28 June–2 July 2011; pp. 833–840. [Google Scholar]
- Kingma, D.P.; Welling, M. Auto-encoding variational bayes. arXiv 2013, arXiv:1312.6114. [Google Scholar]
- Radford, A.; Metz, L.; Chintala, S. Unsupervised representation learning with deep convolutional generative adversarial networks. arXiv 2015, arXiv:1511.06434. [Google Scholar]
- Mao, X.; Li, Q.; Xie, H.; Lau, R.Y.; Wang, Z.; Paul Smolley, S. Least squares generative adversarial networks. In Proceedings of the IEEE International Conference on Computer Vision, Beijing, China, 17–121 October 2005; pp. 2794–2802. [Google Scholar]
- Zhao, J.; Mathieu, M.; LeCun, Y. Energy-based generative adversarial network. arXiv 2016, arXiv:1609.03126. [Google Scholar]
- Arjovsky, M.; Chintala, S.; Bottou, L. Wasserstein gan. arXiv 2017, arXiv:1701.07875. [Google Scholar]
- LeCun, Y.; Bottou, L.; Bengio, Y.; Haffner, P. Gradient-based learning applied to document recognition. Proc. IEEE 1998, 86, 2278–2324. [Google Scholar] [CrossRef] [Green Version]
- Krizhevsky, A.; Sutskever, I.; Hinton, G.E. Imagenet classification with deep convolutional neural networks. In Proceedings of the Advances in neural information processing systems, Stateline, NV, USA, 3 –8 December 2012; pp. 1097–1105. [Google Scholar]
- Simonyan, K.; Zisserman, A. Very deep convolutional networks for large-scale image recognition. arXiv 2014, arXiv:1409.1556. [Google Scholar]
- Szegedy, C.; Liu, W.; Jia, Y.; Sermanet, P.; Reed, S.; Anguelov, D.; Erhan, D.; Vanhoucke, V.; Rabinovich, A. Going deeper with convolutions. In Proceedings of the IEEE Conference on Computer Vision and Pattern Recognition, Columbus, OH, USA, 24 June–27 June 2014; pp. 1–9. [Google Scholar]
- He, K.; Zhang, X.; Ren, S.; Sun, J. Deep residual learning for image recognition. In Proceedings of Proceedings of the IEEE Conference on Computer Vision and Pattern Recognition, Las Vegas, NV, USA, 27–30 June 2016; pp. 770–778. [Google Scholar]
- Huang, G.; Liu, Z.; Van Der Maaten, L.; Weinberger, K.Q. Densely connected convolutional networks. In Proceedings of the IEEE Conference on Computer Vision and Pattern Recognition, Honolulu, HI, USA, 21–26 July 2017; pp. 4700–4708. [Google Scholar]
- Hochreiter, S.; Schmidhuber, J. Long short-term memory. Neural Comput. 1997, 9, 1735–1780. [Google Scholar] [CrossRef]
- Chung, J.; Gulcehre, C.; Cho, K.; Bengio, Y. Empirical evaluation of gated recurrent neural networks on sequence modeling. arXiv 2014, arXiv:1412.3555. [Google Scholar]
- Zhao, R.; Yan, R.; Chen, Z.; Mao, K.; Wang, P.; Gao, R.X. Deep learning and its applications to machine health monitoring. Mech. Syst. Signal Process. 2019, 115, 213–237. [Google Scholar] [CrossRef]
- Huang, J.; Wang, X.; Ren, G.; Wang, D. A hydraulic fault diagnosis method based on sliding-window spectrum feature and deep belief network. J. Vibroengineering 2017, 19, 4272–4284. [Google Scholar] [CrossRef]
- Wen, L.; Li, X.; Gao, L.; Zhang, Y. A New Convolutional Neural Network-Based Data-Driven Fault Diagnosis Method. IEEE Trans. Ind. Electron. 2018, 65, 5990–5998. [Google Scholar] [CrossRef]
- Lu, C.; Wang, Z.-Y.; Qin, W.-L.; Ma, J. Fault diagnosis of rotary machinery components using a stacked denoising autoencoder-based health state identification. Signal Process. 2017, 130, 377–388. [Google Scholar] [CrossRef]
- Szabó, J.Z.; Bakucz, P. Identification of nonlinearity in knocking vibration signals of large gas engine by deep learning. In Proceedings of the 2016 IEEE 20th Jubilee International Conference on Intelligent Engineering Systems (INES), Budapest, Hungary, 30 June–2 July 2016; pp. 39–44. [Google Scholar]
- Luo, B.; Wang, H.; Liu, H.; Li, B.; Peng, F. Early Fault Detection of Machine Tools Based on Deep Learning and Dynamic Identification. IEEE Trans. Ind. Electron. 2019, 66, 509–518. [Google Scholar] [CrossRef]
- Jin, K.H.; McCann, M.T.; Froustey, E.; Unser, M. Deep convolutional neural network for inverse problems in imaging. IEEE Trans. Image Process. 2017, 26, 4509–4522. [Google Scholar] [CrossRef] [Green Version]
- Günnemann, N.; Pfeffer, J. Predicting defective engines using convolutional neural networks on temporal vibration signals. In Proceedings of the First International Workshop on Learning with Imbalanced Domains: Theory and Applications, Limassol, Cyprus, 29–31 October 2018; pp. 92–102. [Google Scholar]
- Huang, H.B.; Huang, X.R.; Li, R.X.; Lim, T.C.; Ding, W.P. Sound quality prediction of vehicle interior noise using deep belief networks. Appl. Acoust. 2016, 113, 149–161. [Google Scholar] [CrossRef] [Green Version]
- Xie, J.; Li, T.; Yang, Y.; Jin, W. Learning features from high speed train vibration signals with deep belief networks. In Proceedings of the 2014 International Joint Conference on Neural Networks (IJCNN), Beijing, China, 6–11 July 2014; pp. 2205–2210. [Google Scholar]
- Punjani, A.; Abbeel, P. Deep learning helicopter dynamics models. In Proceedings of the 2015 IEEE International Conference on Robotics and Automation (ICRA), Seattle, WA, USA, 26–30 May 2015; pp. 3223–3230. [Google Scholar]
- Abbeel, P.; Coates, A.; Ng, A.Y. Autonomous Helicopter Aerobatics through Apprenticeship Learning. Int J. Robot Res. 2010, 29, 1608–1639. [Google Scholar] [CrossRef]
- Dai, J.; Tang, J.; Shao, F.; Huang, S.; Wang, Y. Fault Diagnosis of Rolling Bearing Based on Multiscale Intrinsic Mode Function Permutation Entropy and a Stacked Sparse Denoising Autoencoder. Appl. Sci. 2019, 9, 2743. [Google Scholar] [CrossRef] [Green Version]
- Smith, W.A.; Randall, R.B. Rolling element bearing diagnostics using the Case Western Reserve University data: A benchmark study. Mech. Syst. Signal Process. 2015, 64–65, 100–131. [Google Scholar] [CrossRef]
- Tao, Y.; Wang, X.; Sanchez, R.-V.; Yang, S.; Bai, Y. Spur Gear Fault Diagnosis Using a Multilayer Gated Recurrent Unit Approach With Vibration Signal. IEEE Access 2019, 7, 56880–56889. [Google Scholar] [CrossRef]
- He, J.; Yang, S.; Gan, C. Unsupervised Fault Diagnosis of a Gear Transmission Chain Using a Deep Belief Network. Sensors 2017, 17, 1564. [Google Scholar] [CrossRef] [PubMed]
- Zhang, W.; Peng, G.; Li, C.; Chen, Y.; Zhang, Z. A New Deep Learning Model for Fault Diagnosis with Good Anti-Noise and Domain Adaptation Ability on Raw Vibration Signals. Sensors 2017, 17, 425. [Google Scholar] [CrossRef]
- Qian, W.; Li, S.; Wang, J.; Xin, Y.; Ma, H. A New Deep Transfer Learning Network for Fault Diagnosis of Rotating Machine Under Variable Working Conditions. In Proceedings of the 2018 Prognostics and System Health Management Conference (PHM-Chongqing), Chongqing, China, 26–28 October 2018; pp. 1010–1016. [Google Scholar]
- Nguyen, V.H.; Cheng, J.S.; Yu, Y.; Thai, V.T. An architecture of deep learning network based on ensemble empirical mode decomposition in precise identification of bearing vibration signal. J. Mech. Sci. Technol. 2019, 33, 41–50. [Google Scholar] [CrossRef]
- Li, C.; Sanchez, R.V.; Zurita, G.; Cerrada, M.; Cabrera, D. Fault Diagnosis for Rotating Machinery Using Vibration Measurement Deep Statistical Feature Learning. Sensors 2016, 16, 895. [Google Scholar] [CrossRef] [Green Version]
- Li, C.; Sanchez, R.-V.; Zurita, G.; Cerrada, M.; Cabrera, D.; Vásquez, R.E. Gearbox fault diagnosis based on deep random forest fusion of acoustic and vibratory signals. Mech. Syst. Signal Process. 2016, 76–77, 283–293. [Google Scholar] [CrossRef]
- Sun, J.; Yan, C.; Wen, J. Intelligent bearing fault diagnosis method combining compressed data acquisition and deep learning. IEEE Trans. Instrum. Meas. 2017, 67, 185–195. [Google Scholar] [CrossRef]
- Chen, Z.; Li, W. Multisensor feature fusion for bearing fault diagnosis using sparse autoencoder and deep belief network. IEEE Trans. Instrum. Meas. 2017, 66, 1693–1702. [Google Scholar] [CrossRef]
- Shao, H.; Jiang, H.; Zhao, H.; Wang, F. A novel deep autoencoder feature learning method for rotating machinery fault diagnosis. Mech. Syst. Signal Process. 2017, 95, 187–204. [Google Scholar] [CrossRef]
- Pan, T.; Chen, J.; Zhou, Z.; Wang, C.; He, S. A Novel Deep Learning Network via Multi-Scale Inner Product with Locally Connected Feature Extraction for Intelligent Fault Detection. IEEE Trans. Ind. Inform. 2019, 15, 5119–5128. [Google Scholar] [CrossRef]
- Cao, P.; Zhang, S.; Tang, J. Preprocessing-Free Gear Fault Diagnosis Using Small Datasets with Deep Convolutional Neural Network-Based Transfer Learning. IEEE Access 2018, 6, 26241–26253. [Google Scholar] [CrossRef]
- Liu, H.; Li, L.; Ma, J. Rolling Bearing Fault Diagnosis Based on STFT-Deep Learning and Sound Signals. Shock Vib. 2016, 2016, 1–12. [Google Scholar] [CrossRef] [Green Version]
- Deutsch, J.; He, D. Using Deep Learning-Based Approach to Predict Remaining Useful Life of Rotating Components. IEEE Trans. Syst. Manand Cybern. Syst. 2018, 48, 11–20. [Google Scholar] [CrossRef]
- Heydarzadeh, M.; Kia, S.H.; Nourani, M.; Henao, H.; Capolino, G.-A. Gear fault diagnosis using discrete wavelet transform and deep neural networks. In Proceedings of the IECON 2016-42nd Annual Conference of the IEEE Industrial Electronics Society, Florence, Italy, 24–27 October 2016; pp. 1494–1500. [Google Scholar]
- Liu, R.; Yang, B.; Zio, E.; Chen, X. Artificial intelligence for fault diagnosis of rotating machinery: A review. Mech. Syst. Signal Process. 2018, 108, 33–47. [Google Scholar] [CrossRef]
- Wang, D.; Tsui, K.-L.; Miao, Q. Prognostics and Health Management: A Review of Vibration Based Bearing and Gear Health Indicators. IEEE Access 2018, 6, 665–676. [Google Scholar] [CrossRef]
- Devendiran, S.; Manivannan, K. Vibration based condition monitoring and fault diagnosis technologies for bearing and gear components-a review. Int. J. Appl. Eng. Res. 2016, 11, 3966–3975. [Google Scholar]
- Chen, Z.; Shang, L.; Zhou, M. A FP-CNN method for aircraft fault prognostics. In Proceedings of the 2018 3rd International Conference on Automation, Mechanical Control and Computational Engineering (AMCCE 2018), Dalian, China, 12–13 May 2018. [Google Scholar]
- Fu, Y.; Zhang, Y.; Qiao, H.; Li, D.; Zhou, H.; Leopold, J. Analysis of Feature Extracting Ability for Cutting State Monitoring Using Deep Belief Networks. Procedia Cirp 2015, 31, 29–34. [Google Scholar] [CrossRef]
- Zhao, R.; Yan, R.; Wang, J.; Mao, K. Learning to Monitor Machine Health with Convolutional Bi-Directional LSTM Networks. Sensors 2017, 17, 273. [Google Scholar] [CrossRef]
- Yan, J.M.; Zhao, Y.; Guo, Z.H. Vibration signal analysis and fault diagnosis of bogies of the high-speed train based on deep neural networks. J. Vibroeng. 2017, 19, 2456–2474. [Google Scholar] [CrossRef]
- Wu, H.; Chen, J.; Liu, X.; Xiao, Y.; Wang, M.; Zheng, Y.; Rao, Y.-J. 1-D CNN based intelligent recognition of vibrations in pipeline monitoring with DAS. J. Lightwave Technol. 2019, 1. [Google Scholar] [CrossRef]
- Han, T.; Liu, C.; Yang, W.; Jiang, D. A novel adversarial learning framework in deep convolutional neural network for intelligent diagnosis of mechanical faults. Knowl. Based Syst. 2019, 165, 474–487. [Google Scholar] [CrossRef]
- Zhang, G.; Wang, Z.; Zhao, L.; Qi, Y.; Wang, J. Coal-Rock Recognition in Top Coal Caving Using Bimodal Deep Learning and Hilbert-Huang Transform. Shock Vib. 2017, 2017, 1–13. [Google Scholar] [CrossRef]
- Tamilselvan, P.; Wang, Y.; Wang, P. Deep belief network based state classification for structural health diagnosis. In Proceedings of the 2012 IEEE Aerospace Conference, Big Sky, MT, USA, 3–10 March 2012; pp. 1–11. [Google Scholar]
- Galloway, G.S.; Catterson, V.M.; Fay, T.; Robb, A.; Love, C. Diagnosis of tidal turbine vibration data through deep neural networks. In Proceedings of the Third European Conference of the Prognostics and Health Management Society, Bilbao, Spain, 5 –8 July 2016; pp. 172–180. [Google Scholar]
- Hu, H.; Tang, B.; Gong, X.; Wei, W.; Wang, H. Intelligent Fault Diagnosis of the High-Speed Train with Big Data Based on Deep Neural Networks. IEEE Trans. Ind. Inform. 2017, 13, 2106–2116. [Google Scholar] [CrossRef]
- Dong, H.; Yang, L.; Li, H. Small fault diagnosis of front-end speed controlled wind generator based on deep learning. Wseas Trans. Circuits Syst 2016, 15, 64–72. [Google Scholar]
- Guo, J.; Xie, X.; Bie, R.; Sun, L. Structural health monitoring by using a sparse coding-based deep learning algorithm with wireless sensor networks. Pers. Ubiquitous Comput. 2014, 18, 1977–1987. [Google Scholar] [CrossRef]
- Zhao, Y.; Noori, M.; Altabey, W.A.; Ghiasi, R.; Wu, Z.S. Deep Learning-Based Damage, Load and Support Identification for a Composite Pipeline by Extracting Modal Macro Strains from Dynamic Excitations. Appl. Sci. 2018, 8, 2564. [Google Scholar] [CrossRef] [Green Version]
- Abdeljaber, O.; Avci, O.; Kiranyaz, S.; Gabbouj, M.; Inman, D.J. Real-time vibration-based structural damage detection using one-dimensional convolutional neural networks. J. Sound Vib. 2017, 388, 154–170. [Google Scholar] [CrossRef]
- Onchis, H.D.M. A deep learning approach to condition monitoring of cantilever beams via time-frequency extended signatures. Comput. Ind. 2019, 105, 177–181. [Google Scholar] [CrossRef]
- Lin, Y.-z.; Nie, Z.-h.; Ma, H.-w. Structural Damage Detection with Automatic Feature-Extraction through Deep Learning. Comput. Aided Civ. Infrastruct. Eng. 2017, 32, 1025–1046. [Google Scholar] [CrossRef]
- de Oliveira, M.; Monteiro, A.; Vieira Filho, J. A New Structural Health Monitoring Strategy Based on PZT Sensors and Convolutional Neural Network. Sensors 2018, 18, 2955. [Google Scholar] [CrossRef] [PubMed] [Green Version]
Figure 1.
Vibration responses of the nut-runner during bolt tightening for clamping force of (a) 47 kN, (b) 37 kN, (c) 27 kN and (d) 17 kN.
Figure 1.
Vibration responses of the nut-runner during bolt tightening for clamping force of (a) 47 kN, (b) 37 kN, (c) 27 kN and (d) 17 kN.

Figure 2.
Short-time cepstral coefficients for clamping force of (a) 47 kN, (b) 37 kN, (c) 27 kN and (d) 17 kN.
Figure 2.
Short-time cepstral coefficients for clamping force of (a) 47 kN, (b) 37 kN, (c) 27 kN and (d) 17 kN.

Figure 3.
Comparison of Euclidean distance for determination of bolt clamping force by vibration responses calculated by different by machine learning algorithms: (a) k-means, (b) principal component analysis (PCA), (c) agglomerative clustering, (d) density-based spatial clustering of application with noise (DBSCAN).

Figure 4.
Converted images on nine fault conditions from [98], Copyright 2018, IEEE.
Figure 4.
Converted images on nine fault conditions from [98], Copyright 2018, IEEE.

Figure 5.
Framework of the early fault detection method based on deep learning and dynamics identification from [101], Copyright 2019, IEEE.
Figure 5.
Framework of the early fault detection method based on deep learning and dynamics identification from [101], Copyright 2019, IEEE.

Figure 6.
Bearing test ring tests from [108], Copyright 2019, MDPI. A = fan end bearing; B = electronic motor; C = drive end bearing; D = torque transducer; E = dynamometer.
Figure 6.
Bearing test ring tests from [108], Copyright 2019, MDPI. A = fan end bearing; B = electronic motor; C = drive end bearing; D = torque transducer; E = dynamometer.

Figure 7.
Diagnosis result of the four tests from [108], Copyright 2019, MDPI.
Figure 7.
Diagnosis result of the four tests from [108], Copyright 2019, MDPI.

Figure 8.
System structure and its distributed recognition scheme for safety monitoring of long distance buried oil pipelines with hybrid fiberoptic acoustic sensor (DAS) from [132], Copyright 2019, IEEE Xplore.
Figure 8.
System structure and its distributed recognition scheme for safety monitoring of long distance buried oil pipelines with hybrid fiberoptic acoustic sensor (DAS) from [132], Copyright 2019, IEEE Xplore.

Figure 9.
The ten-fold-cross evaluation for the proposed method (1-D convolutional neural network (CNN) + support vector machine (SVM)) and the conventional machine learning method (hand-crafted feature + SVM) from [132], Copyright 2019, IEEE Xplore.
Figure 9.
The ten-fold-cross evaluation for the proposed method (1-D convolutional neural network (CNN) + support vector machine (SVM)) and the conventional machine learning method (hand-crafted feature + SVM) from [132], Copyright 2019, IEEE Xplore.

Figure 10.
Pipeline modeling from [140], Copyright 2018, MDPI.
Figure 10.
Pipeline modeling from [140], Copyright 2018, MDPI.

Figure 11.
Identification schematic using a convolutional neural network from [140], Copyright 2018, MDPI.
Figure 11.
Identification schematic using a convolutional neural network from [140], Copyright 2018, MDPI.


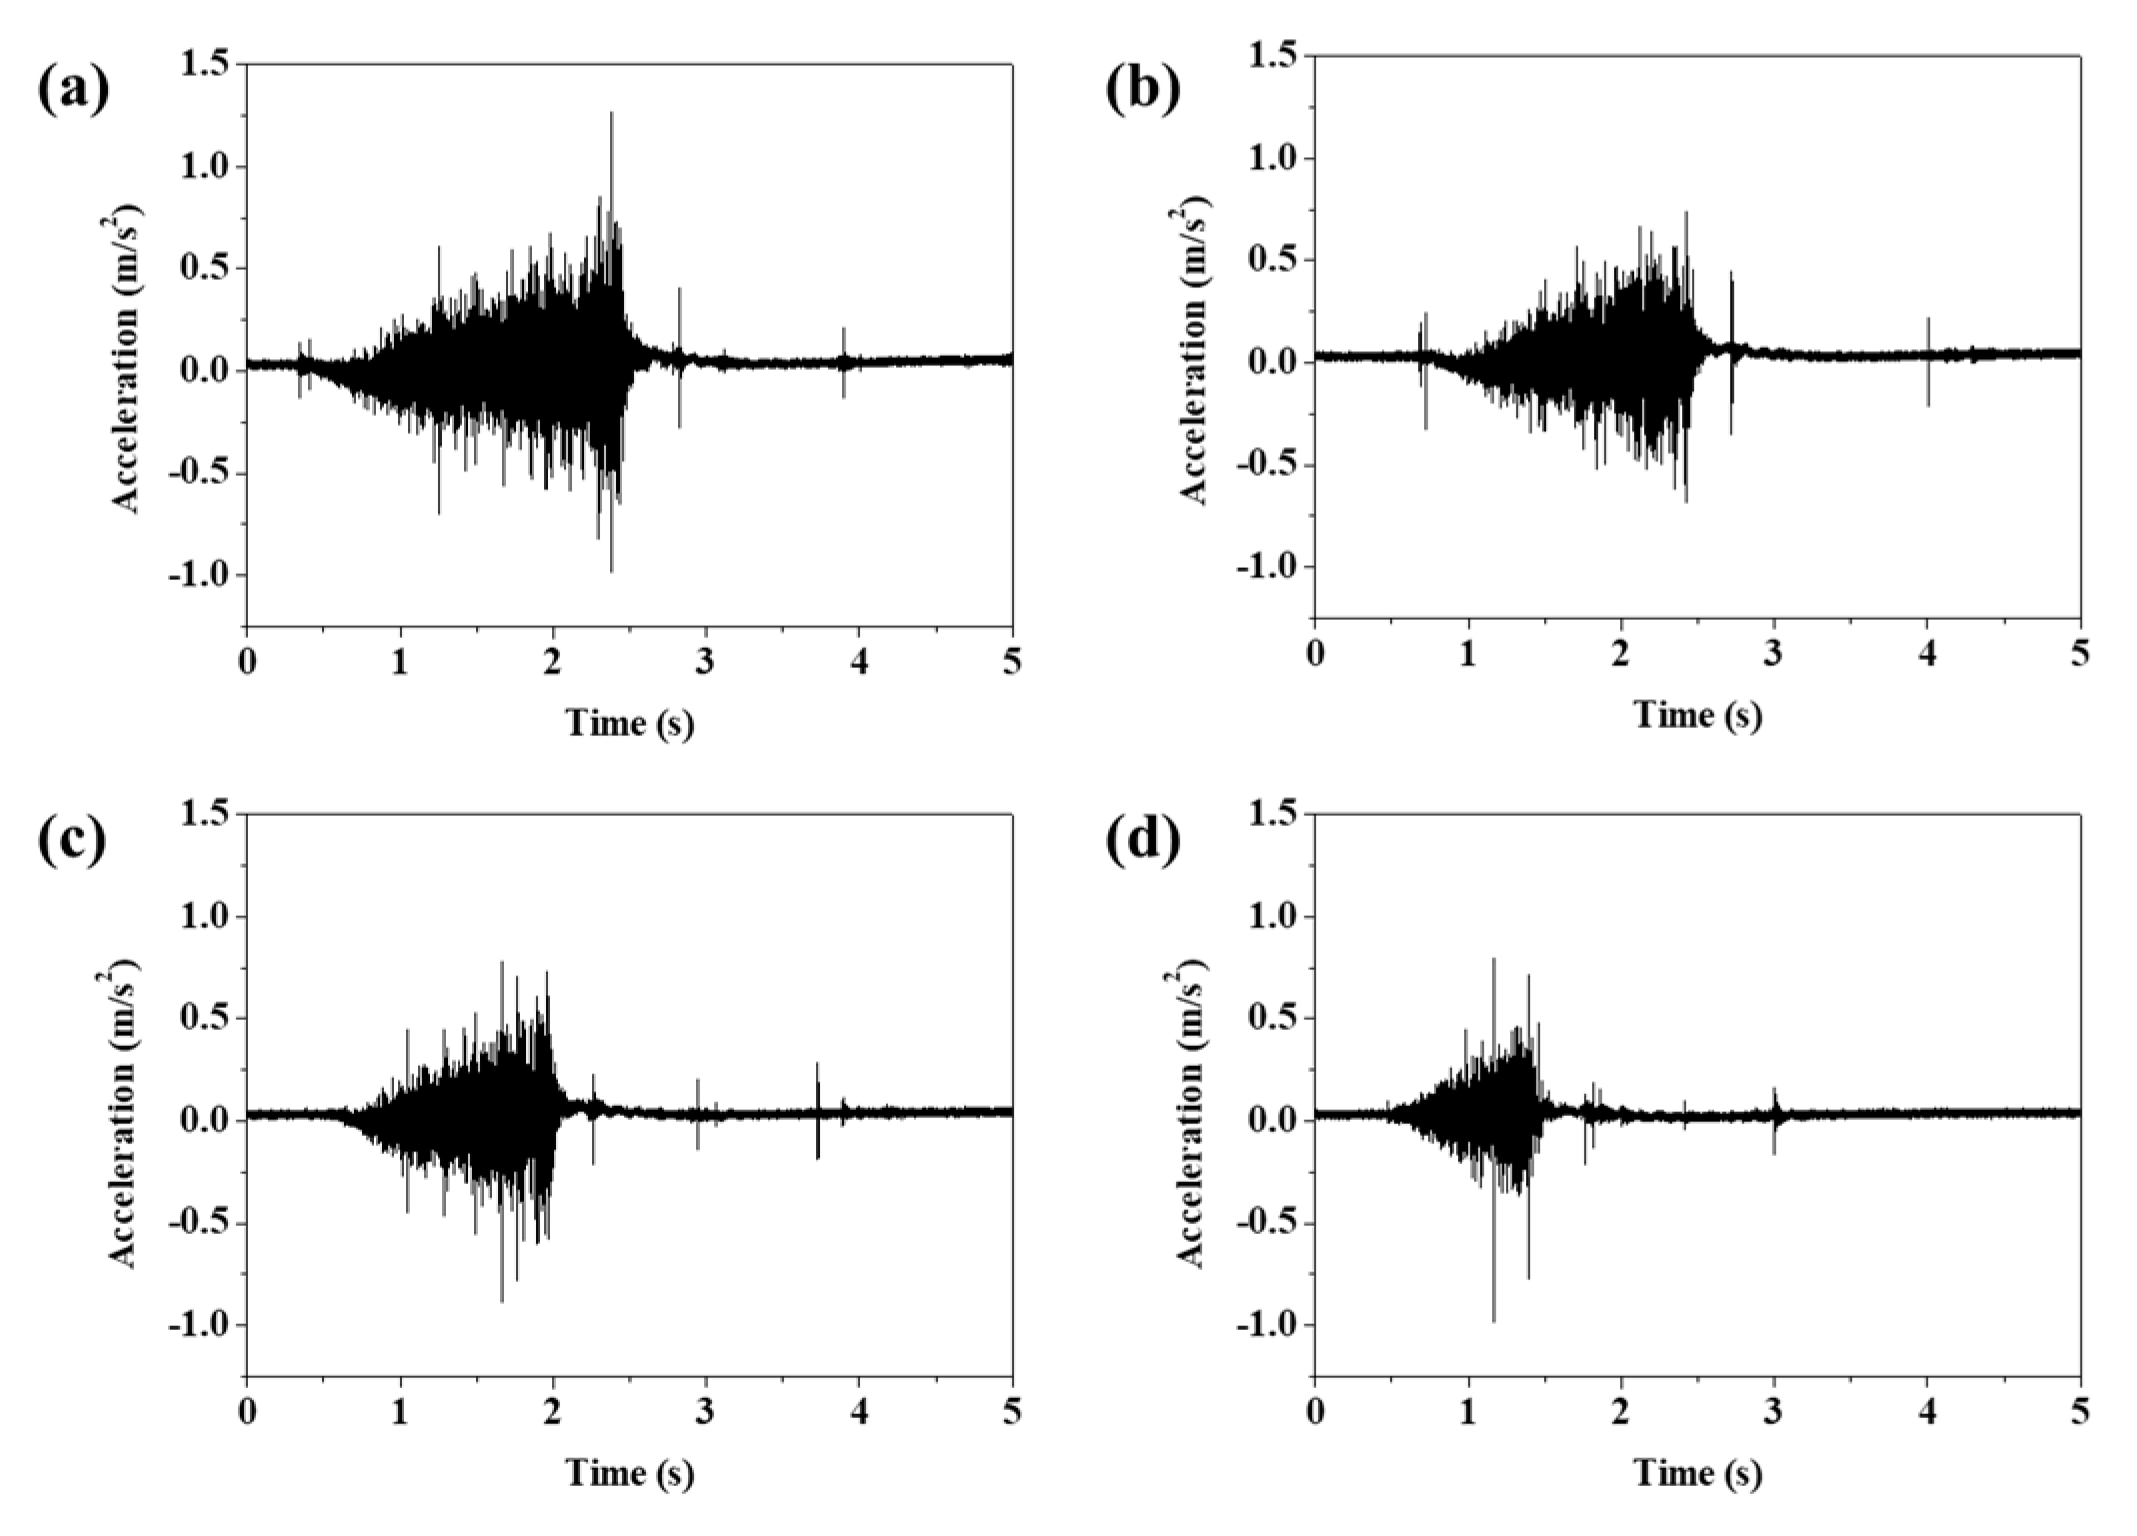
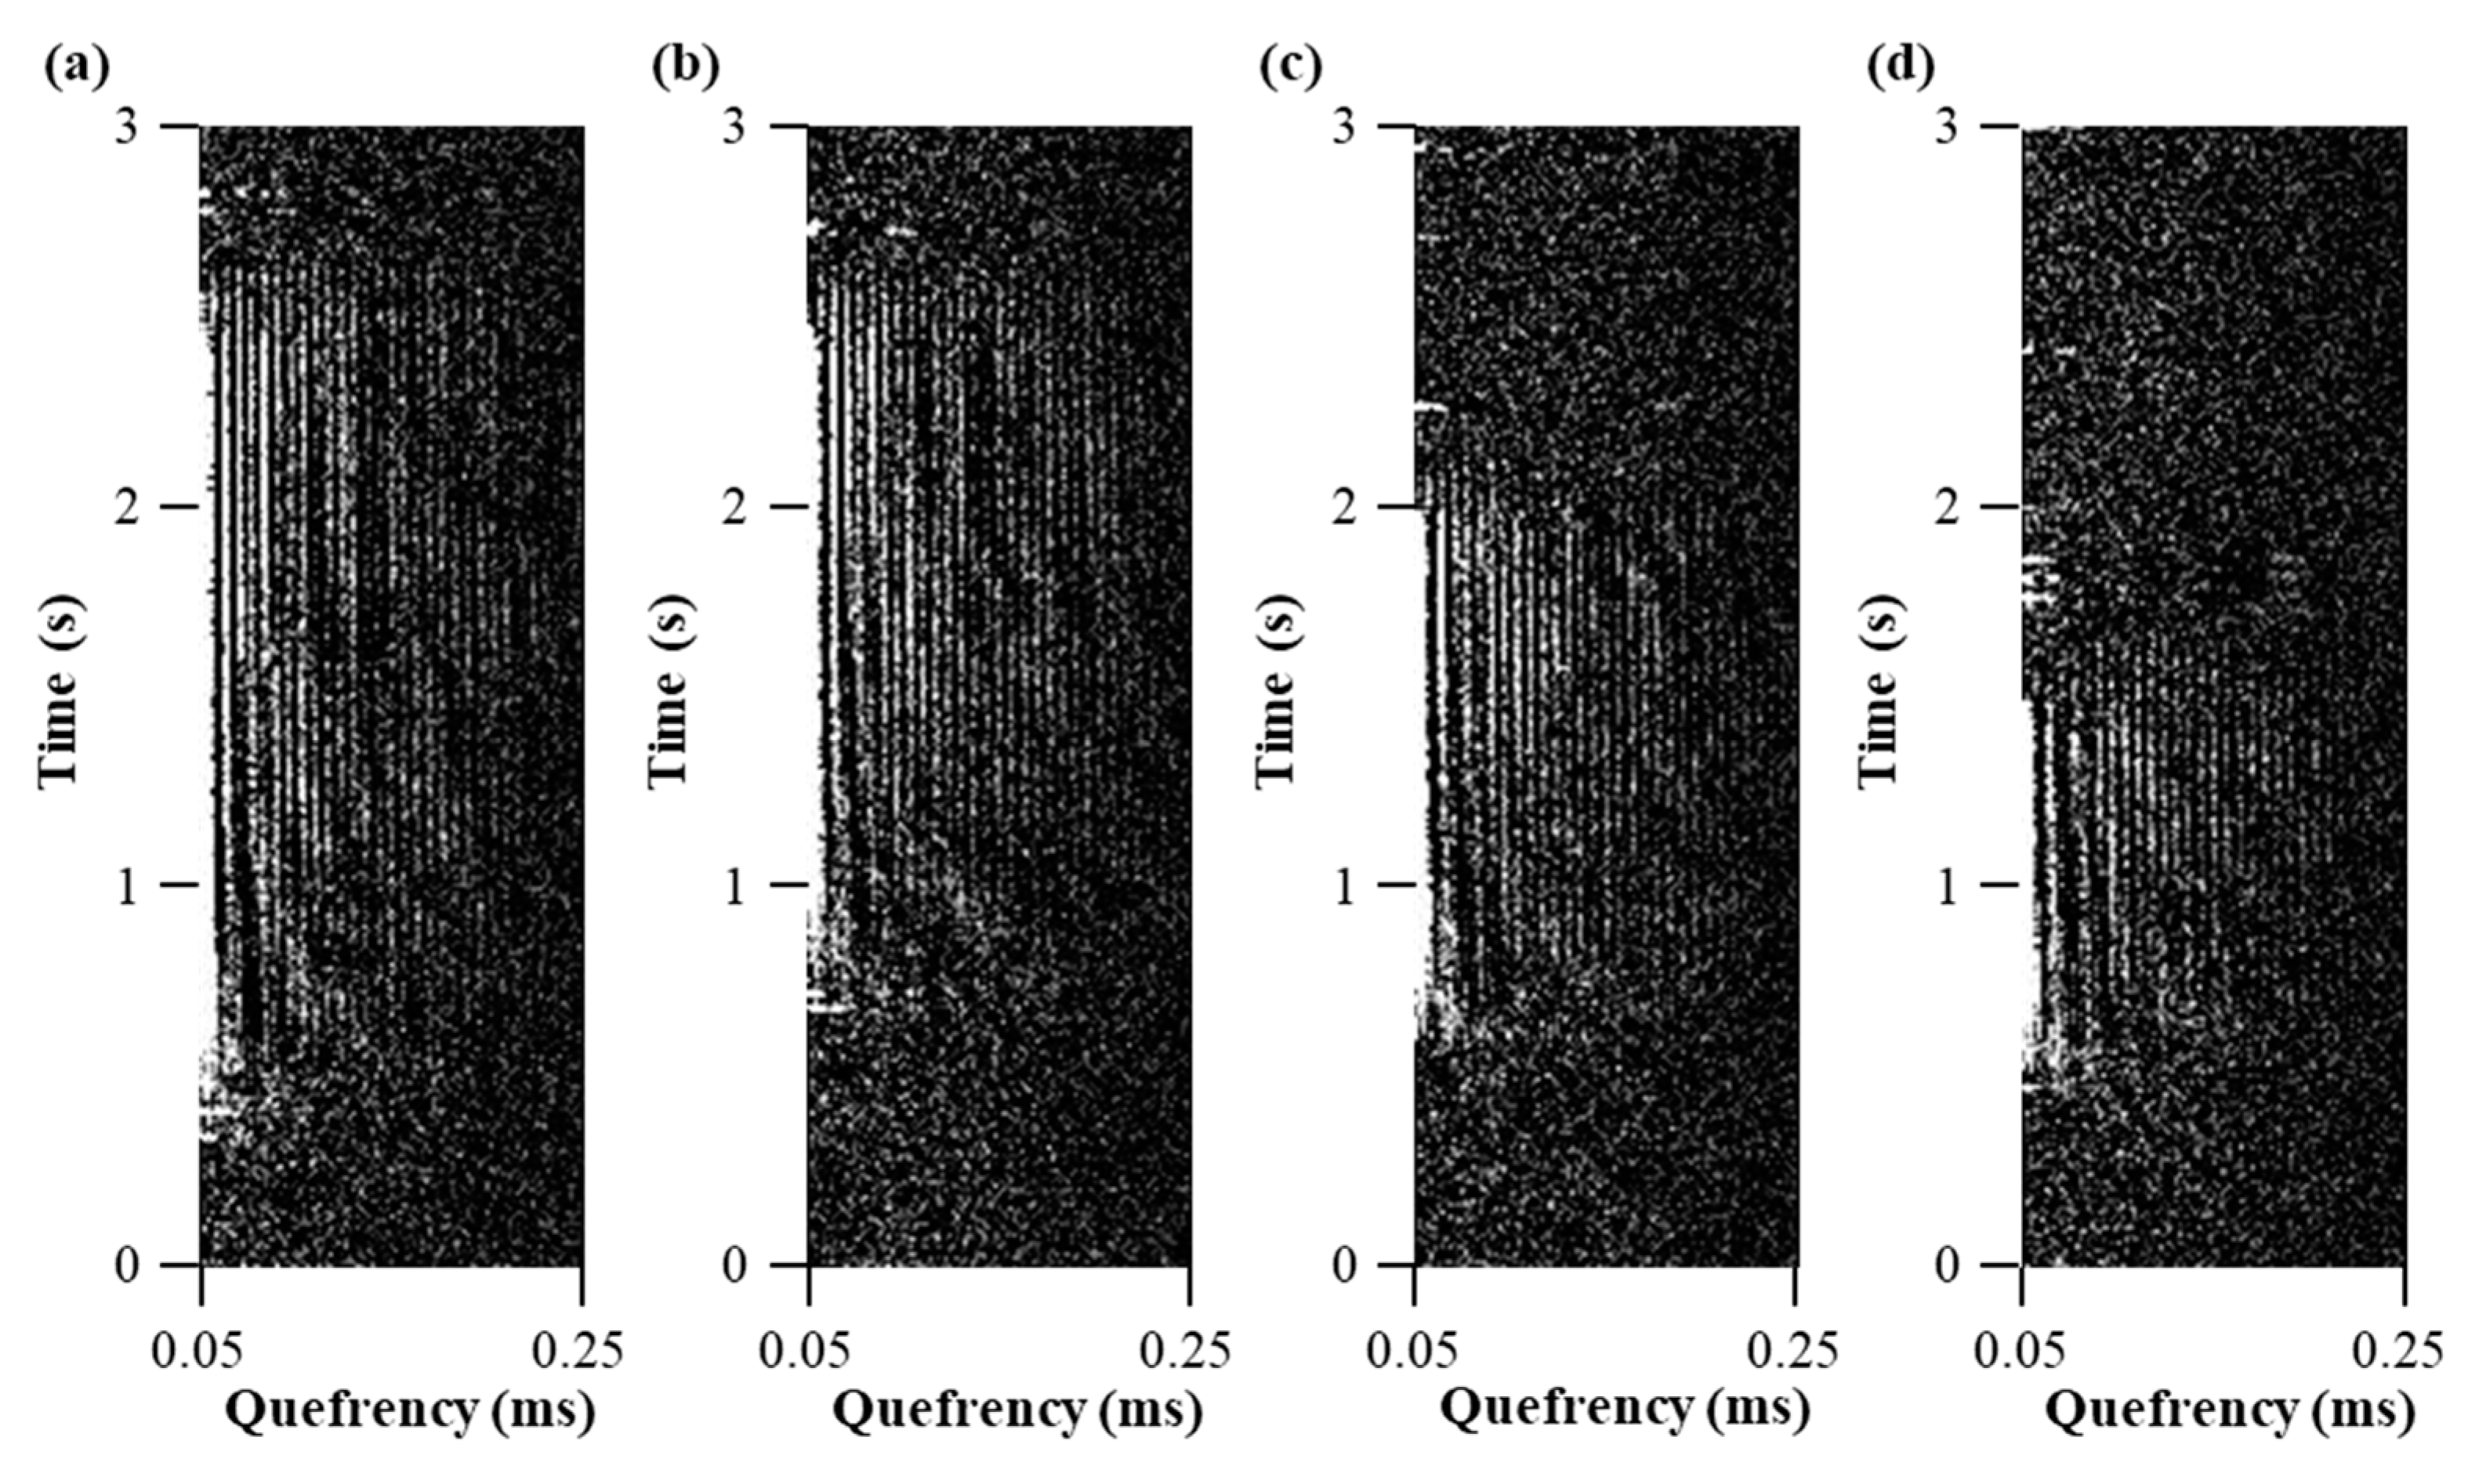
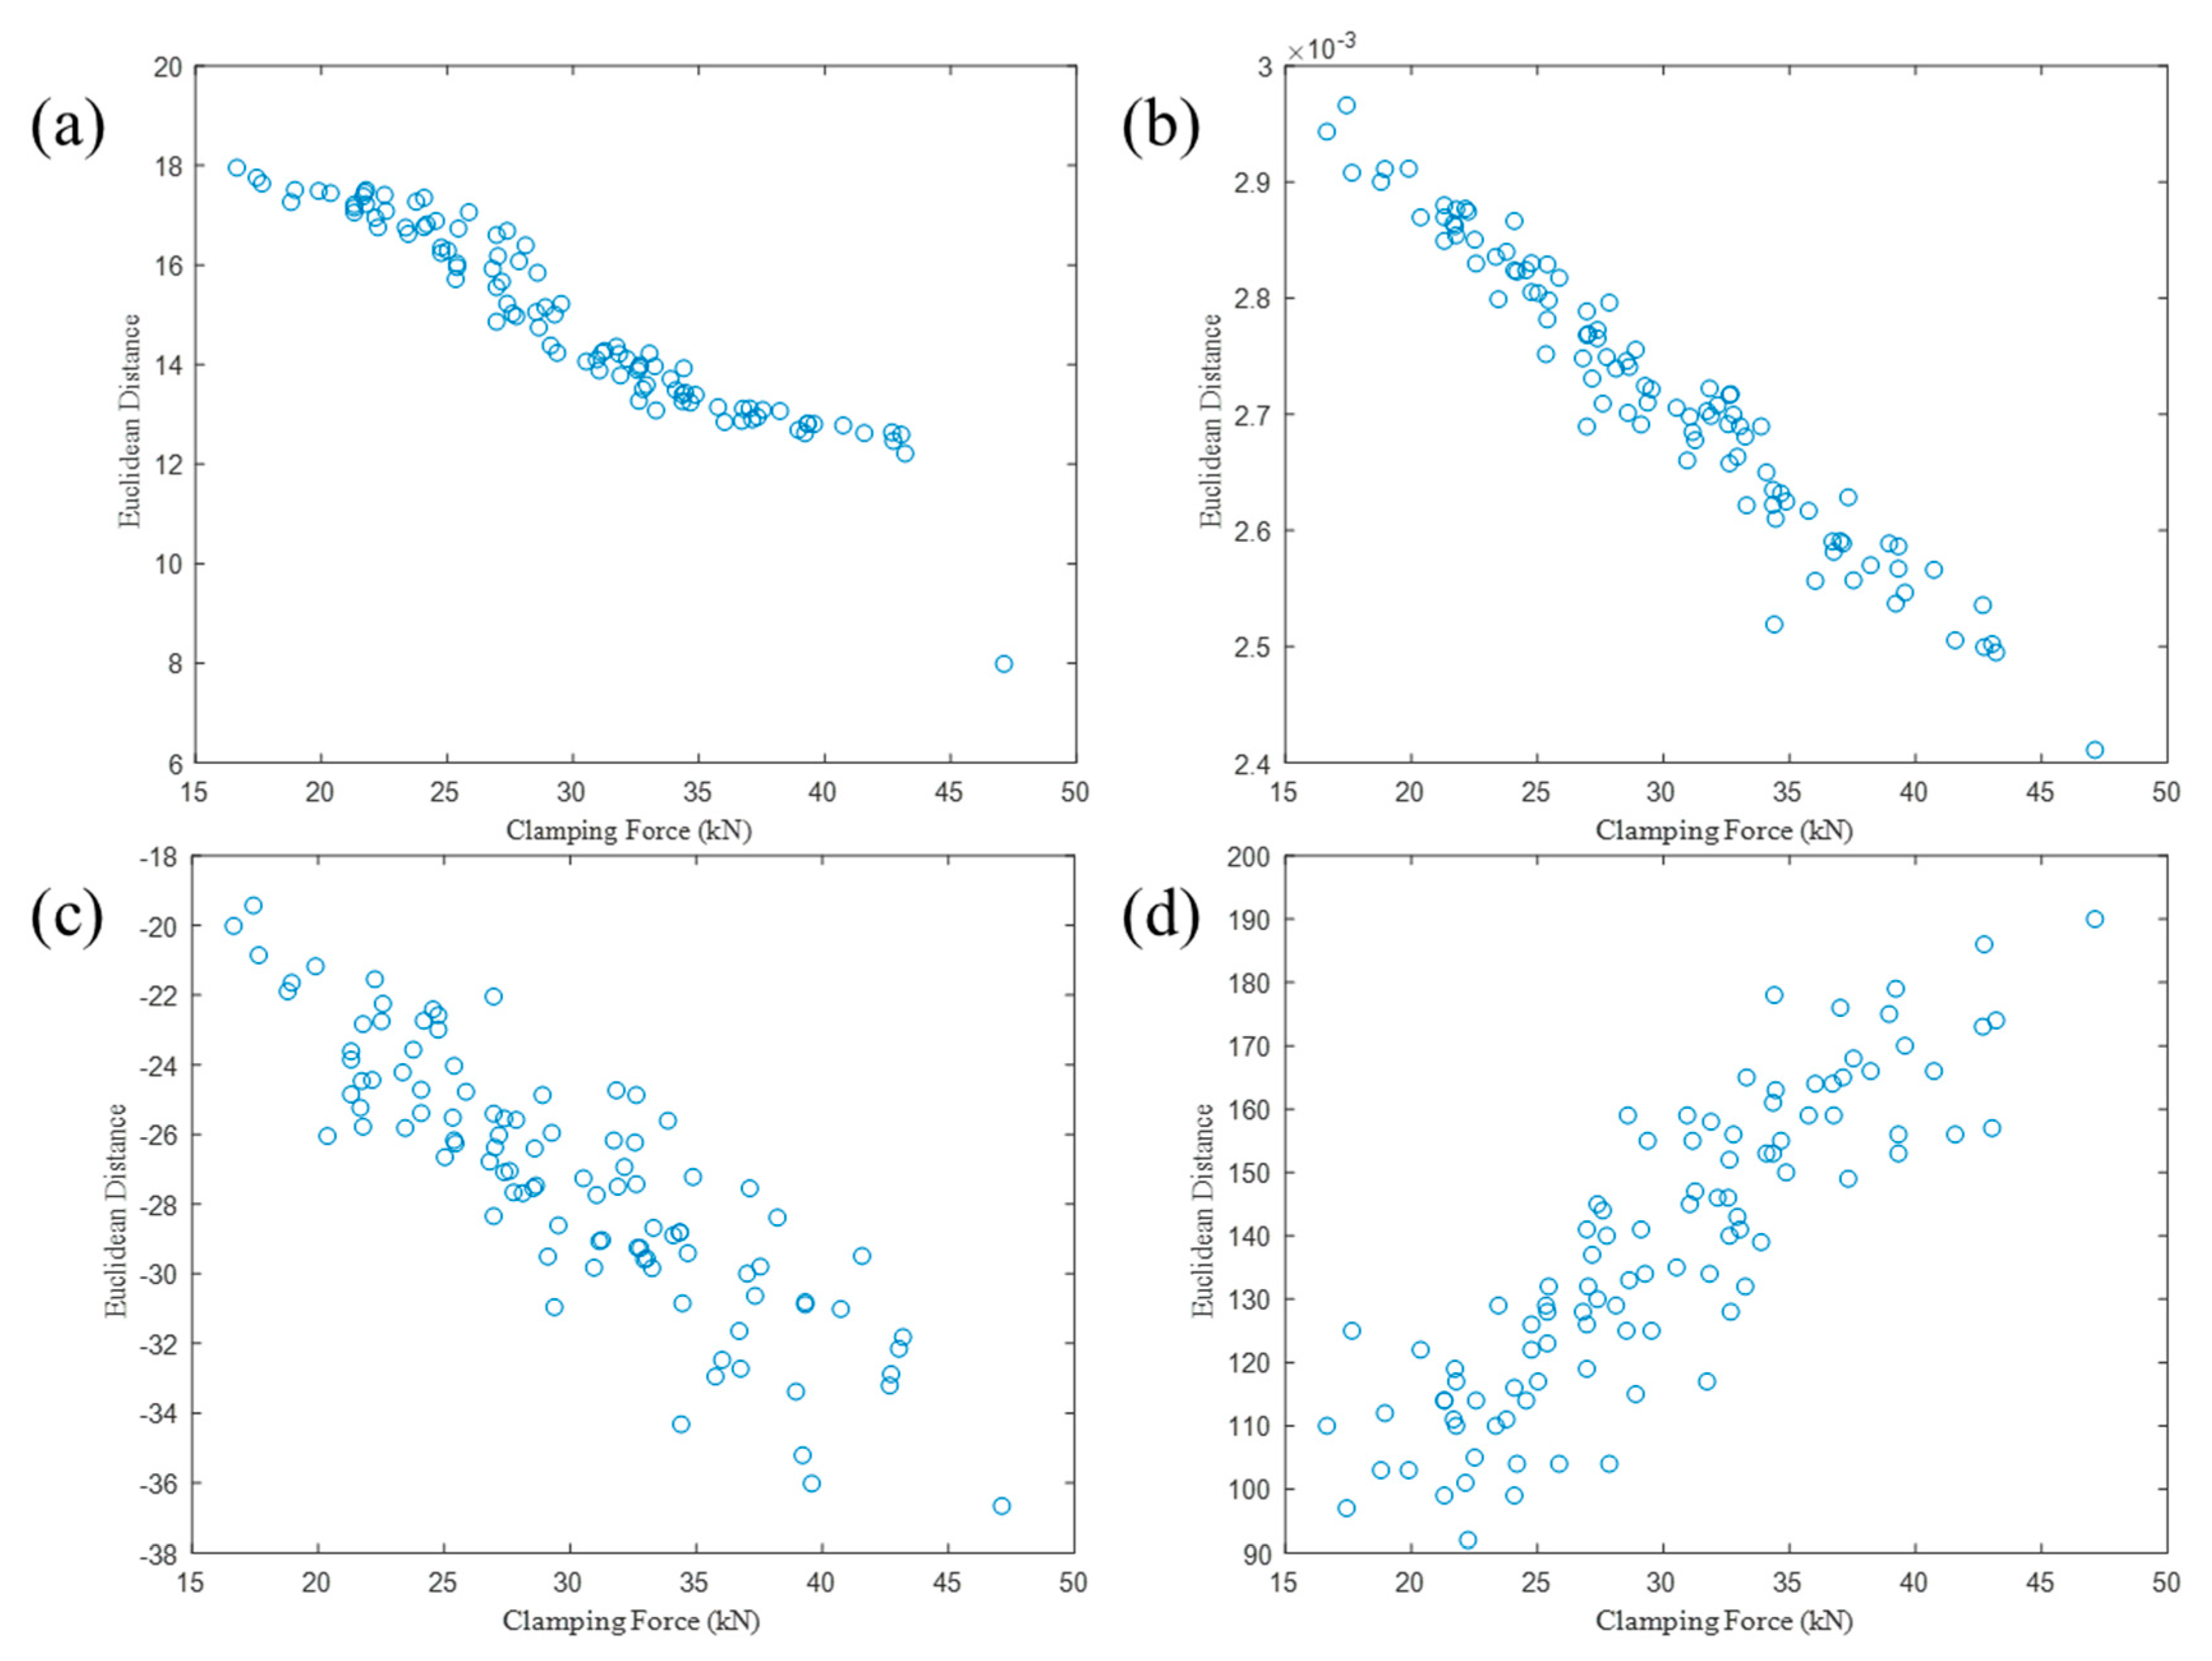
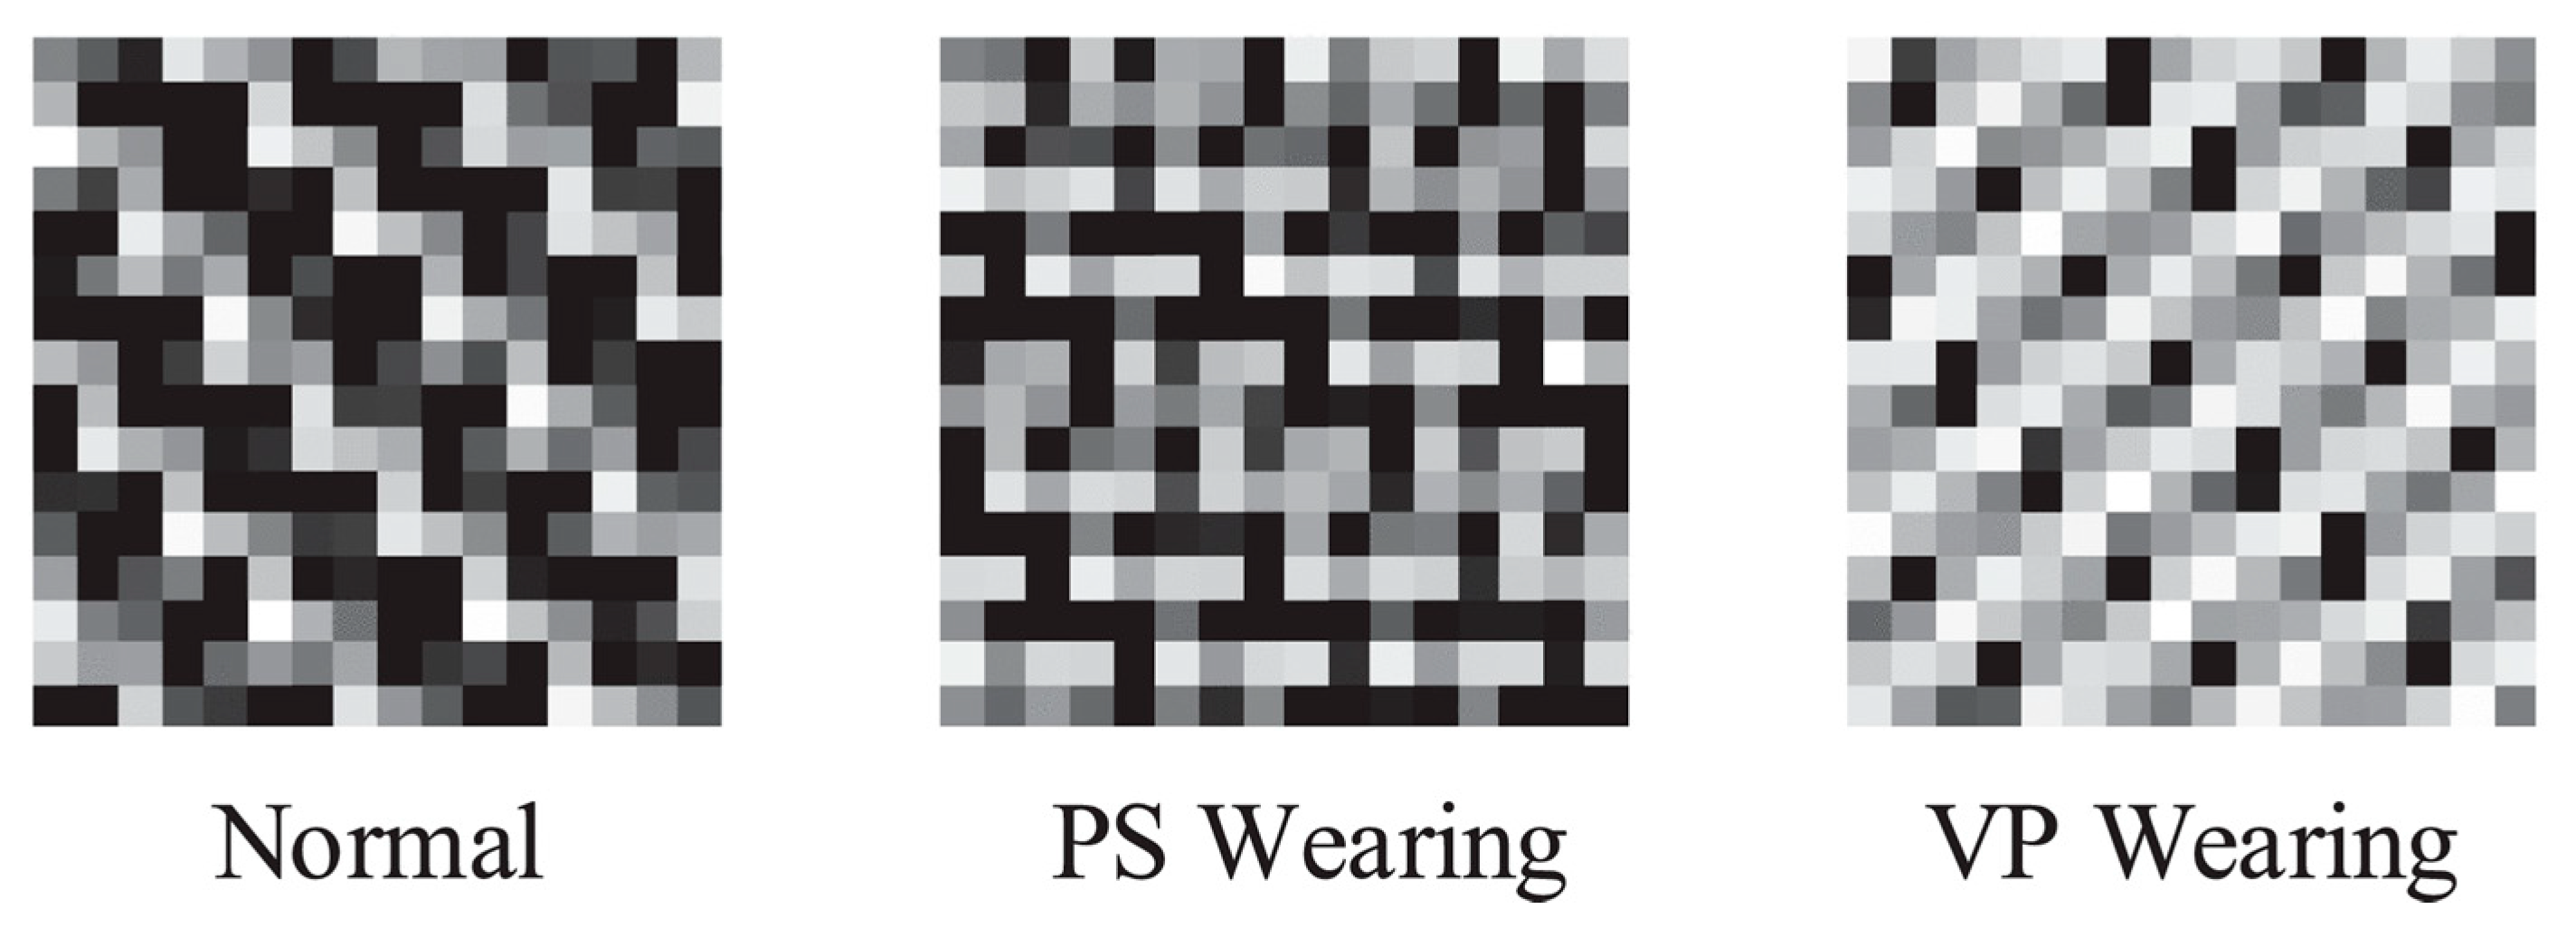
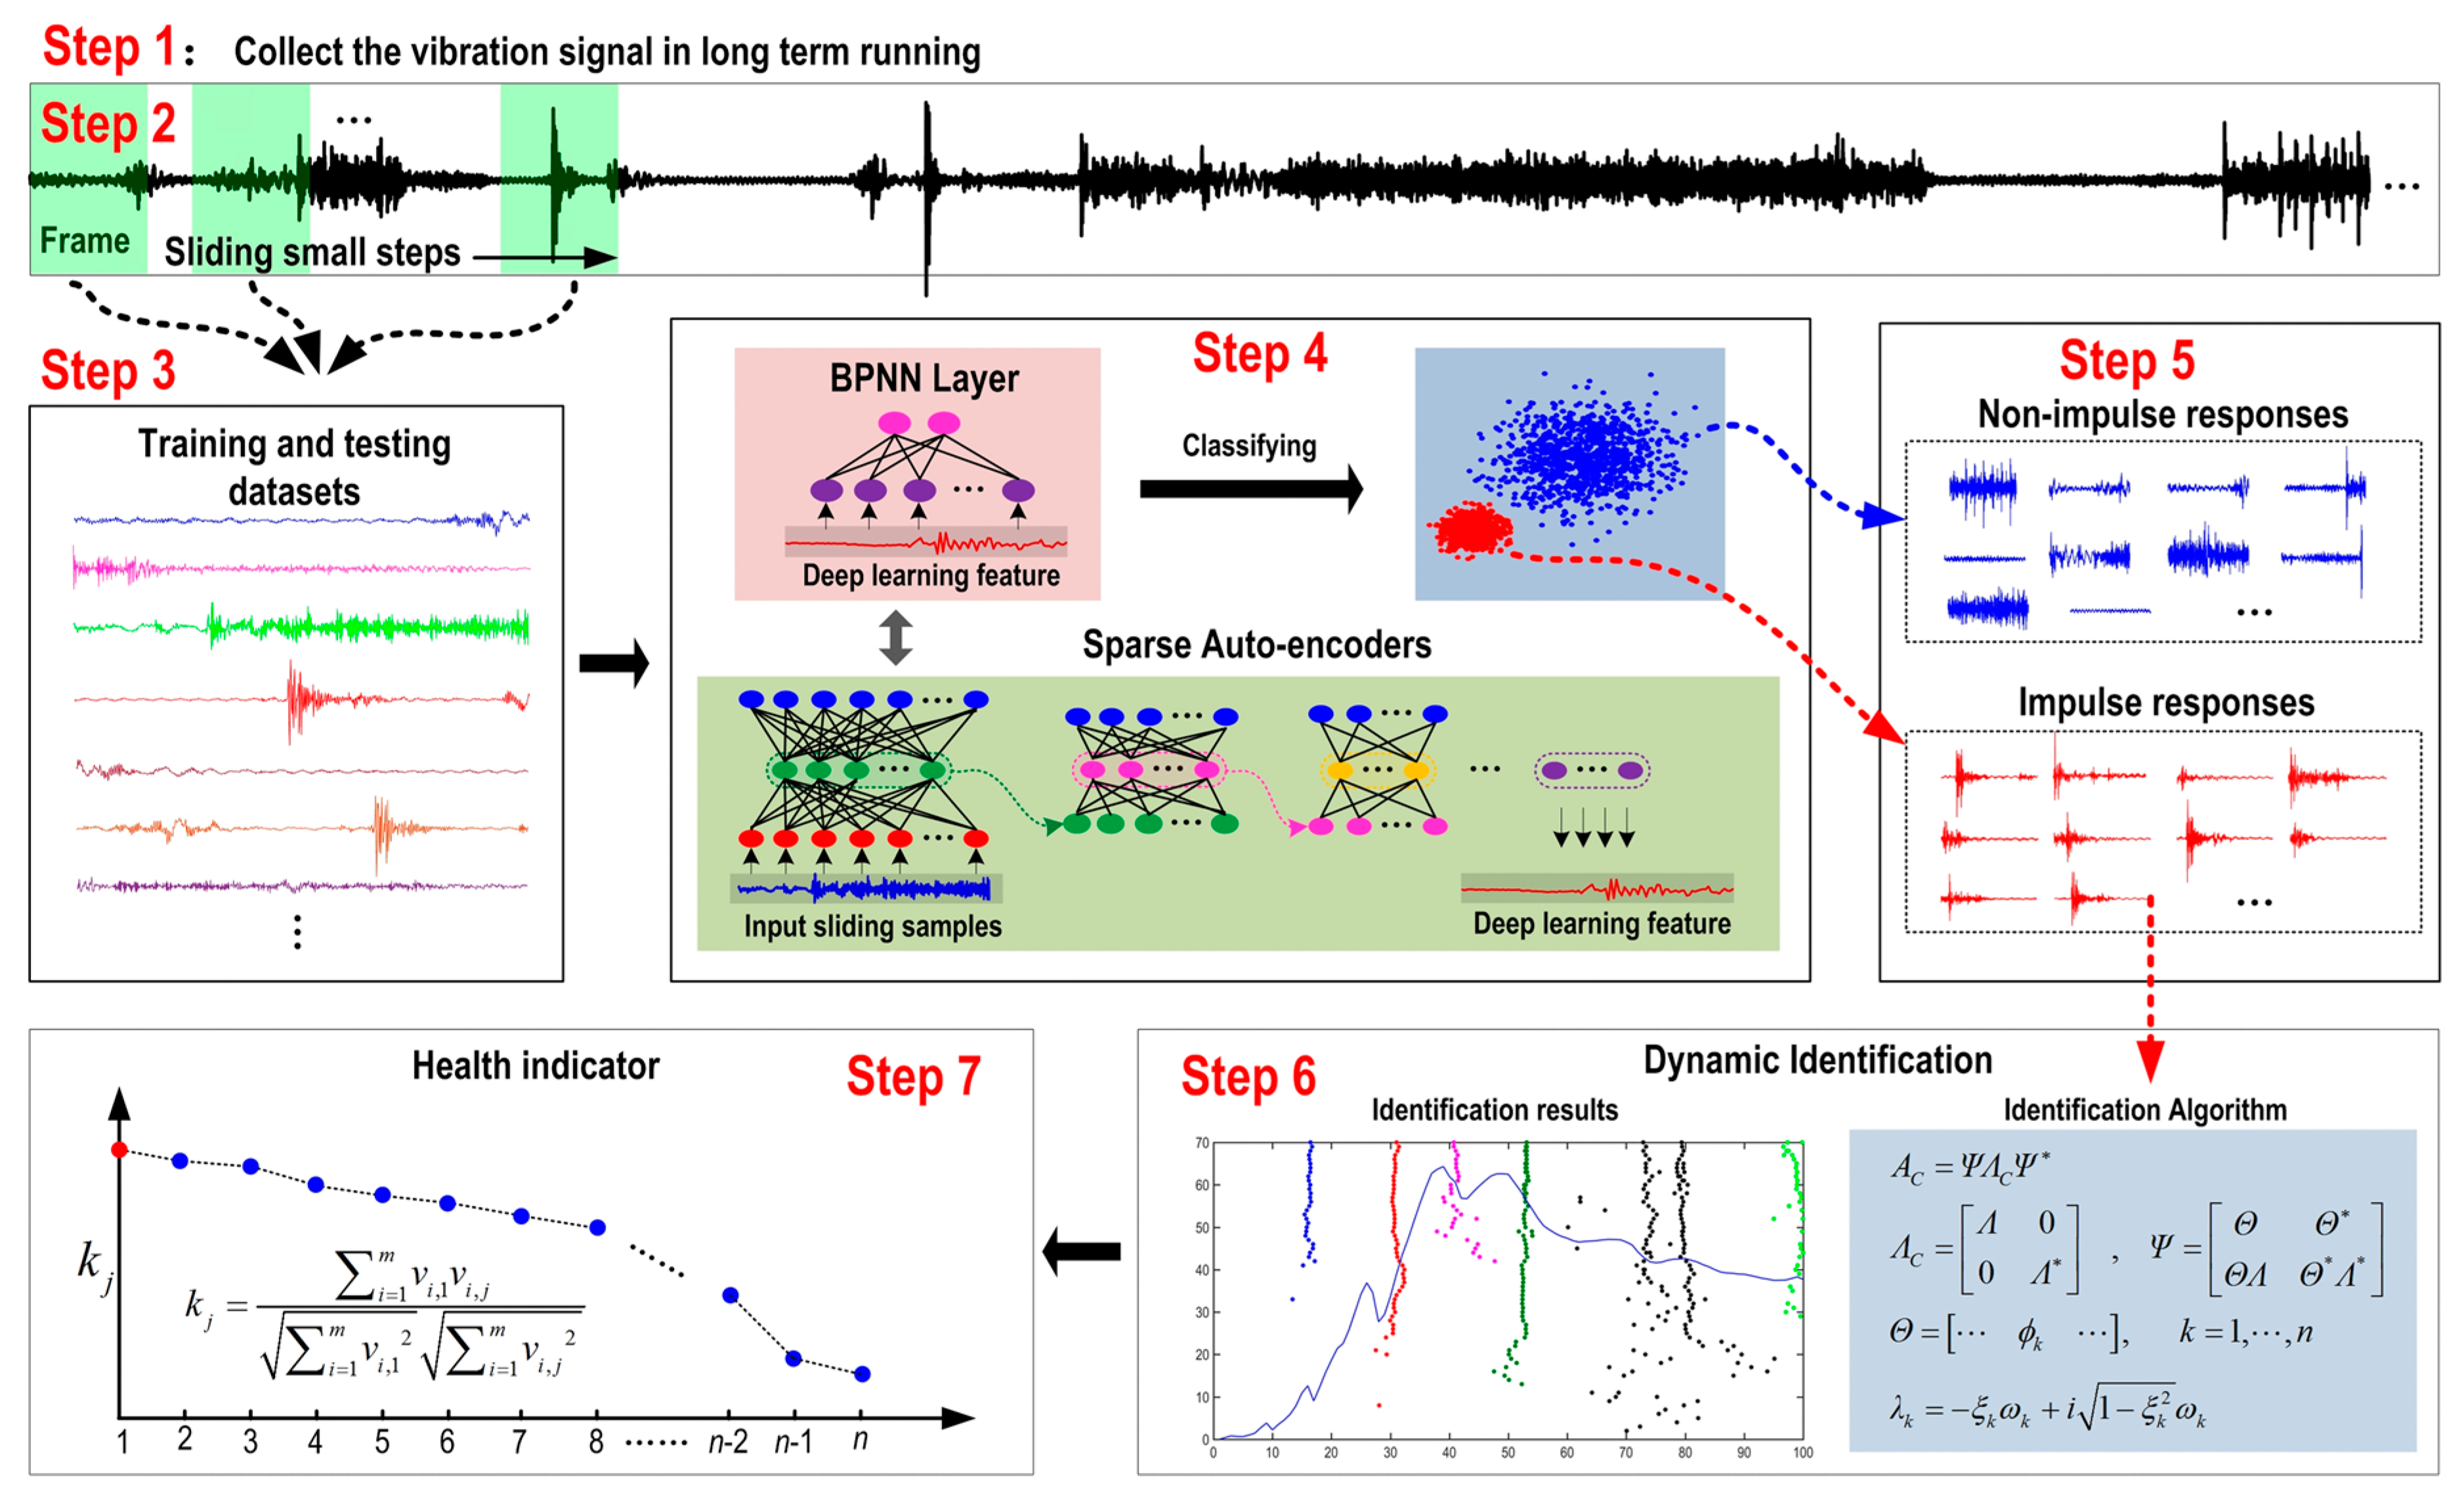
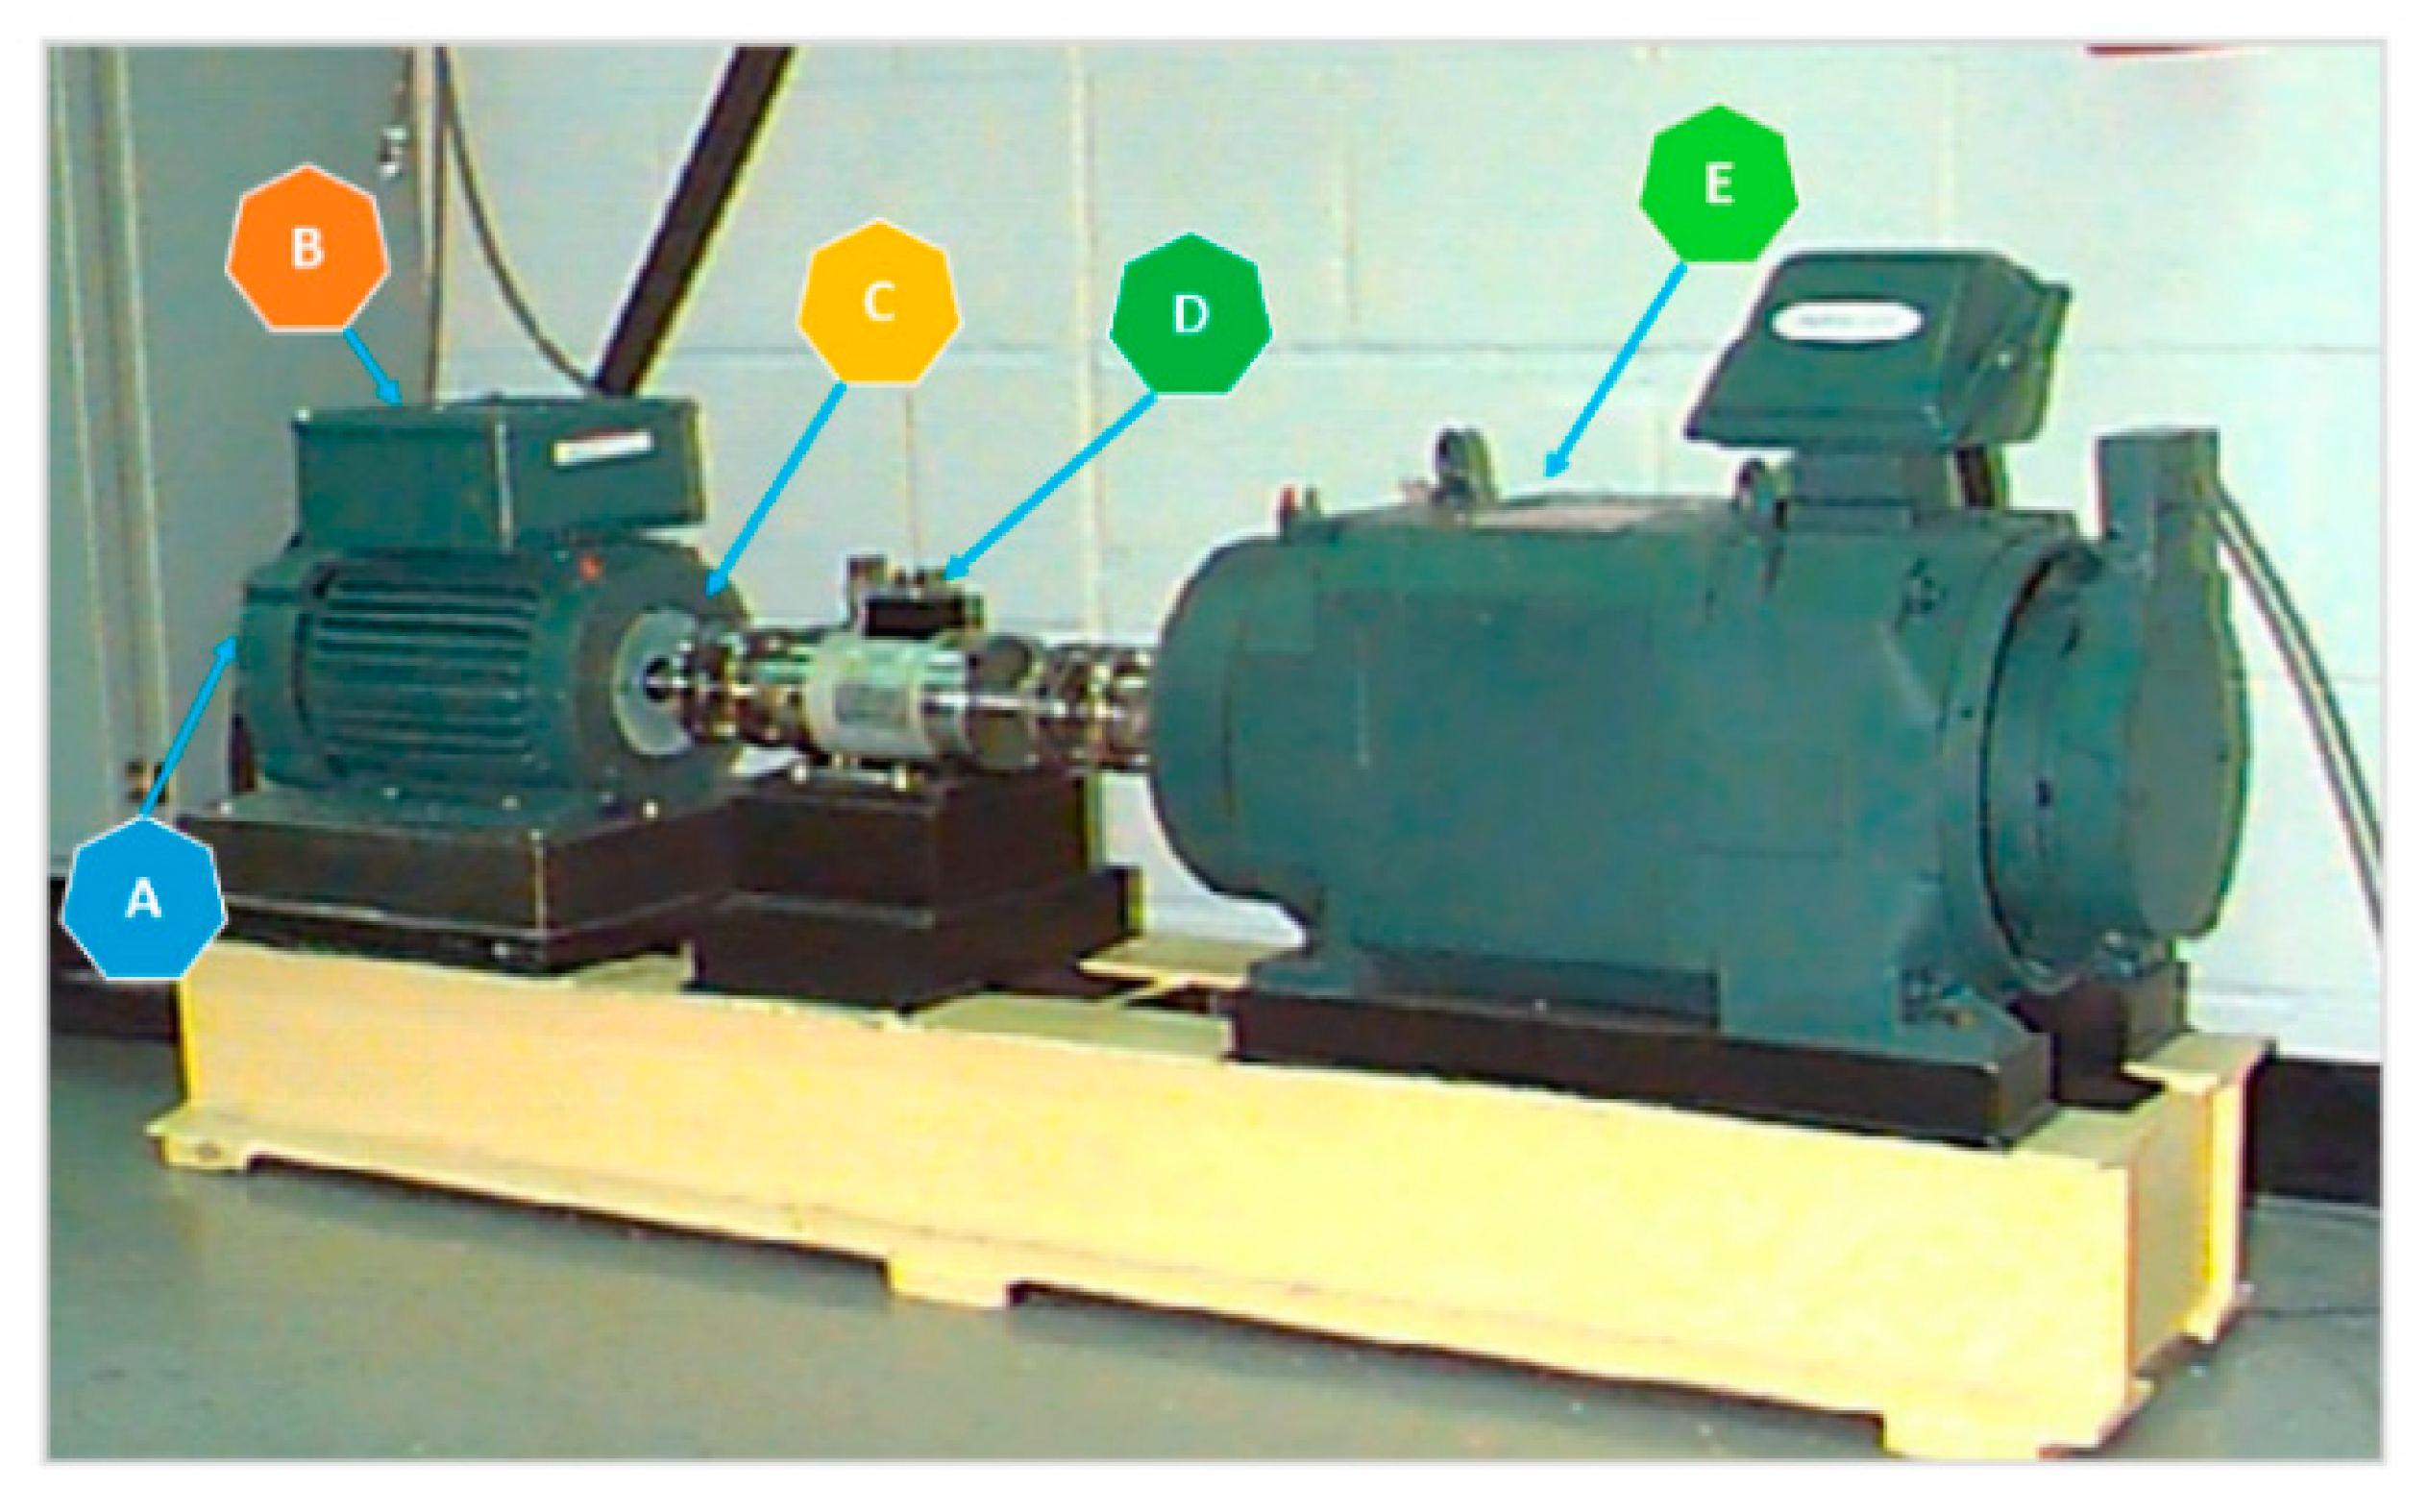
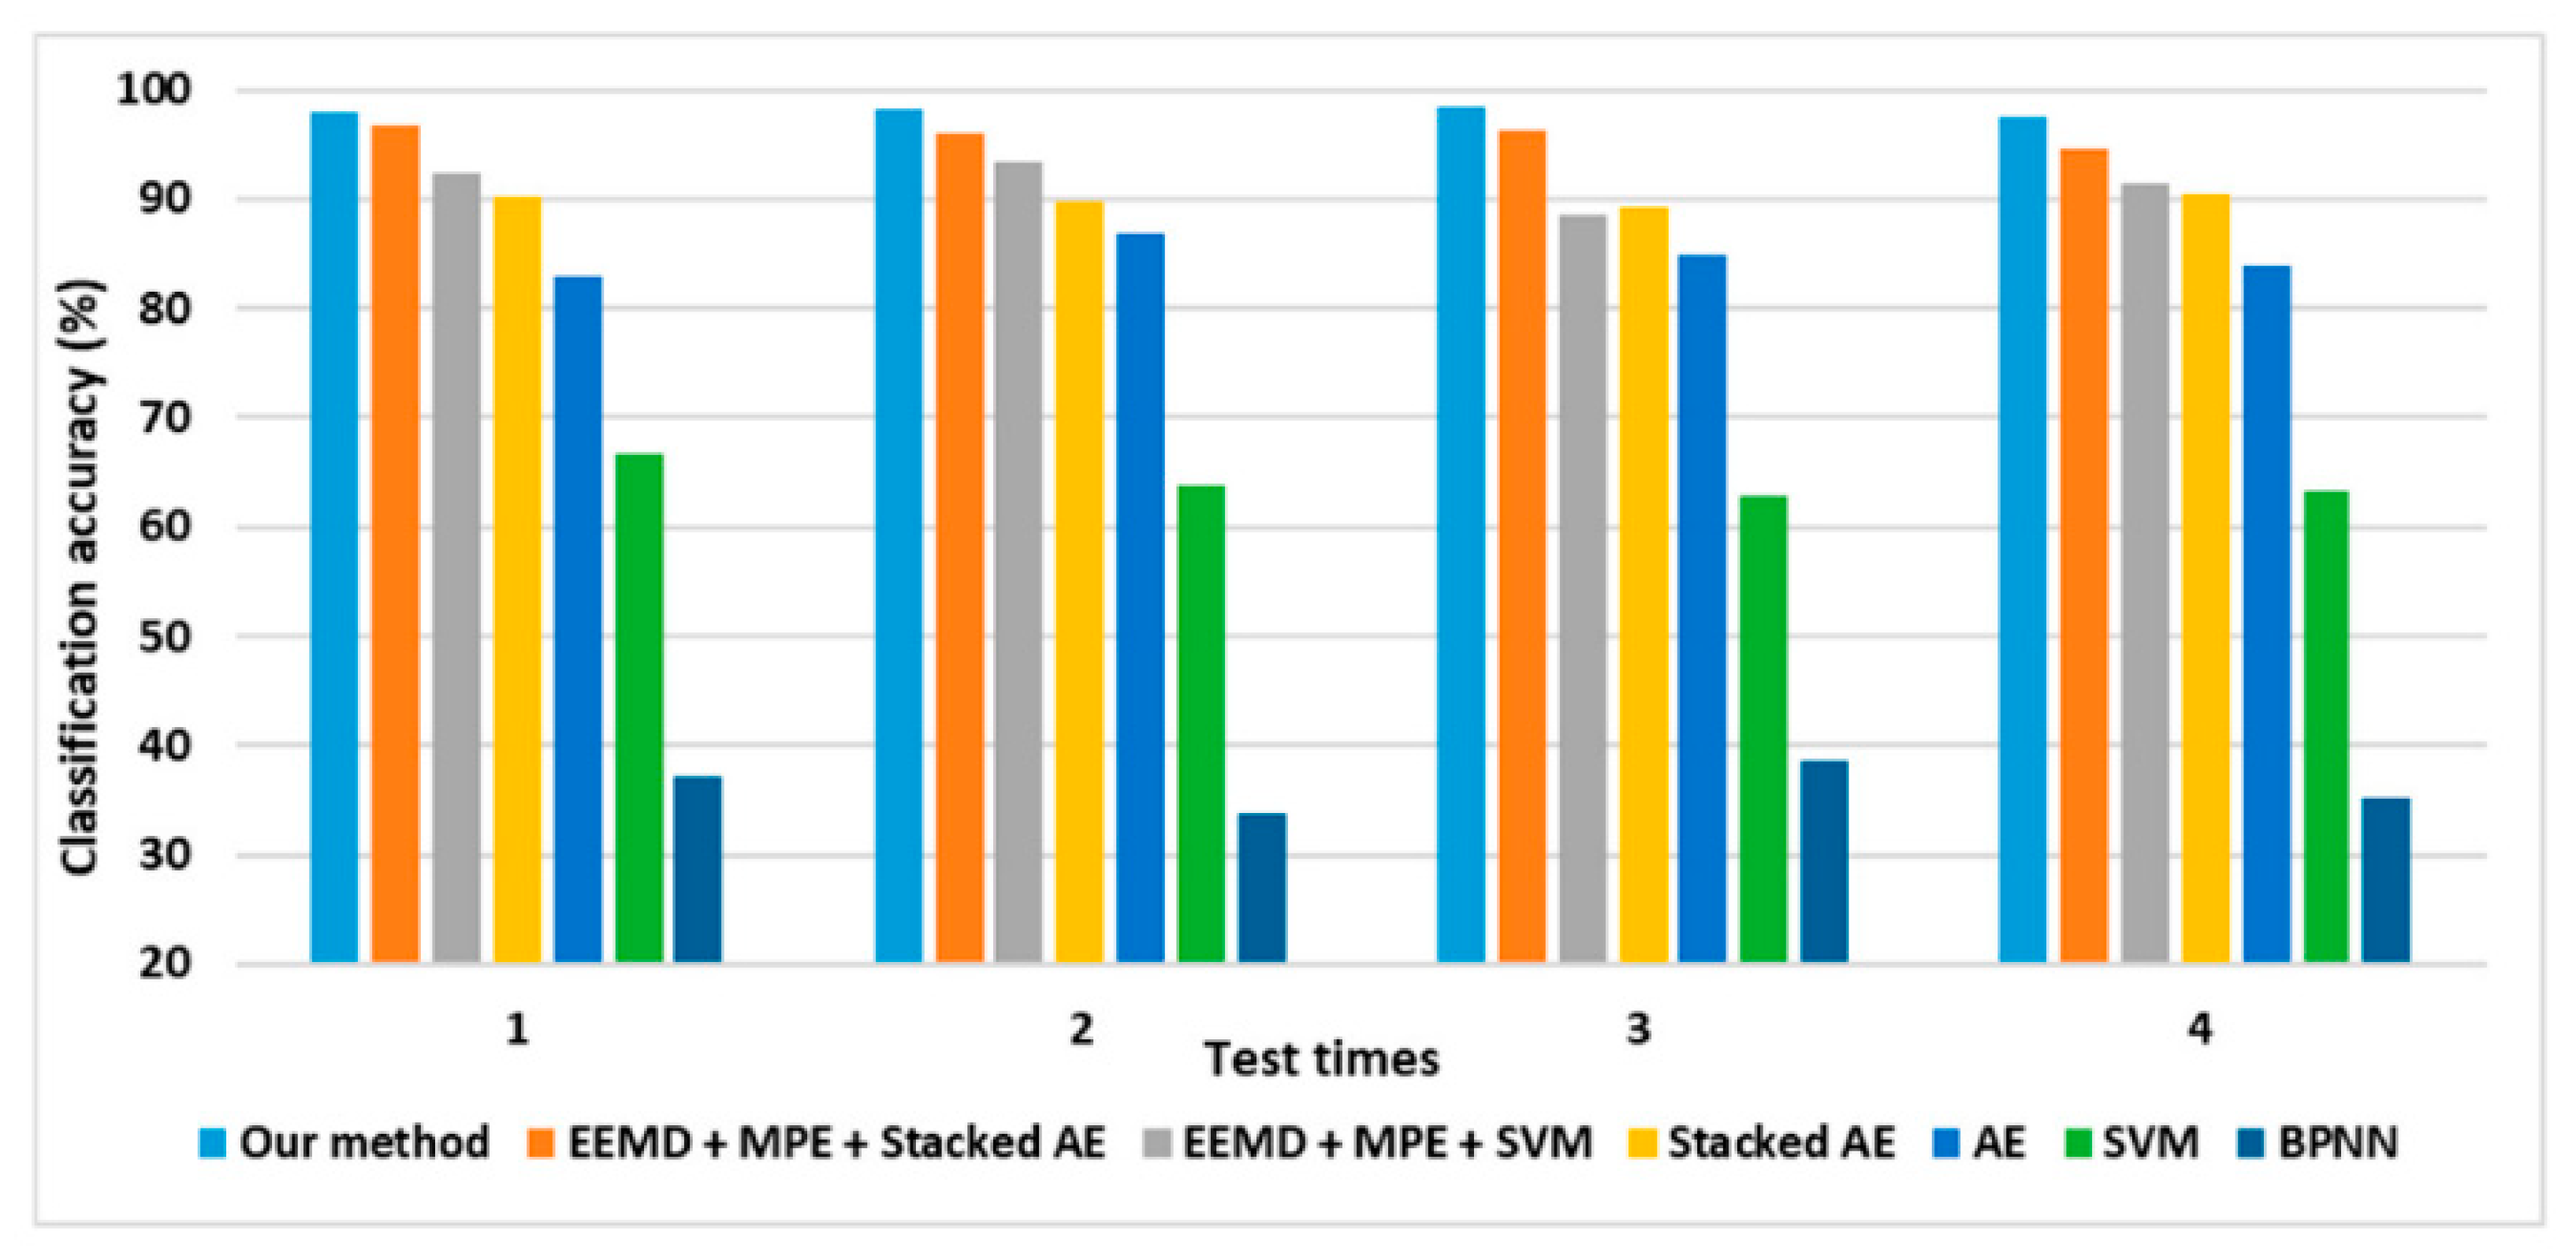
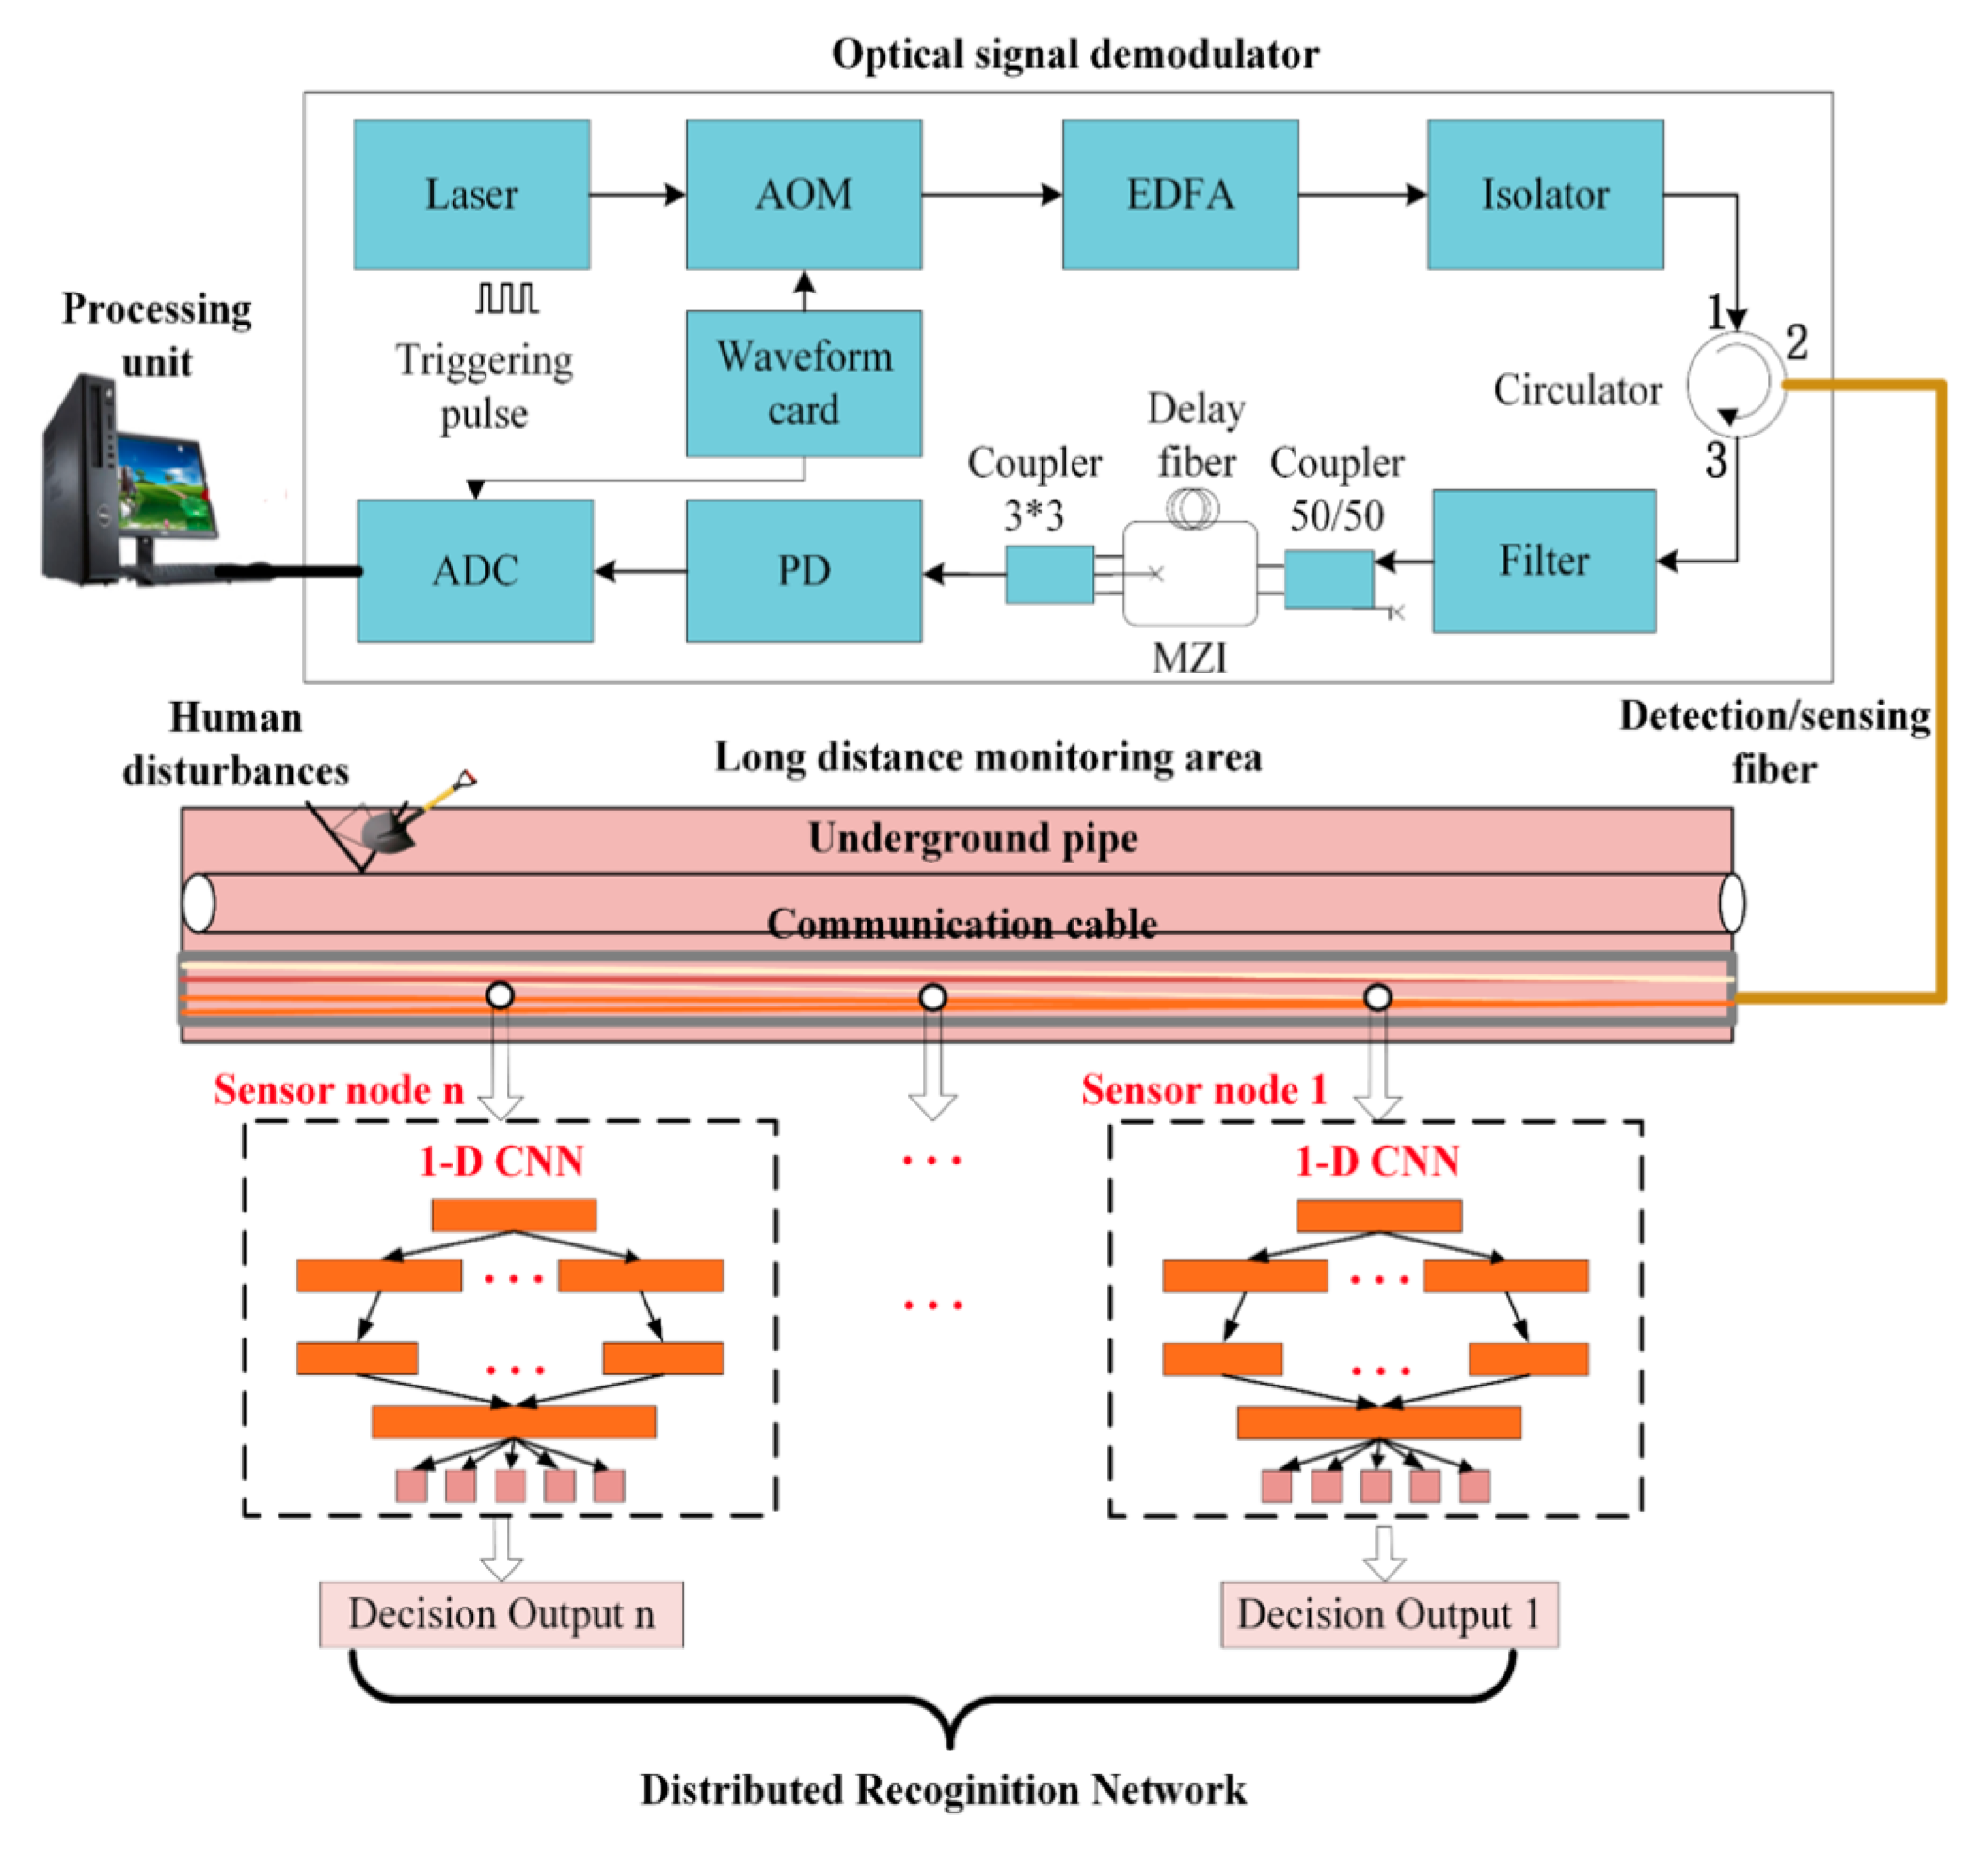
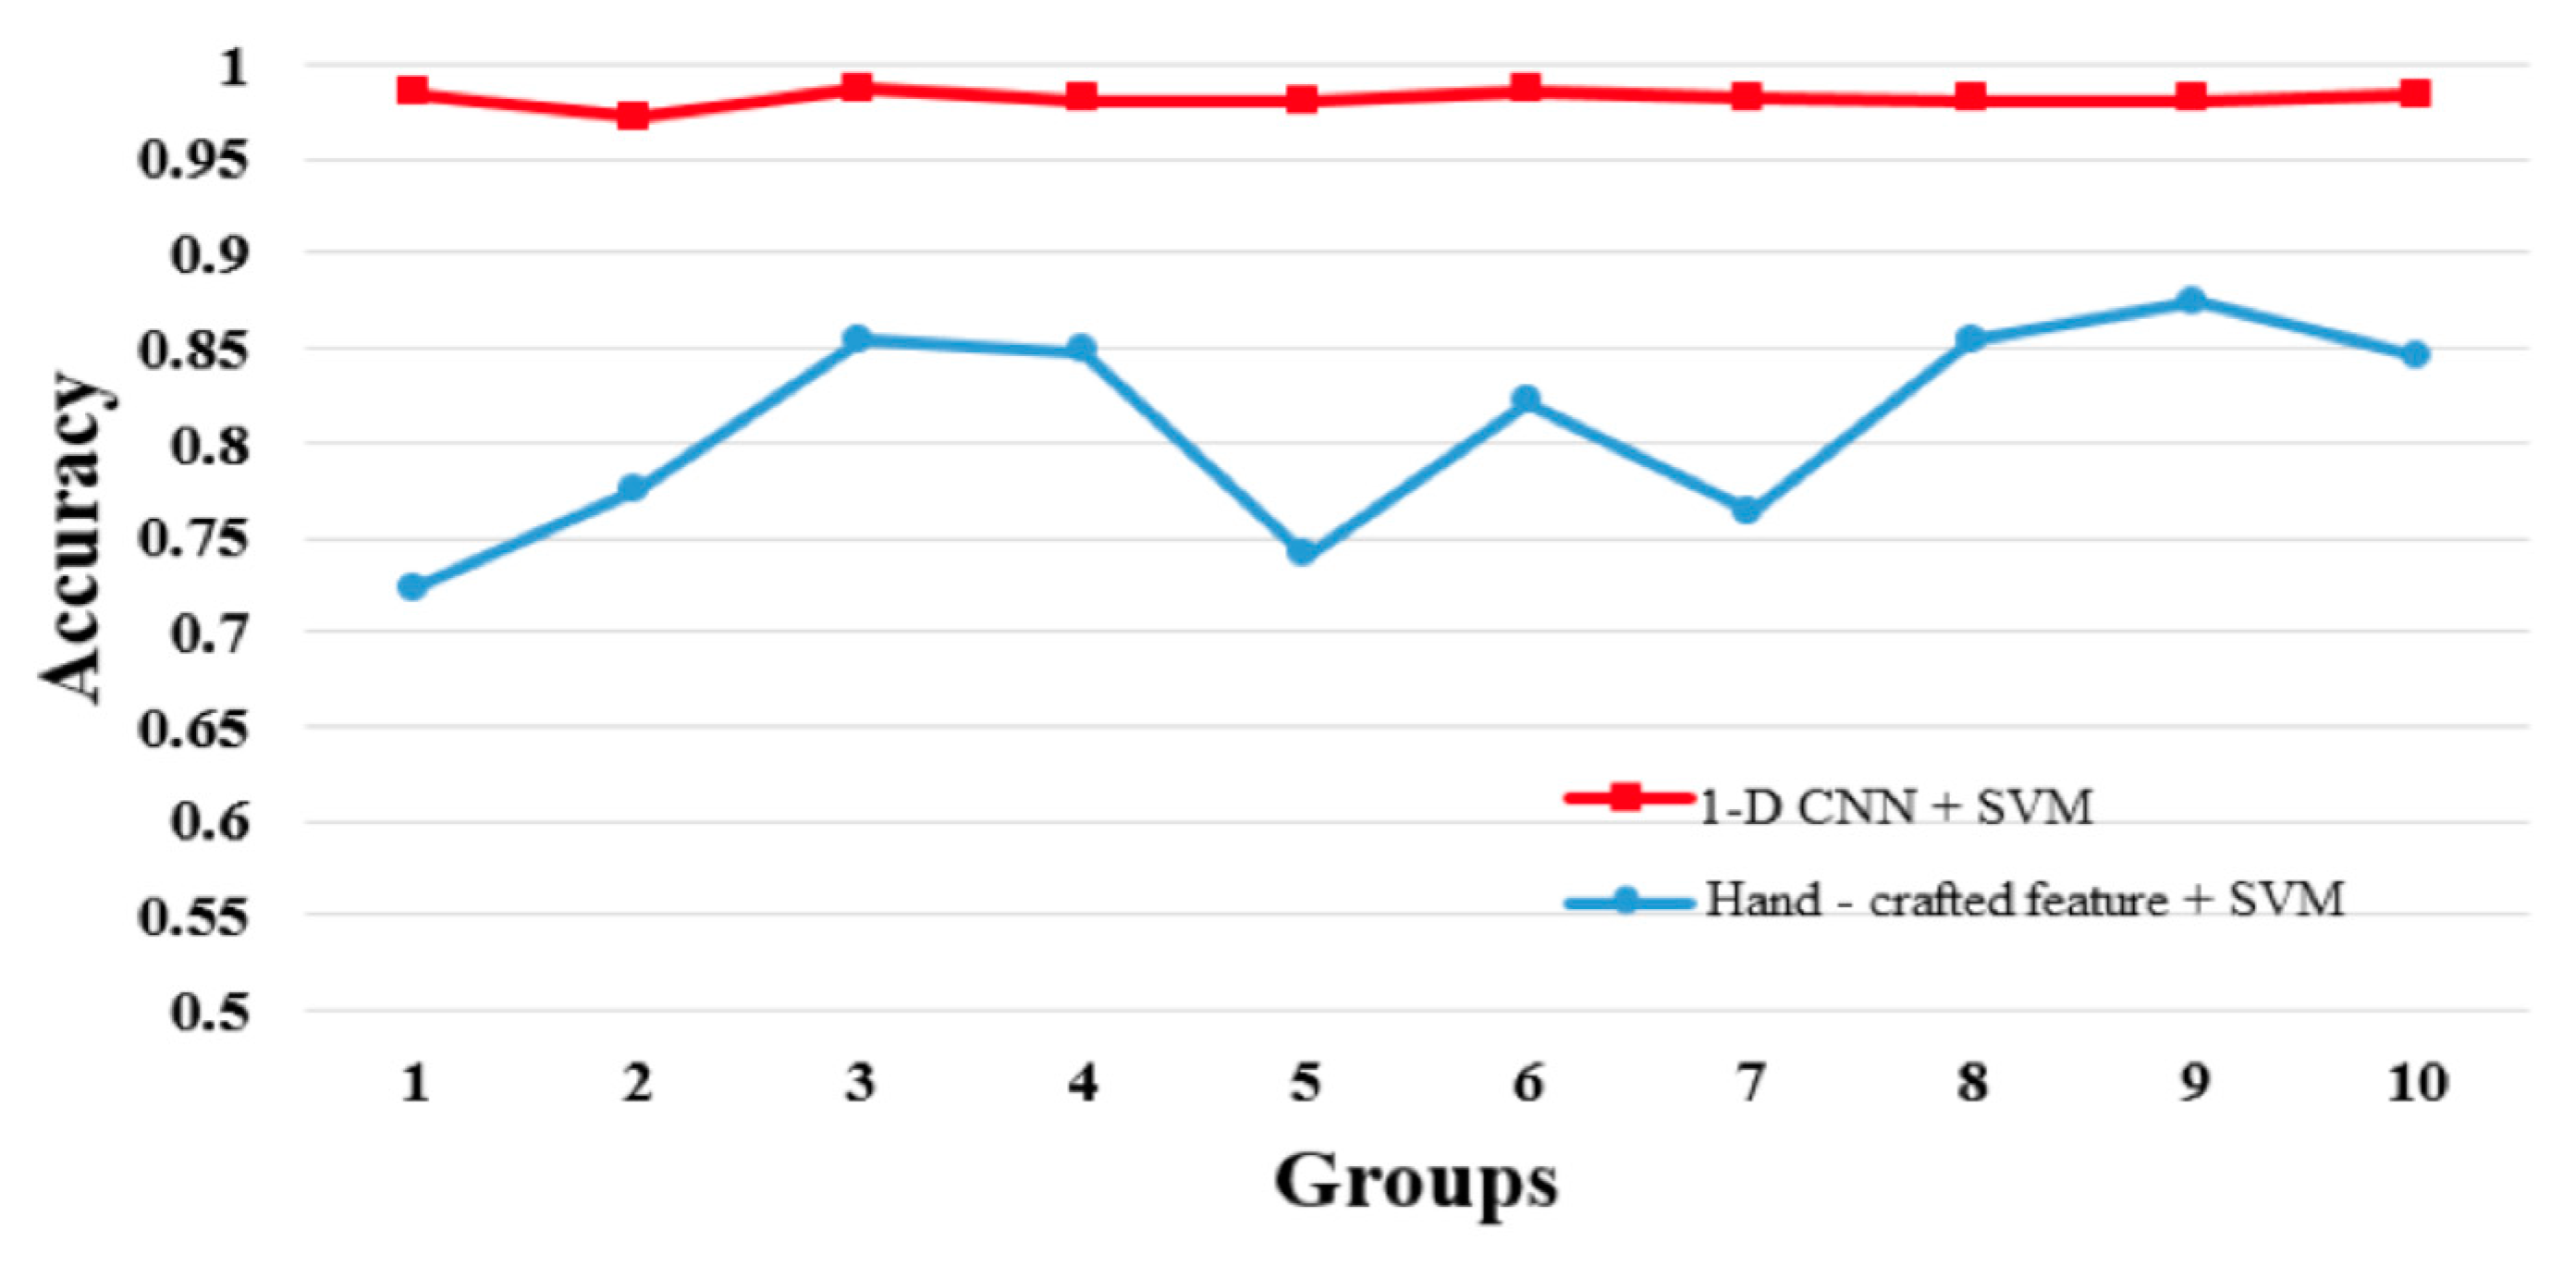
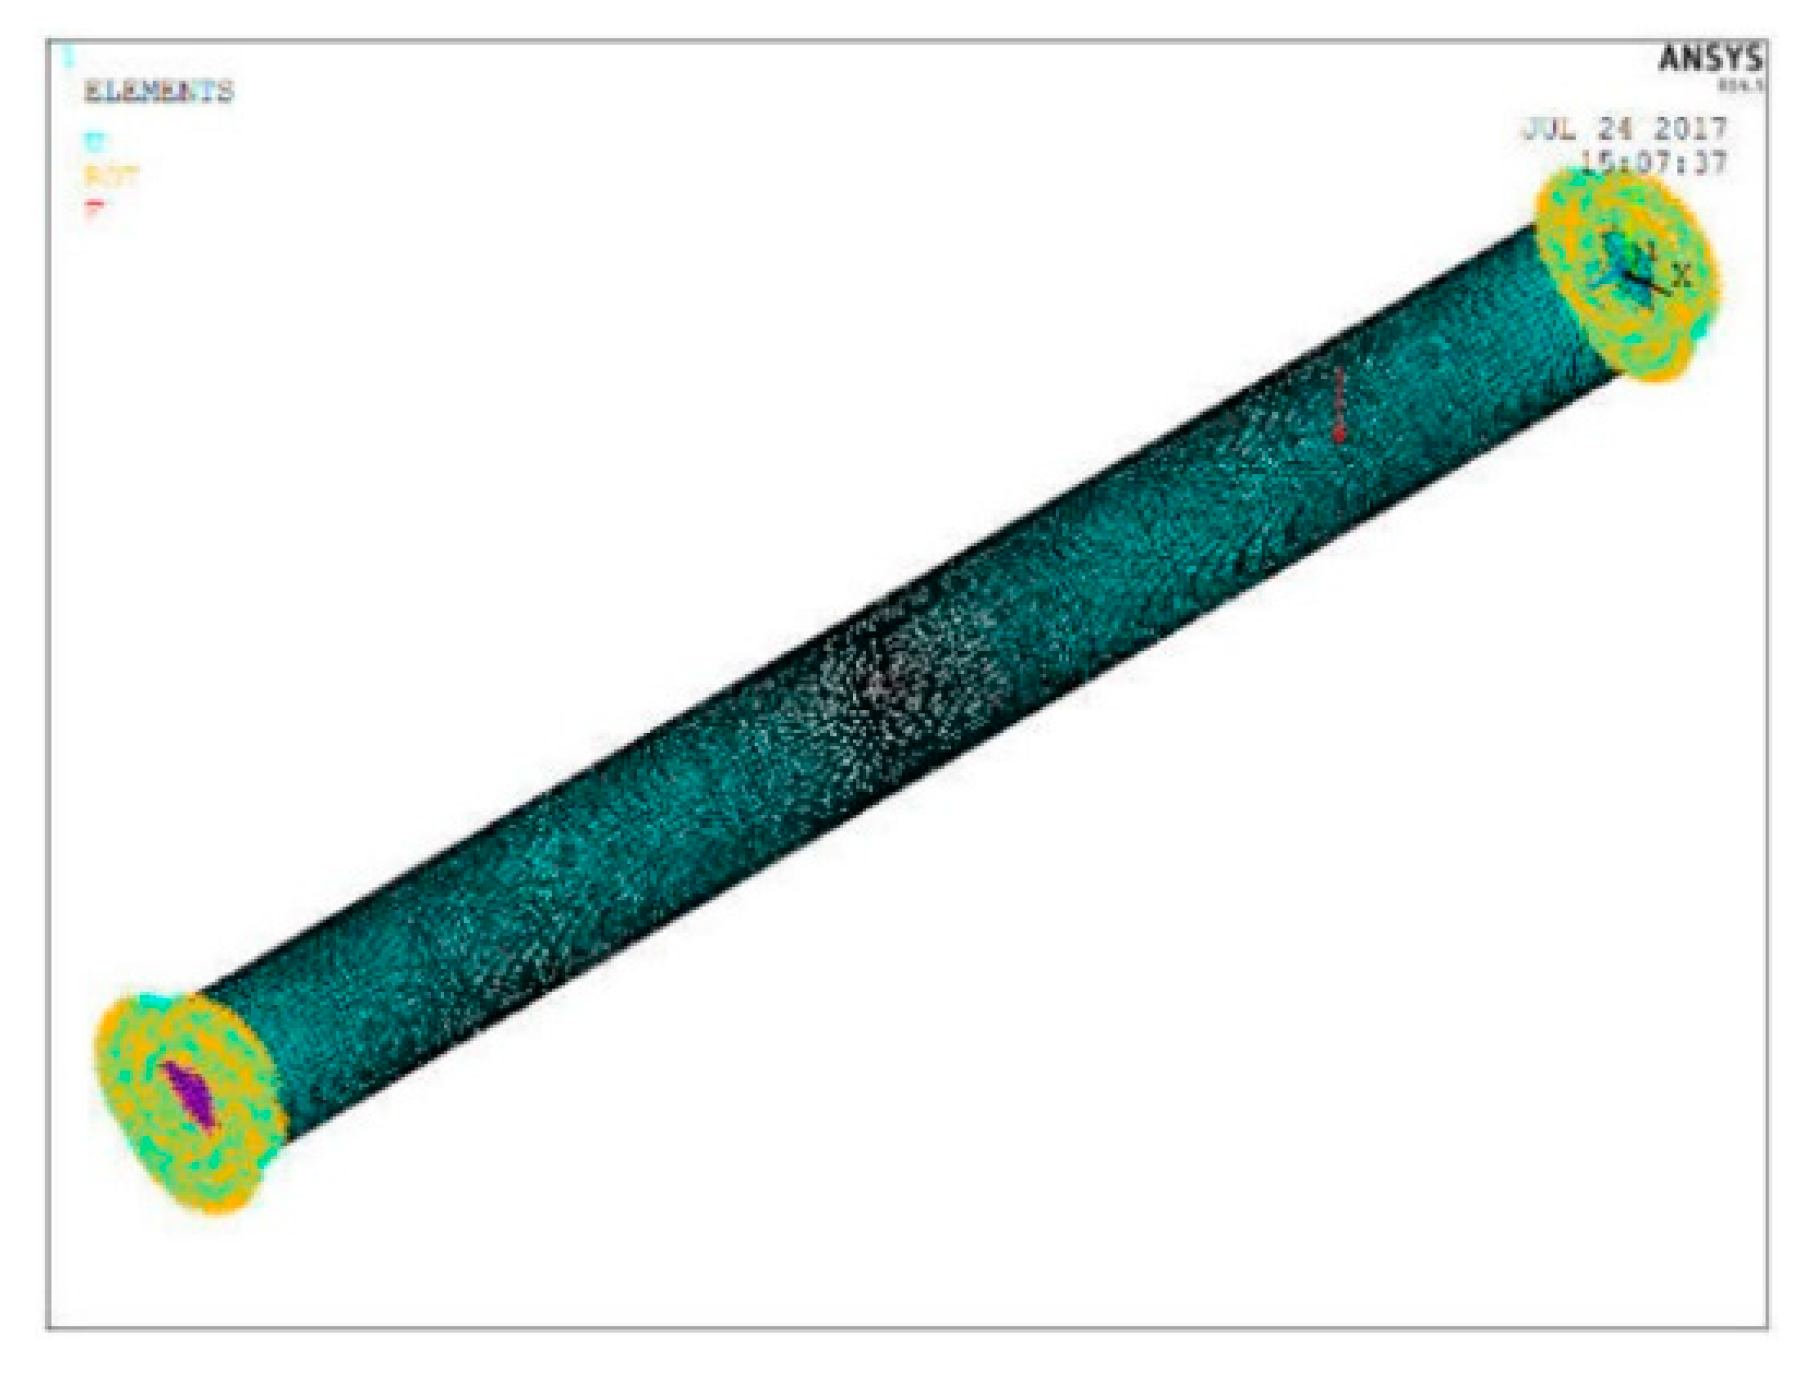
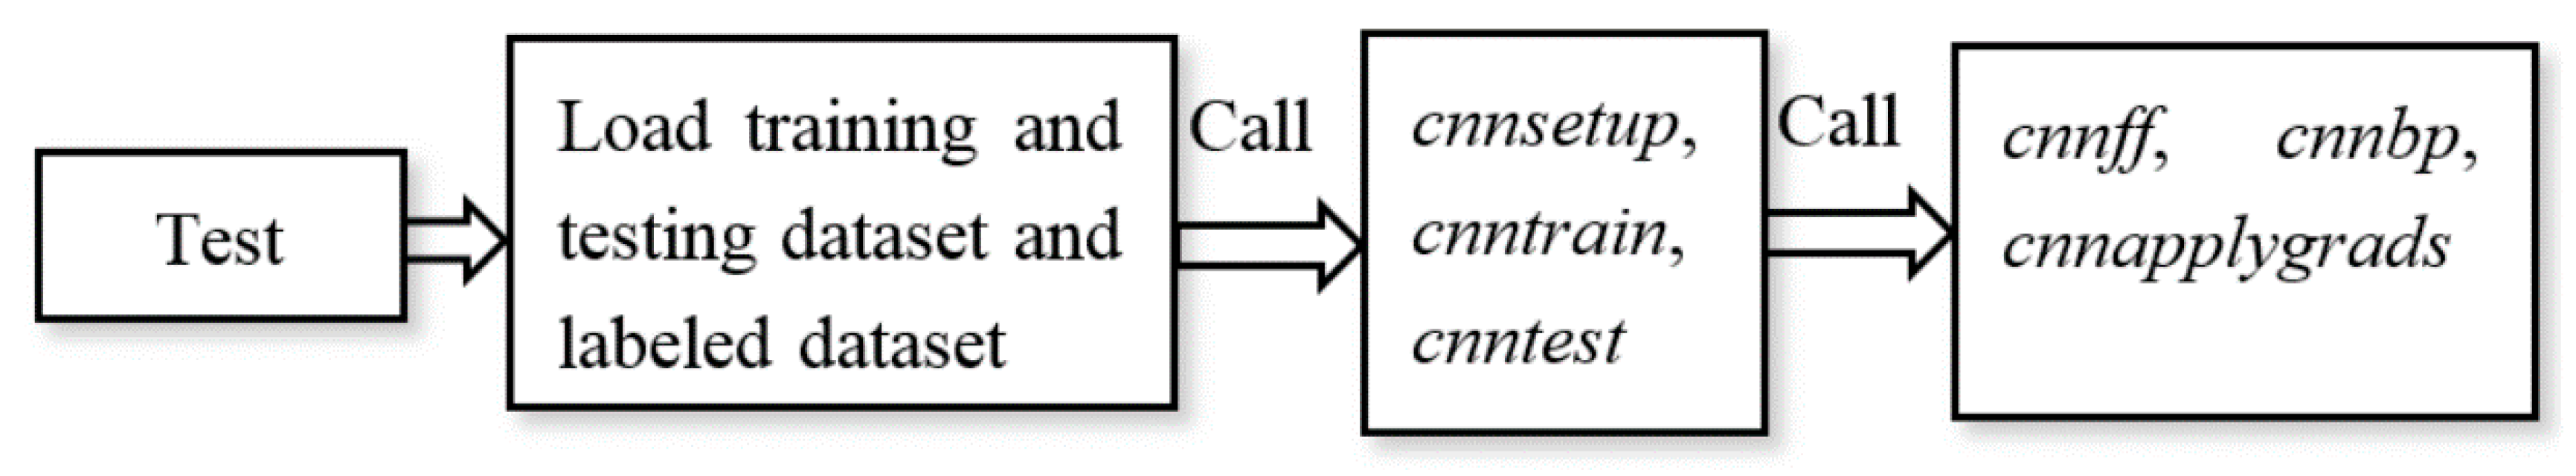
Table 1.
Comparison of deep learning techniques.
| Technique | Advantages | Disadvantages |
|---|---|---|
| Autoencoder | Easy to implement Easy to track the loss/cost | Requiring a huge amount of data for training Requiring irrelevant information for learning |
| DBN | Good to analyze one-dimensional data Possible to extract the global feature from raw data | Inefficient and very slow |
| CNN | Good to analyze multidimensional data Specialized to extract local feature | Complicated, with network structure requiring a lot of calculating time |
| RNN | Outperforming with sequential data Good to calculate the feature from time variations | Difficult to implement and train |
Table 2.
Summary of deep-learning-based structural health monitoring by architecture.
| Architecture | References | Application |
|---|---|---|
| Deep autoencoders | [119] T, [136] TF, [137] TF | Gearbox, Tidal turbine, Train |
| SAE | [101] T, [114] TF, [117] C, [122] TF, [139] TF | CNC machine, Bearing, Bridge |
| DAE | [99] T, [131] TF | Bearing, Train bogie |
| SAE + DAE | [108] T | Bearing |
| DBN | [97] F, [100] TF, [104] W, [105] F, [111] T, [112] T, [115] TF, [116] W, [123] T, [124] W, [129] T, [134] T, [135] T | Hydraulic system, Gas engine, Acoustic signals, Train, Transmission Chain, Gearbox, Milling machine, Top coal caving Aircraft wing |
| SAE + DBN | [118] TF | Bearing |
| CNN | [98] T, [103] F, [91] W, [128] T, [132] T, [133] T, [138] T, [140] F, [141] T, [143] T, [144] F | Axial piston, Engine, Pipeline, Wind turbine, Wind generator, Steel Frame, Structural damage detection, Aluminum plate |
| GRU + LSTM | [110] TF | Spur gear |
| CNN + LSTM | [130] T | CNC milling machine |
| ReLu | [106] T | Helicopter |
| Transfer + SAE | [113] F | Gearbox |
| Transfer + CNN | [121] T | Gearbox |
| DNN classifier 1 | [142] TF | Cantilever beams |
| Multiscale inner product | [120] T | Bearing |
1 The DNN classifier can indicate deep NN, convolutional NN and recurrent NN, but Onchis [142] just noted a DNN classifier. Superscripts of preprocessing type: time (T), Fourier (F), wavelet (W), compressed sensing (C), time + Fourier (TF).
© 2020 by the authors. Licensee MDPI, Basel, Switzerland. This article is an open access article distributed under the terms and conditions of the Creative Commons Attribution (CC BY) license (http://creativecommons.org/licenses/by/4.0/).
Share and Cite
MDPI and ACS Style
Toh, G.; Park, J. Review of Vibration-Based Structural Health Monitoring Using Deep Learning. Appl. Sci. 2020, 10, 1680. https://doi.org/10.3390/app10051680
AMA Style
Toh G, Park J. Review of Vibration-Based Structural Health Monitoring Using Deep Learning. Applied Sciences. 2020; 10(5):1680. https://doi.org/10.3390/app10051680
Chicago/Turabian StyleToh, Gyungmin, and Junhong Park. 2020. "Review of Vibration-Based Structural Health Monitoring Using Deep Learning" Applied Sciences 10, no. 5: 1680. https://doi.org/10.3390/app10051680
Note that from the first issue of 2016, this journal uses article numbers instead of page numbers. See further details here.