Article

Classification of Brainwaves for Sleep Stages by High-Dimensional FFT Features from EEG Signals

1
Graduate School of Natural Science and Technology, Kanazawa University, Kanazawa 9201192, Japan
2
Department of Computer and Informatics Engineering, Politeknik Negeri Jakarta, Depok 16425, Indonesia
3
Telkom of Computing, Telkom University, Bandung 40257, Indonesia
4
Computer Science, Lambung Mangkurat University, Banjarbaru 70714, Indonesia
5
Institute of Science and Engineering, Kanazawa University, Kanazawa 9201192, Japan
*
Author to whom correspondence should be addressed.
Appl. Sci. 2020, 10(5), 1797; https://doi.org/10.3390/app10051797
Submission received: 29 November 2019 / Revised: 23 February 2020 / Accepted: 2 March 2020 / Published: 5 March 2020
(This article belongs to the Section Computing and Artificial Intelligence)

Abstract

:
Manual classification of sleep stage is a time-consuming but necessary step in the diagnosis and treatment of sleep disorders, and its automation has been an area of active study. The previous works have shown that low dimensional fast Fourier transform (FFT) features and many machine learning algorithms have been applied. In this paper, we demonstrate utilization of features extracted from EEG signals via FFT to improve the performance of automated sleep stage classification through machine learning methods. Unlike previous works using FFT, we incorporated thousands of FFT features in order to classify the sleep stages into 2–6 classes. Using the expanded version of Sleep-EDF dataset with 61 recordings, our method outperformed other state-of-the art methods. This result indicates that high dimensional FFT features in combination with a simple feature selection is effective for the improvement of automated sleep stage classification.

1. Introduction

Sleep is one of the basic physiological needs, and an important part of life. A typical human spends one-third of his lifetime sleeping. Lack of sleep may cause health issues, influence mood, and interfere with cognitive performance [1,2]. Examination of sleep is usually performed with the aid of polysomnography (PSG). PSG is used to examine multiple parameters that may be useful in the diagnosis of sleep disorders, or may be analyzed in pursuit of a deeper understanding of sleep itself. Hollan, Dement, and Raynal introduced the term Polysomnography in 1974. PSG is performed using an electronic device equipped to monitor multiple physiologic parameters during sleep by recording corresponding electrophysiological signals, for instance: from the brain via electroencephalogram (EEG), from the eyes via electrooculogram (EOG), from the skeletal muscles via electromyogram (EMG), and from the heart via electrocardiogram (ECG) [3]. To collect this data, recording devices are attached to the relevant locations of the body, typically including three EEG electrodes, one EMG electrode and two EOG electrodes. ECG is also a compulsory component of PSG. Additionally, the monitoring of respiratory functions may be desired in the diagnosis of respiratory disorders such as sleep apnea and require the addition of other tools applied in conjunction with the EEG electrodes, most often a pulse oximeter, oral thermometer, nasal cannula, thoracic and abdominal belt, and a throat microphone [4,5].
Figure 1 represents the standard system used for measuring the EEG signal, termed as the 10–20 system, in which the minimum number of electrodes used is 21. This method regulates the physical placement and designations of electrodes on the scalp. The head is divided into proportions from important sites of the skull so that all areas of the brain are adequately covered. The label of 10–20 indicates that the actual distances between neighboring electrodes are either 10% or 20% of the distance from the nasion (front side of the head/anteriorly) to the inion (back side of the head/posteriorly) between the ears and nose where electrode points are chosen. Generally, electrodes marked with even numbers are placed on the right side of the head and those marked with odd numbers on the left side. The electrodes are also marked with letters to represent their locations relative to the anatomical divisions of the brain: F (frontal), C (central), T (temporal), P (parietal), O (occipital), and Fp (Frontal pole). A subscript z is used to mark the midline electrodes as zero.
The electric signal in the brain is determined by measuring the difference of the electric activity between the two electrodes over a period of time. As it propagates, the signal gradually decays with distance from the source. Finally, the signal has a decreased value since only one of the parallel combinations of electrodes gives precise measurement [4,6].
EEG waveforms have several kinds of rhythms. These rhythms are remarkably useful for classification annotation of sleep score as recorded by PSG. In a normal EEG, we differentiate these rhythms into five frequency bands. Table 1 lists the frequency and amplitude ranges of these bands [4,7]
Human sleep consists of cyclic stages, and the sleep stages are essential sections of activity during sleep. Three main stages of the sleep cycle are awake, non-REM (NREM) sleep, and rapid eye movement (REM) sleep. The NREM phase is also called dreamless sleep: breathing is slow and heart rate and blood pressure are normal. NREM sleep eventually deepens and leads to REM sleep. The REM stage occurs most often while dreaming. At the time, the body goes into a temporary paralysis to prevent it from acting out these dreams. However, during REM sleep the eyes move quickly back and forth. The absence of one of these stages or the overabundance of another can lead to the diagnosis of numerous conditions ranging from sleep apnea, hypersomnia, insomnia, or sleep talking [8].
There are two recognized standards for interpreting sleep stages based on sleep recordings: the Rechtschaffen and Kales (R & K) criteria and the American Academy of Sleep Medicine (AASM) criteria. The R & K recommendations classify sleep into seven discrete stages: wake/wakefulness, S1/drowsiness, S2/light sleep, S3/deep sleep, S4/deep or wave sleep, REM and MT/movement time [9]. The AASM criteria are a modified version of the R & K criteria. Some differences between the AASM and R & K criteria are as follows [9,10]:
  • NREM stages in the R & K criteria (S1, S2, S3, and S4) are referred to as stages N1, N2, and N3 in the AASM criteria.
  • In the AASM criteria, deep sleep (N3) is a combination of the S3 and S4 stages of the R & K criteria.
  • Movement time (MT) is eliminated as a sleep stage in the AASM criteria.
The stages of sleep can be thought of as a cyclic alternation of non-rapid eye movement (NREM) and rapid eye movement (REM) stages [11]. It has been recognized that NREM sleep consists of four distinct stages: S1, S2, S3, and S4, each with specific characteristics. In S1, the patient is drowsy but still awake. The appearance of sleep spindles, vertex sharp waves, and K complexes mark S2 sleep. Shallow sleep consists of both S1 and S2, while deep sleep consists of S3 and S4 [12].
Conventionally, technicians have interpreted and marked the sleep stages manually. As such, it is a time-intensive process as well as being expensive and dependent on human resources. Because it is time consuming, expensive, and is an enormous process, it is not suitable to hold the large EEG datasets for sleep stages annotation by the human expert [13]. As a result, it has become necessary to develop a sleep stage classification in order to achieve better accuracy.
Previous attempts at automated classification of sleep stages have been based on single-channel as well as multi-channel EEG recordings and various other physiological markers. Ronzhina et al. described a single-channel EEG based scheme utilizing an artificial neural network coupled with power spectrum density analysis of EEG recordings [14]. Zhu et al. analyzed nine features from single-channel EEG recordings and applied an artificial intelligence technique referred to as a support vector machine (SVM) to perform classification [15]. High classification performance has been reported by Huang by applying short-time Fourier transform to a two-channels recording of forehead EEG signals and a relevance vector machine [16]. In addition, Aboalayon et al. have conducted a comprehensive review of automatic sleep stage classification (AASC) systems, which includes a survey of processing techniques including pre-processing, feature extraction, feature selection, dimensionality reduction, and classification. This study evaluated AASC methods against the sleep-EDF database based on single-channel EEG recordings, and is remarkable for having selected 10 s epochs for its analysis. Their model’s performance achieved the highest accuracy in comparison to previous results [17]. Braun et al. had applied low dimensional FFT features on the sleep-EDF database with the usage of eight statistical features from the Pz-Oz EEG channel. The classification performance had reached with the accuracy 90.9%, 91.8%, 92.4%, 94.3%, and 97.1% for all 6- to 2-state sleep stages [18].
In this paper, we present a system of sleep stage classification based on EEG signals. Instead of using complicated processes of signal filtering and feature extraction, we utilized high-dimensional features calculated by fast Fourier transform (FFT) from single- or multi-channel EEG signals. FFT is one of the traditional and verified techniques capable of extracting features from EEG signals. If an EEG signal is recorded at a sampling frequency of 100 Hz, the FFT can separate the signal into features in the range of 0–100 Hz. Typically, in previous studies, a small number of FFT features corresponding to the bands shown in Table 1 were extracted and used. However, a sampling window of 30 s at 100 Hz sampling frequency allows for an extraction of at most 3000 features in the range of 0–100 Hz. In this study, we demonstrate that by incorporating high-dimensional FFT features and a simple feature selection by random forest algorithm into the analysis, it is possible to outperform state-of-the-art algorithms for the Sleep-EDF database. Our proposed approach consists of three main steps: brainwaves acquisition from EEG channel, feature processing, and finally, the classification evaluation by measuring the accuracy. The flowchart of our approach is shown in Figure 2.

2. Materials and Methods

2.1. Experimental Data

Sleep-EDF Dataset

The dataset is open-source, and many previous researchers have utilized this dataset in sleep scoring research [15,17,18,19,20,21,22]. Among three available versions of the dataset, we used an expanded version containing 61 recordings from 42 Caucasian male and female subjects. The subjects’ ages ranged from 18 to 79 years. This dataset was organized into two sub-sets. The first subset with 39 recordings from 20 subjects was EEG data recorded in a study from 1987 to 1991. These subjects were healthy and in ambulatory condition. The second subset with 22 recordings from 22 subjects was EEG data recorded in a study in 1994 and the subjects reported slight difficulty in falling asleep but were otherwise healthy. The EEG data had been collected over 24 h of the daily lives of the subjects. A miniature telemetry system recorded nocturnal EEG data from four subjects in a hospital [19]. The data was collected from just two channels: Fpz-Cz and Pz-Oz, at a sampling frequency of 100 Hz. The previous researchers had established that on single-channel analysis the Pz-Oz channel demonstrated improved performance over the Fpz-Cz channel. Using R & K criteria, EEG recordings of both of the subsets had been annotated by an experienced sleep technician on a 30 s basis. Therefore, the duration of each epoch is established as 30 s and yielded 3000 samples. The epochs had been annotated by sleep technicians as: AWA, REM, S1, S2, S3, S4, “Movement Time” or “Unscored.” On the other hand, the annotations using AASM criteria consisted of the designations AWA, REM, N1, N2, N3, and “Unknown sleep stage.” The number of samples according to R & K criteria are shown in Table 2. After removing “Movement Time” and “Unscored,” total number of the samples is 127,663. The epoch duration was 30 s.
As far as features analyzed, we prepared 6000 features extracted from two channels (Pz_Oz and Fpz_Cz). For each channel, 1000 features were extracted at a sampling frequency of 100 Hz and epoch lasted 30 s. The features were used in the experiments separately or in combination.

2.2. Feature Extraction with Fast Fourier Transform (FFT)

The feature represents a differentiating property or an operative component identified in a section of a pattern, and a recognizable measurement. Feature extraction is a critical step in EEG signal processing. Consequently, minimizing the loss of valuable information attached to the signal is one of the goals of feature extraction. Additionally, feature extraction decreases the resources required to describe a vast set of data accurately. When carried out successfully, feature extraction can minimize the cost of information processing, reduce the complexity of data implementation, and mitigate the possible need to compress the information [23].
The extraction of informative statistical features from the EEG signal is necessary to perform sleep stage classification efficiently. In general, the EEG signal is highly complex and non-linear, so it would be better to use a non-linear model [24]. In this study, the fast Fourier transform (FFT) is utilized to extract the features of EEG signal for sleep stage classification. Hence, the values of a given time-series data as a numeric sequence data are converted into a finite set of the frequency domain. Then, to deconstruct signals into segmented EEG signal sequences, we divided them into equal time intervals called epochs. The length of each epoch was set to every 30 s of EEG signal. Accordingly, the epochs were then processed using frequency analysis in which frequency spectra were generated using FFT. We used FFT to convert a signal from its original, time domain signal to a representation in the frequency domain signal [25]. Figure 3 represents in the form of time-domain signal and frequency-domain signal.
Previous studies have shown that FFT is a promising tool for stationary signal processing, and enjoys a speed advantage over virtually all other available methods in real-time applications, and it is more appropriate for sine waveforms such as in EEG signals. However, the disadvantage is that it does not have excellent spectral estimation and cannot be employed for analysis of short EEG signals [23].

2.3. Feature Selection and Optimization

Feature extraction is an effective way of recognizing and visualizing significant data. This process shortens the time for training and application, as well as reducing demands for data calculation and storage. Some researchers combine several feature extraction techniques in order to achieve better data analysis. Consequently, application of multiple processes may often affect feature redundancy and expansion of feature dimension. Feature selection reduces the dimension of feature space and minimizes the data training and application [26]. In this study, we conducted a simple feature selection based on the importance of each feature evaluated by random forest algorithm. Mean decrease in Gini was calculated by using the random Forest package for R, then all features were sorted in the descending order of this value. For Sleep-EDF dataset, we examined the number of important features to be selected with 50 increments in between 500 and 2500, and the most appropriate feature subset were determined for each number of classes. More details about the feature selection in this study are found in [27] which describes basically the same feature selection method.

2.4. Classification Evaluation

The classification step was completed with the 5- or 10-fold cross-validation. This means for each process, this step is repeated 5 or 10 times per sample. The 5- or 10-fold cross-validation comes from the cross validation technique to evaluate prediction performance from classification model. This technique splits the dataset into training and test data. We trained each fold in order to have a better estimation of the true error rate of each set. The model is created by using the training data, and the test data is used for evaluating the performance of prediction.
Among the various classification algorithms, we adopted the multiclass support vector machine (SVM) algorithm, a supervised machine learning method, implemented in the kernlab package for R. The SVM classifier is a popular algorithm widely applied to various problems in machine learning. SVM constructs the maximum margin around the separating hyperplane between the classes. In this study, we utilized a Gaussian or Radial Basis Function (RBF) Kernel. One of the advantages of the SVM method is that this method is effective when the number of features is greater than the number of samples. In addition, the model is sufficient as a classification model of the EEG signal.

3. Experimental Results

3.1. Classification of Sleep-EDF Dataset

In this experiment, 2–6 classes defined by R & K criteria were selected as class labels. Features from two channels were analyzed separately or in combination. From one channel, 3000 features (i.e., 100 Hz × 30 s) were extracted. For performance evaluation, five-fold cross-validation was conducted. The results obtained using our method are compared with the results acquired using other state-of-the-art methods in. In this Table 3, it can be seen that our method with 6000 features from two channels (Pz_Oz and Fpz_Cz) outperformed all other methods in the classification of 6 to 2 classes.

3.2. Classification of Sleep-EDF Dataset Expanded (197 Recordings)

The results of applying our method against the latest, extended version of the Sleep-EDF database, show that in contrast to the first version of the database which consisted of 61 recordings (version 1), the latest version consists of 197 recordings (version 2, released in 2018). It has been studied in many recent papers (e.g., [27,28], however, because of its large size, it is rarely studied as a whole (many papers which classified it are using only a small subset of it). Therefore, it is hard to compare the performance on it under the same or similar conditions. Instead of comparing performances, in this subsection we mainly analyzed the relationship between classification performance and the balance of classes.
Table 4 contains the result of the classification experiment using our method. “SC” and “ST” found in the recording ID. The prefixes “SC” and “ST” stand for “Sleep Cassette” and “Sleep Telemetry”, respectively. In this experiment, ten-fold cross validation was conducted for each recording. The average, highest, and lowest accuracies were 87.84%, 96.54%, and 37.03%, respectively. Since the accuracies are greatly affected by the degree of sample distribution among the classes in each recording, a large discrepancy exists between the highest and lowest accuracies. For example, in the recording SC4201, which achieved the highest accuracy, the AWA class occupies ~73% of the recording. In contrast, the lowest accuracy was achieved by ST7151 with a more even distribution between the classes (AWA:REM:S1:S2:S3:S4 = 104:143:78:304:142:126). This is even more clearly demonstrated in Figure 4, where we show the relationship between accuracy and degree of class imbalance (represented in this experiment by the standard deviation of class sizes in a recording). There appears to be an almost linear relationship (correlation coefficient was 0.9857).

4. Discussions and Conclusions

In order to improve the performance of sleep stage classification, previous work has mainly focused on the following points:
  • More effective methods of feature extraction from the original EEG signal (e.g., wavelet transform)
  • Application of filters (e.g., band-pass filter) and noise reduction algorithms
  • Identification of better classifier algorithms (e.g., random forest, adaptive boosting, and convolutional neural network)
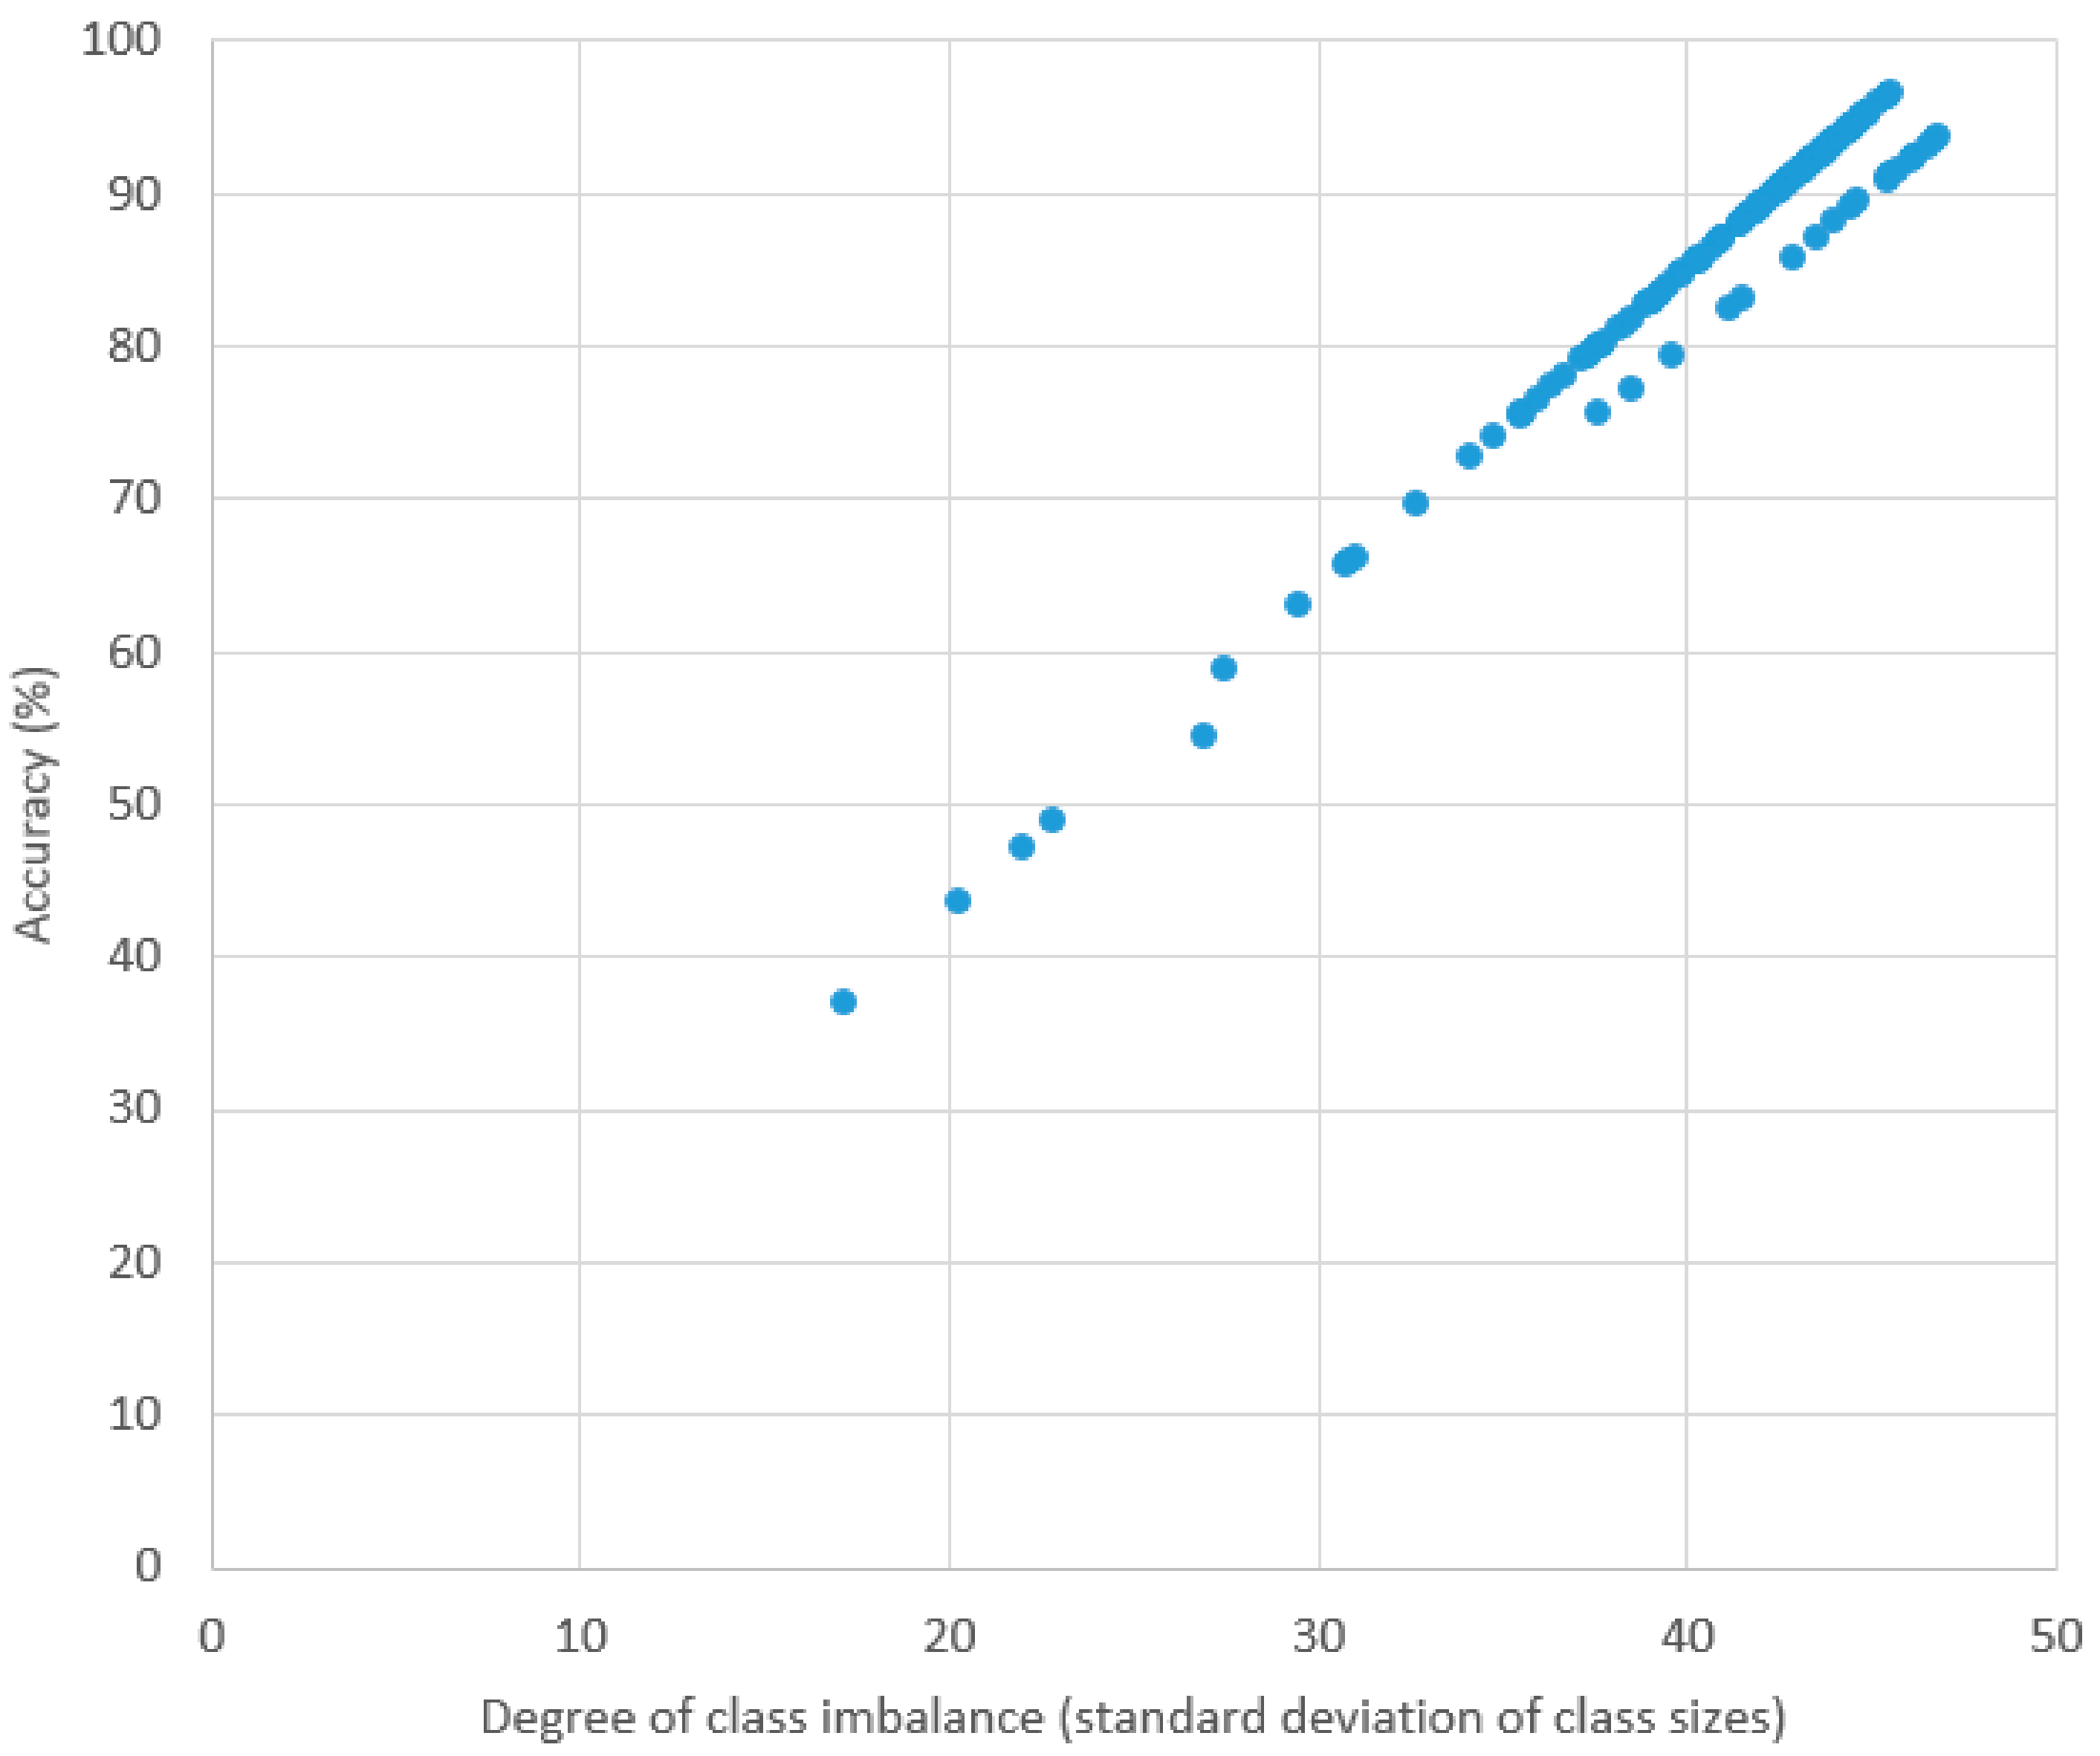
  • Improvement of class imbalance by under- and/or over-sampling (e.g., SMOTE)
In contrast, we have demonstrated in this paper that fully utilizing thousands of FFT features extracted from single- and multi-channel EEG signals in combination with simple feature selection is an effective means of improving the performance of automated sleep stage classification. In our experiment on 6- to 2-class classification against the Sleep-EDF dataset, our method outperformed other recent and advanced methods.
Additionally, we demonstrated the result of application of our method to the classification of the recording included in the latest version of Sleep-EDF database. We clearly showed that accuracy in classifying a recording is highly influenced by the degree of class imbalance.
The differences between the amounts of the majority class and the minority class in the datasets leads to an imbalanced dataset. In other words, balanced class distributions are essential in supervised learning as standard classification. One of the methods for solving this problem is by doing oversampling and it aims to achieve a balanced class distribution by creating an artificial data. SMOTE (synthetic minority over-sampling technique) is an over-sampling method that is typically used to balance an imbalanced data as a part of machine learning. New instances are created as minority class instances from minority class neighbors that performed like the original instances of the minority class [29]. Related to sleep stage classification, our experimental results suggested that by combining our method with under- and/or over-sampling methods like SMOTE, we may achieve better classification performance of the recordings in the latest Sleep-EDF database.
One of the disadvantages in our method is the intensive computational requirements in memory and processor. However, it also means that if the available resource of computing is rich, its performance can be further improved. In addition to the analysis of relationship between the number of features and performance, we need to conduct future work on the effectiveness of our method in other datasets.

Author Contributions

Conceptualization, M.K.D. and K.S.; formal analysis, B.P., K.R.M., and F.I.; funding acquisition, K.S.; investigation, M.K.D.; methodology, K.S.; software, N.G.N., M.R.F., and M.K.; supervision, K.S.; writing—original draft, M.K.D.; writing—review and editing, B.P., K.R.M., F.I., and K.S. All authors have read and agreed to the published version of the manuscript.

Funding

This work was partially supported by JSPS KAKENHI Grant Number JP18K11525 and Kanazawa University CHOZEN project.

Acknowledgments

The first and second authors would like to gratefully acknowledge the BUDI-LN scholarship from Indonesia Endowment Fund for Education (LPDP), Ministry of Education and Culture Republic of Indonesia (KEMENDIKBUD), and Ministry of Research and Technology of Republic Indonesia (KEMENRISTEK). In this research, the super-computing resource was provided by Human Genome Center, the Institute of Medical Science, the University of Tokyo. Additional computation time was provided by the super computer system in Research Organization of Information and Systems (ROIS), National Institute of Genetics (NIG).

Conflicts of Interest

The authors declare no conflict of interest

References

  1. Touchette, É.; Petit, D.; Seguin, J.R.; Boivin, M.; Tremblay, R.E.; Montplaisir, J.Y. Associations Between Sleep Duration Patterns and Behavioral/Cognitive Functioning at School Entry. Sleep 2007, 30, 1213–1219. [Google Scholar] [CrossRef] [PubMed]
  2. Walker, M.P.; Stickgold, R. Sleep, Memory, and Plasticity. Annu. Rev. Psychol. 2006, 57, 139–166. [Google Scholar] [CrossRef] [PubMed] [Green Version]
  3. Álvarez-Estévez, D.; Moret-Bonillo, V. Identification of Electroencephalographic Arousals in Multichannel Sleep Recordings. IEEE Trans. Biomed. Eng. 2011, 58, 54–63. [Google Scholar] [CrossRef] [PubMed]
  4. Keenan, S.A. Handbook of Clinical Neurophysiology, An Overview of Polysomnography; Elsevier B.V.: Amsterdam, The Netherlands, 2005; Volume 6, Chapter 3; p. 18. [Google Scholar]
  5. Billiard, M.; Bae, C.; Avidan, A. Sleep Medicine; Smith, H.R., Comella, C.L., Hogl, B.L., Eds.; Cambridge University Press: Cambridge, UK, 2012. [Google Scholar]
  6. Kaniusas, E. Biomedical Signals and Sensors I; Springer: Berlin, Germany; pp. 1–26. [CrossRef] [Green Version]
  7. Aboalayon, K.A.I.; Faezipour, M. Multi-Class SVM Based on Sleep Stage Identification Using EEG Signal. Proceedings of the 2014 IEEE Healthcare Innovation Conference (HIC), Piscataway, NJ, USA, 8–10 October 2014; pp. 181–184. [Google Scholar]
  8. Thorpy, M.J. The International Classification Of Sleep Disorders: Diagnostic and Coding Manual. Rev.Ed; One Westbrook Corporate Center, Suite 920: Westchester, IL, USA, 2001. [Google Scholar]
  9. Rechtschaffen, A.; Kales, A. A Manual of Standardized Terminology, Techniques and Scoring System for Sleep Stages of Human Subjects; National Government Publication: Los Angeles, CA, USA, 1968. [Google Scholar]
  10. Iber, C.; Medicine, A.A.o.S. The AASM Manual for The Scoring of Sleep and Associated Events: Rules, Terminology and Technical Specifications; American Academy of Sleep Medicine: Darien, IL, USA, 2007. [Google Scholar]
  11. Hobson, J.A. Sleep is of The Brain, by The Brain and For The Brain. Nature 2005, 437, 1254–1256. [Google Scholar] [CrossRef] [PubMed]
  12. Marshall, L.; Helgadottir, H.; Molle, M.; Born, J. Boosting Slow Oscillations During Sleep Potentiates Memory. Nature 2006, 444, 610–613. [Google Scholar] [CrossRef] [PubMed]
  13. Norman, R.G.; Pal, I.; Stewart, C.; Walsleben, J.A.; Rapoport, D.M. Interobserver Agreement Among Sleep Scorers From Different Centers in a Large Dataset. Sleep 2000, 23, 901–908. [Google Scholar] [CrossRef] [PubMed]
  14. Ronzhina, M.; Janousek, O.; Kolarova, J.; Novakova, M.; Honzik, P.; Provaznik, I. Sleep Scoring Using Artificial Neural Networks. Sleep Med. Rev. 2012, 16, 251–263. [Google Scholar] [CrossRef] [PubMed]
  15. Zhu, G.; Li, Y.; Wen, P.P. Analysis and Classification of Sleep Stages Based on Difference Visibility Graphs From A Single-Channel EEG Signal. IEEE J. Biomed. Health Inform. 2014, 18, 1813–1821. [Google Scholar] [CrossRef] [PubMed]
  16. Huang, C.-S.; Lin, C.-L.; Ko, L.-W.; Liu, S.-Y.; Su, T.-P.; Lin, C.-T. Knowledge-based Identification of Sleep Stages Based on Two Forehead Electroencephalogram Channels. Front. Neurosci. 2014, 8, 263. [Google Scholar] [CrossRef] [PubMed] [Green Version]
  17. Aboalayon, K.A.I.; Faezipour, M.; Almuhammadi, W.S.; Moslehpour, S. Sleep Stage Classification Using EEG Signal Analysis: A Comprehensive Survey and New Investigation. Entropy 2016, 18, 272. [Google Scholar] [CrossRef]
  18. Braun, E.T.; Silvera, T.L.T.D.; Kozakevicius, A.D.J.; Rodrigues, C.R.; Giovani, B. Sleep Stages Classification Using Spectral Based Statistical Moments as Features. Revista de Informática Teórica e Aplicada 2018, 25. [Google Scholar] [CrossRef] [Green Version]
  19. Hassan, A.R.; Subasi, A. A Decision Support System for Automated Identification of Sleep Stages from Single-Channel EEG Signals. Knowl.-Based Syst. 2017, 128, 115–124. [Google Scholar] [CrossRef]
  20. Liang, S.-F.; Kuo, C.-E.; Hu, Y.-H.; Pan, Y.-H.; Wang, Y.-H. Automatic Stage Scoring of Single-Channel Sleep EEG by Using Multiscale Entropy and Autoregressive Models. IEEE Trans. Instrum. Meas. 2012, 61, 1649–1657. [Google Scholar] [CrossRef]
  21. Nakamura, T.; Adjei, T.; Alqurashi, Y.; Looney, D.; Morrell, M.J.; Mandic, D.P. Complexity science for sleep stage classification from EEG. In Proceedings of the International Joint Conference on Neural Networks, Anchorage, AK, USA, 14–19 May 2017. [Google Scholar]
  22. Yildirim, O.; Baloglu, U.B.; Acharya, U.R. A Deep Learning Model for Automated Sleep Stages Classification Using PSG Signals. Int. J. Environ. Res. Public Health 2019, 16, 599. [Google Scholar] [CrossRef] [PubMed] [Green Version]
  23. Al-Fahoum, A.S.; Al-Fraihat, A.A. Methods of EEG Signal Features Extraction Using Linear Analysis in Frequency and Time-Frequency Domains. ISRN Neurosci. 2014, 2014, 730218. [Google Scholar] [CrossRef] [PubMed] [Green Version]
  24. Freeman, W.J.; Skarda, C.A. Spatial EEG patterns, non-linear dynamics and perception: the neo-Sherringtonian view. Brain Res. 1985, 357, 147–175. [Google Scholar] [CrossRef] [Green Version]
  25. Nussbaumer, H.J. Fast Fourier Transform and Convolution Algorithms; Springer: Berlin/Heidelberg, Germany, 1981. [Google Scholar] [CrossRef]
  26. Wen, T.; Zhang, Z. Effective and Extensible Feature Extraction Method Using Genetic Algorithm-based Frequency-Domain Feature Search for Epileptic EEG Multiclassification. Medicine (Baltimore) 2017, 96, e6879. [Google Scholar] [CrossRef] [PubMed]
  27. Huang, W.; Guo, B.; Shen, Y.; Tang, X.; Zhang, T.; Li, D.; Jiang, Z. Sleep staging algorithm based on multichannel data adding and multifeature screening. Comput Methods Programs Biomed. 2019, 187, 105253. [Google Scholar] [CrossRef] [PubMed]
  28. Timplalexis, C.; Diamantaras, K.; Chouvarda, I. Classification of Sleep Stages for Healthy Subjects and Patients with Minor Sleep Disorders. In Proceedings of the 2019 IEEE 19th International Conference on Bioinformatics and Bioengineering (BIBE), Athens, Greece, 28–30 October 2019; pp. 344–351. [Google Scholar]
  29. Chawla, N.V.; Bowyer, K.W.; Hall, L.O.; Kegelmeyer, W.P. SMOTE: Synthetic Minority Over-sampling Technique. J. Artif. Intel. Res. 2002, 16, 321–357. [Google Scholar] [CrossRef]
Figure 1. Electrodes placement of electroencephalogram (EEG) measurement [4] (reproduced with permission by Elsevier (License Number 4781771458692)).
Applsci 10 01797 g001
Figure 2. The flowchart of the proposed research.
Applsci 10 01797 g002
Figure 3. EEG signals in time domain signal and frequency domain signal.
Applsci 10 01797 g003
Figure 4. Plot of accuracy and standard deviation of class sizes in each recording.
Applsci 10 01797 g004
Table 1. Frequency and amplitude range of the EEG signal.
BandsFrequencies (Hz)Amplitude (µV)
Delta0.5–3.520–100
Theta3.5–7.510
Alpha7.5–122–100
Beta12–305–10
Gamma>31-
Table 2. The number of samples in Sleep-EDF dataset (R & K criteria).
# of ClassesAWAREMS1S2S3S4
674,82711,8484,84827,29250753773
574,82711,8484,84827,2928848
474,82711,84832,1408848
374,82711,84840,988
274,82752,836
Table 3. Performance comparison on Sleep-EDF dataset (R & K criteria, 2–6 classes).
MethodLength of Epoch (s)# of Epochs# of ClassesAccuracy (%)
Nakamura et al. 2017 30126,699686.60
588.60
491.00
394.50
297.40
Yildirim et al. 2019 [22]30127,512689.43
590.48
492.24
394.23
297.85
Our method (Pz_Oz)30127,663690.17
591.42
492.24
394.36
297.79
Our method (Fpz_Cz)30127,663689.70
588.57
490.02
392.69
297.13
Our method
(Pz_Oz and Fpz_Cz)
30127,663690.77
591.73
492.82
394.41
297.88
Table 4. Performance of classification for each recording in Sleep-EDF database (version 2).
IDAccuracy (%)IDAccuracy (%)IDAccuracy (%)IDAccuracy (%)
SC400194.17SC425292.77SC452294.24SC481291.26
SC400292.49SC426189.25SC453189.22SC482192.67
SC401194.27SC426292.43SC453292.68SC482289.17
SC401293.43SC427190.37SC454193.68ST701175.56
SC402194.11SC427291.59SC454290.28ST701281.39
SC402292.86SC428191.27SC455190.97ST702183.62
SC403195.88SC428291.42SC455294.29ST702279.29
SC403294.44SC429191.54SC456184.57ST704158.73
SC404190.51SC429291.67SC456290.25ST704265.79
SC404291.58SC430191.48SC457189.66ST705143.61
SC405195.29SC430292.94SC457292.47ST705284.77
SC405292.51SC431191.99SC458189.89ST706180.09
SC406195.33SC431289.40SC458288.17ST706285.53
SC406294.27SC432188.92SC459191.41ST707179.06
SC407193.71SC432292.26SC459285.54ST707281.05
SC407293.70SC433191.51SC460192.68ST708183.10
SC408192.56SC433294.24SC460286.79ST708281.77
SC408290.92SC434189.21SC461187.08ST709175.45
SC409191.59SC434296.42SC461293.10ST709277.99
SC409290.59SC435194.34SC462184.74ST710180.34
SC410193.38SC435290.59SC462291.20ST710275.67
SC410294.84SC436292.08SC463191.06ST711182.40
SC411192.12SC437191.13SC463293.04ST711283.43
SC411295.32SC437286.79SC464194.62ST712179.76
SC412192.54SC438193.39SC464292.58ST712282.65
SC412291.56SC438293.23SC465189.64ST713185.80
SC413192.97SC440191.94SC465285.62ST713276.47
SC414195.12SC440293.40SC466185.77ST714175.50
SC414295.31SC441192.92SC466288.53ST714272.74
SC415192.97SC441289.87SC467191.07ST715137.03
SC415293.25SC442195.23SC467293.35ST715279.94
SC416190.29SC442292.07SC470188.10ST716148.93
SC416291.04SC443191.50SC470292.39ST716274.06
SC417192.20SC443292.08SC471188.52ST717179.37
SC417286.52SC444188.84SC471293.23ST717277.20
SC418192.34SC444290.77SC472183.95ST718182.92
SC418291.00SC445191.24SC472287.05ST718254.30
SC419190.25SC445290.94SC473188.42ST719147.16
SC419291.21SC446194.06SC473287.96ST719287.10
SC420196.54SC446293.78SC474192.12ST720166.16
SC420295.04SC447190.90SC474290.71ST720269.62
SC421192.40SC447285.81SC475194.07ST721179.40
SC421293.67SC448190.11SC475287.98ST721277.28
SC422188.17SC448293.31SC476192.82ST722182.95
SC422289.88SC449193.88SC476289.00ST722282.78
SC423193.08SC449292.37SC477190.33ST724165.62
SC423286.76SC450191.16SC477290.19ST724262.94
SC424192.30SC450293.77SC480191.42
SC424294.92SC451190.53SC480291.43
SC425196.34SC451292.85SC481191.79

