Article

Crown Wall Modifications as Response to Wave Overtopping under a Future Sea Level Scenario: An Experimental Parametric Study for an Innovative Composite Seawall

1
Department of Engineering, Università degli Studi della Campania “L. Vanvitelli”, via Roma, 29, 81031 Aversa (Caserta), Italy
2
Inter-University National Consortium for Marine Sciences (CoNISMa), P.zzale Flaminio, 00144 Rome, Italy
3
CNR-INM, Institute of Marine Engineering, Via di Vallerano 139, 00128 Roma, Italy
*
Author to whom correspondence should be addressed.
Appl. Sci. 2020, 10(7), 2227; https://doi.org/10.3390/app10072227
Submission received: 22 February 2020 / Revised: 12 March 2020 / Accepted: 18 March 2020 / Published: 25 March 2020
(This article belongs to the Special Issue Maritime Hydraulics: Analysis and Modeling)

Abstract

:
The overtopping phenomenon at the rear side of breakwaters has particular importance in harbor protection. Undoubtedly, this topic needs to be taken even more seriously, considering the sea level rise. The present study focuses on the effectiveness in the reduction of the wave overtopping of a triangular parapet placed on the top of an innovative concrete superstructure. The last is part of the OBREC device (Overtopping BReakwater for wave Energy Conversion), an overtopping structure which is integrated into a traditional rubble-mound breakwater, to convert wave energy into electricity. Parametric laboratory tests, including the influence of water depth, have led to the evaluation of the accuracy of the main literature formulations and to the introduction of a new overtopping formula to take into account the influence of the parapet geometry. The results highlight the capability of the parapet in significantly increasing the hydraulic protection compared to a breakwater with a traditional crown wall. The findings from this work are expected to support in promoting and developing adaptive management strategies for existing coastal defenses and smart approaches in the construction and maintenance of new ones, with special reference to future sea-level-rise scenarios.

1. Introduction

1.1. Motivations and Perspective

If it is true that the first two decades of the 21st century will be remembered as those of maximum scientific and political discussion on the warming of the climate system, then the following two decades will probably focus on the options for countering the impact and future risks of climate trends.
While the scientific aspect of the climate change was in the hands of a few categories, now ahead lies a general page, for whoever is on call, in order to face the challenges in the near future. For instance, the marine and maritime engineering community is pushing hard to provide solutions in the blue energy sector [1], which could give a significant contribution to the greenhouse gas reduction objectives. The exploitation of energy from the sea though Wave Energy Converters (WECs) is increasingly catching on, and numerous technological solutions are renovating this field [2,3]. The idea to integrate WECs into traditional coastal structures is not recent, and lately, it is moving toward the highest level of research and development [4,5,6,7,8,9,10].
Nowadays, ninety-seven percent of climate scientists (they were 95% in 2013 [11]) agree that climate-warming trends over the past century are extremely likely due to the heat-trapping nature of carbon dioxide and other gases related to human activities [12].
Unfortunately, the first symptoms of climate change have begun to appear, so it is now necessary to take action, not only on the causes of the global warming, but also on its effects. Changes in the polar ice caps, ocean temperatures, atmospheric sea level pressure, wind fields, precipitation patterns, ocean currents and water mass distribution seem to be confirmed by several studies, leading worldwide scientific organizations to issue public statements endorsing this position. The sea level rise (SLR) and the intensification of extreme wave climate events represent one of the major issues of global concern [13].
SLR affects the extreme statistics of both nearshore significant wave height and water level, resulting in an increase of overtopping in terms of discharge volumes and frequency of overtopping events [14,15,16]. This issue needs to be carefully addressed during planning, design and maintenance of coastal defenses and related risk-management strategies [17]. Present day risks may substantially be altered and generate a need to revisit existing costal defenses by developing alternative and innovative countermeasures. For their part, some coastal engineers and researchers involved in the renewable energy sector are focusing their effort on the combination of WECs into harbor breakwaters [18,19,20], which could represent a smart alternative with other adding values, e.g., just the protection against SLR.
The present work analyzes a specific measure to counteract the increased overtopping due to SLR to be embedded into a WEC-breakwater technology called Overtopping BReakwater for wave Energy Conversion (OBREC) [21,22,23]. This device is able to extract energy through the wave-overtopping phenomenon. Instead of dissipating the incoming wave energy, OBREC uses a single reservoir, placed on a traditional rubble mound breakwater or on a vertical caisson breakwater, to harvest this energy and transform it into electricity (Figure 1). After the system collects the overtopping water above the sea level, thanks to a sloping ramp, the flow is driven toward low head turbines in the reservoir, to generate electrical energy [24,25].
A full-scale prototype of OBREC is currently working at Naples Harbor, in Italy. It represents the first non-conventional breakwater in the world which exploits the overtopping phenomenon to produce clean energy. This technology can be applied for new breakwater port expansions, or it can be integrated into existing superstructures, which must be rebuilt due to the maintenance activities or upgraded due to climate change [26]. Given its concept, the system must meet both energy prerequisites and harbor safety requirements. Therefore, in order to reduce the overtopping at the rear of the structure, the upper crown wall is equipped with a reverse bevel consisting in an isosceles triangular parapet, also denominated “nose” (Figure 1). The effectiveness of the OBREC nose with a pre-fixed geometry was already confirmed by previous studies [19,27]. A clear definition of the hydraulic performance of this nose under different overall dimensions and in the perspective of a SLR scenario is, however, still unknown. Previous studies focused on different configurations of the parapet instead of analyzing its hydraulic performance based on their geometrical characteristics and overall dimensions, indeed.
Such a framework provides the main motivations and the path in which the experimental analysis has been conceived and carried out.

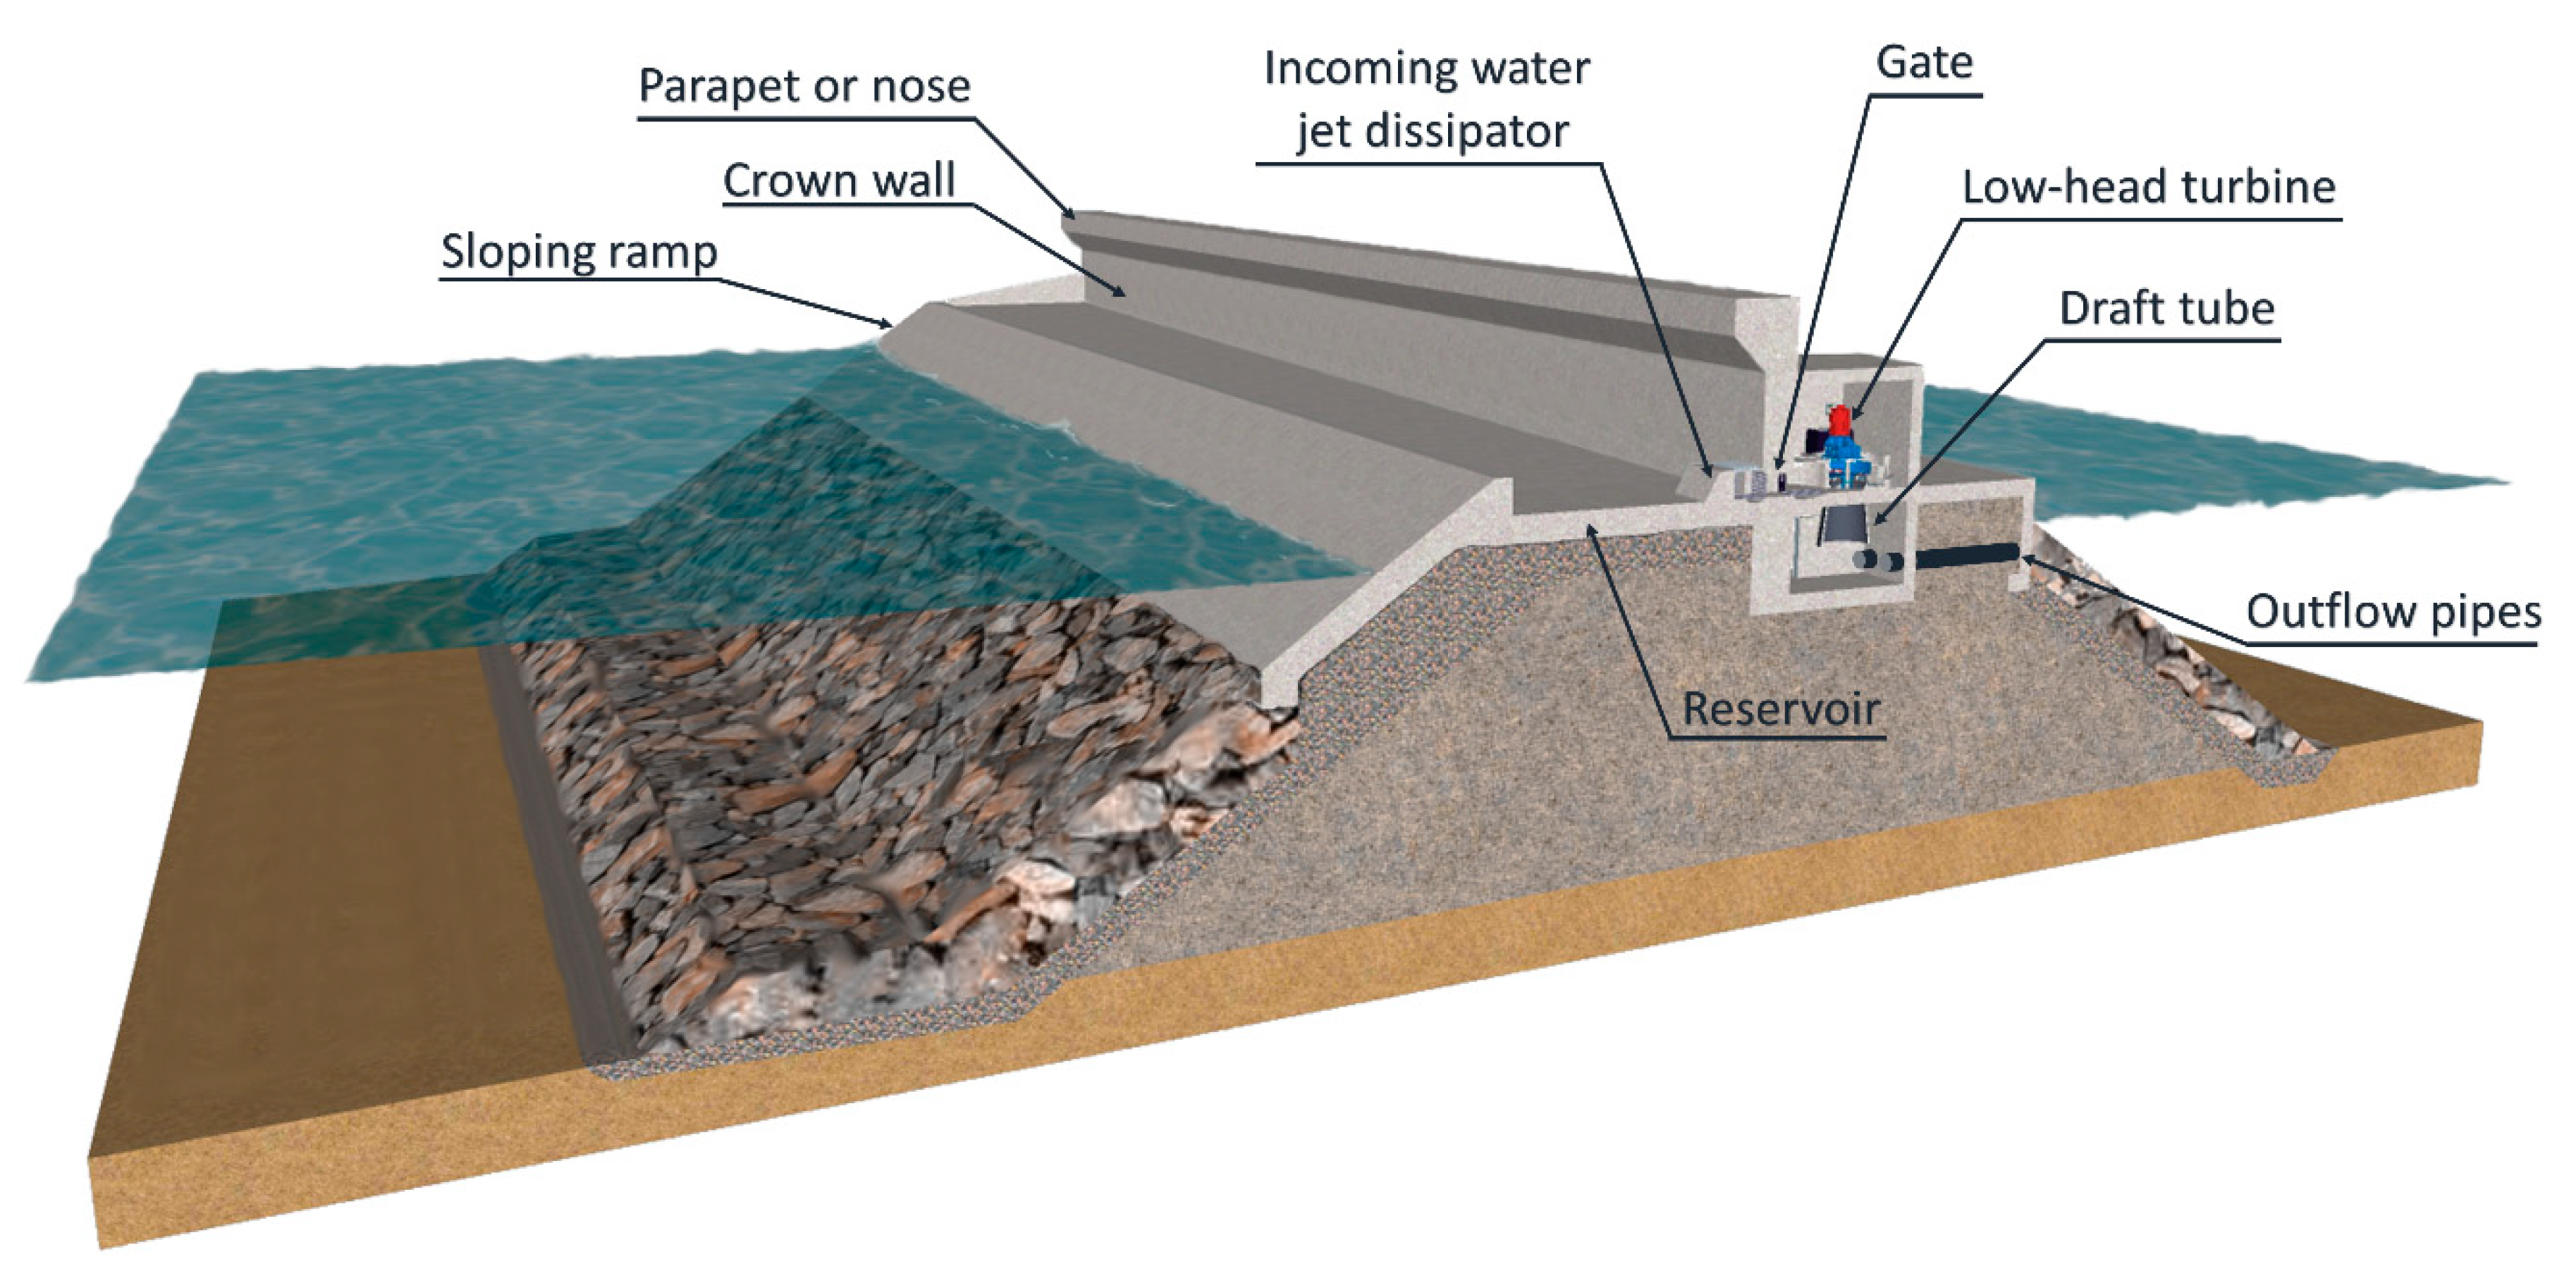
1.2. Technical Background

Wave overtopping can strongly influence the overall response of coastal defenses. In the last few decades, several studies have been carried out with the aim to investigate the overtopping phenomenon, but, at the present, few of them have analyzed the strategies to reduce the wave overtopping for existing infrastructures or new ones designed to impede the sea level rise [28,29].
Conventional crown wall geometries are shown in Figure 2. The vertical wall is frequently adopted to reduce the overtopping discharge rate (Figure 2a) [30,31]. The vertical face is sometimes substituted by a sloping ramp to limit the impulsive wave forces (Figure 2b). However, this solution leads to a worse hydraulic performance in terms of overtopping volumes. Figure 2c shows a seaward curved wall, which allows us to contain the overtopping discharge rate, but, at the same time, its behavior is characterized by the occurrence of relevant uplift pressures weakening the overall structure stability. Upgrading an intuition from the past (see the carved Breakwater [31] introduced by Phoenicians) a composite seawall consisting in the realization of a reservoir between the seaward vertical wall and the sloping ramp (Figure 2d) has been proposed for some recent coastal defenses [32,33]. These nonconventional structures were demonstrated to be characterized by a high hydraulic and structural performance and an economic viability. The reservoir is often equipped with a drainage system providing an uplift pressure saving. In some cases, a parapet on the upper crown wall [27] is conveniently installed. This parapet is aimed to decrease the wave overtopping at the rear side of the structure for very extreme wave conditions.
The hydraulic and structural behavior of seawalls and breakwaters equipped with parapets have been not massively analyzed in the technical literature. Most experimental studies described specific case studies rather than generic investigations. Franco et al. [34] considered different layouts of modified-typed vertical breakwaters, such as a shifted sloping parapet and a caisson with rubble mound protection. The best efficiency in the overtopping reduction was achieved by introducing a recurved parapet at the crest of the vertical front wall. In [35], the influence of a small deflector parapet installed on the top of a vertical wall was analyzed. It was demonstrated that the overtopping discharge rate was strictly related to the dimensionless freeboard. Pearson et al. [36] carried out a set of overtopping measurements on different types of composite walls at small and large scales, and the experimental results were elaborated to derive a generically valid method for the prediction of the overtopping reduction. This study also provided a prediction method in a “decision chart” taking into account the inclination of the parapet. In [37], the reduction of wave overtopping of a smooth dike was investigated by installing a wave return wall, and lately Van Doorslaer at al. [38] evaluated the overtopping effect of several crest layouts, as a storm wall with or without nose, a promenade and a combination of both solutions, all of which to be mounted at crest level of the dike. Various recurved parapets, with different recurved extensions and angles, were tested by [39]. The results of such investigation confirmed the expected reduction of the overtopping discharge rate by increasing the angle of recurve.
Despite the various design solutions, none of the aforementioned studies could be straightforwardly applied to the OBREC because of its specific geometry and hydraulic behavior. For this reason, the optimization of the OBREC geometry required a preliminary analysis based on physical model tests at the Aalborg University (Denmark) in 2012 and 2014. In particular, Vicinanza et al. [40] performed an experimental campaign mainly aiming to compare the hydraulic performance of equally sized OBREC and traditional rubble mound breakwaters. According to the physical model tests, the average overtopping discharge rate in OBREC was slightly larger than in the traditional device. The safety against the overtopping OBREC was shown to be even smaller by adopting a curved, instead of a flat, ramp, as reported by [21,41].
In the aforesaid studies, some preliminary results demonstrated that the installation of the nose allowed to reduce the wave overtopping by 50–60%, whereas the production of electricity was unaltered being related to the wave overtopping discharge in the front reservoir. Nevertheless, the influence of the geometry of the parapet on the overtopping phenomenon was not evaluated in detail. A comprehensive understanding of the nose behavior would be a desirable outcome, given that its installation should lead to the following:
  • An enhancement of the hydraulic safety level as compared to a traditional breakwater;
  • The lowering of the OBREC crest height to provide lower visual impact on the city skyline;
  • An increase of the potential energy to be converted because the up-rushing waves are redirected into the reservoir;
  • An effective and economically feasible solution to counter the effects derived by the SLR.
Moving from these motivations, the present work intends to assess the effectiveness of the nose to oppose the wave overtopping potentially generated by an increase of the sea water level. The influence of the nose geometrical layout on the wave overtopping at the rear side of the OBREC is analyzed in the following, and some empirical recommendations to be used for optimally designing the nose structure are presented.
The paper is organized as follows: Section 2 provides detailed information on the experimental facility and tests program. In Section 3, an analysis of the physical model data on the hydraulic performance of the nose is provided. Here, a new formula to be applied for predicting the dimensionless wave overtopping discharge is suggested. Section 4 is finally devoted to an overall discussion with some concluding remarks.

2. Materials and Methods

The experimental results derived by the physical model tests carried out at the Hydraulic and Coastal Engineering Laboratory of Aalborg University in 2014 [21] are herein considered. During these test-runs, the overtopping volume at the rear side of the structure was measured by considering three different geometries of the nose.

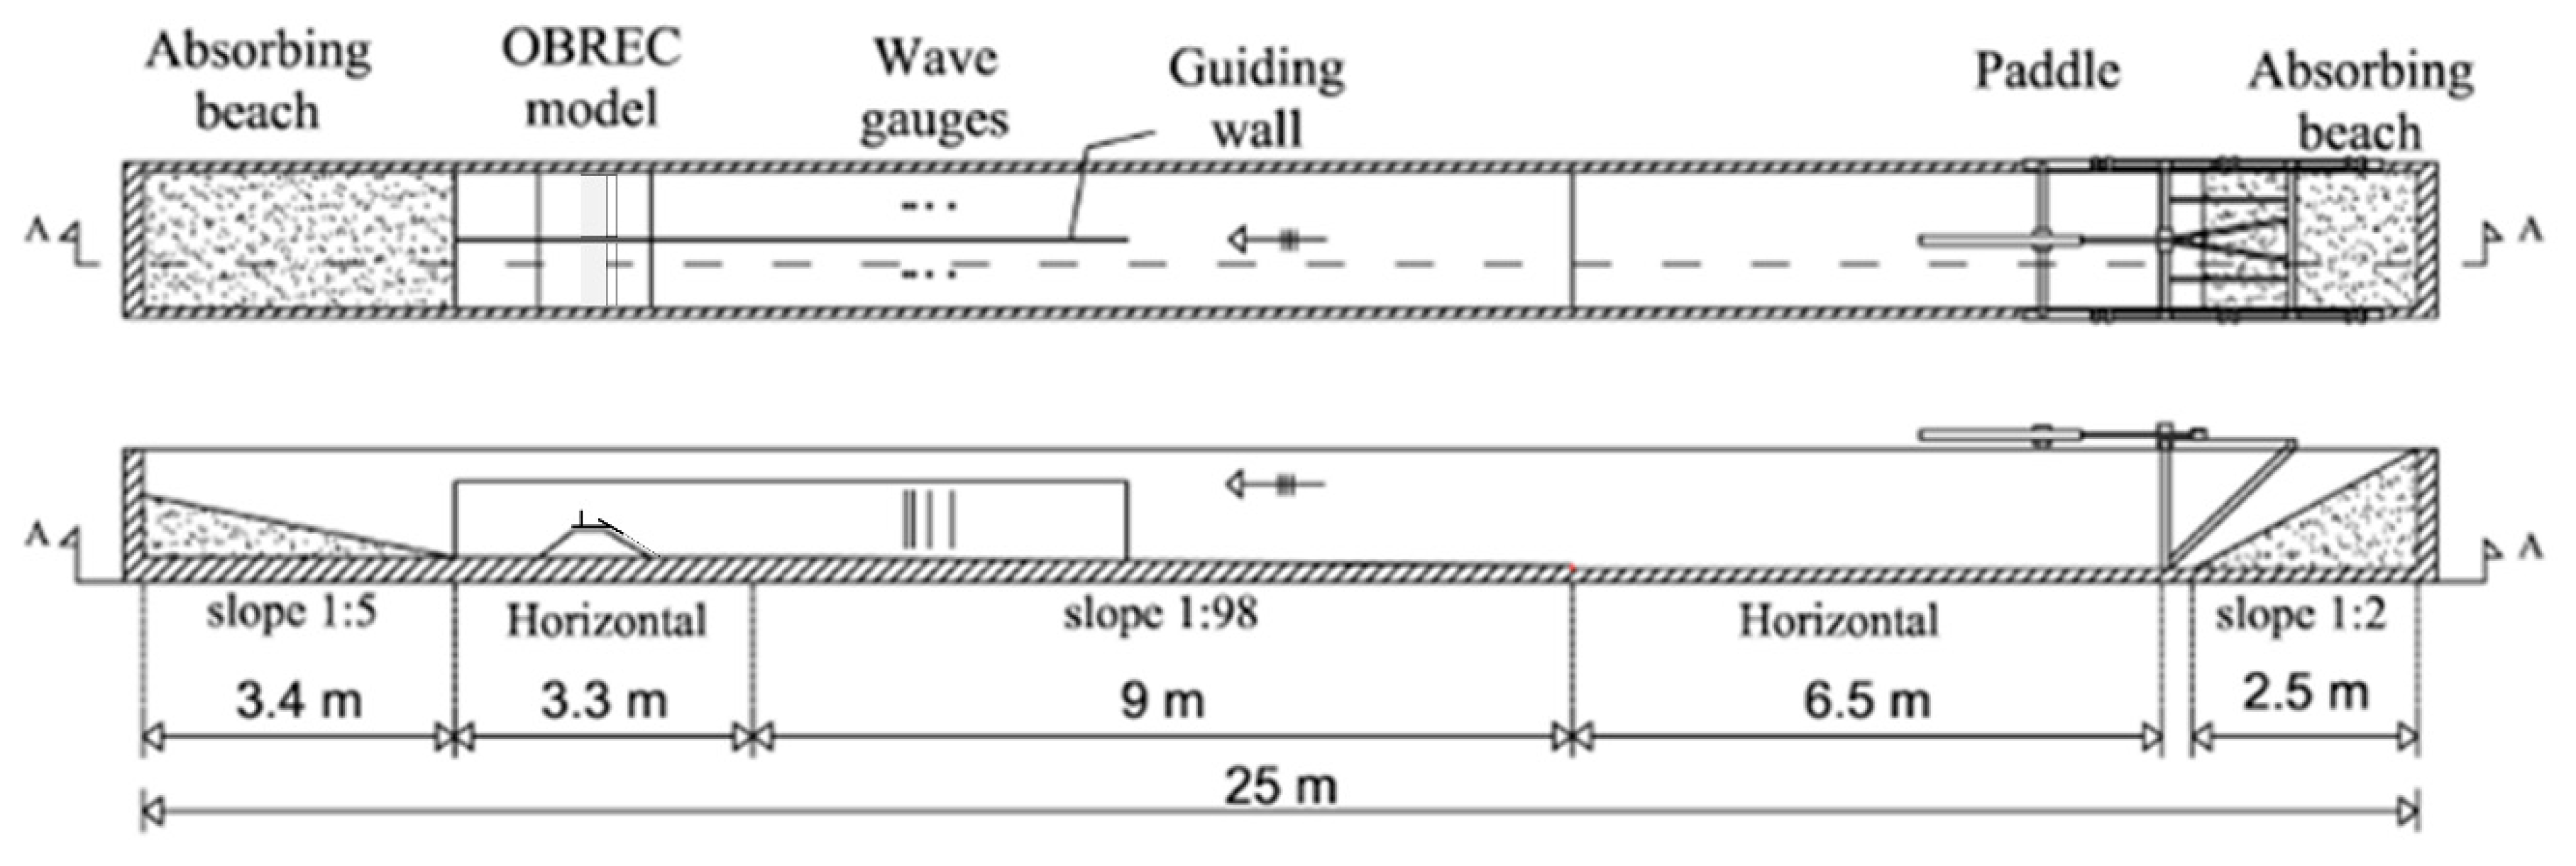
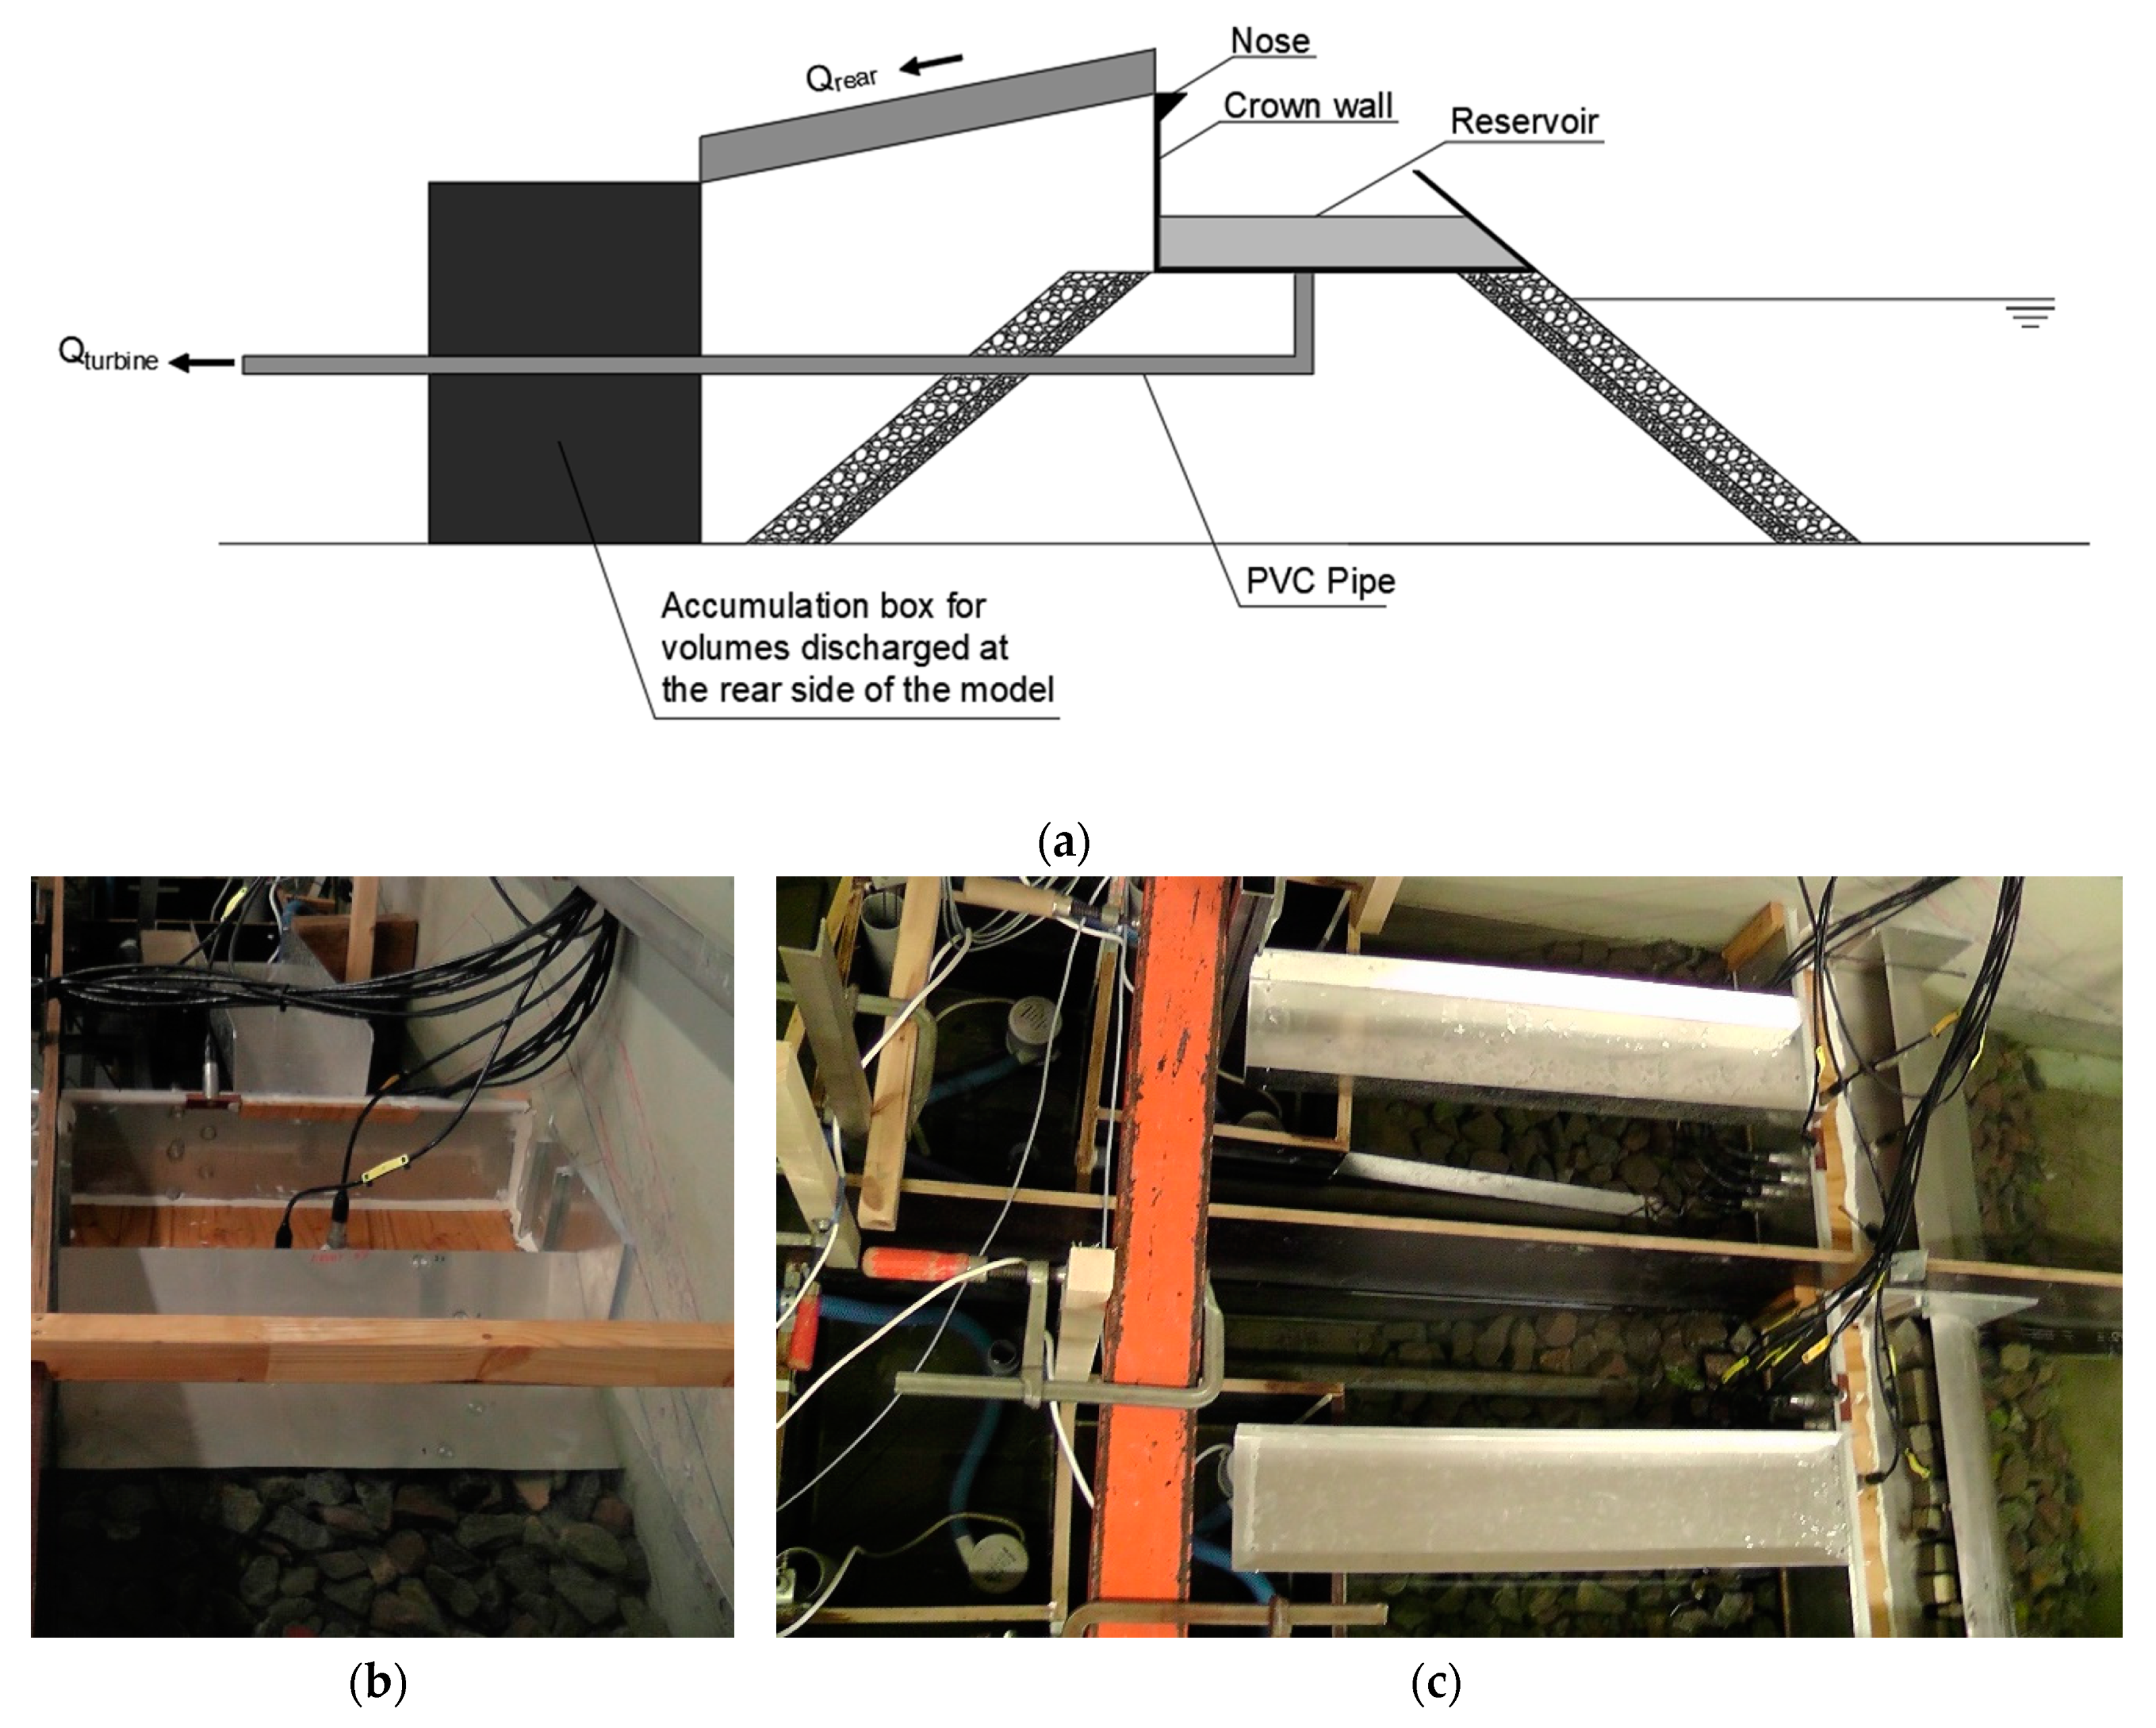
2.1. Laboratory Model

The 2D experimental tests were performed in a 25.00 m long, 1.50 m wide and 1.20 m deep wave flume (Figure 3), where a down-scaled model of OBREC, with a scale factor of 1:30 (Froude scale), as compared to the prototype dimensions, was installed. The wave flume was horizontal for the first 6.50 m, starting from the piston wave paddle. After a step of 0.35 m, a sloping ramp, with a length of 9.00 m, conveyed the wave flow toward the OBREC model. The latter was placed on a horizontal invert. At the end of the flume, a dissipative gravel beach with a slope included between 1:4 and 1:5 was positioned in order to absorb the wave energy transmitted at the rear side of the model and to minimize the reflection in the channel. The flume was separated in two subsections by an axial guiding wooden wall, with a total length of 5.00 m. The herein considered model had a flat ramp and it was placed in one of these subsections, whereas a similar model with a curved ramp was located in the adjacent flume subsection. Lateral and frontal views of the two OBREC models are displayed in Figure 4.
The model was made up of a rubble-mound foundation and a steel superstructure with a thickness of 5 mm, by which the flat ramp, the reservoir and the vertical wall were built. The model was installed in the flume in different steps: First, the steel component was fixed to the channel, with the base placed at 0.30 m above the wave flume bottom. The rubble-mound foundation, with the different layers made out of rock material, was then installed under the fixed structure.
The rubble-mound materials were chosen to ensure the stone stability under the wave action and to reproduce the main hydraulic behavior of the structure. The porous media below the OBREC base was composed of three layers with nominal diameter Dn,50. In detail, the rubble-mound foundation consists of a core with Dn,50 = 5 mm, filter layers with Dn,50 = 20 mm and the seaward and leeward external armor layers with Dn,50 = 50 mm.
Figure 5 shows a cross-section of the OBREC model with the frontal ramp in the flat configuration [26]. The latter had a planar face slope of α = 34° with reference to the horizontal. In the sketch of Figure 5, the following notation is assumed: Br is the emerged reservoir width; Bs is emerged sloping plate width; Bb is the lower side reservoir width; Bbase is the base width; ΔBrs is the horizontal distance between the ramp crest and the crown wall; dw is the ramp height; dd is the submerged shaft; h is the water depth at the toe of the structure; hres is the vertical distance between the base reservoir and the channel bottom; Rr is the crest freeboard of the ramp; Rc is crest freeboard of the crown wall; ΔRc is the vertical distance between the top of the crown wall and the ramp crest; and hw is the crown wall height with reference to the reservoir bottom. It is worth noting that the nose (highlighted by a circle) on the crown wall is also represented in Figure 5.
Table 1 summarizes the range of the main model geometrical parameters.
An accumulation box with a water level gauge was installed at the rear side of the structure, with the twofold aim, to measure the wave overtopping volumes and to control the evacuation pumps. As depicted in Figure 6, the overtopping discharge flowed along a ramp, with a width of 0.202 m, on the top of the crown wall. Then, the flow entered the accumulation box, which was connected to a tailwater reservoir by a PVC pipe placed at the same level of the OBREC reservoir bottom.
Given the water level in the accumulation box, the overtopping discharge, qrear, was derived as follows:
qrear = ΔV/Δt = {A(hbox)⋅[hbox(t + Δt) − hbox(t)]}/Δt
where ΔV is the overtopping volume variation in the time interval Δt, and A(hbox) is the box cross-sectional area. It is noteworthy that A(hbox) is a function of the water level hbox which varied thanks to the presence of the PVC pipe and a pump used to extract the water. It was thus calculated by measuring hbox after that a known water volume was conveyed in the box [41].
In the next applications herein described, qrear is made non-dimensional by considering the following relation:
qrear* = qrear/(g⋅Hm03)0.5
where g is the gravity acceleration, and Hm0 is the wave height computed on the zero-order moment of wave spectral function.

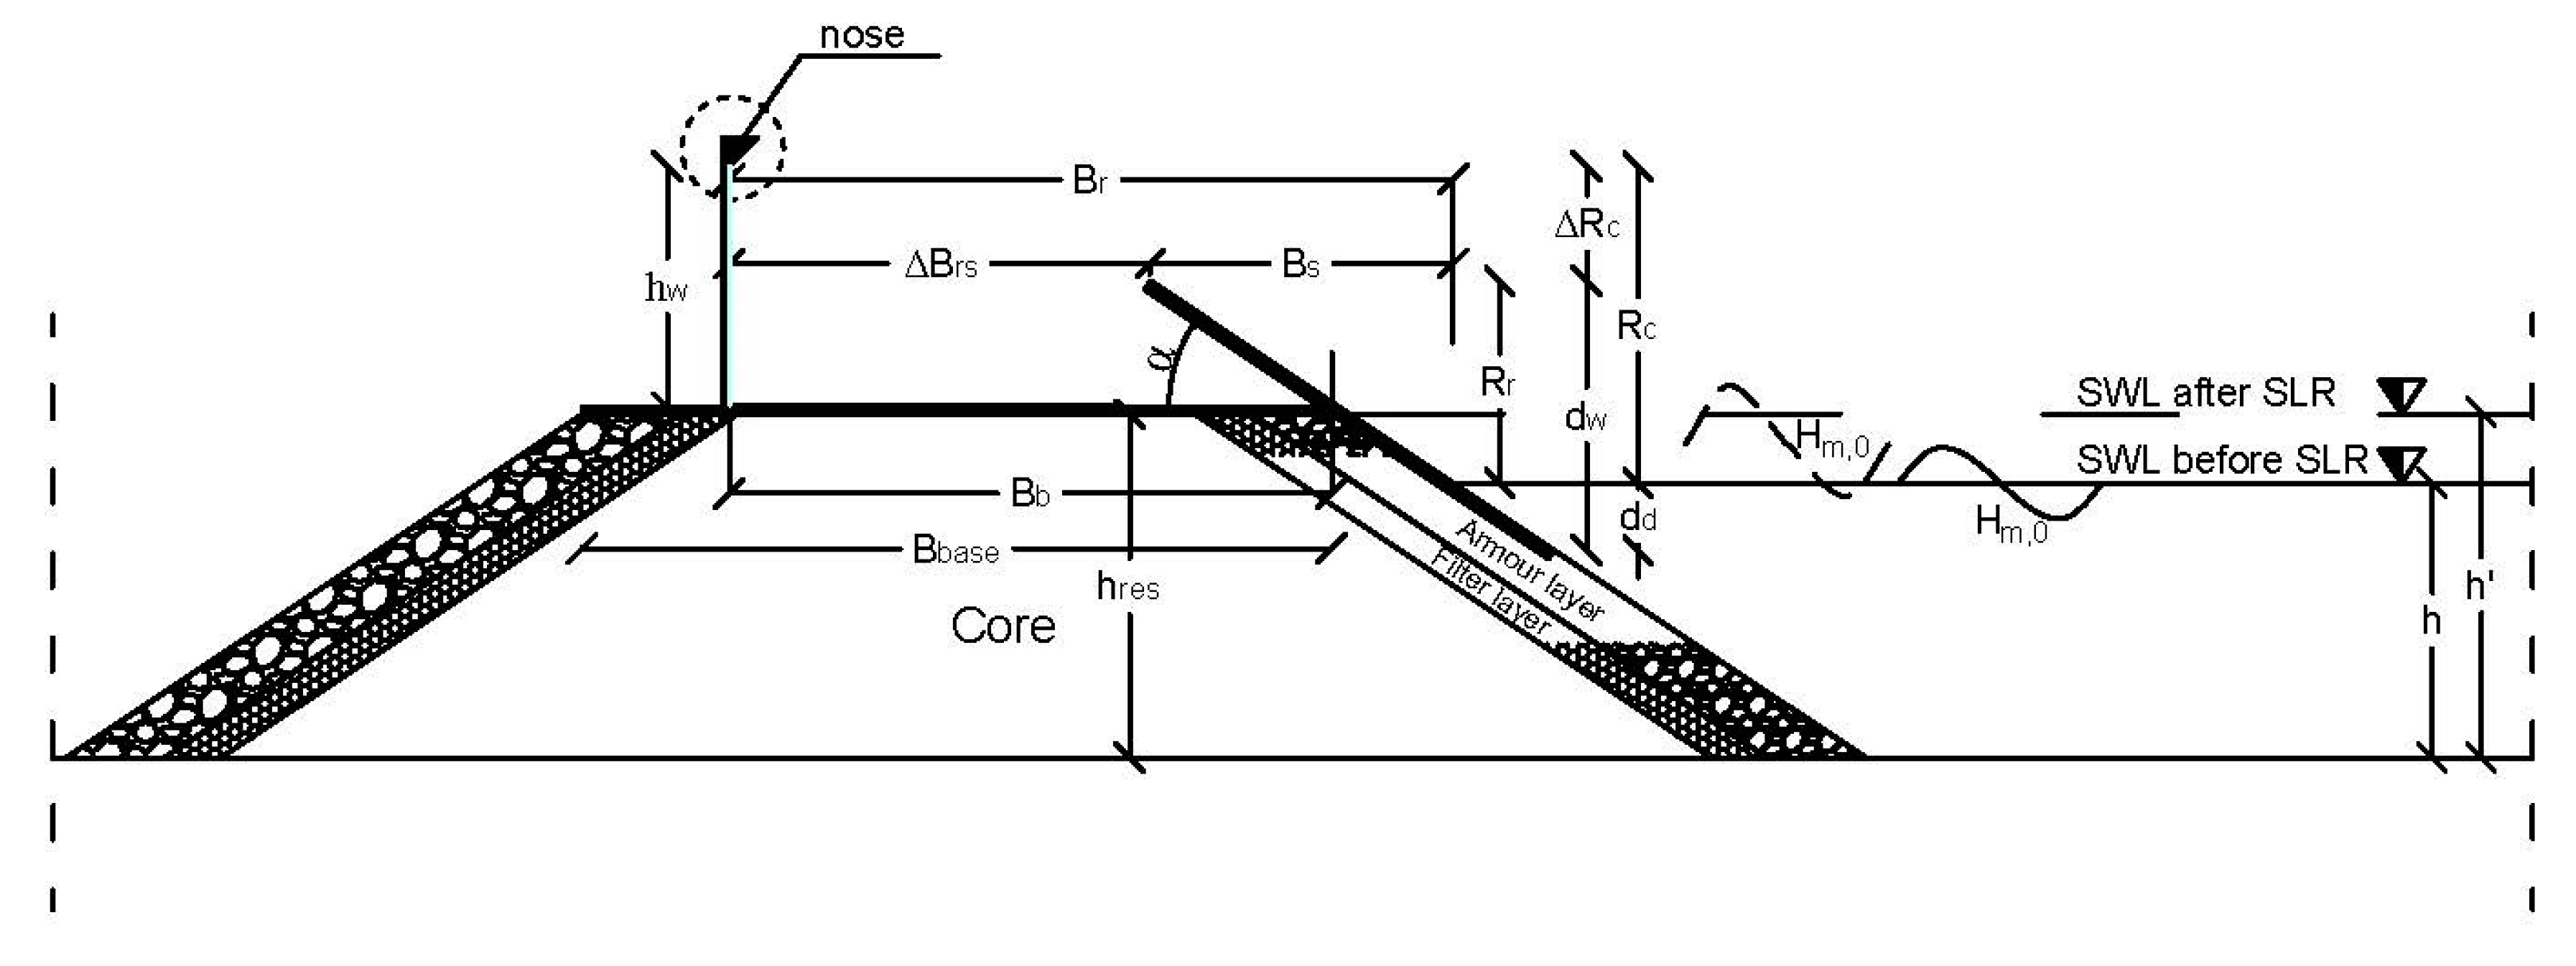
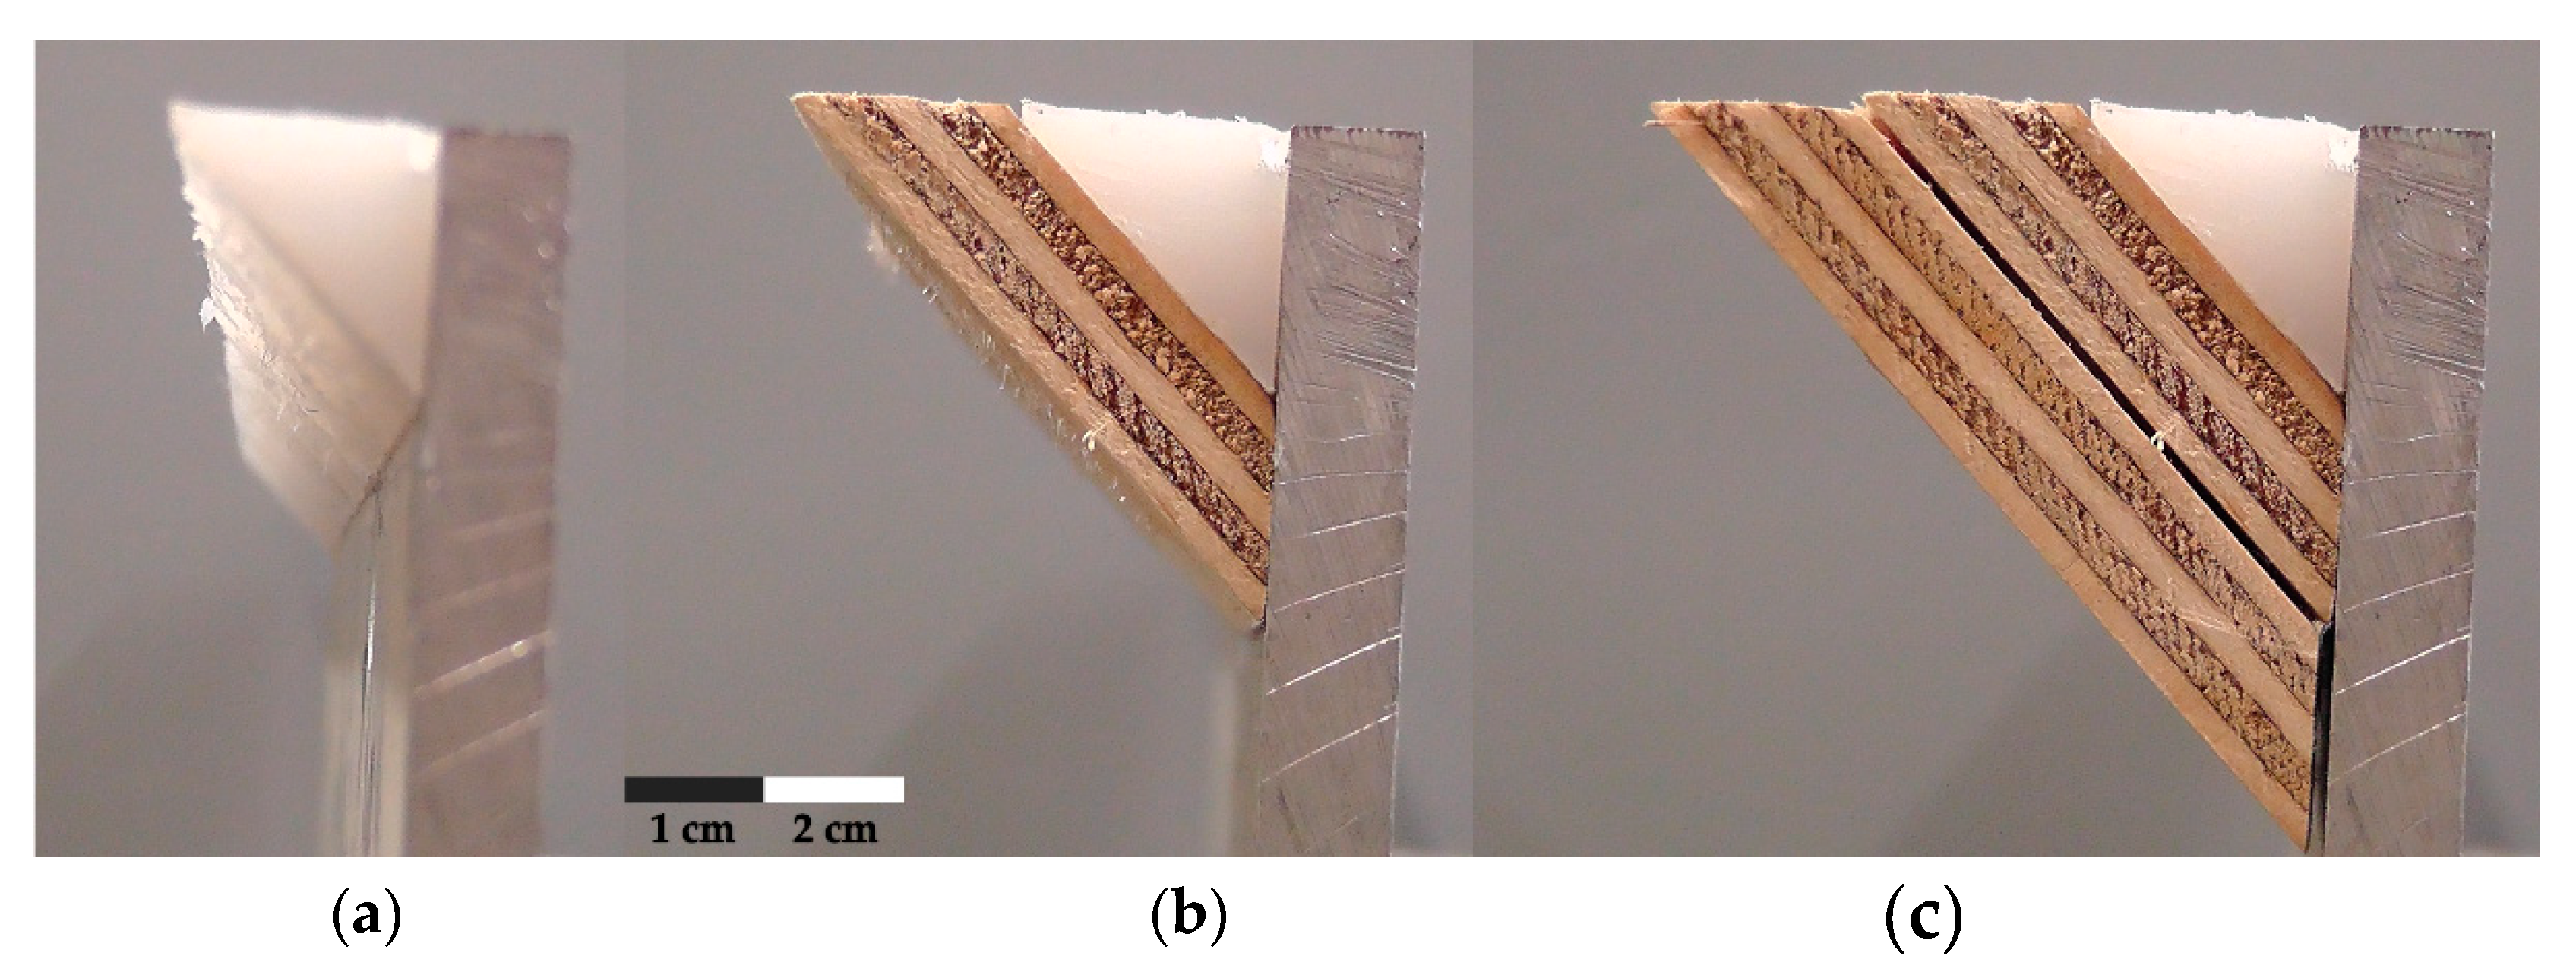
2.2. Geometry of the Nose

A nose (Figure 1, Figure 5 and Figure 6a) was placed on the top of the upper crown wall of the OBREC model. The flat configuration exhibited a larger overtopping discharge rate (about +20%) than the curved configuration [26]. Therefore, the paper focuses on the flat ramp configuration.
The nose had an isosceles triangular shape, with an angle of ε = 45°, in respect to the vertical [40]. Three different nose dimensions were tested. The smallest geometry was characterized by a nose height/length hnose = 0.020 m. It was installed by adding a triangle parapet made of plastic material on the upper crown wall (Figure 7a). A second parapet configuration with dimensions of hnose = 0.037 m was realized by pasting an additional wooden piece on the existing plastic profile (Figure 7b). The nose in the extra configuration was characterized by hnose = 0.057 m, and it was obtained from the addition of a further wooden triangle (Figure 7c).
In the following, the nose dimension is indicated with the dimensionless height λ = hnose/hw. According to the observed nose geometry, λ is thus equal to 0.10 (small configuration), 0.19 (large configuration) and 0.29 (extra-large configuration).

2.3. Sea-Level-Rise Scenario

During the last decades, several investigations on SLR have been carried out, as many projections from observed data have been proposed. One of the key questions related to the development of a future scenario is where the estimation should be provided. Bearing in mind the high variability of SLR at both regional scale and local level, the term SLR should be read in the sense of Global Mean Sea Level (GMSL) rise. Since 1880, the GMSL has increased by about 21 to 24 cm, with about 8 cm occurring since 1993 [42,43,44].
Moving from those observed data, a wide range of estimates for GMSL rise scattered throughout the scientific literature can be found, along with the lack of any coordinating interagency effort.
A scientific synthesis across the large range of published future GMSL was described by [45]. They developed a set of four scenarios, spanning a range of 0.2 to 2.0 m by the year 2100, that described potential future GMSL conditions under varying assumptions about climate change and the behavior of large ice sheets. However, the key advance of that study was the complement of the existing scientific assessments (e.g., from the Intergovernmental Panel on Climate Change, IPCC [46]) by presenting the science from the perspective of scenario analysis within a risk-based context. Practically, instead of addressing the question “What is most likely to occur?”, the research of the long-term SLR should be read in terms of “How bad could things get?” [47]. In fact, traditional scientific assessment can often diverge from the goals of packaging science needed to support assessment and management of risk [48]. For instance, the IPCC Fifth Assessment Report [46] stresses the central or ‘likely’ range of 21st century rise in GMSL based primarily on process-based models. As explained in [49], the ‘likely’ range is assessed as having at least a 66% probability of containing the true value. Given such a 33% chance that GMSL rise falls outside of this range, some risk-averse decision-makers may find the IPCC’s ‘likely’ range inadequate for their planning purposes (for instance, a nuclear power plant near the coastal zone might be more interested in the 99th percentile, as highlighted by [47]).
Clearly, a detailed review or study of long-term SLR scenarios are out of the scope of the present paper. However, in order to define a methodology, a selection of a specific pattern is required. Several studies assumed the SLR to be linear during the 21st century: for instance, Chini et al. [16] investigated an extreme rate of 1.0 m rise in 2100. At the European level, Weisse et al. [17] provided an estimation of regional mean sea level changes for five tide gauges in different parts of Europe: for all the locations, the 95-percentile maxima of GMSL derived from the Intergovernmental Panel on Climate Change Fourth Assessment Report (IPCC AR4) projections arises about 0.8 m in 2080.
One recent study [50] estimates that 0.9 m of sea level rise would permanently inundate areas currently home to 2 million Americans. The value of 0.9 m corresponds to the median under the Representative Concentration Pathway 8.5 (RCP8.5) emission scenario [51], in which a 2 °C warming relative to the preindustrial period is expected by 2041, reaching 4 °C by 2083, continuing to a median projected warming of almost 5 °C by 2100 [52,53]. Moreover, 0.9 m is suggested by European Community as the SLR value which will probably face almost all of the world’s 136 largest coastal cities by 2100 [54]. Therefore, a value of 0.9 m has been considered as the future scenario of sea level during the present experimental campaign. Considering the scale of the laboratory model (1:30), test-runs were repeated considering a high-water level of 3 cm to be added to the baseline water level of h = 0.27 m (hence h’ = 0.30 m) for wave propagation from offshore to nearshore. The value of h after SLR is indicated using a prime (’).

2.4. Wave Characteristics and Experimental Program

The wave motion was triggered by a hydraulic-driven piston-type wavemaker, whose movement was electrically controlled. The software AwaSys [55,56], which was developed at the Department of Civil Engineering of the Aalborg University, was used to generate the wave signal sent to the wavemaker. The system allowed us to produce both regular (linear, second-order or approximated by the theory of stream function) and random waves, with an energy spectrum chosen among JONSWAP (JOint North Sea Wave Project), Pierson-Moskowitz, Bretschneider-Mitsuyasi and Texel Marsen Arsloe spectra. For the random wave generation, a standard JONSWAP-type spectrum [57] with a peak factor of 3.3 was considered for all the tests.
The total duration of each test was selected in order to obtain a long time series of around 500–1000 waves. As shown in Table 2, the test-runs designed to evaluate the effectiveness of the nose were characterized by a wide range of Hm0, h, the peak wave period (Tp), the spectral incident energy wave period (Tm−1,0), the deep water wave length (Lm−1,0) and the wave steepness (sm−1,0 = Hm0/Lm−1,0). These wave parameters were also selected in order to increase the overtopping probability. The change of the water depth due to SLR is expressed by the dimensionless ratio r = h’/h of the variables before and after the SLR.
As defined in the previous subsection, the test-runs carried out with the baseline water level (h = 0.27 m) were repeated under the SLR scenario (h’ = 0.30 m). It is worth noting that an overtopped volume was measured for the extra-large configuration only during 5 test-runs. During the remaining tests, the nose prevented the OBREC overtopping. Conversely, in the small and large configurations, only 2 and 1 test-runs, respectively, did not exhibit overtopping, and therefore they are not considered in the following. Hence, among all the tests generated during the test campaign, a total of 20 test-runs have been considered for comparison in the present analysis:
  • Five tests for the small nose configuration, under the actual water level;
  • Five tests for the small nose configuration, with water level after SLR;
  • Five tests for the large nose configuration, with water level after SLR;
  • Five for the extra-large configuration, with water level after SLR.

3. Results

3.1. Nose Effect

The benefits in the limitation of the overtopping discharge derived by the increase of the nose dimensions are shown in Figure 8. The plots from Figure 8a,d, corresponding to an increasing severity of the wave conditions in terms of Hm0 and Tp, report the variation of qrear* as a function of the relative free-board of the crown wall Rc/Hm0. In general, the wave overtopping for the baseline water level (r = 1.00) was not observed, except for the most severe wave conditions (Figure 8d) during which qrear* was equal to about 1.00 × 10⁻⁴. Conversely, when the water level increased due to SLR (r = 1.11), the overtopping volumes at the rear side of the structure were measured. For Hm0 = 0.08 and Tp = 1.46, Figure 8a shows that qrear* was almost equal to zero for λ = 0.29, whereas the nose with λ = 0.10 and λ = 0.19 did not completely block the wave overtopping. The amount of overtopping volume increased relevantly for Hm0 = 0.10 and Tp = 2.33 (Figure 8b). In this condition, qrear* varied between about 5.2 × 10⁻⁵ and 1.0 × 10⁻⁴. An analogous scenario was observed for Hm0 = 0.11 and Tp = 1.71 (Figure 8c). In this wave condition, the measured qrear* for λ = 0.19 and λ = 0.29 were almost equal, whereas the maximum discharge (qrear* = 0.9 × 10⁻⁴) was observed for λ = 0.10. In the end, all the overtopping discharges augmented significantly for Hm0 = 0.11 and Tp = 2.44, as shown in Figure 8d. Under this wave condition, qrear* ranged between about 1.0 × 10⁻⁴ and 2.0 × 10⁻⁴, with the maximum overtopping volume registered for λ = 0.10.

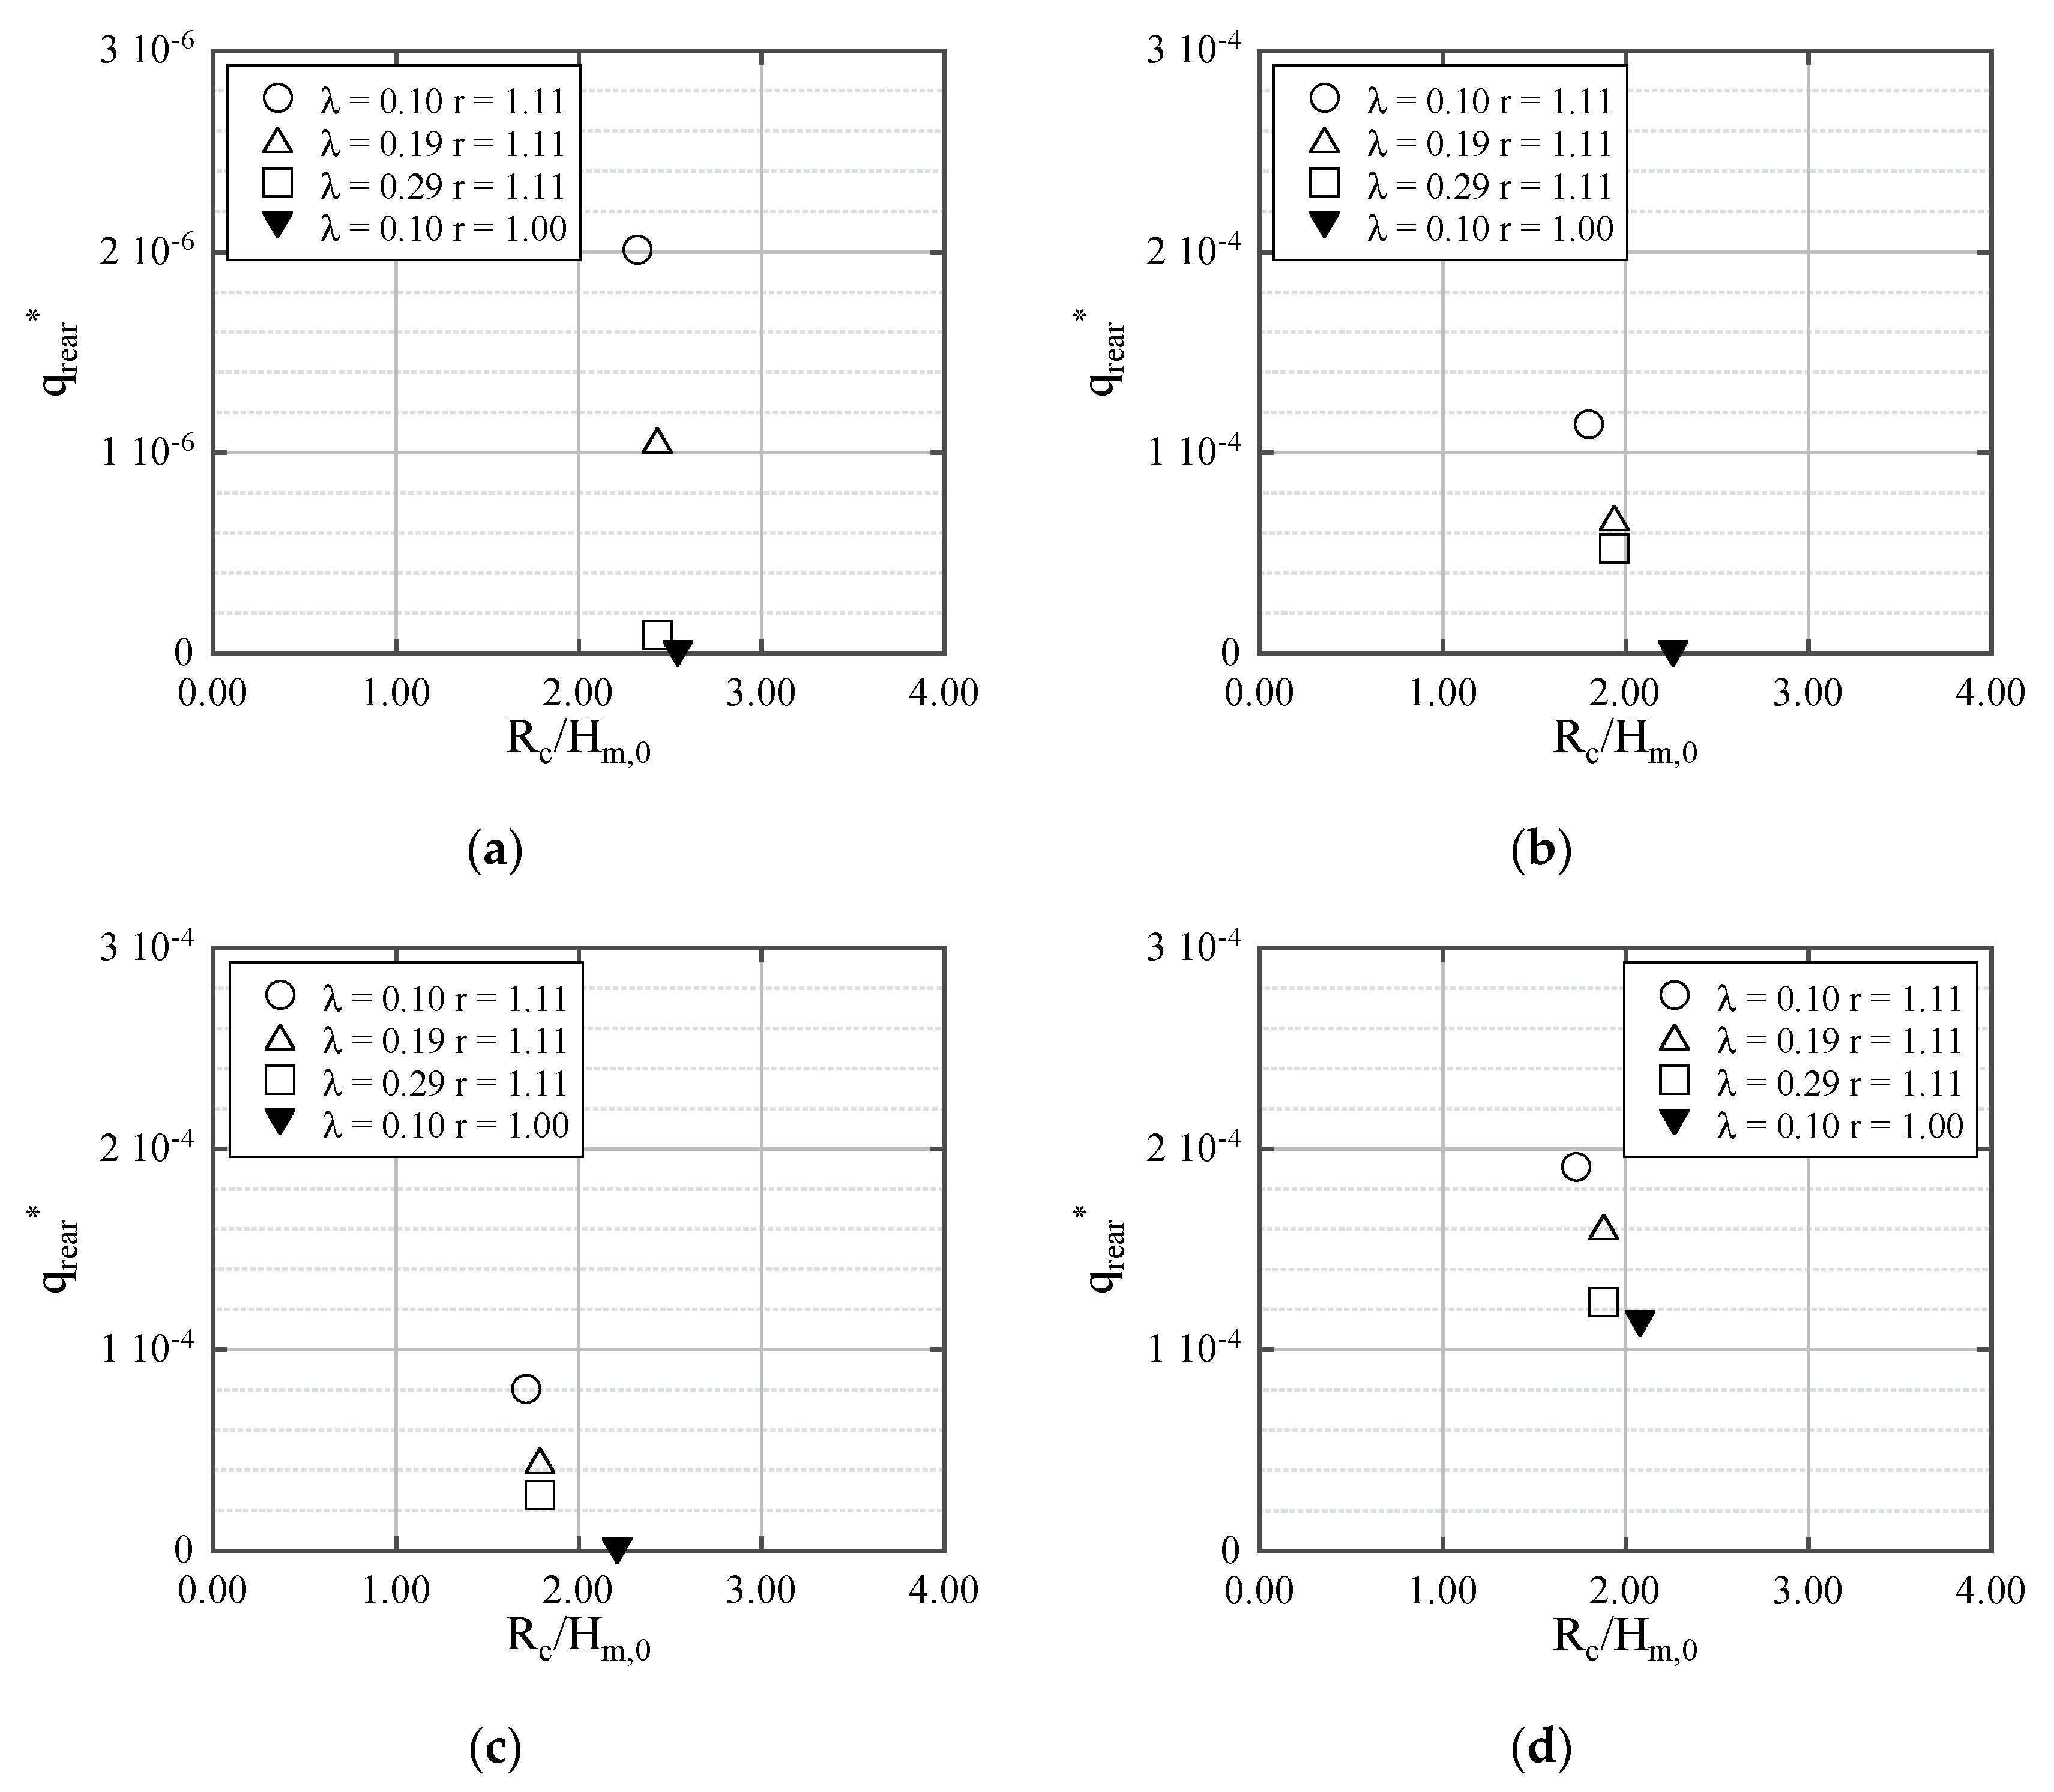
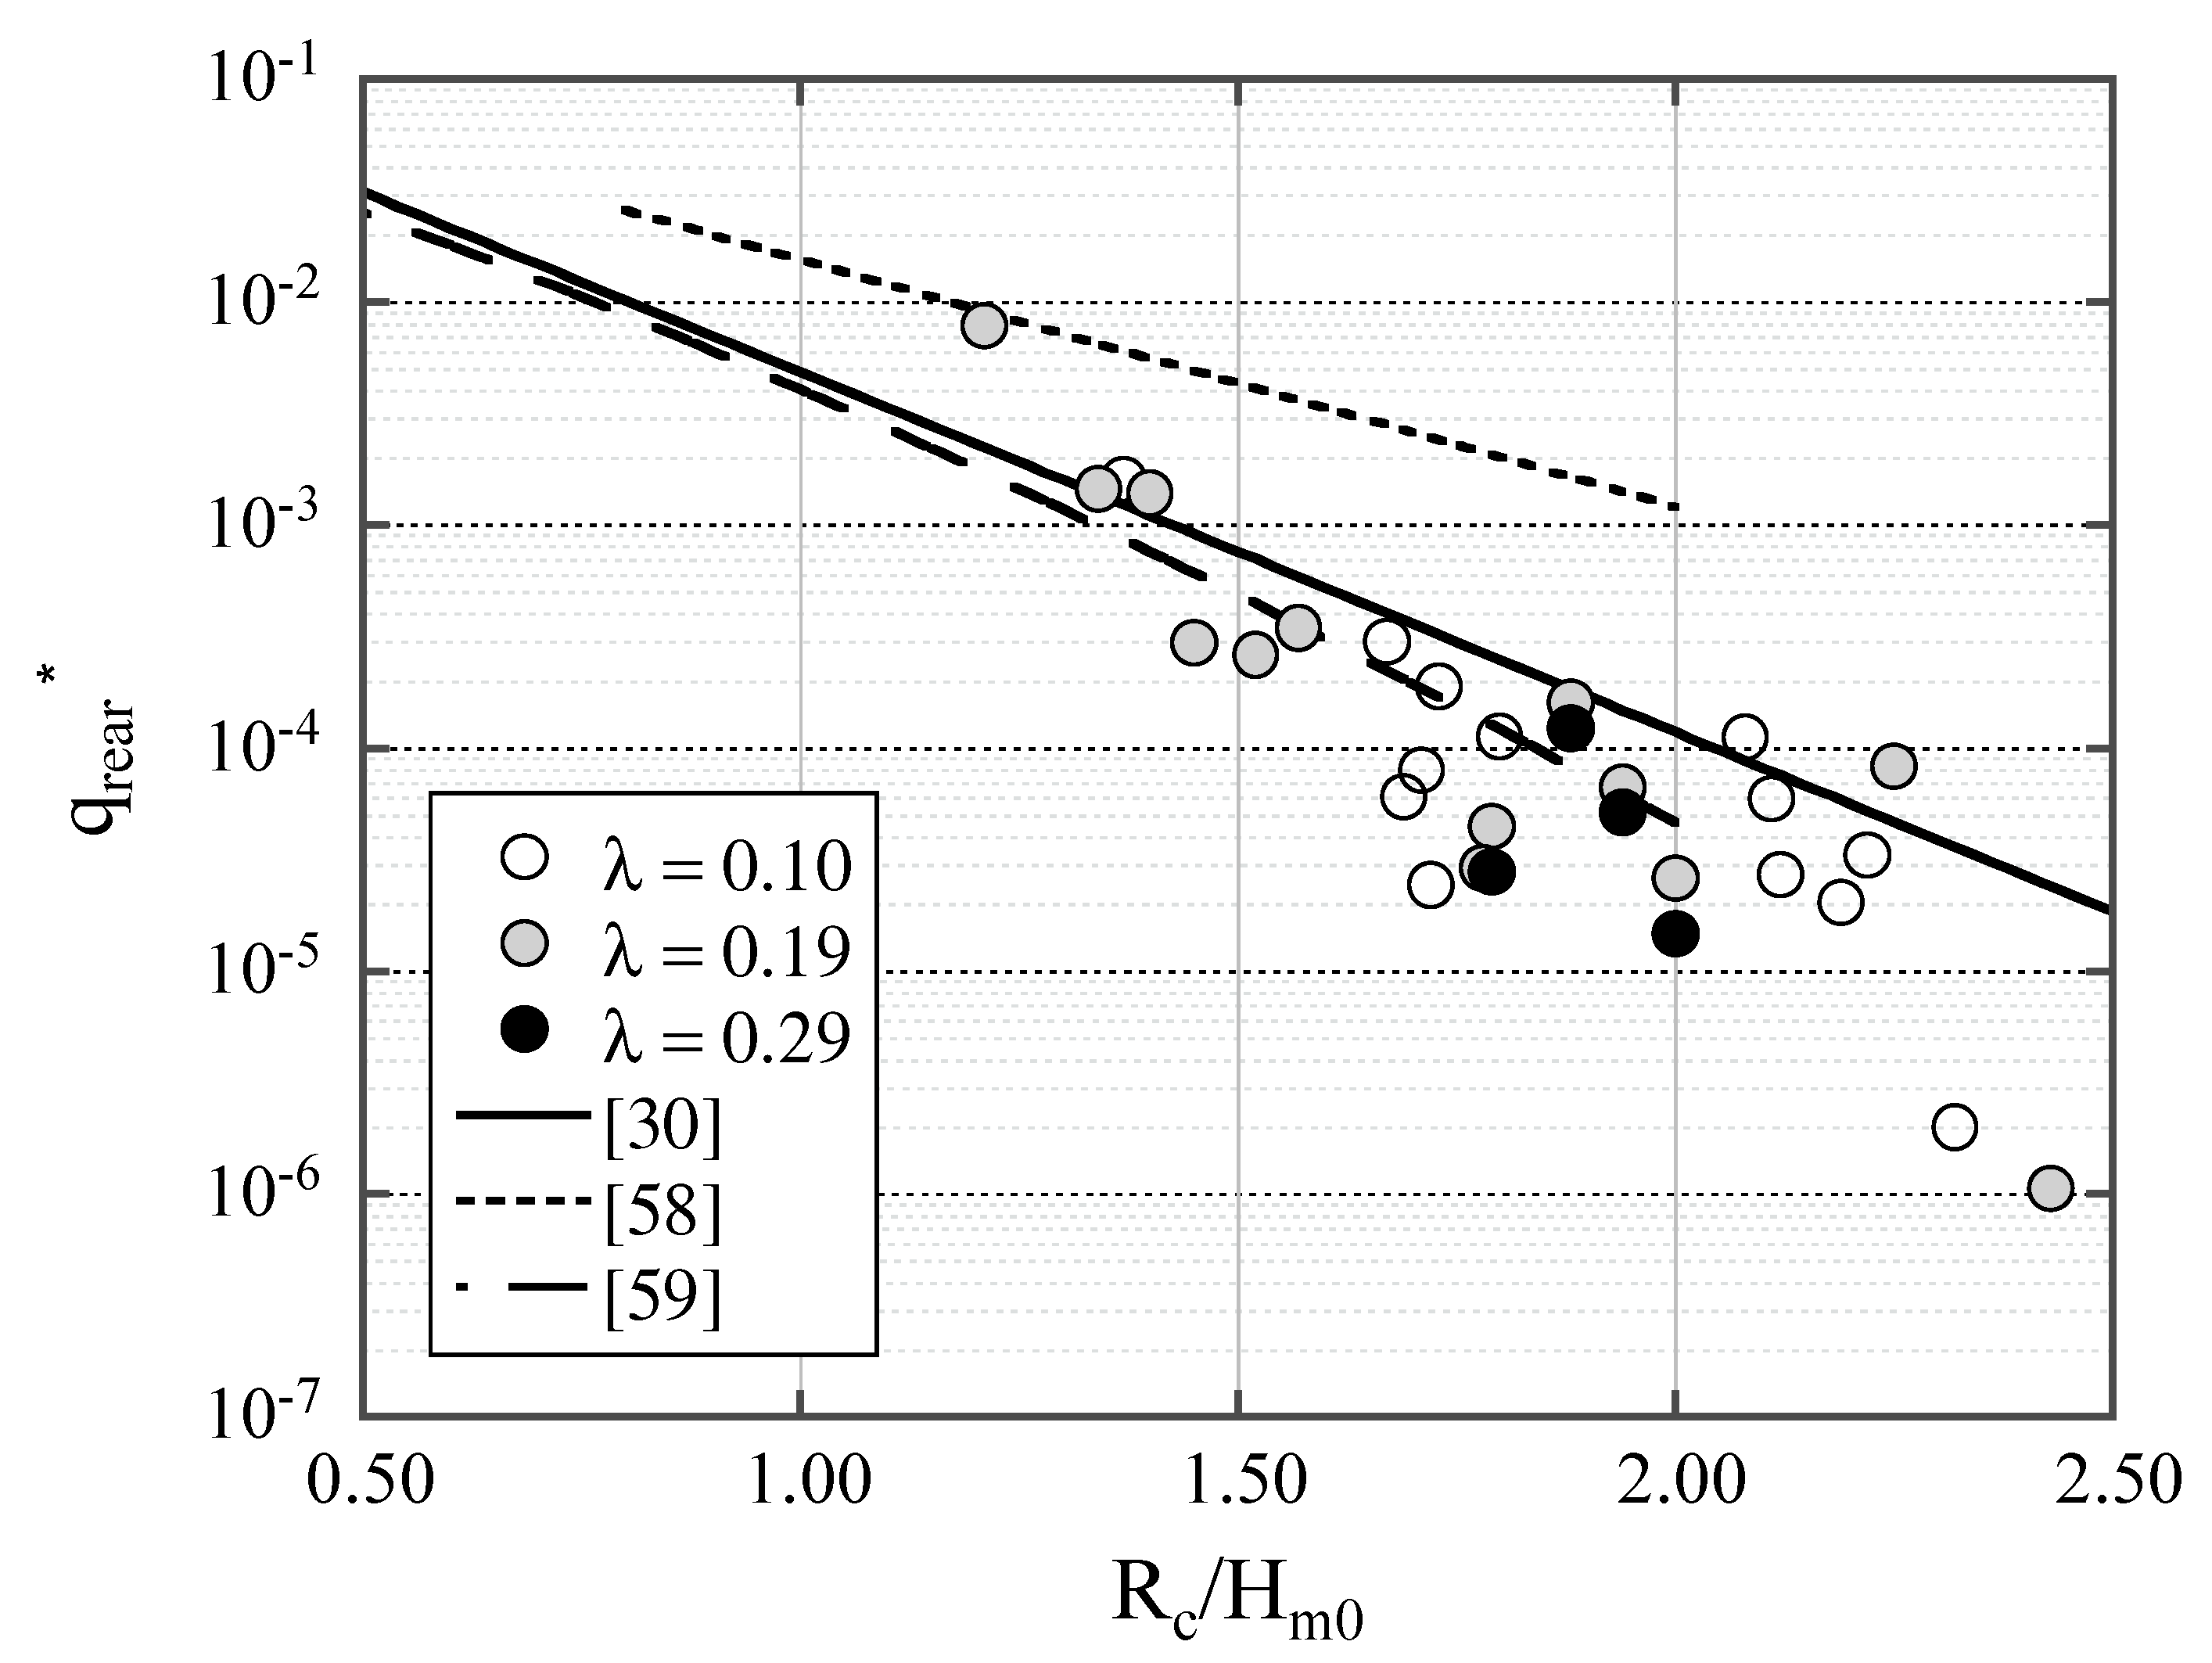
3.2. Average Wave Overtopping Discharge

Wave overtopping flows, as measured during the physical model tests, are herein compared with the main literature prediction methods.
In the EurOtop Manual [30] the main predicting formulae to be adopted for estimating qrear* in steep structures hit by surging or non-breaking waves are resumed. In particular, qrear* is suggested to be calculated as follows:
qrear* = c1⋅exp{−[c2⋅Rc/Hm0⋅(γf⋅γβ⋅γb)−1]c3}
where c1, c2 and c3 are empirical coefficients to be set equal to 0.2, 2.6 and 1.0, respectively, to derive the maximum wave overtopping for non-breaking waves [30]; γf is the permeability and roughness factor; γβ takes into account the oblique wave attack; and γb should be retained to consider the presence of a berm in the structure. Equation (3) is applicable for 0.5 < Rc/Hm0 < 3.5 and 14° < α < 45°. In the present case, no berm has to be considered (γb = 1.0), and only a perpendicular wave attack was simulated (γβ = 1.0). An uncertainty level affects the modeling of the structure roughness. Moreover, γf is hardly to be accurately defined, indeed, due to the relevant differences in the effective roughness between the traditional breakwaters and the herein studied OBREC configuration. As demonstrated by [19], an equivalent roughness reduction on the passage from standard breakwaters to OBRECs is assumed by adopting γf = 0.70.
Victor and Troch [58] provided a new method to estimate qrear in dependence of α and Rc/Hm0 for steep low-crested structures, being in between mildly sloping dikes and vertical walls. If the geometry of the present physical model of OBREC is considered, then the following equation is applicable according to the following [58]:
qrear* = 0.2⋅exp(1.57⋅cotα − 4.88)
Equation (4) is valid for 0.8 < Rc/Hm0 < 2.0 and 34° < α < 90°.
Van der Meer and Bruce [59] modified the approach indicated by [58], to define c1, c2 and c3 in Equation (3). In particular, c1 and c2 were assumed as a function of α. For α ≥ 26°, as in the present case, they can be derived as follows:
c1 = 0.09 − 0.01⋅(2⋅− cotα)2.1
c2 = 1.50 + 0.42⋅(2⋅− cotα)1.5
Moreover, c3 was made equal to 1.3, instead. This method is adoptable for 0.0 < Rc/Hm0 < 2.0 and 20° < α < 90°, and it was included in [30] later.
Figure 9 shows the measured values of qrear* as a function of Rc/Hm0. As visible, qrear* decreases as Rc/Hm0 augments. This demonstrates that, by making Hm0 constant, the larger is Rc, the smaller is the overtopped water volume beyond the structure. A comparison between the observed qrear* and the corresponding predicted values by [30,58,59] is also provided in Figure 9. All the predicting equations overestimate the observed qrear*. This is clearly an effect of the nose, whose presence at the crest of the crown wall is not considered by [30,58,59]. The parapet limited the overtopping flows at the rear side of the OBREC, and, consequently, the measured values of qrear* are smaller than the corresponding computed values. Note that, according to the experimental data, Rc/Hm0 varies between about 1.20 and 2.50. This implies that the relations suggested by [58,59] cannot be indiscriminately applied to the herein experimental dataset. Table 3 reports the values of the most common metrics used to assess the prediction effectiveness: the Nash–Sutcliffe model efficiency parameter NSE, the Mean Absolute Error MAE, the Root Mean Squared Error RMSE and the Normalized Root Mean Squared Error NRMSE. They are defined as follows:
NSE = 1 i = 1 n ( y i x i ) 2 / i = 1 n ( x ¯ x i ) 2
MAE = i = 1 n | y i x i | / n
RMSE = [ i = 1 n ( x i y i ) 2 / n ] 0.5
NRMSE = n · RMSE / i = 1 n ( y i )
In the previous formulae from Equation (7) to Equation (10), n is the total number of observations; xi and yi are the measured and predicted values, respectively, at the data point i; and x ¯ is the average value of the experimental data. The values of NSE of Table 3 are always smaller than 0.50, and this demonstrates that the reliability of the herein considered equations is very poor.
Given the relevant inaccuracy of the standard relations to predict qrear*, the observed overtopping discharges are also compared with some reference formulae derived to take the reducing effect of a storm wall with a nose and of the combination of a storm wall, a nose and a promenade into account. In the first scenario, EurOtop Manual [30] suggested to calculate qrear* as follows:
qrear* = 0.09⋅exp{−[1.50⋅(Rc/Hm0)⋅1/(γv⋅γpar⋅γs0,par)]1.3}
where γv is a storm wall influence factor defined, for hwall/Rc < 1.24, as follows [26]:
γv = exp(−0.56⋅hwall/Rc)
Moreover, γpar considers, instead, the extra-reducing effect related to the presence of the nose on the storm wall. Van Doorslaer et al. [60] defined γpar as a function of γε and γλ. These factors were introduced to describe the influence of ε and λ, respectively, and, for hw/Rc ≥ 0.25 (Table 1), they give γpar as follows:
γpar = 1.80⋅γε⋅γλ
where γε = (1.53 × 10⁻⁴⋅ε2) − (1.63 × 10⁻²⋅ε) +1, for 15° ≤ ε ≤ 50°, and γλ = 0.75 − 0.20⋅λ, for 0.125 ≤ λ ≤ 0.6 (Section 2.2) [60]. In the end, γs0,par aims to account for the wave overtopping increase due to sm−1,0. In this regard, Van Doorslaer et al. [60] suggested to apply the following equation for γs0,par:
γs0,par = 1.33 − 10⋅sm−1,0
When a storm wall equipped with a nose is placed at the end of a promenade, EurOtop Manual [30] provides the following equation to derive qrear*:
qrear* = 0.09⋅exp{−[1.50⋅(Rc/Hm0)⋅1/(1.19⋅γpar⋅γprom)]1.3}
in which the reducing factor, γprom, models the effect due to the promenade. Here, the reservoir is considered as an artificial promenade, and, according to [60], γprom is derived as a function of ΔBrs/Lm−1,0 and of γv, as follows:
γprom = 0.87⋅(1 − 0.47⋅ΔBrs/Lm,0)⋅γv
Equation (16) is valid for 0.04 < ΔBrs/Lm−1,0 < 0.40, 0.17 < hwall/Rc < 0.80 and 0.25 < λ < 0.38. The latter condition restricts the range of the experimental data to be used to test the reliability of Equation (16).
More recently, Iuppa et al. [41] investigated the overtopping behavior of the physical model of OBREC with a nose on the top of the vertical wall. In this case, the nose dimensions were fixed, with λ = 0.10. An empirical relation to predict qrear was suggested:
qrear⋅Tm−1,0/Lm−1,02 = 0.0139⋅exp(−7.17⋅Xrear)
where the OBREC geometrical parameters were grouped into the dimensionless factor Xrear = (Rc/Hm0)⋅(ΔBrs/Br)0.5⋅(ΔRc/dw)0.25. Note that Equation (17) allowed us to predict the observed overtopping discharges in OBREC with good accuracy (NSE = 0.96). However, the nose size was not considered to be an influential parameter.
Figure 10 shows the comparison between measured overtopping discharges and corresponding predictions by applying Equations (11), (15) and (17). Figure 10a shows that the observations are not sufficiently estimated by the relation proposed by [30] for structures with a storm wall and a nose. The curve of Equation (11) mainly underestimates the measurements for all the nose dimensions. In particular, the largest discrepancy is derived for about [(Rc/Hm0)/(γv⋅γpar⋅γs0,par)] < 2.50. The same considerations can be inferred with reference to Equation (15). The latter furnishes overtopping volume estimations with an accuracy not affected by the nose dimensions (Figure 10b). However, the introduction of the reducing factors to consider the effect of the promenade does not allow us to predict qrear* with a satisfying amount of precision. Figure 10c demonstrates, instead, that the results derived by applying the Equation (17) of [41] are quite satisfactorily. In particular, the prediction results to be more reliable for λ = 0.10 than for λ = 0.19 and λ = 0.29. In the large and extra-large nose configurations, the predicting relation slightly overestimates the corresponding observations.
The statistical parameters describing the reliability of Equations (11), (15) and (17) are reported in Table 4. These metrics confirm that Equation (17) is more precise than Equations (11) and (15), being characterized by a smaller value of NRMSE and a larger value of NSE. It is remarkable that the estimating equation provided by [41] for OBREC with a nose of increasing dimensions is affected by less-accurate statistical parameters (NSE = 0.78) than for the nose with only λ = 0.10 (NSE = 0.96).

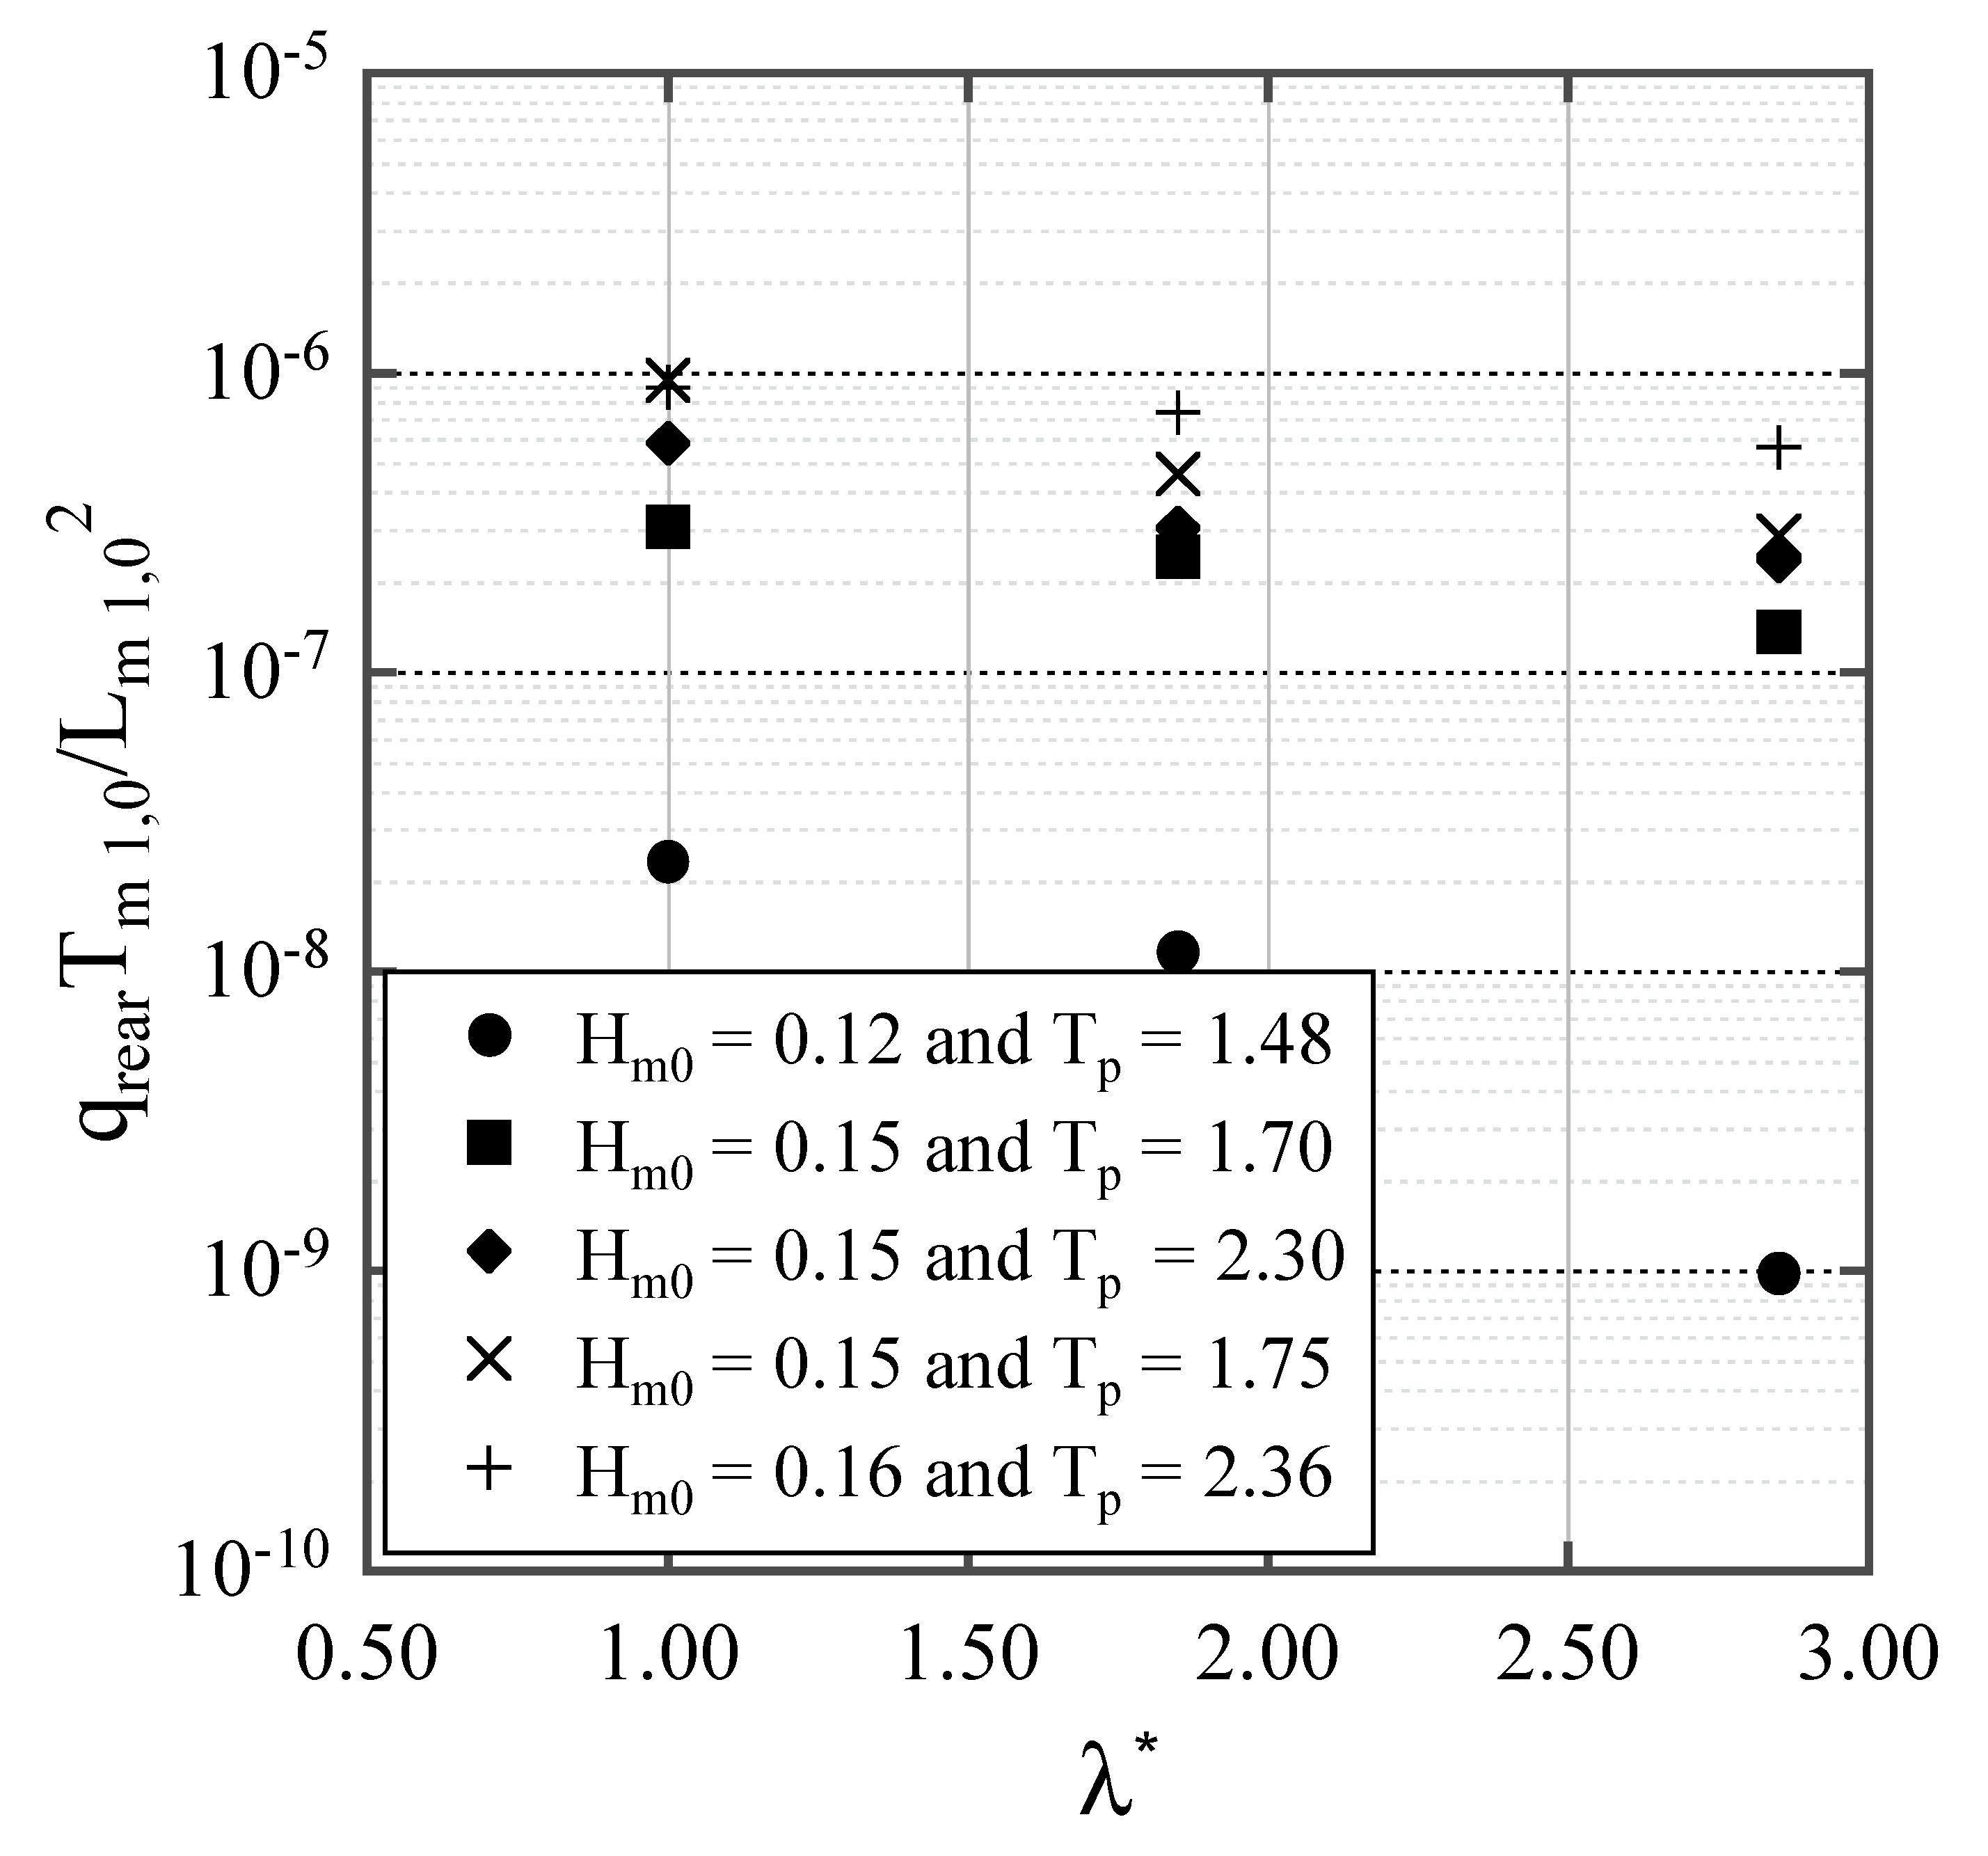
3.3. New Equation to Account for the Increase of the Nose Dimension

As shown in the previous section, the equation suggested by Iuppa et al. [41] is the most reliable for predicting the overtopping discharge in the OBREC equipped with a nose at the top of the crown wall. However, this relation does not include the nose dimensions among the influential parameters and its accuracy when λ increases from 0.10 to 0.29 is smaller than for uniquely λ = 0.10. Conversely, the geometry of the nose was demonstrated to affect the overtopping volume amount relevantly. The increase of λ led to a reduction of qrear. Figure 11 shows that the observed values of qrear⋅Tm−1,0/Lm−1,02 decrease by increasing λ* = λ/λsmall, where λsmall = 0.10 is the nose dimension in the small configuration. The effect of λ* is also represented in Figure 12, where the nondimensional overtopping discharge, q*, before and after SLR
q = [ q rear T m 1 , 0 / L m 1 , 0 2 ] afterSLR [ q rear T m 1 , 0 / L m 1 , 0 2 ] beforeSLR
is plotted against the Iribarren number ξm−1,0 = tan(α)/(Hm−1,0/Lm−1,0)0.5.
Based on the empirical relation of [41] a new equation to calculate qrear by retaining the nose dimensions is provided. The relative error was minimized by a simple regression analysis, and the following equation is herein introduced:
qrear⋅Tm−1,0/Lm−1,02 = 0.0179⋅exp(−7.18⋅Xrear)
Equation (18) is characterized by NSE = 0.86, RMSE = 3.43 × 10⁻⁶ and NRMSE = 0.84. This relation thus gives a more accurate prevision of the overtopping discharge for OBRECs with variable nose dimensions.

4. Conclusions

In the last decades, coastal engineers and researchers have provided their efforts in the investigation of new technologies to harvest blue energies and of new solutions to mitigate coastal hazards due to extreme wave events and sea level rise. It is likely that successful responses to these challenges will involve a path of innovation and not only simple improvements or replacement of existing breakwaters.
In this framework, the present paper describes a set of experiments undertaken on a physical model of an innovative coastal structure, the Overtopping BReakwater for wave Energy Conversion (OBREC). The purpose of this study is to highlight the influence of geometrical shape changes of a nose installed on the top of the vertical crown wall of the OBREC to reduce the impact of the future sea level rise. For the high-water level scenario, the indications provided by EC, corresponding to a sea level rise of 0.9 m by 2100, are herein adopted.
A parametric study was carried out, considering three different geometrical dimensions of the nose and investigating the capability to limit the overtopping discharge at rear side of the structure. The experimental results allowed us mainly to demonstrate and quantify the beneficious effect related to the nose dimension increase. This evidence can be thus used as a preliminary result to support the concept according to which the simple augmentation of the nose dimensions is a very effective and economic viable solution to contain the overtopping phenomenon in existing OBREC structures also under a future scenario with an increase of the sea level. The present recommendation should be, however, combined with the indications of Castellino et al. [61] who showed that the lower part of a recurved nose is affected by the “confined-crest impact” consisting in an instantaneous and high impulsive pressure peak.
The physical observations derived from the present experimental campaign were compared with the corresponding results from standard literature prediction methods. Since the present device was characterized by some peculiar characteristics, being a WEC-integrated breakwater, the application of the main reference equations was cautiously evaluated. Most of these relations failed at the prediction of the overtopping discharge. The unique equation giving an estimation with an acceptable accuracy was suggested by Iuppa et al. [41]. However, the precision statistics of this equation by considering the entire experimental dataset with all the nose dimensions was not satisfying as for the only small nose configuration. For this reason, a new equation derived by the modification of the relation suggested by [41] was herein introduced.
The findings from this work are expected to support in promoting and developing adaptive management strategies for existing coastal defenses and smart approaches in the construction and maintenance of new ones.

Author Contributions

C.G. carried out the conceptualization; P.C. conceived the investigation; S.R. analyzed preliminarily the data; G.C. made the formal analysis; F.C. designed the methodology; P.C. and G.C. wrote the original draft; C.G., F.C. and D.V. performed the writing, review and editing stages. All authors have read and agreed to the published version of the manuscript.

Funding

This research was funded by “A.I.M.—Attrazione e Mobilità Internazionale” project, provided by the Italian Ministry of University and Research within the National Operational Programme for “Research and Innovation” 2014–2020. The experimental campaign discussed here was part of the National Operational Programme for “Research and Competitiveness” 2007–2013 (NOP for R&C) founded project PON04a3_00303 titled “DIMEMO-DIga Marittima per l’Energia del Moto Ondoso” (Maritime Breakwater for Wave Energy Conversion). The present research, moreover, is part of the joint project “Natural Laboratory for Marine Renewable Energies” between Institute of Marine Engineering of the Italian National Research Council (INM-CNR) and the Department of Engineering of the University of Campania “Luigi Vanvitelli”.

Acknowledgments

Authors gratefully acknowledges the Italian Ministry of Education, University and Research (MIUR) for supporting this innovative research. The support of the University of Campania “Luigi Vanvitelli” through the VALERE program (VAnviteLli pEr la RicErca) is gratefully acknowledged. A special thanks is addressed to Claudio Iuppa (University of Catania), Thomas Lykke Andersen (University of Aalborg), Enrico Di Lauro and Vincenzo Ferrante (University of Campania) for actively supporting the OBREC laboratory campaign.

Conflicts of Interest

The authors declare no conflict of interest.

References

  1. Falcão, A.F.D.O. Wave energy utilization: A review of the technologies. Renew. Sust. Energy Rev. 2010, 14, 899–918. [Google Scholar] [CrossRef]
  2. Azzellino, A.; Lanfredi, C.; Contestabile, P.; Ferrante, V.; Vicinanza, D. Strategic environmental assessment to evaluate WEC projects in the perspective of the environmental cost-benefit analysis. In Proceedings of the Twenty-First International Offshore and Polar Engineering Conference, Maui, HI, USA, 19–24 June 2011. [Google Scholar]
  3. Buccino, M.; Dentale, F.; Salerno, D.; Contestabile, P.; Calabrese, M. The use of CFD in the analysis of wave loadings acting on seawave slot-cone generators. Sustainability 2016, 8, 1255. [Google Scholar] [CrossRef] [Green Version]
  4. Contestabile, P.; Vicinanza, D. Coastal Defence Integrating Wave-Energy-Based Desalination: A Case Study in Madagascar. J. Mar. Sci. Eng. 2018, 6, 64. [Google Scholar] [CrossRef] [Green Version]
  5. Di Lauro, E.; Lara, J.L.; Maza, M.; Losada, I.J.; Contestabile, P.; Vicinanza, D. Stability analysis of a non-conventional breakwater for wave energy conversion. Coast. Eng. J. 2019, 145, 36–52. [Google Scholar] [CrossRef]
  6. Vicinanza, D.; Cappietti, L.; Ferrante, V.; Contestabile, P. Estimation of the wave energy in the Italian offshore. J. Coast. Res. 2011, 64, 613–617. [Google Scholar]
  7. Contestabile, P.; Di Lauro, E.; Galli, P.; Corselli, C.; Vicinanza, D. Offshore wind and wave energy assessment around Malè and Magoodhoo Island (Maldives). Sustainability 2017, 9, 613. [Google Scholar] [CrossRef] [Green Version]
  8. Palma, G.; Contestabile, P.; Mizar Formentin, S.; Vicinanza, D.; Zanuttigh, B. Design optimization of a multifunctional wave energy device. In Progress in Renewable Energies Offshore, Proceedings of the 2nd International Conference on Renewable Energies Offshore (RENEW2016), Lisbon, Portugal, 24–26 October 2016; CRC Press: Boca Raton, FL, USA, 2016; p. 235. [Google Scholar]
  9. Aderinto, T.; Li, H. Review on Power Performance and Efficiency of Wave Energy Converters. Energies 2019, 12, 4329. [Google Scholar] [CrossRef] [Green Version]
  10. Vicinanza, D.; Margheritini, L.; Contestabile, P.; Kofoed, J.P.; Frigaard, P. Seawave Slot-cone Generator: An innovative caisson breakwaters for energy production. In Coastal Engineering 2008—Proceedings of the 31st International Conference; World Scientific Publishing: Singapore, 2009; pp. 3694–3705. [Google Scholar]
  11. Stocker, T.F.; Qin, D.; Plattner, G.K.; Tignor, M.; Allen, S.K.; Boschung, J.; Nauels, A.; Xia, Y.; Bex, V.; Midgley, P.M. Climate Change 2013: The Physical Science Basis; Contribution of Working Group I to the Fifth Assessment Report of the Intergovernmental Panel on Climate Change; Cambridge University Press: New York, NY, USA, 2013. [Google Scholar]
  12. Climate Change: How Do We Know? Available online: https://climate.nasa.gov/evidence/ (accessed on 10 January 2020).
  13. Demirbilek, Z. Sea level rise and impacts on engineering practice. Ocean Eng. 2013, 71, 1–2. [Google Scholar] [CrossRef]
  14. Coles, S. An Introduction to Statistical Modelling of Extreme Values; Springer Series in Statistics; Springer: London, UK, 2001; p. 208. [Google Scholar]
  15. Galiatsatou, P.; Prinos, P.; Sanchez-Arcilla, A. Estimation of extremes: Conventional versus Bayesian techniques. J. Hydraul. Res. 2008, 46, 211–223. [Google Scholar] [CrossRef]
  16. Chini, N.; Stansby, P.K. Extreme values of coastal wave overtopping accounting for climate change and sea level rise. Coast. Eng. 2012, 65, 27–37. [Google Scholar] [CrossRef]
  17. Weisse, R.; Bellafiore, D.; Menéndez, M.; Méndez, F.; Nicholls, R.J.; Umgiesser, G.; Willems, P. Changing extreme sea levels along European coasts. Coast. Eng. 2014, 87, 4–14. [Google Scholar] [CrossRef] [Green Version]
  18. Vicinanza, D.; Di Lauro, E.; Contestabile, P.; Gisonni, C.; Lara, J.L.; Losada, I.J. Review of innovative harbor breakwaters for wave-energy conversion. J. Waterw. Port. Coast. 2019, 145, 1–18. [Google Scholar] [CrossRef]
  19. Vicinanza, D.; Contestabile, P.; Nørgaard, J.; Lykke Andersen, T. Innovative rubble mound breakwaters for overtopping wave energy conversion. Coast. Eng. 2014, 88, 154–170. [Google Scholar] [CrossRef]
  20. Patrizi, N.; Pulselli, R.M.; Neri, E.; Niccolucci, V.; Vicinanza, D.; Contestabile, P.; Bastianoni, S. Lifecycle environmental impact assessment of an overtopping wave energy converter embedded in breakwater systems. Front. Energy Res. 2019, 7, 32. [Google Scholar] [CrossRef] [Green Version]
  21. Contestabile, P.; Iuppa, C.; Di Lauro, E.; Cavallaro, L.; Lykke Andersen, T.; Vicinanza, D. Wave loadings acting on innovative rubble mound breakwater for overtopping wave energy conversion. Coast. Eng. 2017, 122, 60–74. [Google Scholar] [CrossRef]
  22. Contestabile, P.; Ferrante, V.; Di Lauro, E.; Vicinanza, D. Full-scale prototype of an overtopping breakwater for wave energy conversion. In Proceedings of the 35th Conference on Coastal Engineering, Antalya, Turkey, 17–20 November 2016; p. 35. [Google Scholar]
  23. Formentin, S.M.; Palma, G.; Contestabile, P.; Vicinanza, D.; Zanuttigh, B. 2DV RANS-VOF numerical modeling of a multi-functional harbour structure. In Proceedings of the 35th Conference on Coastal Engineering, Antalya, Turkey, 17–20 November 2016; p. 35. [Google Scholar]
  24. Palma, G.; Mizar Formentin, S.; Zanuttigh, B.; Contestabile, P.; Vicinanza, D. Numerical Simulations of the Hydraulic Performance of a Breakwater-Integrated Overtopping Wave Energy Converter. J. Mar. Sci. Eng 2019, 7, 38. [Google Scholar] [CrossRef] [Green Version]
  25. Di Lauro, E.; Contestabile, P.; Vicinanza, D. Non-conventional overtopping breakwater for energy conversion. In Advances in Renewable Energies Offshore: Proceedings of the 3rd International Conference on Renewable Energies Offshore (RENEW2018), Lisbon, Portugal, 8–10 October 2018; CRC Press: Boca Raton, FL, USA, 2018. [Google Scholar]
  26. Contestabile, C.; Crispino, G.; Di Lauro, E.; Ferrante, V.; Gisonni, C.; Vicinanza, D. Overtopping breakwater for wave energy conversion: Review of state of art, recent advancements and what lies ahead. Renew. Energy 2020, 147, 705–718. [Google Scholar] [CrossRef]
  27. Molines, J.; Bayon, A.; Gómez-Martín, M.E.; Medina, J.R. Influence of parapets on wave overtopping on mound breakwaters with crown walls. Sustainability 2019, 11, 7109. [Google Scholar] [CrossRef] [Green Version]
  28. Capel, A. Wave run-up and overtopping reduction by block revetments with enhanced roughness. Coast. Eng. 2015, 104, 76–92. [Google Scholar] [CrossRef]
  29. Kisacik, D.; Tarakcioglu, G.O.; Baykal, C. Stilling wave basins for overtopping reduction at an urban vertical seawall—The Kordon seawall at Izmir. Ocean Eng. 2019, 185, 82–99. [Google Scholar] [CrossRef]
  30. Van der Meer, J.W.; Allsop, N.W.H.; Bruce, T.; De Rouck, J.; Kortenhaus, A.; Pullen, T.; Schüttrumpf, H.; Troch, P.; Zanuttigh, B. Eurotop Manual—Manual on Wave Overtopping of Sea Defences and Related Structures: An Overtopping Manual Largely Based on European Research, but for Worldwide Application, 2nd ed.; Environment Agency: Bristol, UK, 2018. [Google Scholar]
  31. U.S. Army Corps of Engineers. Coastal Engineering Manual—Part V; U.S. Army Corps of Engineers: Washington, DC, USA, 2008.
  32. Franco, L. Ancient Mediterranean harbours: A heritage to preserve. Ocean Coast. Manag. 1996, 30, 115–151. [Google Scholar] [CrossRef]
  33. Burcharth, H.F.; Lykke-Andersen, T. Overtopping of rubble mound breakwaters with front reservoir. In Proceedings of the 30th International Conference on Coastal Engineering, San Diego, CA, USA, 3–8 September 2006; pp. 4605–4615. [Google Scholar]
  34. Franco, L.; Gentilomo, M.; Noli, A.; Passacantando, G. Constructional aspects of some large rubble mound breakwaters in northern Africa. In Advances in Coastal Structures and Breakwaters, Proceedings of the Conference on Coastal Structures and Breakwaters, London, England, 1995; Thomas Telford, Ltd.: London, UK, 1996; pp. 158–173. [Google Scholar]
  35. Kortenhaus, A.; Pearson, J.; Bruce, T.; Allsop, N.W.H.; van der Meer, J.W. Influence of parapets and recurves on wave overtopping and wave loading of complex vertical walls. In Proceedings of the Conference on Coastal Structures, Portland, OR, USA, 26–30 August 2003; pp. 369–381. [Google Scholar]
  36. Pearson, J.; Bruce, T.; Allsop, W.; Kortenhaus, A.; van der Meer, J.W. Effectiveness of recurve wave walls in reducing wave overtopping on seawalls and breakwaters. In Proceedings of the 29th International Conference on Coastal Engineering, Lisbon, Portugal, 19–24 September 2004; Smith, J.M., Ed.; World Scientific Publishing: Singapore, 2005; pp. 4404–4416. [Google Scholar]
  37. Van Doorslaer, K.; De Rouck, J. Reduction on wave overtopping on a smooth dike by means of a parapet. In Proceedings of the 32nd International Conference on Coastal Engineering, Shanghai, China, 30 June–5 July 2010; Smith, J.M., Lynett, P., Eds.; Coastal Engineering Research Council: Long Beach, CA, USA, 2010. [Google Scholar]
  38. Van Doorslaer, K.; De Rouck, J. Wave overtopping over sea dikes and impact forces on storm walls. In Proceedings of the 9th International Conference on Coastal and Port Engineering in Developing Countries, Rio de Janeiro, Brazil, 16–21 October 2016. [Google Scholar]
  39. Martinelli, L.; Ruol, P.; Volpato, M.; Favaretto, C.; Castellino, M.; De Girolamo, P.; Franco, L.; Romano, A.; Sammarco, P. Experimental investigation on non-breaking wave forces and overtopping at the recurved parapets of vertical breakwaters. Coast. Eng. 2018, 141, 52–67. [Google Scholar] [CrossRef]
  40. Vicinanza, D.; Nørgaard, J.H.; Contestabile, P.; Andersen, T.L. Wave loadings acting on overtopping breakwater for energy conversion. J. Coast. Res. 2013, 65, 1669–1674. [Google Scholar] [CrossRef]
  41. Iuppa, C.; Contestabile, P.; Cavallaro, L.; Foti, E.; Vicinanza, D. Hydraulic performance of an innovative breakwater for overtopping wave energy conversion. Sustainability 2016, 8, 1226. [Google Scholar] [CrossRef] [Green Version]
  42. Hay, C.C.; Morrow, E.; Kopp, R.E.; Mitrovica, J.X. Probabilistic reanalysis of twentieth-century sea-level rise. Nature 2015, 517, 481–484. [Google Scholar] [CrossRef] [PubMed]
  43. Church, J.A.; White, N.J. Sea-level rise from the late 19th to the early 21st century. Surv. Geophys. 2011, 32, 585–602. [Google Scholar] [CrossRef] [Green Version]
  44. Nerem, R.S.; Chambers, D.; Choe, C.; Mitchum, G.T. Estimating Mean Sea Level Change from the TOPEX and Jason Altimeter Missions. Mar. Geod. 2010, 33, 435–446. [Google Scholar] [CrossRef]
  45. Parris, A.; Bromirski, P.; Burkett, V.; Cayan, D.; Culver, M.; Hall, J.; Horton, R.; Knuuti, K.; Moss, R.; Obeysekera, J.; et al. Global Sea Level Rise Scenarios for the US National Climate Assessment; NOAA Technical Report No. OAR CPO-1; National Oceanic And Atmospheric Administration: Silver Spring, MD, USA, 2012.
  46. Church, J.A.; Clark, P.U. Sea level change. In Climate Change 2013: The Physical Science Basis; Chapter 13; Contribution of Working Group I to the Fifth Assessment Report of the Intergovernmental Panel on Climate Change; Cambridge University Press: New York, NY, USA, 2013. [Google Scholar]
  47. Sweet, W.V.; Kopp, R.E.; Weaver, C.P.; Obeysekera, J.; Horton, R.M.; Thieler, E.R.; Zervas, C. Global and Regional Sea Level Rise Scenarios for the United States; NOAA Technical Report No. NOS CO-OPS 083; NOAA/NOS Center for Operational Oceanographic Products and Services: Silver Spring, MD, USA, 2017.
  48. Hinkel, J.; Jaeger, C.; Nicholls, R.J.; Lowe, J.; Renn, O.; Peijun, S. Sea-level rise scenarios and coastal risk management. Nat. Clim. Change 2015, 5, 188–190. [Google Scholar] [CrossRef]
  49. Church, J.A.; Clark, P.U.; Cazenave, A.; Gregory, J.M.; Jevrejeva, S.; Levermann, A.; Merrifield, M.A.; Milne, G.A.; Nerem, R.S.; Nunn, P.D.; et al. Sea-level rise by 2100. Science 2013, 342, 1445. [Google Scholar] [CrossRef] [Green Version]
  50. Hauer, M.E.; Evans, J.M.; Mishra, D.R. Millions projected to be at risk from sea-level rise in the continental United States. Nat. Clim. Change 2016, 6, 691–695. [Google Scholar] [CrossRef]
  51. Sierra, J.P. Economic impact of overtopping and adaptation measures in Catalan ports due to sea level rise. Water 2019, 11, 1440. [Google Scholar] [CrossRef] [Green Version]
  52. Christensen, O.B.; Yang, S.; Boberg, F.; Fox Maule, C.; Thejll, P.; Olesen, M.; Drews, M.; Danielsen Sørup, H.J.; Christensen, J.H. Scalability of regional climate change in Europe for high-end scenarios. Clim. Res. 2015, 64, 25–38. [Google Scholar] [CrossRef] [Green Version]
  53. Jevrejeva, S.; Jackson, L.P.; Riva, R.E.; Grinsted, A.; Moore, J.C. Coastal sea level rise with warming above 2 C. Proc. Natl. Acad. Sci. USA 2016, 113, 13342–13347. [Google Scholar] [CrossRef] [PubMed] [Green Version]
  54. Science for Environment Policy. Available online: https://ec.europa.eu/environment/integration/research/newsalert/pdf/rapid_significant_sea_level_rise_expected_two_degree_plus_global_warming_486na1_en.pdf (accessed on 10 January 2020).
  55. Frigaard, P.; Andersen, T.L. Technical Background Material for the Wave Generation Software Awasys 5; DCE Technical Report No. 64; Aalborg University: Aalborg, Denmark, 2010. [Google Scholar]
  56. Andersen, T.L.; Clavero, M.; Frigaard, P.; Losada, M.; Puyol, J. A new active absorption system and its performance to linear and non-linear waves. Coast. Eng. 2016, 114, 47–60. [Google Scholar] [CrossRef]
  57. Hasselmann, K.; Barnett, T.P.; Bouws, E.; Carlson, H.; Cartwright, D.E.; Enke, K.; Ewing, J.A.; Gienapp, H.; Hasselmann, D.E.; Kruseman, P.; et al. Measurements of Wind-Wave Growth and Swell Decay during the Joint North Sea Wave Project (JONSWAP); Hydraulic Engineering Report No. 12; Deutches Hydrographisches Institut: Hamburg, Germany, 1973; p. 95.
  58. Victor, L.; Troch, P. Wave overtopping at smooth impermeable steep slopes with low crest freeboards. J. Waterw. Port. Coast. Ocean Eng. 2012, 138, 372–385. [Google Scholar] [CrossRef]
  59. Van der Meer, J.W.; Bruce, T. New physical insights and design formulas on wave overtopping at sloping and vertical structures. J. Waterw. Port. Coast. Ocean Eng. 2013, 140, 04014025. [Google Scholar] [CrossRef] [Green Version]
  60. Van Doorslaer, K.; De Rouck, J.; Audenaert, S.; Duquet, V. Crest modifications to reduce wave overtopping of non-breaking waves over a smooth dike slope. Coast. Eng. 2015, 101, 69–88. [Google Scholar] [CrossRef]
  61. Castellino, M.; Sammarco, P.; Romano, A.; Martinelli, L.; Ruol, P.; Franco, L.; De Girolamo, P. Large impulsive forces on recurved parapets under non-breaking waves. A numerical study. Coast. Eng. 2018, 136, 1–15. [Google Scholar] [CrossRef]
Figure 1. Conceptual design and key components of the Overtopping BReakwater for wave Energy Conversion (OBREC) (wave flow direction from left to right).
Applsci 10 02227 g001
Figure 2. Standard defense structures to reduce the wave overtopping: (a) vertical seawall; (b) sloping ramp seawall; (c) seaward curved wall; (d) vertical seawall equipped with a reservoir and a landward sloping ramp.
Applsci 10 02227 g002
Figure 3. Layout of the 2D wave flume at the Aalborg University (wave flow direction from right to left).
Applsci 10 02227 g003
Figure 4. Lateral (a) and frontal (b) view of the two configurations tested in the wave flume.
Applsci 10 02227 g004
Figure 5. Physical model cross section of OBREC and definition of the main geometrical parameters.
Applsci 10 02227 g005
Figure 6. (a) Sketch of the wave-by-wave system used for the flow discharge measurement; details of (b) the ramp on the top of the crown wall; (c) the accumulation box.
Applsci 10 02227 g006
Figure 7. Photos showing the nose in (a) small configuration, (b) large configuration and (c) extra-large configuration.
Applsci 10 02227 g007
Figure 8. Overtopping discharge measurements qrear* against Rc/Hm0 for: (a) Hm0 = 0.08 and Tp = 1.46; (b) Hm0 = 0.10 and Tp = 2.33; (c) Hm0 = 0.11 and Tp = 1.71; (d) Hm0 = 0.11 and Tp = 2.44.
Applsci 10 02227 g008
Figure 9. Measured and predicted dimensionless average overtopping discharge against the relative free-board of the crown wall.
Applsci 10 02227 g009
Figure 10. Comparison between measured overtopping discharges and corresponding predicted values derived from (a) [30] for structures protected by a storm wall with a nose; (b) [60] for structures equipped with a storm wall combined with a nose and a promenade; (c) [41] for OBREC with a nose on the top of the vertical wall.
Applsci 10 02227 g010
Figure 11. Measured overtopping discharge against λ*.
Applsci 10 02227 g011
Figure 12. Relative overtopping discharge, q*, against ξm−1,0.
Applsci 10 02227 g012
Table 1. Main geometrical characteristics of the physical model.
Rc (m)dw (m)Rr (m)ΔBrs (m)hres (m)hw (m)
min0.1470.1920.0450.3000.3000.197
max0.2270.1920.1250.3000.3000.197
Table 2. Main wave experimental parameters.
Hm0 (m)h (m)h’ (m)r (m)Tp (s)Tm−1,0 (s)Lm−1,0 (m)sm−1,0 (-)
Min0.080.270.301.111.461.403.050.014
Max0.120.270.301.112.562.197.470.029
Table 3. Statistics of the accuracy of [30,58,59] in the prediction of qrear*.
Equation (3) [30]Equation (4) [58]Equations (3), (5) and (6) [59]
NSE0.46−1.810.36
MAE3.35 × 10−41.98 × 10−33.13 × 10−4
RMSE1.04 × 10−32.38 × 10−31.13 × 10−3
NRMSE2.610.974.51
Table 4. Statistics of the accuracy of [30,41,60] in the prediction of the overtopping discharge.
Equation (11) [30]
Storm Wall–Nose
Equation (15) [60]
Storm Wall–Nose–Promenade
Equation (17) [41]
OBREC with Storm Wall–Nose
NSE0.11−0.020.78
MAE3.84 × 10−44.43 × 10−41.77 × 10−6
RMSE1.34 × 10−31.43 × 10−33.80 × 10−6
NRMSE12.7235.871.19

