Article

Material Flow Behavior on Weld Pool Surface in Plasma Arc Welding Process Considering Dominant Driving Forces

1
Science-Technology and International Cooperation Department, Sao Do University, Hai Duong 03000, Vietnam
2
Research and Development Department, Murata Welding Laboratory, Osaka 5320012, Japan
3
Welding Department, Hanoi University of Science and Technology, Hanoi 100000, Vietnam
4
Faculty of Mechanical Engineering, Sao Do University, Hai Duong 03000, Vietnam
5
Faculty of Mechanical Engineering-Mechatronics, Phenikaa University, Hanoi 100000, Vietnam
6
Faculty of Mechanical Engineering, Hanoi University of Industry, Hanoi 100000, Vietnam
7
School of Mechanical Engineering, Viet Nam Maritime University, Hai Phong 04000, Vietnam
8
Faculty of Mechanical Engineering, Ho Chi Minh City University of Technology, Vietnam National University Ho Chi Minh City, Ho Chi Minh 700000, Vietnam
*
Author to whom correspondence should be addressed.
Authors contributed equally to this work.
Appl. Sci. 2020, 10(10), 3569; https://doi.org/10.3390/app10103569
Submission received: 7 April 2020 / Revised: 12 May 2020 / Accepted: 19 May 2020 / Published: 21 May 2020
(This article belongs to the Section Mechanical Engineering)

Abstract

:
In this study, the effect of oxygen in the shielding gas on the material flow behavior of the weld pool surface was discussed to clarify the dominant driving weld pool force in keyhole plasma arc welding (KPAW). To address this issue, the convection flow on the top surface of weld pool was observed using a high-speed video camera. The temperature distribution on the surface along keyhole wall was measured using the two-color pyrometry method to confirm the Marangoni force activity on the weld pool. The results show that the inclination angle of the keyhole wall (keyhole shape) increased especially near the top surface due to the decrease in the surface tension of weld pool through surface oxidation when a shielding gas of Ar + 0.5% O2 was used. Due to the change in the keyhole shape, the upward and backward shear force compositions created a large inclination angle at the top surface of the keyhole. From the temperature measurement results, the Marangoni force was found to alter the direction when 0.5% O2 was mixed with the shielding gas. The shear force was found to be the strongest force among the four driving forces. The buoyant force and Lorentz force were very weak. The Marangoni force was stronger than the Lorentz force but was weaker than shear force. The interaction of shear force and Marangoni force controlled the behavior and speed of material flow on the weld pool surface. A strong upward and backward flow was observed in the case of mixture shielding gas, whereas a weak upward flow was observed for pure Ar. The heat transportation due to the weld pool convection significantly changed when only a small amount of oxygen was admixed in the shielding gas. The results can be applied to control the penetration ratio in KPAW.

Graphical Abstract

1. Introduction

Plasma arc welding (PAW) is one of the arc welding processes that produces deep penetration and low distortion compared with conventional gas tungsten arc welding [1,2]. In comparison to laser beam welding (LBW) and electron beam welding (EBW) processes, PAW equipment is cheaper and joint preparation is easier, even though its energy is less dense [3]. Consequently, PAW has been widely applied in industry fields such as aerospace [4], automotive [5], and rail transport [6]. Similar to LBW and EBW, PAW can be operated in keyhole mode (called keyhole plasma arc welding (KPAW)).
In KPAW, the material flow around the keyhole is transported backward through both sides of the keyhole, producing a weld pool. The void behind the keyhole must be filled with the molten flow to maintain welding stability. The two necessary conditions for welding stability include: the molten flow on both sides must bridge the gap formed at the rear part by the passage of the keyhole and the molten flow must be supported by the surface tension acting on the back surface of molten pool. To improve the welding stability, the keyhole formation mechanism must be studied considering the material flow behavior of the weld pool. To understand and improve this behavior, mechanisms involving transportation of the convection flow in the weld pool must be studied in further detail. The behavior indicated above is a result of the interaction of forces acting on the surface and inside the KPAW weld pool. As described in a review paper, the four principal forces driving the welding convection flow of welding arc processes include: (i) drag force (shear force), which is created by the plasma flow acting on the liquid surface through the keyhole and plasma flow acting on the weld pool surface; (ii) buoyance force, which is caused by the temperature difference within the weld pool; (iii) Lorentz force, which is generated by the self-magnetic field of the welding current within the weld pool; and (iv) Marangoni force, which is formed by the temperature gradient on the surface of the weld pool and on the surface along the keyhole wall. These forces are interrelated. They are principally controlled by welding process parameters such as welding current, welding voltage, shielding gas, welding speed, and base metal [7].
Recently, to increase the understanding and the knowledge about this process, many experiments were conducted. To improve the quality of welding joints, Zhang et al. observed the influence of welding speed and welding current on the change in the keyhole diameter and the weld pool surface using an insulated gate bipolar transistor (IGBT) power module [8,9,10]. Using this module, welding current was controlled in pulse waveform to decrease the brightness of the main arc. When the brightness of the main arc was weak, the keyhole and the weld pool surface were clearly visualized using a high-speed video camera (HSVC).
Wu et al. achieved good quality weld joints through controlling keyhole stability [11,12,13,14] by developing a welding current control unit for KPAW process. During the welding process, the keyhole and the weld pool surface were captured in an image and the temperature at the bottom side of the base metal was measured. The main results showed the relationship of welding current and keyhole geometry parameters.
To accurately control the position of the welding torch when welding by robot, Yamane et al. investigated and developed algorithms for adapting the control of the welding robot through processing the weld pool images to track the weld line based on the boundary between the base metal and the weld pool [15,16,17]. During welding process, however, clearly distinguishing the boundary was difficult due to the high brightness of the main arc. To correctly achieve control, a pulsed current wave form was used to cut off the main arc for a very short time.
Nguyen et al. mainly considered the flow velocity distribution inside the weld pool using experiments [18]. However, only the flow velocity inside the weld pool and on the weld pool surface under a specific welding condition was discussed. In another paper, the influence of shielding gas flow rate was discussed in detail. The results showed that with varying shielding gas flow rate, the convection inside the weld pool changes, causing welding defects such as undercut [19].
Xu et al. calculated the material flows inside the weld pool with variable polarity plasma arc (VPPA) welding for aluminum using both experimental and numerical simulation approaches [20,21]. The results indicated that, in this case, the velocity inside weld pool is much lower than with steel and the weld pool length is very short in comparison to steel. In recent works, a novel variant of the KPAW process was developed for welding aluminum [22,23]. The results showed that using a hybrid welding process between VPPA welding and metal inert gas (MIG) welding can reduce the porosity, which is the most common issue in welding aluminum.
Even though many publications are related to this welding process, the weld pool formation mechanism and the behavior of material flow in relation to the main driving forces are not fully understood. To provide clarification, we focused on determining the influence of Marangoni and shear forces on the weld pool formation through changing the shielding gas composition. The weld pool convection was investigated by observing the movement of slight zirconia particles on the weld pool surface with an HSVC. The temperature distribution on the surface along the keyhole wall was measured to evaluate the Marangoni force acting on the weld pool.

2. Material and Experimental Methods

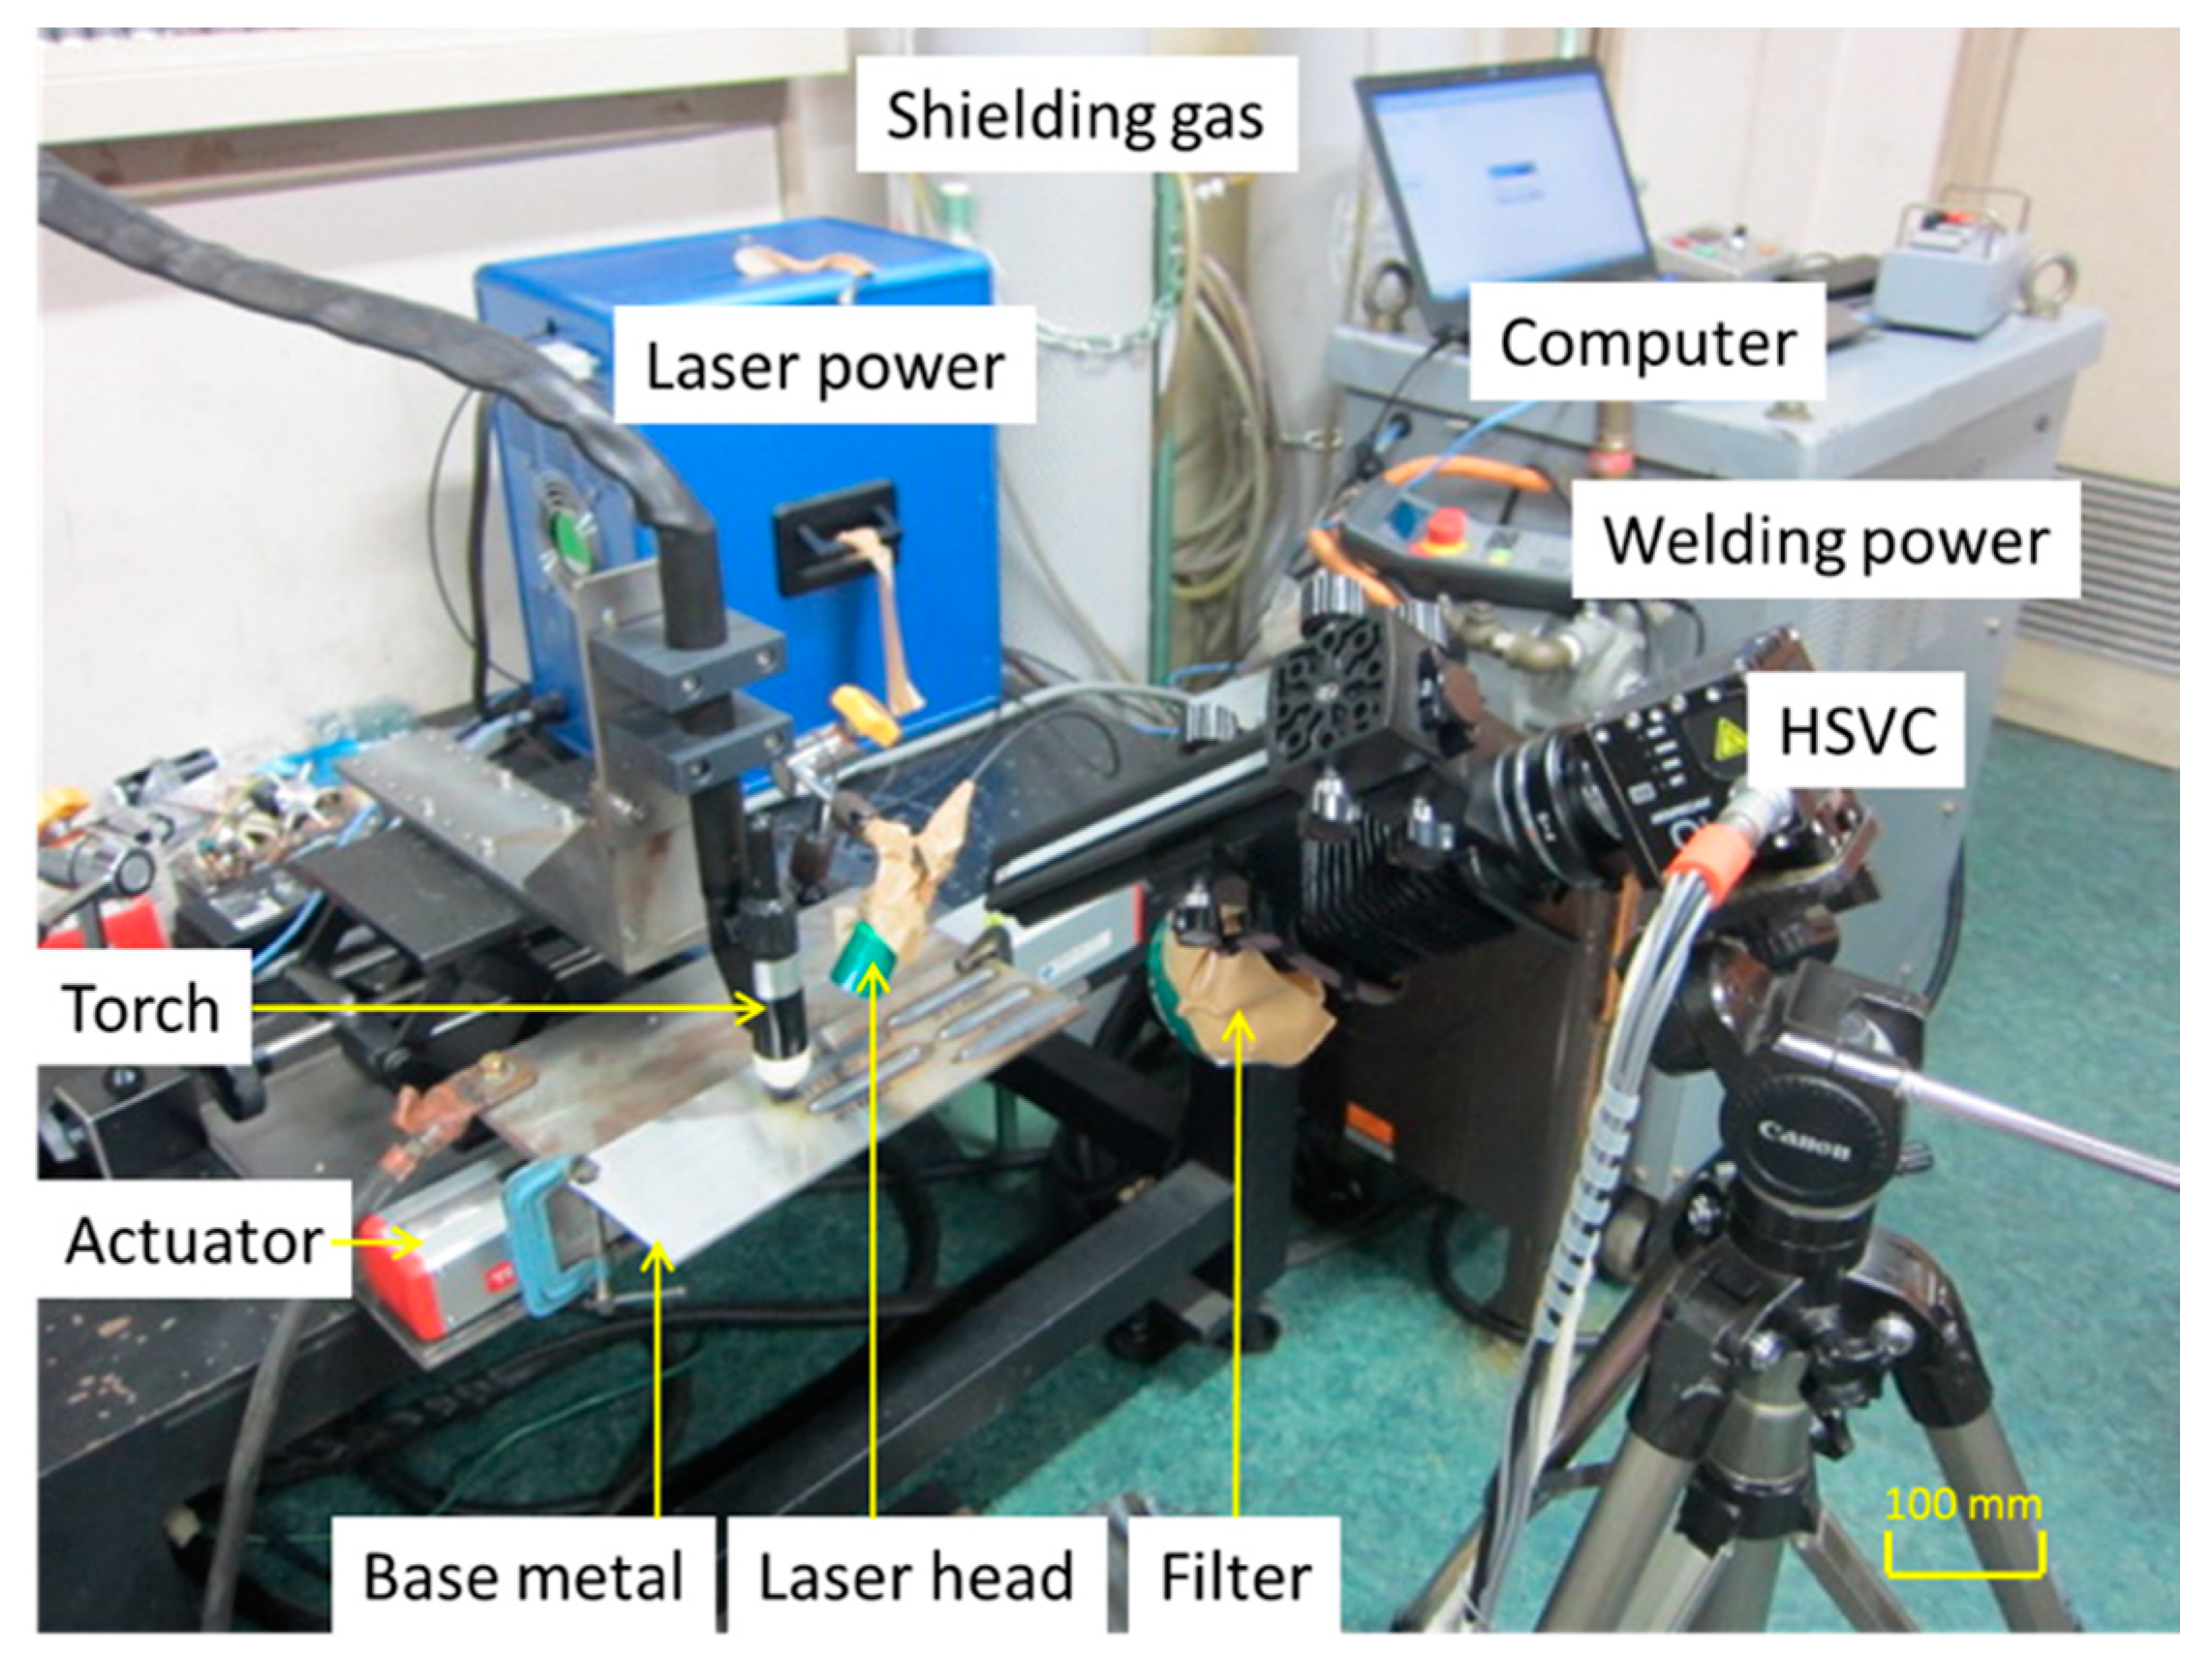
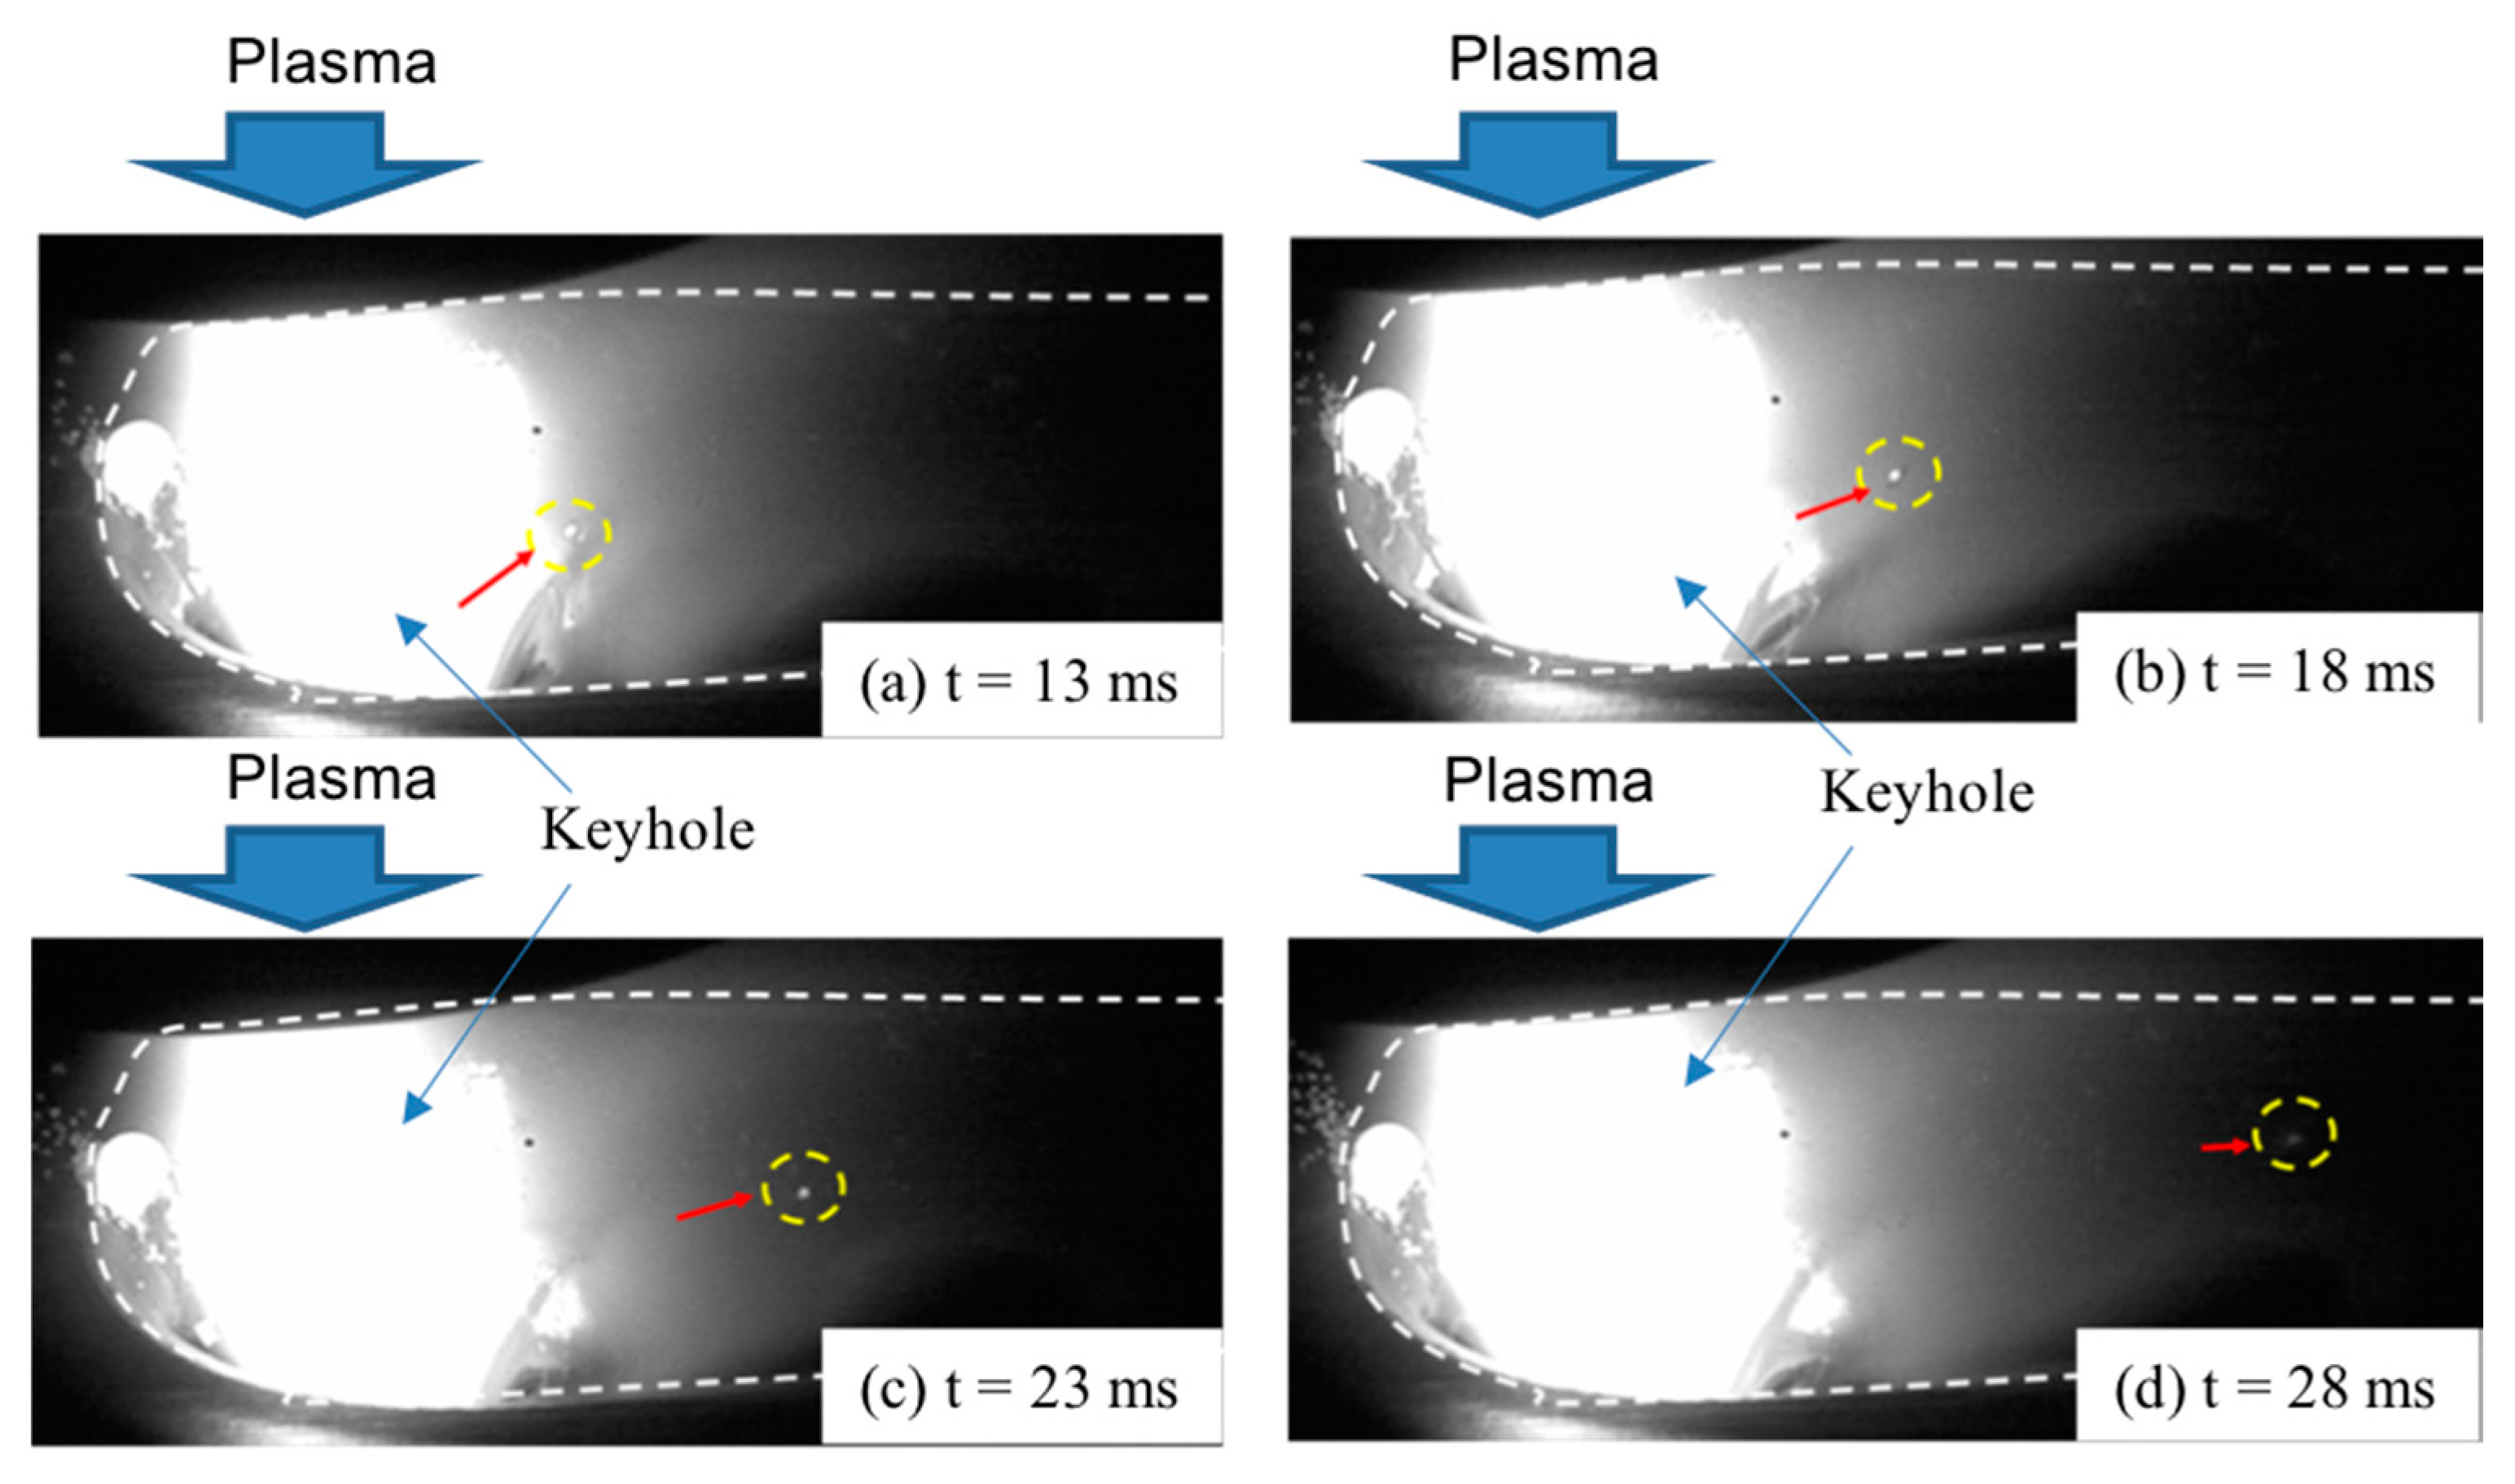
2.1. Measurement of Material Flow on Weld Pool Surface

The experimental setup is portrayed in Figure 1. This experimental system consisted of a welding torch, a welding power source (NW-300ASR, Nippon Steel Welding & Engineering Co., Ltd., Tokyo, Japan), base metal, shielding gas, plasma gas, an HSVC (Memrecam Q1v-V-209-M8, Nac Co., Ltd., Osaka, Japan), an actuator (THK E56-06-0300H-TS, THK Co., Ltd., Tokyo, Japan), a band pass filter, and a diode laser power (CNDC24B7, Japan Servo Co., Ltd., Osaka Japan). The base metal was SUS 304 stainless steel in 300 × 100 × 4 mm (length × width × height) sheets. Its chemical composition is presented in Table 1. Two kinds of the shielding gas were applied: pure Ar and Ar + 0.5% O2. Pure Ar was employed for plasma gas in all experiments. The HSVC, connected to the computer, captured videos at 1000 frame per second (fps). The welding speed of 3 mm s−1 was controlled by an actuator. A filter with wavelength of 940 nm was attached in front of the HSVC. The distance from the filter to the center point of the keyhole was 300 mm. A high-power diode laser with power of 30 W and wavelength of 940 nm was employed. The purpose of the diode laser was to overcome the brightness of the arc plasma. Using both the band-pass filter and the laser power, the brightness of the main arc was considerably decreased. Hence, the weld pool surface and the motion of zirconia particles were clearly observed during welding. The magnification of the weld pool images was controlled by a lens (Micro-Nikon 105 mm f/2.8, Nikon Co., Ltd., Osaka, Japan). A tungsten electrode (2% thorium) with a 3.2 mm diameter was used. The full tip angle of the electrode was 60°, the nozzle diameter for plasma gas was 2.4 mm, and the nozzle diameter for the shielding gas was 12 mm. Other welding conditions are listed in Table 2.
To detect the convection flow on weld pool surfaces, we used 0.3 mm diameter zirconia particles. To put zirconia particles in holes on the base metal, in each of the experiments, we drilled six 2-mm-deep and 1-mm-diameter holes in two lines (three holes per line; Figure 2). Afterward, the holes were cleaned using ethanol and acetone and were then dried in the air. After drying, one zirconia particle was placed in each hole. Finally, the base metal was fixed and welded under the stated welding conditions. Afterward, a computer running Dipp-motion software (Detech Co., Ltd., Osaka, Japan) was used to calculate the velocity of the molten flow on the weld pool surface. To determine the velocity of fluid flow, images with resolution of 640 × 480 pixels were set up for the HSVC to capture real images of 24 × 23 mm. After, based on the HSVC resolution and the dimensions of the real images, the transferred distance of particles was converted from pixels of the HSVC to the real dimensions of the weld pool for each time step. Then, the velocity was determined.

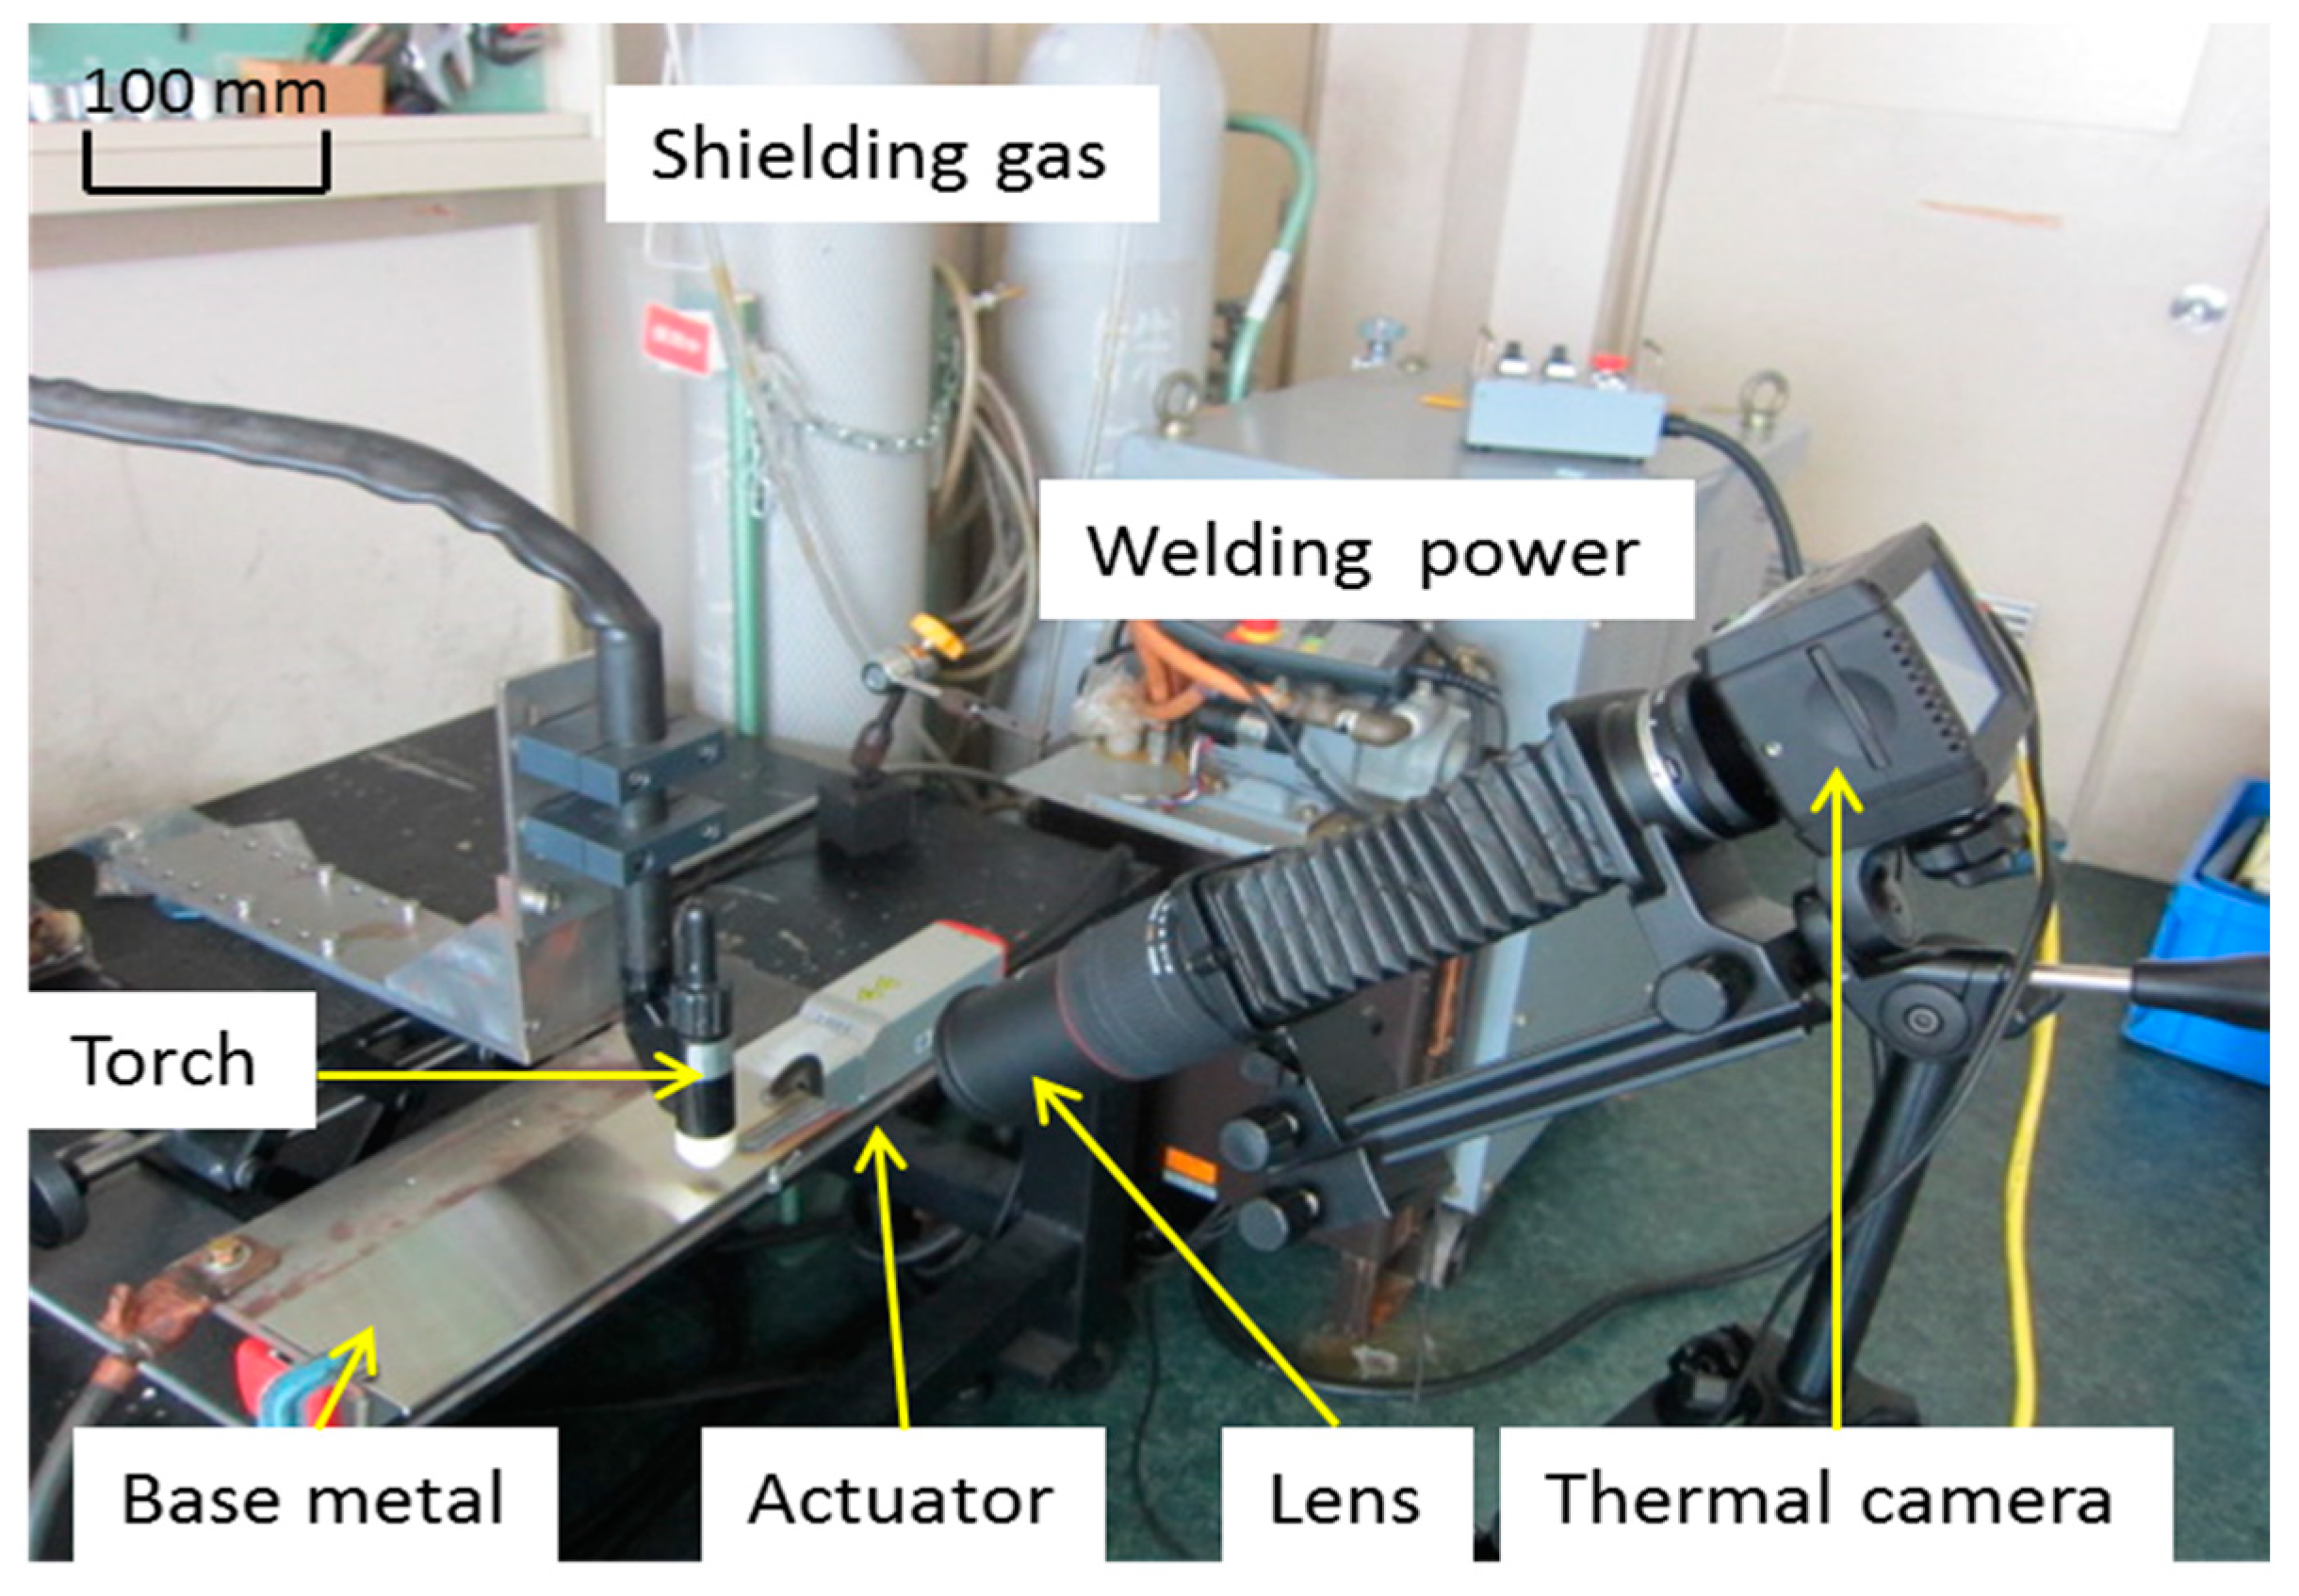
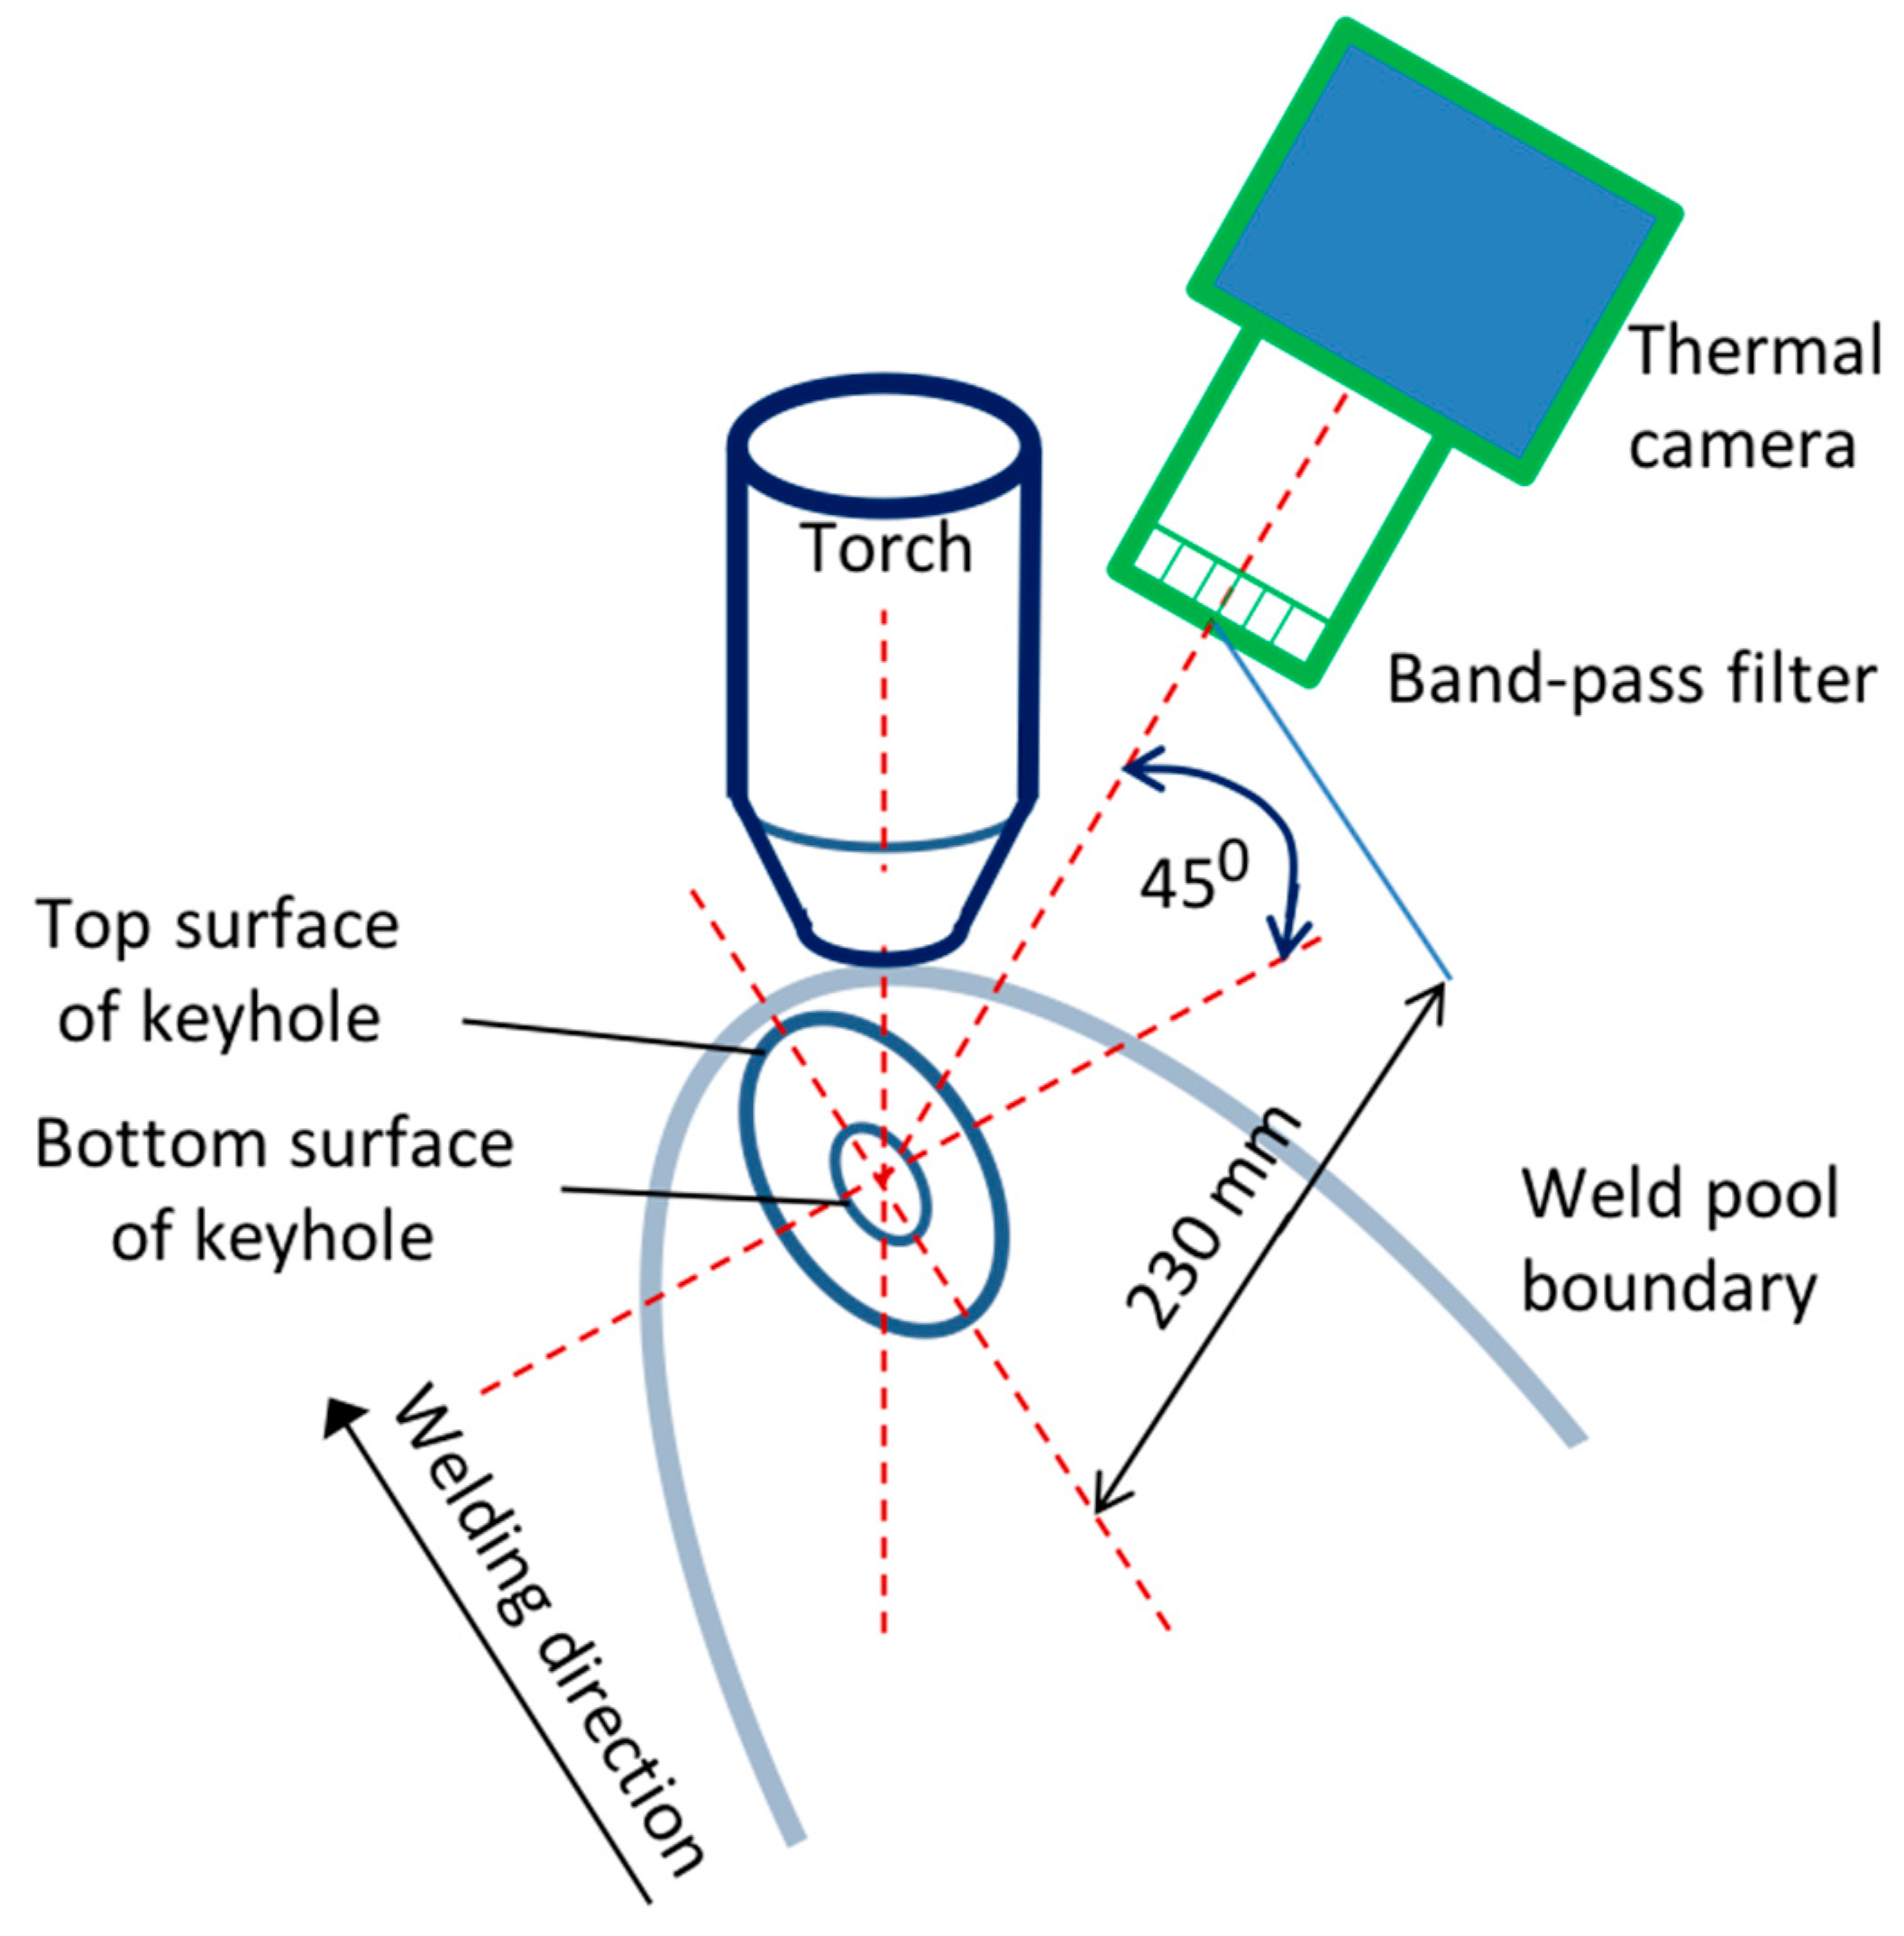
2.2. Temperature Measurement on the Surface along the Keyhole Wall

The keyhole surface was taken by a high temperature measurement system including a thermal camera and Thermera-HS software (Phantom Co., Ltd., Tokyo, Japan). In this experiment, the keyhole image was captured from the topside perpendicular to the welding direction. A schematic illustration of the longitudinal section of the keyhole and the KPAW weld pool is provided in Figure 3. The experimental setup of temperature distribution measurement on the surface inside the keyhole is depicted in Figure 4. Figure 5 provides a schematic illustration of temperature measurement on the surface along the keyhole wall. Here, the keyhole wall is limited from the top and the bottom surfaces with the diameter on the top surface being larger than on the bottom surface. We used a thermal camera (Miroex, Phantom Co., Ltd., Tokyo, Japan) including three red (R), green (G), and blue (B) color sensors to take the keyhole surface images, which was set up at a rate of 2000 fps. We set the distance from the camera lens to the center line of keyhole to 230 mm and the tilt angle between the optical axis of camera and the surface plane of base metal was set to 45°. At this inclined camera angle, the whole keyhole wall including the top and the bottom surfaces could be captured simultaneously, as shown in Figure 3. A lens (sigma DG28-300, Nikkon Co., Ltd., Osaka, Japan) was used to adjust the magnification of keyhole images. Other welding conditions were same as the convection flow observation described in Section 2.1. During the welding process, excessive arc brightness can impair the camera, so the images were immediately taken after the main arc was switched off from a welding current of 120 A. The keyhole wall image was captured within 2 ms after the cutting main arc. The main arc and the pilot arc completely disappeared within 1.0 ms, which corresponds to two frames, because the current sharply decreased to zero without a ramp down profile. The measured temperature was slightly lower than that at full current. In addition, it was demonstrated in a previous paper that the drop in temperature is negligible for times less than 2 ms after the arc disappears [24]. Afterward, the temperature was evaluated using the two-color pyrometry method.

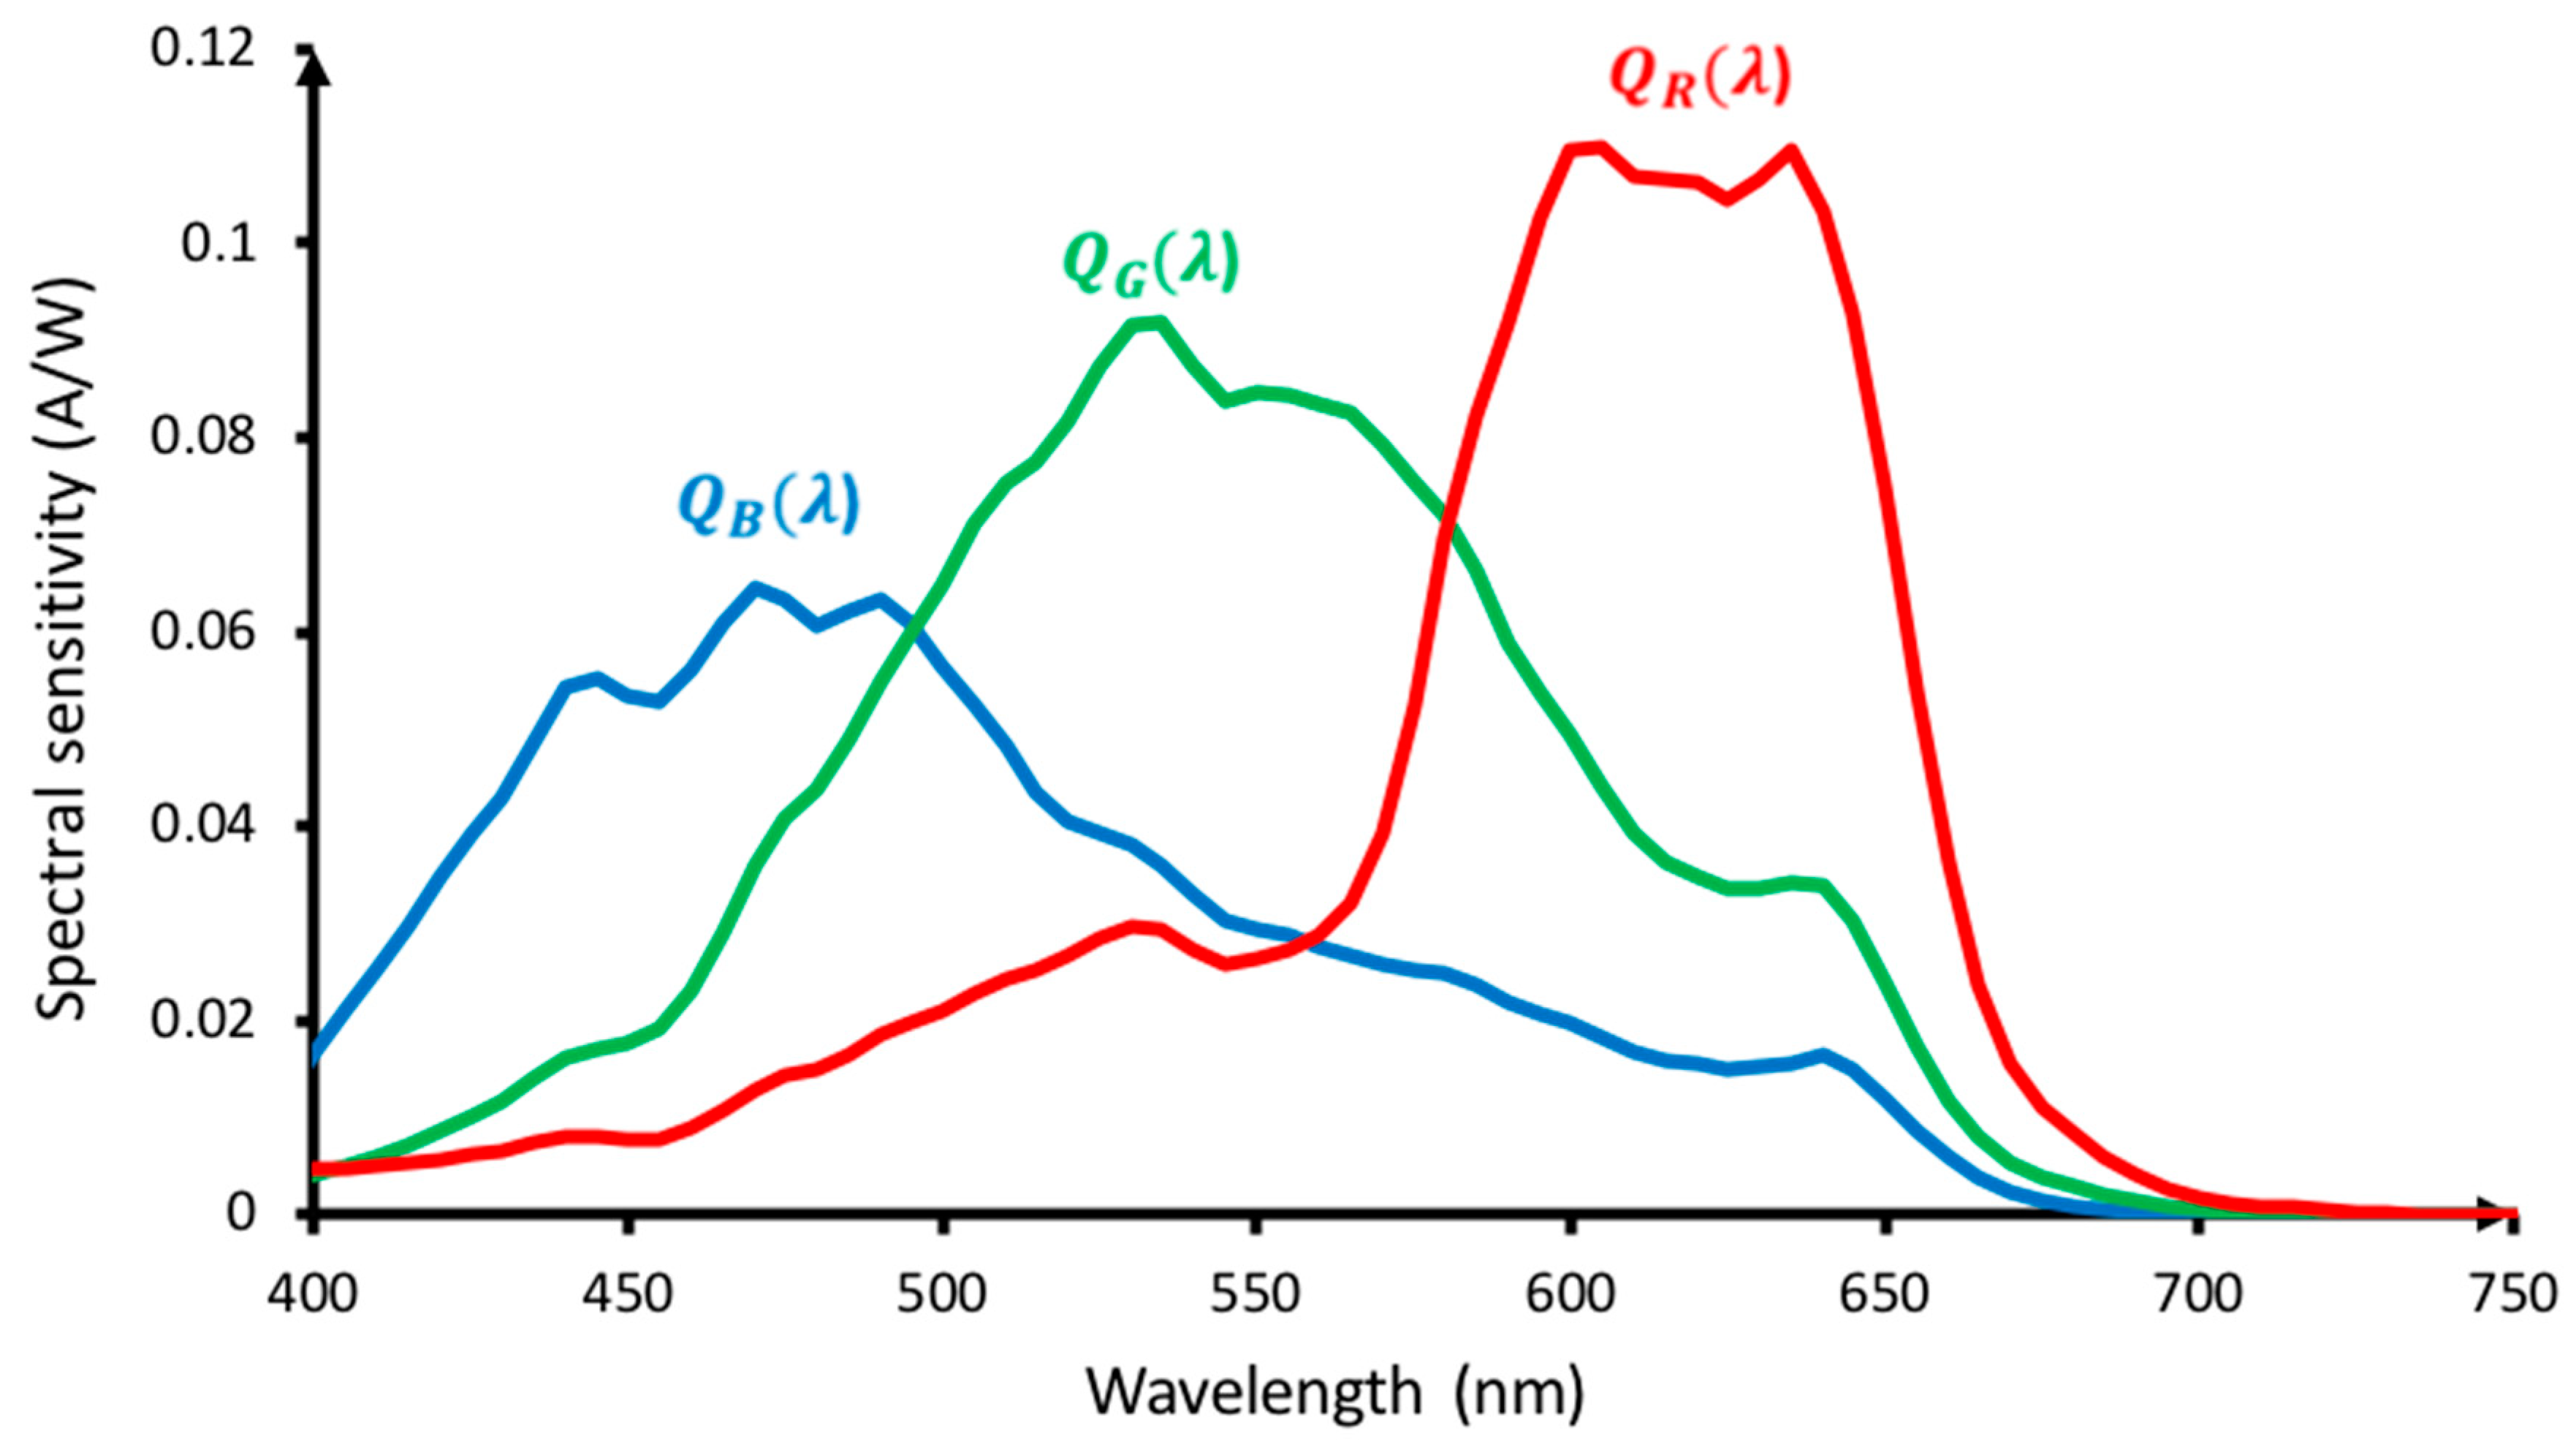
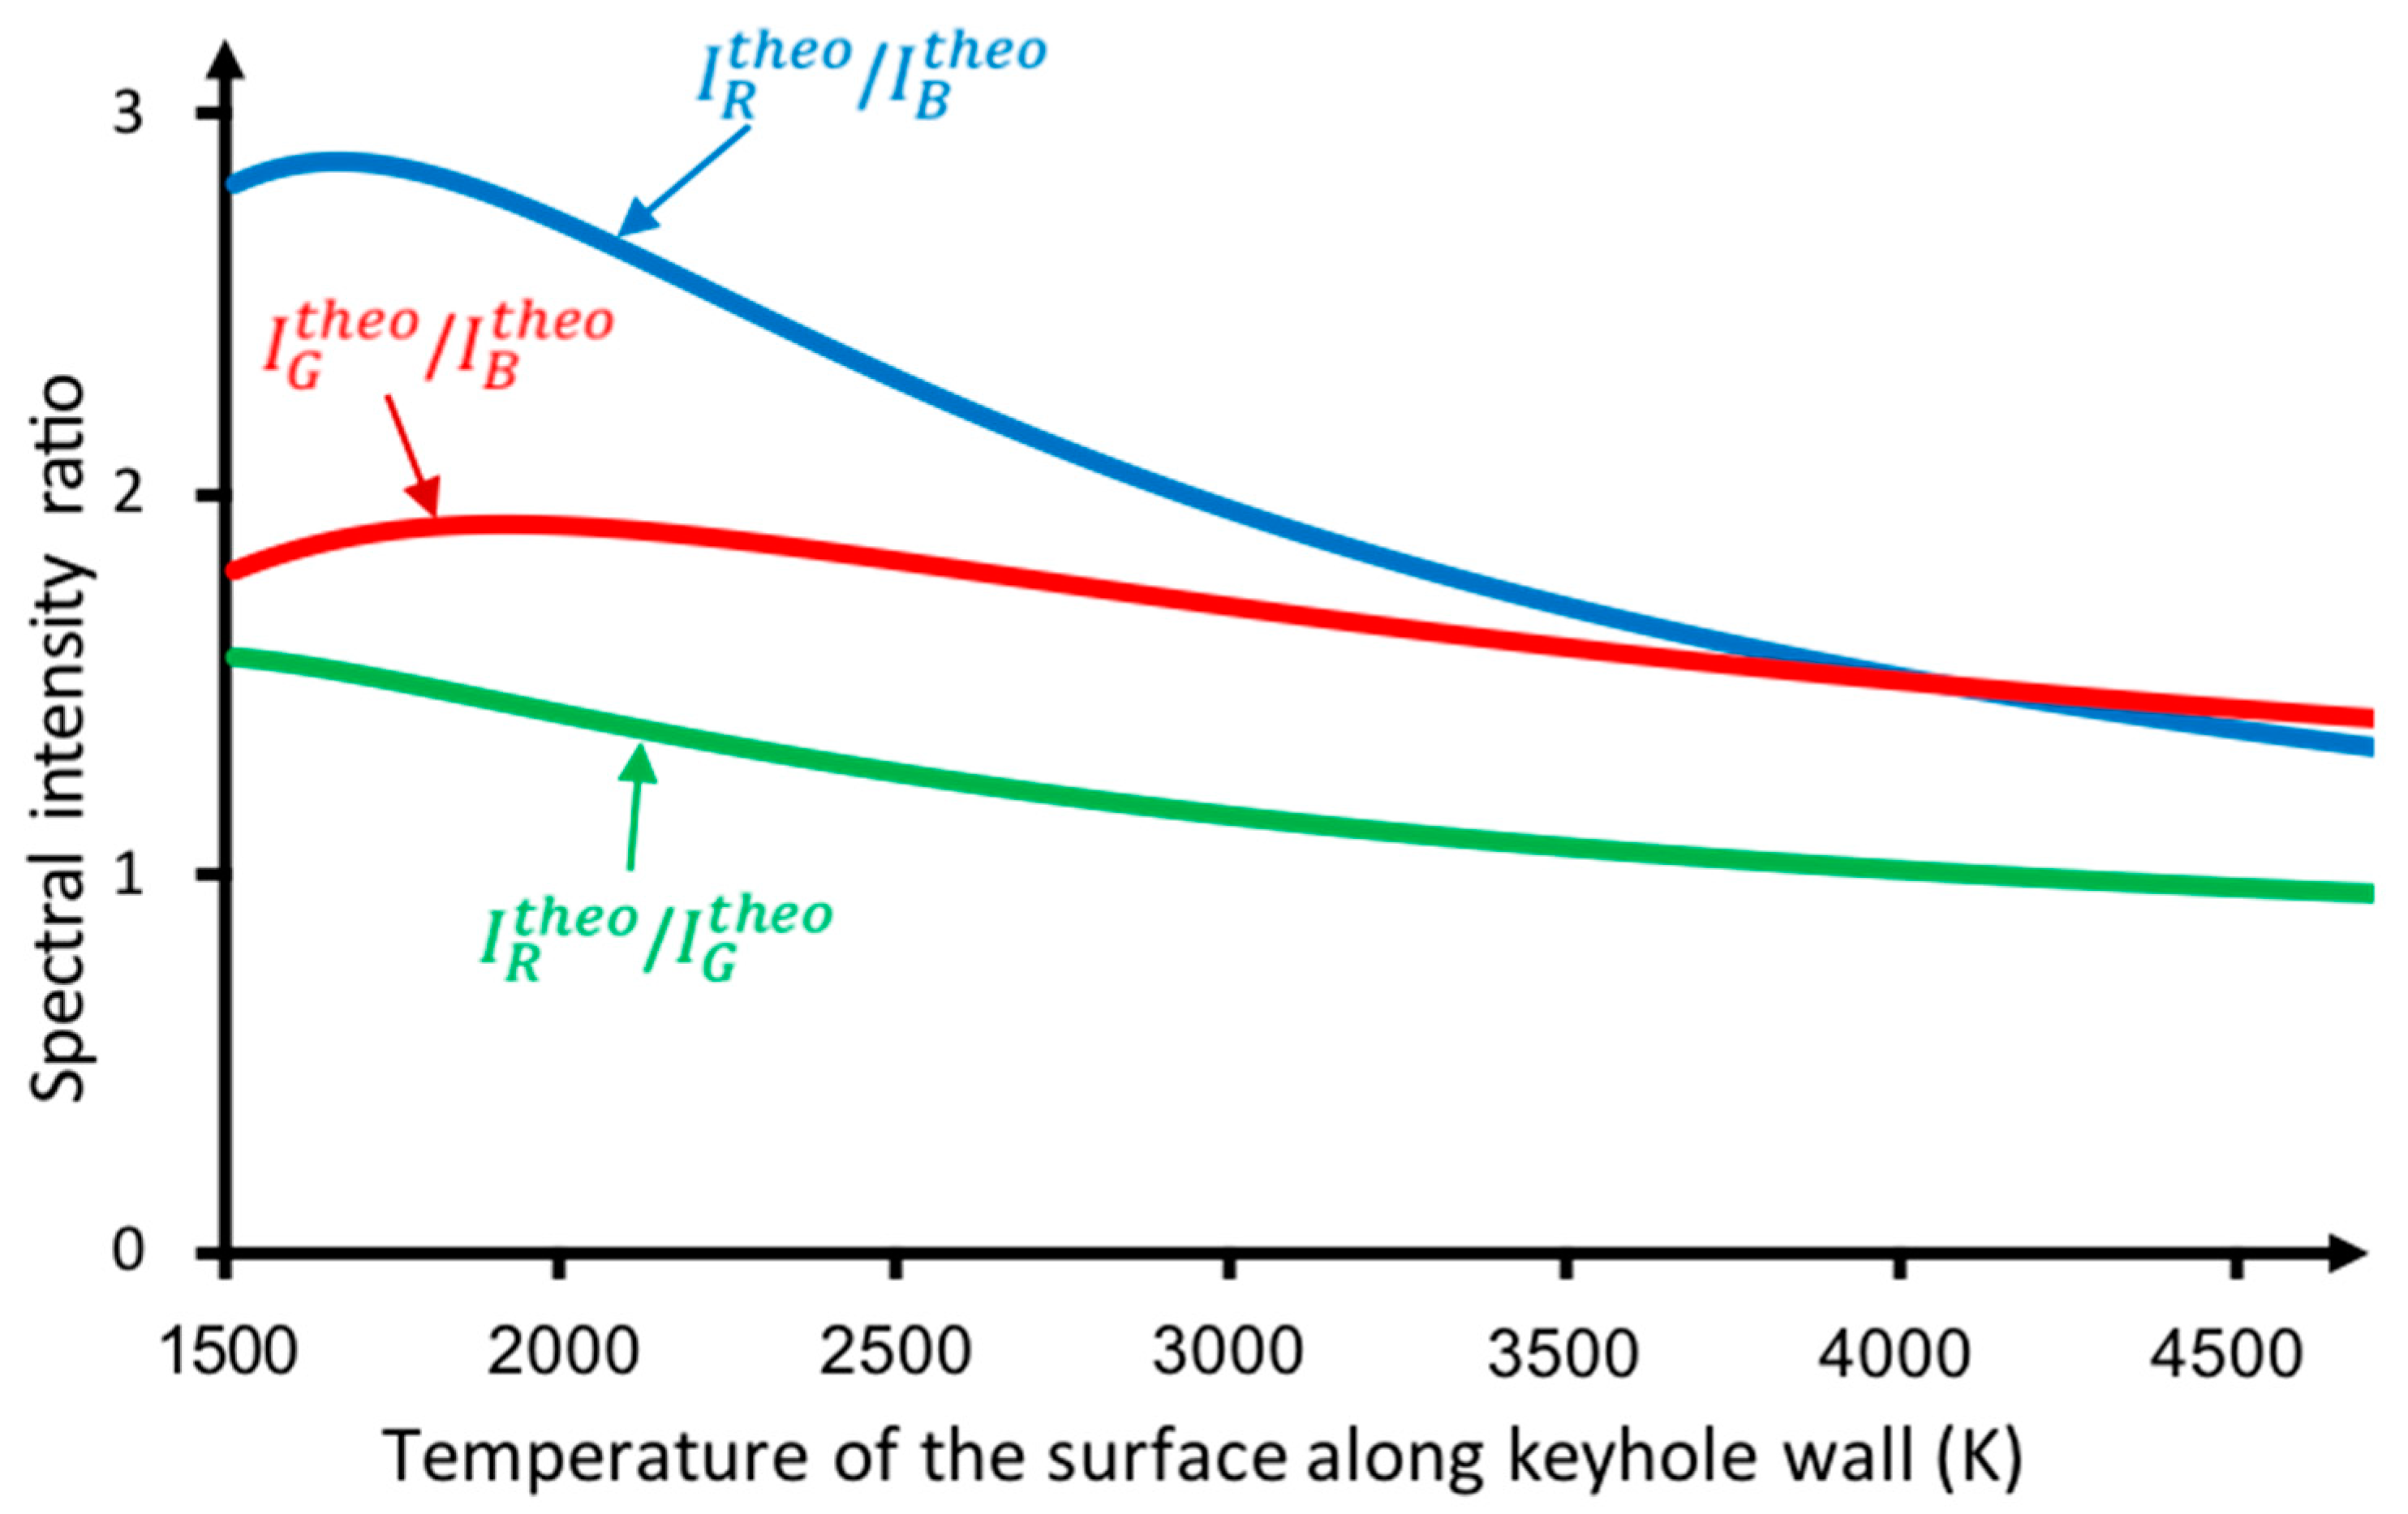
2.3. Two-Color Pyrometry Method

To calculate the temperature distribution on the surface inside the keyhole, we used Thermera-HS software (Phantom Co., Ltd., Tokyo, Japan) with the two-color pyrometry method. The spectral sensitivity of each color sensor corresponding to wavelengths is shown in Figure 4. The spectral sensitivities of the R, G, and B color sensors were Q R ( λ ) , Q G ( λ ) , and   Q B ( λ ) ,   where   λ   ( m ) is wavelength, respectively. Using this camera, we measured three experimental radiation intensities I R m e a n s , I G m e a n s , and I B m e a n s simultaneously in each experiment. If we assume that the surface along the keyhole wall is a black body, then theoretical radiation intensity ratios of I R t h e o / I B t h e o , I G t h e o / I B t h e o , and I R t h e o / I G t h e o , where each I t h e o is a function of temperature T   ( K ) can be computed as:
I R t h e o ( T ) = λ = 0 Q R ( λ ) × B ( λ , T )
I G t h e o ( T ) = λ = 0 Q G ( λ ) × B ( λ , T )
I B t h e o ( T ) = λ = 0 Q B ( λ ) × B ( λ , T )
where:
B ( λ , T ) = 2 h c 2 λ 5 × 1 e h c λ k B T 1
where B ( λ , T )   ( Ws   r 1   m 3 ) is the spectral radiation of the weld pool, h = 6.63 × 10 34   m 2 kg 1 s 1 is the Planck constant, C = 3 × 10 8   m   s 1 is the speed of light, k B = 1.38 × 10 23   J   K 1 is the Boltzmann constant, and T   ( K ) is the temperature of the surface along the keyhole wall. From Equations (1)–(3), we obtained the theoretical ratios I R t h e o / I B t h e o , I G t h e o / I B t h e o , and I R t h e o / I G t h e o corresponding to each temperature as described in Figure 6. Comparing the radiation intensity ratios ( I R m e a s / I B m e a s , I G m e a s / I B m e a s , and I R m e a s / I G m e a s ) measured the in experiments with the theoretically calculated radiation intensity ratios ( I R t h e o ( T ) / I B t h e o ( T ) , I G t h e o ( T ) / I B t h e o ( T ) , and I R t h e o ( T ) / I G t h e o ( T ) ), the temperatures ( T i ) on the surface along keyhole wall were determined. As indicated in Figure 7, only one temperature value exists for each intensity ratio in the case of the I R t h e o ( T ) / I G t h e o ( T ) ratio, this ratio was chosen to calculate the temperature in this study.
A recent paper reported that the two-color pyrometry method, as explained in this paper, can be used to detect the temperature of the weld pool surface for the tungsten inner gas (TIG) welding process with acceptable accuracy [24]. Other papers confirmed that the maximal temperatures on the weld pool surface in KPAW determined using experiments and simulation are nearly equal, with less than 5% deviation (about 1875 K per experiments and 1945 K per simulation) [18,25]. We used many experiments to confirm the accuracy of this method. The results showed that the average maximal temperature on the weld pool surface in KPAW is about 1875 K, with a deviation of ±50 K. From all of above, we found that the uncertainly in the measured temperatures and the possible wavelength variation were slight. Therefore, the measured temperature is reliable for considering the action of Marangoni force.

3. Experimental Results and Discussion

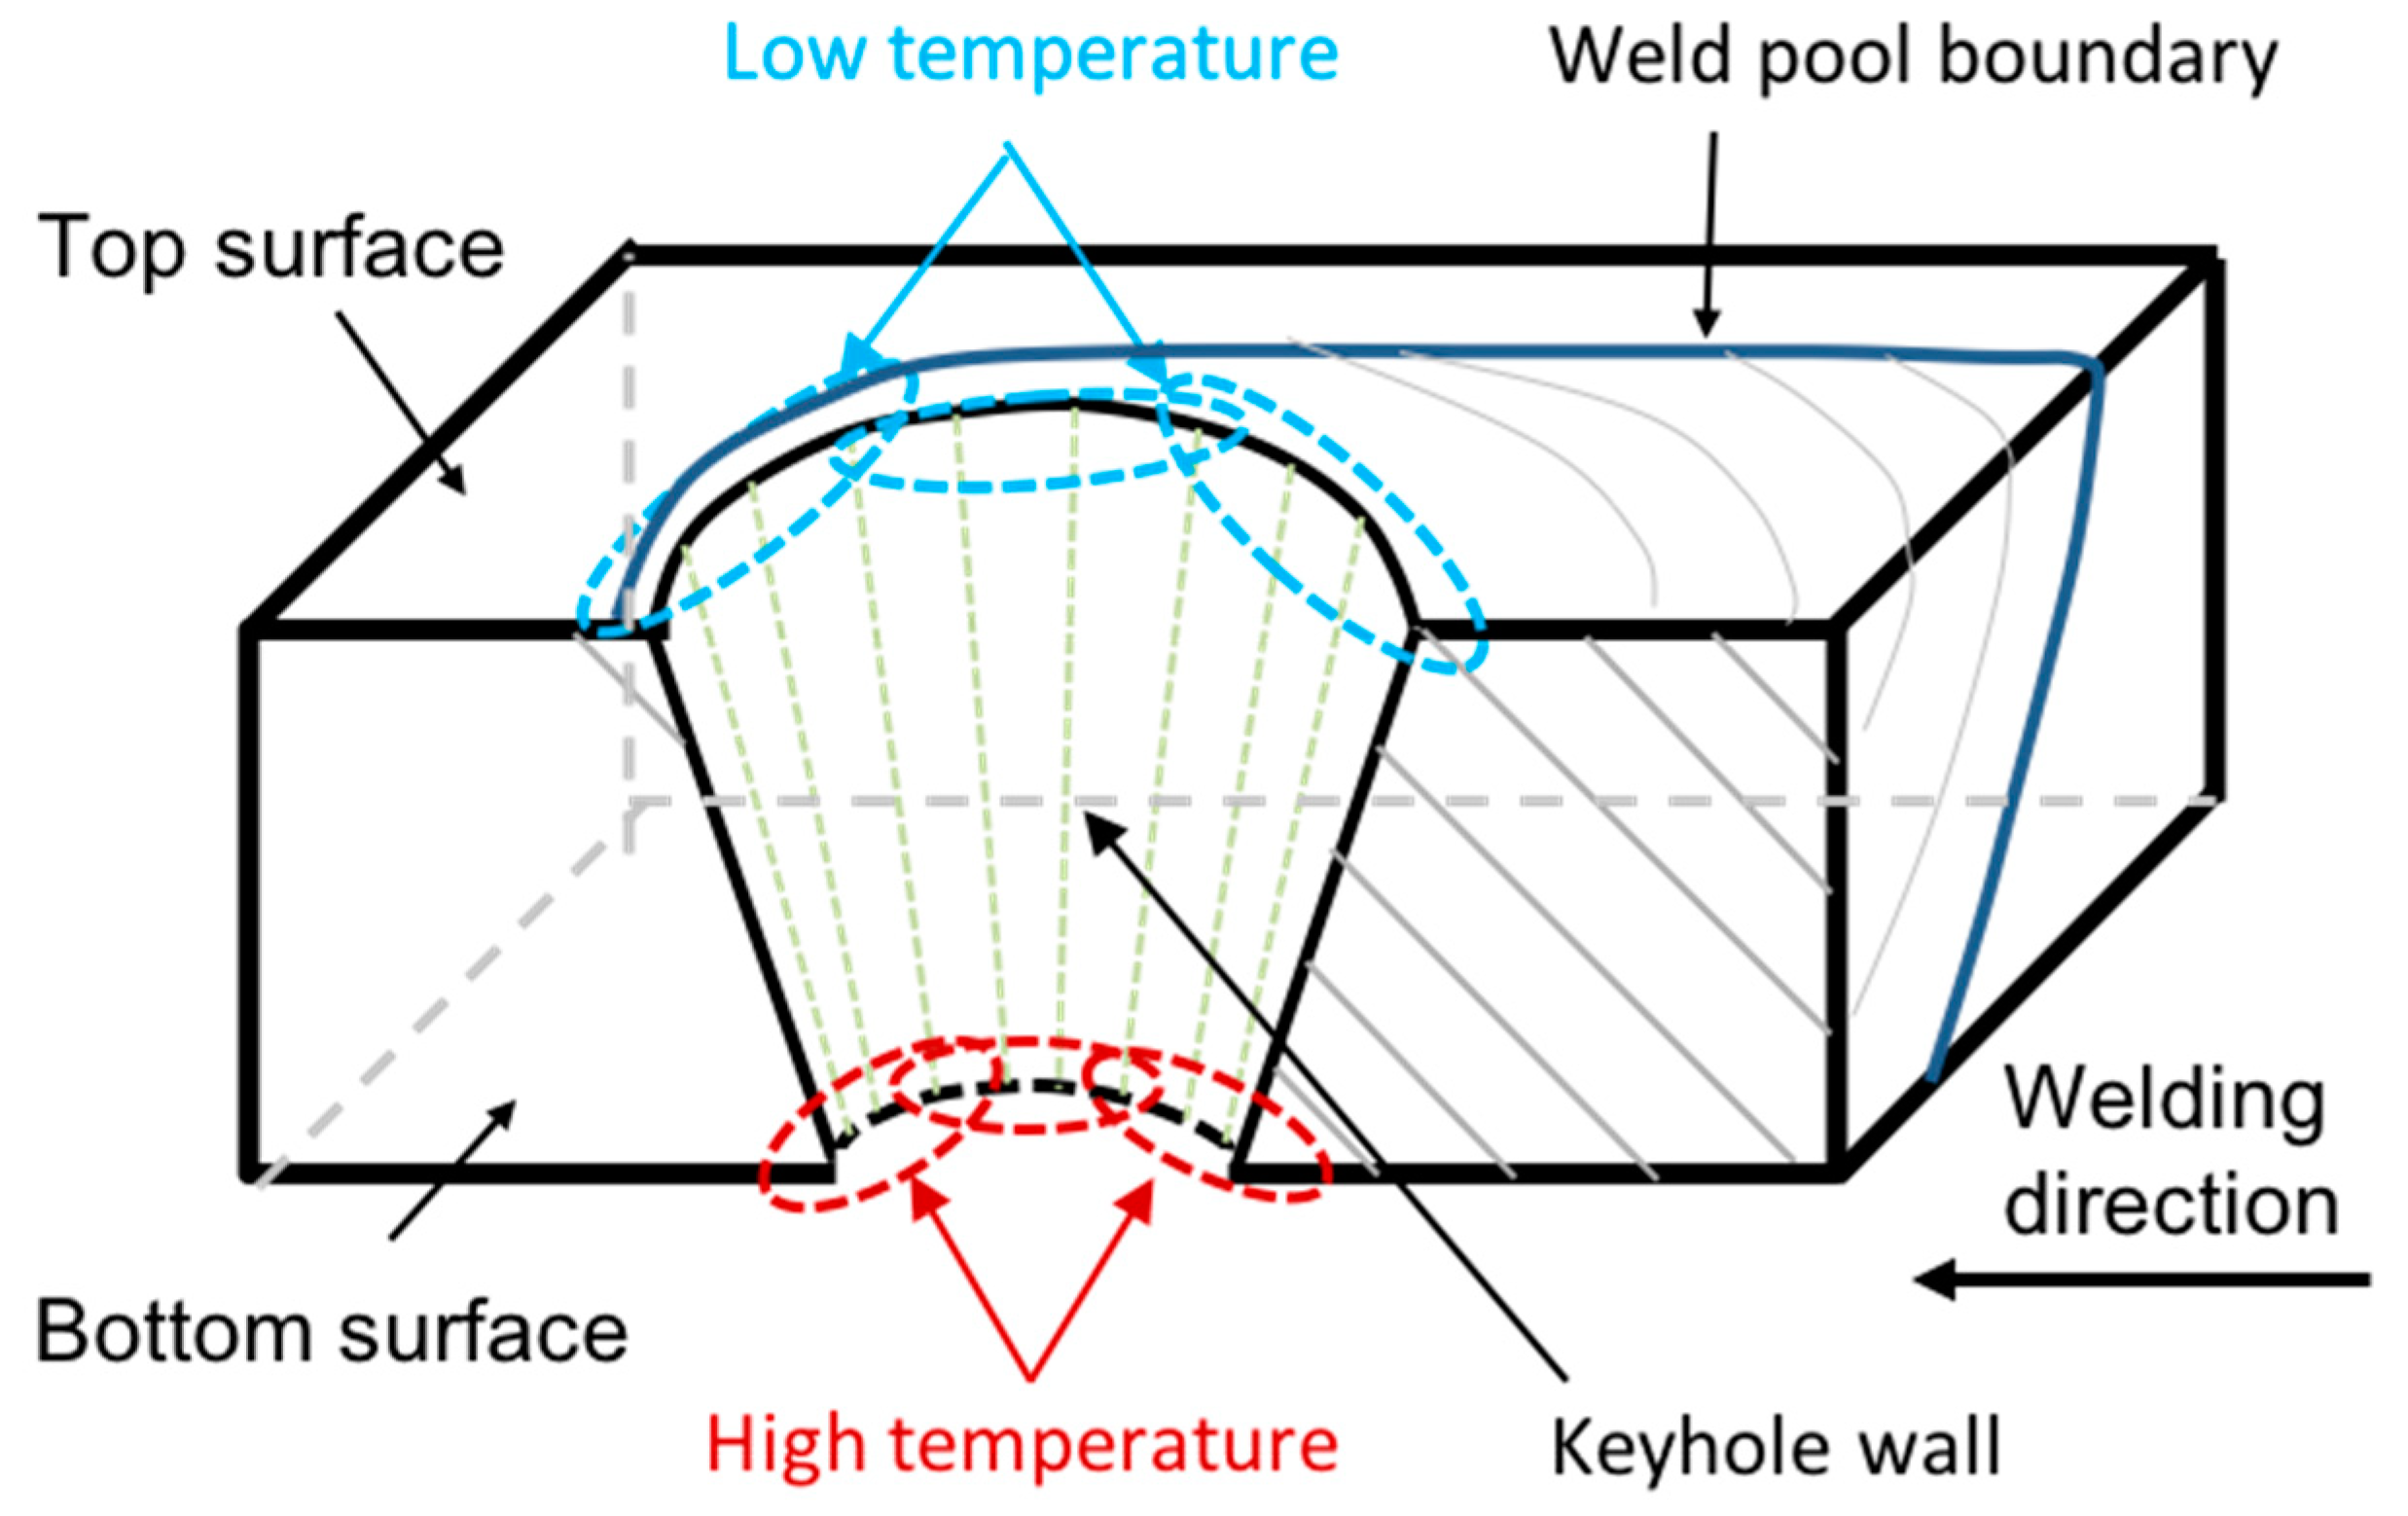
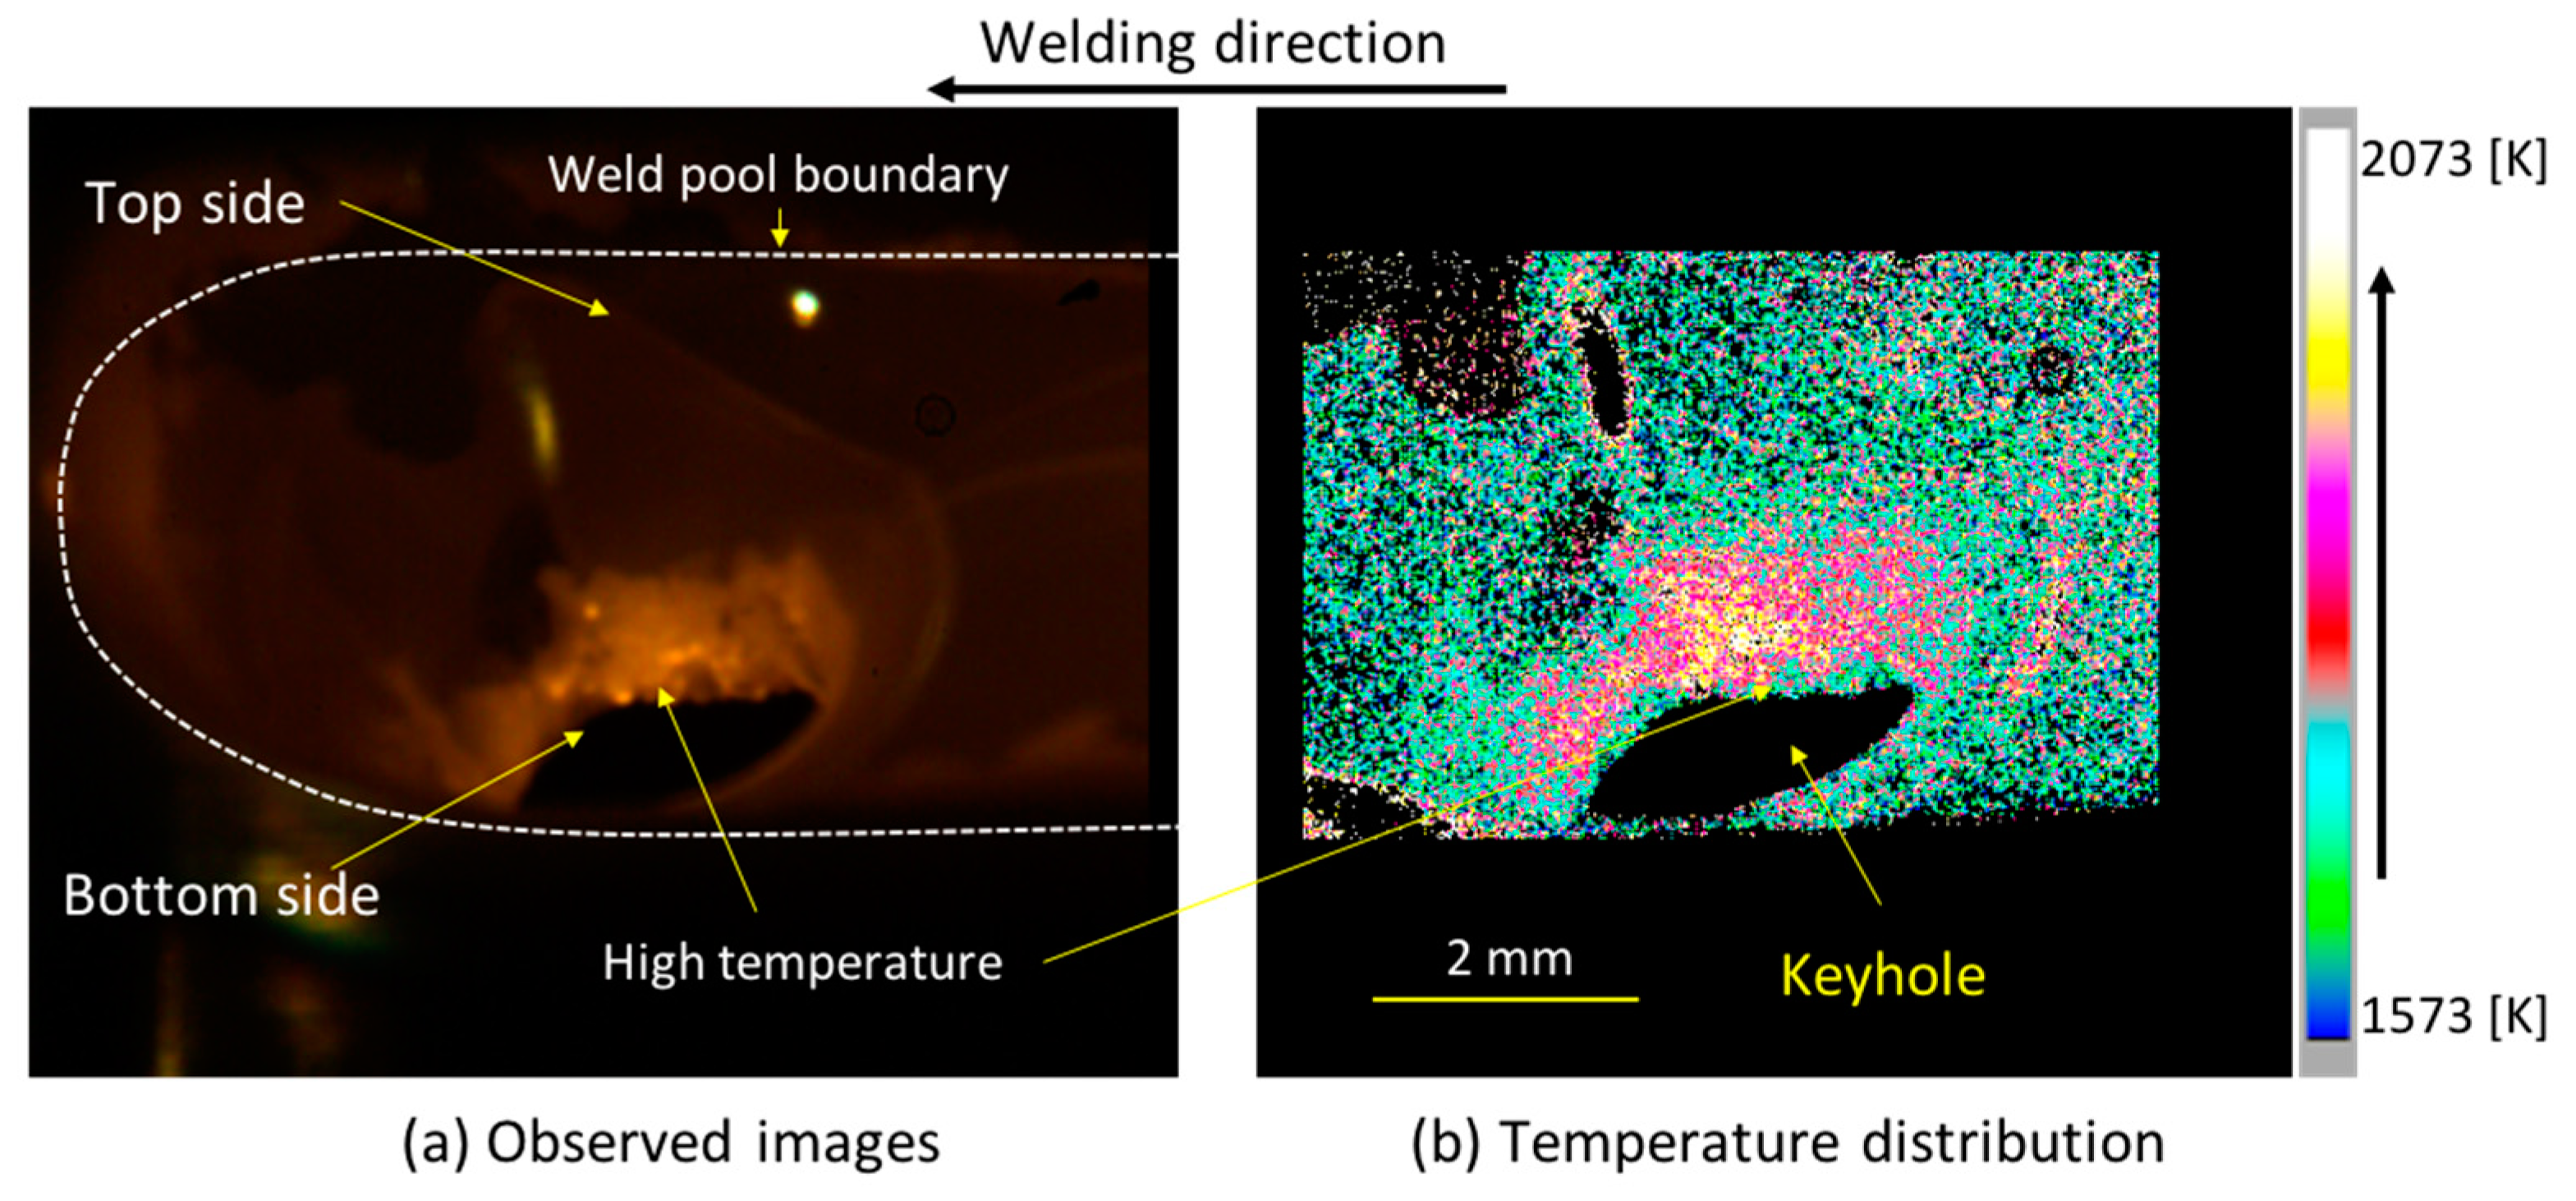
3.1. Temperature Distribution on Keyhole Wall Surface

The temperature distribution on the surface along the keyhole wall calculated from experimental research is depicted in Figure 8. The temperature range was around 1573–2073 K. The maximum temperature of 2073 K occurred at the bottom surface of the keyhole. This result can be explained by (1) the heat transfer from the arc plasma to the weld pool and (2) the subsequent thermal conduction in the weld pool. Generally, the total heat flux on the surface of a base metal (workpiece) consists of the heat flux from electron condensation and thermal conduction. With an opening keyhole, the energy transfer on the surface along keyhole wall consists of electron condensation and thermal conduction, whereas the energy transfer anywhere within the weld pool only occurs due to thermal conduction. In this case, the arc plasma column with very high temperature attached to the surface along the keyhole wall. The center of the arc plasma column was closer to the workpiece on the bottom surface rather than the top surface due to the small keyhole diameter at the bottom surface. Therefore, the energy from electron condensation transferred to this region was much larger than elsewhere within the weld pool [26]. As a result, the temperature on the surface along the keyhole wall was higher than at other positions within weld pool, and the temperature on the bottom surface was higher than on the top surface.
We conducted many experiments to confirm that the temperature distribution tendencies for both pure Ar and Ar + 0.5% O2 were similar, meaning that the temperature at the bottom surface was higher that at the top surface. Therefore, to discuss the results in this work, only the temperature distribution in the case of pure Ar is presented.

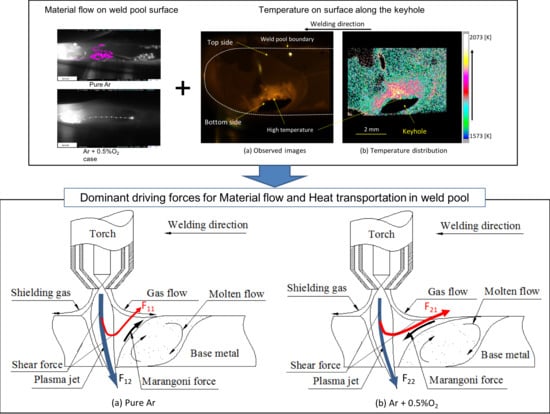
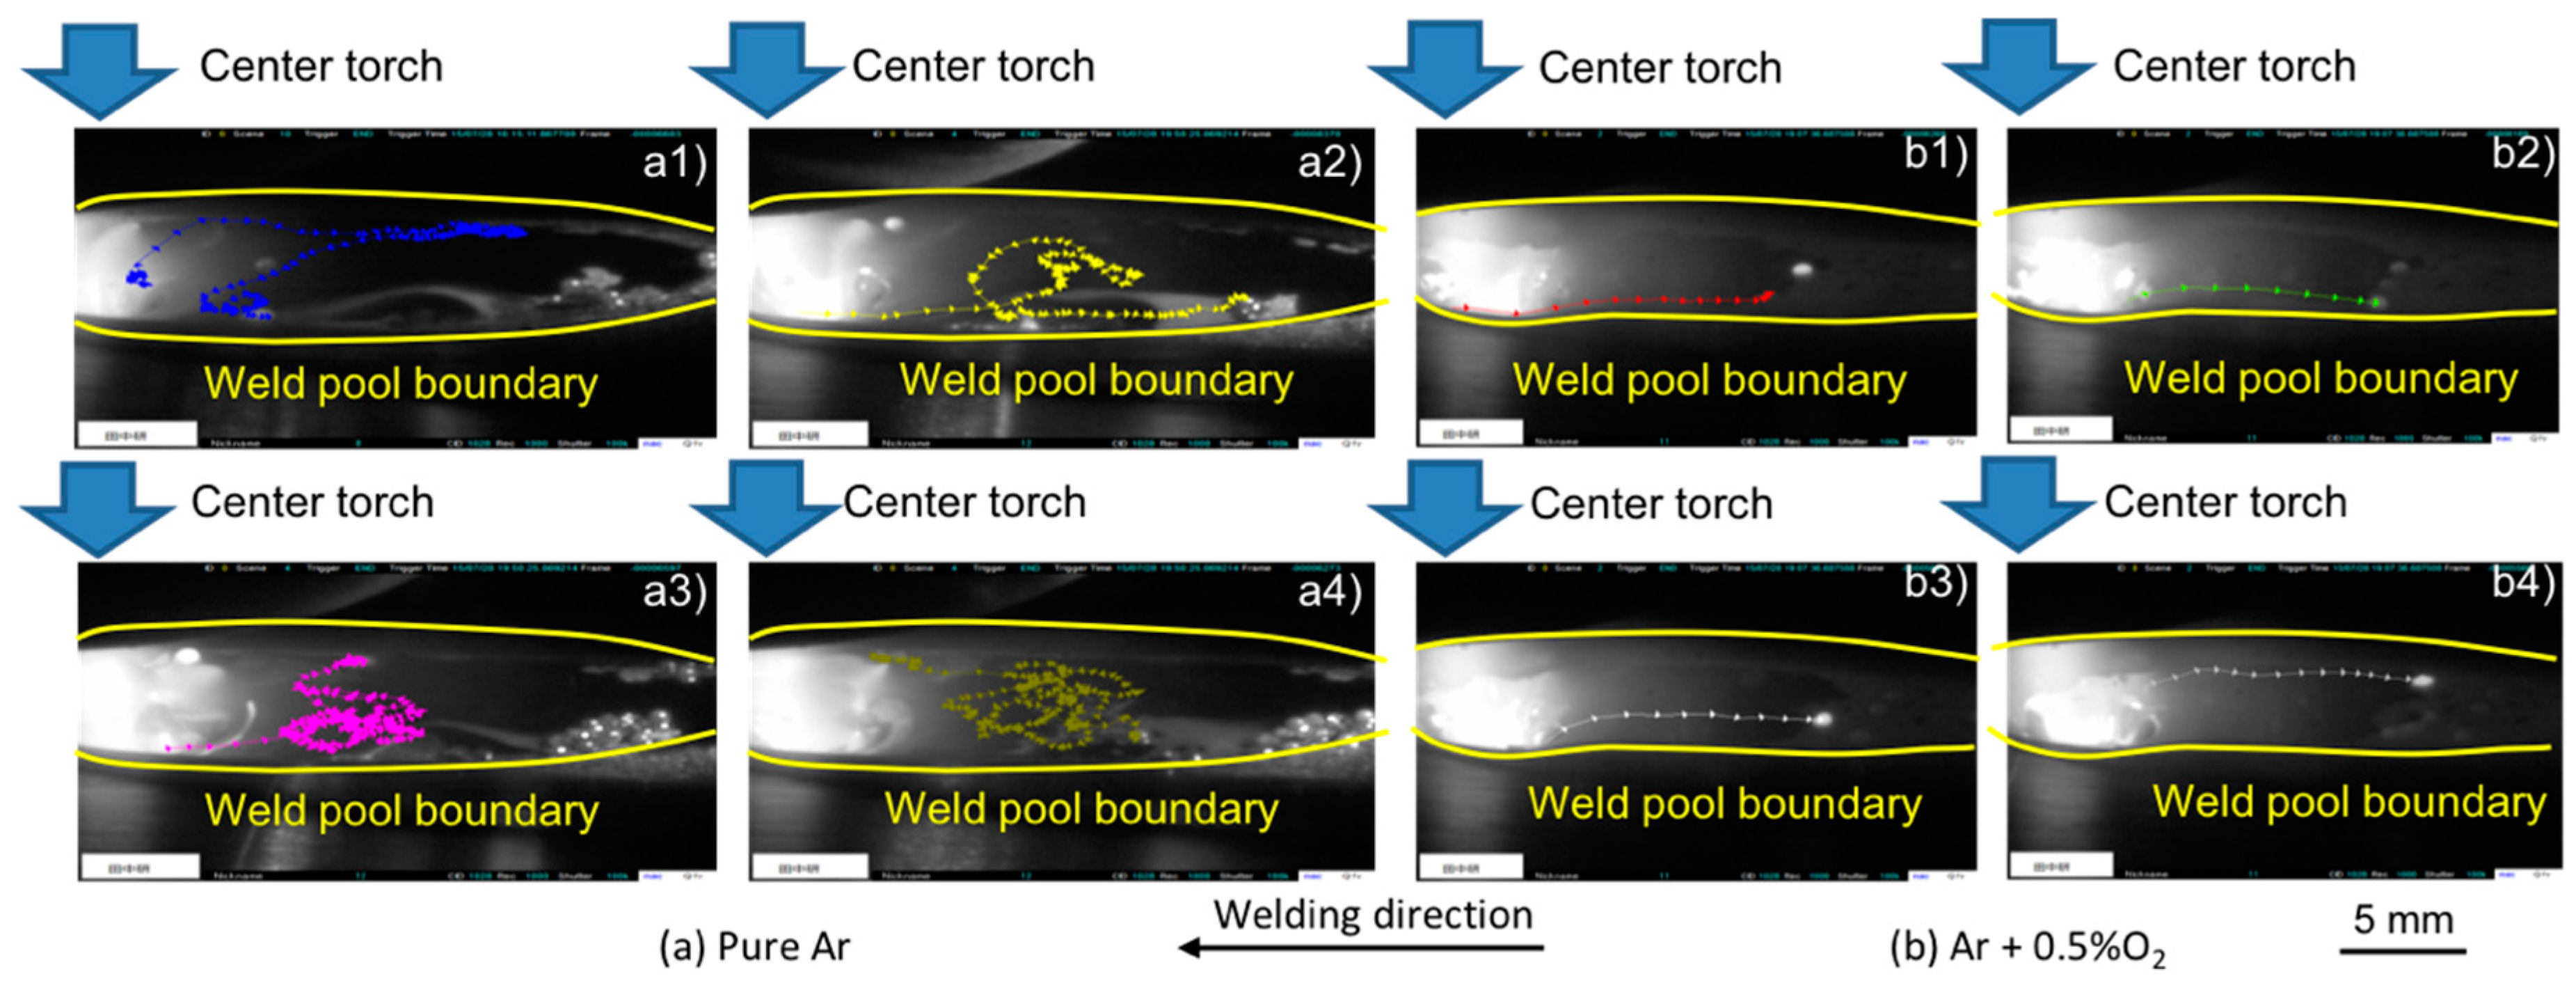
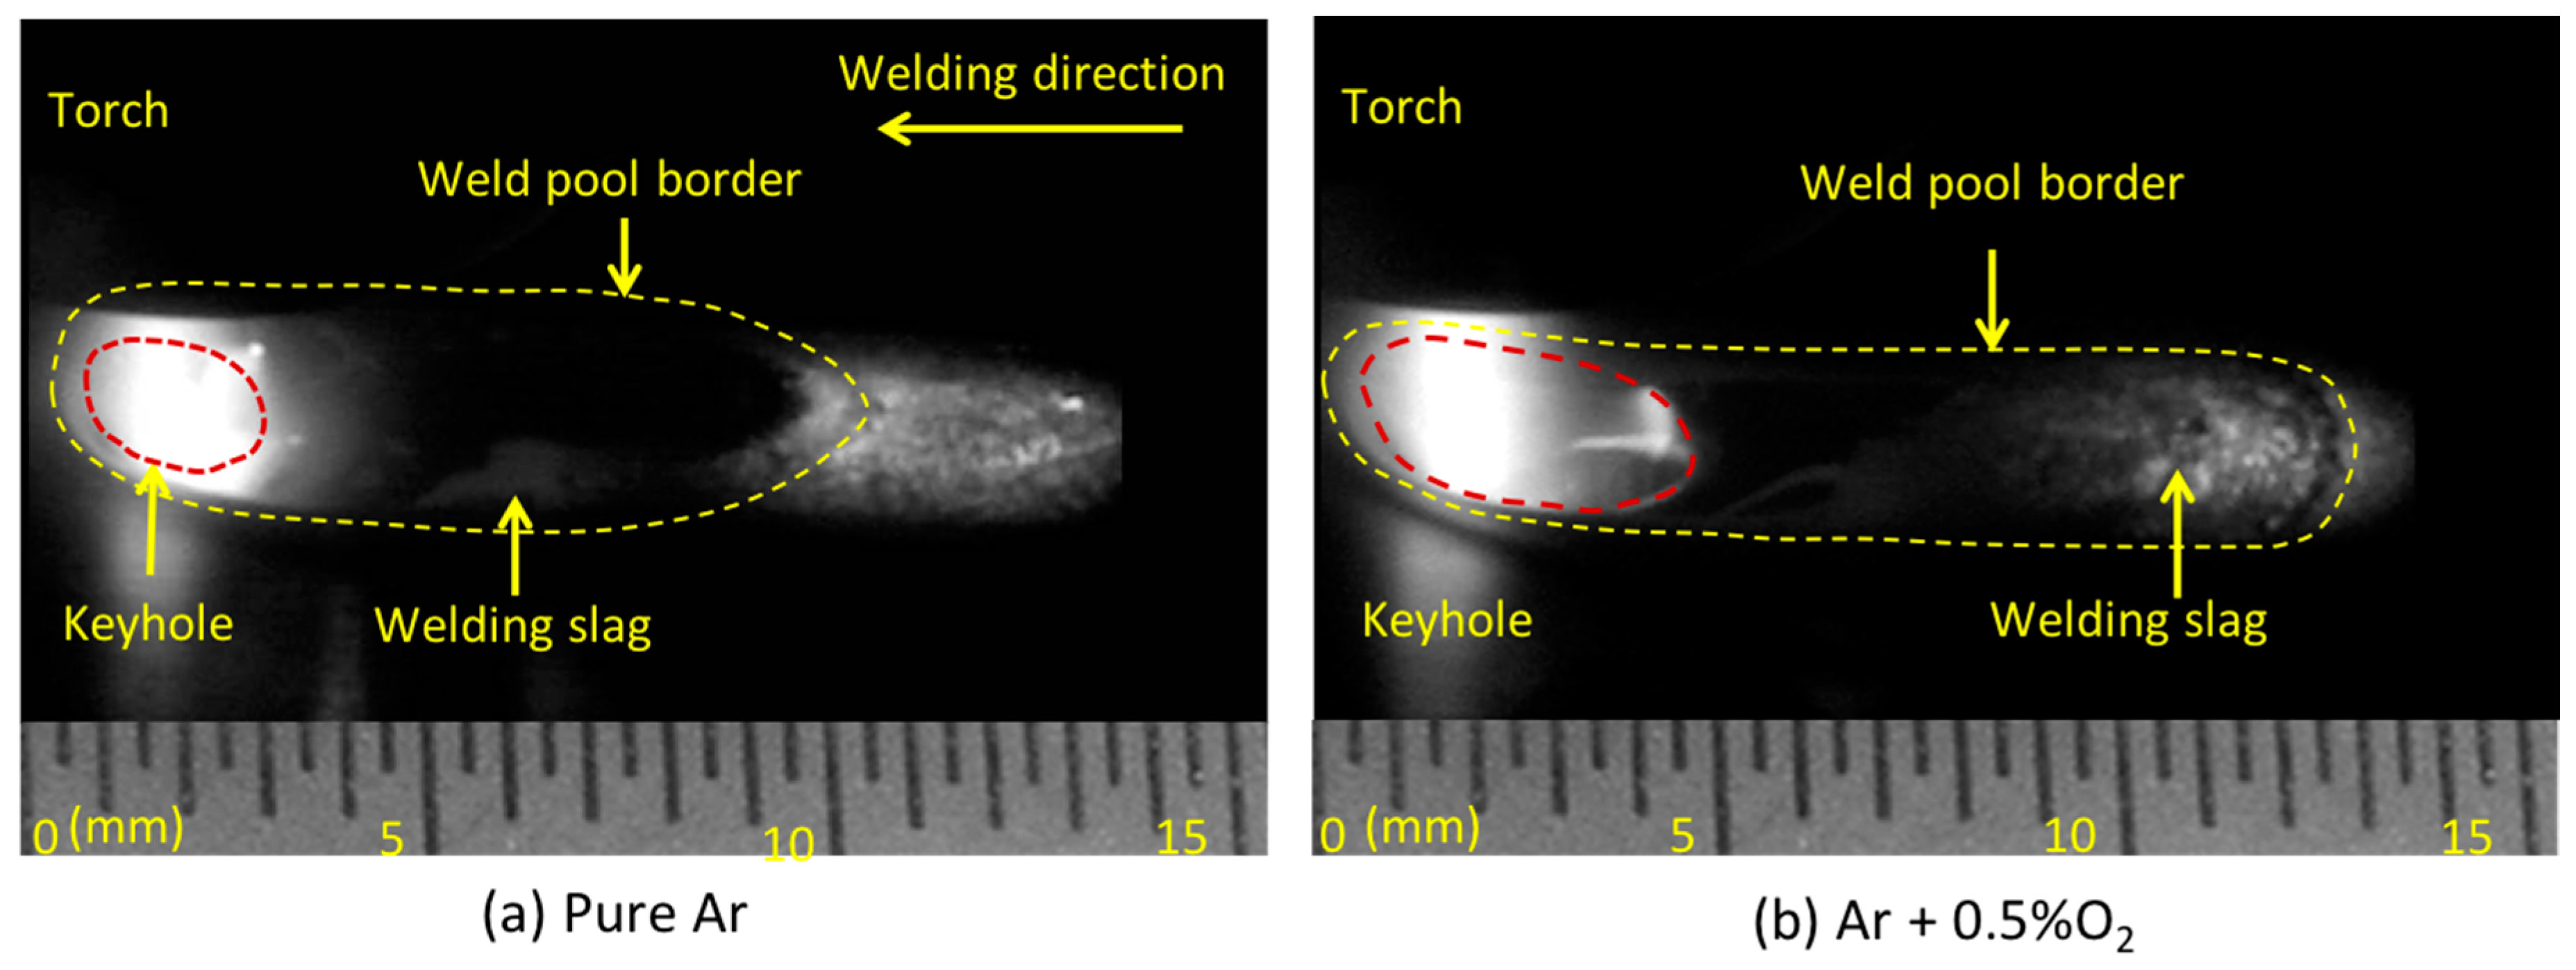
3.2. Material Flow Behavior on Weld Pool Surface

To verify the reliability of the research results, the experimental observations were repeated more than 10 times for each shielding gas. The experimental results showed the same tendency of zirconia particles in most experiments. Typical consecutive tracer particle movement images for Ar + 0.5% O2 are presented in Figure 9 from 13 until 28 ms.
Four typical results for each case of the shielding gas are shown in Figure 10. The tracer particles in a1, a2, a3, and a4 showed nearly the same tendency (Figure 10a). In this case, tracer particles’ motion was observed for 130 ms. Firstly, the zirconia particle sank to the bottom surface before entering the weld pool. Then, it accelerated in an upward direction behind the keyhole. After accelerating in the upward direction, it reversed from straight motion to rotational motion behind the keyhole before entering the welding slag layer on left and right edges of the weld pool surface.
Figure 10b shows that after upward and backward acceleration from inside the keyhole, the tracer particles in b1, b2, b3, and b4 displayed translational movement toward to the ending part of the weld pool. In this case, the zirconia motion was observed for 30 ms. Accordingly, the moving time of the zirconia particle in pure Ar case was longer than that with Ar + 0.5% O2. Due to oxidation on the weld pool surface, we observed that the slag on the weld pool surface was significantly increased when using Ar + 0.5% O2. The average speed of material flow in the two cases was computed; the average speed was about 0.24 and 0.42 m s−1 in pure Ar and Ar + 0.5%O2, respectively.
Weld pool surface shapes are depicted in Figure 11, which compares the weld pool length in both pure Ar and the mixture of Ar and 0.5% oxygen. The weld pool on the top surface in pure Ar case was longer, but its width decreased in comparison to with Ar + 0.5% O2. The keyhole diameter was larger, especially around the top surface of the weld pool in Ar + 0.5% O2. The weld pool length was about 11 mm for pure Ar, but about 14 mm for Ar + 0.5% O2. Slag was observed at the ending part of the weld pool, especially for the mixed shielding gas. This issue can be explained based on the difference in the weld pool length and the oxidation of the weld pool surface by the oxygen in the shielding gas. Since the weld pool for the mixed shielding gas was much longer than that of pure shielding gas, the shielding effect was much reduced. The covered efficiency was low, producing the slag described above.
The widths of weld bead after welding are exhibited in Figure 12. Due to the higher flow velocity of the weld pool convection and the zirconia particle being directly accelerated backward to the ending part of the weld pool, the width of the weld bead was narrower when the shielding gas was admixed with 0.5% O2. The weld bead width was about 7.0 mm for pure Ar and about 5.0 mm for Ar + 0.5% O2.
Figure 13 displays the slag on the bottom surface of the base metal after welding. At a high temperature during the welding process, oxygen from the air participated in oxidation reactions to form oxides, especially on the bottom surface due to an insufficient shielding effect. The welding slag on the bottom surface of the base metal consequently increased for Ar + 0.5% O2. More slag was created when using mixed gas compared with pure Ar due to two factors: the penetration of oxygen from the air and oxygen from the shielding gas.
Generally, in the KPAW process with an open keyhole, a strong shear force always occurs in the downward direction along the keyhole wall from the top surface toward the bottom surface of the weld pool due to the strong plasma flow exiting a small nozzle diameter. However, in one of our recent experiments, we found that the shear force in KPAW with an open keyhole consists of two components: along the keyhole wall in the downward direction from the top surface toward to the bottom surface, and another in the upward direction from the middle part of the keyhole toward the top side in backward direction from the keyhole toward the rear part of weld pool [18]. Depending on the keyhole shape, the strength of components can be changed. This can cause a change in the convective flow of the weld pool.
The Marangoni force is a surface force acting on the surface of a weld pool and a keyhole wall. As shown in a previous study, Marangoni forces can be produced by the reversion of the surface tension gradient ( d σ / d T ) on a weld pool surface, as indicated in Figure 14 [27]. Sahoo et al. proposed that at a low temperature (about 2000 K or less), the surface tension decreases with increasing temperature ( d σ / d T always has a negative value). In this case, the surface tension at the weld pool edge is higher than at the center of weld pool, creating convective flow from the center toward the edge. Marangoni flow occurs from high temperature zones toward low temperature zones. However, adding a small amount of activated elements such as oxygen (0.5 wt%), the temperature coefficient of surface tension can change from negative to positive ( d σ / d T always has a positive value), changing the direction of Marangoni flow from outward to inward [28]. These results showed that the Marangoni force direction was upward and backward around the top surface of the weld pool under pure Ar and downward around the bottom surface of the weld pool for Ar + 0.5% O2.
Lorentz force (an electromagnetic force) is caused by electric current flowing through the base metal. As a result, this magnetic field induces convective flow. Generally, the Lorentz convection is inward and downward [29]. The simulation results of an individual force indicated that the velocity caused by this force was much lower than that caused by Marangoni force [26]. Therefore, this force is not considered to be a main force affecting the weld pool in KPAW.
Buoyant force is an upward force acting in the weld pool. This force always occurred from the bottom surface toward the top surface of the weld pool. However, this force was much weaker than other dominant forces (shear force and Marangoni force) [18]. As a result, buoyant force is not considered to be a dominant driving force in KPAW.
In a surface fluid flow experiment of the TIG welding process, Masuda et al. estimated that the maximal speed is about 0.1 m s−1 at the center of the arc [30]. This value is much lower than the velocity value in this study. The main driving forces in the TIG welding process are Marangoni force and shear force [31]. Based on this difference, the KPAW shear force is much stronger than in TIG welding.
Based on the explanation above, our results are discussed through schematic illustration of the influence of shear and Marangoni forces in Figure 15. In this case, the convective patterns of the weld pool are controlled principally by the interaction of shear force and Marangoni force. As explained above, the direction of Marangoni force is from the bottom surface toward the top surface of the weld pool for pure Ar and from the top surface toward the bottom surface for Ar + 0.5% O2. Due to the change in keyhole shape, the shear force caused by plasma flow along the surface of keyhole wall varied. With pure Ar, because the keyhole diameter was smaller, most of the plasma flow pushed out at the bottom surface of the weld pool through the keyhole and only a small amount flowed in the upward and backward directions along the surface of the weld pool. This led to a weak upward and backward shear force (F11) on the top surface of the weld pool and a strong downward shear force (F12) along the keyhole wall. In this case, the combination of F11 in the upward direction (weak force) and Marangoni force in the upward direction (weak force) controlled an upward material flow with low speed (0.24 m s−1). The keyhole diameter was larger, especially near the top surface of the weld pool for Ar + 0.5% O2. In this case, a large amount plasma flow pushed out in the upward and backward directions along the weld pool surface to produce a larger upward and backward shear force (F21); a small amount of plasma flow pushed down through the inside keyhole wall to cause a weak downward force (F22). In this case, the combination of F21 in the upward direction (strong force) and Marangoni force (weak force) in the downward direction strongly accelerated the material flow in the upward direction toward the rear part of the weld pool (0.42 m s−1). As the backward heat transfer produced by the convection in the weld pool increased through the expansion of the keyhole diameter especially near the top surface, the weld pool length increased, but the width of the weld bead decreased when a small amount of oxygen was added to the argon shielding gas.
As explained above, the shear force in KPAW was caused by the strong plasma gas and shielding gas flows along the keyhole and weld pool surfaces in the upward and backward directions on the upper side of the weld pool. With Ar + 0.5% O2, due to the oxidation of the weld pool surface, the surface tension decreased. Consequently, the plasma gas flow and shielding gas flow easily pushed the fluid flow backward compared to the welding direction. As a result, the inclination angle of keyhole wall considerably increased, especially around the top surface, as demonstrated in Figure 15. This is different to the behavior of molten flow in the TIG welding process as shown in many previous papers, where the molten flow occurs in the downward direction due to (1) a weak shear force on the weld pool surface and (2) a strong Marangoni force. Summary, the shear force is the dominant driving force that depends on the shape of the keyhole.
The slag appearance on the bottom surface and the change in weld bead width can cause changes in the mechanical properties of the welding joints such as tensile strength or residual strength [32]. However, as shown in another work, with a small amount of oxygen in the weld pool (less than 2.0%), the penetration can be changed due to the change in Marangoni convection, but mechanical properties such as tensile strength did not decrease [33].
Nguyen et al. recently estimated the behavior of fluid flow inside the weld pool considering the influence of shielding gas compositions [34]. The results indicated that the velocity of molten flow with pure Ar is much lower than with Ar + 0.5% O2. The plots showed that a downward convection flow occurred in the lower half of the weld pool with Ar + 0.5% O2. The convection flow near the keyhole in the upper half of the weld pool did not seem to be observed. However, we observed a strong upward convection in the upper half of the weld pool. Therefore, the behavior of the material flow in this study is new compared with [34]. In other words, the convection inside the weld pool in the upper half has not yet been studied, but the convection on the surface of the weld pool in the upper half has been described. To obtain a whole image of weld pool convection, the weld pool convection in the upper half should be considered in future studies.
The results in this work suggest that using a mixed shielding gas with a minor amount of activated elements such as oxygen can increase the ratio of welding penetration to weld bead width. Therefore, admixture shielding gas can be considered for welding large thickness plates to reduce the number of welding passes and reduce welding time.

4. Conclusions

On the basis of the results of this investigation, the following main conclusions were drawn:
(1)
The temperature on the surface along the keyhole wall decreased gradually from the bottom toward the top surface.
(2)
The maximum temperature was about 2073 K at the bottom surface and about 1573 K at the top surface.
(3)
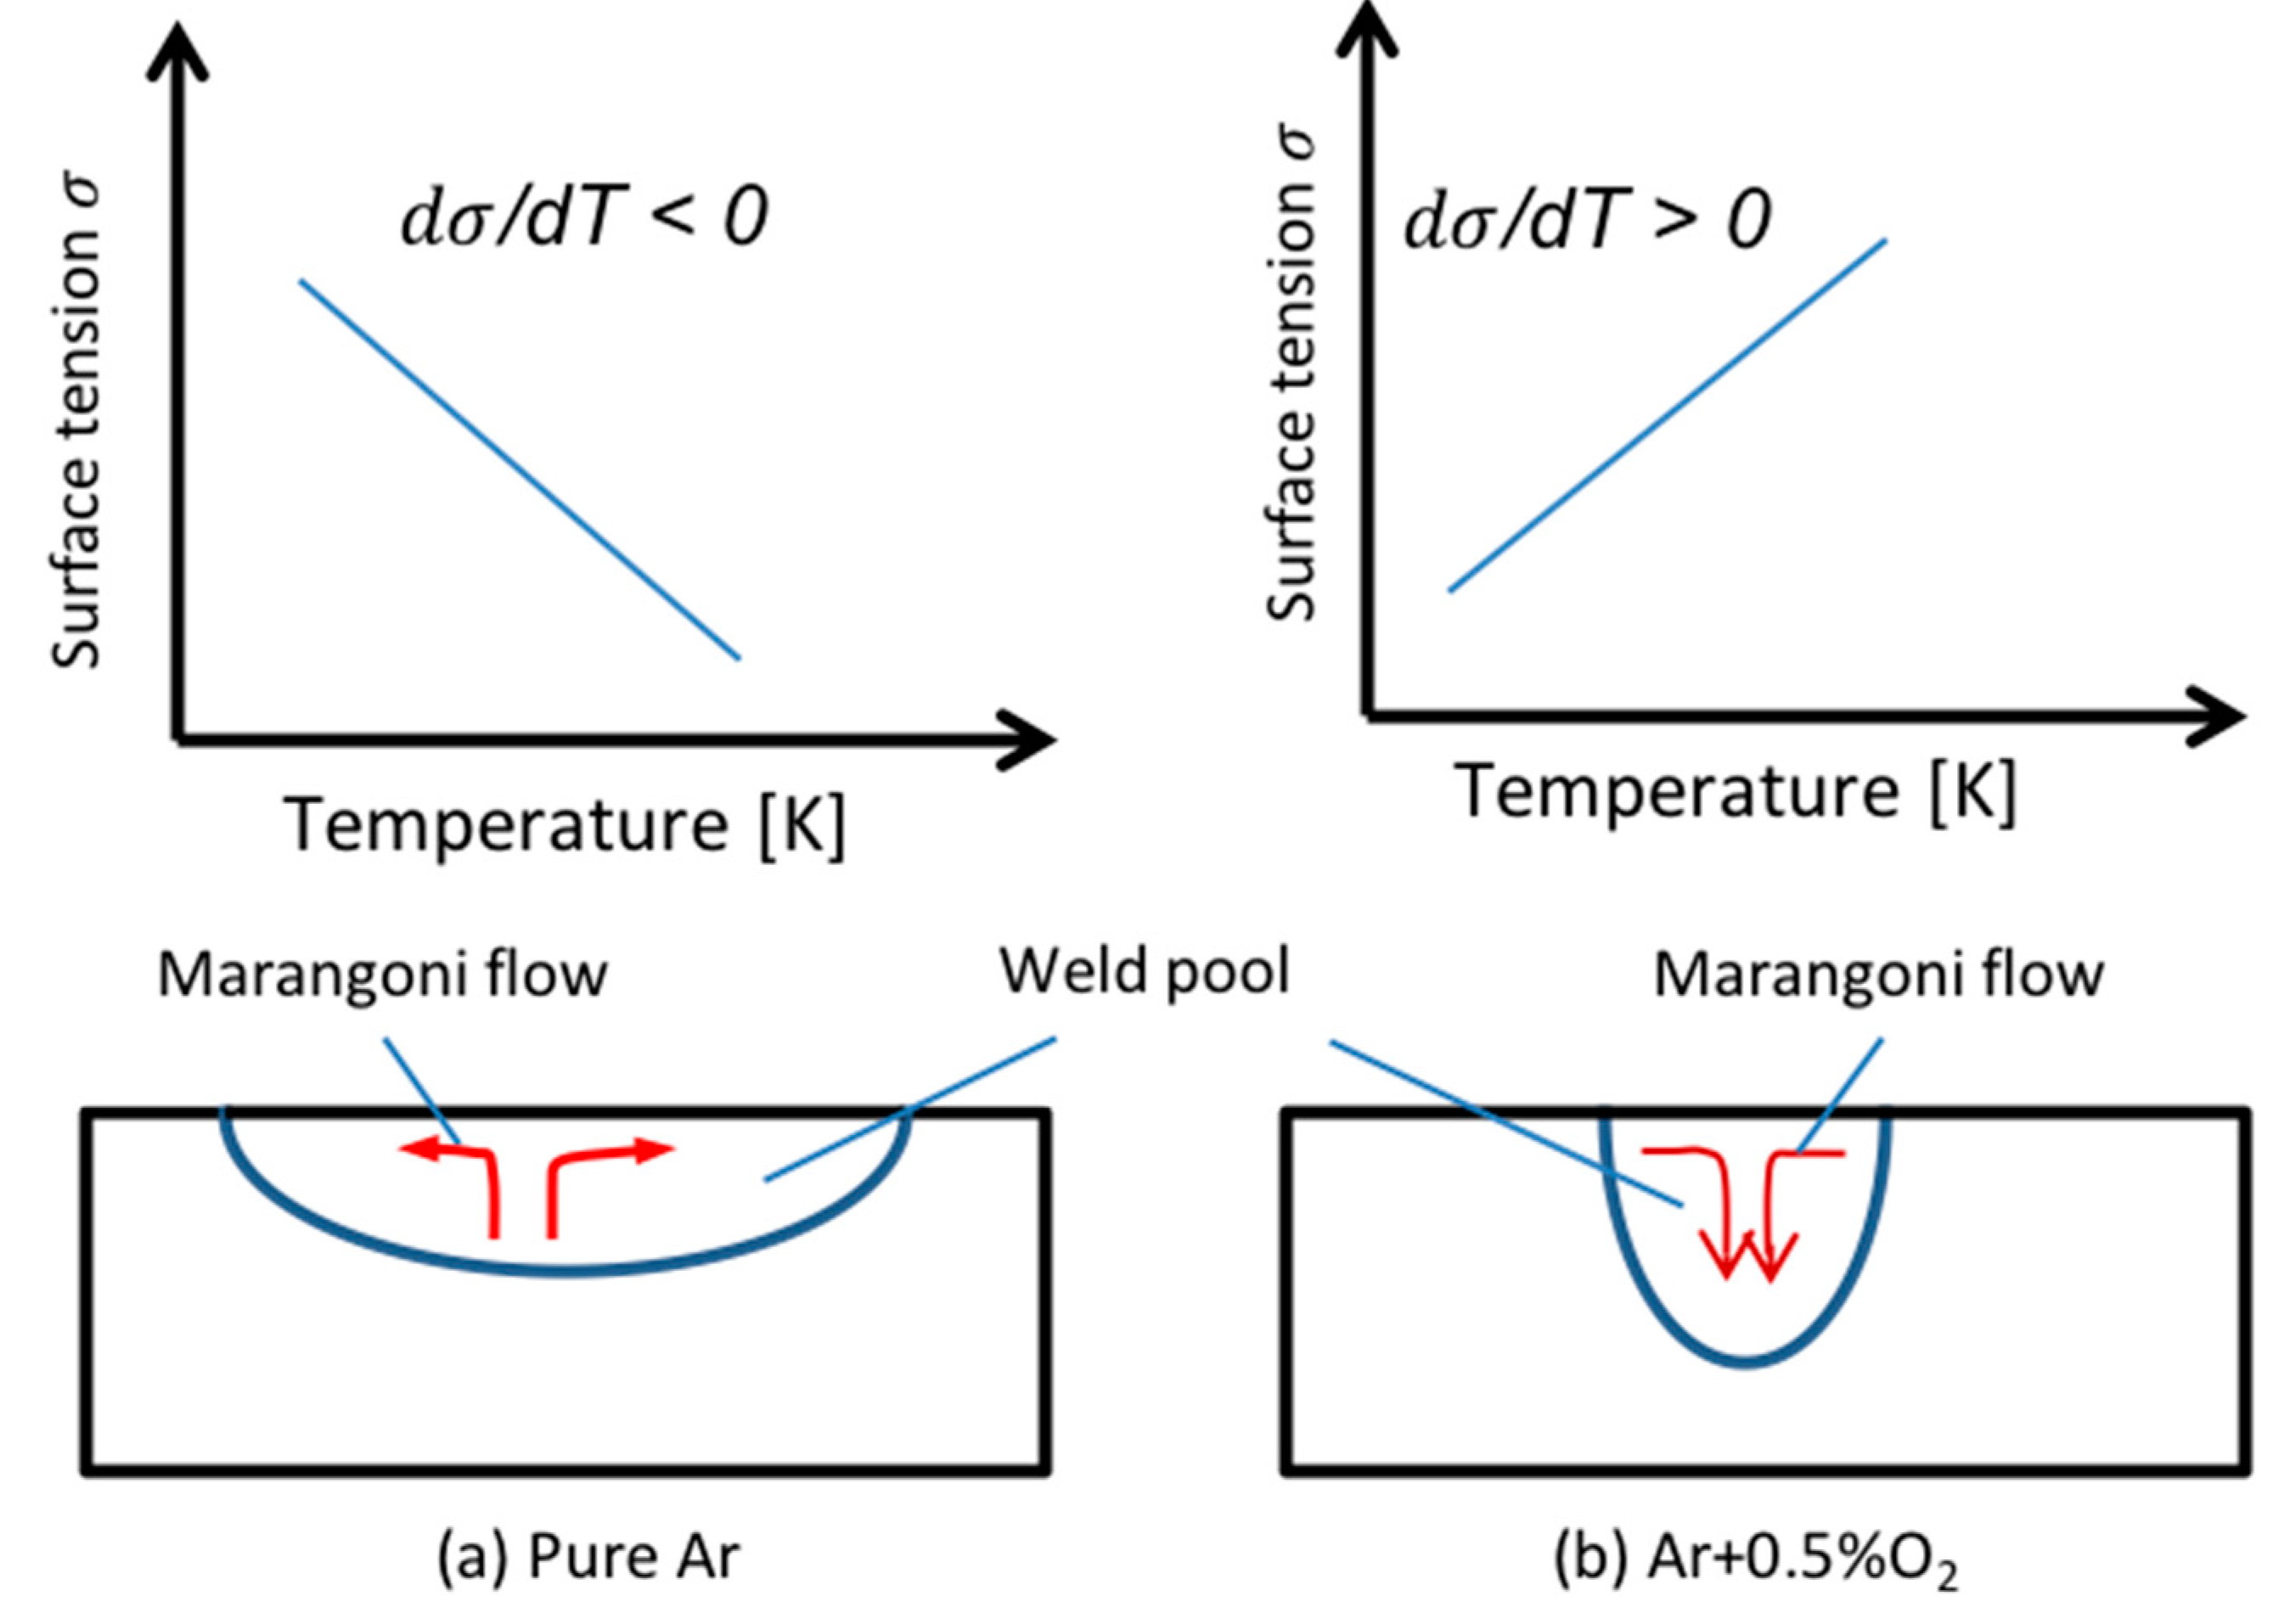
The Marangoni force diverted the flow direction from upward and backward with pure Ar to downward with mixture shielding gas.
(4)
The molten flow tended toward the rotational motion behind the keyhole with the Ar case.
(5)
The molten flow occurred in a translational movement to the ending part of weld pool when 0.5% O2 was mixed with the shielding gas.
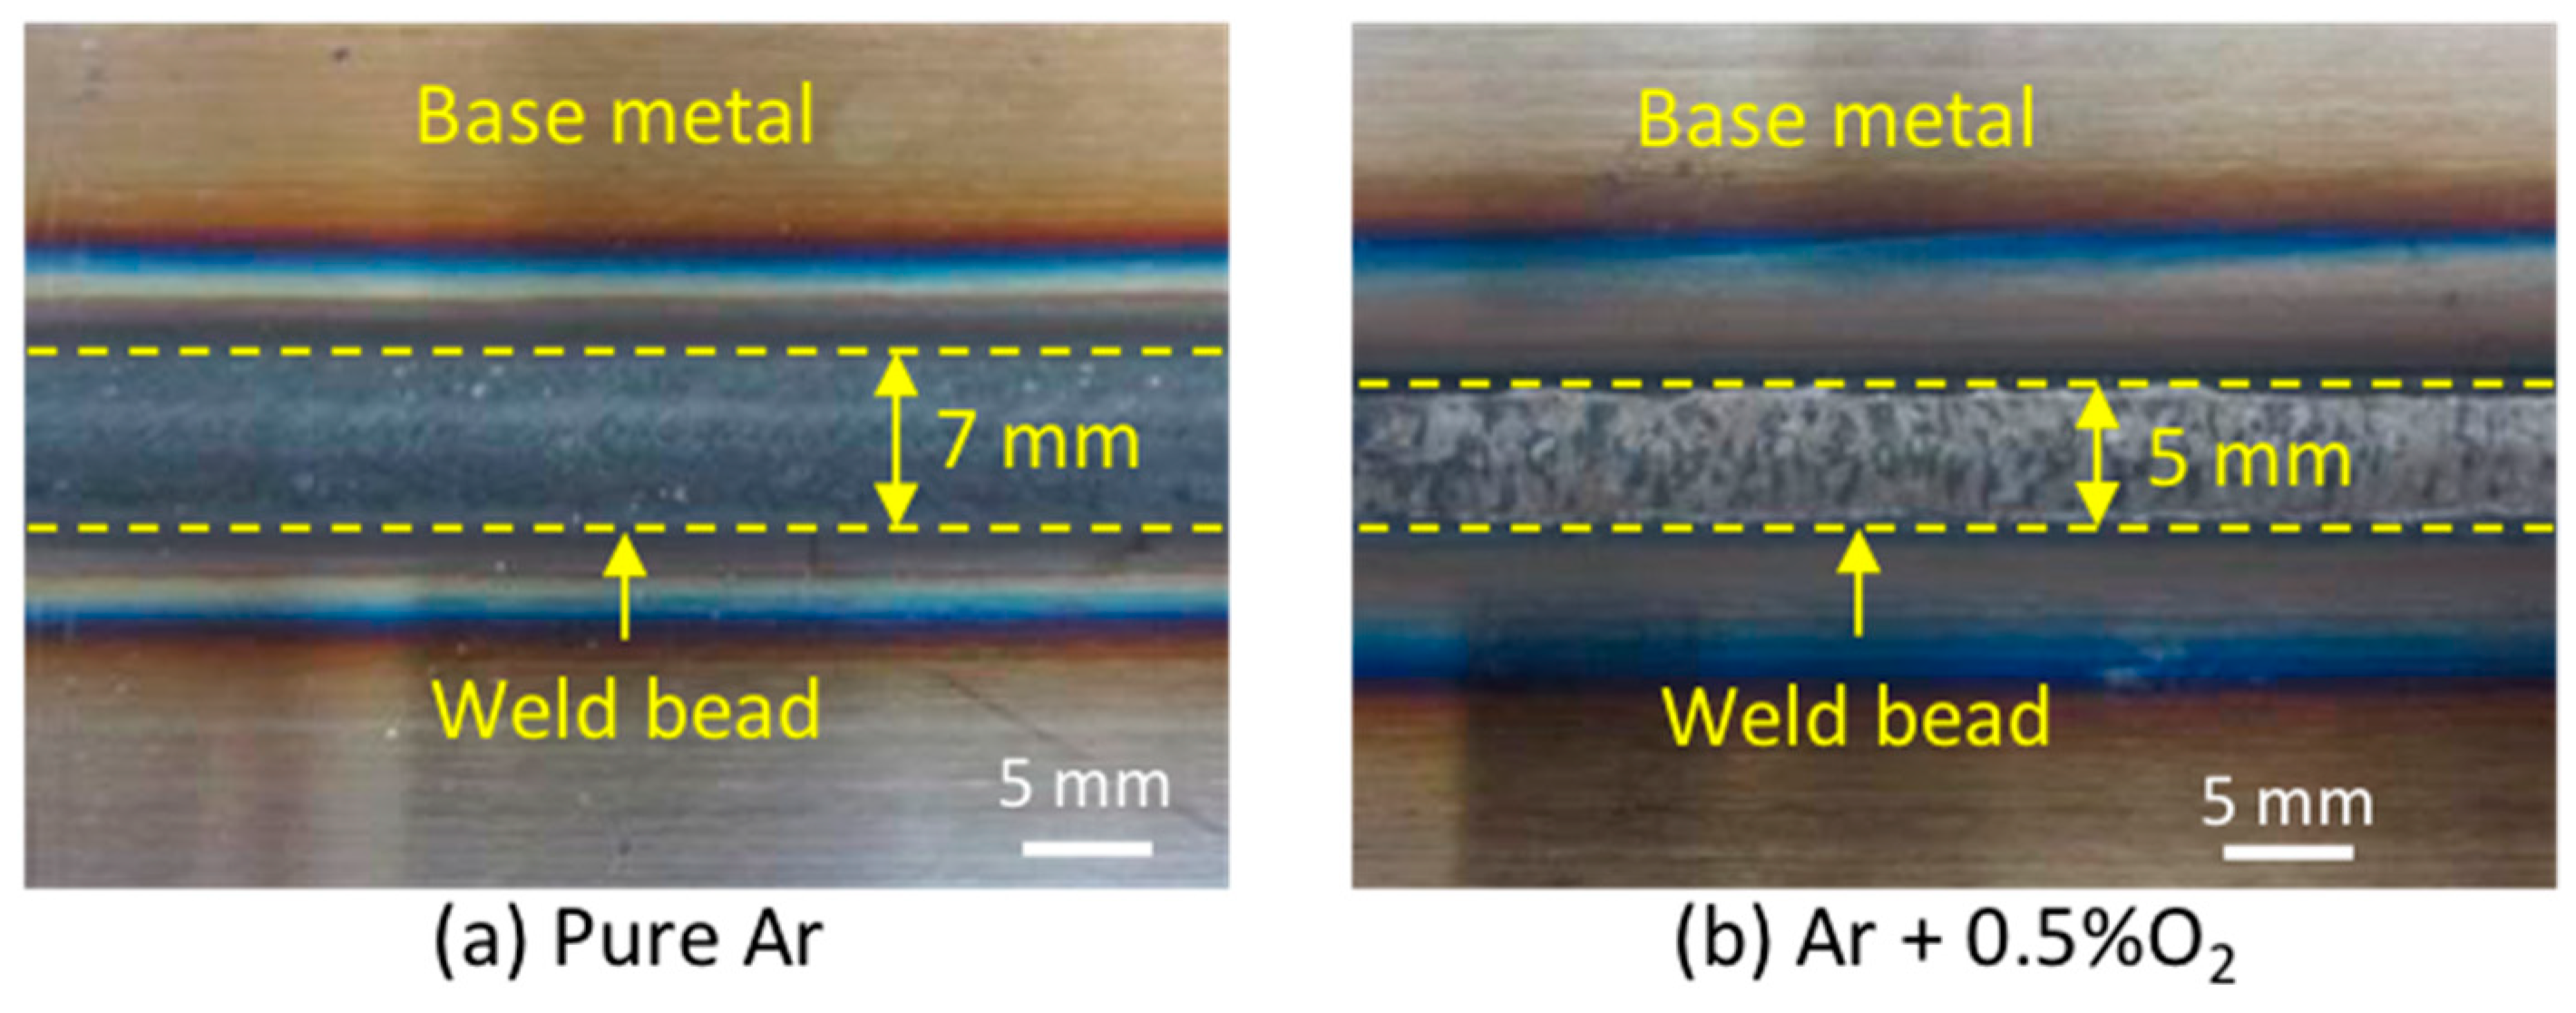
(6)
The length of weld pool increased but the width of weld bead decreased when shielding gas was mixed with 0.5% O2.
(7)
The behavior of the material flow in the KPAW weld pool was mainly controlled by shear force.
(8)
Marangoni force was not a dominant driving force here, even though its direction was diverted when a small amount of oxygen was mixed with the shielding gas.

Author Contributions

M.N.H., T.N.V. (Thanh Nguyen Van), and T.-H.N. contributed to the project design; D.N.T. and D.T.H. performed all experiments and data processing; A.N.V. and T.N.V. (Tuan Nguyen Van) wrote the manuscript. All authors participated in the discussion of the results and guided the writing of the article. All authors have read and agreed to the published version of the manuscript.

Funding

This study was supported by the Hanoi University of Science and Technology and Murata Welding Laboratory under a collaboration program for exchange students and scientists.

Conflicts of Interest

The authors declare that there is no conflict of interest regarding the publication of this paper.

References

  1. Tomsic, M.J.; Jackson, C.E. Energy distribution in keyhole mode plasma arc welds. Weld. J. 1974, 3, 109–116. [Google Scholar]
  2. Nguyen, A.V.; Tashiro, S.; Bui, H.V.; Tanaka, M. Influence of plasma gas on the behavior of convention flow on weld pool surface. Q. J. Jpn. Weld. Soc. 2017, 35, 98s–102s. [Google Scholar] [CrossRef] [Green Version]
  3. Fan, H.G.; Kovacevic, R. Keyhole formation and collapse in plasma arc welding. J. Phys. D 1999, 32, 2902–2909. [Google Scholar] [CrossRef] [Green Version]
  4. Patricio, F.M.; Thomas, W.E. Welding processes for aeronautics. Adv. Mater. Process. 2001, 159, 39–43. [Google Scholar]
  5. Geng, W.; Wu, D.; Sun, D.; Li, H.; Che, Y. Microstructures and Mechanical Properties of Plasma Arc Welded Joints of Ultra-high Strength Steel and Aluminum Alloy Using Al–Si and Al–Cu Fillers. ISIJ Int. 2018, 58, 1108–1116. [Google Scholar] [CrossRef] [Green Version]
  6. Tabal, E.; Dhooge, A.; Kaluc, E. Plasma Arc Welding of Modified 12% Cr Stainless Steel. Mater. Manuf. Process. 2009, 24, 649–656. [Google Scholar]
  7. Tanaka, M.; Lowke, J.J. Predictions of weld pool profiles using plasma physics. J. Phys. D 2007, 40, 1–23. [Google Scholar] [CrossRef]
  8. Zhang, Y.M.; Zhang, S.B. Observation of the keyhole during plasma arc welding. Weld. J. 1999, 78, 53s–58s. [Google Scholar]
  9. Lu, W.; Zhang, Y.M.; Emmerson, J. Sensing of weld pool surface using non-transferred plasma charge sensor. Meas. Sci. Technol. 2004, 15, 991–999. [Google Scholar] [CrossRef]
  10. Zhang, Y.M.; Zhang, S.B.; Liu, Y.C. Plasma cloud charge sensor for pulse keyhole process control. Trans. Sci. Technol. 2001, 12, 1365–1370. [Google Scholar] [CrossRef] [Green Version]
  11. Liu, Z.M.; Wu, C.S.; Chen, J. Sensing dynamic keyhole behaviors in controlled-pulse keyholing plasma arc welding. Weld. J. 2013, 92, 381–389. [Google Scholar]
  12. Wu, C.S.; Jia, C.B.; Chen, M.A. A control system for keyhole plasma arc welding of stainless steel with medium thickness. Weld. J. 2010, 89, 225–231. [Google Scholar]
  13. Liu, Z.M.; Wu, C.S.; Chen, M.A. Experimental study on PAW butt-welding process with controlled pulse key-holing strategy. J. Mech. Eng. 2011, 47, 45–50. [Google Scholar] [CrossRef]
  14. Wu, C.S.; Wang, L.; Ren, W.J.; Zhang, X.Y. Plasma arc welding: Process, sensing, control and modeling. J. Manuf. Process. 2014, 16, 74–85. [Google Scholar] [CrossRef]
  15. Yamane, S.; Suzuki, H.; Toma, J.; Godo, T.; Hosoya, K.; Nakajima, T.; Yamamoto, H. Imaging processing of the weld pool in robot plasma welding system. Q. J. Jpn. Weld. Soc. 2013, 31, 44–47. [Google Scholar] [CrossRef] [Green Version]
  16. Yamane, S.; Godo, T.; Hosoya, K.; Nakajima, T.; Yamamoto, H. Detecting and tracking of welding line in visual plasma robotic welding. Q. J. Jpn. Weld. Soc. 2013, 31, 175–180. [Google Scholar] [CrossRef]
  17. Yamane, S. Tracking of welding using image processing. Q. J. Jpn. Weld. Soc. 2015, 84, 35–42. [Google Scholar]
  18. Nguyen, A.V.; Tashiro, S.; Bui, H.V.; Tanaka, M. Experimental investigation of weld pool formation process in plasma keyhole arc welding. J. Phys. D Appl. Phys. 2018, 51, 015204. [Google Scholar]
  19. Nguyen, A.V.; Wu, D.; Tashiro, S.; Tanaka, M. Undercut formation mechanism in the keyhole plasma arc welding. Weld. J. 2020, 98, 204–212. [Google Scholar]
  20. Xu, B.; Jiang, F.; Chen, S.; Tanaka, M.; Tashiro, S.; Nguyen, A.V. Numerical analysis of plasma arc physical characteristics under additional constraint of keyhole. Chin. Phys. B 2018, 27, 034701. [Google Scholar] [CrossRef]
  21. Xu, B.; Chen, S.; Tashiro, S.; Jiang, F.; Nguyen, A.V.; Tanaka, M. Material flow analyses of high-efficiency joint process in VPPA keyhole flat welding by X-ray transmission system. J. Clean. Product. 2020, 250, 119450. [Google Scholar] [CrossRef]
  22. Lu, Z.; Zhang, W.; Jiang, F.; Chen, S.; Yan, Z. A Primary Study of Variable Polarity Plasma Arc Welding Using a Pulsed Plasma Gas. Materials 2019, 12, 1666. [Google Scholar] [CrossRef] [PubMed] [Green Version]
  23. Jiang, F.; Li, C.; Xu, B.; Tashiro, S.; Tanaka, M.; Chen, S. Study on the Decoupled Transfer of Heat and Mass in Wire Variable Polarity Plasma Arc Welding. Materials 2020, 13, 1073. [Google Scholar] [CrossRef] [PubMed] [Green Version]
  24. Yamazaki, K.; Yamamoto, E.; Suzuku, K.; Koshiishi, F.; Miyazako, S.; Tashiro, S.; Tanaka, M.; Nakata, K. The Surface Temperature Measurement of Weld Pool by Infrared Two-Color Pyrometry. Q. J. Jpn. Weld. Soc. 2009, 27, 34–40. [Google Scholar] [CrossRef]
  25. Wu, D.S.; Nguyen, A.V.; Tahsiro, S.; Hua, X.; Tanaka, M. Elucidation of the weld pool convection and keyhole formation mechanism in the keyhole plasma arc welding. Int. J. Heat. Mass. Tranf. 2019, 131, 920–931. [Google Scholar] [CrossRef]
  26. Li, Y.; Feng, Y.; Li, Y.; Zhang, X.; Wu, C.S. Plasma arc and weld pool coupled modeling of transport phenomena in keyhole welding. Int. J. Heat. Mass. Tranf. 2016, 92, 628–638. [Google Scholar] [CrossRef]
  27. Lu, S.; Fujii, H.; Sugiyama, H.; Tanaka, M.; Nogi, K. Weld penetration and Marangoni convection with oxide fluxes in GTA welding. Mater. Tran. 2002, 11, 2926–2931. [Google Scholar] [CrossRef] [Green Version]
  28. Sahoo, P.; Debroy, T.; McNallan, M.J. Surface tension of Binary Metal-Surface Active Solute Systems under Conditions Relevant to Welding Metallurgy. Metall. Mater. Trans. B 1988, 19B, 483–491. [Google Scholar] [CrossRef]
  29. Kou, S.; Wang, Y.H. Weld pool convection and its effect. Weld. J. 1986, 65, 63–70. [Google Scholar]
  30. Masuda, S.; Yasushi, T. Effect of magnetic field on flows and temperature distribution of molten pool in electromagnetic controlled molten pool welding process. Q. J. Japan Weld. Soc. 2015, 4, 244–250. [Google Scholar] [CrossRef]
  31. Mougenot, J.; Gonzalez, J.J.; Freton, P.; Cressault, Y. Argon and Arcal.37 plasma characteristics in a TIG configuration. J. Phys. D Appl. Phys. 2013, 46, 495203. [Google Scholar] [CrossRef]
  32. Arunkumar, M.; Dhinakaran, V.; Shanmugam, N.S. Numerical prediction of temperature distribution and residual stresses on plasma arc welded thin titanium sheets. Int. J. Model. Simul. 2019, 39, 1–17. [Google Scholar] [CrossRef]
  33. Fujii, H.; Lu, S.; Sato, T.; Nogi, K. Effect of Oxygen Content in He-O2 Shielding Gas on Weld Shape for Ultra Deep Penetration TIG. Trans. JWRI 2008, 37, 19–26. [Google Scholar]
  34. Nguyen, A.V.; Tashiro, S.; Ngo, M.H.; Le, A.H.; Tanaka, M. Influence of shielding gas composition on molten metal flow behavior during plasma keyhole arc welding process. J. Manuf. Process. 2020, 53, 431–437. [Google Scholar] [CrossRef]
Figure 1. Experimental setup for observing the weld pool surface.
Applsci 10 03569 g001
Figure 2. Schematic illustration of holes on the base metal surface.
Applsci 10 03569 g002
Figure 3. Schematic illustration of longitudinal section of the keyhole and the weld pool in keyhole plasma arc welding (KPAW).
Applsci 10 03569 g003
Figure 4. Experimental setup of temperature distribution measurement.
Applsci 10 03569 g004
Figure 5. Schematic illustration of temperature measurement on the surface along the keyhole wall.
Applsci 10 03569 g005
Figure 6. Relationship between spectral sensitivities and wavelength.
Applsci 10 03569 g006
Figure 7. Relationship between theoretical radiation intensity ratios to temperature on the surface along the keyhole wall.
Applsci 10 03569 g007
Figure 8. Temperature distribution on the surface along keyhole wall in the case of Ar. (a) Observed images, (b) Temperature distribution.
Applsci 10 03569 g008
Figure 9. Typical continuous tracer particle movement images. (a) t = 13 ms, (b) t = 18 ms, (c) t = 23 ms, (d) t = 28 ms.
Applsci 10 03569 g009
Figure 10. Four typical series of images of observed convection on the weld pool surface for both pure Ar and Ar + 0.5% O2. (a) pure Ar, (b) Ar + 0.5% O2.
Applsci 10 03569 g010
Figure 11. Weld pool surface appearance. (a) pure Ar, (b) Ar + 0.5% O2.
Applsci 10 03569 g011
Figure 12. Weld bead width on the top surface of the base metal. (a) pure Ar, (b) Ar + 0.5% O2.
Applsci 10 03569 g012
Figure 13. Welding slag appearance on the bottom surface of the base metal. (a) Pure Ar, (b) Ar + 0.5% O2.
Applsci 10 03569 g013
Figure 14. Schematic illustration of Marangoni force on the weld pool surface redrawn from [27]. (a) Pure Ar, (b) Ar + 0.5%O2.
Applsci 10 03569 g014
Figure 15. Influence of shear force and Marangoni force on the material flow behavior of the KPAW weld pool. (a) Pure Ar, (b) Ar + 0.5% O2.
Applsci 10 03569 g015
Table 1. Chemical composition of base metal (SUS 304).
ElementCSiMnNiCr
Wt %0.060.440.968.1918.22
Table 2. Welding conditions.
Welding ParametersValue (Unit)
Welding currentDC 120 (A)
Plasma gasPure Ar
Shielding gasPure Ar and Ar + 0.5% O2
Arc length5 (mm)
Plasma gas flow rate1.6 (L min−1)
Shielding gas flow rate7.5 (L min−1)

